Design Drivers of Energy-Efficient Transport Aircraft The MIT Faculty has made this article openly available. Please share how this access benefits you. Your story matters. Citation Drela, Mark. Design Drivers of Energy-Efficient Transport Aircraft. Warrendale, PA: SAE International, 2011. As Published http://dx.doi.org/10.4271/2011-01-2495 Publisher SAE International Version Author's final manuscript Citable link http://hdl.handle.net/1721.1/86398 Terms of Use Creative Commons Attribution-Noncommercial-Share Alike Detailed Terms http://creativecommons.org/licenses/by-nc-sa/4.0/

Welcome message from author
This document is posted to help you gain knowledge. Please leave a comment to let me know what you think about it! Share it to your friends and learn new things together.
Transcript
Design Drivers of Energy-Efficient Transport Aircraft
The MIT Faculty has made this article openly available. Please share how this access benefits you. Your story matters.
Citation Drela, Mark. Design Drivers of Energy-Efficient Transport Aircraft.Warrendale, PA: SAE International, 2011.
As Published http://dx.doi.org/10.4271/2011-01-2495
Publisher SAE International
Version Author's final manuscript
Citable link http://hdl.handle.net/1721.1/86398
Terms of Use Creative Commons Attribution-Noncommercial-Share Alike
Detailed Terms http://creativecommons.org/licenses/by-nc-sa/4.0/

Design Drivers of Energy-Efficient Transport Aircraft
Mark Drela
MIT Department of Aeronautics and Astronautics, Cambridge, MA 02139
The fuel energy consumption of subsonic air transportation is examined. The focus
is on identification and quantification of fundamental engineering design tradeoffs which
drive the design of subsonic tube and wing transport aircraft. The sensitivities of energy
efficiency to recent and forecast technology developments are also examined.
Background and Motivation
Early development of the modern jet transport,starting with the DeHavilland Comet and Boeing 707in the 1950’s, was strongly driven by range require-ments. With the imperatives of rising fuel costs andincreased environmental concerns, more recent devel-opments have focused on fuel economy and also onnoise. Of the three main drivers of fuel economy —aerodynamics, structures, and propulsion — the lat-ter has seen the largest improvements, not surprisinglybecause in the 1950’s turbojet and turbofan engineswere a very young technology. As engine technologymaturation has now reached the levels of the other dis-ciplines, further improvements will have to come fromall technologies. The recent and ongoing NASA Aero-nautics research,1 in particular the N+1,2,3 programs2
target a wide range of aerodynamic, structural, andpropulsion technologies towards this goal.
The objective of this document is to identify themajor competing effects which influence the designparameters of a tube and wing transport aircraft, op-timized for minimum fuel burn. Sensitivities of fuelburn to the following parameters will be determinedand presented:
– flight Mach number– allowable specific stress and load factor– allowable turbine metal temperatures– engine overall pressure ratio– balanced field length– stability margin
Recent configuration technologies from the N+3 pro-gram will also be mentioned.
The main focus will be on short to medium-rangeBoeing 737 or Airbus A320 class aircraft, since this isone of the largest air travel market segments. Longerrange aircraft in the Boeing 777 or Airbus A340 classwill also be examined for a few cases.
The overall objective is to identify which parame-ters or combinations of parameters have the greatestpotential for enabling fuel burn reductions, and there-fore are the most attractive targets for research anddevelopment.
Fuel Consumption Overview
We will begin by examining the major overall factorswhich contribute to fuel burn, via the Breguet relation.This analysis is too coarse to provide any useful designguidance, but it does help to interpret some possiblycounterintuitive results from much more detailed op-timization results presented later.
Fuel consumption via Breguet relation
The fuel weight Wfuel consumed to fly a distance(range) R by an aircraft in level flight at Mach numberM is given by the Breguet relation.
Wfuel = WZF
[
exp
(
D
L
TSFC
M
R
a
)
− 1
]
(1)
≃ WZF ×
D
L×
TSFC
M×
R
a(2)
The exact and linearized forms (1),(2) are comparedin Figure 1 for a typical modern jet transport. Longrange missions in effect get progressively more penal-ized for carrying the extra fuel. The linearized form
0
0.1
0.2
0.3
0.4
0.5
0.6
0 1000 2000 3000 4000 5000 6000 7000 8000
Wfuel
WZF
_____
R [ nmi ]
Breguet
Linear approximation
TSFCa M L/D
= 0.5 / hr= 320 m/s= 0.8= 17
Fig. 1 Fuel weight fraction versus mission range fora typical jet transport. The linear approximationis valid for short to medium range missions.
shows that the fuel weight is approximately the prod-uct of three parameters:
WZF Zero-fuel weight (at landing).D/L Drag/lift ratio.TSFC/M Thrust-specific fuel consumption over Mach
The range R is fixed by the mission and the speed ofsound a at cruise altitude is a physical constant, andhence these are not design variables. In the limit of
1 of 15
SAE Paper 2011-01-2495

very high-bypass ratio engines or lightly-loaded pro-pellers, the TSFC scales nearly as the cruise MachM . In this situation the ratio TSFC/M , which isequivalent to a power-specific fuel consumption, is therelevant measure of propulsion-system efficiency. For afixed-parameter turbofan engine, the ratio TSFC/M0.5
stays roughly constant with M , while for an optimizedengine the ratio TSFC/M0.7 is roughly constant. Thecorresponding aerodynamic figures of merit for the twoapproaches are then M0.5L/D and M0.3L/D, respec-tively. Which approach is chosen is largely a matter ofpreference when performing manual parametric stud-ies. The choice is immaterial for the parameter studiespresented here, since the engine is simulated directly,for any given M , without reliance on any assumed em-pirical TSFC vs. M dependency.
Although equations (1) and (2) correctly give thefuel burn, they are nearly useless as a design guide.The reason is that any one of the three parameterscan be reduced in isolation, but this will generally in-crease the others. For example, D/L can be reducedby increasing the wing aspect ratio or the wing/wettedarea fraction, but this will be offset by an increase inthe wing weight’s contribution to WZF. The 1/M fac-tor can be decreased by choosing to fly faster, but thiswill increase all the other factors and actually give anet increase in the fuel burn. Since all the factorsinfluence each other to varying degrees, to minimizefuel burn it is essential to account for their importantinteractions and tradeoffs. This is addressed by theconceptual-design approach, whose application is thecentral focus of this paper.
Fuel burn and flight altitude
From the most fundamental viewpoint, the objec-tive of air transportation is to move the fuselage —in effect a payload container — over a required rangeR, at an economically-viable speed or Mach number,with the smallest fuel weight or more generally energyexpenditure. The latter is quantified by the Payload-Fuel Energy Intensity (PFEI),3
PFEI ≡
hfuelWfuel
Wpay R[kJ/kg km] (3)
=Fuel energy
Payload mass×Distance
where hfuel is the fuel specific heating value. This al-lows an energy-usage efficiency comparison betweendifferent aircraft and mission lengths, between differ-ent fuels, and between different modes of transporta-tion (air, land, water).
To examine a transport aircraft’s energy require-ments in this framework, expression (2) is recast byseparating the components of the drag D, assumingWZF ≃ L, and defining an effective power specificfuel consumption based on thrust power PSFCT ≡
TSFC/V .
PFEI ≃ (Dfuse+Drest+Di) PSFCT
hfuel
Wpay(4)
The absolute minimum energy required to transportthe fuselage is
PFEImin = Dfuse PSFCT
hfuel
Wpay(5)
with the energy consumed by the induced drag and theprofile drag of the remaining components being in ef-fect “overhead”. Dfuse and the corresponding PFEImin
can be quantified via the usual average skin friction,form factor, and wetted area, as described by Shevell.4
PFEImin =γ
2pM2 Cfwet
Ff Awet PSFCT
hfuel
Wpay(6)
The dynamic pressure has also been replaced by thestatic pressure p and flight Mach number by the rela-tion ρV 2=γpM2.The effect of Mach number will be examined in de-
tail later. If this is considered fixed, then aside fromreduced Cfwet
via riblets or laminar flow5 (which willalso be examined later), the only variable in (6) whichcan be freely varied to significantly reduce PFEImin isthe pressure p at cruise altitude. Indeed, transporta-tion of the fuselage is “free” if performed at extremealtitudes where p ≃ 0. But of course an increase inflight altitude adds more“overhead” in the form oflarger and heavier surfaces and engines, whose profileand induced drag add to the full fuel energy expres-sion (4). This tradeoff is quantified in Figure 2. The
35000
15000
47500
[ ft ]
optimum
fuselage drag
fuselage too draggy
impractical
p
hCRwing, tail, engines too heavy
wing, tail, engine weight
oversize−wing field length penalty
PFEI 1050[ atm ] 10 [ kJ/kg−km ]
Fig. 2 Mission fuel-energy use versus cruise alti-tude for a jet transport with a B737-class fuselage,at fixed cruise Mach MCR = 0.8 . Lower pressureat altitude decreases fuel burn from fuselage drag,but increases fuel burn from “overhead” of wings,tails, engines.
optimum altitude for any given Mach number is wherethe fuel burn due to fuselage drag and due to overheadhave equal and opposite sensitivity to pressure.
2 of 15
SAE Paper 2011-01-2495

It’s interesting (if not amusing) to consider trans-porting the fuselage at sea level as a wheeled vehicle,since this eliminates the weight and drag overhead ofthe wings and tails, and also eliminates induced drag.As indicated in Figure 2, the energy required to dothis is actually comparable to the energy needed to flythe fuselage at the optimum altitude at the same Machnumber. Needless to say, a wheeled fuselage travelingoverland at M=0.8 is not practical.
Transport Aircraft Design SpaceConceptual design formulations
At the detail-design level, a vast number of param-eters is needed to fully define an aircraft, its engines,and its operation. A major goal of the initial concep-tual design stage is to greatly reduce the number ofparameters by some combination of historical correla-tions and low-order modeling, and thus allow initialsizing and optimization.Because aircraft fuel burn depends on many compet-
ing drivers, any effective conceptual design formulationmust retain the key features of all the disciplines in-volved. As a minimum, the airframe structure andweights, the aerodynamic performance, the propul-sion performance, and the flight trajectory must allbe represented with sufficient fidelity. Many concep-tual design approaches have been developed towardsthis end, e.g. by Roskam,6 Torrenbeek,7 Raymer,8 Ja-yaram,9 Mason,10 and others.Conceptual design methods more focused on for-
mal optimization have also been developed. These arecommonly referred to as Multi-Disciplinary Optimiza-tion, or MDO methods. Examples are the methodsof Knapp,11 Wakayama,12 and Kroo.13 The author’sTASOPT formulation14 also falls into this class.
TASOPT Summary
Because TASOPT was used to generate the key re-sults in this paper, a brief summary is given here sothe fidelity as well as limitations of the results canbe better understood. TASOPT uses first-principlesmethods for its primary weight, aerodynamic, and en-gine performance predictions. Specifically, it uses
• Beam and pressure-vessel theory for primary-structure sizing and weight prediction, Figure 3.
• Variable wing airfoils and viscous/inviscid CFDfor all profile drag prediction, Figure 4.
• Full engine flowpath simulation, Figure 5.
• Variable flight trajectory, Figure 6.
Significantly, TASOPT does not rely on histori-cal primary-structure weight correlations, wetted-areadrag prediction methods, engine lookup tables or cor-relations, or fixed climb and cruise profiles. Theminimal reliance on historical data and empiricism
gives considerable confidence in the design parametersweeps presented here, even if they go into unchartedterritory. For more detailed TASOPT documentationand validation see Drela14 and Greitzer.15
M
p∆
p
w
Fig. 3 TASOPT structural and weight modelsfor wing and fuselage, based on simple beam andpressure-vessel theory.
Θ
A( )x
w
ΛΜ
cl
Fig. 4 TASOPT wing and fuselage profile dragmodels, and Trefftz-Plane induced drag model.
m.α
m.
Fig. 5 TASOPT turbofan engine performancemodel. The entire flowpath is simulated, includ-ing the effects of turbine cooling flow.
h
W
R
R
Fig. 6 TASOPT trajectory simulation for takeoffperformance and mission fuel burn.
3 of 15
SAE Paper 2011-01-2495

Design closure and optimization
For any given set ofmodel parameters, design closureis the convergence of all the derived model quanti-ties towards a self-consistent design. Such a “closed”design meets all structural criteria, and also mission re-quirements such as range, takeoff distance, and climbgradient. Optimization can then be performed aroundthis closure procedure. In TASOPT this is imple-mented as two nested loops, shown in Figure 7.
Y
Structural gauges
Volumes and Weights
N
Surface spans, areas
Loads, Shears, Moments
Y
Drag, Engine size+weight
Trajectory, Fuel Weight
Total Weight converged?
Fuel burn minimized?
OptimizationDesign Closure
( Sweep, CL, AR, Altitude, FPR, BPR, Tt4 ... )
RangePayloadMach
NmaxfstressTmetal
CMfuse
WeightsDimensionsGauges
Engine sizeFuel burn
lBFmax . . .
Design Parameters
Design OutputsSweepCLARAltitude
FPRBPRTt4 . . . T/O perf
. . .
DesignVariables
( Design Inputs )
N
M
odel
Par
amet
ers
Fig. 7 TASOPT design-closure and optimizationprocedure. The Model Parameters required by theinner closure loop are partitioned into the DesignParameters which are explicitly specified, and De-sign Variables which are calculated by the outeroptimization loop.
Design variable subset
Of the 100 or so model parameters required to de-fine the aircraft at the conceptual level, a much smallersubset is eligible for use as design variables in the outerloop. These are the model parameters which a have anon-monotonic influence on the fuel-burn design objec-tive, and hence must be determined via optimizationif the optimum aircraft is to be obtained. The remain-ing model parameters are the design parameters, andare typically set to the best-available values limited bytechnology, with some allowance for cost.Table 1 gives the complete list of the design vari-
ables used in the TASOPT formulation. The ()i indexgoes over some number of spanwise stations, so thatλi define the planform shape, and λi rcℓi define thespanwise-loading shape.
Importance of global optimization
A major focus of this paper is the quantification offuel burn versus a number of key design parameters re-
Table 1 Design variables determined by globalmission optimization.
CLCRcruise lift coefficient
AR aspect ratioΛ wing sweep angleλi section relative chords (taper ratios)(t/c)i section airfoil thicknessesrcℓi section local/root cℓ ratios
FPRD design fan pressure ratioBPRD design bypass ratioTt4TO
turbine inlet temperature at takeoffTt4CR
turbine inlet temperature in cruisehCR start-of cruise altitude
lated to technology. An essential feature of this studyis that for any set of input design parameters (at thetop of Figure 7), the fuel burn of the optimized aircraft
is taken as the figure of merit.
The importance of this continuous optimization is il-lustrated in Figure 8. If the cruise Mach number of the
6
6.5
7
7.5
8
8.5
0.7 0.72 0.74 0.76 0.78 0.8
PF
EI
[ k
J / k
g-km
]
Mach
(none)CL, sweep
t/c, AR, CL, sweepfixed opt engine, t/c, AR, CL, sweep
hCR, rubber opt engine, t/c, AR, CL, sweep
Fig. 8 Fuel burn versus cruise Mach, for differentoptimization design variable sets. Expanding thedesign set reduces the minimum fuel burn, and alsochanges the optimum cruise Mach.
baseline B737 is reduced, and all the other model pa-rameters are held fixed, the result is an increase in thefuel burn as indicated by the topmost line in Figure 8.As more and more model parameters are included inthe optimized design variable set, however, then pro-gressively larger fuel savings are obtained with theslower cruise. The greatest fuel reduction occurs if allthe variables listed in Table 1 are optimized. Clearly,optimizing the entire aircraft+engine+operation sys-tem is necessary to obtain the true design-parametersensitivity, with respect to Mach number in this case.Such full optimization will be used for the subsequentsensitivity studies, so that the results represent thegreatest possible fuel savings from a change in eachdesign parameter being considered.
4 of 15
SAE Paper 2011-01-2495
Design Parameter Sensitivities
The subsequent sections show the optimum-aircraftfuel burn sensitivity with respect to key design param-eters. These are chosen based both on their influenceon fuel burn in potential future aircraft, and on theirstrong dependence on technology. The results canbe interpreted as a guide to research investment forfuture aircraft, in that they quantify the potential fuel-economy payoff of the parameters being examined.Two baseline aircraft will be examined: a medium
range aircraft in the Boeing 737 or Airbus A320 class,and a long range aircraft in the Boeing 777 or AirbusA340 class. Their specified key parameters are listedin Table 2, and will be held fixed except where statedotherwise. The payloads correspond to 180 and 500all-economy passengers, respectively. Since the rangeand payload are fixed, Wfuel and PFEI are effectivelyequivalent. The fuel burn will also be given as a ratiofrom the baseline, to more easily see the potential fuelsavings as a percentage.
Table 2 Key parameters of baseline aircraft.
B737-class B777-class
Fuse.OML 737-800 777-300ERPayload 37 000 lb 115 000 lbRange 3000 nmi 6500 nmiMach 0.80 0.84Field 8000 ft 9500 ft
Although the fuselage outer mold lines are heldfixed, the wing and tail surfaces are always sized andwing is positioned based on required-lift, trim, and sta-bility requirements. All structural gauges are likewisealways sized via specified load conditions and mate-rial properties. Conventional aluminum materials areassumed. Engines are sized for the cruise-thrust con-dition, under the constraint of a minimum specifiedbalanced field length and minimum climb gradient.
Cruise Mach number
A reduced cruise Mach number has previously beenconsidered as a means for reducing mission fuel burn.2
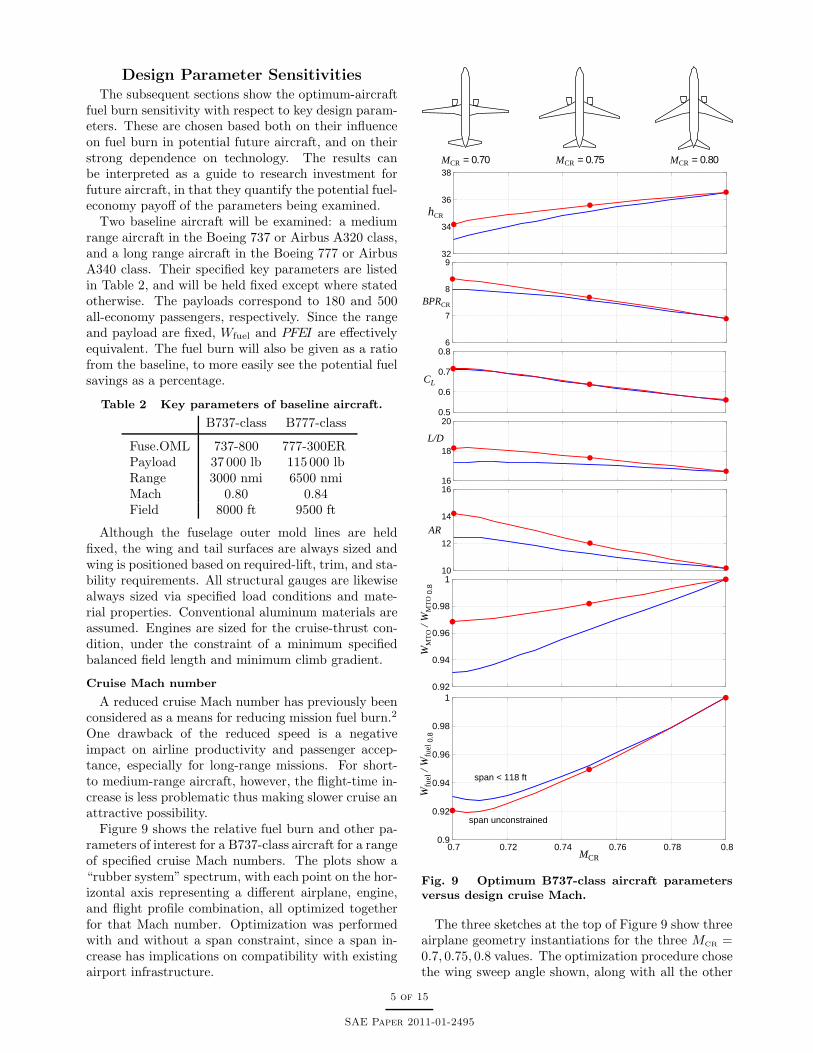
One drawback of the reduced speed is a negativeimpact on airline productivity and passenger accep-tance, especially for long-range missions. For short-to medium-range aircraft, however, the flight-time in-crease is less problematic thus making slower cruise anattractive possibility.Figure 9 shows the relative fuel burn and other pa-
rameters of interest for a B737-class aircraft for a rangeof specified cruise Mach numbers. The plots show a“rubber system” spectrum, with each point on the hor-izontal axis representing a different airplane, engine,and flight profile combination, all optimized togetherfor that Mach number. Optimization was performedwith and without a span constraint, since a span in-crease has implications on compatibility with existingairport infrastructure.
M = 0.80CRMCR = 0.75MCR = 0.70
32
34
36
38
hCR
6
7
8
9
BPRCR
0.5
0.6
0.7
0.8
CL
16
18
20
L/D
10
12
14
16
AR
0.92
0.94
0.96
0.98
1
WM
TO
/ W
MT
O 0
.8
0.9
0.92
0.94
0.96
0.98
1
0.7 0.72 0.74 0.76 0.78 0.8
Wfu
el /
Wfu
el 0
.8
MCR
span unconstrained
span < 118 ft
Fig. 9 Optimum B737-class aircraft parametersversus design cruise Mach.
The three sketches at the top of Figure 9 show threeairplane geometry instantiations for the three MCR =0.7, 0.75, 0.8 values. The optimization procedure chosethe wing sweep angle shown, along with all the other
5 of 15
SAE Paper 2011-01-2495

design variables listed in Table 1. Also, the insidedesign-closure loop shown in Figure 7 generated allthe key airframe gauges and engine parameters in theoptimization process.As the cruise Mach number M
∞is reduced the opti-
mum sweep angle Λ is also reduced, roughly accordingto the infinite swept wing relation
cosΛ ≃
Mcrit
M∞
(7)
where Mcrit is in the range 0.70 . . . 0.75 for moderntransonic airfoils, depending on the airfoil thicknesst/c and the local lift coefficient. Relation (7) indicatesthat as M
∞→ Mcrit, then cosΛ → 1 and the sweep
angle tends to approach zero. As the sweep is reduced,the optimum aspect ratio AR will then tend to increaseas allowed by the reduction of structural span for agiven aerodynamic projected span.The engine parameters also change significantly,
with the cruise-condition bypass ratio BPRCR increas-ing notably as MCR decreases. A major reason is thatthe fan face always requires a fixed local Mfan ≃ 0.6,so a lower cruise Mach results in a smaller requireddiffusion MCR−Mfan. The less-loaded nacelle then hassmaller supervelocities on its outside surface, as shownin Figure 10. This mitigates the nacelle profile dragpenalty of a large-diameter fan, and thus the systemoptimizes to a larger bypass ratio.
M ( )x
= 0.60M fan
fanM
Mnacelle
Mnacelle
Mnacelle
equivalentvortex sheet strength
= 0.80M
M = 0.72
nacelle
1.25
1.16
nacelleV
V
/V
/V0.84 ,
1.00 ,
Fig. 10 With a fixed fan-face Mach number, thenacelle’s external supervelocities decrease dispro-portionately as cruise Mach number is reduced.
Somewhat less obvious is the decrease in the op-timum start-of-cruise altitude hCR. An explanationis provided by the previous fuel burn versus altitudetradeoff shown in Figure 2. The reduced Mach numberdecreases the minimum-possible fuel burn PFEImin asgiven by (6), so that it is less imperative to fly highto reduce it. This shrinks the wing and engines andtheir “overhead” weight and nacelle drag. The takeoffdistance is still acceptable since reduced wing sweepnaturally increases the achievable CLmax
.The span constraint in Figure 9 is seen to have a
strong effect on the overall L/D and the gross weightWMTO = WZF+Wfuel. However, these two quantities
have a directly opposite effect on the fuel burn Wfuel,as can be seen in the Breguet relation (2), so that thenet effect on fuel burn is remarkably small. This weakdependence on span will also be evident in the otherparameter sensitivity results shown later.
The results in Figure 9 were computed assuming afixed minimum static stability margin SMmin = 0.15.If this value is strongly driven by pitch-up associatedwith transonic stall, then the SMmin value can likelybe decreased along with the reduced cruise Mach. Theadditional fuel-burn benefit from this reduced SMmin
will be examined later.
Material Strength/Weight
Stronger airframe materials have of course alwaysbeen the subject of intense research and development.One result has been the relatively recent introductionof composites into the primary structure of the Boeing787 and to some extent the Airbus A380.
Development of advanced sensor technology anddata acquisition capabilities has enabled the possibilityof Structural Health Monitoring (SHM)16 to be usedon aircraft in routine service, which could allow re-ductions in allowables since less margin is needed forunanticipated corrosion, fatigue cracking, and impactdamage. The latter is of particular interest for com-posite airframes.
Here we will examine the maximum possible fuelburn reductions resulting from increased allowablematerial stress, representing either material improve-ments, or the introduction of SHM. In the con-text of a conceptual-design model like TASOPT, theonly relevant parameter is the material’s allowable-stress/density ratio. Here this is quantified by a simplefactor multiplying the baseline value, which here cor-responds to standard aluminum.
One question which arises in any such technologyimprovement is to how to best exploit it. For example,some possible ways to exploit a stronger wing materialare:
– larger aspect ratio AR– smaller airfoil t/c together with smaller sweep Λ– larger S/Awet and higher cruise
The best-possible solution is likely to be some combi-nation of all these changes, and possibly others whichmay not be obvious. For example, significantly dif-ferent engine parameters may be optimal with thehigher cruise altitude favored by a relatively lightermaterial. In TASOPT all these trades are madeby its global optimization, so that the resulting air-craft+engine+operation combination takes the bestpossible advantage of the improved technology.
Figure 11 shows the relative fuel burn and otherparameters for the B737-class aircraft for a range ofmaterial stress factor. The global optimization wasperformed with and without a span constraint. As ex-pected, the optimum aspect ratio and resulting cruise
6 of 15
SAE Paper 2011-01-2495
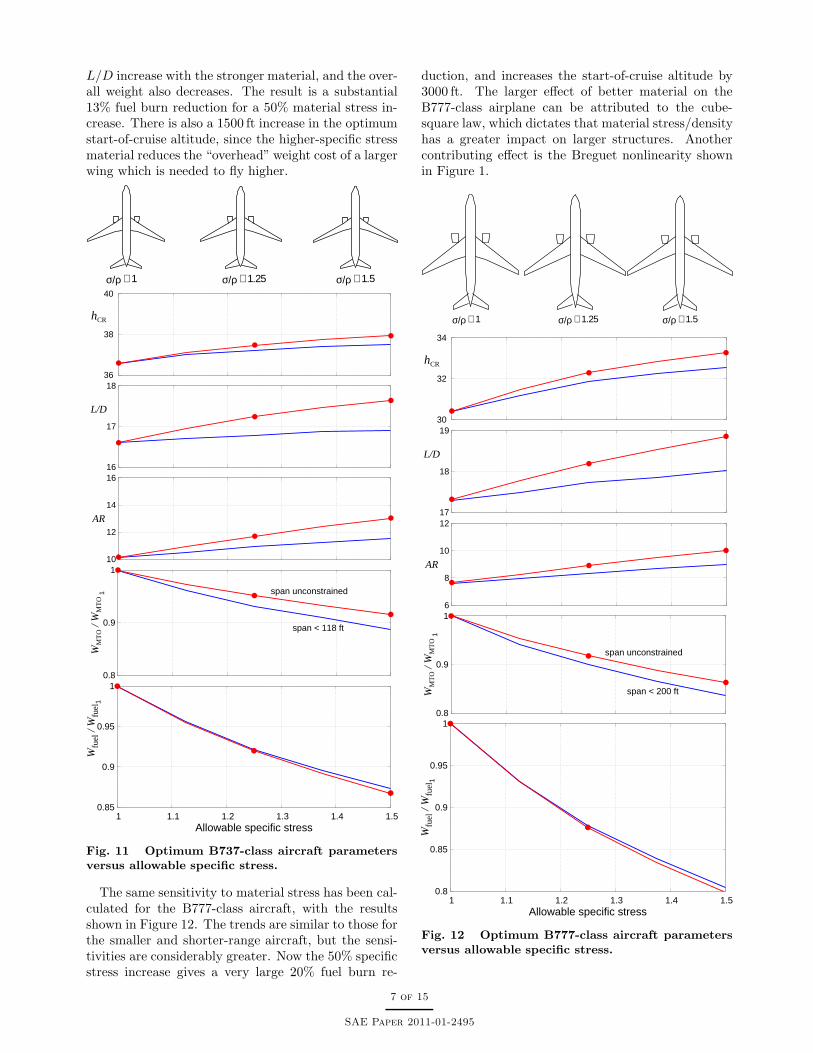
L/D increase with the stronger material, and the over-all weight also decreases. The result is a substantial13% fuel burn reduction for a 50% material stress in-crease. There is also a 1500 ft increase in the optimumstart-of-cruise altitude, since the higher-specific stressmaterial reduces the “overhead” weight cost of a largerwing which is needed to fly higher.
σ/ρ ∼ 1 σ/ρ ∼ 1.25 σ/ρ ∼ 1.5
36
38
40
hCR
16
17
18
L/D
10
12
14
16
AR
0.8
0.9
1
WM
TO
/ W
MT
O 1
span < 118 ft
span unconstrained
0.85
0.9
0.95
1
1 1.1 1.2 1.3 1.4 1.5
Wfu
el /
Wfu
el1
Allowable specific stress
Fig. 11 Optimum B737-class aircraft parametersversus allowable specific stress.
The same sensitivity to material stress has been cal-culated for the B777-class aircraft, with the resultsshown in Figure 12. The trends are similar to those forthe smaller and shorter-range aircraft, but the sensi-tivities are considerably greater. Now the 50% specificstress increase gives a very large 20% fuel burn re-
duction, and increases the start-of-cruise altitude by3000 ft. The larger effect of better material on theB777-class airplane can be attributed to the cube-square law, which dictates that material stress/densityhas a greater impact on larger structures. Anothercontributing effect is the Breguet nonlinearity shownin Figure 1.
σ/ρ ∼ 1 σ/ρ ∼ 1.25 σ/ρ ∼ 1.5
30
32
34
hCR
17
18
19
L/D
6
8
10
12
AR
0.8
0.9
1
WM
TO
/ W
MT
O 1
span < 200 ft
span unconstrained
0.8
0.85
0.9
0.95
1
1 1.1 1.2 1.3 1.4 1.5
Wfu
el /
Wfu
el1
Allowable specific stress
Fig. 12 Optimum B777-class aircraft parametersversus allowable specific stress.
7 of 15
SAE Paper 2011-01-2495

Load factor
The introduction of digital electronics and fly-by-wire controls on aircraft has enabled active Gust LoadAlleviation (GLA) to reduce the peak stresses on theairframe produced by any given gust. This conceivablyallows some reduction of the specified maximum loadfactor Nmax which the aircraft can withstand with-out structural failure. Figures 13 and 14 show thefuel burn versus specified maximum load factor forthe B737 and B777 class aircraft. The effect is qual-itatively similar to that produced by an increase inallowable stress, although now the benefits are smallerbecause only the primary wing structure is affected byNmax. The fuselage structure is sized by pressuriza-tion and landing-impact loads, which are held fixed asthe load factor is varied. The tail structure is sized bymaximum airloads at a specified never-exceed speed,which is also held fixed here.
= 3.0Nmax= 2.25Nmax= 1.50Nmax
16
17
18
19
20
L/D
0.85
0.9
0.95
1
WM
TO
/ W
MT
O 3
span < 118 ft
span unconstrained
0.85
0.9
0.95
1
1.5 1.75 2 2.25 2.5 2.75 3
Wfu
el /
Wfu
el 3
Maximum load factor
Fig. 13 Optimum B737 class aircraft parametersversus specified maximum load factor.
Engine pressure ratio and turbine materials
Turbofan engine technology has been the subject ofcontinuous intense research and development since the1950’s, as outlined by Koff.17 NASA’s UEET pro-gram18 is a relatively recent example.Two measures of engine technology are the over-
all pressure ratio (OPR), and the turbine inlet totaltemperature Tt4. The latter is mainly limited by the
= 3.0Nmax= 2.25Nmax= 1.50Nmax
16
17
18
19
20
L/D
0.85
0.9
0.95
1
1.5 1.75 2 2.25 2.5 2.75 3
WM
TO
/ W
MT
O 3
span < 200 ft
span unconstrained
0.8
0.85
0.9
0.95
1
1.5 1.75 2 2.25 2.5 2.75 3
Wfu
el /
Wfu
el 3
Maximum load factor
Fig. 14 Optimum B777-class aircraft parametersversus specified maximum load factor.
allowable turbine metal temperature Tmetal and theturbine-cooling mass flow and effectiveness.A large OPR naturally produces decreases in TSFC
via the ideal Brayton-cycle thermal efficiency relation
ηT = 1 − 1/OPR(γ−1)/γ (8)
while a large Tt4 or Tmetal increases the engine core’spower/weight ratio, and thus reduces the engineweight for a given thrust requirement. In the presenceof material thermal constraints the two parameters arealso coupled in that an increase in OPR also increasesthe compressor discharge temperature Tt3, which inturn reduces the maximum permissible energy input,i.e. temperature rise Tt4−Tt3 across the combustor,and thus limits the core power.As outlined above, changes in OPR and Tmetal have
a complex influence on the TSFC and thrust/weightratio, so that the overall engine+airplane system’s re-sponse to these parameters is quite involved. Theoverall effect is quantified in Figure 15, which showsthe fuel burn versus turbine blade metal tempera-ture, for a range of OPR values. The lowest values
8 of 15
SAE Paper 2011-01-2495
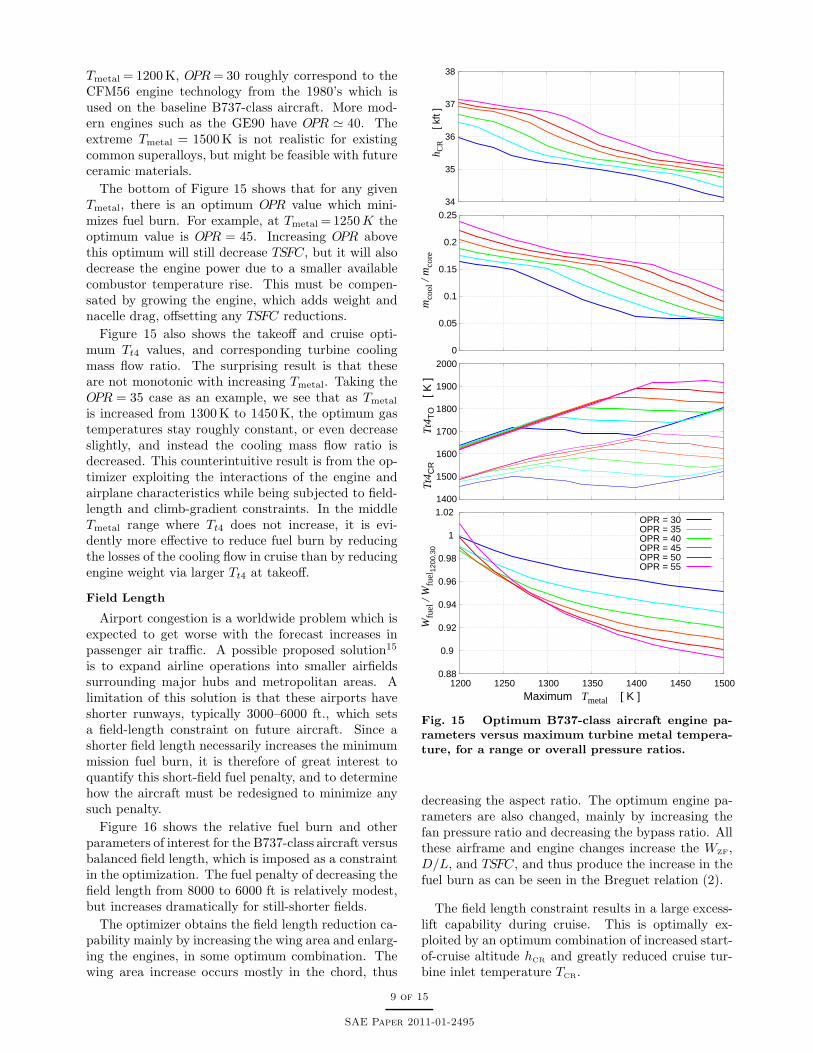
Tmetal = 1200K, OPR= 30 roughly correspond to theCFM56 engine technology from the 1980’s which isused on the baseline B737-class aircraft. More mod-ern engines such as the GE90 have OPR ≃ 40. Theextreme Tmetal = 1500K is not realistic for existingcommon superalloys, but might be feasible with futureceramic materials.
The bottom of Figure 15 shows that for any givenTmetal, there is an optimum OPR value which mini-mizes fuel burn. For example, at Tmetal=1250K theoptimum value is OPR = 45. Increasing OPR abovethis optimum will still decrease TSFC, but it will alsodecrease the engine power due to a smaller availablecombustor temperature rise. This must be compen-sated by growing the engine, which adds weight andnacelle drag, offsetting any TSFC reductions.
Figure 15 also shows the takeoff and cruise opti-mum Tt4 values, and corresponding turbine coolingmass flow ratio. The surprising result is that theseare not monotonic with increasing Tmetal. Taking theOPR = 35 case as an example, we see that as Tmetal
is increased from 1300K to 1450K, the optimum gastemperatures stay roughly constant, or even decreaseslightly, and instead the cooling mass flow ratio isdecreased. This counterintuitive result is from the op-timizer exploiting the interactions of the engine andairplane characteristics while being subjected to field-length and climb-gradient constraints. In the middleTmetal range where Tt4 does not increase, it is evi-dently more effective to reduce fuel burn by reducingthe losses of the cooling flow in cruise than by reducingengine weight via larger Tt4 at takeoff.
Field Length
Airport congestion is a worldwide problem which isexpected to get worse with the forecast increases inpassenger air traffic. A possible proposed solution15
is to expand airline operations into smaller airfieldssurrounding major hubs and metropolitan areas. Alimitation of this solution is that these airports haveshorter runways, typically 3000–6000 ft., which setsa field-length constraint on future aircraft. Since ashorter field length necessarily increases the minimummission fuel burn, it is therefore of great interest toquantify this short-field fuel penalty, and to determinehow the aircraft must be redesigned to minimize anysuch penalty.
Figure 16 shows the relative fuel burn and otherparameters of interest for the B737-class aircraft versusbalanced field length, which is imposed as a constraintin the optimization. The fuel penalty of decreasing thefield length from 8000 to 6000 ft is relatively modest,but increases dramatically for still-shorter fields.
The optimizer obtains the field length reduction ca-pability mainly by increasing the wing area and enlarg-ing the engines, in some optimum combination. Thewing area increase occurs mostly in the chord, thus
34
35
36
37
38
h
CR
[ kf
t ]
0
0.05
0.1
0.15
0.2
0.25
mco
ol /
mco
re
1400
1500
1600
1700
1800
1900
2000
Tt4
CR
T
t4T
O
[ K ]
0.88
0.9
0.92
0.94
0.96
0.98
1
1.02
1200 1250 1300 1350 1400 1450 1500
Wfu
el /
Wfu
el12
00,3
0
Maximum Tmetal [ K ]
OPR = 30OPR = 35OPR = 40OPR = 45OPR = 50OPR = 55
Fig. 15 Optimum B737-class aircraft engine pa-rameters versus maximum turbine metal tempera-ture, for a range or overall pressure ratios.
decreasing the aspect ratio. The optimum engine pa-rameters are also changed, mainly by increasing thefan pressure ratio and decreasing the bypass ratio. Allthese airframe and engine changes increase the WZF,D/L, and TSFC, and thus produce the increase in thefuel burn as can be seen in the Breguet relation (2).
The field length constraint results in a large excess-lift capability during cruise. This is optimally ex-ploited by an optimum combination of increased start-of-cruise altitude hCR and greatly reduced cruise tur-bine inlet temperature TCR.
9 of 15
SAE Paper 2011-01-2495

= 3000lBF ft lBF ft= 5000 lBF ft= 8000
36
38
40
42hCR
[ kft ]
1200
1300
1400
1500
1600
1700
1800
Tt4
[K]
Takeoff
Cruise
4
5
6
7
8
BPR
Takeoff
Cruise
1.5
1.6
1.7
1.8
1.9
FPR Takeoff
Cruise
1
1.05
1.1
1.15
WM
TO /
WM
TO
800
0
1
1.05
1.1
1.15
1.2
1.25
1.3
3000 4000 5000 6000 7000 8000
Wfu
el /
Wfu
el 8
000
Balanced field length [ ft ]
Fig. 16 Optimum B737-class aircraft parametersversus balanced field length.
Stability Margin
The extensive use of fly-by-wire and digital con-trol systems on modern aircraft enables the possibilityof using active stability augmentation, commonly re-ferred to as Relaxed Static Stability (RSS).19 In thepresent conceptual design study its effect is repre-sented by a reduction in the minimum allowed stabilitymargin, defined for the aftmost-CG passenger load-ing configuration. The resulting aircraft then has less
fuel burn from a smaller horizontal tail which reducesweight and profile drag. Another contributing factoris less download in cruise at mid-range CG, which re-duces trim drag and also shrinks the wing.Figure 17 shows the fuel burn versus minimum static
stability margin, along with other associated parame-ters of interest. A decrease of 0.05 in margin producesa 1.25% fuel burn reduction, which is not large, butperhaps worth pursuing with a suitable RSS system.
= −0.10SMmin = +0.05SMmin = +0.20SMmin
0.6
0.8
1
1.2
Vh
-0.1
-0.05
0(L
h / L
) CG
mid
16
17
18
L/D
0.94
0.96
0.98
1
1.02
-0.1 -0.05 0 0.05 0.1 0.15 0.2
Wfu
el /
Wfu
el 0
.15
Minimum static margin
Fig. 17 Optimum B737 class aircraft parame-ters versus specified minimum (forward-CG) staticmargin.
Increased seat room allowance
Judging by the complaints about air travel echoedin the media, air travelers are very sensitive to cabincomfort, in particular cramped seating. Alleviatingthis with a larger-cabin configuration could thereforehave a strong marketing benefit, but would inevitablycome at a price of increased fuel burn and a larger andmore expensive airplane.To determine the smallest possible fuel burn and
gross weight penalties of a larger cabin, the B737-classfuselage shape was progressively grown in diameter to
10 of 15
SAE Paper 2011-01-2495

accommodate 10% and 20% increases in seat width,and then separately stretched lengthwise to accommo-date 10% and 20% increases in seat pitch. The globalTASOPT optimization was then used to generate op-timized aircraft for each of these enlarged fuselageshapes. Figure 18 summarizes the results. Assumingthat the width and pitch stretch effects can be super-imposed, a 20% increase in both will result in a roughly15% fuel burn increase. The gross weight would alsoincrease about 8%. The resulting increases in operat-ing and ownership costs and higher ticket prices wouldof course need to be weighed against the better attrac-tiveness to the air traveler.
1.0 1.21.1
1
1.02
1.04
1.06
WM
TO
/ W
MT
O 1
width
pitch
1
1.02
1.04
1.06
1.08
1.1
1 1.05 1.1 1.15 1.2
Wfu
el /
Wfu
el 1
Seat width, pitch factor
width
pitch
Fig. 18 B737 class aircraft fuel burn and grossweight, versus seat width and pitch.
Skin friction reduction
The profile drag of a transport aircraft in cruise issomewhat more than half of the total drag, and verynearly directly scales with the skin friction integratedover its surface (the pressure-drag component of pro-file drag actually scales as the displacement thickness,but this itself scales as the skin friction). Because oftheir great potential payoff in increased range or de-creased fuel burn, techniques for reducing skin frictionhave been extensively pursued for many decades. Mostof the effort has been focused on either small-scalestreamwise surface ridges or “riblets”, or alternativelyon partial laminar flow. There is a very large bodyof literature on these topics. For a partial review see
Bushnell.5
Riblets
Riblets have long been known to be effective for dragreduction in near-zero pressure gradients, as investi-gated first by Liu et al,20 and subsequently by manyothers. Their effectiveness was also demonstrated instrong wing-airfoil pressure gradients by McLean etal.21 About 5–8% skin friction reduction is achievableby full surface coverage with riblets which are ideallysized for the local Reynolds number. Partial coverageor nonideal sizing will result in smaller friction reduc-tions, or even penalties.
Laminar flow
The possibility of using laminar flow on large jettransports is generally recognized to be extremely dif-ficult, due to their high Reynolds numbers, wing sweepwhich promotes crossflow instabilities,22 and the rel-atively “dirty” operating environment. These prob-lems can be overcome with sufficient surface qualityand judicious application of Laminar Flow Control(LFC) in the form of distributed suction, as has beendemonstrated on a retrofitted Boeing 757 wing inflight.23 Joslin24 discusses the relevant technology is-sues. Whether an LFC system is economically viableon an operational airplane is still an open question.Laminar flow on transonic wings introduces many
new design tradeoffs and complications. For example,the weak adverse pressure gradient on an ideal tran-sonic airfoil must be moderated to allow laminar flow,causing loss of lift as sketched in Figure 19. This trade-off has been examined by Fujino et al.25 Also, laminar
−Cp
Cp− ∗
ideal transonic airfoil
shock
required forlaminar flow
excessive wave draglost lift
shock strength
Fig. 19 Slight favorable pressure gradient neededfor laminar flow conflicts with ideal transonic pres-sure distribution, resulting in loss of lift in thepresence of a maximum shock strength constraint.
flow is incompatible with leading edge slats, so lesseffective systems like Kruger flaps are required.Since laminar flow adversely impacts both the tran-
sonic cruise wave drag and possibly also the availableCLmax
for takeoff and landing, it makes the overall air-craft system optimization considerably more compli-cated, especially at the conceptual design stage. Fullyaccounting for all such tradeoffs is somewhat beyondthe scope of the present conceptual design study.
11 of 15
SAE Paper 2011-01-2495

Simple friction scaling
The focus here is to only estimate the impact on fuelburn of any modest skin friction reduction, howeverit is obtained. The effect is represented in TASOPTby applying an ad-hoc scaling factor fcf to the skin-friction correlations used in its profile drag predictions.For representing riblets on a fuselage, the simple
friction scaling is deemed reasonable. For riblets ona wing, it does not address the possibility of redesign-ing the airfoils to fully exploit the healthier boundarylayers which result from the riblets, so that here thefriction scaling approach might be conservative.For representing laminar flow, the simple scaling is
less realistic overall, since there are now many otherinteracting effects as discussed above. Nevertheless,it is still considered useful as a best-case indicator ofplausible fuel savings which might be achieved. Alsoof interest, as with the other parameters, is how theengine and operation should be redesigned to best ex-ploit any given skin friction reduction.To determine the possibly different impacts of re-
ducing friction on the fuselage and the wing, separateTASOPT calculations were performed for these twocases. The results are summarized in Figure 20. The
36
37
38hCR
[ kft ]
0.92
0.94
0.96
0.98
1
(D/L
) / (
D/L
) 1
0.96
0.98
1
WM
TO
/ W
MT
O 1
0.9
0.92
0.94
0.96
0.98
1
0.85 0.9 0.95 1
Wfu
el /
Wfu
el 1
Skin friction factor
fuselage only
wing+tails only
Fig. 20 B737-class aircraft parameters versus skinfriction factor.
benefit is larger for friction reduction on the wing andtail surfaces, simply because they have a larger frac-tion of the total profile drag. It’s interesting to notethat reducing friction on the wing and tail surfaces in-
creases the optimum altitude, while reducing frictionon the fuselage decreases it very slightly. This is con-sistent with the optimum-altitude tradeoffs discussedearlier.If the entire surface were covered with optimum ri-
blets with a fcf=0.93 friction factor, the fuselage andsurface benefits together would produce a 6% fuel sav-ings. Laminar flow could potentially produce muchlarger savings, but no overall-savings estimates will beattempted here, since numerous other factors and in-teractions must be also considered as discussed above.
Alternative Configurations
The conventional low-wing monoplane configurationwith wing-mounted engines has been the norm forcommercial transport aircraft since the developmentof the Boeing 707 in the 1950’s. The major variationhas been the engine placement, as on the B727 andDC9, but the cantilever low wing has persisted. Nu-merous studies have been conducted into alternativeconfigurations, for example
– the Blended Wing Body (BWB) of Liebeck,26
– the C-wing of McMasters and Kroo,27
– the Joined Wing of Wolkovitch,28
– the Strut-Braced Wing (SBW) of Pfenninger,29
– the author’s D8 concept,15, 30
and many others. It is far beyond scope to examineand compare all these here. One practical reason isthat the TASOPT model uses simple beam theory forits structural models. Hence it is restricted to a wing-tube airplane topology, and cannot be applied to theBWB, C-wing, and Joined-Wing concepts. However,it does apply to the SBW and the D8 concepts, whichwill be examined here.
Strut-Braced Wing
The SBW concept uses an external strut for wingbending moment relief, which enables some combina-tion of reduced structural weight, larger span, andthinner airfoil. These should overcome the addedweight and drag of the strut, resulting in a net re-duction in fuel burn.Many complications arise in the SBW concept, the
major ones being strut buckling under negative loads,reduction of fuel volume, aeroelasticity, load pathsfrom landing gear to wing, and crash safety of thehigh wing above the cabin. Most of these have beenaddressed by the Truss-BracedWing,31 which is a gen-eralization of the SBW. Here, the focus will be onfinding the best SBW airplane+engine+operation forminimum fuel burn as for the other parameter stud-ies. However, complications and associated weightpenalties from negative loading requirements, crash-worthiness, and aeroelasticity are ignored. Hence theresults here are likely to be optimistic, and should betaken only as a bound on the fuel burn reductionsachievable with a single-strut configuration.
12 of 15
SAE Paper 2011-01-2495

Since a strut-braced wing is differently affected byairfoil thickness than the cantilever wing, it is expectedto have different Mach/sweep/thickness tradeoff char-acteristics. For this reason the optimization was per-formed over a range of cruise Mach numbers like in theearlier cruise-Mach study. The results are summarizedin Figure 21. In addition to the unconstrained-spancase, two different span constraint cases were calcu-lated: i) span limited to 132 ft which is the optimumunconstrained span for the SBW at MCR=0.8, and ii)span limited to 118 ft which is the optimum uncon-strained span for the cantilever case MCR=0.8, whichis shown in Figure 9 and replotted here for comparison.
M = 0.80CRMCR = 0.75MCR = 0.70
16
17
18
19
L/D
0.85
0.9
0.95
1
WM
TO
/ W
MT
O 0
.8, c
antil
ever
0.8
0.85
0.9
0.95
1
0.7 0.72 0.74 0.76 0.78 0.8
Wfu
el /
Wfu
el 0
.8, c
antil
ever
MCR
span unconstrained
span < 132 ft
span < 118 ft
cantilever
Fig. 21 Strut-braced B737-class aircraft parame-ters, versus cruise Mach number.
The unconstrained-span SBW configuration appearsto offer 8% fuel savings relative to the cantilever con-figuration. For the constrained-span SBW the savingsbecome 7% at MCR=0.8, and 4% at MCR=0.7. Thesesavings are attractive, but would need to be exam-ined more closely in light of the potential complicationswith the SBW configuration discussed above.
D8 Configuration
The D8 configuration was the result of an N+3study,15 and was further described by Drela.30 Thisis a B737-class aircraft with a wide twin-aisle fuselagewith upturned nose. Two variants are diagrammed inFigure 22.
737−800
D8.x
700 10 20 30 40 50 60 80 90 100 110 ft
11
D8.xD8.0
D8.0
700 10 20 30 40 50 60 80 90 100 110 120 ft
9
737−800
D8.2
Fig. 22 D8 fuselage on the D8.0 and D8.2 variants,compared with a B737-800 fuselage.
Compared to the conventional B737 fuselage, themain features of the D8 fuselage which produce itsfuel savings are:
– increased fuselage carryover lift CLfuse
– less-negative wing-body pitching moment CMac
– smaller CG travel ∆xcg due to the shorter cabin– larger tail effectiveness ∂cℓh/∂CL at the high location– lighter two-point supported horizontal tail
The relevant parameter values are compared in Ta-ble 3. Their effects on the aircraft are:
– larger fuselage lift correspondingly shrinks the ex-posed wing area by 6%– the required horizontal tail area shrinks by 20%– the tail download in cruise is less negative by 3%of aircraft weight, which further shrinks the wing byanother 3%
Table 3 Tail-sizing and tail-load parameter com-parison.
Aircraft CLfuse/CL CMac
∆xcg/c̄ ∂cℓh/∂CL
B737 0.128 -0.1665 0.586 0.36D8.0 0.195 -0.0825 0.507 0.41
The flat rear D8 fuselage enables a flush-mountedengine installation on the D8.2 variant, with BoundaryLayer Ingestion (BLI) of about 40% of the fuselage’sboundary layer. The BLI gives 6–8% additional fuelburn reduction, depending on the allowance made forfan efficiency degradation from ingesting the distortedflow. The D8.0 and D8.2 top views are shown in Fig-ure 23. Optimization by TASOPT produces the keyparameters and predicted performance listed in Ta-ble 4, along with the values for the optimized-B737
13 of 15
SAE Paper 2011-01-2495

baseline. The structural material properties, load fac-tors, and engine technology parameters are specified tobe the same for all three airplanes, so the differencesare due to configuration alone.
Mach = 0.80span = 118 ft
Mach = 0.72span = 118 ft
Mach = 0.72span = 138 ft
D8.0 D8.2
D8.2
(no span constraint)
Fig. 23 D8.0 and D8.2 configuration top views.
Table 4 Key parameters of B737, D8.0, and D8.2configurations, all optimized by TASOPT for min-imum Wfuel. Baseline weight values are WMTO =
162319 lb and Wfuel = 35889 lb.
M CL L/D span WMTO Wfuel[ft] frac frac
B737 0.80 0.559 16.33 118 1.000 1.000D8.0 0.80 0.567 16.39 118 0.894 0.882D8.2 0.72 0.699 18.32 118 0.775 0.671D8.2 0.72 0.688 19.84 138 0.815 0.658
If categorized by its wing-mounted engines and typ-ical cruise Mach, the D8.0 is a relatively conventionaltransport airplane. Nevertheless, it is predicted toproduce a 12% fuel savings compared to the optimized-B737 baseline, this being entirely the result of the D8fuselage and tail characteristics listed in Table 3 whichshrink the wing and tail surfaces.
The D8.2, with its low-sweep wing and slower cruise,and its rear BLI engines, is a more novel configuration.In addition to the fuselage’s benefits, the D8.0 alsoexploits the cumulative effects of the reduced Machnumber, BLI, shorter landing gear, smaller verticaltails allowed by the small engine-out yaw moments,and other miscellaneous features. The net result is aquite large 33% fuel burn reduction.
Concluding Remarks
This paper has presented calculations of sensitivitiesof fuel burn to a variety of key design parameters oftube and wing transport aircraft. The parameters en-compass materials technology, engine technology, andoperations, and were selected on the basis of theirexpected strong influence on fuel burn. The quantifi-cation of these sensitivities gives guidance for whereresearch efforts might be directed so as to have signif-icant impact on the fuel economy of future transportaircraft.
Acknowledgments
The author would like to thank Doug McLean(Boeing, ret.), Ed Greitzer (MIT), and Wesley Lord(Pratt&Whitney) for their helpful critique and sug-gestions.
References1NASA Aeronautics Research Mission Directorate. Funda-
mental Aeronatics Program: Subsonic Fixed Wing, Sep 2009.http://www.aeronautics.nasa.gov/fap/.
2NASA Aeronautics Research Mission Directorate.N+3 Program, June 2010. http://www.nasa.gov/topics/
aeronautics/ features/future airplanes.html.3J.I Hileman, J.B. Katz, J. Mantilla, and G. Fleming. Pay-
load fuel energy efficiency as a metric for aviation environmentalperformance. Proceedings of the 26th ICAS Conference, Anchor-age, AK, Sep 2008.
4R.S. Shevell. Fundamentals of Flight, 2nd Edition. Pren-tice Hall, Englewood Cliffs, New Jersey, 1989.
5D.M. Bushnell. Aircraft drag reduction — a review. Jour-nal of Aerospace Engineering, 217:1–18, 2003.
6J. Roskam. Airplane Design. DAR Corporation, Lawrence,Kansas, 2000.
7E. Torrenbeek. Synthesis of Subsonic Airplane Design.Delft University Press, 1988.
8D.P. Raymer. Aircraft Design: A Conceptual Approach.AIAA Education Series. AIAA, 1992.
9S. Jayaram, A. Myklebust, and P. Gelhausen. ACSYNT —A standards-based system for parametric computer aided con-ceptual design of aircraft. AIAA Paper 92-1268, Feb 1992.
10W.H. Mason and T.K. Arledge. ACSYNT aerodynamic es-timation — An examination and validation for use in conceptualdesign. AIAA Paper 93-0973, Feb 1993.
11M.B. Knapp. Applications of a nonlinear wing planformdesign program. Master’s thesis, MIT, Aug 1996.
12S. Wakayama. Lifting Surface Design Using Multidisci-
plinary Optimization. PhD thesis, Stanford, June 1994.13I. Kroo. PASS, Program for Aircraft Synthesis Studies.
Software Package, Desktop Aeronautics, Palo Alto, CA, 2005.14M. Drela. N+3 Aircraft Concept Designs and Trade
Studies – Appendix. Technical Report NASA CR-2010-216794/VOL2, NASA, 2010.
15E.G. Greitzer. N+3 Aircraft Concept Designs and TradeStudies. Technical Report NASA CR-2010-216794/VOL1,NASA, 2010.
16F. Chang. Structural health monitoring: The demands and
challenges. CRC Press, 1999.17B.L. Koff. Gas turbine technology evolution: A designer’s
perspective. Journal of Propusion and Power, 20(4):577–595,Jul–Aug 2004.
18NASA Glenn Research Center. Ultra-Efficient EngineTechnology Program, Jan 2010. http://www.grc.nasa.gov/
WWW/RT/RT2000/2000/2010shaw.html.19S.M. Sliwa. Economic evaluation of flying-qualities design
criteria for a transport configured with relaxed static stability.Technical Report TP-1980-1760, NASA, 1980.
20S.J. Liu, C.K.and Kline and J.P. Johnston. An experimen-tal study of turbulent boundary layer on rough walls. ReportMD-15, Stanford U. Dep. Mech. Eng., July 1966.
21J.D. McLean, D.N. George-Falvy, and P.P Sullivan. Flight-test of turbulent skin friction reduction by riblets. Proceedingsof International Conference on Turbulent Drag Reduction byPassive Means, Royal Aeronautical Society, London, 1987.
22H.L. Reed and D. Saric, W.S.and Arnal. Linear stabilitytheory applied to boundary layers. Annual Reviews of Fluid
Mechanics, 28, 1996.
14 of 15
SAE Paper 2011-01-2495
23Boeing Commercial Aircraft Group. High reynolds numberhybrid laminar flow control (HLFC) flight experiment. TechnicalReport CR-1999-209324, NASA, 1999.
24R.D. Joslin. Overview of laminar flow control. TechnicalReport TP-1998-208705, NASA, 1998.
25M. Fujino, Y. Yoshizaki, and Y. Kawamura. Naturallaminar-flow airfoil development for a lightweight business jet.Journal of Aircraft, 40(4):609–615, Jul-Aug 2003.
26R. Liebeck. Design of the Blended Wing Body subsonictransport. Journal of Aircraft, 41(1), Jan 2004.
27J.H. McMasters and I. Kroo. Advanced configurations forvery large subsonic transport airplanes. Technical MemorandumTM 109154, NASA, Sept 1994.
28J. Wolkovitch. The joined wing: An overview. Journal of
Aircraft, 23(3), Mar 1986.29W. Pfenninger. Some thoughts on the design of large global
range lfc transport airplanes. In Special Course on Concepts for
Drag Reduction. AGARD, 1976.30M. Drela. Development of the D8 Transport Configuration.
AIAA Paper 2011-3970, June 2011.31O. Gur, M. Bhatia, W.H. Mason, J.A. Schetz, R.K. Kapa-
nia, and T. Nam. Development of a framework for truss-bracedwing conceptual MDO. Struc. Multidic. Optim., 44:277–298,2011. Also appeared as AIAA paper 2010-2754.
15 of 15
SAE Paper 2011-01-2495
Related Documents