Yıl:3 | Sayı:5 | Ocak 2014 Yer Altı Kaynakları Dergisi | Journal of Underground Resources Year:3 | Number:5 | January 2014 www.mtbilimsel.com 1 Araştırma Makalesi Design Criteria for Production Blasting in an Underground Quarry: An Example of Application of the BDI Theory Patlatma Hasar İndeksi Teorisinin Bir Uygulama Örneği: Yeraltı Ocağında Üretim Patlatması için Tasarım Ölçütleri Marilena Cardu 1 *, Pierpaolo Oreste 2 1 DIATI Politecnico, Torino, ITALY 2 IGAG National Research Council, Torino, ITALY *Responsible Author: [email protected] Abstract Although not common, there are cases of underground quarries where the exploitation affects materials like limestone, when both technical and economic feasibility are guaranteed; the object of the present study is part of this case. The quarry is in operation since 1927: at present, the exploitation is carried out completely underground by sub-level stoping. The exploitation involves two levels, with 4 rooms at the upper level, and 9 rooms at the lower level. The need to comply with the required production respecting the desired grain size distribution implies the adoption of 650-800 kg of explosives per blast. The vibrations, as well as the related unwanted effects, are then considerable, regardless of the timing system. The vibrations must therefore be reduced, through the analysis of the blasting pattern, a careful design and a proper performance of the blast. For this purpose, the theory of Blast Damage Index (BDI) was used: through the development of correlations between charge per delay, propagation velocity of p waves in the rock mass and peak particle velocity, it was possible to determine which pair minimum dis- tance/maximum charge per delay is allowed. Key words: Blasting damage index, underground mining methods, vibrations, ppv. Özet Çok sık olmamasına rağmen, kireçtaşı gibi üretimi etkileyen malzemeler yeraltı ocaklarındaki bazı durumlarda hem teknik hem de ekonomik uygunluk garanti edildiğinde bu çalışmanın amacı bu durumun bir parçasıdır. Ocak 1927’den bu yana faaliyettedir: şu anda, üretim yeral- tında tamamen arakatlı dolgu yöntemi ile yapılmaktadır. Üretim faaliyetleri 4 odalı üst kat ve 9 odalı alt kat olarak iki seviyeyi içermektedir. İstenilen tane boyut dağılımına uygun üretim için patlama başına 650-800 kg patlayıcı madde kullanılması gereklidir. Zamanlama sistemine bakmadan, arzu edilmeyen etkilerinden dolayı titreşimler dikkate alınmalıdır. Bundan dolayı, titreşimler, dikkatli bir patlatma paterni tasarımı ve patlayıcının uygun performansı analiz edi- lerek azaltılmalıdır. Bu amaç için, gecikme başına şarj, kaya kütlesi içerisindeki p dalgalarının yayılım hızı ve en yüksek parçacık hızı arasındaki korelasyanların yardımıyla Patlatma Hasar İndeksi (PHİ) kullanılmıştır, en kısa mesafe / izin verilen gecikme başı en büyük şarj çiftinin belirlenmesi mümkün olmuştur. Anahtar kelimeler: Patlatma hasar indeksi, titreşimler, yeraltı üretim yöntemleri, ppv.

Welcome message from author
This document is posted to help you gain knowledge. Please leave a comment to let me know what you think about it! Share it to your friends and learn new things together.
Transcript

Yıl:3 | Sayı:5 | Ocak 2014
Yer Altı Kaynakları Dergisi | Journal of Underground Resources
Year:3 | Number:5 | January 2014
www.mtbilimsel.com
1
Araştırma Makalesi
Design Criteria for Production Blasting in an Underground Quarry: An Example of Application of the BDI TheoryPatlatma Hasar İndeksi Teorisinin Bir Uygulama Örneği: Yeraltı Ocağında Üretim Patlatması için Tasarım Ölçütleri
Marilena Cardu1*, Pierpaolo Oreste2
1DIATI Politecnico, Torino, ITALY2IGAG National Research Council, Torino, ITALY*Responsible Author: [email protected]
AbstractAlthough not common, there are cases of underground quarries where the exploitation affects materials like limestone, when both technical and economic feasibility are guaranteed; the object of the present study is part of this case. The quarry is in operation since 1927: at present, the exploitation is carried out completely underground by sub-level stoping. The exploitation involves two levels, with 4 rooms at the upper level, and 9 rooms at the lower level. The need to comply with the required production respecting the desired grain size distribution implies the adoption of 650-800 kg of explosives per blast. The vibrations, as well as the related unwanted effects, are then considerable, regardless of the timing system. The vibrations must therefore be reduced, through the analysis of the blasting pattern, a careful design and a proper performance of the blast. For this purpose, the theory of Blast Damage Index (BDI) was used: through the development of correlations between charge per delay, propagation velocity of p waves in the rock mass and peak particle velocity, it was possible to determine which pair minimum dis-tance/maximum charge per delay is allowed.
Key words: Blasting damage index, underground mining methods, vibrations, ppv.
ÖzetÇok sık olmamasına rağmen, kireçtaşı gibi üretimi etkileyen malzemeler yeraltı ocaklarındaki bazı durumlarda hem teknik hem de ekonomik uygunluk garanti edildiğinde bu çalışmanın amacı bu durumun bir parçasıdır. Ocak 1927’den bu yana faaliyettedir: şu anda, üretim yeral-tında tamamen arakatlı dolgu yöntemi ile yapılmaktadır. Üretim faaliyetleri 4 odalı üst kat ve 9 odalı alt kat olarak iki seviyeyi içermektedir. İstenilen tane boyut dağılımına uygun üretim için patlama başına 650-800 kg patlayıcı madde kullanılması gereklidir. Zamanlama sistemine bakmadan, arzu edilmeyen etkilerinden dolayı titreşimler dikkate alınmalıdır. Bundan dolayı, titreşimler, dikkatli bir patlatma paterni tasarımı ve patlayıcının uygun performansı analiz edi-lerek azaltılmalıdır. Bu amaç için, gecikme başına şarj, kaya kütlesi içerisindeki p dalgalarının yayılım hızı ve en yüksek parçacık hızı arasındaki korelasyanların yardımıyla Patlatma Hasar İndeksi (PHİ) kullanılmıştır, en kısa mesafe / izin verilen gecikme başı en büyük şarj çiftinin belirlenmesi mümkün olmuştur.
Anahtar kelimeler: Patlatma hasar indeksi, titreşimler, yeraltı üretim yöntemleri, ppv.
22
Cardu and Oreste
1. The Quarry and the Lime PlantsThe quarry is active since 1927, in the Bergamo province (Northern Italy), and feeds a large lime plant, with 4 vertical kilns, for a total production of burned lime of 350,000 t/y. Due to the burning loss (50%) and to the fines (<10 mm) that clog the kilns and therefore must be discarded before burning, a total yearly amount of 106 t/y of blasted rock (380,000 m3/y of rock in place) must be warranted. That means, for 220 worked days/y, an average daily production of 4,000 to 5,000 t. It has to be considered, however, that the burning process is continuous, and does not tolerate momentary shortages of feed. Two ample surge stockpiles, both of ready to burn rock and of blasted unprocessed rock have to be therefore warranted, to assure a constant feed even in the case of quarry production temporary stops (repairs, small delays in developments, displacements of semi-mobile machinery and so on). An appropriate daily production rate is 2,000 m3/d (in place). Primary and secondary crushing, sieving and washing plants are located underground, since the times of surface exploitation (Figure 1). A large (15,000 to 18,000 m3) underground storage of crushed rock, to be used as surge stockpile, is under excavation. The reasons for the underground exploitation are explained in Figures 2 and 3.
Limestone is abundant in the area, but only a member of the stratigraphic succession is locally suitable to the production of quicklime, represented by a bed 160-180 m thick of very pure limestone. Other beds are either too rich of magnesia, or of silica, or both. As shown in Figure 2, the bed is sub-vertical, and to continue surface quarrying implies the removal of a growing amount of unsuitable limestone, for stability reasons (Oriard, 1982). This not only increases the ratio of the excavated useless rock to the pure limestone, as shown by the example of Figure 3 and, obviously, the cost of the exploitation, but is actually impossible, because there is not eno-ugh free space to dump the large amount of waste rock (Berta & Oth., 1999). On the contrary, underground exploitation can be favorably considered (Mancini & Oth., 2003): the limestone is sound in thick beds, RQD practically 100%, and wide stopes can be opened with the longer axis at right angle with the bedding, separated by pillars of adequate width. The percent recovery of the rock body is obviously low, with respect to a surface exploitation, but still warrants, within the permit limits, 20 years of production at the present rate.
Figure 1. Front view of the old open pit exploitation; accesses to the underground (below) and the green (left) benches resulting from the exploitation are noticeable.Şekil 1. Eski açık ocak işletmesinin önden görünüşü; yeraltına geçişler (aşağıda) ve üretimden kaynaklanan yeşil (solda) basamaklar dikkat çekicidir.

3
Design Criteria for Production Blasting in an Underground Quarry: An Example of Application of the BDI Theory
Figure 2. 3D scheme of the body, the surface exploitation and the underground exploitation; it is noticeable the increase of waste removal required to continue the surface exploitation (Mancini & Oth., 2005).Şekil 2. Cevherin 3 boyutlu şeması, açık işletme üretimi ve yeraltı üretimi; açık ocak üretiminin sürekliliği için pasa atımının arttırılması dikkat çekicidir (Mancini & Oth., 2005).
Figure 3. Explanation of the physical limits of the surface exploitation. Vertical axis: amount of waste rock to be excavated; horizontal axis: amount of useful limestone excavated (cubic meters, for a vertical slice of unit thickness of the rock body).Şekil 3. Açık ocak üretiminin fiziksel sınırlarının açıklanması. Düşey eksen: kazılacak atık kayacın miktarı; yatay eksen: kazılacak faydalı kireçtaşının miktarı (metre küp, cevher kütlesinin birim kalınlığının düşey bir dilimi için).
2. Mining Method and Rock Stability ProblemsThe method is a sublevel stoping, with haulage by conveyor belts: the blasted rock is taken at the draw-points by LHD machines and transferred to a mobile crusher, feeding the conveyor belt – ore passes system for the upper 4 stops; the lower stopes (5 to 13) are exploited in the same way, but the haulage is effected by LHD + dumper tracks, and the primary crusher is installed in a fixed position. A general plan of the mine is shown in Figure 4; presently, only 5 of the 13 stopes have been exploited. The mechanical strength data of the limestone have been obtained from extensive coring (Table 1). The geomechanical quality of the rock mass is good, according to the surveys effected in the previous surface exploitation and in development tunnels. Some

44
Cardu and Oreste
karstic cavity of small extent has been crossed by the development works, in the upper levels; no groundwater problems, however, have been found, nor are expected, being the water table dictated by the river bed (290 m a.s.l), while the foreseen exploitation develops at altitudes over 305 m a.s.l. The mine has been designed according to the same principles followed in designing a multi-stage building in masonry. Pillars are considered as walls subjected to vertical loads (the rock cover plus their own weight) and to horizontal loads (the unbalanced lateral thrust of the self supporting vaults connecting the pillars); a thickness of 2 m of rock adjacent to the surface of the walls is considered as contributing load but not strength (the analogous of the plaster coating of a wall), being presumably cracked by the immediate proximity of the blasts. The admissible tensile stress is considered 0, the admissible compression stress is 1/4 of the minimum C0 measured on the cores, hence 25 MPa. Pillars are therefore verified for stability as walls subjected to eccentric vertical load: if the resultant vertical force falls within the median third of the resisting horizontal section, the whole section (apart from the supposed damaged layer) has bearing function, if falls outside the median third, tensile stresses can occur and the resisting section is accordingly reduced in the stability calculations. A maximum slenderness ratio of 2.5 has been set for the pillars. The vaults connecting the pillars are calculated according to the natural self supporting arch criterion (Bello 1977); a rock cover of at least 30 m above the self supporting arc top has been set.
Figure 4. 3D view of the quarry, at the end of the exploitation (Mancini & Oth., 2005).Şekil 4. Üretimden sonra ocağın üç boyutlu görüntüsü (Mancini & Oth., 2005).
Specific gravity 2.67 t/m3
C0 Over 140 MPa (min 100 MPa)T0 (Brazilian) Over 6 MPa
Table 1. Mechanical data of the limestone.Çizelge 1. Kireçtaşının mekanik verileri.
The access and drilling tunnels have a cross section of 30 ÷ 35 m2 (haulage and access) and 25 m2 (drilling), allowing for an easy circulation and operation of the machinery; the maximum grade has been set at 15 %. Ore passes are drilled by raise borer, 3 to 5 m in diameter, inclined by 200 with respect to the vertical. Apart from occasional bolting, no rock support is needed up to now. The stability of the pillars is monitored by means of extensometers installed perma-nently in selected points.
5
Design Criteria for Production Blasting in an Underground Quarry: An Example of Application of the BDI Theory
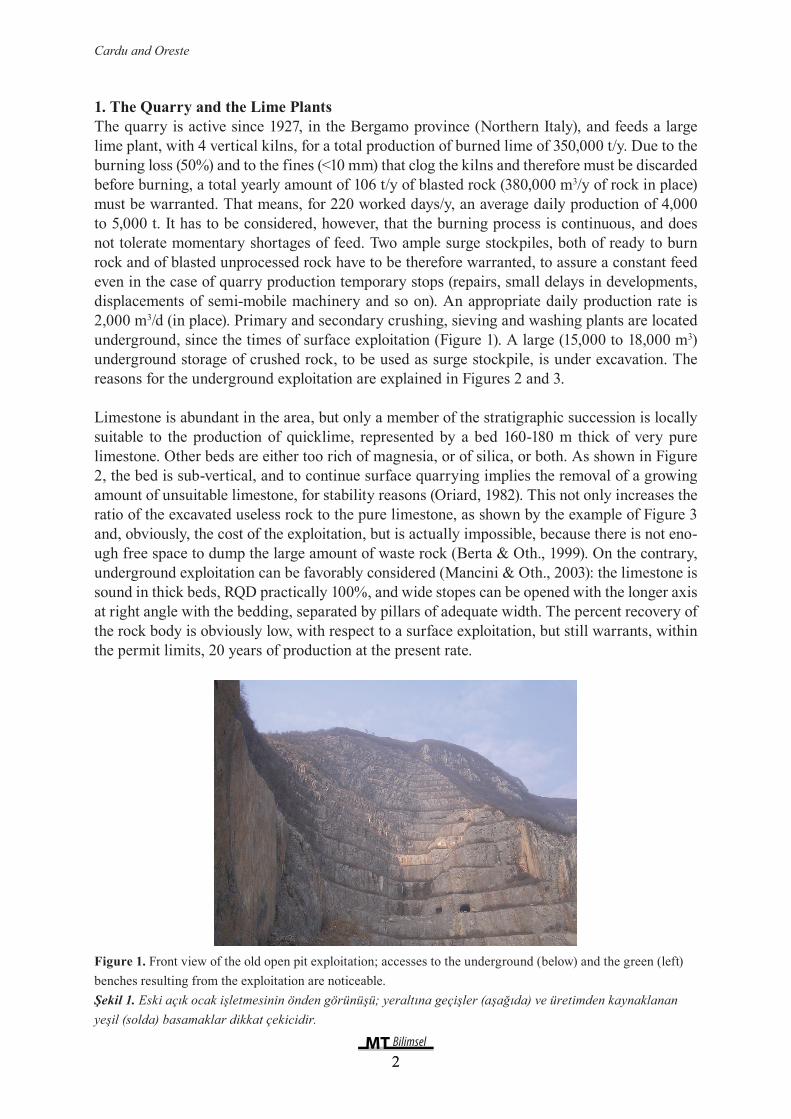
3. ExploitationThe first stope has been exploited using one drilling tunnel per sub-level, say 3 drilling tunnels per stope, as shown in Figure 5, right.
This arrangement was chosen with the aim of minimizing the incidence of the development work and of retaining some possibility of reducing the width of the stope, in the case of an unforeseen reduction of the self supporting ability of the roof. Some drawbacks became appa-rent during the exploitation (anyhow, successfully accomplished): slotting is difficult and time consuming, the side walls of the open stope are often very irregular due to poor or excessive breakage at the toe of the holes, the round includes a great number of long upward holes, diffi-cult to drill and to charge. Though being the results still acceptable (see Figure 6), starting from the stope n. 2 a different scheme, with two drilling tunnels in each sub-level, is adopted (Figure 5 left), which implies a greater incidence of the preparatory work but provides better control of the pillar size and strength, and other changes (to increase the sub-level spacing, and the size of the production blasts) are under study. Present production blasts are designed for rock volumes of 2,700 to 3,000 m3 each. The basal collecting trough is excavated with smaller blasts, some rounds in advance with respect to production, as shown in the same figure. Draw points are spaced by 20 m. Blasted rock in collected by 7÷9 m3 LHD loders, carried to the mobile crusher, and fed to the belt-ore passes system.
The average volume of a stope is 500,000 to 550,000 m3 (being the width 30 m, the length 180 m, the height 110 m), say 1.4 years of production. That means that in the same time a new stope must be ready (the drilling tunnels prepared and the slot opened), a pace that proved to be maintainable. Total workforce amounts to 15 (partly hired from an external contractor), and machinery comprises 2 jumbos, 1 SOLO drill (for production drilling), 2 TORO LHD (7 m3 and 9 m3), 1 mobile crusher, belting (as explained, the haulage system is due to be changed).
Figure 5. Right: exploitation with 3 sub levels, one drilling tunnel per sublevel; left: same, with 2 drilling tunnels per sublevel.Şekil 5. Sağ: 3 arakatın üretimi; sol: aynı, her arakat için 2 delik delme tüneli.

66
Cardu and Oreste
Figure 6. Representation of the results obtained from a production blast at stope n. 1.Şekil 6. 1 numaralı katlar arasında üretim patlatmasından elde edilen sonuçların sunumu.
4. The Blast Damage IndexThe BDI (Yu & Vongpaisal, 1996) can be considered as the reciprocal of a safety factor, and is represented as the ratio between dynamic stress induced and rock strength. Denoting by: V = vector sum of the three components of peak particle velocity (m/s); d = density of the rock (kg/dm3); c = speed of compression waves in the rock-mass (m/s); KS = site quality constant, variable between 0 and 1 and dimensionless, the stress induced in the rock is expressed as the product of the factors V, d and c, while the rock strength is the product of the dynamic tensile strength of the rock, the site quality constant, and a correction factor; then, the index of damage can be expressed as a function of six parameters:
Şekil 5. Sağ: 3 arakatın üretimi; sol: aynı, her arakat için 2 delik delme tüneli.
Figure 6. Representation of the results obtained from a production blast at stope n. 1.
Şekil 6. 1 numaralı katlar arasında üretim patlatmasından elde edilen sonuçların sunumu.
4. The Blast Damage Index
The BDI (Yu & Vongpaisal, 1996) can be considered as the reciprocal of a safety factor, and
is represented as the ratio between dynamic stress induced and rock strength. Denoting by: V
= vector sum of the three components of peak particle velocity (m/s); d = density of the rock
(kg/dm3); c = speed of compression waves in the rock-mass (m/s); KS = site quality constant,
variable between 0 and 1 and dimensionless, the stress induced in the rock is expressed as the
product of the factors V, d and c, while the rock strength is the product of the dynamic tensile
strength of the rock, the site quality constant, and a correction factor; then, the index of
damage can be expressed as a function of six parameters:
BDI =V⋅d⋅c
T⋅K S⋅106[1]
On the basis of tests carried out to determine the dynamic tensile strength of different types of
rock, Mohanty (1987) found that the ratio between the compressive strength and the dynamic
tensile strength varies between 3.2 and 3.9. The proportion between the dynamic tensile
On the basis of tests carried out to determine the dynamic tensile strength of different types of rock, Mohanty (1987) found that the ratio between the compressive strength and the dyna-mic tensile strength varies between 3.2 and 3.9. The proportion between the dynamic tensile strength and the tensile strength determined with the Brazilian test, instead, varies between a minimum of 1.6 and a maximum of 9.3.
The results of a series of uniaxial and triaxial compressive tests on samples obtained from core surveys carried out at the quarry show that the value of uniaxial compressive strength is 141
7
Design Criteria for Production Blasting in an Underground Quarry: An Example of Application of the BDI Theory
MPa, while the Brazilian tensile strength is over 6 MPa. The rock is a very pure limestone, stratified in banks, with good strength characteristics and, therefore, a value of 3.9 it is assumed as the ratio between compressive and dynamic tensile strength. The layering implies an anisot-ropic behaviour of the rock-mass and for this reason it was decided to assign an average value of dynamic tensile strength of about 29 MPa. The uniaxial compressive strength is one of the parameters needed to assess RMR (Rock Mass Rating) and hence the site quality constant KS. For the site under consideration, a RMR= 69 parallely to the layers and RMR= 81 perpendicu-larly were found, and thus the KS values can be fixed as 0.81 and 0.69 respectively.
The density of the intact rock is 2.7 kg/dm3, while the rock-mass shows an average value of 2.65 kg/dm3. The in-situ compression waves speed perpendicularly to the layers is 5,800 m/s and a higher value, i.e. the seismic velocity in the intact rock (about 6,300 m/s) is fixed parallely to the stratification.
PPP refers to the vector sum of the three orthogonal components of the particle velocity. The level of vibration varies considerably depending on whether a cylindrical or a spherical charge is considered; in the first case, the following formula was found:
strength and the tensile strength determined with the Brazilian test, instead, varies between a
minimum of 1.6 and a maximum of 9.3.
The results of a series of uniaxial and triaxial compressive tests on samples obtained from
core surveys carried out at the quarry show that the value of uniaxial compressive strength is
141 MPa, while the Brazilian tensile strength is over 6 MPa. The rock is a very pure
limestone, stratified in banks, with good strength characteristics and, therefore, a value of 3.9
it is assumed as the ratio between compressive and dynamic tensile strength. The layering
implies an anisotropic behaviour of the rock-mass and for this reason it was decided to assign
an average value of dynamic tensile strength of about 29 MPa. The uniaxial compressive
strength is one of the parameters needed to assess RMR (Rock Mass Rating) and hence the
site quality constant KS. For the site under consideration, a RMR= 69 parallely to the layers
and RMR= 81 perpendicularly were found, and thus the KS values can be fixed as 0.81 and
0.69 respectively.
The density of the intact rock is 2.7 kg/dm3, while the rock-mass shows an average value of
2.65 kg/dm3. The in-situ compression waves speed perpendicularly to the layers is 5,800 m/s
and a higher value, i.e. the seismic velocity in the intact rock (about 6,300 m/s) is fixed
parallely to the stratification.
PPP refers to the vector sum of the three orthogonal components of the particle velocity. The
level of vibration varies considerably depending on whether a cylindrical or a spherical charge
is considered; in the first case, the following formula was found:
m
W
RKV
=
2/1[2]
and, in the second:
m
W
RKV
=
3/1[3]
in which: V=vector sum of the three components of peak particle velocity, expressed in
(mm/s); W=mass of the charge (kg); K, m=constants depending on the site; R=the distance
between the charge and the measuring point (m).
and, in the second:
strength and the tensile strength determined with the Brazilian test, instead, varies between a
minimum of 1.6 and a maximum of 9.3.
The results of a series of uniaxial and triaxial compressive tests on samples obtained from
core surveys carried out at the quarry show that the value of uniaxial compressive strength is
141 MPa, while the Brazilian tensile strength is over 6 MPa. The rock is a very pure
limestone, stratified in banks, with good strength characteristics and, therefore, a value of 3.9
it is assumed as the ratio between compressive and dynamic tensile strength. The layering
implies an anisotropic behaviour of the rock-mass and for this reason it was decided to assign
an average value of dynamic tensile strength of about 29 MPa. The uniaxial compressive
strength is one of the parameters needed to assess RMR (Rock Mass Rating) and hence the
site quality constant KS. For the site under consideration, a RMR= 69 parallely to the layers
and RMR= 81 perpendicularly were found, and thus the KS values can be fixed as 0.81 and
0.69 respectively.
The density of the intact rock is 2.7 kg/dm3, while the rock-mass shows an average value of
2.65 kg/dm3. The in-situ compression waves speed perpendicularly to the layers is 5,800 m/s
and a higher value, i.e. the seismic velocity in the intact rock (about 6,300 m/s) is fixed
parallely to the stratification.
PPP refers to the vector sum of the three orthogonal components of the particle velocity. The
level of vibration varies considerably depending on whether a cylindrical or a spherical charge
is considered; in the first case, the following formula was found:
m
W
RKV
=
2/1[2]
and, in the second:
m
W
RKV
=
3/1[3]
in which: V=vector sum of the three components of peak particle velocity, expressed in
(mm/s); W=mass of the charge (kg); K, m=constants depending on the site; R=the distance
between the charge and the measuring point (m).
in which: V=vector sum of the three components of peak particle velocity, expressed in (mm/s); W=mass of the charge (kg); K, m=constants depending on the site; R=the distance between the charge and the measuring point (m).
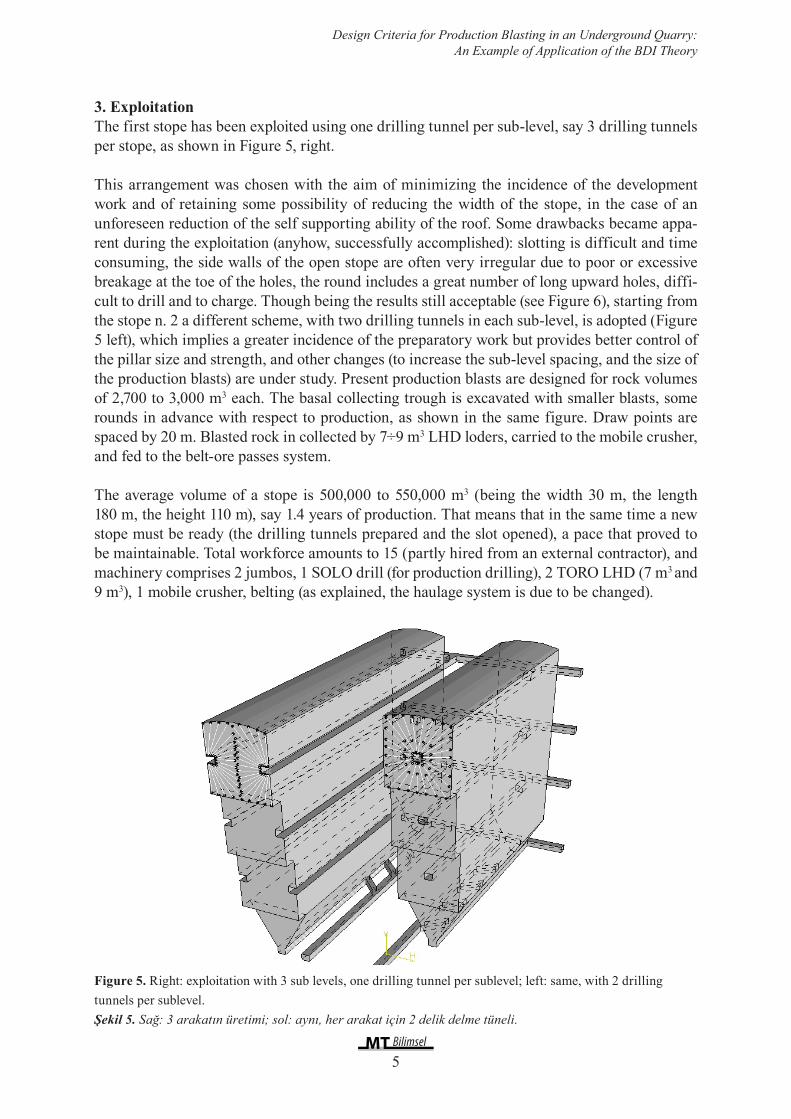
In the following, the values of ppv as a function of scaled distance will be examined, obtained using both the square root and the cubic root of the charge in kg, while the charge will still be considered as concentrated in the barycentre and, accordingly, the distances expressed in m will be those between the barycentre and the point of measurement and the mass of the charge will be the charge per delay. The data examined are related to 62 production blasts. As for the site under study, the layered stratification of limestone affects the behaviour of rock-mass: it can be noticed, in fact, a different arrangement of data collected parallely and perpendicularly to the layers; an example is shown in Figure 7. With regard to the analysis that takes into account the square root, the following formulas were found, respectively considering the parallel (Eq. 4) and perpendicular (Eq. 5) direction:
In the following, the values of ppv as a function of scaled distance will be examined, obtained
using both the square root and the cubic root of the charge in kg, while the charge will still be
considered as concentrated in the barycentre and, accordingly, the distances expressed in m
will be those between the barycentre and the point of measurement and the mass of the charge
will be the charge per delay. The data examined are related to 62 production blasts. As for the
site under study, the layered stratification of limestone affects the behaviour of rock-mass: it
can be noticed, in fact, a different arrangement of data collected parallely and perpendicularly
to the layers; an example is shown in Figure 7. With regard to the analysis that takes into
account the square root, the following formulas were found, respectively considering the
parallel (Eq. 4) and perpendicular (Eq. 5) direction:
702.0
2/12.116
−
=W
Rppv [4]
416.2
2/18.448
−
=W
Rppv [5]
Figure 7. ppv –scaled distance calculated through the cubic root of the charge (data refer to the two directions:
parallel – blue line - and perpendicular –red line - to the layers).
Şekil 7. ppv –şarjın küp kökü üzerinden hesaplanan ölçekli mesafe (veri iki boyutu işaret etmektedir: paralel –
mavi çizgi – ve dik doğrultu – kırmızı çizgi - katmanlar).

88
Cardu and Oreste
Figure 7. ppv - scaled distance calculated through the cubic root of the charge (data refer to the two directions: parallel - blue line - and perpendicular - red line - to the layers).Şekil 7. ppv - şarjın küp kökü üzerinden hesaplanan ölçekli mesafe (veri iki boyutu işaret etmektedir: paralel - mavi çizgi - ve dik doğrultu - kırmızı çizgi - katmanlar).
If the analysis is performed using the cubic root of the charge, the following results were obtai-ned, with coefficients and exponents higher than in the previous case, respectively considering the parallel (Eq. 6) and perpendicular (Eq. 7) direction:
If the analysis is performed using the cubic root of the charge, the following results were
obtained, with coefficients and exponents higher than in the previous case, respectively
considering the parallel (Eq. 6) and perpendicular (Eq. 7) direction:
815.0
3/17.232
−
=W
Rppv [6]
916.2
3/12.4505
−
=W
Rppv [7]
The interpolation of the data must be corrected in order to obtain a ppv-DS law that is valid
and cautionary in most cases: analysis was performed which allowed to find, fixed the
exponent m, the coefficient K by which the curve would encompass 90% of the values. It was
set a confidence interval of 90%, taking the risk that the 10% of the pairs of values ppv-DS
could be above the straight line that represents the maximum value of the range.
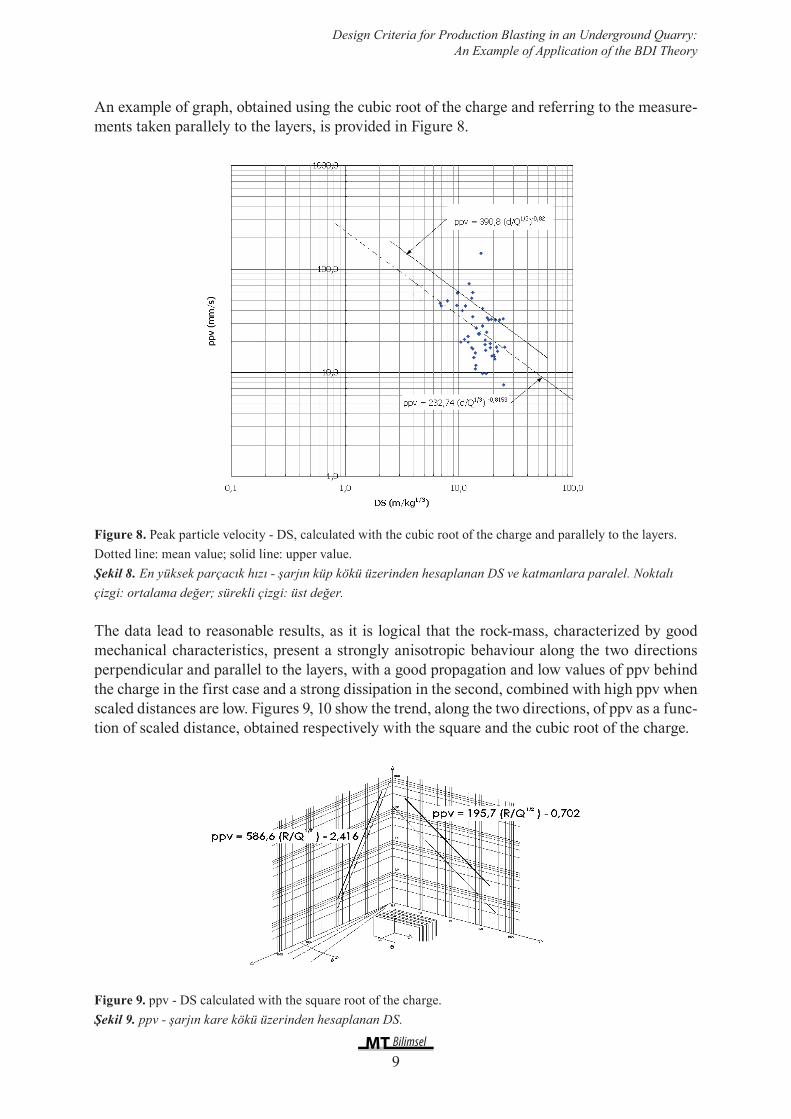
An example of graph, obtained using the cubic root of the charge and referring to the
measurements taken parallely to the layers, is provided in Figure 8.
Figure 8. Peak particle velocity - DS, calculated with the cubic root of the charge and parallely to the layers.
Dotted line: mean value; solid line: upper value.
Şekil 8. En yüksek parçacık hızı - şarjın küp kökü üzerinden hesaplanan DS ve katmanlara paralel. Noktalı çizgi:
ortalama değer; sürekli çizgi: üst değer.
The data lead to reasonable results, as it is logical that the rock-mass, characterized by good
mechanical characteristics, present a strongly anisotropic behaviour along the two directions
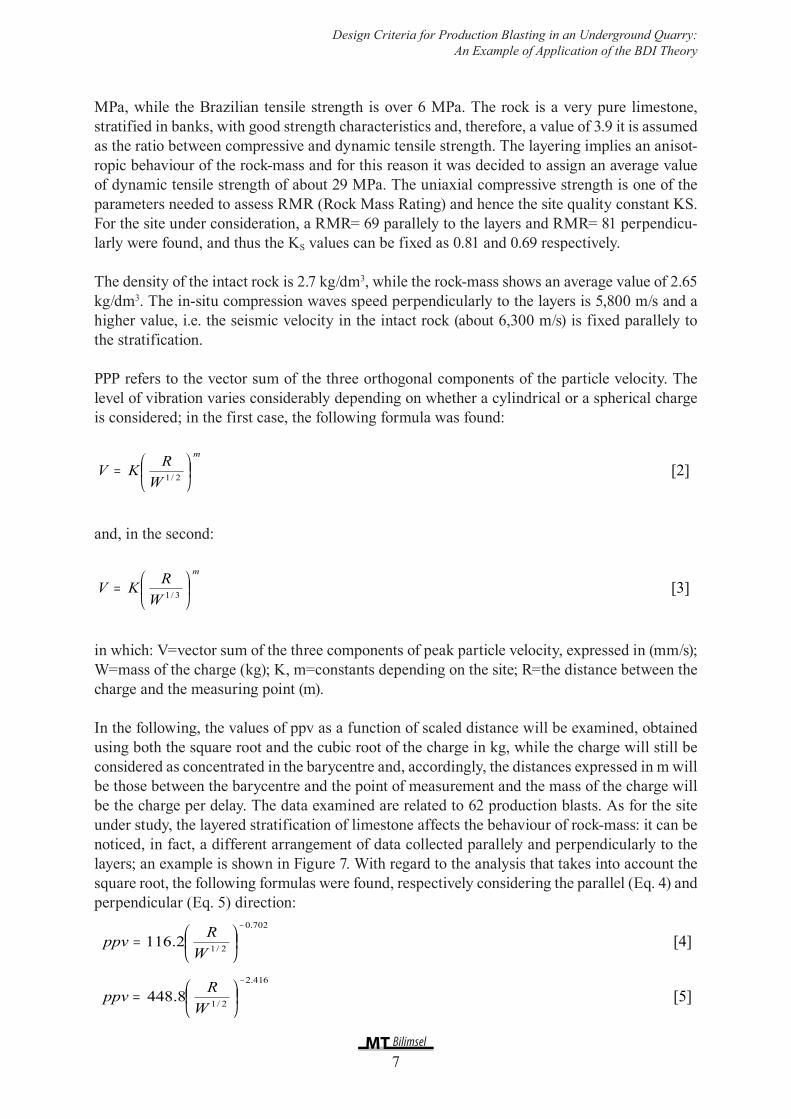
The interpolation of the data must be corrected in order to obtain a ppv-DS law that is valid and cautionary in most cases: analysis was performed which allowed to find, fixed the exponent m, the coefficient K by which the curve would encompass 90% of the values. It was set a confi-dence interval of 90%, taking the risk that the 10% of the pairs of values ppv-DS could be above the straight line that represents the maximum value of the range.
9
Design Criteria for Production Blasting in an Underground Quarry: An Example of Application of the BDI Theory
An example of graph, obtained using the cubic root of the charge and referring to the measure-ments taken parallely to the layers, is provided in Figure 8.
Figure 8. Peak particle velocity - DS, calculated with the cubic root of the charge and parallely to the layers. Dotted line: mean value; solid line: upper value.Şekil 8. En yüksek parçacık hızı - şarjın küp kökü üzerinden hesaplanan DS ve katmanlara paralel. Noktalı çizgi: ortalama değer; sürekli çizgi: üst değer.
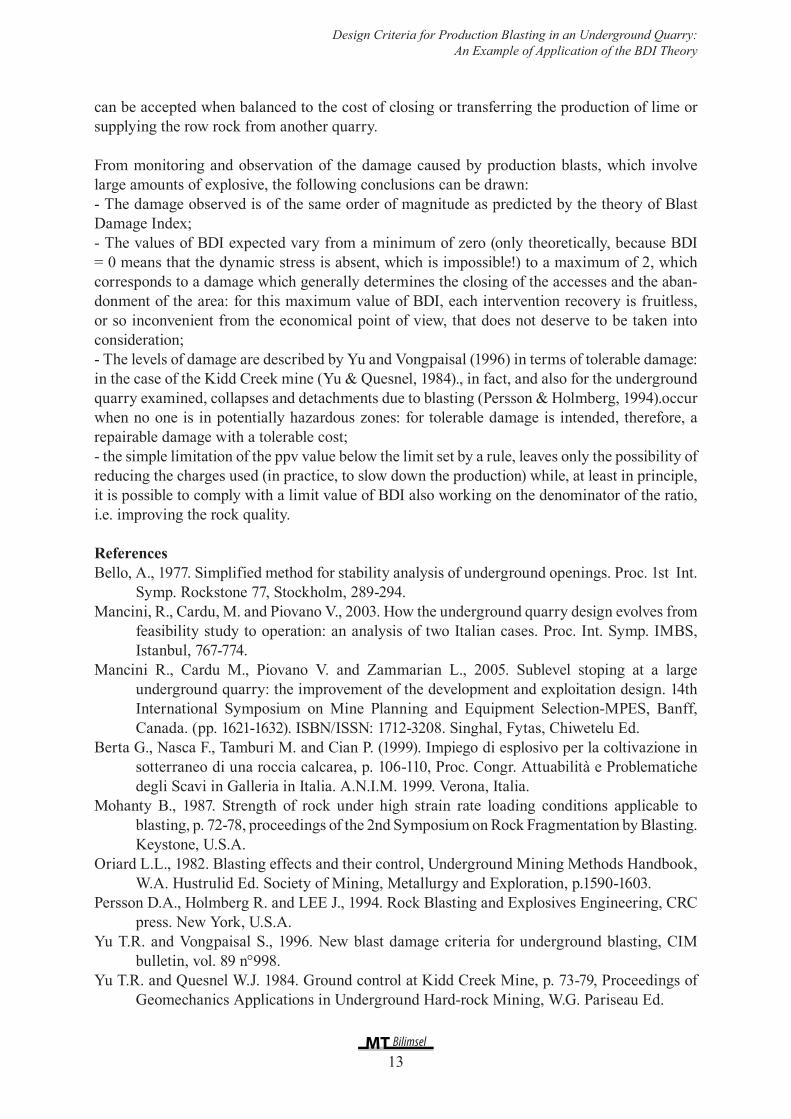
The data lead to reasonable results, as it is logical that the rock-mass, characterized by good mechanical characteristics, present a strongly anisotropic behaviour along the two directions perpendicular and parallel to the layers, with a good propagation and low values of ppv behind the charge in the first case and a strong dissipation in the second, combined with high ppv when scaled distances are low. Figures 9, 10 show the trend, along the two directions, of ppv as a func-tion of scaled distance, obtained respectively with the square and the cubic root of the charge.
Figure 9. ppv - DS calculated with the square root of the charge.Şekil 9. ppv - şarjın kare kökü üzerinden hesaplanan DS.

1010
Cardu and Oreste
Figure 10. ppv - DS calculated with the cubic root of the charge.Şekil 10. ppv - şarjın kare kökü üzerinden hesaplanan DS.
4.1 Determination of BDIFor each of the solutions is taken into account the behaviour of the rock along the two perpen-dicular directions, so as to ensure a good representation of the rock mass, which is anisotropic; there are no tunnels or underground voids that are not perpendicular or parallel to the stratifica-tion, then is not considered the behaviour of the rock-mass along intermediate directions: thus, for the assessment of damage, an area along one of the tunnels that is closest to the blast can be still be found, to assess the effects of damage to the structure.
With regard to one of the infinite directions parallel to the layering, which can be either vertical or horizontal, the following values have been assumed: rock density d: 2, 670 kg/m3; speed of compression waves c: 5,700 m/s; dynamic tensile strength T: 25 MPa; site quality constant KS: 0.69.
With regard to the direction perpendicular to the layering, the following values were assumed: rock density d: 2,670 kg/m3; speed of compression waves c: 6,300 m/s; dynamic tensile strength T: 36 MPa; site quality constant KS: 0.81.
It is therefore possible to express the relationship between BDI and ppv as linear, with only one constant which encloses all the fixed values: the strong differences in the behaviour of the rock led to investigate a law which varies with the direction considered: it is therefore determined a constant for the parallel direction and a constant for the perpendicular direction, according to the following expressions:
With regard to one of the infinite directions parallel to the layering, which can be either
vertical or horizontal, the following values have been assumed: rock density d: 2,670 kg/m3;
speed of compression waves c: 5,700 m/s; dynamic tensile strength T: 25 MPa; site quality
constant KS: 0.69.
With regard to the direction perpendicular to the layering, the following values were assumed:
rock density d: 2,670 kg/m3; speed of compression waves c: 6,300 m/s; dynamic tensile
strength T: 36 MPa; site quality constant KS: 0.81.
It is therefore possible to express the relationship between BDI and ppv as linear, with only
one constant which encloses all the fixed values: the strong differences in the behaviour of the
rock led to investigate a law which varies with the direction considered: it is therefore
determined a constant for the parallel direction and a constant for the perpendicular direction,
according to the following expressions:
ppvppv
BDI par 882.01069.025
570026706
=
⋅⋅⋅⋅= [8]
ppvppv
BDIperp
577.01081.036
630026706
=
⋅⋅⋅⋅= [9]
At this point, by imposing the maximum BDI which is thought to be achieved respecting the
structures, a limit to the peak particle velocity can be established and therefore, being
available the relations ppv-DS, a couple minimum distance/maximum charge not to be
exceeded can be found.
This pair of values is uniquely identified by a value of DS, scaled distance: by increasing the
load, the scaled distance decreases in reason of the square root of the charge, then the limit is
constituted by a value of maximum charge, whereas the decrease of the actual distance
implies that the DS also decreases, then a limit value for the distance is constituted by a
minimum below which we should not go down.
The relationships (for the directions perpendicular and parallel to the layers) that link the BDI
to ppv are represented in the graph of Figure 11.
At this point, by imposing the maximum BDI which is thought to be achieved respecting the structures, a limit to the peak particle velocity can be established and therefore, being available the relations ppv-DS, a couple minimum distance/maximum charge not to be exceeded can be found.

11
Design Criteria for Production Blasting in an Underground Quarry: An Example of Application of the BDI Theory
This pair of values is uniquely identified by a value of DS, scaled distance: by increasing the load, the scaled distance decreases in reason of the square root of the charge, then the limit is constituted by a value of maximum charge, whereas the decrease of the actual distance implies that the DS also decreases, then a limit value for the distance is constituted by a minimum below which we should not go down.
The relationships (for the directions perpendicular and parallel to the layers) that link the BDI to ppv are represented in the graph of Figure 11.
Figure 11. Correlation between BDI and ppv in the direction perpendicular (BDI = 0.882 ppv) and parallel (BDI = 0.577 ppv) to the layers.Şekil 11. Dik doğrultu yönündeki BDI ve ppv arasındaki korelasyon (BDI = 0.882 ppv) ve katmanlara paralel yöndeki (BDI = 0.577 ppv).
In the case examined, for which a BDI threshold of 0.250 was proposed, the ppv max in the two directions being known, the scaled distances can be evaluated (Table 2).
Figures 12 and 13 provide an example of the relationship between distance and charge per delay, with BDI = 0.250, having adopted a scaled distance respectively calculated with the square and the cubic root of the charge.
These graphs can be used to calculate, known the maximum charge per delay, the minimum distance from the charge to be observed, or, once the distance is known, to determine the maxi-mum charge per delay that can be used in a given blast.

1212
Cardu and Oreste
DS Dir. BDI (-) ppv (mm/s) DS (m/kg1/2)Par. 0.250 350 0.287Perp. 0.250 260 1.201
DS Dir. BDI (-) ppv (mm/s) DS (m/kg1/2)Par. 0.250 350 0.870Perp. 0.250 260 2.699
Figure 11. Correlation between BDI and ppv in the direction perpendicular (BDI = 0.882 ppv) and parallel
(BDI = 0.577 ppv) to the layers.
Şekil 11. Dik doğrultu yönündeki BDI ve ppv arasındaki korelasyon (BDI = 0.882 ppv) ve katmanlara paralel
yöndeki (BDI = 0.577 ppv).
In the case examined, for which a BDI threshold of 0.250 was proposed, the ppv max in the
two directions being known, the scaled distances can be evaluated (Table 2).
Figures 12 and 13 provide an example of the relationship between distance and charge per
delay, with BDI = 0.250, having adopted a scaled distance respectively calculated with the
square and the cubic root of the charge.
These graphs can be used to calculate, known the maximum charge per delay, the minimum
distance from the charge to be observed, or, once the distance is known, to determine the
maximum charge per delay that can be used in a given blast.
Table 2. Maximum values of DS obtained.
Çizelge 2. DS’den elde edilen en yüksek değerler.
DS Dir. BDI (-) ppv (mm/s) DS (m/kg1/2)2 Par. 0.250 350 0.287
Perp. 0.250 260 1.201
DS Dir. BDI (-) ppv (mm/s) DS (m/kg1/2)3 Par. 0.250 350 0.870
Perp. 0.250 260 2.699
Table 2. Maximum values of DS obtained.Çizelge 2. DS’den elde edilen en yüksek değerler.
Figure 12. Representation of R (distance, m) v/ W (charge, kg) when the scaled distance is calculated with the square root of the charge.Şekil 12. Ölçekli mesafe şarjın kare kökü ile hesaplandığında R’nin gösterimi (mesafe, m) v/ W (şarj, kg).
Figure 13. Representation of R (distance, m) v/ W (charge, kg) when the scaled distance is calculated with the cubic root of the charge.Şekil 13. Ölçekli mesafe şarjın küp kökü ile hesaplandığında R’nin gösterimi (mesafe, m) v/ W (şarj, kg).
5. ConclusionsThe underground exploitation is not intended to compete with surface exploitation, when both are practicable, due to the higher development costs. In the case, however, the underground exploitation was the only way to avoid the closure of the plant, and the higher costs of the raw rock ton at the kiln, which can be quantified as 100 % more than in previous surface production,
13
Design Criteria for Production Blasting in an Underground Quarry: An Example of Application of the BDI Theory
can be accepted when balanced to the cost of closing or transferring the production of lime or supplying the row rock from another quarry.
From monitoring and observation of the damage caused by production blasts, which involve large amounts of explosive, the following conclusions can be drawn:- The damage observed is of the same order of magnitude as predicted by the theory of Blast Damage Index;- The values of BDI expected vary from a minimum of zero (only theoretically, because BDI = 0 means that the dynamic stress is absent, which is impossible!) to a maximum of 2, which corresponds to a damage which generally determines the closing of the accesses and the aban-donment of the area: for this maximum value of BDI, each intervention recovery is fruitless, or so inconvenient from the economical point of view, that does not deserve to be taken into consideration;- The levels of damage are described by Yu and Vongpaisal (1996) in terms of tolerable damage: in the case of the Kidd Creek mine (Yu & Quesnel, 1984)., in fact, and also for the underground quarry examined, collapses and detachments due to blasting (Persson & Holmberg, 1994).occur when no one is in potentially hazardous zones: for tolerable damage is intended, therefore, a repairable damage with a tolerable cost;- the simple limitation of the ppv value below the limit set by a rule, leaves only the possibility of reducing the charges used (in practice, to slow down the production) while, at least in principle, it is possible to comply with a limit value of BDI also working on the denominator of the ratio, i.e. improving the rock quality.
ReferencesBello, A., 1977. Simplified method for stability analysis of underground openings. Proc. 1st Int.
Symp. Rockstone 77, Stockholm, 289-294.Mancini, R., Cardu, M. and Piovano V., 2003. How the underground quarry design evolves from
feasibility study to operation: an analysis of two Italian cases. Proc. Int. Symp. IMBS, Istanbul, 767-774.
Mancini R., Cardu M., Piovano V. and Zammarian L., 2005. Sublevel stoping at a large underground quarry: the improvement of the development and exploitation design. 14th International Symposium on Mine Planning and Equipment Selection-MPES, Banff, Canada. (pp. 1621-1632). ISBN/ISSN: 1712-3208. Singhal, Fytas, Chiwetelu Ed.
Berta G., Nasca F., Tamburi M. and Cian P. (1999). Impiego di esplosivo per la coltivazione in sotterraneo di una roccia calcarea, p. 106-110, Proc. Congr. Attuabilità e Problematiche degli Scavi in Galleria in Italia. A.N.I.M. 1999. Verona, Italia.
Mohanty B., 1987. Strength of rock under high strain rate loading conditions applicable to blasting, p. 72-78, proceedings of the 2nd Symposium on Rock Fragmentation by Blasting. Keystone, U.S.A.
Oriard L.L., 1982. Blasting effects and their control, Underground Mining Methods Handbook, W.A. Hustrulid Ed. Society of Mining, Metallurgy and Exploration, p.1590-1603.
Persson D.A., Holmberg R. and LEE J., 1994. Rock Blasting and Explosives Engineering, CRC press. New York, U.S.A.
Yu T.R. and Vongpaisal S., 1996. New blast damage criteria for underground blasting, CIM bulletin, vol. 89 n°998.
Yu T.R. and Quesnel W.J. 1984. Ground control at Kidd Creek Mine, p. 73-79, Proceedings of Geomechanics Applications in Underground Hard-rock Mining, W.G. Pariseau Ed.
Related Documents