Welcome message from author
This document is posted to help you gain knowledge. Please leave a comment to let me know what you think about it! Share it to your friends and learn new things together.
Transcript
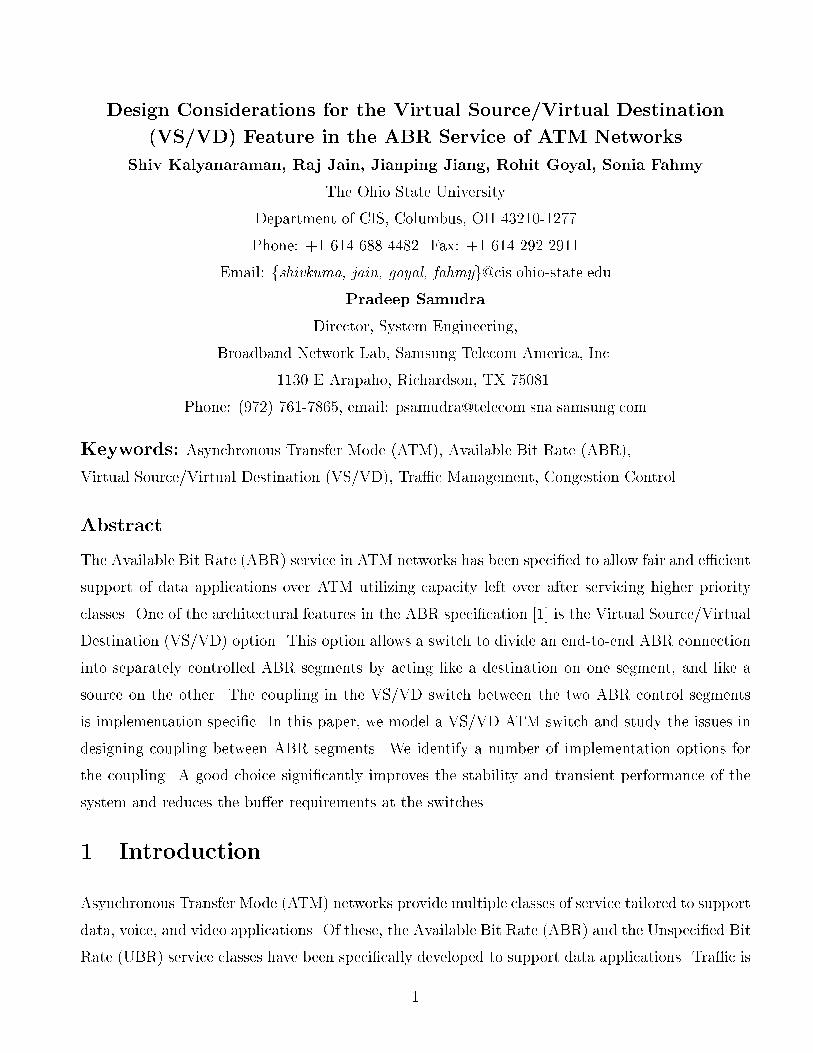
Design Considerations for the Virtual Source/Virtual Destination
(VS/VD) Feature in the ABR Service of ATM Networks
Shiv Kalyanaraman, Raj Jain, Jianping Jiang, Rohit Goyal, Sonia Fahmy
The Ohio State University
Department of CIS, Columbus, OH 43210-1277
Phone: +1 614 688 4482. Fax: +1 614 292 2911
Email: fshivkuma, jain, goyal, [email protected]
Pradeep Samudra
Director, System Engineering,
Broadband Network Lab, Samsung Telecom America, Inc.
1130 E Arapaho, Richardson, TX 75081.
Phone: (972) 761-7865, email: [email protected]
Keywords: Asynchronous Transfer Mode (ATM), Available Bit Rate (ABR),
Virtual Source/Virtual Destination (VS/VD), Tra�c Management, Congestion Control.
Abstract
The Available Bit Rate (ABR) service in ATM networks has been speci�ed to allow fair and e�cient
support of data applications over ATM utilizing capacity left over after servicing higher priority
classes. One of the architectural features in the ABR speci�cation [1] is the Virtual Source/Virtual
Destination (VS/VD) option. This option allows a switch to divide an end-to-end ABR connection
into separately controlled ABR segments by acting like a destination on one segment, and like a
source on the other. The coupling in the VS/VD switch between the two ABR control segments
is implementation speci�c. In this paper, we model a VS/VD ATM switch and study the issues in
designing coupling between ABR segments. We identify a number of implementation options for
the coupling. A good choice signi�cantly improves the stability and transient performance of the
system and reduces the bu�er requirements at the switches.
1 Introduction
Asynchronous Transfer Mode (ATM) networks provide multiple classes of service tailored to support
data, voice, and video applications. Of these, the Available Bit Rate (ABR) and the Unspeci�ed Bit
Rate (UBR) service classes have been speci�cally developed to support data applications. Tra�c is
1
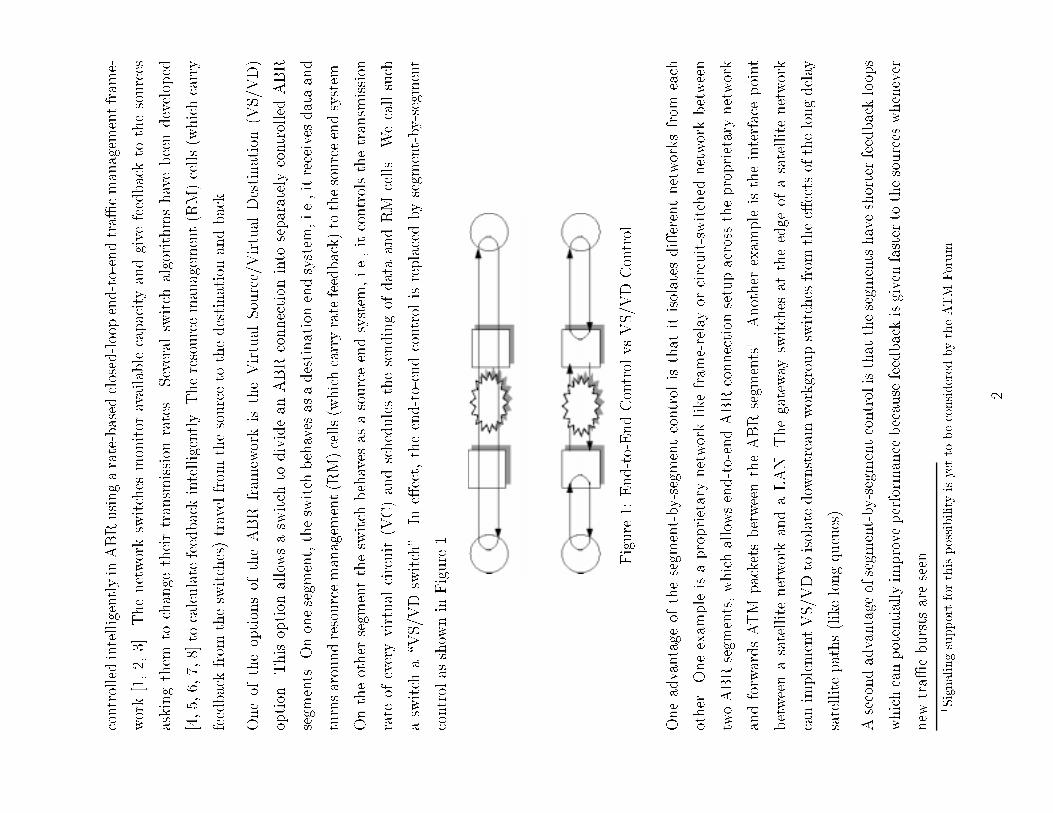
controlledintelligentlyinABRusingarate-based
closed-loop
end-to-endtra�
cmanagem
entfram
e-
work[1,2,
3].Thenetworkswitches
monitor
availablecapacityandgive
feedbackto
thesources
askingthem
tochange
theirtransm
ission
rates.
Several
switch
algorithmshavebeendeveloped
[4,5,6,7,8]to
calculatefeedbackintelligently.Theresourcemanagem
ent(RM)cells(whichcarry
feedbackfrom
theswitches)travelfrom
thesourceto
thedestinationandback.
Oneof
theoptionsof
theABR
fram
eworkis
theVirtual
Source/Virtual
Destination(V
S/V
D)
option.Thisoption
allowsaswitch
todividean
ABRconnection
into
separatelycontrolledABR
segm
ents.Ononesegm
ent,theswitch
behavesas
adestinationendsystem
,i.e.,itreceivesdataand
turnsaroundresourcemanagem
ent(RM)cells(whichcarryratefeedback)to
thesourceendsystem
.
Ontheother
segm
enttheswitch
behaves
asasourceendsystem
,i.e.,itcontrolsthetransm
ission
rate
ofeveryvirtual
circuit(VC)andschedulesthesendingof
dataandRM
cells.
Wecallsuch
aswitch
a\V
S/V
Dswitch".
Ine�ect,theend-to-endcontrol
isreplacedbysegm
ent-by-segment
controlas
show
nin
Figure
1.
Figure
1:End-to-EndControlvsVS/V
DControl
Oneadvantage
ofthesegm
ent-by-segmentcontrol
isthat
itisolates
di�erentnetworksfrom
each
other.Oneexam
pleisaproprietarynetworklike
fram
e-relayor
circuit-switched
networkbetween
twoABRsegm
ents,whichallowsend-to-endABRconnection
setupacrosstheproprietarynetwork
andforwardsATM
packets
betweentheABRsegm
ents
1.Another
exam
pleistheinterfacepoint
betweenasatellitenetworkandaLAN.Thegateway
switches
attheedge
ofasatellitenetwork
canimplementVS/V
Dto
isolatedow
nstream
workgroupswitches
from
thee�ectsofthelongdelay
satellitepaths(likelongqueues).
Asecondadvantage
ofsegm
ent-by-segmentcontrolisthat
thesegm
entshaveshorterfeedbackloops
whichcanpotentiallyimprove
perform
ance
becausefeedbackisgivenfasterto
thesourceswhenever
new
tra�
cburstsareseen.
1SignalingsupportforthispossibilityisyettobeconsideredbytheATM
Forum
2
The VS/VD option requires the implementation of per-VC queueing and scheduling at the switch. In
addition to per-VC queueing and scheduling, there is an incremental cost to enforce the (dynamically
changing) rates of VCs, and to implement the logic for the source and destination end system rules
as prescribed by the ATM Forum [1].
The goal of this study is �nd answers to the following questions:
� Do VS/VD switches really improve ABR performance?
� What changes to switch algorithms are required to operate in VS/VD environments?
� Are there any side-e�ects of having multiple control loops in series?
In this paper, we model and study VS/VD switches using the ERICA switch algorithm [8] to
calculate rate feedback. We describe our switch model and the use of the ERICA algorithm in
sections 2 and 3. The VS/VD design options are listed and evaluated in sections 4 and 5. The
results and future work are summarized in sections 7 and 8.
2 Switch Queue Structure
In this section, we �rst present a simple switch queue model for the non-VS/VD switch and later
extend it to a VS/VD switch by introducing per-VC queues. The ow of data, forward RM (FRM)
and backward RM (BRM) cells is also closely examined.
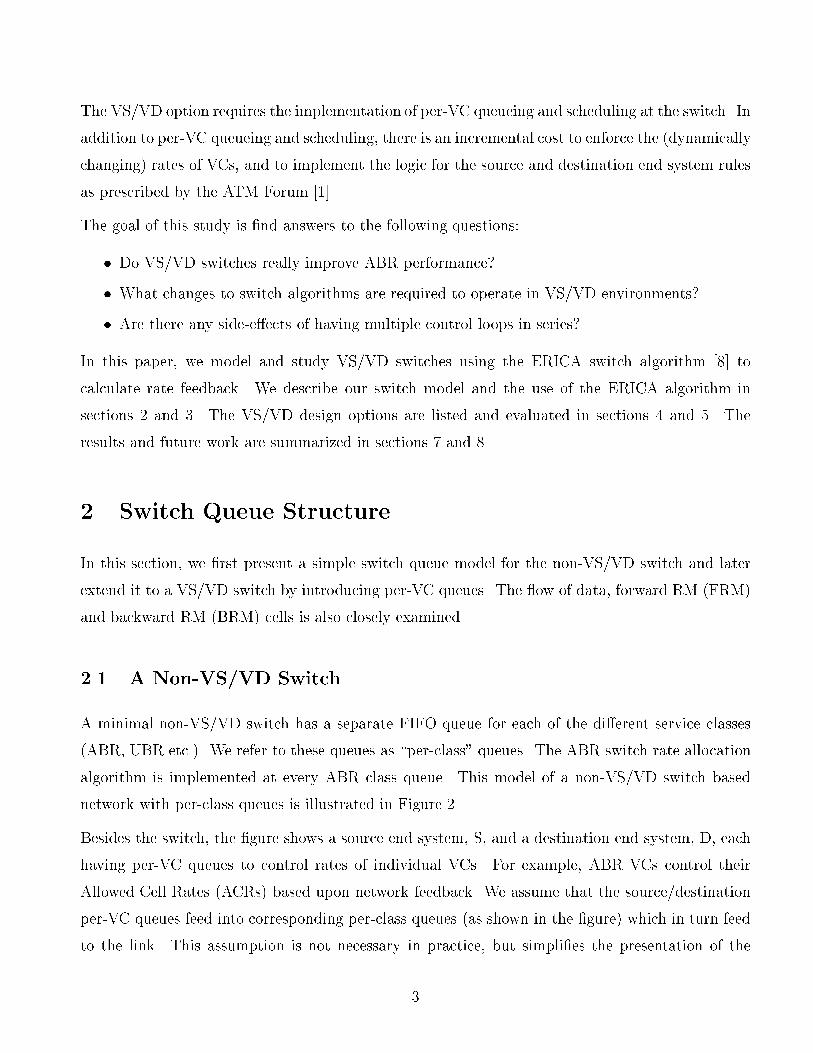
2.1 A Non-VS/VD Switch
A minimal non-VS/VD switch has a separate FIFO queue for each of the di�erent service classes
(ABR, UBR etc.). We refer to these queues as \per-class" queues. The ABR switch rate allocation
algorithm is implemented at every ABR class queue. This model of a non-VS/VD switch based
network with per-class queues is illustrated in Figure 2.
Besides the switch, the �gure shows a source end system, S, and a destination end system, D, each
having per-VC queues to control rates of individual VCs. For example, ABR VCs control their
Allowed Cell Rates (ACRs) based upon network feedback. We assume that the source/destination
per-VC queues feed into corresponding per-class queues (as shown in the �gure) which in turn feed
to the link. This assumption is not necessary in practice, but simpli�es the presentation of the
3
Figure
2:Per-classqueues
inanon-VSVDswitch
model.Thecontention
forlinkaccess
betweencellsfrom
di�erentper-classqueues
(attheswitch,
thesourceandthedestination)isresolved
through
appropriatescheduling.
2.2
AVS/VD
Switch
TheVS/V
Dswitch
implementsthesourceandthedestinationendsystem
functionalityinaddition
tothenormalswitch
functionality.Therefore,like
anysourceanddestinationend-system
,itrequires
per-VC
queues
tocontrol
theratesof
individual
VCs.
Theswitch
queuestructure
isnow
more
similar
tothesource/destinationstructure
wherewehaveper-VCqueues
feedinginto
theper-class
queues
beforeeach
link.Thisswitch
queuestructure
andaunidirectional
VCoperatingon
itis
show
nin
Figure
3.
TheVS/V
Dswitch
has
twoparts.Thepartknow
nas
theVirtualDestination(V
D)forwardsthe
datacellsfrom
the�rstsegm
ent(\previousloop")
totheper-VCqueueat
theVirtualSource(V
S)
ofthesecondsegm
ent(\nextloop").Theother
partor
theVirtualSource(ofthesecondsegm
ent)
sendsoutthedatacellsandgenerates
FRM
cellsas
specifed
inthesourceendsystem
rules.
Figure
3:Per-VCandper-classqueues
inaVSVDswitch
Theswitch
also
needsto
implementtheswitch
congestioncontrol
algorithm
andcalculate
the
allocationsforVCsdependingupon
itsbottleneckrate.Aquestion
whicharises
iswheretherate
4
calculationsaredoneandhow
thefeedbackisgivento
thesources.Wepostponethediscussionof
thisquestion
tolatersections.
2.3
AVS/VD
Switch
withUnidirectionalData
Flow
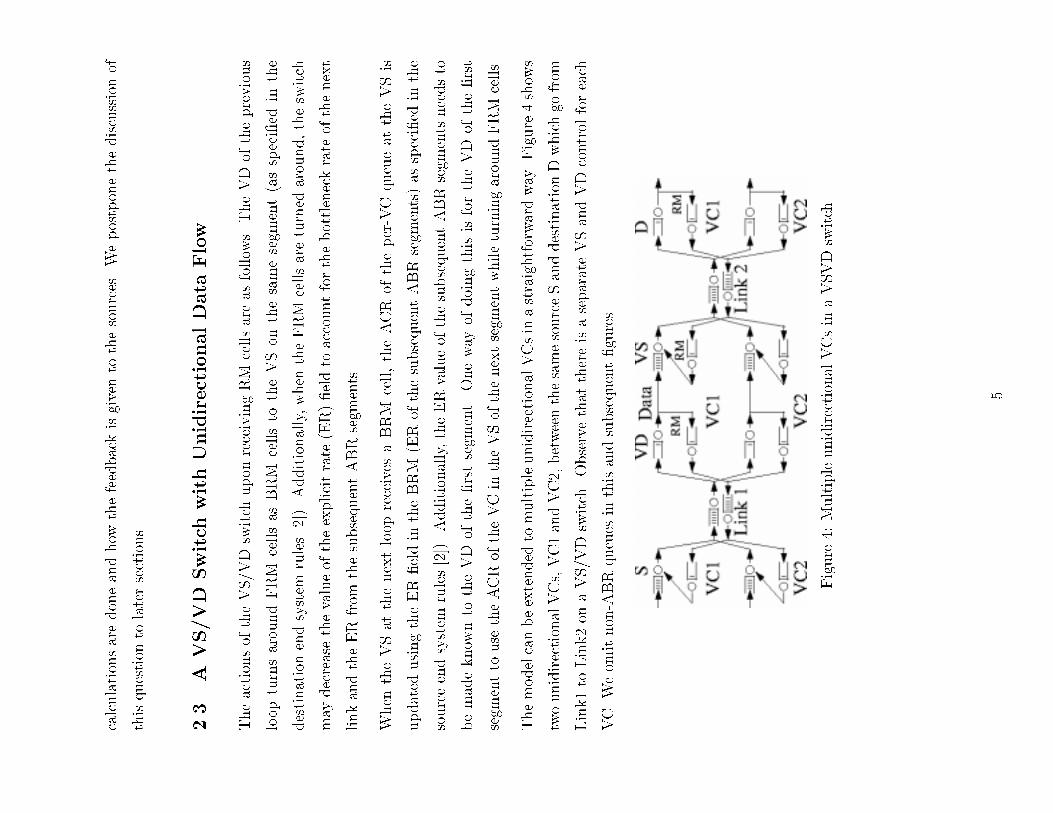
Theactionsof
theVS/V
Dswitch
upon
receivingRM
cellsareas
follow
s.TheVDof
theprevious
loop
turnsaroundFRM
cellsas
BRM
cellsto
theVSon
thesamesegm
ent(asspeci�ed
inthe
destinationendsystem
rules[2]).Additionally,when
theFRM
cellsareturned
around,theswitch
may
decreasethevalueoftheexplicitrate
(ER)�eldto
accountforthebottleneckrate
ofthenext
linkandtheERfrom
thesubsequentABRsegm
ents.
When
theVSat
thenextloop
receives
aBRM
cell,theACR
oftheper-VCqueueat
theVSis
updated
usingtheER�eldin
theBRM
(ERof
thesubsequentABRsegm
ents)as
speci�ed
inthe
sourceendsystem
rules[2]).Additionally,theERvalueofthesubsequentABRsegm
entsneedsto
bemadeknow
nto
theVD
ofthe�rstsegm
ent.
Oneway
ofdoingthisisfortheVD
ofthe�rst
segm
entto
use
theACRoftheVCin
theVSofthenextsegm
entwhileturningaroundFRM
cells.
Themodelcanbeextended
tomultipleunidirectionalVCsinastraightforwardway.Figure4show
s
twounidirectionalVCs,VC1andVC2,betweenthesamesourceSanddestinationDwhichgo
from
Link1to
Link2on
aVS/V
Dswitch.Observethat
thereisaseparateVSandVDcontrol
foreach
VC.Weom
itnon-ABRqueues
inthisandsubsequent�gures.
Figure
4:MultipleunidirectionalVCsin
aVSVDswitch
5
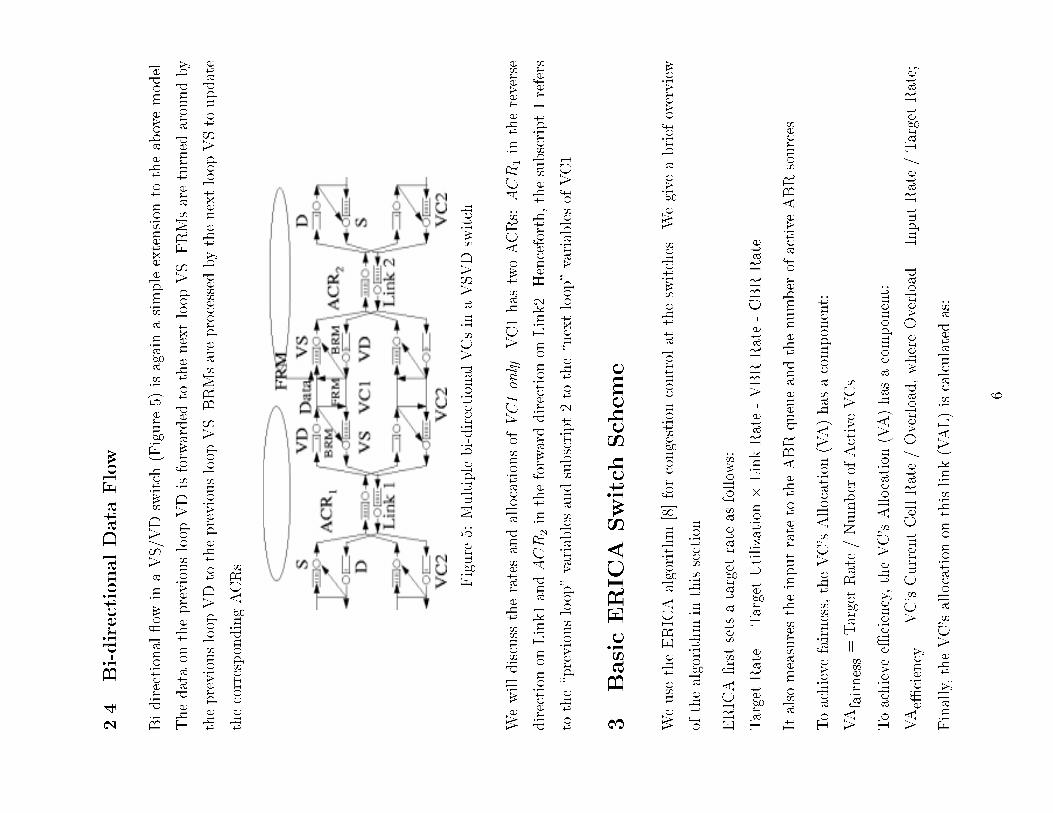
2.4
Bi-directionalData
Flow
Bi-directional ow
inaVS/V
Dswitch
(Figure
5)isagainasimpleextension
totheabovemodel.
Thedataon
thepreviousloop
VDisforwarded
tothenextloop
VS.FRMsareturned
aroundby
thepreviousloop
VDto
thepreviousloop
VS.BRMsareprocessed
bythenextloop
VSto
update
thecorrespondingACRs.
Figure
5:Multiplebi-directionalVCsin
aVSVDswitch
Wewilldiscuss
theratesandallocationsof
VC1only.VC1has
twoACRs:ACR
1in
thereverse
direction
onLink1andACR
2in
theforwarddirection
onLink2.
Henceforth,thesubscript1refers
tothe\previousloop"variablesandsubscript2to
the\nextloop"variablesof
VC1.
3BasicERICASwitchScheme
Weuse
theERICAalgorithm
[8]forcongestioncontrol
attheswitches.Wegive
abriefoverview
ofthealgorithm
inthissection.
ERICA�rstsetsatarget
rate
asfollow
s:
TargetRate=TargetUtilization
�LinkRate-VBRRate-CBRRate
Italso
measurestheinputrate
totheABRqueueandthenumber
ofactive
ABRsources.
Toachieve
fairness,theVC'sAllocation
(VA)has
acomponent:
VAfairness=TargetRate/Number
ofActiveVCs
Toachieve
e�ciency,theVC'sAllocation
(VA)has
acomponent:
VAe�
ciency
=VC'sCurrentCellRate/Overload,whereOverload=InputRate/TargetRate;
Finally,theVC'sallocation
onthislink(VAL)iscalculatedas:
6
VAL=MaxfVAe�
ciency,VAfairnessg=FunctionfInputRate,VC'scurrentrateg
Notethat
thefullERICA
algorithm
containsseveralenhancements
whichaccountforfairness,
queueingdelays,andwhichhandleshighlyvariantbursty
(ON-OFF)tra�
ce�
ciently.
Acomplete
description
ofthealgorithm
isprovided
inreference
[8].Wenow
describewheretheERICA
rate
calculationsaredonein
anon-VS/V
Dswitch
andin
aVS/V
Dswitch.
3.1
Rate
Calculationsin
anon-V
S/VD
Switch
Thenon-VS/V
Dswitch
calculatestherate
(VAL)forsources
when
theBRMsareprocessed
inthe
reversedirection
andentersitin
theBRM
�eldas
follow
s:
ERin
BRM
=MinfERin
BRM,VALg
Atthesourceendsystem
,theACRisupdated
as:
ACR=FunctionfER,VC'scurrentACRg
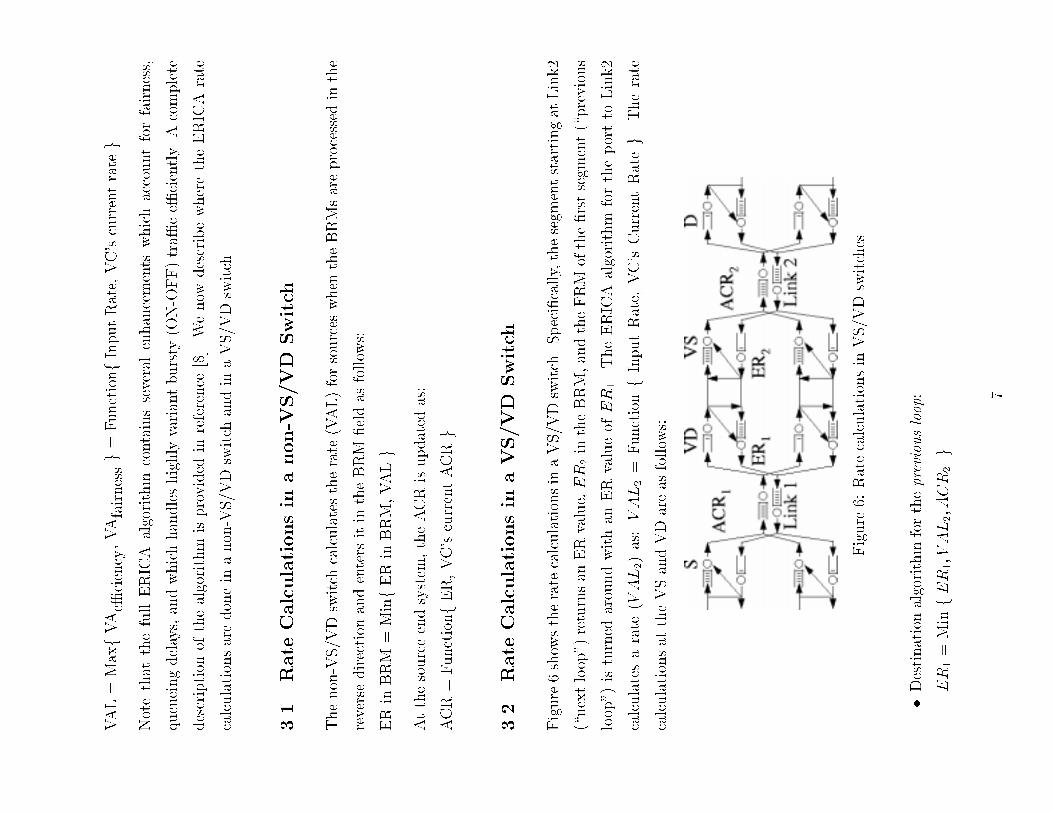
3.2
Rate
Calculationsin
aVS/VD
Switch
Figure6show
stheratecalculationsinaVS/V
Dswitch.Speci�cally,thesegm
entstartingat
Link2
(\nextloop")
returnsan
ERvalue,ER
2in
theBRM,andtheFRM
ofthe�rstsegm
ent(\previous
loop")
isturned
aroundwithan
ERvalueofER
1.TheERICA
algorithm
fortheportto
Link2
calculatesarate
(VAL2)as:VAL2=
FunctionfInputRate,
VC'sCurrentRateg.Therate
calculationsat
theVSandVDareas
follow
s:
Figure
6:Ratecalculationsin
VS/V
Dswitches
�Destinationalgorithm
forthepreviousloop:
ER
1=MinfER
1;VAL2;ACR
2g
7
�SourceAlgorithm
forthenextloop:
Optionally,ER
2=MinfER
2;VAL2g
ACR
2=FnfER
2;ACR
2g
Theunknow
nsin
theaboveequationsaretheinputrate
andtheVC'scurrentrate.Weshallseein
thenextsectionthat
thereareseveralwaysof
measuringVCratesandinputrates,combiningthe
feedbackfrom
thenextloop,andupdatingtheACRof
thenextloop.Notethat
though
di�erent
switches
may
implementdi�erentalgorithms,manymeasure
quantities
such
astheVC'scurrent
rate
andtheABRinputrate.
4VS/VDSwitchDesignOptions
Inthissection,weaim
atansweringthefollow
ingquestions:
�What
isaVC'scurrentrate?(4
options)
�What
istheinputrate?(2
options)
�Does
thecongestioncontrol
actionsat
alinka�ectthenextloop
orthepreviousloop?(3
options)
�When
istheVC'sallocation
atthelink(VAL)calculated?(3
options)
Wewillenumeratethe72
(=4�2�3�3)
option
combinationsandthen
studythisstatespace
forthebestcombination.
4.1
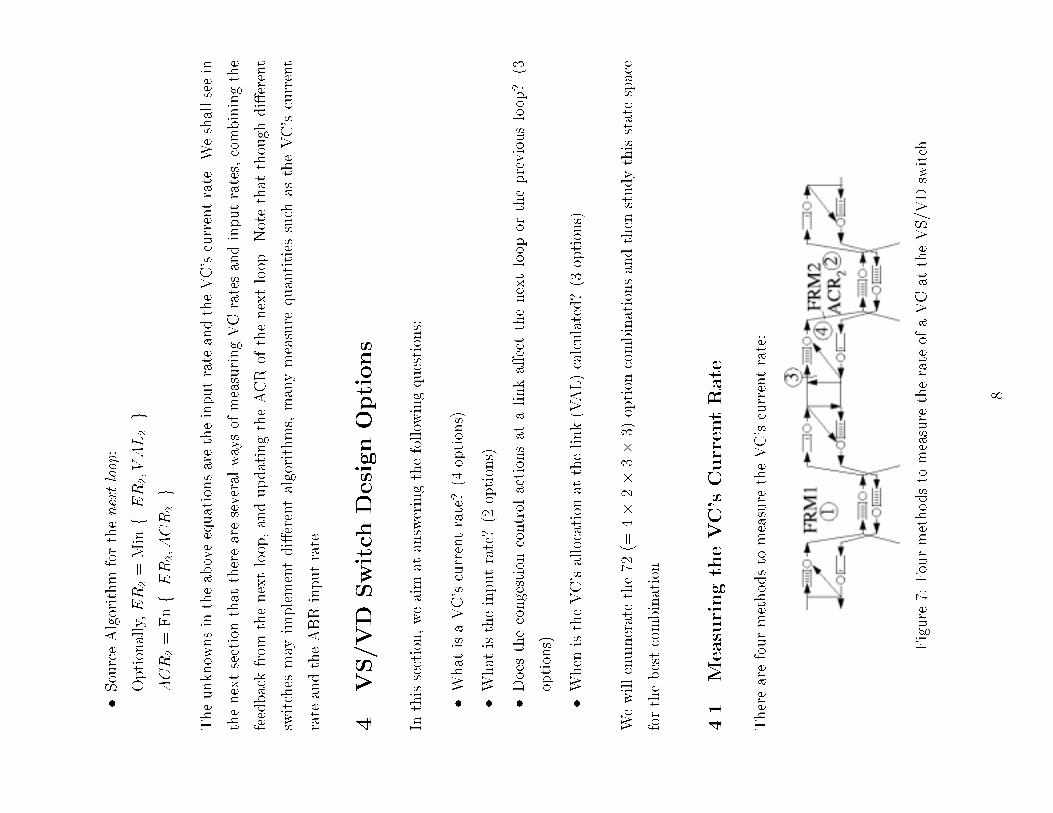
MeasuringtheVC'sCurrentRate
Therearefourmethodsto
measure
theVC'scurrentrate:
Figure
7:Fourmethodsto
measure
therate
ofaVCat
theVS/V
Dswitch
8
1.Therate
oftheVCisdeclaredbythesourceendsystem
ofthepreviousloop
intheCurrent
CellRate(CCR)�eldof
theFRM
cell(FRM1)
received
bytheVD.Thisdeclaredvaluecan
beusedas
theVC'srate.
2.TheVSto
thenextloop
declarestheCCR
valueof
theFRM
sent(FRM2)
tobeitsACR
(ACR
2).Thisdeclaredvaluecanbeusedas
theVC'srate.
3.Theactual
sourcerate
inthepreviousloopcanbemeasured.Thisrate
isequal
totheVC's
inputrate
totheper-VCqueue.
Thismeasuredsourcerate
canbeusedas
theVC'srate.
4.Theactualsourcerateinthenextloopcanbemeasuredas
theVC'sinputrateto
theper-class
queue(from
theper-VCqueue).Thismeasuredvaluecanbeusedas
theVC'srate.
Figure
7illustrateswhereeach
methodisapplied
(notethepositionof
thenumbersin
circles).
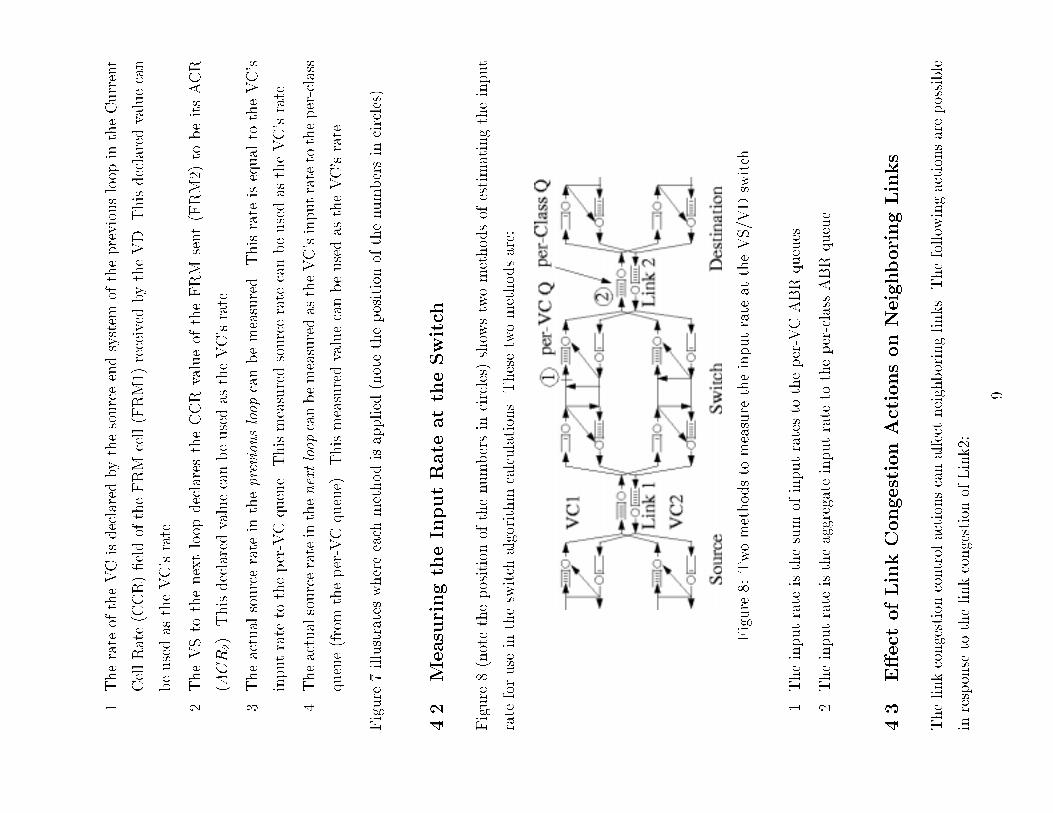
4.2
MeasuringtheInputRate
attheSwitch
Figure
8(notethepositionof
thenumbersin
circles)
show
stwomethodsof
estimatingtheinput
rate
foruse
intheswitch
algorithm
calculations.Thesetwomethodsare:
Figure
8:Twomethodsto
measure
theinputrate
attheVS/V
Dswitch
1.Theinputrate
isthesum
ofinputratesto
theper-VCABRqueues.
2.Theinputrate
istheaggregateinputrate
totheper-classABRqueue.
4.3
E�ectofLinkCongestionActionsonNeighboringLinks
Thelinkcongestioncontrolactionscana�ectneighboringlinks.Thefollow
ingactionsarepossible
inresponse
tothelinkcongestionof
Link2:
9

1.ChangeER
1.Thisa�ectstherateofthepreviouslooponly.Thechange
inrateisexperienced
only
afterafeedbackdelay
equalto
twicethepropogationdelay
oftheloop.
2.ChangeACR
2.Thisa�ectstherate
ofthenextlooponly.Thechange
inrate
isexperienced
instantaneously.
3.Change
ER
1andACR
2.Thisa�ects
both
thepreviousandthenextloop.Thenextloop
is
a�ectedinstantaneouslywhilethepreviousloop
isa�ectedafterafeedbackdelay
asin
the
�rstcase.
4.4
FrequencyofUpdatingtheAllocatedRate
TheERICA
algorithm
inanon-VS/V
Dswitch
calculatestheallocatedrate
when
aBRM
cellis
processed
inaswitch.How
ever,in
aVS/V
Dswitch,therearethreeoptionsas
show
nin
Figure
9:
Figure
9:Threemethodsto
updatetheallocatedrate
1.Calculateallocatedrate
onreceivingBRM2only.Storethevalueinatableandusethistable
valuewhen
anFRM
isturned
around.
2.Calculate
allocatedrate
only
when
FRM1is
turned
around.
3.Calculateallocatedrate
both
when
FRM1isturned
aroundaswellaswhen
BRM2isreceived.
Inthenextsection,wediscuss
thevariousoptionsandpresentanalyticalarguments
toeliminate
certaindesigncombinations.
5VS/VDSwitchDesignOptions
5.1
VCRate
MeasurementTechniques
Wehavepresentedfourwaysof
�ndingthetheVC'scurrentrate
insection4.1,twoof
them
used
declaredratesandtwoof
them
measuredtheactual
sourcerate.Weshow
that
measuringsource
ratesisbetterthan
usingdeclaredratesfortworeasons.
10
First,thedeclaredVCrateofaloop
naivelyistheminimumofbottleneckratesof
downstream
loops
only.It
does
not
consider
thebottleneckratesof
upstream
loops,andmay
ormay
not
consider
thebottleneckrate
ofthe�rstlinkofthenextloop.Measurementallowsbetterestimationofload
when
thetra�
cisnot
regular.
Second,theactualrate
oftheVCmay
belower
than
thedeclaredACRoftheVCdueto
dynam
ic
changesin
bottleneckratesupstream
ofthecurrentswitch.Thedi�erence
inACR
andVCrate
willremainatleastas
longas
thetimerequired
fornew
feedbackfrom
thebottleneckin
thepath
toreachthesourceplusthetimeforthenew
VCrate
tobeexperiencedat
theswitch.Thesum
of
thesetwodelay
componentsiscalled
the\feedbackdelay."
Dueto
feedbackdelay,itispossiblethat
thedeclaredrate
isastalevalueat
anypointof
time.
Thisisespeciallytruein
VS/V
Dswitches
whereper-VCqueues
may
controlsourceratesto
values
quitedi�erentfrom
theirdeclaredrates.
Further,themeasuredsourcerate
caneasily
becalculatedin
aVS/V
Dswitch
since
thenecessary
quantities
(number
ofcellsandtimeperiod)aremeasuredas
partof
oneof
thesourceendsystem
rules(SESRule5)
[1,2,10].
5.2
InputRate
measurementtechniques
Asdiscussed
earlier,theinputrate
canbemeasuredas
thesum
oftheinputratesof
VCsto
the
per-VCqueues
ortheaggregateinputrate
totheper-classqueue.
Thesetworatescanbedi�erent
because
theinputrate
totheper-VCqueues
isat
thepreviousloop'srate
whiletheinputto
the
per-classqueueisrelatedto
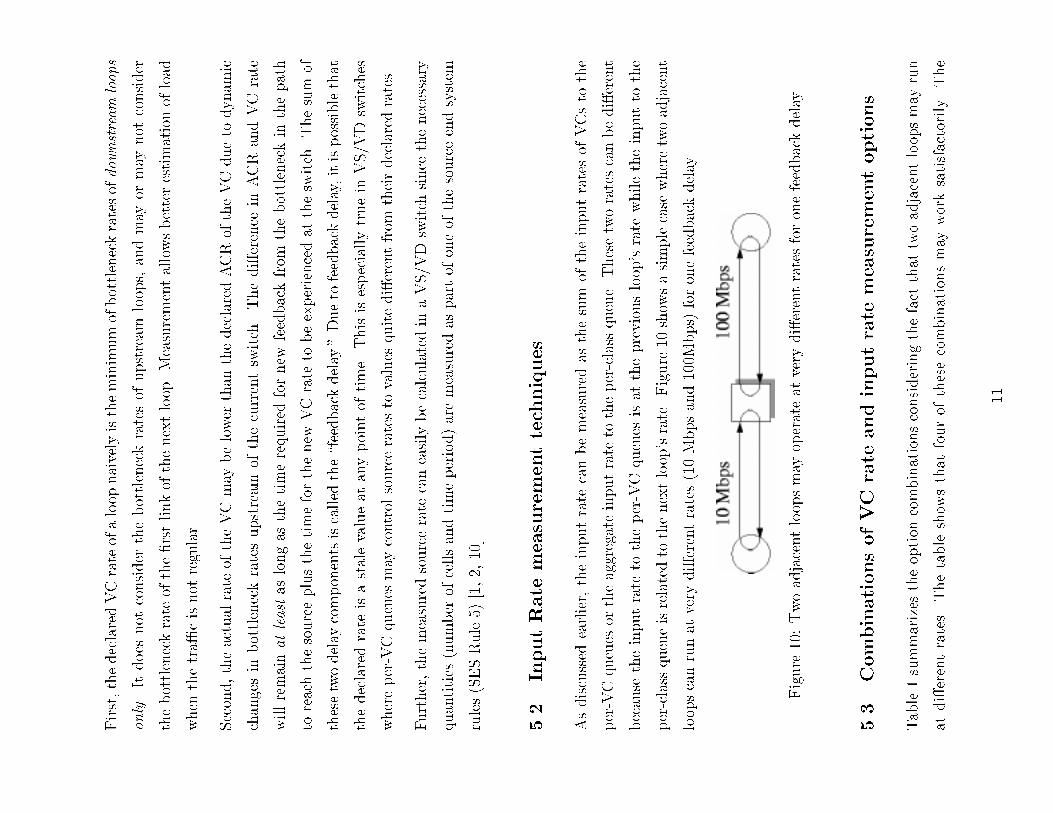
thenextloop'srate.Figure10
show
sasimplecasewheretwoadjacent
loopscanrunat
very
di�erentrates(10Mbpsand100M
bps)foronefeedbackdelay.
Figure
10:Twoadjacentloopsmay
operateat
very
di�erentratesforonefeedbackdelay
5.3
CombinationsofVCrate
andinputrate
measurementoptions
Table1summarizes
theoption
combinationsconsideringthefact
that
twoadjacentloopsmay
run
atdi�erentrates.
Thetableshow
sthat
fourof
thesecombinationsmay
worksatisfactorily.The
11
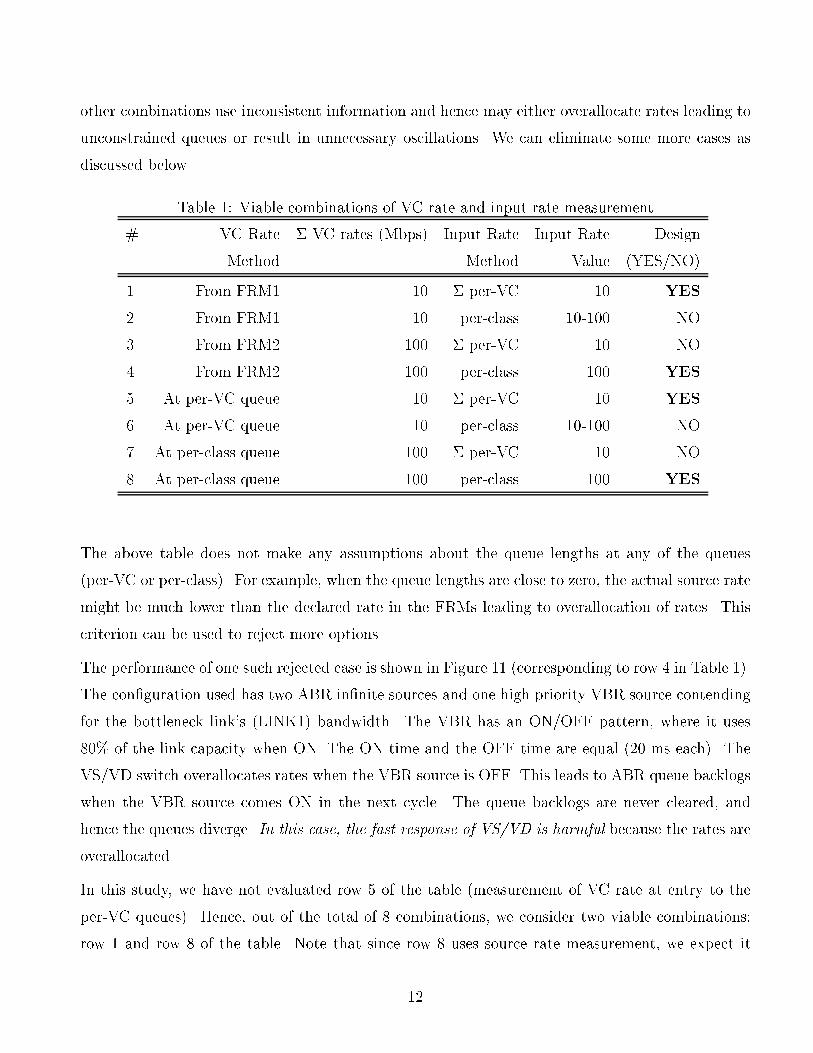
other combinations use inconsistent information and hence may either overallocate rates leading to
unconstrained queues or result in unnecessary oscillations. We can eliminate some more cases as
discussed below.
Table 1: Viable combinations of VC rate and input rate measurement
# VC Rate � VC rates (Mbps) Input Rate Input Rate Design
Method Method Value (YES/NO)
1. From FRM1 10 � per-VC 10 YES
2. From FRM1 10 per-class 10-100 NO
3. From FRM2 100 � per-VC 10 NO
4. From FRM2 100 per-class 100 YES
5. At per-VC queue 10 � per-VC 10 YES
6. At per-VC queue 10 per-class 10-100 NO
7. At per-class queue 100 � per-VC 10 NO
8. At per-class queue 100 per-class 100 YES
The above table does not make any assumptions about the queue lengths at any of the queues
(per-VC or per-class). For example, when the queue lengths are close to zero, the actual source rate
might be much lower than the declared rate in the FRMs leading to overallocation of rates. This
criterion can be used to reject more options.
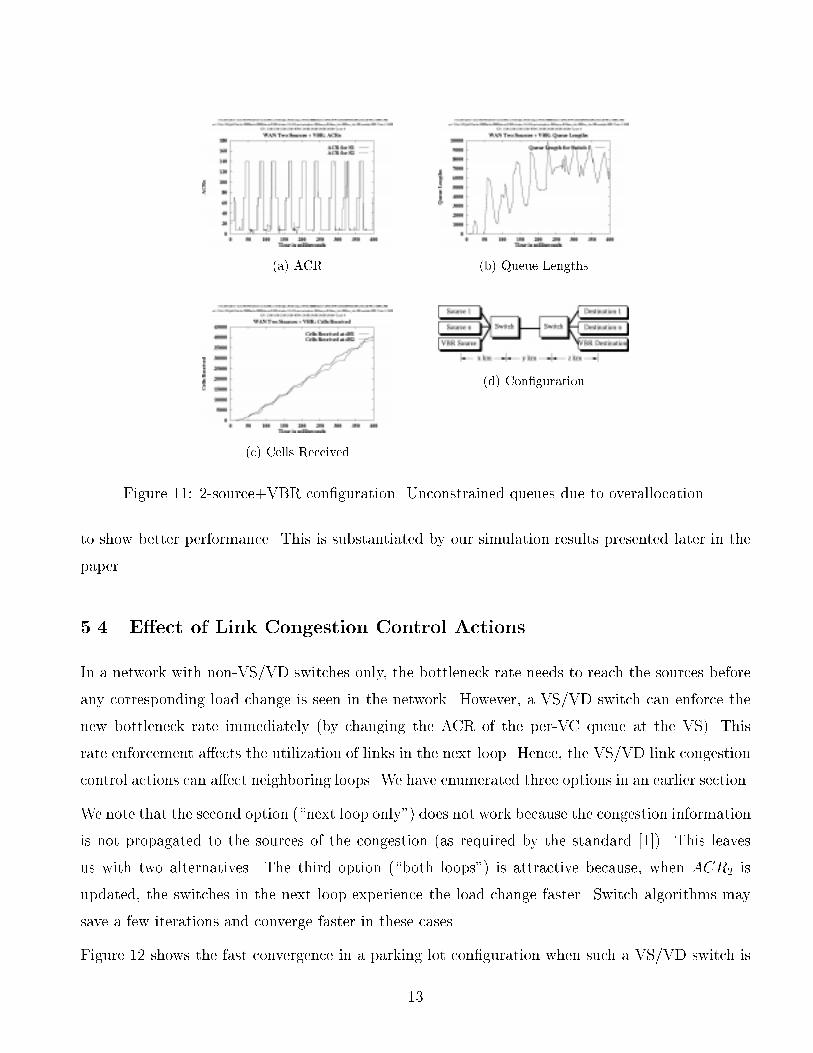
The performance of one such rejected case is shown in Figure 11 (corresponding to row 4 in Table 1).
The con�guration used has two ABR in�nite sources and one high priority VBR source contending
for the bottleneck link's (LINK1) bandwidth. The VBR has an ON/OFF pattern, where it uses
80% of the link capacity when ON. The ON time and the OFF time are equal (20 ms each). The
VS/VD switch overallocates rates when the VBR source is OFF. This leads to ABR queue backlogs
when the VBR source comes ON in the next cycle. The queue backlogs are never cleared, and
hence the queues diverge. In this case, the fast response of VS/VD is harmful because the rates are
overallocated.
In this study, we have not evaluated row 5 of the table (measurement of VC rate at entry to the
per-VC queues). Hence, out of the total of 8 combinations, we consider two viable combinations:
row 1 and row 8 of the table. Note that since row 8 uses source rate measurement, we expect it
12
(a) ACR
(b) Queue Lengths
(c) Cells Received
(d) Con�guration
Figure 11: 2-source+VBR con�guration. Unconstrained queues due to overallocation.
to show better performance. This is substantiated by our simulation results presented later in the
paper.
5.4 E�ect of Link Congestion Control Actions
In a network with non-VS/VD switches only, the bottleneck rate needs to reach the sources before
any corresponding load change is seen in the network. However, a VS/VD switch can enforce the
new bottleneck rate immediately (by changing the ACR of the per-VC queue at the VS). This
rate enforcement a�ects the utilization of links in the next loop. Hence, the VS/VD link congestion
control actions can a�ect neighboring loops. We have enumerated three options in an earlier section.
We note that the second option (\next loop only") does not work because the congestion information
is not propagated to the sources of the congestion (as required by the standard [1]). This leaves
us with two alternatives. The third option (\both loops") is attractive because, when ACR2 is
updated, the switches in the next loop experience the load change faster. Switch algorithms may
save a few iterations and converge faster in these cases.
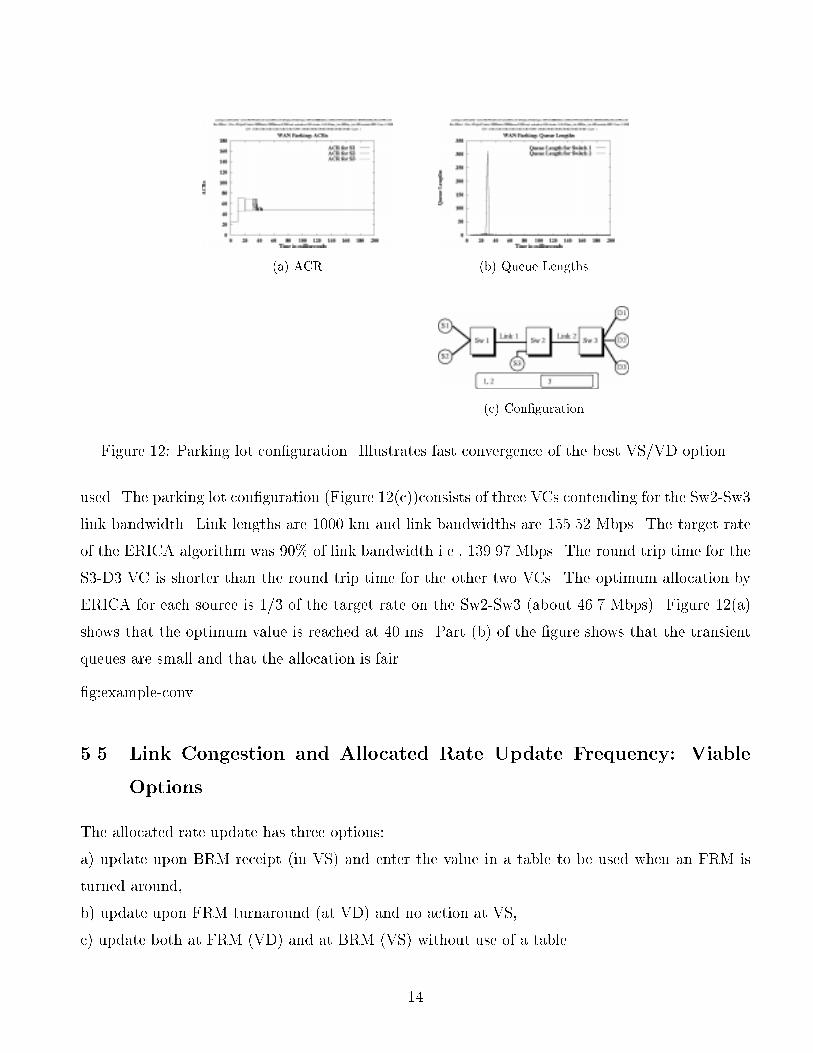
Figure 12 shows the fast convergence in a parking lot con�guration when such a VS/VD switch is
13
(a) ACR
(b) Queue Lengths
(c) Con�guration
Figure 12: Parking lot con�guration. Illustrates fast convergence of the best VS/VD option.
used. The parking lot con�guration (Figure 12(c))consists of three VCs contending for the Sw2-Sw3
link bandwidth. Link lengths are 1000 km and link bandwidths are 155.52 Mbps. The target rate
of the ERICA algorithm was 90% of link bandwidth i.e., 139.97 Mbps. The round trip time for the
S3-D3 VC is shorter than the round trip time for the other two VCs. The optimum allocation by
ERICA for each source is 1/3 of the target rate on the Sw2-Sw3 (about 46.7 Mbps). Figure 12(a)
shows that the optimum value is reached at 40 ms. Part (b) of the �gure shows that the transient
queues are small and that the allocation is fair.
�g:example-conv
5.5 Link Congestion and Allocated Rate Update Frequency: Viable
Options
The allocated rate update has three options:
a) update upon BRM receipt (in VS) and enter the value in a table to be used when an FRM is
turned around,
b) update upon FRM turnaround (at VD) and no action at VS,
c) update both at FRM (VD) and at BRM (VS) without use of a table.
14
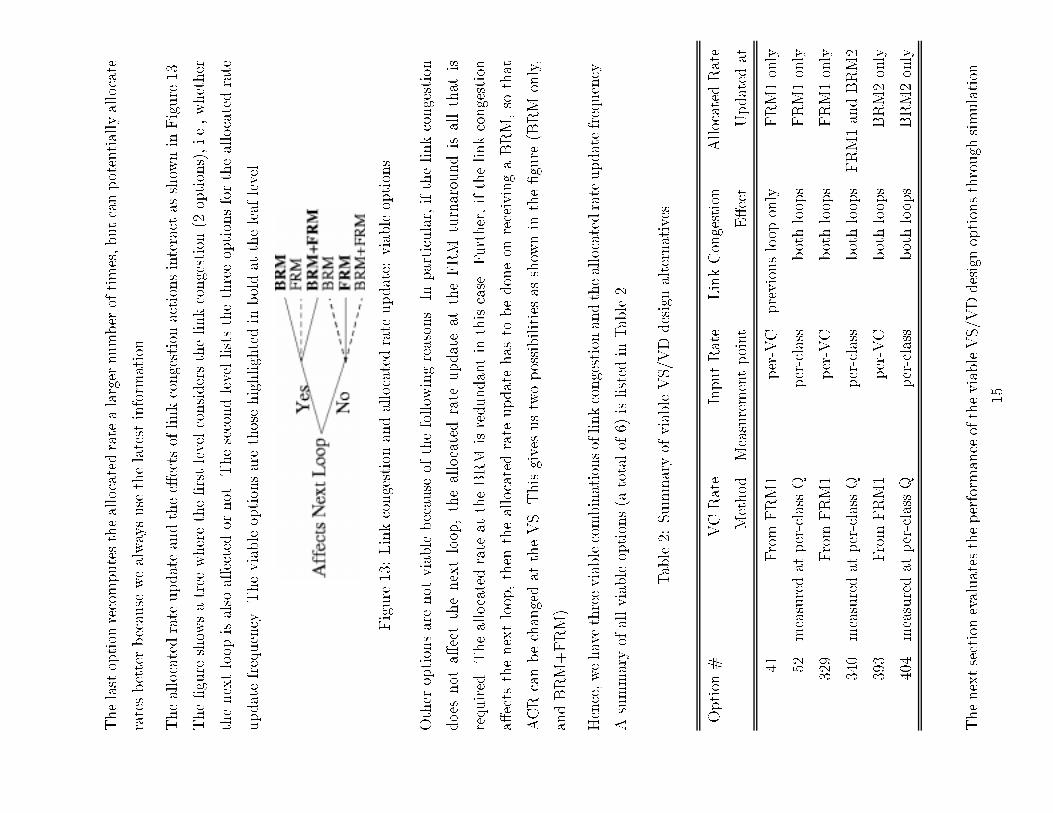
Thelastoption
recomputestheallocatedratealargernumberoftimes,butcanpotentiallyallocate
ratesbetterbecause
wealwaysuse
thelatestinform
ation.
Theallocatedrate
updateandthee�ectsoflinkcongestionactionsinteract
asshow
nin
Figure13.
The�gure
show
satree
wherethe�rstlevelconsidersthelinkcongestion(2
options),i.e.,whether
thenextloop
isalso
a�ectedor
not.Thesecondlevelliststhethreeoptionsfortheallocatedrate
updatefrequency.Theviableoptionsarethosehighlightedin
boldat
theleaf
level.
Figure
13:Linkcongestionandallocatedrate
update:
viableoptions
Other
optionsarenot
viablebecause
ofthefollow
ingreasons.
Inparticular,ifthelinkcongestion
does
not
a�ectthenextloop,theallocatedrate
updateat
theFRM
turnaroundis
allthat
is
required.Theallocatedrate
attheBRM
isredundantin
thiscase.Further,ifthelinkcongestion
a�ects
thenextloop,then
theallocatedrate
updatehas
tobedoneon
receivingaBRM,so
that
ACRcanbechangedat
theVS.Thisgivesustwopossibilitiesas
show
nin
the�gure
(BRM
only,
andBRM+FRM).
Hence,wehavethreeviablecombinationsoflinkcongestionandtheallocatedrateupdatefrequency.
Asummaryof
allviableoptions(a
totalof
6)islisted
inTable2.
Table2:
Summaryof
viableVS/V
Ddesignalternatives
Option
#VCRate
InputRate
LinkCongestion
AllocatedRate
Method
Measurementpoint
E�ect
Updated
at
41From
FRM1
per-VC
previousloop
only
FRM1only
52measuredat
per-classQ
per-class
bothloops
FRM1only
329
From
FRM1
per-VC
bothloops
FRM1only
340
measuredat
per-classQ
per-class
bothloops
FRM1andBRM2
393
From
FRM1
per-VC
bothloops
BRM2only
404
measuredat
per-classQ
per-class
bothloops
BRM2only
Thenextsectionevaluatestheperform
ance
oftheviableVS/V
Ddesignoptionsthrough
simulation.
15
6Perform
anceEvaluationofVS/VDDesignOptions
6.1
Metrics
Weuse
fourmetrics
toevaluatetheperform
ance
ofthesealternatives:
�Response
Tim
e:isthetimetakento
reachnearoptimalbehavioron
startup.
�ConvergenceTim
e:isthetimeforrate
oscillationsto
decrease(timeto
reachthesteady
state).
�Throughput:
Totaldatatransferredper
unittime.
�Maxim
um
Queue:Themaximum
queuebeforeconvergence.
Thedi�erencebetweenresponsetimeandconvergence
timeisillustratedinFigure14.Thefollow
ing
sectionspresentsimulation
resultswithrespectto
theabovemetrics.Notethat
wehaveusedgreedy
(in�nite)
tra�
csources
inoursimulations.Wehavestudiedthealgorithmicenhancementsin
non-
VS/V
Dswitchesfornon-greedysourcesinreference
[8].Weexpectconsistentresultsforsuch
tra�
c
when
thebestimplementation
option
(see
below
)isused.
Figure
14:Response
timevsConvergence
time
6.1.1
Response
Tim
e
WithoutVS/V
Dallresponse
times
arecloseto
theround-tripdelay.WithVS/V
D,theresponse
times
arecloseto
thefeedbackdelay
from
thebottleneck.Since
VS/V
Dreducestheresponse
time
duringthe�rstroundtrip,itisgoodforlongdelay
paths.
Thequickresponse
time(10msin
the
parkinglotcon�guration
whichhas
a30
msroundtriptime)was
illustratedpreviouslyinFigure12.
Responsetimeisalso
importantforbursty
tra�
clike
TCP�letransferoverATM
which\startsup"
atthebeginningof
everyactive
period(when
theTCPwindow
increases)
afterthecorresponding
idleperiod[9,10].
16
6.1.2
Throughput
Thenumber
ofcellsreceived
atthedestinationisameasure
ofthethroughputachieved.These
values
arelisted
inTable
3.Thetoprow
isalist
ofthecon�guration
codes
(thesecodes
are
explained
inTable2.
The�nalcolumnliststhethroughputvaluesforthecase
when
anon-VS/V
D
switch
isused.The2source+
VBR
andtheparkinglotcon�gurationshavebeenintroducedin
earliersection.
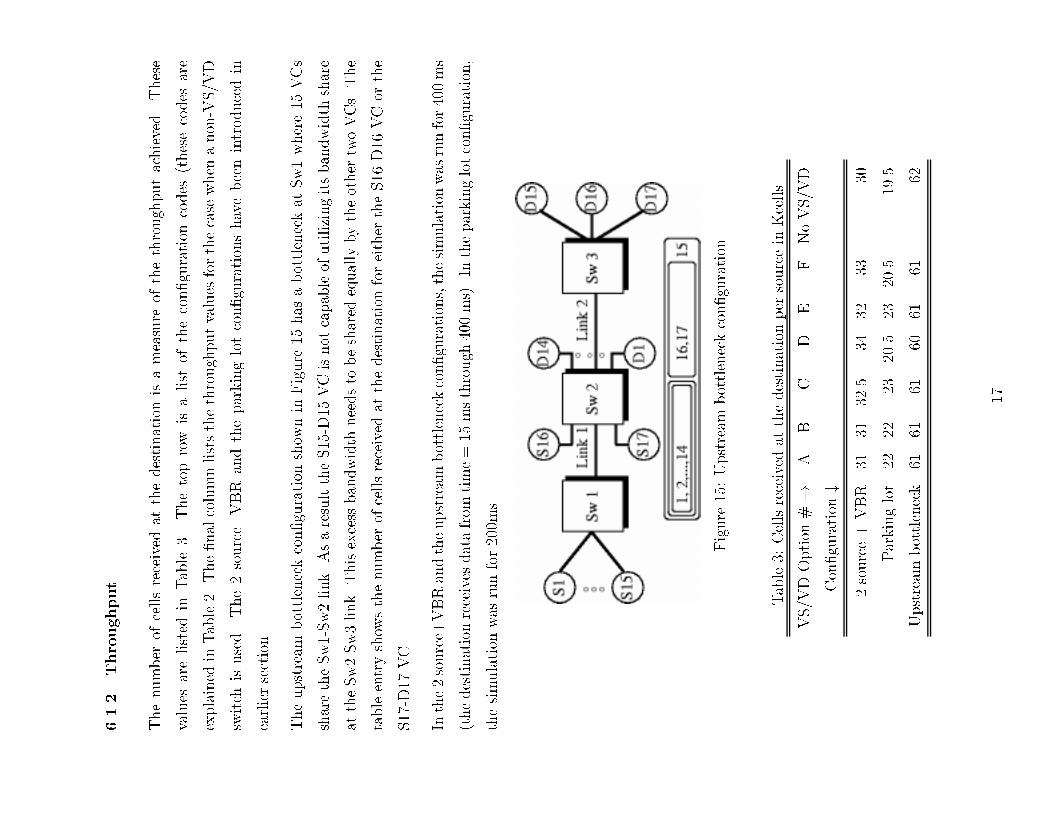
Theupstream
bottleneckcon�guration
show
nin
Figure
15has
abottleneckat
Sw1where15
VCs
sharetheSw1-Sw2link.AsaresulttheS15-D15
VCisnot
capableofutilizingitsbandwidth
share
attheSw2-Sw3link.Thisexcessbandwidth
needsto
beshared
equallybytheothertwoVCs.The
tableentryshow
sthenumber
ofcellsreceived
atthedestinationforeither
theS16-D16
VCor
the
S17-D17
VC.
Inthe2source+
VBRandtheupstream
bottleneckcon�gurations,thesimulation
was
runfor400ms
(thedestinationreceivesdatafrom
time=15
msthrough
400ms).In
theparkinglotcon�guration,
thesimulation
was
runfor200m
s.
Figure
15:Upstream
bottleneckcon�guration
Table3:
Cellsreceived
atthedestinationper
sourcein
Kcells
VS/V
DOption
#!
AB
CD
EF
NoVS/V
D
Con�guration
#
2source+VBR
3131
32.5
3432
3330
Parkinglot
2222
2320.5
2320.5
19.5
Upstream
bottleneck
6161
6160
6161
62
17
As we compare the values in each row of the table, we �nd that, in general, there is little di�erence
between the alternatives in terms of throughput. However, there is a slight increase in throughput
when VS/VD is used over the case without VS/VD switch.
6.1.3 Convergence Time
The convergence time is a measure of how fast the scheme �nishes the transient phase and reaches
steady state. It is also sometimes called \transient response." The convergence times of the various
options are shown in Table 4. The \transient" con�guration mentioned in the table has two ABR
VCs sharing a bottleneck (like the 2 source + VBR con�guration, but without the VBR VC). One
of the VCs comes on in the middle of the simulation and remains active for a period of 60 ms before
going o�.
Table 4: Convergence time in ms
VS/VD Option # ! A B C D E F No VS/VD
Con�guration #
Transient 50 50 65 20 55 25 60
Parking lot 120 100 170 45 125 50 140
Upstream bottleneck 95 75 75 20 95 20 70
Observe that the convergence time of VS/VD option D (highlighted) is the best. Recall that this
con�guration corresponds to measuring the VC rate at the entry to the per-class queue, input rate
measured at the per-class queue, link congestion a�ecting both the next loop and the previous loop,
the allocated rate updated at both FRM1 and BRM2.
6.1.4 Maximum Transient Queue Length
The maximum transient queues gives a measure of how askew the allocations were when compared
to the optimal allocation and how soon this was corrected. The maximum transient queues are
tabulated for various con�gurations for each VS/VD option and for the case without VS/VD in
Table 5.
The table shows that VS/VD option D has very small transient queues in all the con�gurations
18
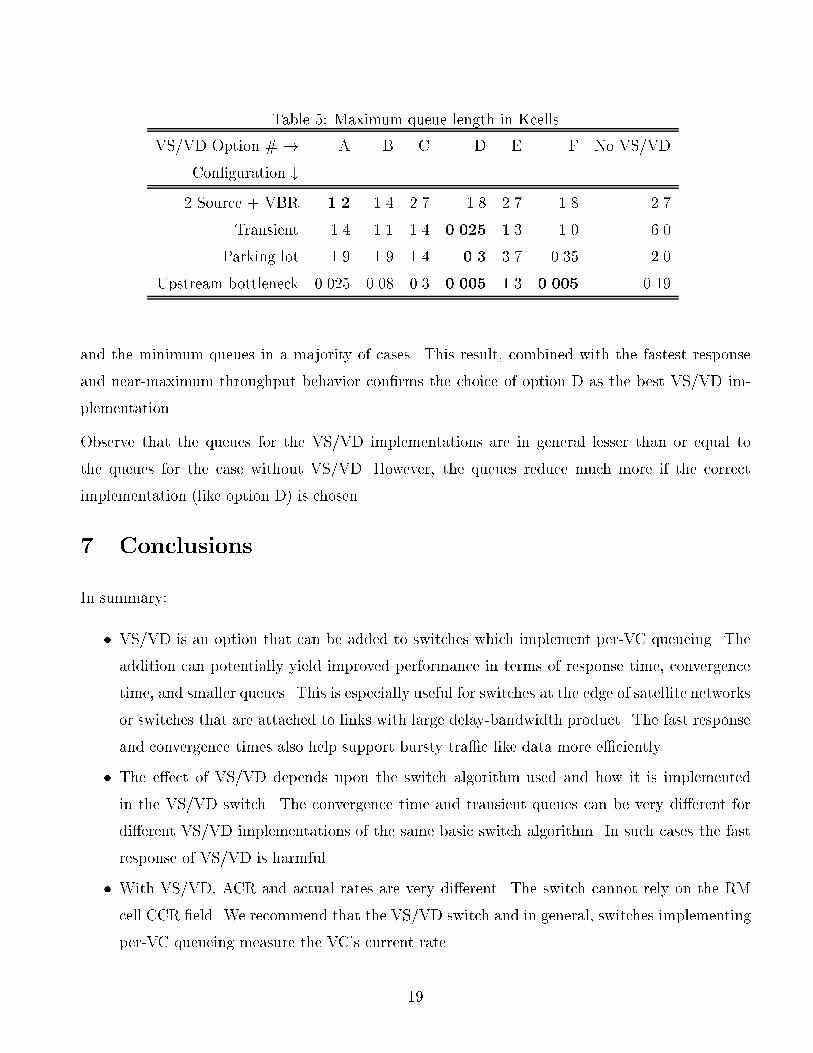
Table 5: Maximum queue length in Kcells
VS/VD Option # ! A B C D E F No VS/VD
Con�guration #
2 Source + VBR 1.2 1.4 2.7 1.8 2.7 1.8 2.7
Transient 1.4 1.1 1.4 0.025 1.3 1.0 6.0
Parking lot 1.9 1.9 1.4 0.3 3.7 0.35 2.0
Upstream bottleneck 0.025 0.08 0.3 0.005 1.3 0.005 0.19
and the minimum queues in a majority of cases. This result, combined with the fastest response
and near-maximum throughput behavior con�rms the choice of option D as the best VS/VD im-
plementation.
Observe that the queues for the VS/VD implementations are in general lesser than or equal to
the queues for the case without VS/VD. However, the queues reduce much more if the correct
implementation (like option D) is chosen.
7 Conclusions
In summary:
� VS/VD is an option that can be added to switches which implement per-VC queueing. The
addition can potentially yield improved performance in terms of response time, convergence
time, and smaller queues. This is especially useful for switches at the edge of satellite networks
or switches that are attached to links with large delay-bandwidth product. The fast response
and convergence times also help support bursty tra�c like data more e�ciently.
� The e�ect of VS/VD depends upon the switch algorithm used and how it is implemented
in the VS/VD switch. The convergence time and transient queues can be very di�erent for
di�erent VS/VD implementations of the same basic switch algorithm. In such cases the fast
response of VS/VD is harmful.
� With VS/VD, ACR and actual rates are very di�erent. The switch cannot rely on the RM
cell CCR �eld. We recommend that the VS/VD switch and in general, switches implementing
per-VC queueing measure the VC's current rate.
19
� The sum of the input rates to per-VC VS queues is not the same as the input rate to the link.
It is best to measure the VC's rate at the output of the VS and the input rate at the entry to
the per-class queue.
� On detecting link congestion, the congestion information should be forwarded to the previ-
ous loop as well as the next loop. This method reduces the convergence time by reducing
the number of iterations required in the switch algorithms on the current and downstream
switches.
� It is best for the the rate allocated to a VC to be calculated both when turning around FRMs
at the VD as well as after receiving BRMs at the next VS.
8 Future Work
The VS/VD provision in the ABR tra�c management framework can potentially improve perfor-
mance of bursty tra�c and reduce the bu�er requirements in switches. The VS/VD mechanism
achieves this by breaking up a large ABR loop into smaller ABR loops which are separately con-
trolled. However, further study is required in the following areas:
� E�ect of VS/VD on bu�er requirements in the switch.
� Scheduling issues with VS/VD.
� E�ect of di�erent switch algorithms in di�erent control loops, and di�erent control loop
lengths.
� E�ect of non-ABR clouds and standardization issues involved.
� E�ect of using switch algorithms speci�cally designed to exploit the per-VC queueing policy
required in VS/VD implementations.
References
[1] ATM Forum, \ATM Tra�c Management Speci�cation Version 4.0," April 1996, available as
ftp://ftp.atmforum.com/pub/approved-specs/af-tm-0056.000.ps
20
[2] Raj Jain, Shiv Kalyanaraman, Rohit Goyal, Sonia Fahmy, \Source Behavior for ATM ABR
Tra�c Management: An Explanation," IEEE Communications Magazine, November 19962.
[3] Kerry Fendick, \Evolution of Controls for the Available Bit Rate Service," IEEE Communica-
tions Magazine, November 1996.
[4] L. Roberts, \Enhanced PRCA (Proportional Rate-Control Algorithm)," AF-TM 94-0735R1,
August 1994.
[5] K. Siu and T. Tzeng, \Intelligent congestion control for ABR service in ATM networks,"
Computer Communication Review, Volume 24, No. 5, pp. 81-106, October 1995.
[6] L. Kalampoukas, A. Varma, K. K. Ramakrishnan, \An e�cient rate allocation algorithm for
ATM networks providing max-min fairness," Proceedings of the 6th IFIP International Con-
ference on High Performance Networking, September 1995.
[7] Y. Afek, Y. Mansour, and Z. Ostfeld, \Phantom: A simple and e�ective ow control scheme,"
Proceedings of the ACM SIGCOMM, August 1996.
[8] R. Jain, S. Kalyanaraman, R. Goyal, S. Fahmy, and R. Viswanathan, \The ERICA Switch
Algorithm for ABR Tra�c Management in ATM Networks, Part I: Description" IEEE Trans-
actions on Networking, submitted.
[9] Anna Charny, Gunter Leeb, Michael Clarke, \Some Observations on Source Behavior 5 of the
Tra�c Management Speci�cation," AF-TM 95-0976R1, August 1995.
[10] Shivkumar Kalyanaraman, Ray Jain, Sonia Fahmy, Rohit Goyal, \Use-It-or-Lose-It (UILI)
Policies for the ABR Service in ATM Networks," Computer Networks and ISDN Systems,
submitted.
2All our papers and ATM Forum contributions are available through http://www.cis.ohio-state.edu/~jain
21
Related Documents