DESIGN AND TESTING OF A TRACTION/DISTRACTION KNEE BRACE A Thesis Submitted to the College of Graduate and Postdoctoral Studies In Partial Fulfillment of the Requirements For the Degree of Master of Science In the Department of Mechanical Engineering University of Saskatchewan Saskatoon By TIMOTHY JAMES GADZELLA Copyright Timothy James Gadzella, September, 2018. All rights reserved.

Welcome message from author
This document is posted to help you gain knowledge. Please leave a comment to let me know what you think about it! Share it to your friends and learn new things together.
Transcript
DESIGN AND TESTING OF A TRACTION/DISTRACTION KNEE BRACE
A Thesis Submitted to the College of
Graduate and Postdoctoral Studies
In Partial Fulfillment of the Requirements
For the Degree of Master of Science
In the Department of Mechanical Engineering
University of Saskatchewan
Saskatoon
By
TIMOTHY JAMES GADZELLA
Copyright Timothy James Gadzella, September, 2018. All rights reserved.
i
Permission to Use
In presenting this thesis/dissertation in partial fulfillment of the requirements for a Postgraduate
degree from the University of Saskatchewan, I agree that the Libraries of this University may
make it freely available for inspection. I further agree that permission for copying of this
thesis/dissertation in any manner, in whole or in part, for scholarly purposes may be granted by
the professor or professors who supervised my thesis/dissertation work or, in their absence, by
the Head of the Department or the Dean of the College in which my thesis work was done. It is
understood that any copying or publication or use of this thesis/dissertation or parts thereof for
financial gain shall not be allowed without my written permission. It is also understood that due
recognition shall be given to me and to the University of Saskatchewan in any scholarly use
which may be made of any material in my thesis/dissertation.
DISCLAIMER
Reference in this thesis/dissertation to any specific commercial products, process, or service by
trade name, trademark, manufacturer, or otherwise, does not constitute or imply its endorsement,
recommendation, or favoring by the University of Saskatchewan. The views and opinions of the
author expressed herein do not state or reflect those of the University of Saskatchewan, and shall
not be used for advertising or product endorsement purposes.

ii
Requests for permission to copy or to make other uses of materials in this thesis/dissertation in
whole or part should be addressed to:
Head of the Department of Mechanical Engineering
57 Campus Drive
University of Saskatchewan
Saskatoon, Saskatchewan S7N 5A9
Canada
OR
Dean
College of Graduate and Postdoctoral Studies
University of Saskatchewan
116 Thorvaldson Building, 110 Science Place
Saskatoon, Saskatchewan S7N 5C9
Canada
iii
Abstract
A new knee brace design is required to provide non-surgical distraction of the knee joint for
extended periods of time. This knee brace needs to apply traction force to the joint directly,
rather than indirectly unloading one compartment. In providing such a design, this research had
two objectives: 1) to design a lower-leg knee brace that can apply traction load to the knee; and
2) to test prototypes of these lower-leg knee brace components and relate the traction load to
wearer discomfort and interface force.
The first objective was met through prospective analysis and iterative design. A planar finite
element (FE) model of the lower leg was used to analyse the effect of knee brace coverage. It
was observed that increasing the coverage of the knee brace may reduce interface pressures and
concentrations of force. A lower-leg knee brace was designed responding to this model, using
fibreglass casts with embedded fasteners to transfer load. Braces were manufactured in three
lengths for testing: 3”, 7”, and a combined (“mixed”) design with components from each.
Nine participants were recruited for pilot testing of the lower leg knee brace. A mechanical test
frame was built to apply traction load to the participants’ legs through each of the prototype knee
braces. The load in the test frame was increased in 3kgf increments as interface force
measurements were taken. Participants self-reported their discomfort on an 11-point Likert scale
or Numerical Rating Scale (NRS).
Results of the pilot study showed significant differences among the brace designs. The 3” design
showed higher NRS scores than the 7” and mixed designs by a full NRS step. Graphical profiles
of the interface force suggested that this difference may be the result of higher interface forces
distributed across the smaller area of the 3” brace. However, no significant correlation between
maximum interface force and self-reported pain was found. Parameters characterizing the shape
of the participant’s lower legs indicated that leg shape may influence brace effectiveness.
This study concluded that a rigid knee brace is indeed a valid design, but a longer knee brace
interface is required for the anterior surface of the leg to improve comfort. This length may not
be required for the posterior surface. Further, this study demonstrated simple relationships
among applied load, interface force, and wearer discomfort. Future work will adapt this design to
the upper leg and optimize the design to minimize force concentrations at the joints.

iv
Acknowledgments
I would like first and foremost to acknowledge the support of my supervisors, Professors JD
Johnston and Allan Dolovich. This thesis is the result of many hours spent in their offices tossing
around ideas and drawing inspiration from comic books and movies. Their mentorship, guidance,
and willingness to let me explore the fantastic were instrumental to this work. I cannot possibly
thank them enough.
I would also like to thank my committee members, Professors Emily McWalter and Joel
Lanovaz, for their guidance in this research. I would also like to thank Professor Saija
Kontulainen for her guidance in the analysis of our data.
I would like to acknowledge the support of the staff of the Department of Mechanical
Engineering, specifically Rob Peace and Mike Miller. I would also like to acknowledge the
support of our lab group: Amy, Brennan, Kadin, IBK, Nema, Mahdi, Mehrdad, Lumeng, and
Dena.
I am fortunate to have what I can only describe as an army of friends and family who supported
my research throughout the past two years. This legion of positivity marches under many
banners: they are my parents, my sisters Ehren and KP, the boys of Atlas Company, the cheerful
Viking folk of Myrgan Wood, the plucky crew of the Dissonant Heart, and the hit-point sinks of
the Harambe’s Heroes Guild. They have been marshalled with seemingly unending patience by
my fiancée Katie, whose care and attention gave untellable amounts to this thesis. Thank you all
for your interest in my work and for giving me the occasional escape by indulging my love of
fantasy. You help keep the magic alive.

v
For Mum and Dad:
something need-to-have.
vi
Table of Contents
Permission to Use ........................................................................................................................... i
Abstract ......................................................................................................................................... iii
Acknowledgments ........................................................................................................................ iv
Table of Contents ......................................................................................................................... vi
List of Figures ............................................................................................................................... ix
List of Tables ................................................................................................................................ xi
List of Abbreviations .................................................................................................................. xii
1 Introduction ........................................................................................................................... 1
2 Literature Review ................................................................................................................. 2
2.1 Functional Anatomy of the Knee Joint ............................................................................ 2
2.2 Osteoarthritis and Knee Joint Distraction ........................................................................ 3
2.3 Osteoarthritis knee braces ................................................................................................ 6
2.4 Modelling of Biomechanical Interfaces ........................................................................... 9
2.5 Summary ........................................................................................................................ 10
3 Research Questions and Objectives .................................................................................. 12
3.1 Research Question .......................................................................................................... 12
3.2 Objectives ....................................................................................................................... 12
3.3 Hypotheses ..................................................................................................................... 12
3.4 Scope .............................................................................................................................. 13
4 Design Development............................................................................................................ 14
4.1 Introduction .................................................................................................................... 14
4.2 General Design Features ................................................................................................ 14
4.3 Design Improvements .................................................................................................... 15
4.3.1 FE Analysis ............................................................................................................. 15
4.3.2 Prototype Development ........................................................................................... 20
4.4 Discussion ...................................................................................................................... 27

vii
4.4.1 FE Model ................................................................................................................ 27
4.4.2 Prototype development............................................................................................ 28
5 Lower Leg Brace Testing ................................................................................................... 29
5.1 Introduction .................................................................................................................... 29
5.2 Methods .......................................................................................................................... 29
5.2.1 Participants ............................................................................................................. 29
5.2.2 Apparatus ................................................................................................................ 29
5.2.3 Test Procedure ........................................................................................................ 33
5.2.4 Analysis ................................................................................................................... 36
5.3 Results ............................................................................................................................ 36
5.3.1 Participant Inclusion .............................................................................................. 36
5.3.2 Qualitative Feedback and Observations ................................................................. 37
5.3.3 Pain Responses to Differing Brace Designs ........................................................... 37
5.3.4 Interface Forces ...................................................................................................... 38
5.4 Discussion ...................................................................................................................... 41
6 Geometric Analysis ............................................................................................................. 45
6.1 Introduction .................................................................................................................... 45
6.2 Methods .......................................................................................................................... 45
6.2.1 Digitizing Participant Leg Geometry...................................................................... 45
6.2.2 Geometric Analysis ................................................................................................. 46
6.3 Results ............................................................................................................................ 49
6.4 Discussion ...................................................................................................................... 49
7 Discussion............................................................................................................................. 51
7.1 Overview of Findings ..................................................................................................... 51
7.2 Comparison to Existing Findings ................................................................................... 52
7.3 Strengths and Limitations............................................................................................... 53

viii
8 Conclusions and Future Directions ................................................................................... 55
8.1 Conclusions .................................................................................................................... 55
8.2 Contributions .................................................................................................................. 55
8.3 Clinical Significance ...................................................................................................... 55
8.4 Recommendations for Future Research ......................................................................... 56
8.5 Closing Remarks ............................................................................................................ 56
References .................................................................................................................................... 58
Appendix A. Von Mises Stress Contours from Planar FE Simulation .................................. 63
Appendix B. Participant Information and Subject-Specific Test Data ................................. 68
ix
List of Figures
Figure 2.1: Anatomy of the knee joint (excluding patella)7 ............................................................ 2
Figure 2.2: Surgically distracted knee with two monotube fixators (medial and lateral),
reproduced with permission4 ........................................................................................................... 4
Figure 2.3: Physiological and radiological trends in cartilage thickness following KJD, reprinted
with permission5.............................................................................................................................. 5
Figure 2.4: Left: An example of a knee brace, reused with permission16. Right: A diagram
showing the moment-generating loads applied by a knee brace..................................................... 6
Figure 2.5: Comparisons of the traction and moment loads applied by knee braces16 and surgical
devices5 ........................................................................................................................................... 8
Figure 2.6: Example of an interface model, reproduced with permission34 ................................... 9
Figure 4.1: Model of a complete design concept .......................................................................... 15
Figure 4.2: 3-dimensional representation of bodies used in FE simulation .................................. 16
Figure 4.3: Boundaries and bodies in FE planar simulation of lower leg in the sagittal plane
(colours of bodies match Figure 4.2) ............................................................................................ 17
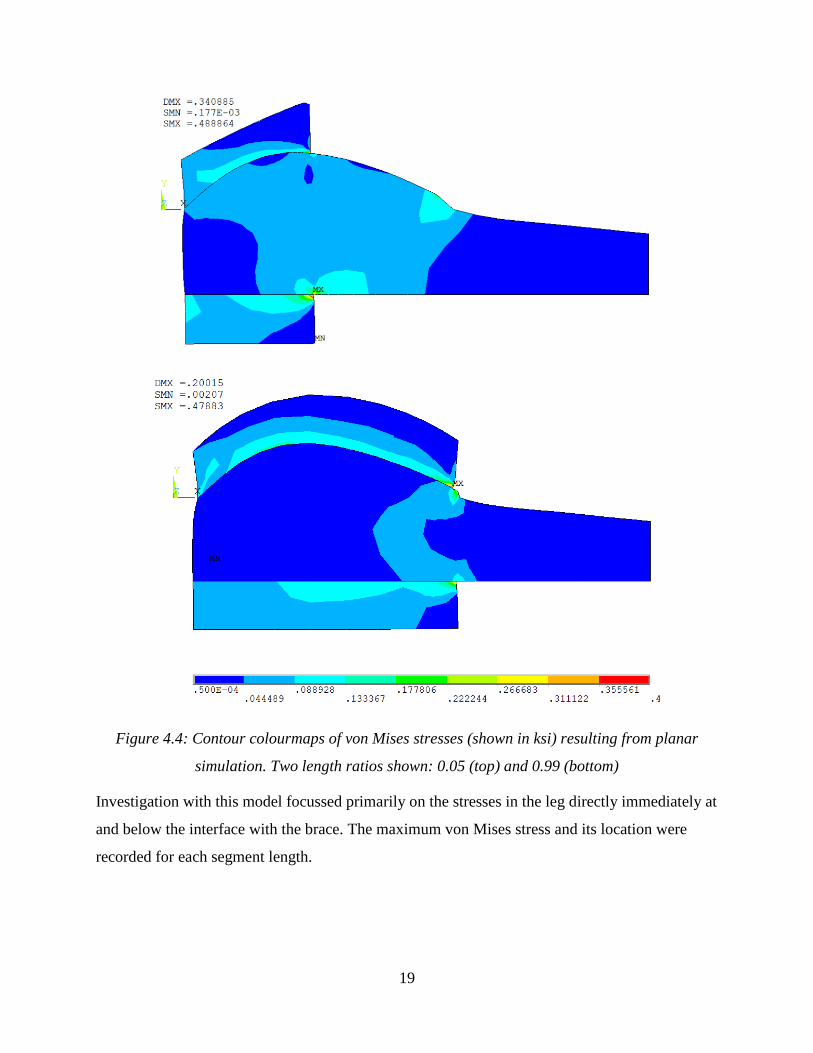
Figure 4.4: Contour colourmaps of von Mises stresses (shown in ksi) resulting from planar
simulation. Two length ratios shown: 0.05 (top) and 0.99 (bottom) ............................................ 19
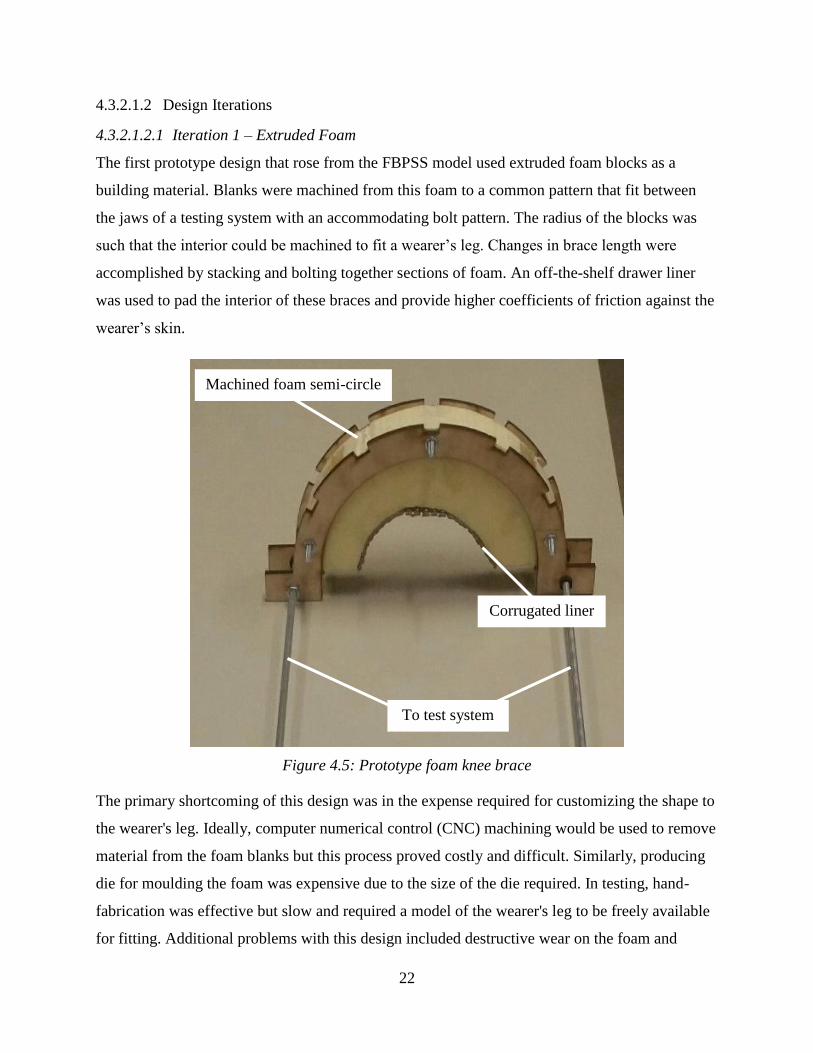
Figure 4.5: Prototype foam knee brace ......................................................................................... 22
Figure 4.6: Foam knee brace laoded in cross section (undeformed and deformed shapes shown)
....................................................................................................................................................... 23
Figure 4.7: Plaster cast on participant's leg ................................................................................... 23
Figure 4.8: Section showing order of brace materials .................................................................. 25
Figure 4.9: Edge and corner adjustments on fibreglass brace ...................................................... 26
Figure 4.10: Completed prototype knee brace on plaster model leg ............................................ 26
Figure 5.2: Frame and cable apparatus ......................................................................................... 30
Figure 5.3: Arrangement of apparatus during test ........................................................................ 31
Figure 5.4: Division of brace area into measurement sectors, with sensors (numbered) mounted
in a 7” brace prototype .................................................................................................................. 32
Figure 5.5: Three brace configurations for testing........................................................................ 33
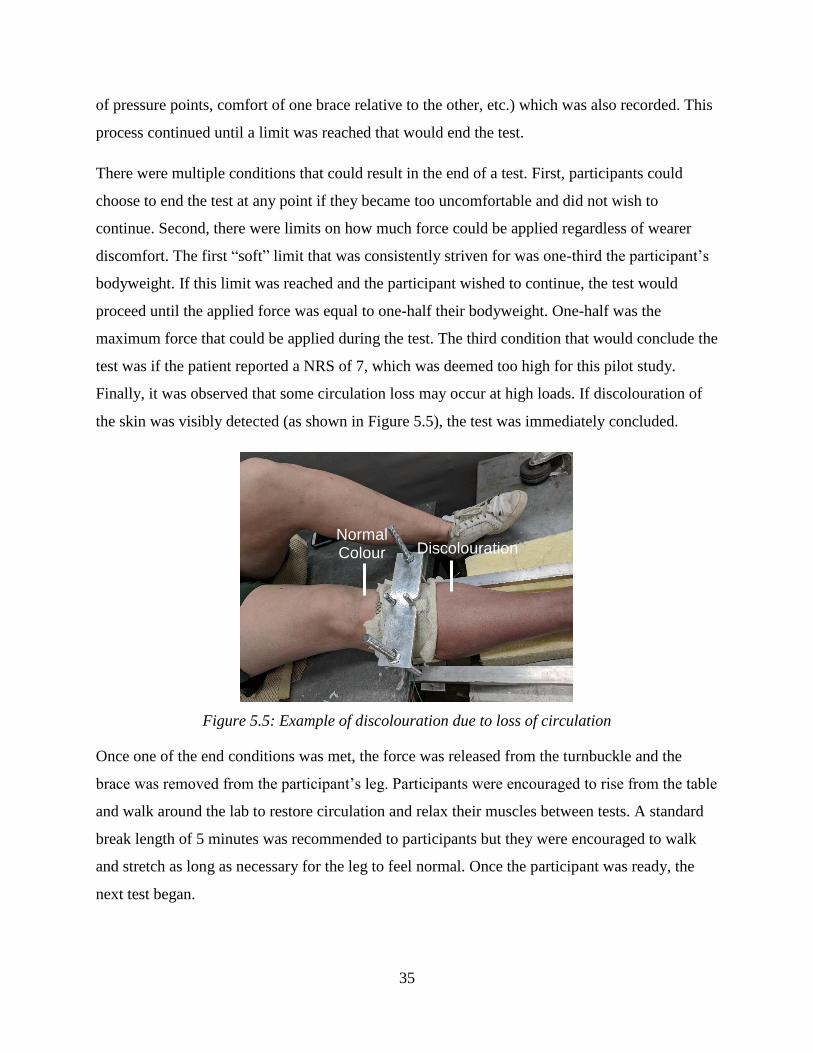
Figure 5.6: Example of discolouration due to loss of circulation ................................................. 35
Figure 5.5.9: Regression model relating pain and applied load .................................................... 38

x
Figure 5.10: Average interface force profiles (in Newtons) a) at baseline; b) at 117N of applied
load; and c) at 206N of applied load. ............................................................................................ 39
Figure 5.11: Self-reported pain and maximum interface forces for three brace designs .............. 41
Figure 6.1: Example of a STL surface of a lower leg ................................................................... 46
Figure 6.2: Sketch of error determination for Pratt fit circles ....................................................... 47
Figure 6.3: Example of a convergence plot for curvature fitting showing thresholds for fit width
and RMSE (green and grey), the section width near a sudden RMSE increase (red), and the
selected fit width for a single participant ...................................................................................... 48

xi
List of Tables
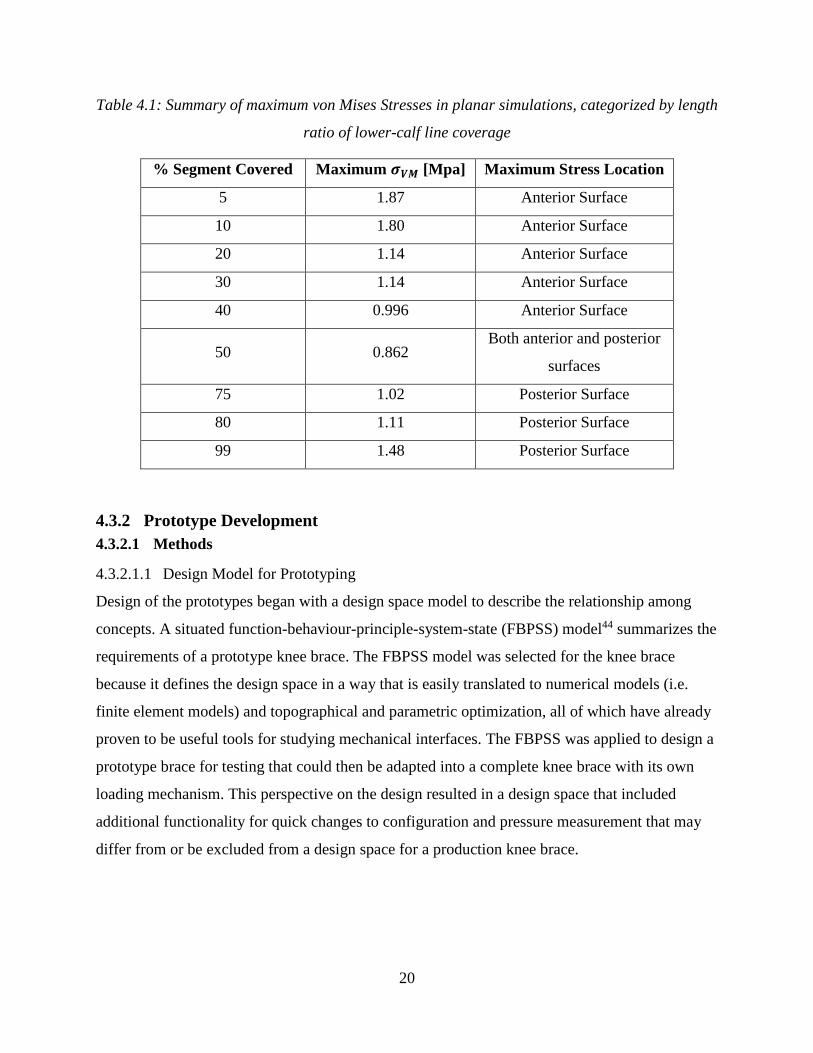
Table 4.1: Summary of maximum von Mises Stresses in planar simulations, categorized by
length ratio of lower-calf line coverage ........................................................................................ 20
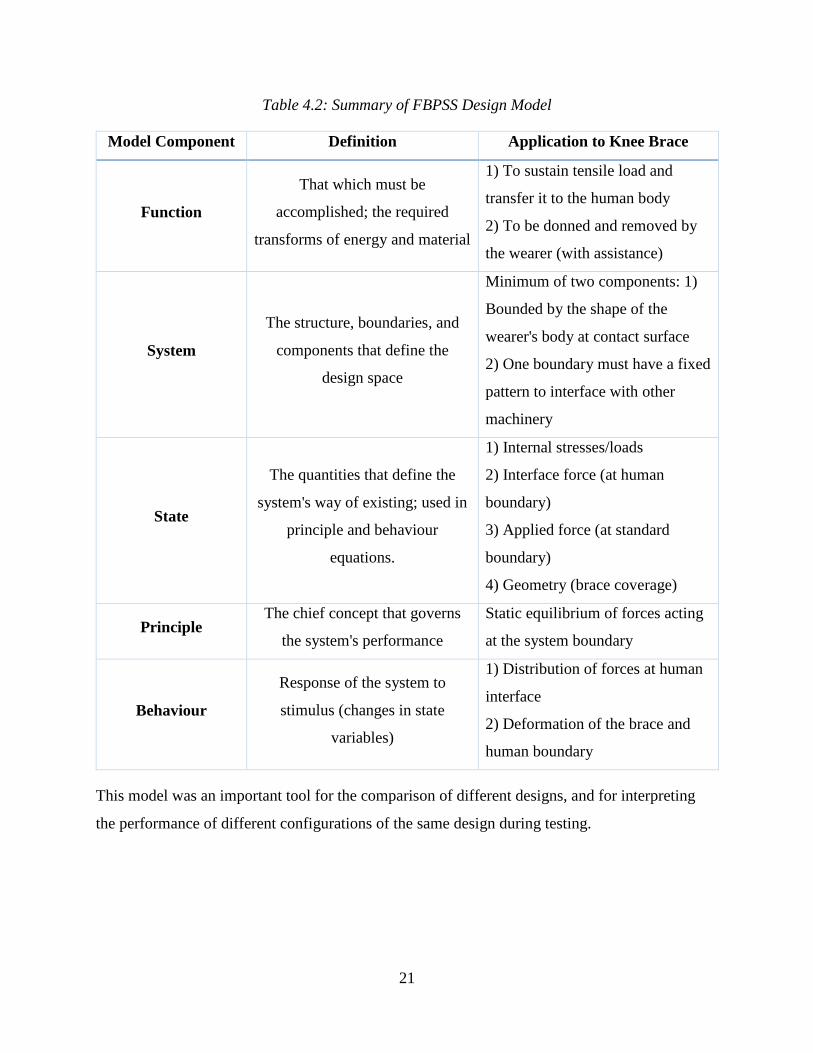
Table 4.2: Summary of FBPSS Design Model ............................................................................. 21
Table 5.1: Pearson coefficients correlating geometric parameters and brace performance ......... 49

xii
List of Abbreviations
ADM – Analog Discovery Module
EKAM – External Knee Adduction Moment
FBPSS – Function-Behaviour-Principle-System-State [design model]
JSW – Joint Space Width
KJD – Knee Joint Distraction
NRS – Numerical Rating Scale
OA - Osteoarthritis
OARSI – Osteoarthritis Research Society International
PPT – Pressure Pain Threshold
RMSE – Root Mean Square Error
WOMAC – Western Ontario and McMaster Universities Osteoarthritis [index]
1
1 Introduction
Osteoarthritis (OA) is a leading cause of disability, causing growing concern for many Canadians
who wish to be active and healthy. According to the Canadian Chronic Disease Surveillance
System, 13% of Canadians over the age of 20 years are affected by OA1. When the knee joint is
affected by OA it may lead to disability and inferior quality of life. Total knee replacements are
an option to restore function to those suffering most severely from OA but are only available at
the advancing stages of the disease. There are non-surgical treatment methods for knee OA,
summarized by the Osteoarthritis Research Society International (OARSI) in their published
guidelines2. OARSI’s panel of experts and patients recommend weight management, strength
training, and biomechanical interventions (e.g. knee bracing) as appropriate elements to a
complete treatment regime.
The subject of this thesis is the design of knee braces, an example of biomechanical interventions
for OA management described in the OARSI guidelines. Evidence is surfacing that indicates that
changes to the loads in the knee resulting from joint distraction may be key to delaying the
degenerative effects of OA3-5. The main goal of this research is to adapt knee brace interface
design to address current challenges in surgical methods of providing joint distraction.
Current OA knee braces are “unloaders”, creating moments about the knee to limit joint torques
that cause joint pain during gait. These braces provide a simple solution to a complicated
biomechanical problem but see low long-term compliance due to poor fit and discomfort of the
wearer6. Instead, knee braces should adapt to directly oppose the forces acting through the knee
rather than redistribute them, while simultaneously addressing issues of comfort and compliance.
Further, it is desirable to obtain quantitative data relating these parameters for use in engineering
models. This research attempts to address each of these problems through the redesign of a
lower-leg component to a new knee brace. This knee brace component is assessed by its
capability to deliver traction load to a human leg, the behaviour of the mechanical interface
between brace and leg, and the resulting comfort of the wearer.
2
2 Literature Review
2.1 Functional Anatomy of the Knee Joint
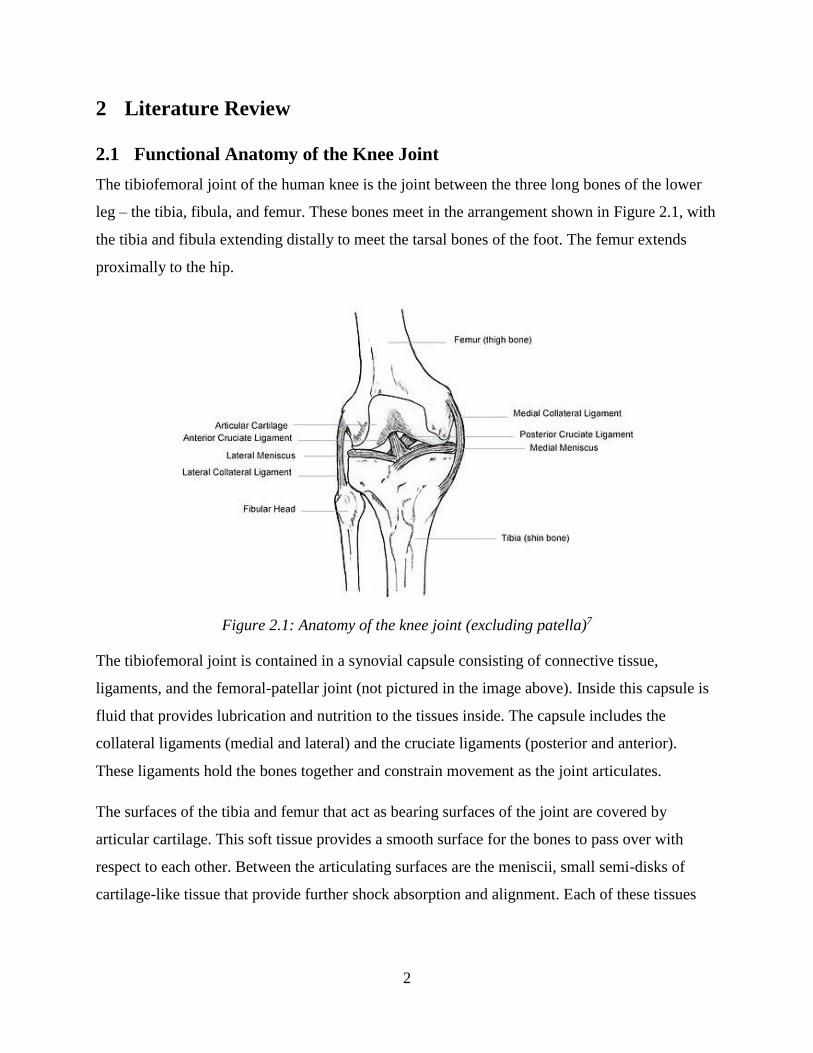
The tibiofemoral joint of the human knee is the joint between the three long bones of the lower
leg – the tibia, fibula, and femur. These bones meet in the arrangement shown in Figure 2.1, with
the tibia and fibula extending distally to meet the tarsal bones of the foot. The femur extends
proximally to the hip.
Figure 2.1: Anatomy of the knee joint (excluding patella)7
The tibiofemoral joint is contained in a synovial capsule consisting of connective tissue,
ligaments, and the femoral-patellar joint (not pictured in the image above). Inside this capsule is
fluid that provides lubrication and nutrition to the tissues inside. The capsule includes the
collateral ligaments (medial and lateral) and the cruciate ligaments (posterior and anterior).
These ligaments hold the bones together and constrain movement as the joint articulates.
The surfaces of the tibia and femur that act as bearing surfaces of the joint are covered by
articular cartilage. This soft tissue provides a smooth surface for the bones to pass over with
respect to each other. Between the articulating surfaces are the meniscii, small semi-disks of
cartilage-like tissue that provide further shock absorption and alignment. Each of these tissues
3
help provide shock absorption and alignment for the knee joint as it articulates. The health of
these tissues directly influences the knee joint’s ability to function.
2.2 Osteoarthritis and Knee Joint Distraction
OA is a debilitating disease that affects articulating joints, causing pain and decreasing
functionality. The disease is characterized by physiological changes in the muscoloskeletal
tissues of the affected joint such as the formation of cysts and bony protrusions (osteophytes),
inflammation, degradation of articulating tissues and the closure of the joint space as well as
pain8. The features of OA are numerous, but all influence the health of the tissues in the affected
joint. The prevailing hypothesis is that OA progresses due to an imbalance of damaging and
synthetic processes, resulting in tissues that cannot perform8.
There are a number of metrics for measuring the severity of OA. The Kellgren-Lawrence scale
employs radiographic measures to assess the severity of OA based upon features such as
narrowing of the joint space width (JSW) and osteophyte formation9. Other changes in such as
altered bone density and the formation of cysts have also been linked with OA progression8.
Little is known about the degradation/synthesis mechanism of OA, so most treatments of OA
focus on treating the primary symptom (pain) rather than combatting the cause of the disease.
One such treatment is joint distraction, in which mechanical force is applied to the joint to
separate the articulating surfaces of the bone for brief periods of time. Joint distraction can be
applied by hand10 but is also applied using constant-traction force generating devices11,12. In
patients with knee OA, knee joint distraction (KJD) has been shown to lessen pain and improve
function when coupled with regular physiotherapy12.
There is reason to believe that joint distraction may have greater effects than reducing pain.
Surgical methods of joint distraction in the human ankle13 and canine models of knee OA14 have
been somewhat successful at restoring function and health to tissues. These studies led to pilot
work in using KJD to combat OA in humans.
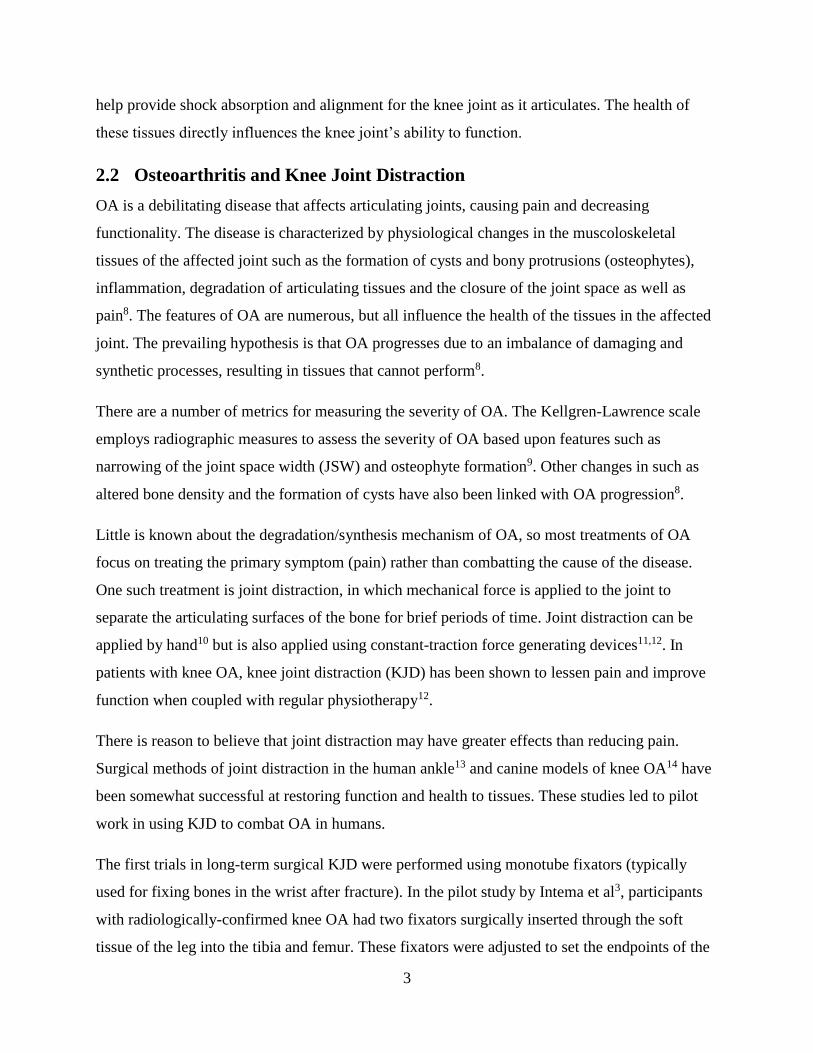
The first trials in long-term surgical KJD were performed using monotube fixators (typically
used for fixing bones in the wrist after fracture). In the pilot study by Intema et al3, participants
with radiologically-confirmed knee OA had two fixators surgically inserted through the soft
tissue of the leg into the tibia and femur. These fixators were adjusted to set the endpoints of the
4
tibia and femur with a JSW of 5mm as confirmed by radiographs. Because these fixators are
spring-loaded, participants were able to walk with their full weight on their fixated knee with
some degree of compliance (despite the angular position of the knee being fixed). Participants’
knees were fixated for approximately two months with intermittent appointments to remove the
fixators and flex the knee.
Figure 2.2: Surgically distracted knee with two monotube fixators (medial and lateral),
reproduced with permission4
The initial results from this pilot study were extremely promising. Like short-term, non-surgical
KJD, pain scores and functionality in the treated joints were improved. Unlike other methods for
KJD, physiological changes were observed. Immediately after the distraction protocol, the JSW
in the knee compartment most affected by OA was much greater than at baseline. Similarly, the
overall JSW in the knee was improved3. Other earmarks of OA such as subchondral bone density
and the thickness and area coverage of the articular cartilage were also significantly improved by
surgical KJD. By changing the method of distraction to allow for long-term manipulation of the
joint (as opposed to short bursts in a medical appointment), KJD was able to relieve the
symptoms of OA and combat some of the physiological damage from the disease.
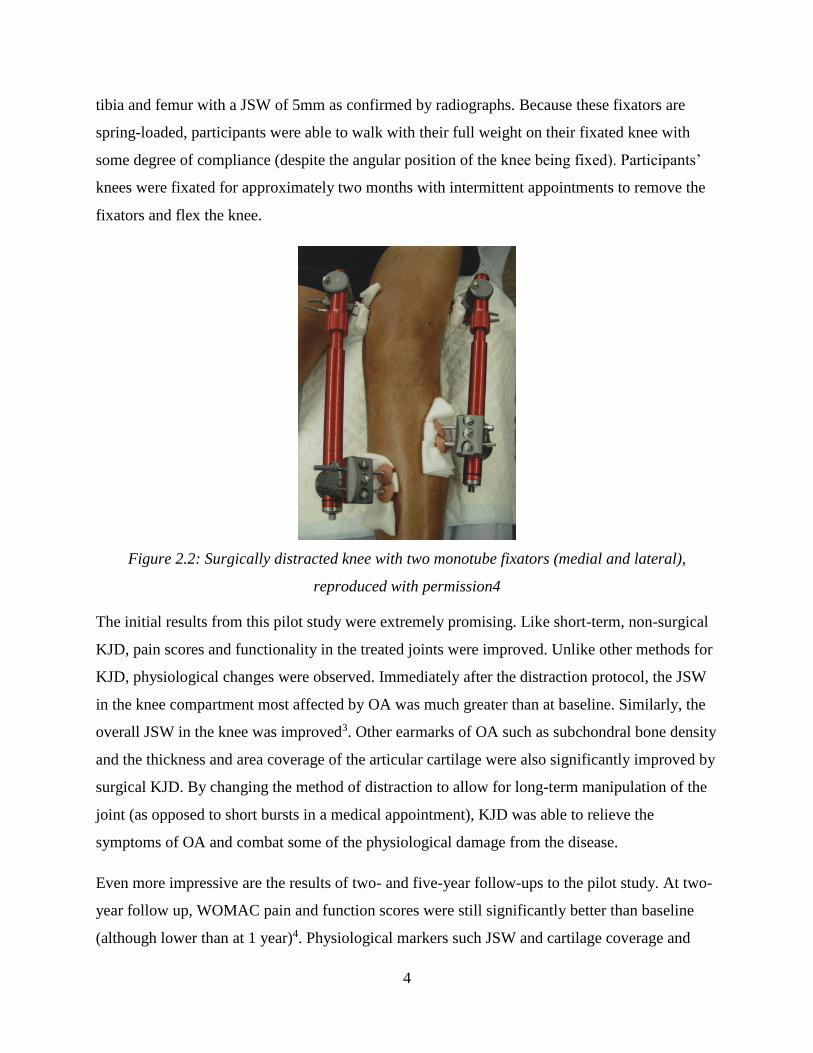
Even more impressive are the results of two- and five-year follow-ups to the pilot study. At two-
year follow up, WOMAC pain and function scores were still significantly better than baseline
(although lower than at 1 year)4. Physiological markers such JSW and cartilage coverage and
5
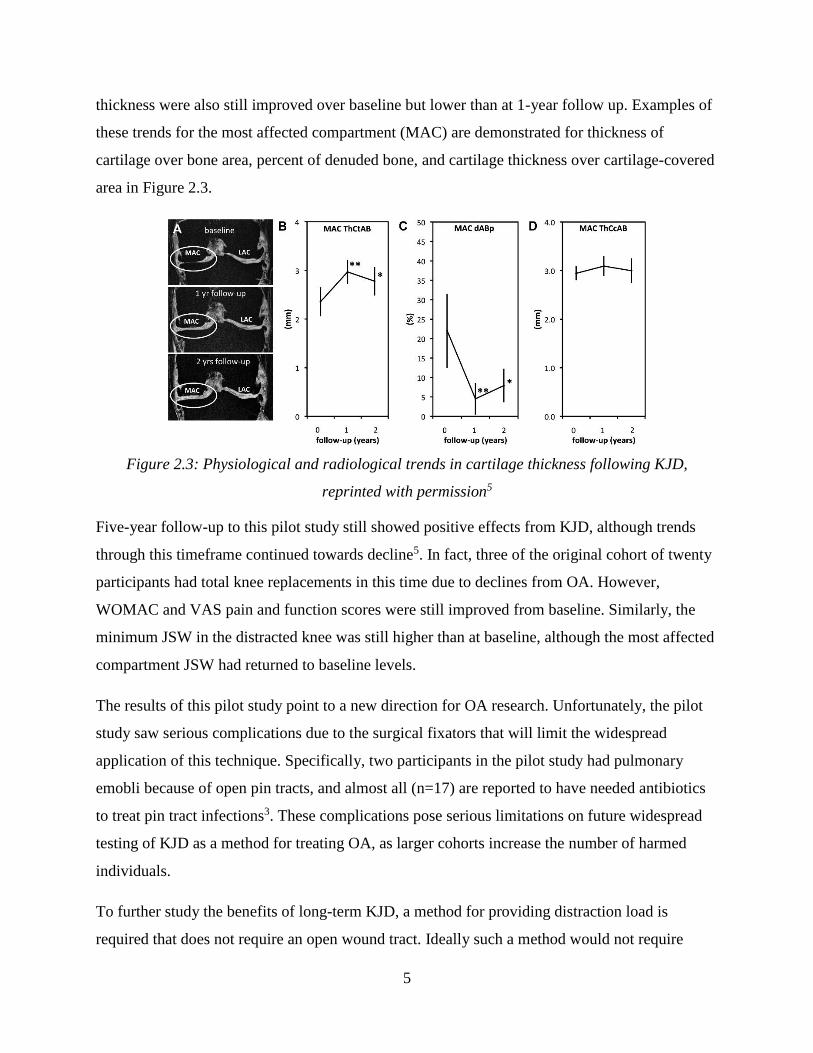
thickness were also still improved over baseline but lower than at 1-year follow up. Examples of
these trends for the most affected compartment (MAC) are demonstrated for thickness of
cartilage over bone area, percent of denuded bone, and cartilage thickness over cartilage-covered
area in Figure 2.3.
Figure 2.3: Physiological and radiological trends in cartilage thickness following KJD,
reprinted with permission5
Five-year follow-up to this pilot study still showed positive effects from KJD, although trends
through this timeframe continued towards decline5. In fact, three of the original cohort of twenty
participants had total knee replacements in this time due to declines from OA. However,
WOMAC and VAS pain and function scores were still improved from baseline. Similarly, the
minimum JSW in the distracted knee was still higher than at baseline, although the most affected
compartment JSW had returned to baseline levels.
The results of this pilot study point to a new direction for OA research. Unfortunately, the pilot
study saw serious complications due to the surgical fixators that will limit the widespread
application of this technique. Specifically, two participants in the pilot study had pulmonary
emobli because of open pin tracts, and almost all (n=17) are reported to have needed antibiotics
to treat pin tract infections3. These complications pose serious limitations on future widespread
testing of KJD as a method for treating OA, as larger cohorts increase the number of harmed
individuals.
To further study the benefits of long-term KJD, a method for providing distraction load is
required that does not require an open wound tract. Ideally such a method would not require

6
surgical intervention at all. The method proposed to overcome this challenge is a knee brace that
can apply distraction loads, providing a long-term method for applying force without surgery.
2.3 Osteoarthritis knee braces
Knee braces are orthotic devices that are designed to apply mechanical load to the leg for support
or correcting alignment. Knee braces for treating OA typically try to correct varus/valgus
moments and malalignments15. This countermoment is usually created through a narrow rigid
frame or nylon surface, applying opposing coupled forces at three or four points along the leg.
An example of such a knee brace is shown below:
Figure 2.4: Left: An example of a knee brace, reused with permission16. Right: A diagram
showing the moment-generating loads applied by a knee brace
The knee braces presently available in the market are made from aluminum or magnesium
alloys, carbon fibre and rigid plastic, or flexible nylon. These knee braces apply their forces with
one or two arms running along the leg with connecting bars, which are coupled with straps to
hold the brace on the leg. Because the forces are applied across the leg as concentrated loads
(rather than being distributed across broader components), there are few braces that cover much
of the leg – their designs are highly optimized for creating varus/valgus moments and little else.
This method of loading seeks to treat the symptoms of OA (pain, stiffness, and malalignment)
7
with no other physiological effects. There is, however, existing controversy concerning their
effectiveness.
The OARSI guidelines on the treatment of osteoarthritis summarize the controversy around OA
knee braces as part of their review of biomechanical interventions in general – they recommend
these devices as prescribed by specialists but acknowledge reviews that describe the evidence for
their effectiveness as "limited due to heterogeneity and poor quality of the available evidence"2.
The review in question was published by Duivenvoorden et al.17, which assessed clinical trials
involving knee brace effectiveness at reducing pain and improving function. Duivenvoorden et
al.'s review presents a dissenting voice compared to other reviewers, most of whom agree that
knee braces at least succeed in reducing pain18-20. This difference may arise from the constraint
of clinical trials in the Duivenvoorden review – the reviews by Steadmann et al.18, Petersen et
al.19 and Maleki et al.20 did not have this constraint and included observational and pilot studies.
Even with dissent among reviewers, there is evidence towards knee braces reducing OA pain.
Summarized by Moyer et al. in their review21, many studies find that knee braces improve
WOMAC scores for pain22-27. Interestingly, Draganich et al.28 compared off-the-shelf knee
braces to custom braces and found that while both groups improved pain scores, custom knee
braces helped restore function where off-the-shelf braces did not. This suggests that custom knee
braces interact more effectively with the body.
The crux of the controversy around knee brace effectiveness is biomechanical rather than
clinical. This controversy is best summarized by Steadman et al.'s review18, which focusses on a
number of biomechanical measures of gait such as external knee adduction moment (EKAM),
walking speed, self-selected walking parameters, and (in some cases) knee JSW. In general,
unloader knee braces appear to reduce EKAM26,27,29-31 with some caveats. Again, Draganich's
study found that the custom knee braces successfully reduced EKAM where the off-the-shelf
braces did not28. Factors such as pairing with insoles24 and initial direction of malalignment16
may also influence reductions in EKAM. In contrast, Hart et al.'s study suggests that the load
applied to a brace does not affect whether or not a knee brace may reduce adduction moments32.
The variety of findings and range of factors raises concerns regarding the compatibility of knee
braces with individual cases. The research reported in this thesis was performed under the belief
that the inability of knee braces to have consistent biomechanical effects is partly rooted in the

8
indirect method of loading – countermoments do not directly oppose the forces passing through
the knee joint but rather shift their location. Inter-personal variability add even more variability
to this indirect mechanical approach.
The evidence surrounding OA knee braces in the literature shows symptomatic relief without the
physiological or gait changes required to delay OA progression. The disparity in these results can
be directly compared to the distraction enforced in the KJD pilot study. Some knee brace studies
have found changes in alignment24,32 including one that used three-dimensional (3D)
fluoroscopy33. Contrastingly, fluroscopic results found that this alignment change could open the
most-affected-condyle but was inconsistent across brace design and participants. Another study
using biplane radiographs found similarly inconsistent results25.
Varying results across different designs speak to a mechanical problem rooted in the operating
principle itself. The loads required for an unloader knee brace to pry open a collapsed knee
compartment are extremely high; too high for the narrowness of the frame of current knee braces
to distribute into the leg, It may be more effective to directly oppose the loads passing through
the knee and pull the bones apart, as provided by surgical fixators, than to rely on a moment to
open one compartment of the knee indirectly. The difference between these two loading schemes
is illustrated in Figure 2.5.
Figure 2.5: Comparisons of the traction and moment loads applied by knee braces16 and
surgical devices5
9
To achieve the desired transformation in loading, a change to knee brace interfaces (the
components of the knee brace that contact the body) is required. This change necessitates study
of the interface forces and their distribution across the leg surface.
2.4 Modelling of Biomechanical Interfaces
Biomechanical interfaces are challenging to quantify through both empirical measurements and
modelling. However, the results of these investigations can provide detailed models which can
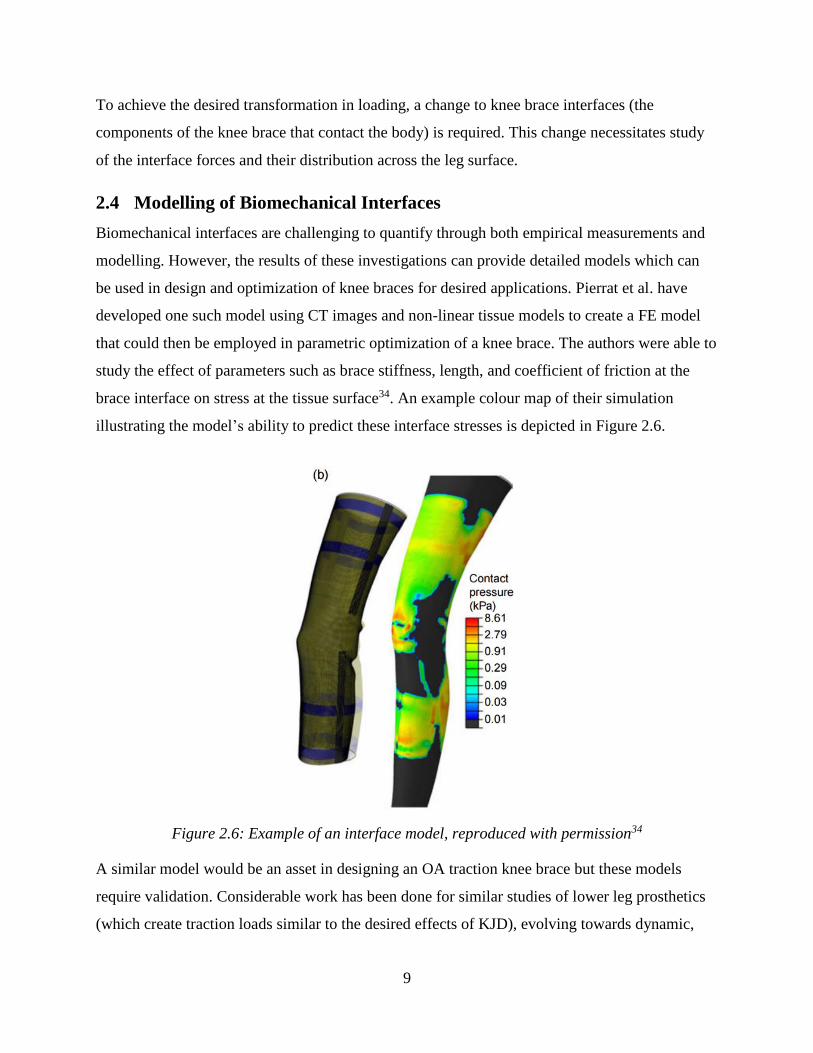
be used in design and optimization of knee braces for desired applications. Pierrat et al. have
developed one such model using CT images and non-linear tissue models to create a FE model
that could then be employed in parametric optimization of a knee brace. The authors were able to
study the effect of parameters such as brace stiffness, length, and coefficient of friction at the
brace interface on stress at the tissue surface34. An example colour map of their simulation
illustrating the model’s ability to predict these interface stresses is depicted in Figure 2.6.
Figure 2.6: Example of an interface model, reproduced with permission34
A similar model would be an asset in designing an OA traction knee brace but these models
require validation. Considerable work has been done for similar studies of lower leg prosthetics
(which create traction loads similar to the desired effects of KJD), evolving towards dynamic,

10
validated models35. Flexible pressure sensors have been designed and tested for measuring
prosthetic socket interfaces36,37. These sensors are designed to measure forces normal to the
surface and have well-known limitations in combined loading such as buckling, folding, and
shear biasing in output voltages. Ideally more complicated systems such as Fibre Bragg
Gratings38 can be used to provide 3D dynamic data. However, given the scarcity of data, there is
still significant clinical relevance to simple pressure measurements given that they can be related
to comfort and overall effectiveness35.
There have been attempts to relate indenter pressures on the residual limb to a model to
determine goodness of fit35,39,40. These models employ subject-specific imaging to develop
models that accurately capture differences in geometry between subject's bodies. However, while
these models relate interface stresses to the pain pressure threshold of the wearer, they do not
validate these relationships with an overall pain score or interface sensor data. For a
biomechanical interface such as a knee brace or prosthetic socket, the relationship between
interface force and the comfort of the wearer are important areas for future investigation.
2.5 Summary
OA is a widespread musculoskeletal disease that affects tissues in the joints, causing pain,
stiffness, and loss of function. A new method for combating the degeneration of these tissues in
the knee may be long-term joint distraction, in which the joint is separated by a fixed distance for
a number of months. This procedure has demonstrated the possibility for cartilage and
subchondral bone to recover but has major complications due to the requirement for an open pin
tract to externally fixate the bones.
The proposed method for overcoming the challenges of KJD is to instead employ a knee brace to
apply distraction load, removing the need for surgery to distract the knee. Current knee braces
employed in the treatment of OA use coupled forces to create moments about the knee to unload
one compartment of the knee. These knee braces are effective at relieving pain but have not
shown that they can apply the forces required to fully distract the knee. The problems with knee
brace effectiveness necessitate a change in their design as they are constructed using frames that
cannot apply the required traction forces. Further study of the biomechanical interface of such a
high-load device is required.

11
Biomechanical interfaces are often investigated using FE models with experimental validation. It
has been shown that such a model may be used to optimize soft brace designs, so there is
potential to use interface information to optimize a high-load brace. However, the closest
analogies to a KJD knee brace that are studied in this manner are prosthetic socket interfaces. In
addition to FE models, flexible pressure sensors can be used to investigate the stress-state and
forces at the boundary between the socket and residual limb. These methods may be replicated to
analyze this boundary in a KJD knee brace and, ideally, relate the mechanical performance of
such a brace to the comfort of the wearer. The current design paradigm of OA knee braces may
be shifted to apply traction load rather than cross-loading to apply varus/valgus moments,
allowing large-scale investigation into the promise of KJD as a conservative treatment of
osteoarthritis.
12
3 Research Questions and Objectives
3.1 Research Question
The proposed research will investigate the design of a lower-leg knee brace and its interactions
with the human body. The overall research question is: can a rigid knee brace be used to apply
traction load to the lower leg? Further, the proposed research will investigate relationships
between distraction load and wearer discomfort, and attempt to relate these factors to the
mechanical interface between the brace and wearer's leg.
3.2 Objectives
To address the research question, the following objectives will be pursued:
1. To design lower-leg knee braces that can apply traction load to the knee; and
2. To test prototype lower-leg knee brace components and relate the traction load to wearer
discomfort and interface force.
3.3 Hypotheses
For the design process prescribed in Objective 1, the hypothesis was that the artefact or system
proposed (the lower-leg knee brace) would succeed in its purpose (to apply traction load to the
knee).
The hypotheses for the pilot test described in Chapter 5 were determined during the design
phase. We hypothesized that the longest knee brace design would have the lowest interface
forces and, as a result, the lowest reported discomfort by study participants. We hypothesized
that a “mixed” brace design comprised of short and long halves would have intermediate
discomfort scores, and the shortest design the highest discomfort scores (with accompanying
increases in interface forces).
Repeated brace failure for one participant prompted investigation of the relationships among leg
shape, interface forces, and wearer discomfort. This investigation is described in Chapter 7. It
was hypothesized that leg shape would correlate to measurements taken during the pilot study.
Specifically, we hypothesized that increases in leg size and shape complexity (curvature) would
reduce interface forces and wearer discomfort ratings.

13
3.4 Scope
Chapter 4 describes the design of the lower leg knee brace using planar FE modelling to
determine different brace shapes to be tested. Chapter 5 describes the testing method that was
developed to perform a pilot study on the prototype braces. This method was employed on a
small cohort of 9 participants. The data from this pilot test was analyzed to for the relationships
from Objective 2. Chapter 5 also describes the results of this analysis in terms of statistics and
graphical relationships. In Chapter 6, post-hoc geometric analysis is used to relate participant leg
shape to outcomes from Chapter 5. Chapter 7 discusses these results in the context of existing
research. Chapter 8 concludes the research, addressing the limitations and future work arising
from the pilot study.
14
4 Design Development
4.1 Introduction
The purpose of the design process was to create a new knee brace that delivers traction loading
to the knee through the lower leg. These loads are of a large magnitude on a physiological scale
(on the order of the wearer’s bodyweight) but are relatively low compared to the strengths of
engineering materials. The key issue in the design was then to distribute the load onto the body
safely and comfortably. The distraction knee brace will need to be worn for long periods of time
(up to two months to match the distraction period of the surgical pilot study). A prosthetic socket
provides such a load and is usually worn for much longer than this time frame, but the force is
directed proximally rather than distally. An effective design may then re-arrange a prosthetic
socket to apply load in the opposite direction. By changing the orientation of the applied force
and adjusting the area covered by the socket, this design has been adapted to the traction knee
brace.
The design factors manipulated in this design were the area of coverage of the knee brace and the
stiffness of the material. Area of coverage is a balancing act between avoiding sensitive areas
while maximizing the area across which load can be distributed. Stiffness was determined by
selecting the material for the knee brace. Investigation of the interaction between these factors
began with a simple finite element model, leading to the iterative design of prototypes.
4.2 General Design Features
The proposed design employs high-coverage, prosthetic socket-like interfaces to apply traction to
both the upper and lower leg. The initial concept for this design had nearly full coverage of the
leg, with rigid connections to apply traction load at multiple points across the leg surface. A
rapid-prototyping model of the design is demonstrated in Figure 4.1.
15
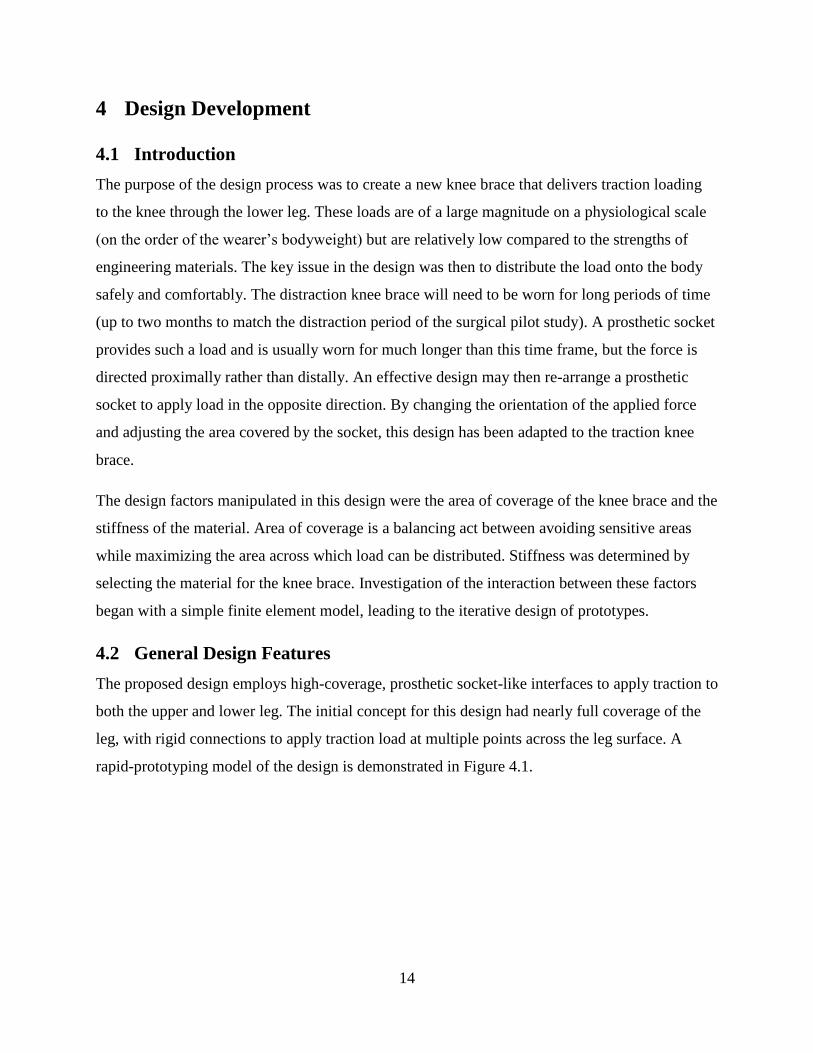
Figure 4.1: Model of a complete design concept
This design concept uses a simple mechanism (threaded rods) to apply traction load to the
interfaces. At this stage of the design, straps (partially represented by hose clamps in Figure 4.1)
apply preload to adhere the brace to the leg surface.
Early renditions of this design covered the entire surface of the thigh and the calf muscle.
However, it was unknown if this was the ideal configuration for the design and, if the design
were changed to cover more or less of the leg, what the comparative differences would be. The
area covered by the brace became the primary factor to be manipulated while improving the
design. The lower-leg interface was studied here due to the relative complexity of directing load
away from the body.
4.3 Design Improvements
4.3.1 FE Analysis
4.3.1.1 Methods
A planar FE analysis of the lower leg was employed to observe the effects of changing brace
area coverage on the brace-body interface. A simple shape was derived in ANSYS mechanical to
simulate a generic lower leg (purple areas in Figures 4.2 and 4.3). Two rigid bodies representing
Upper Leg Interface
Lower Leg Interface
Fixating Rods Retaining Straps &
Clamps

16
a knee brace (blue and red in Figures 4.2 and 4.3) were fitted directly to this body with a no-slip
boundary condition at contact with the lower leg.
Figure 4.2: 3-dimensional representation of bodies used in FE simulation
All three bodies were modeled with 2-dimensional Plane42 elements representing the leg in the
sagittal plane. Soft tissue was modelled with an elastic modulus of 13.8MPa and a Poisson's ratio
of 0.475. These properties are considerably stiffer than 3D models for similar contact scenarios41.
However, this tissue modulus allowed the models to converge without non-linear deformation.
Without subject-specific data numerical results were only estimates for relative comparison of
different lengths, so convergence of the model was prioritized. The elastic modulus of the brace
material was 138MPa with a Poisson’s ratio of 0.30. The properties for the brace material were
analogous to a generic polyethylene thermoplastic42. This material model was selected to
represent a common industrial plastic which is many times stiffer than the soft tissue.
Preload
Applied traction load
17
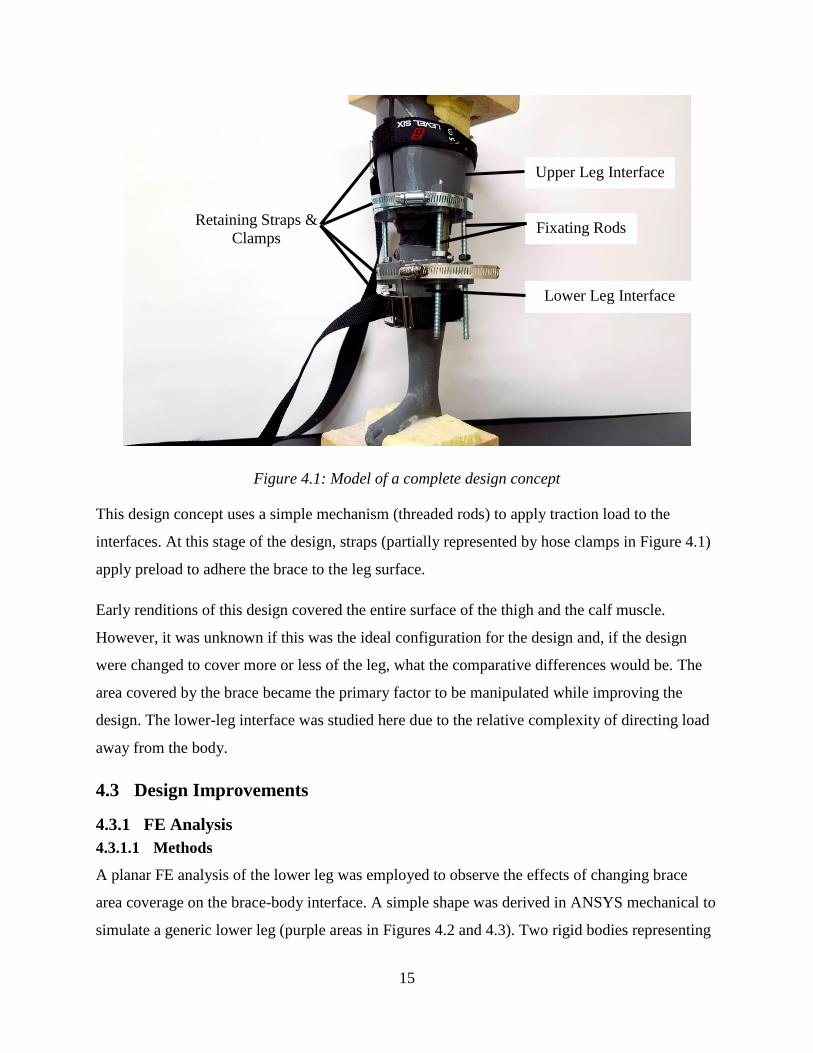
Figure 4.3: Boundaries and bodies in FE planar simulation of lower leg in the sagittal plane
(colours of bodies match Figure 4.2)
Constraints were put on the planar FE model to simply simulate the bones and load applied to the
brace. The vertical degree of freedom was restrained at the shin to simulate the tibia (the line
between points 6, 8, 9 and 7 in Figure 4.3). The tangential degree of freedom was not restrained
to allow for some skin-like movement at that surface. The distal edge of the body was fixed to
act like a foot resting in place (against the ground or a wall) on the lines 7-5 and 5-4.
In this two-dimensional approximation, applied pressures were modelled as forces per length. A
preload pressure of 0.876N/mm was applied to the exterior surfaces (line 16-13 and 14-12). A
pressure of 17.5N/mm was applied to the proximal edge of each brace (lines 1-14 and 6-16). As
the length of the knee brace was manipulated, the distraction force acting on the brace remained
constant while the net preload increased (as a result of a constant distribution along the surface of
the brace). This load case was solved for each brace configuration.
The effect of changing length was determined by resolving the load case for braces of increasing
length. The percent of line segment 8-9 covered by the brace was the factor used to manipulate
the length of each brace - braces were modeled for a coverage ratio of 0.05 to 0.99. Each brace
had the same starting point (just below where the knee would be).
Von Mises stresses were contoured for all three bodies for comparison. Von Mises stress was
selected as a stress measure to represent the net stress state in the leg. Any combination of
compressive, tensile, and shear forces can affect comfort and the performance of the brace.
0.876N/mm
17.5N/mm
0.876N/mm
18
Visualizing the interface using von Mises stresses provided an overview of these combined
effects. Maximum von Mises stresses and their locations were recorded for each configuration.
Although units of MPa were recorded for von Mises stresses, these values could only be
compared relative to each other due to the generic leg geometry and material models that were
used.
4.3.1.2 Results
Von Mises contour plots were used to visualize the distribution of stresses along the brace-leg
interface. Figure 4.4 demonstrates two of these contour plots. Plots for all lengths are given in
Appendix A. Stresses were reported in default units of thousands of pounds per square inch (ksi)
and converted into MPa. However, because this model used generic two-dimensional geometry
with approximated material properties, the resulting values are only be interpreted comparatively
within this study.
19
Figure 4.4: Contour colourmaps of von Mises stresses (shown in ksi) resulting from planar
simulation. Two length ratios shown: 0.05 (top) and 0.99 (bottom)
Investigation with this model focussed primarily on the stresses in the leg directly immediately at
and below the interface with the brace. The maximum von Mises stress and its location were
recorded for each segment length.
20
Table 4.1: Summary of maximum von Mises Stresses in planar simulations, categorized by length
ratio of lower-calf line coverage
% Segment Covered Maximum 𝝈𝑽𝑴 [Mpa] Maximum Stress Location
5 1.87 Anterior Surface
10 1.80 Anterior Surface
20 1.14 Anterior Surface
30 1.14 Anterior Surface
40 0.996 Anterior Surface
50 0.862 Both anterior and posterior
surfaces
75 1.02 Posterior Surface
80 1.11 Posterior Surface
99 1.48 Posterior Surface
4.3.2 Prototype Development
4.3.2.1 Methods
4.3.2.1.1 Design Model for Prototyping
Design of the prototypes began with a design space model to describe the relationship among
concepts. A situated function-behaviour-principle-system-state (FBPSS) model44 summarizes the
requirements of a prototype knee brace. The FBPSS model was selected for the knee brace
because it defines the design space in a way that is easily translated to numerical models (i.e.
finite element models) and topographical and parametric optimization, all of which have already
proven to be useful tools for studying mechanical interfaces. The FBPSS was applied to design a
prototype brace for testing that could then be adapted into a complete knee brace with its own
loading mechanism. This perspective on the design resulted in a design space that included
additional functionality for quick changes to configuration and pressure measurement that may
differ from or be excluded from a design space for a production knee brace.
21
Table 4.2: Summary of FBPSS Design Model
Model Component Definition Application to Knee Brace
Function
That which must be
accomplished; the required
transforms of energy and material
1) To sustain tensile load and
transfer it to the human body
2) To be donned and removed by
the wearer (with assistance)
System
The structure, boundaries, and
components that define the
design space
Minimum of two components: 1)
Bounded by the shape of the
wearer's body at contact surface
2) One boundary must have a fixed
pattern to interface with other
machinery
State
The quantities that define the
system's way of existing; used in
principle and behaviour
equations.
1) Internal stresses/loads
2) Interface force (at human
boundary)
3) Applied force (at standard
boundary)
4) Geometry (brace coverage)
Principle The chief concept that governs
the system's performance
Static equilibrium of forces acting
at the system boundary
Behaviour
Response of the system to
stimulus (changes in state
variables)
1) Distribution of forces at human
interface
2) Deformation of the brace and
human boundary
This model was an important tool for the comparison of different designs, and for interpreting
the performance of different configurations of the same design during testing.
22
4.3.2.1.2 Design Iterations
4.3.2.1.2.1 Iteration 1 – Extruded Foam
The first prototype design that rose from the FBPSS model used extruded foam blocks as a
building material. Blanks were machined from this foam to a common pattern that fit between
the jaws of a testing system with an accommodating bolt pattern. The radius of the blocks was
such that the interior could be machined to fit a wearer’s leg. Changes in brace length were
accomplished by stacking and bolting together sections of foam. An off-the-shelf drawer liner
was used to pad the interior of these braces and provide higher coefficients of friction against the
wearer’s skin.
Figure 4.5: Prototype foam knee brace
The primary shortcoming of this design was in the expense required for customizing the shape to
the wearer's leg. Ideally, computer numerical control (CNC) machining would be used to remove
material from the foam blanks but this process proved costly and difficult. Similarly, producing
die for moulding the foam was expensive due to the size of the die required. In testing, hand-
fabrication was effective but slow and required a model of the wearer's leg to be freely available
for fitting. Additional problems with this design included destructive wear on the foam and
To test system
Machined foam semi-circle
Corrugated liner
23
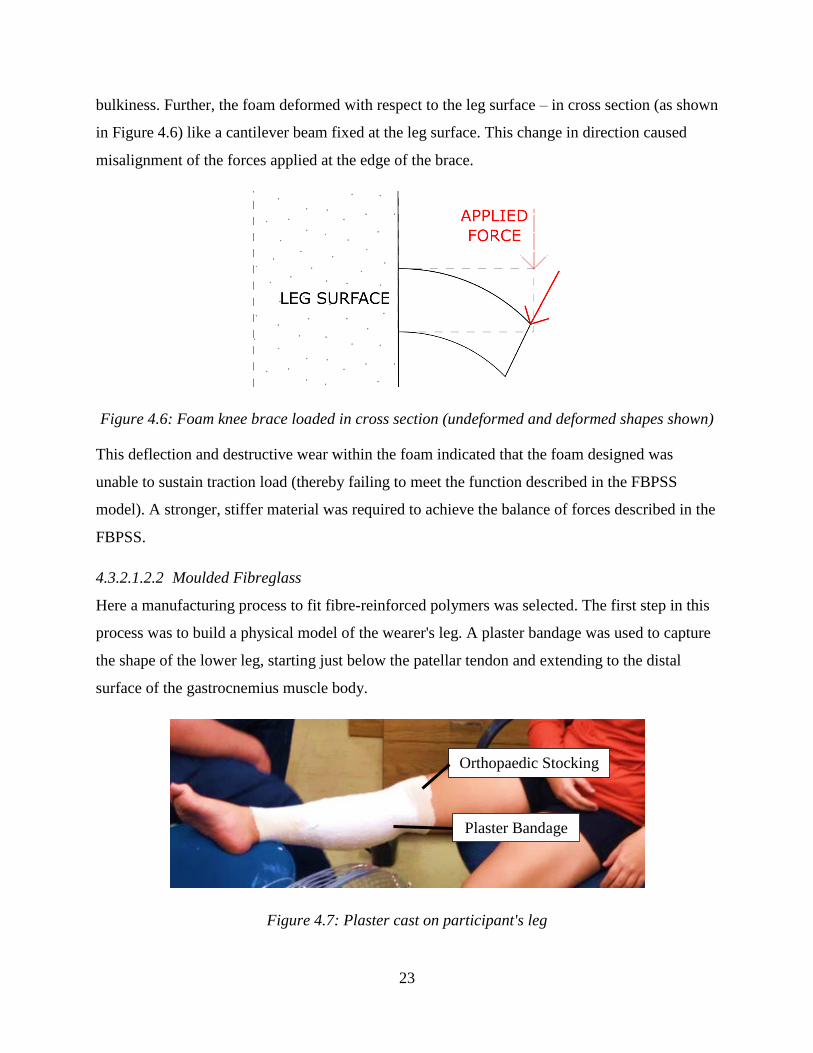
bulkiness. Further, the foam deformed with respect to the leg surface – in cross section (as shown
in Figure 4.6) like a cantilever beam fixed at the leg surface. This change in direction caused
misalignment of the forces applied at the edge of the brace.
Figure 4.6: Foam knee brace loaded in cross section (undeformed and deformed shapes shown)
This deflection and destructive wear within the foam indicated that the foam designed was
unable to sustain traction load (thereby failing to meet the function described in the FBPSS
model). A stronger, stiffer material was required to achieve the balance of forces described in the
FBPSS.
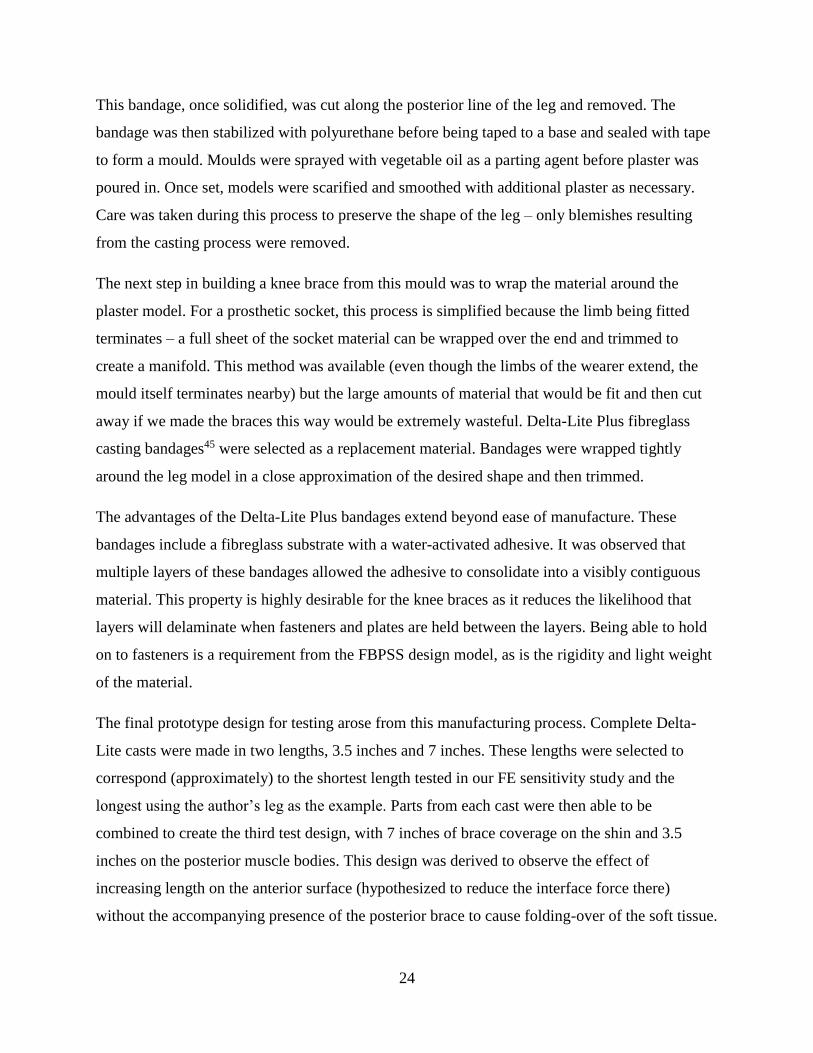
4.3.2.1.2.2 Moulded Fibreglass
Here a manufacturing process to fit fibre-reinforced polymers was selected. The first step in this
process was to build a physical model of the wearer's leg. A plaster bandage was used to capture
the shape of the lower leg, starting just below the patellar tendon and extending to the distal
surface of the gastrocnemius muscle body.
Figure 4.7: Plaster cast on participant's leg
Plaster Bandage
Orthopaedic Stocking
24
This bandage, once solidified, was cut along the posterior line of the leg and removed. The
bandage was then stabilized with polyurethane before being taped to a base and sealed with tape
to form a mould. Moulds were sprayed with vegetable oil as a parting agent before plaster was
poured in. Once set, models were scarified and smoothed with additional plaster as necessary.
Care was taken during this process to preserve the shape of the leg – only blemishes resulting
from the casting process were removed.
The next step in building a knee brace from this mould was to wrap the material around the
plaster model. For a prosthetic socket, this process is simplified because the limb being fitted
terminates – a full sheet of the socket material can be wrapped over the end and trimmed to
create a manifold. This method was available (even though the limbs of the wearer extend, the
mould itself terminates nearby) but the large amounts of material that would be fit and then cut
away if we made the braces this way would be extremely wasteful. Delta-Lite Plus fibreglass
casting bandages45 were selected as a replacement material. Bandages were wrapped tightly
around the leg model in a close approximation of the desired shape and then trimmed.
The advantages of the Delta-Lite Plus bandages extend beyond ease of manufacture. These
bandages include a fibreglass substrate with a water-activated adhesive. It was observed that
multiple layers of these bandages allowed the adhesive to consolidate into a visibly contiguous
material. This property is highly desirable for the knee braces as it reduces the likelihood that
layers will delaminate when fasteners and plates are held between the layers. Being able to hold
on to fasteners is a requirement from the FBPSS design model, as is the rigidity and light weight
of the material.
The final prototype design for testing arose from this manufacturing process. Complete Delta-
Lite casts were made in two lengths, 3.5 inches and 7 inches. These lengths were selected to
correspond (approximately) to the shortest length tested in our FE sensitivity study and the
longest using the author’s leg as the example. Parts from each cast were then able to be
combined to create the third test design, with 7 inches of brace coverage on the shin and 3.5
inches on the posterior muscle bodies. This design was derived to observe the effect of
increasing length on the anterior surface (hypothesized to reduce the interface force there)
without the accompanying presence of the posterior brace to cause folding-over of the soft tissue.
25
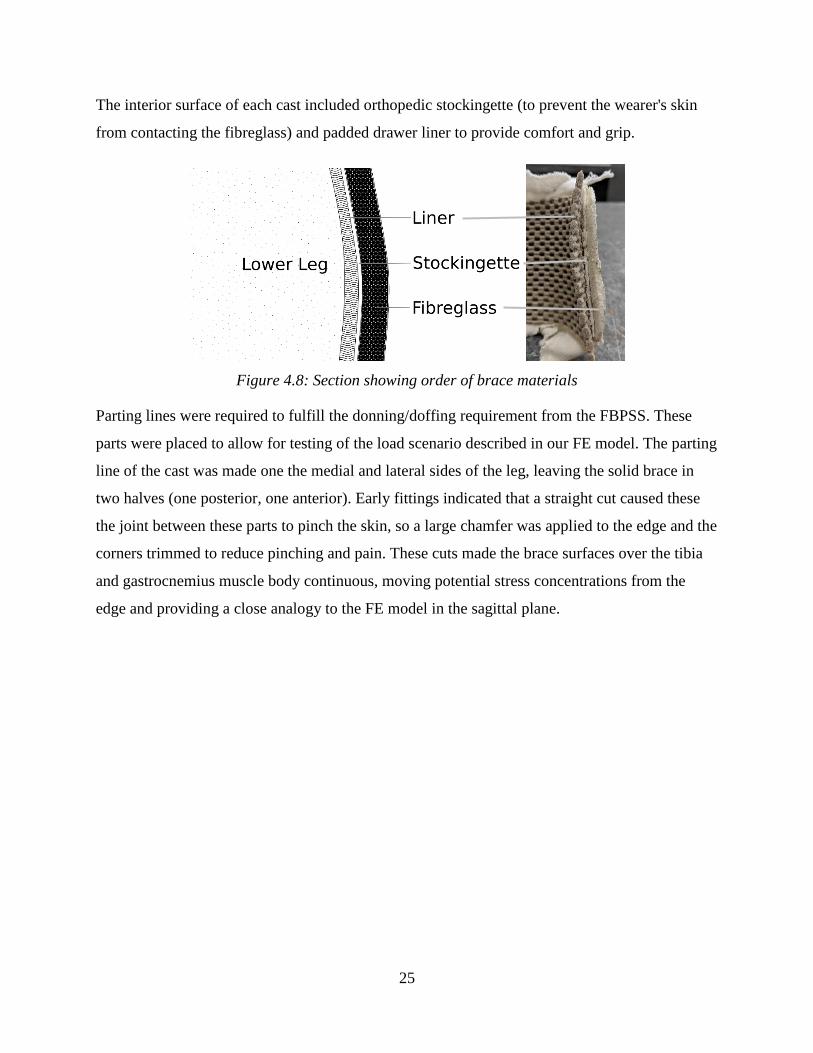
The interior surface of each cast included orthopedic stockingette (to prevent the wearer's skin
from contacting the fibreglass) and padded drawer liner to provide comfort and grip.
Figure 4.8: Section showing order of brace materials
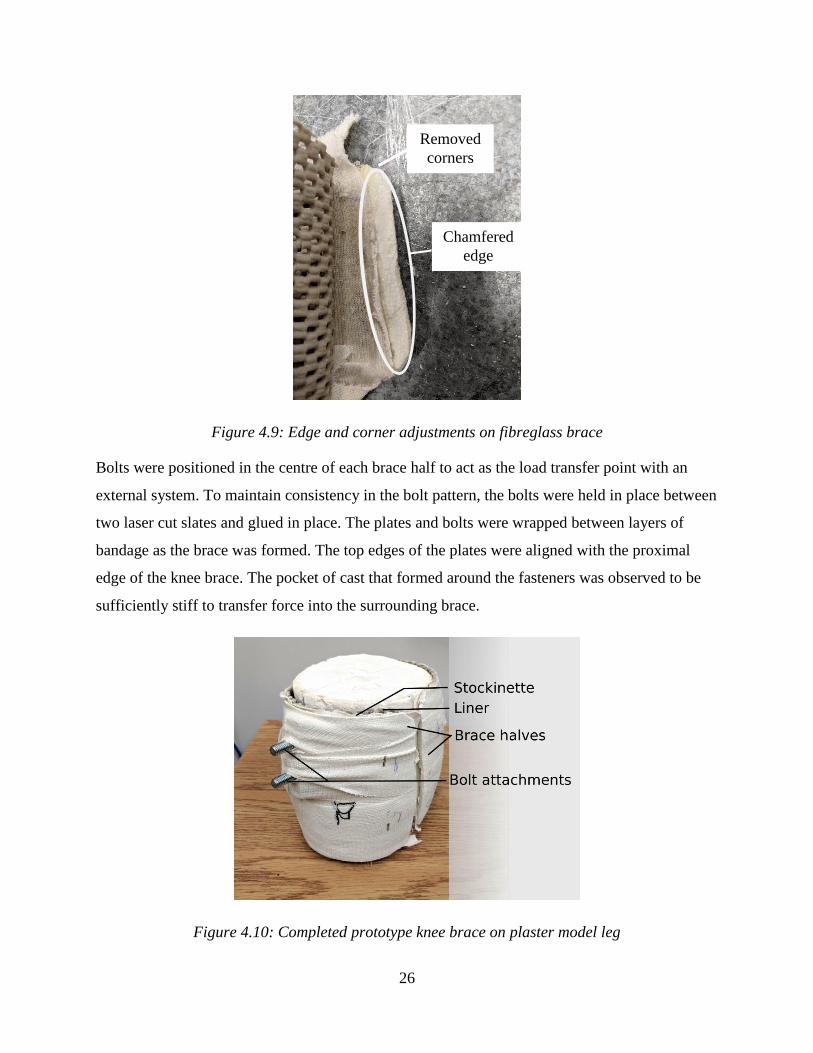
Parting lines were required to fulfill the donning/doffing requirement from the FBPSS. These
parts were placed to allow for testing of the load scenario described in our FE model. The parting
line of the cast was made one the medial and lateral sides of the leg, leaving the solid brace in
two halves (one posterior, one anterior). Early fittings indicated that a straight cut caused these
the joint between these parts to pinch the skin, so a large chamfer was applied to the edge and the
corners trimmed to reduce pinching and pain. These cuts made the brace surfaces over the tibia
and gastrocnemius muscle body continuous, moving potential stress concentrations from the
edge and providing a close analogy to the FE model in the sagittal plane.
26
Figure 4.9: Edge and corner adjustments on fibreglass brace
Bolts were positioned in the centre of each brace half to act as the load transfer point with an
external system. To maintain consistency in the bolt pattern, the bolts were held in place between
two laser cut slates and glued in place. The plates and bolts were wrapped between layers of
bandage as the brace was formed. The top edges of the plates were aligned with the proximal
edge of the knee brace. The pocket of cast that formed around the fasteners was observed to be
sufficiently stiff to transfer force into the surrounding brace.
Figure 4.10: Completed prototype knee brace on plaster model leg
Removed
corners
Chamfered
edge

27
4.4 Discussion
4.4.1 FE Model
Planar elements were used to simulate a generic lower leg interacting with a rigid knee brace at a
constant traction load. Up to 50% coverage of the lower calf line, maximum von Mises stresses
at the brace interface reduced as brace length increased. These stresses were concentrated at the
distal edge of the brace. This distribution pattern is likely the result of a moment created by the
offset of the traction load from the surface of the leg, which also explains the reduction in stress
at the distal end as the brace length increased. Beyond 50% coverage of the lower calf line,
maximum von Mises stresses began to increase. Peak stresses initially occurred at the anterior
surface of the leg, transferring to the posterior surface as the brace approached full coverage. It
was observed that stress concentrations still occurred at the anterior surface of the leg – peak
stresses in the posterior surface appeared to be the result of “folding-over” of the calf muscle
(visible in Figure 4.4).
The results from this simple FE study also influenced understanding of how a rigid knee brace
would function. Observed deformation and stress patterns indicated that the muscle body of the
gastrocnemius (calf muscle) carried significant load and “pulled” along with the brace. In this
case, the brace is pulling on the muscle body much in the way that physiotherapists would when
applying traction with their hands. This pattern highlights the importance of the muscle body in
carrying load although the peak stresses occurred over the tibia.
The conclusions of the FE analysis are limited because there is no validation for the quantities. It
is well-established that there is a relationship between the surface pressure applied to a tissue and
the pain felt, typically described as the Pressure Pain Threshold (PPT). These relationships are
location-dependent and highly variable although lower stresses are generally more comfortable43.
In this simulation, the different brace lengths can only be compared relative to each other and not
in terms of an absolute estimate of wearer comfort. Despite this limitation, the patterns observed
provided a hypothesis for physical testing. It was hypothesized that a longer brace would result
in lower interface pressures and greater user comfort. This study also piqued interest in studying
asymmetrical braces – that is, a brace that is longer in the front than it is in the back. It was
hypothesized that such a brace may reduce the peak pressure felt by the wearer on the tibia while
covering less skin overall (reducing concerns with ventilation, weight, and form factor).
28
However, it was hypothesized that an asymmetrical brace would compromise comfort for these
benefits.
4.4.2 Prototype development
Prototype development indicated that the bandage-cast fibreglass prototype design satisfies the
design model set out in the FBPSS. The two-piece design had strong components to transfer load
into the body, meeting the functional requirement with sufficient stiffness and strength to balance
the state. This design helped ensure customization to each wearer's body while maintaining a
standard bolt pattern for attachment to a testing system. By combining brace halves of different
lengths, this design method had potential to be used to test multiple brace configurations.
One important improvement made through iterative design of the knee brace was the addition of
the friction liner to the cast fibreglass. Early prototypes were not able to sustain even low loads
without slipping down the surface of the lower leg. The addition of this liner allows the brace to
fixate on the leg, more closely approximating the idealized boundary conditions of the FE model.
The main limitation on this design is its dynamic fit – as a wearer moves, the muscle body will
change shape. Future work on this design could be to provide splits or areas of thinner material
with higher compliance that could flex with the body during gait. However, the first tests on this
prototype were be static tests that do not include muscle flexion.
29
5 Lower Leg Brace Testing
5.1 Introduction
The purpose of this study was to fulfill Objective 2 and test a lower leg traction/distraction knee
braces for effectiveness, measured in terms of wearer comfort and ability to bear load. The
interface forces for these braces were also investigated. This chapter details a pilot test for
measuring these factors in a small sample (n=7) of healthy participants with three brace lengths
(3”, 7” and a mixed design). Braces were manufactured to match each participant's right leg, and
were tested by applying load with a cable which pulled the lower leg away from the body.
5.2 Methods
5.2.1 Participants
Nine participants were initially recruited from among the graduate students and faculty of the
Colleges of Engineering and Kinesiology at the University of Saskatchewan (aged 25 ± 6 years).
Participants were required to be over the age of twenty to prevent damage to growth plates in the
knee as load was applied. The only other criterion for exclusion was a history of knee injury or
surgery within the previous 12 months. Of the 9 participants, 3 were female and 6 were male.
These participants were recruited verbally at group meetings with the approval of the University
of Saskatchewan Research Ethics Board.
Each participant had an initial appointment during which their leg shape was captured using a
plaster cast (previously discussed in Chapter 4). Using a plaster model made using these casts,
two sets of brace components were manufactured per participant. Brace lengths were
standardized across participants – 3.5” (nominally known as the 3” brace for note-taking clarity)
and 7”. These lengths corresponded approximately to length ratios of 0 and 1 (maximum and
minimum length) from the FE simulation when fit to a sample leg. The mixed design was
derived from these components.
5.2.2 Apparatus
The loading apparatus for this study was adapted from previous works in physiotherapy which
provided traction load to OA patients. In the original study, a soft greave was placed around the
patients' lower legs and was connected to a cable. The cable was passed through a pulley with
weights suspended from the end to apply a continuous force to the leg12. This system was
30
selected to be adapted as it allowed the person being tested to sit or lie down in relative comfort
while the load was applied.
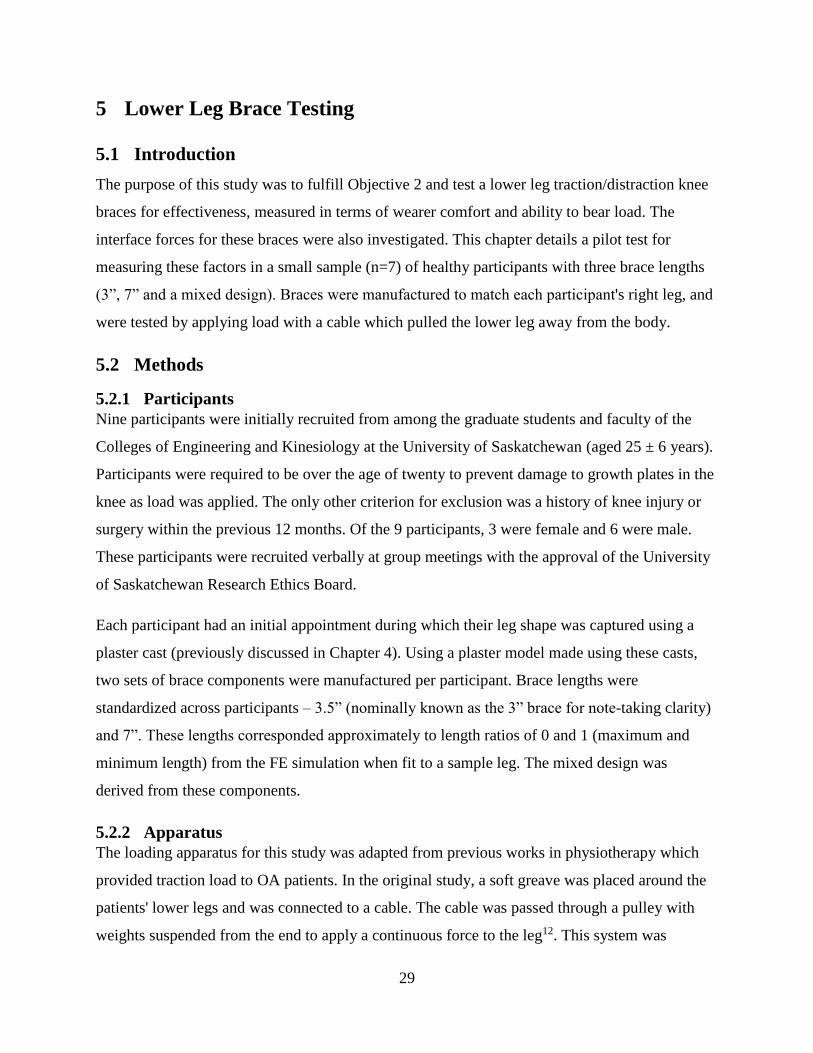
The concept of using a cable in tension to pull the lower leg away from the body was adapted for
this study with several adjustments. The soft greave was replaced with the knee brace being
tested. As a result, the cable could not simply wrap around the leg. As such, a metal frame
(shown in Figure 5.2) was built to connect the knee brace to the connecting cable.
Figure 5.1: Frame and cable apparatus
This metal frame supported preload to the knee brace as it connected to the embedded bolts in
the knee brace. Two threaded rods joined the butterfly plates with nuts that were tightened with
the brace and wearer's leg inside, aligned by the two fasteners embedded in the brace. The
compression of these two plates with the brace and leg in between provided the force that closed
and compressed the brace, thereby adhering it to the leg. The rest of the frame was also
connected to these rods, pivoting in place but supported by nuts that could be adjusted to ensure
alignment with the midplane of the leg. The rest of the frame was composed of simple bars and

31
bolts. If the alignment of this bar with the participant's leg required the bars to realign, tape was
used to gently hold the cable loop in place.
This study required increasing tension in the cable so an alternative to hanging weights was
sought amid concerns that accidentally dropping weights could cause overloading (and thus
injury) of the knee. To address this concern, the cable was attached to a turnbuckle which was
then connected to a scale (to measure the applied force) and a fixed post. A shear pin was
included at the connection between the cable and turnbuckle to release tension in case of an
overload. A diagram of the apparatus is demonstrated in Figure 5.3. The tensile force was
generated by shortening the turnbuckle, which pulled through the frame connected to the knee
brace.
Figure 5.2: Arrangement of apparatus during test
5.2.2.1 Interface Force Sensors
Eight Tekscan FlexiForce A502 flexible force sensors were used to measure the forces between
the knee brace surface and the participant's leg. These sensors were piezoelectric resistors that
change impedance when strained. Changes in voltage as a result of this changing impedance
were measured using a MCP6004 comparator operational amplifier. A comparison voltage of
0.125V and a feedback resistor of 1MΩ were used in this circuit to achieve the desired force
sensitivity range.
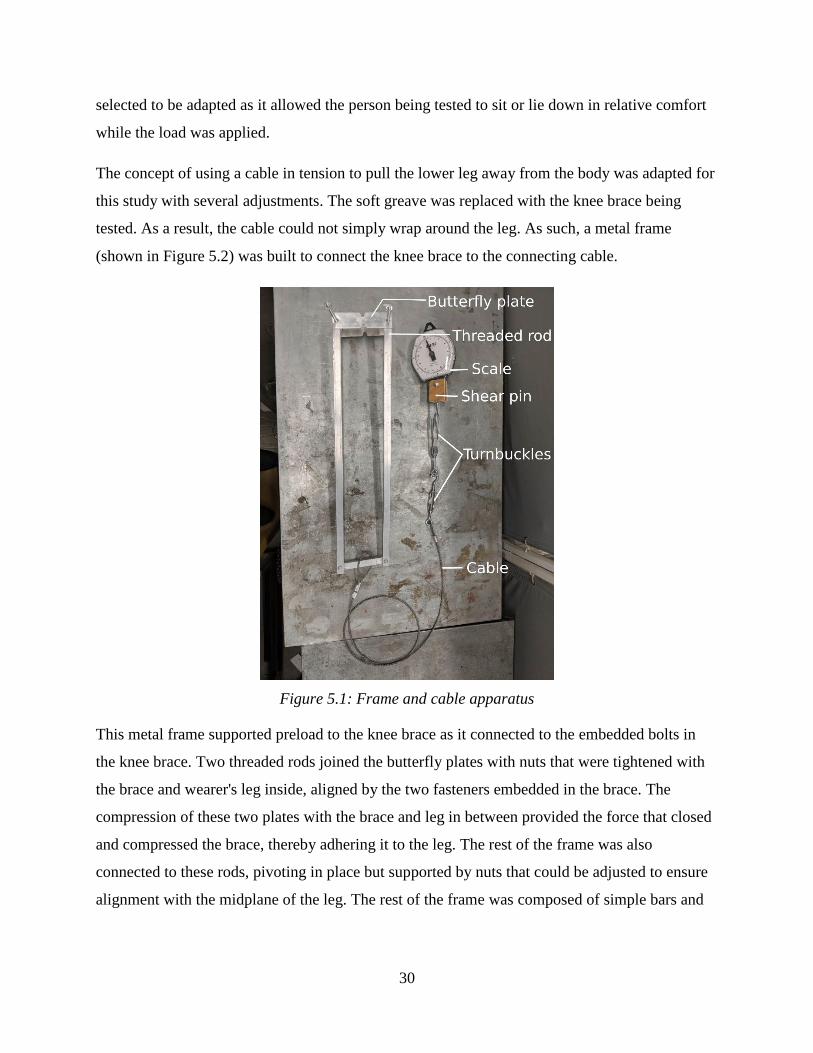
The leg surface was divided into eight sectors, each with a sensor measuring the peak force over
a 4in2 area within the sector. The surface of the leg was divided into quadrants by drawing two
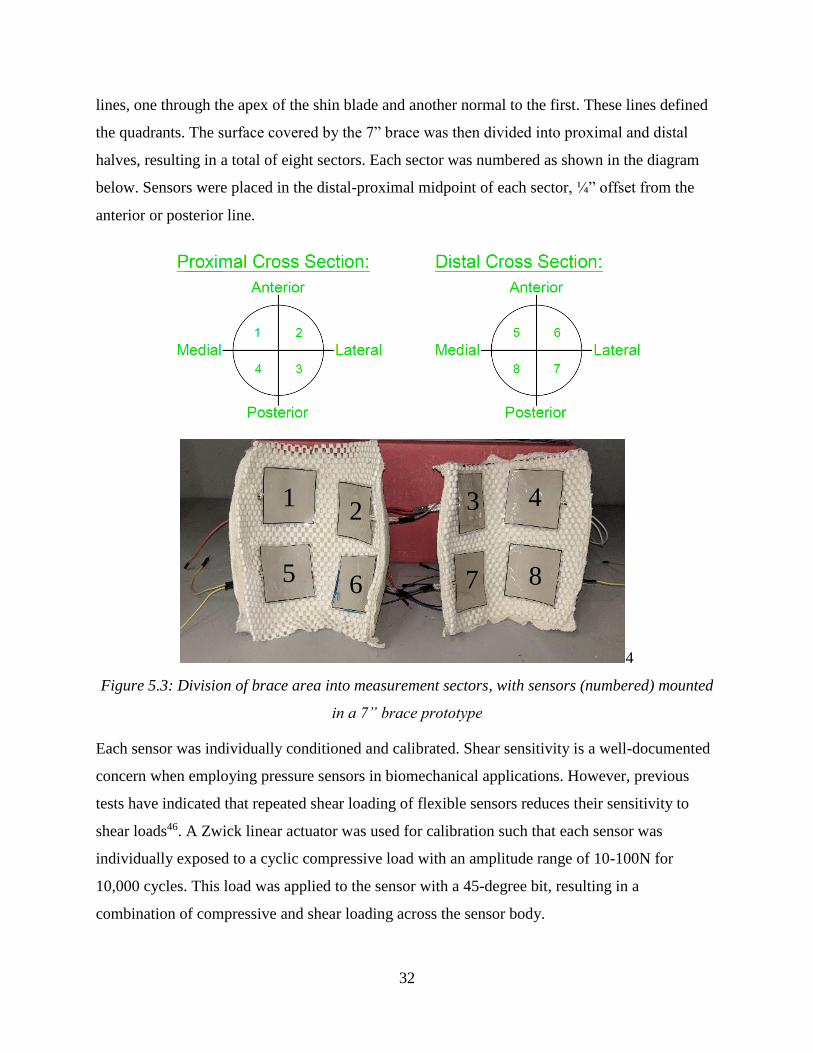
32
lines, one through the apex of the shin blade and another normal to the first. These lines defined
the quadrants. The surface covered by the 7” brace was then divided into proximal and distal
halves, resulting in a total of eight sectors. Each sector was numbered as shown in the diagram
below. Sensors were placed in the distal-proximal midpoint of each sector, ¼” offset from the
anterior or posterior line.
4
Figure 5.3: Division of brace area into measurement sectors, with sensors (numbered) mounted
in a 7” brace prototype
Each sensor was individually conditioned and calibrated. Shear sensitivity is a well-documented
concern when employing pressure sensors in biomechanical applications. However, previous
tests have indicated that repeated shear loading of flexible sensors reduces their sensitivity to
shear loads46. A Zwick linear actuator was used for calibration such that each sensor was
individually exposed to a cyclic compressive load with an amplitude range of 10-100N for
10,000 cycles. This load was applied to the sensor with a 45-degree bit, resulting in a
combination of compressive and shear loading across the sensor body.
1 2
5 6
3 4
7 8
33
Sensors were further conditioned with static loads as per manufacturer guidelines before every
test. Each sensor was individually calibrated using the Tekscan procedure of applying static
loads and fitting a curve to the resulting voltages. Calibration was performed on a curved foam
insert with the same liner material as the braces to best approximate the intended application.
Either a ratio of polynomials or power-law relationship was fitted to the response of an
individual sensor to provide a relationship between output voltage and force.
5.2.3 Test Procedure
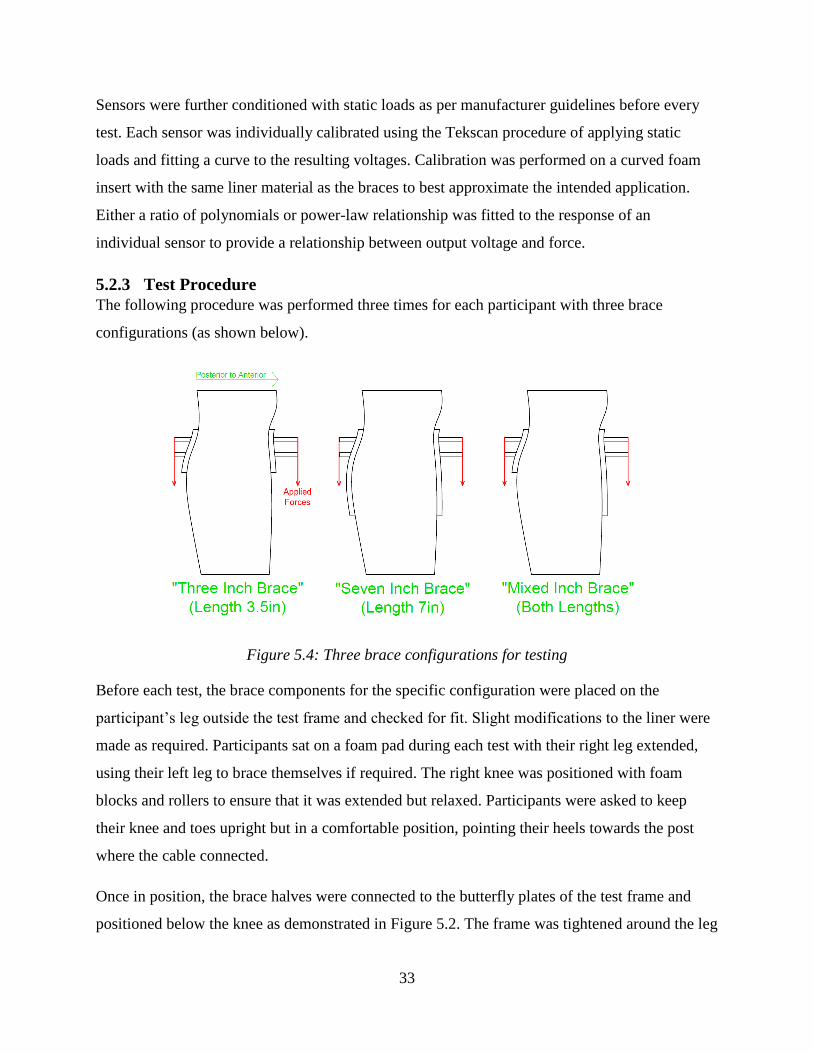
The following procedure was performed three times for each participant with three brace
configurations (as shown below).
Figure 5.4: Three brace configurations for testing
Before each test, the brace components for the specific configuration were placed on the
participant’s leg outside the test frame and checked for fit. Slight modifications to the liner were
made as required. Participants sat on a foam pad during each test with their right leg extended,
using their left leg to brace themselves if required. The right knee was positioned with foam
blocks and rollers to ensure that it was extended but relaxed. Participants were asked to keep
their knee and toes upright but in a comfortable position, pointing their heels towards the post
where the cable connected.
Once in position, the brace halves were connected to the butterfly plates of the test frame and
positioned below the knee as demonstrated in Figure 5.2. The frame was tightened around the leg

34
until the brace was firm and the liner visibly compressed (typically until the nuts were hand-
tight). If required for the longer braces, an additional strap was placed around the distal sectors of
the brace to ensure full contact. The brace was considered fully closed when the joints of the
brace were approximately in the manufactured position. With the brace in place, the first
measurements were taken before the cable was connected and load applied.
Participants self-reported their discomfort verbally. An 11-point Likert scale from 0 to 10, also
known as the Numerical Rating Scale (NRS), was used. Patients were instructed in the use of this
scale, zero being no pain at all and 10 being the worst pain imaginable47; a rating of 2
corresponding to a skinned knee or stubbed toe; and a rating of 7 was determined to be greater
pain than one would anticipate in their daily life (e.g. crushing a finger in a machine). At each
load increment participants were asked to use this scale to report their discomfort while force
readings were taken.
Electrical leads from each sensor passed through small holes in the brace, allowing the
comparator circuit to be connected to each force sensor in turn. Leads were colour-coded to
ensure measurements were related to the correct sensor. A Diligent Analog Discovery Module
(ADM) and Waveforms software48 were used to power the comparator circuit while
simultaneously reading the voltage across the sensor. At each load increment, the oscilloscope
channels of the ADM were connected to every set of leads and the cursor function was used to
determine the output voltage, which was then recorded in a spreadsheet with the verbally-stated
NRS score for that increment.
Both measurements (discomfort and interface force) were taken at the outset of the test. Once
complete, the cable was connected to the turnbuckle and scale and force applied to the cable.
Throughout the test, load was increased by closing the turnbuckle, increasing the tension in the
cable in increments of 3kgf (29.4N). However, the first non-zero increment of 3kgf was not used
as this little force was not large enough to suspend the cable and ensure distribution into the
aluminum frame. Once the load was set, NRS and force sensor measurements were taken. The
scale reading was observed intermittently during measurements to ensure that slight movements
by the participant did not reduce the tension in the cable. As measurements were taken,
participants were free to give qualitative feedback on their perception of the brace (the location
35
of pressure points, comfort of one brace relative to the other, etc.) which was also recorded. This
process continued until a limit was reached that would end the test.
There were multiple conditions that could result in the end of a test. First, participants could
choose to end the test at any point if they became too uncomfortable and did not wish to
continue. Second, there were limits on how much force could be applied regardless of wearer
discomfort. The first “soft” limit that was consistently striven for was one-third the participant’s
bodyweight. If this limit was reached and the participant wished to continue, the test would
proceed until the applied force was equal to one-half their bodyweight. One-half was the
maximum force that could be applied during the test. The third condition that would conclude the
test was if the patient reported a NRS of 7, which was deemed too high for this pilot study.
Finally, it was observed that some circulation loss may occur at high loads. If discolouration of
the skin was visibly detected (as shown in Figure 5.5), the test was immediately concluded.
Figure 5.5: Example of discolouration due to loss of circulation
Once one of the end conditions was met, the force was released from the turnbuckle and the
brace was removed from the participant’s leg. Participants were encouraged to rise from the table
and walk around the lab to restore circulation and relax their muscles between tests. A standard
break length of 5 minutes was recommended to participants but they were encouraged to walk
and stretch as long as necessary for the leg to feel normal. Once the participant was ready, the
next test began.
Normal Colour Discolouration

36
5.2.4 Analysis
5.2.4.1 Self-Reported Pain
Patient-reported Numerical Rating Scale (NRS) scores for each brace were investigated using an
analysis of covariance (ANCOVA) with a significance level of p = 0.05 via ISPSS statistics
software. This analysis compared the pain scores among brace designs. Applied load (F) was
included as a covariate affecting pain scores. This test assumed no interaction among the brace
species and applied loads, i.e. regression lines drawn through all three populations on F-NRS
plots are the same. This assumption was tested using the LMATRIX function in SPSS to run
one-to-one comparisons of the slopes of each regression curve to each other.
5.2.4.2 Interface Force Profiles
Interface force measurements were grouped by brace species, applied load, and sector. Interface
force profiles were plotted by sector for each load step. In these profiles, the load for each sector
was averaged among participants and plotted as a radial bar with the other sectors.
The maximum interface force among all sectors of a brace was determined for every participant
at every load step. This maximum interface force was compared to the self-reported pain for each
load step. Pearson correlation coefficient was used to test for a relationship between maximum
interface force and wearer-reported pain with a significance level of p = 0.05.
5.3 Results
5.3.1 Participant Inclusion
Of the nine healthy volunteers initially recruited for this study, one male participant withdrew
due to a psychosomatic event (fainting) during the test. This event was reported to the University
of Saskatchewan Research Ethics Board. After review, the Board approved continuation of this
study.
One other male participated in all three tests but his data was excluded due to brace failure in two
of his three tests. The mixed and 7-inch brace were tightened for this participant using the same
criteria as the others, but the braces slipped off at low loads. This was attributed to a
“smokestack-shaped” lower leg with little curvature. Attempts to tighten the braces any further
were unattainable without alteration to the brace design, resulting in the exclusion of this
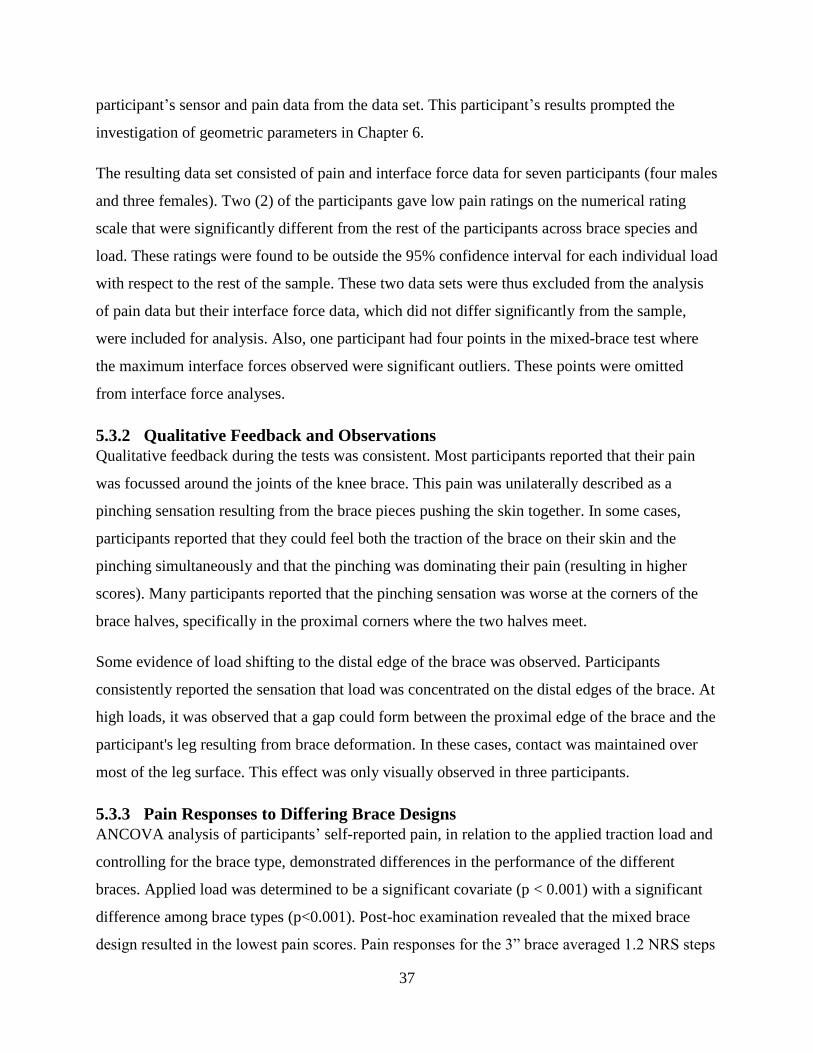
37
participant’s sensor and pain data from the data set. This participant’s results prompted the
investigation of geometric parameters in Chapter 6.
The resulting data set consisted of pain and interface force data for seven participants (four males
and three females). Two (2) of the participants gave low pain ratings on the numerical rating
scale that were significantly different from the rest of the participants across brace species and
load. These ratings were found to be outside the 95% confidence interval for each individual load
with respect to the rest of the sample. These two data sets were thus excluded from the analysis
of pain data but their interface force data, which did not differ significantly from the sample,
were included for analysis. Also, one participant had four points in the mixed-brace test where
the maximum interface forces observed were significant outliers. These points were omitted
from interface force analyses.
5.3.2 Qualitative Feedback and Observations
Qualitative feedback during the tests was consistent. Most participants reported that their pain
was focussed around the joints of the knee brace. This pain was unilaterally described as a
pinching sensation resulting from the brace pieces pushing the skin together. In some cases,
participants reported that they could feel both the traction of the brace on their skin and the
pinching simultaneously and that the pinching was dominating their pain (resulting in higher
scores). Many participants reported that the pinching sensation was worse at the corners of the
brace halves, specifically in the proximal corners where the two halves meet.
Some evidence of load shifting to the distal edge of the brace was observed. Participants
consistently reported the sensation that load was concentrated on the distal edges of the brace. At
high loads, it was observed that a gap could form between the proximal edge of the brace and the
participant's leg resulting from brace deformation. In these cases, contact was maintained over
most of the leg surface. This effect was only visually observed in three participants.
5.3.3 Pain Responses to Differing Brace Designs
ANCOVA analysis of participants’ self-reported pain, in relation to the applied traction load and
controlling for the brace type, demonstrated differences in the performance of the different
braces. Applied load was determined to be a significant covariate (p < 0.001) with a significant
difference among brace types (p<0.001). Post-hoc examination revealed that the mixed brace
design resulted in the lowest pain scores. Pain responses for the 3” brace averaged 1.2 NRS steps
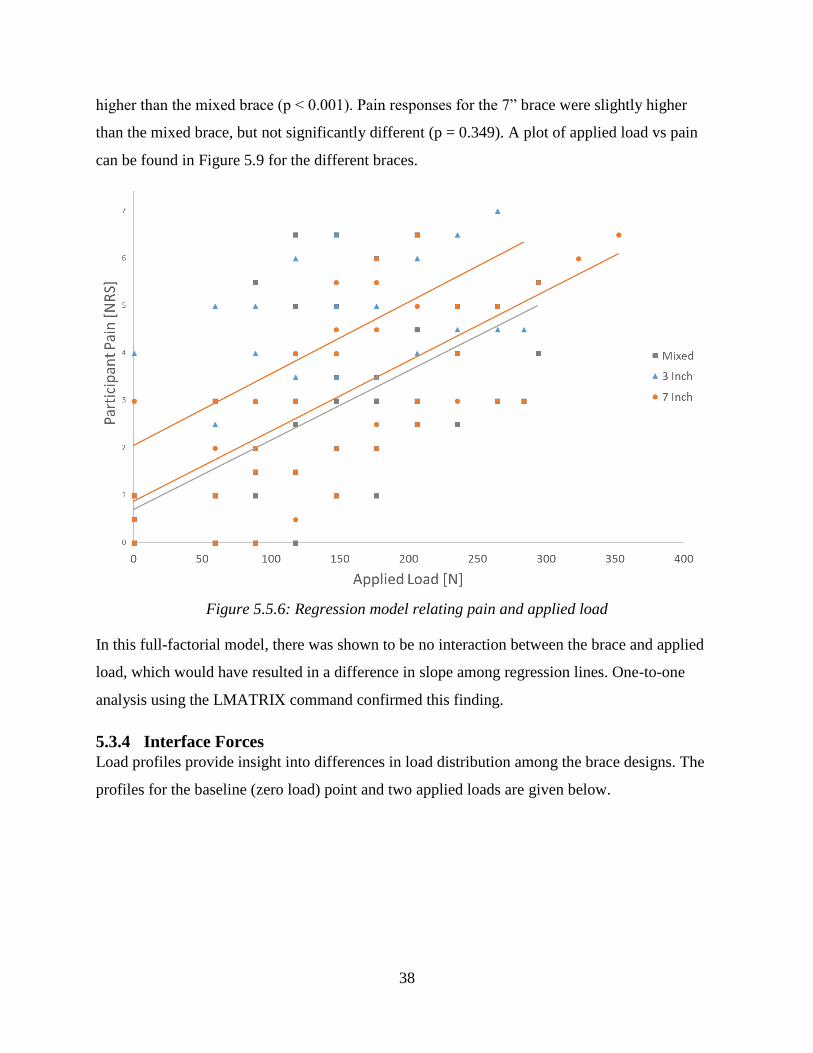
38
higher than the mixed brace (p < 0.001). Pain responses for the 7” brace were slightly higher
than the mixed brace, but not significantly different (p = 0.349). A plot of applied load vs pain
can be found in Figure 5.9 for the different braces.
Figure 5.5.6: Regression model relating pain and applied load
In this full-factorial model, there was shown to be no interaction between the brace and applied
load, which would have resulted in a difference in slope among regression lines. One-to-one
analysis using the LMATRIX command confirmed this finding.
5.3.4 Interface Forces
Load profiles provide insight into differences in load distribution among the brace designs. The
profiles for the baseline (zero load) point and two applied loads are given below.
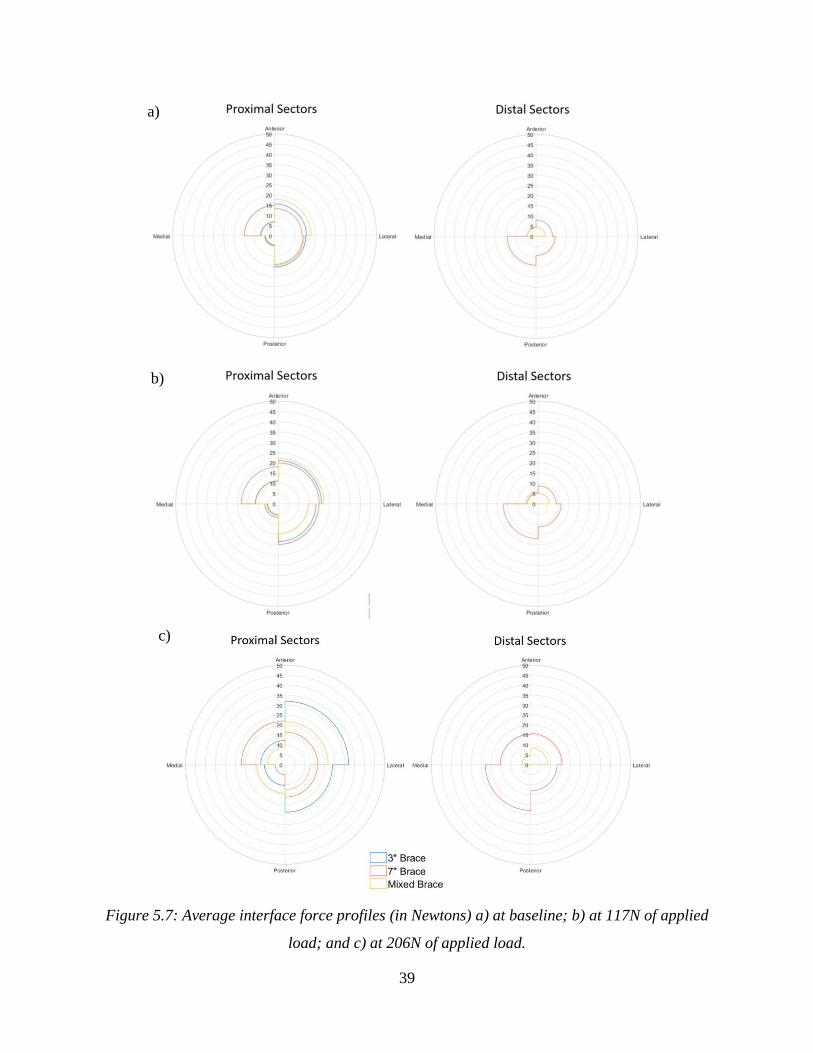
39
Figure 5.7: Average interface force profiles (in Newtons) a) at baseline; b) at 117N of applied
load; and c) at 206N of applied load.
a)
b)
c)

40
The baseline profile shows the average distribution of brace preload across the leg surface. The
profile for the 3” brace exists only in the proximal sector because this brace did not exist in any
of the distal sectors. Similarly, the profile does not exist for the mixed brace in the posterior
sectors of the distal profile. The baseline profile was compared with those corresponding to
117N and 206N loads. The 117N profile is the highest profile with data from every test (all
participants at all loads). The second profile for comparison to baseline was taken at a load of
206N, as this was the highest load for which there was a minimum of three readings for all
sensors. Qualitative comparison of these profiles shows increases in all sectors of the 3” brace
except the proximal-posterior-medial sector, which demonstrated a moderate increase overall.
Increases in interface force were modest for the 7” and mixed designs. The 7” brace appears to
carry more load in the distal sectors of the brace than the mixed brace.
Maximum interface forces for each load step were compared to self-reported pain across braces.
A plot demonstrating the relationship between these variables is demonstrated in Figure 5.11.
Each series has large variance in both pain and maximum interface force. No significant
correlations were found between pain and maximum interface force for any of the three brace
designs.
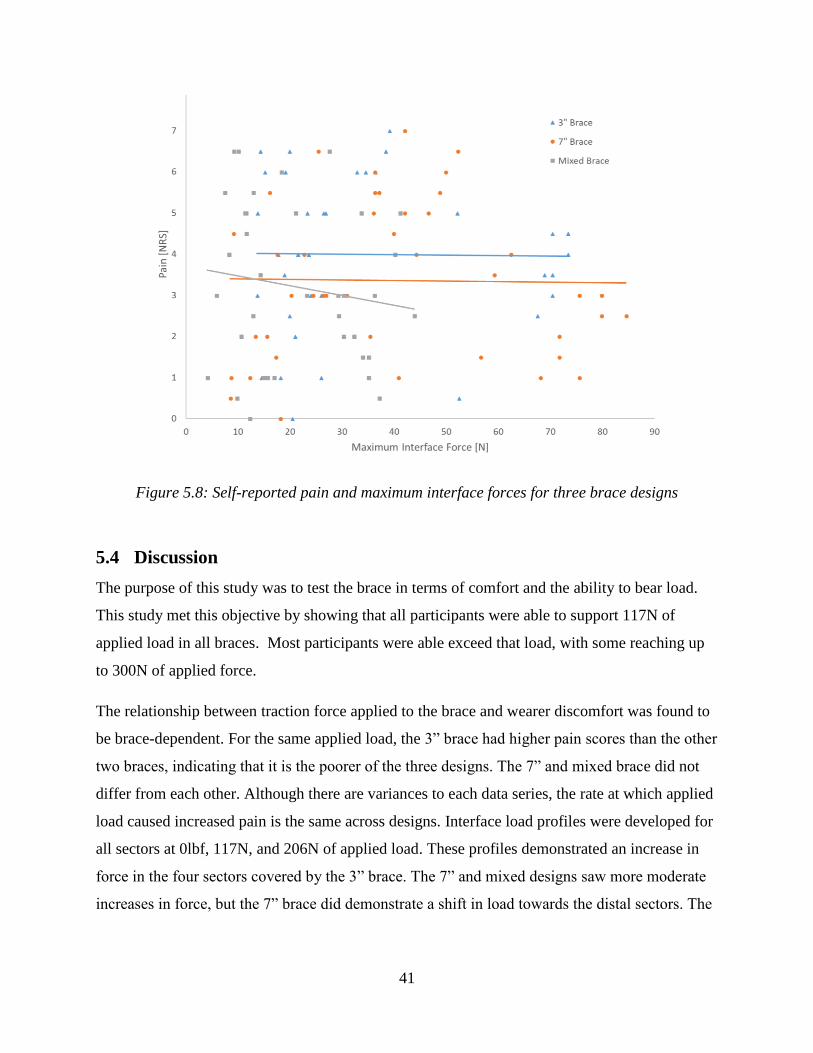
41
Figure 5.8: Self-reported pain and maximum interface forces for three brace designs
5.4 Discussion
The purpose of this study was to test the brace in terms of comfort and the ability to bear load.
This study met this objective by showing that all participants were able to support 117N of
applied load in all braces. Most participants were able exceed that load, with some reaching up
to 300N of applied force.
The relationship between traction force applied to the brace and wearer discomfort was found to
be brace-dependent. For the same applied load, the 3” brace had higher pain scores than the other
two braces, indicating that it is the poorer of the three designs. The 7” and mixed brace did not
differ from each other. Although there are variances to each data series, the rate at which applied
load caused increased pain is the same across designs. Interface load profiles were developed for
all sectors at 0lbf, 117N, and 206N of applied load. These profiles demonstrated an increase in
force in the four sectors covered by the 3” brace. The 7” and mixed designs saw more moderate
increases in force, but the 7” brace did demonstrate a shift in load towards the distal sectors. The

42
3” brace (the most uncomfortable) had large increases over few sectors, which would result in
interface pressures approaching pressure pain thresholds and cause greater discomfort.
Qualitative feedback from participants during the tests both confirmed findings from the design
phase of this study and provided new insight. The FE study described in Chapter 4 indicated a
stress concentration for all braces at the distal edges of the brace. Some participants described
feeling such a load concentration. However, the planar FE model could not predict the pain
concentration at the joints of the brace.
The interface force profiles provided some insight into these differences. At 206N of applied
force, the 3” brace carried larger loads in the proximal sectors than the 3” brace and the mixed
brace, which could distribute load lower onto the leg. However, due to variance in sensor data,
we were unable to detect a correlation between pain and maximum interface force.
Qualitative feedback from these tests suggests that different sensor locations may be required to
correlate interface forces and wearer pain. Participants reported that their pain was localized
around the edges of the brace. For this study, pressure sensors were located near the centre of
each brace half. Qualitative feedback suggest that sensors are needed near the edges of the brace
to measure the forces causing the perceived pain.
This study provides insight into factors that are important for the continued refinement of a rigid
lower-leg knee brace for traction loading. The consistency across metrics where the 3" brace has
higher interface forces and self-reported pain suggests that, if both are to be minimized, it is the
worst design.
To achieve distraction of the knee joint that can be observed on radiographs, the forces passing
through a knee brace will need to be greater than those applied in this pilot study. The
relationships found in this study and the qualitative feedback suggest that the brace designers
need to be cognizant of different ways of carrying load between the anterior and posterior
surfaces of the lower leg. Designers should strive to maximize the area of the anterior surface of
the lower leg that bears load, while being cognizant of the shape of the tissue on the posterior
surface. Balancing these factors will allow the knee brace to bear load and generate traction
comfortably.

43
One possible pathway to balance the design is to normalize the shape to the wearer’s leg. In this
study, fixed braces lengths were used across participants rather than assigning brace coverage
based on the lower-leg length of each participant. This extra step in the customization process
may allow future designers to better balance shape and size of the wearer’s leg with the required
distraction loads. Another possibility may be to normalize interface forces or pain responses to
parameters such as leg length or use bodyweight – such analysis was omitted from this
prospective study,
The primary limitation of this research is the size of the cohort for the pilot study. A small
sample size and high variability in the interface force limited the statistical significance of the
results. The resolution and location of the interface force scanning array was the other major
limitation on this study. The sensule area of the Tekscan sensors in this pilot study was 4 square
inches – sufficient to provide an idea of the distribution of force across the surface but attempts
to divide the output force by this total area would result in a considerable overestimation of the
pressure acting on that area. These sensors also did not cover the full area of the leg and did not
provide enough resolution to directly observe the transfer of load to the edges of the brace. These
sensors were, however, sufficient to show trends in the force distribution and differences among
the braces when plotted as average profiles. Sector-by-sector analysis of the force data indicated
these trends even if they did not reach statistical significance. In addition to the individual effects
of leg geometry, preload on the knee braces was standardized by relative position of the brace
and not the interface force measurements. Baseline differences in interface force may have
introduced additional variance in interface force measures, but the baseline interface forces were
not observed to differ greatly between participants during testing. This pilot study succeeded in
meeting the general objectives of identifying trends despite these limitations, while providing a
basis for more detailed study.
Sample size may have had an effect on the statistical significance of pain findings, in addition to
the varying end conditions imposed to ensure participant safety. The ANCOVA analysis
assumed that all pain scores were independent. In this study, each participant supplied a series of
pain scores, meaning that each scores are in fact dependent. Another analysis, specifically a
repeated measures ANOVA, could account for these within-subject effects. However, each
participant’s tests consisted of a different number of measurements depending on their

44
bodyweight and pain tolerance. A repeated measures ANOVA would require each participant to
provide a pain score at the same number of points (potentially reaching above pain or
bodyweight limitations).By assuming measurement independence, ANCOVA analysis allowed
data series of different lengths to be considered for each brace design.
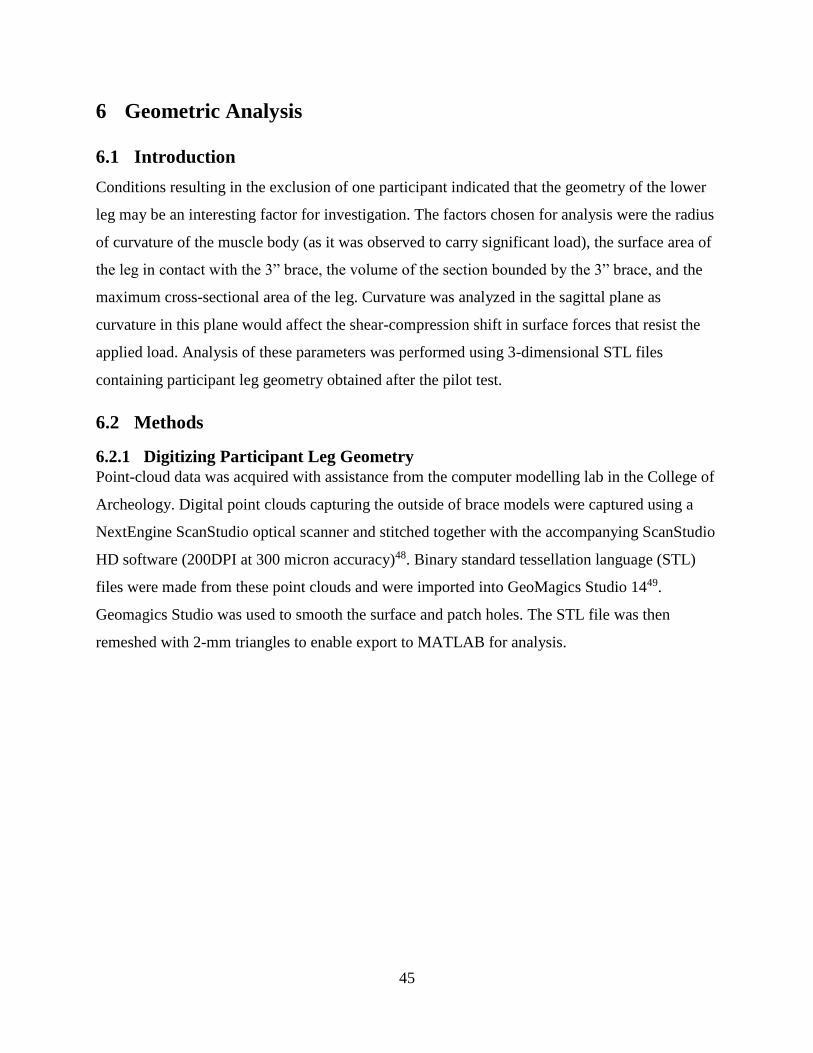
45
6 Geometric Analysis
6.1 Introduction
Conditions resulting in the exclusion of one participant indicated that the geometry of the lower
leg may be an interesting factor for investigation. The factors chosen for analysis were the radius
of curvature of the muscle body (as it was observed to carry significant load), the surface area of
the leg in contact with the 3” brace, the volume of the section bounded by the 3” brace, and the
maximum cross-sectional area of the leg. Curvature was analyzed in the sagittal plane as
curvature in this plane would affect the shear-compression shift in surface forces that resist the
applied load. Analysis of these parameters was performed using 3-dimensional STL files
containing participant leg geometry obtained after the pilot test.
6.2 Methods
6.2.1 Digitizing Participant Leg Geometry
Point-cloud data was acquired with assistance from the computer modelling lab in the College of
Archeology. Digital point clouds capturing the outside of brace models were captured using a
NextEngine ScanStudio optical scanner and stitched together with the accompanying ScanStudio
HD software (200DPI at 300 micron accuracy)48. Binary standard tessellation language (STL)
files were made from these point clouds and were imported into GeoMagics Studio 1449.
Geomagics Studio was used to smooth the surface and patch holes. The STL file was then
remeshed with 2-mm triangles to enable export to MATLAB for analysis.
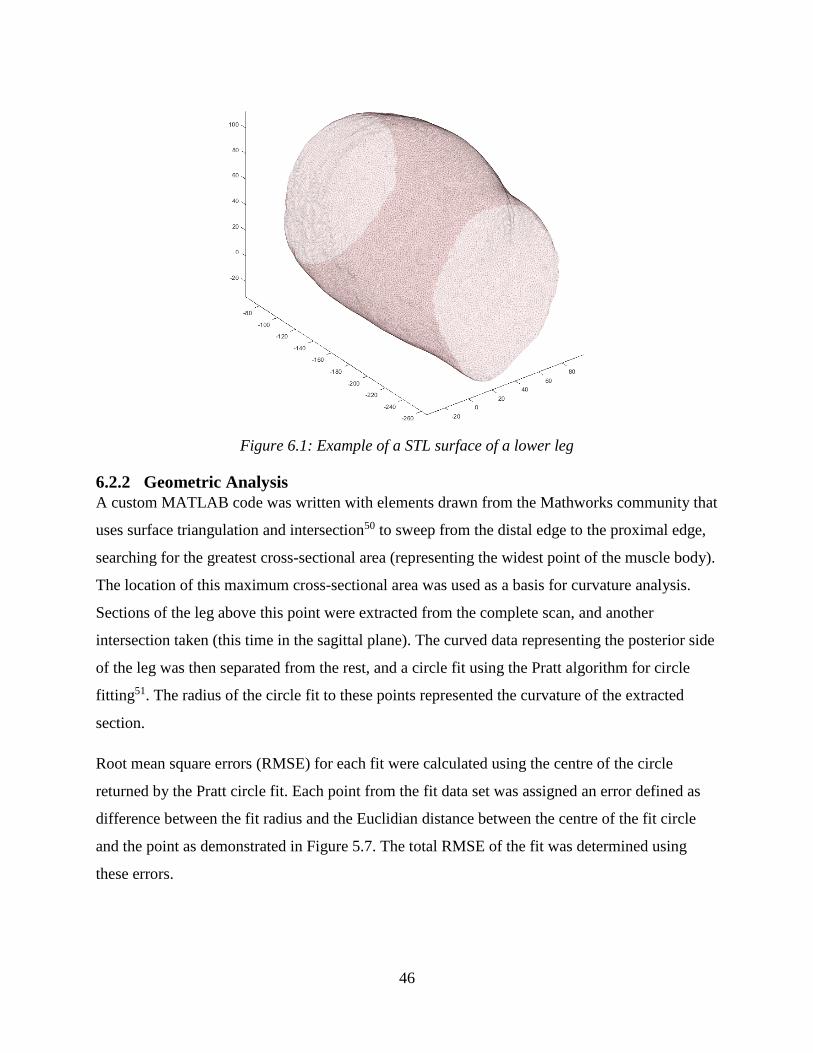
46
Figure 6.1: Example of a STL surface of a lower leg
6.2.2 Geometric Analysis
A custom MATLAB code was written with elements drawn from the Mathworks community that
uses surface triangulation and intersection50 to sweep from the distal edge to the proximal edge,
searching for the greatest cross-sectional area (representing the widest point of the muscle body).
The location of this maximum cross-sectional area was used as a basis for curvature analysis.
Sections of the leg above this point were extracted from the complete scan, and another
intersection taken (this time in the sagittal plane). The curved data representing the posterior side
of the leg was then separated from the rest, and a circle fit using the Pratt algorithm for circle
fitting51. The radius of the circle fit to these points represented the curvature of the extracted
section.
Root mean square errors (RMSE) for each fit were calculated using the centre of the circle
returned by the Pratt circle fit. Each point from the fit data set was assigned an error defined as
difference between the fit radius and the Euclidian distance between the centre of the fit circle
and the point as demonstrated in Figure 5.7. The total RMSE of the fit was determined using
these errors.
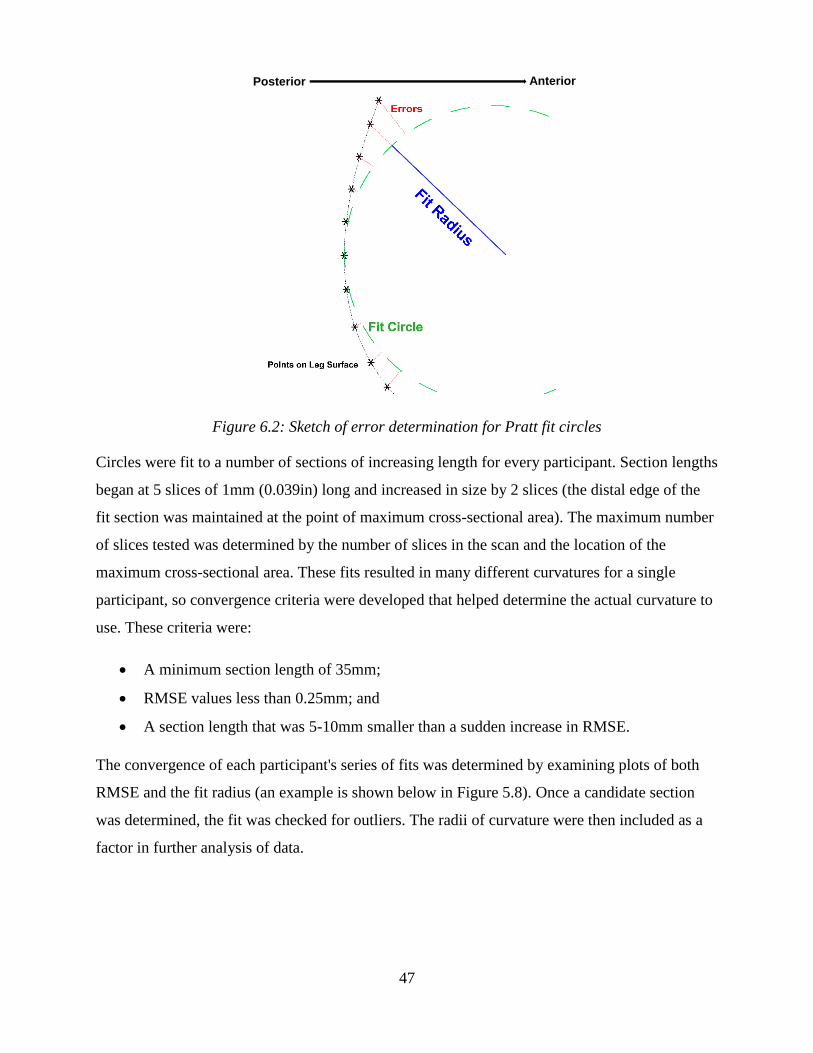
47
Figure 6.2: Sketch of error determination for Pratt fit circles
Circles were fit to a number of sections of increasing length for every participant. Section lengths
began at 5 slices of 1mm (0.039in) long and increased in size by 2 slices (the distal edge of the
fit section was maintained at the point of maximum cross-sectional area). The maximum number
of slices tested was determined by the number of slices in the scan and the location of the
maximum cross-sectional area. These fits resulted in many different curvatures for a single
participant, so convergence criteria were developed that helped determine the actual curvature to
use. These criteria were:
A minimum section length of 35mm;
RMSE values less than 0.25mm; and
A section length that was 5-10mm smaller than a sudden increase in RMSE.
The convergence of each participant's series of fits was determined by examining plots of both
RMSE and the fit radius (an example is shown below in Figure 5.8). Once a candidate section
was determined, the fit was checked for outliers. The radii of curvature were then included as a
factor in further analysis of data.
Posterior Anterior

48
Figure 6.3: Example of a convergence plot for curvature fitting showing thresholds for fit width
and RMSE (green and grey), the section width near a sudden RMSE increase (red), and the
selected fit width for a single participant
Section surface area and volume were determined by extracting a 75mm (3”) section from the
point cloud which was then bound with a triangulated shape object in MATLAB, which returned
volume and surface area. The section width of 3” was selected because it was the maximum
length available for all participants and corresponded closely to the length of the short brace.
Four geometric parameters – radius of curvature, surface area, section volume, and maximum
cross-sectional area – were calculated from the 3” section. These parameters were correlated to
the maximum force sustained in each test with Pearson correlation coefficients. Pain scores and
maximum interface forces were subdivided by brace for correlation to these geometric
parameters (also using Pearson coefficients). Although participants reported pain scores on half-
points on the NRS, pain data was still technically ordinal (requiring Spearman’s Rho to find
relationships with geometry). However, treating pain scores as continuous data allowed for
Pearson’s correlations with geometric parameters to be determined using the same assumptions
Selected curvature
Fit radius
RMSE
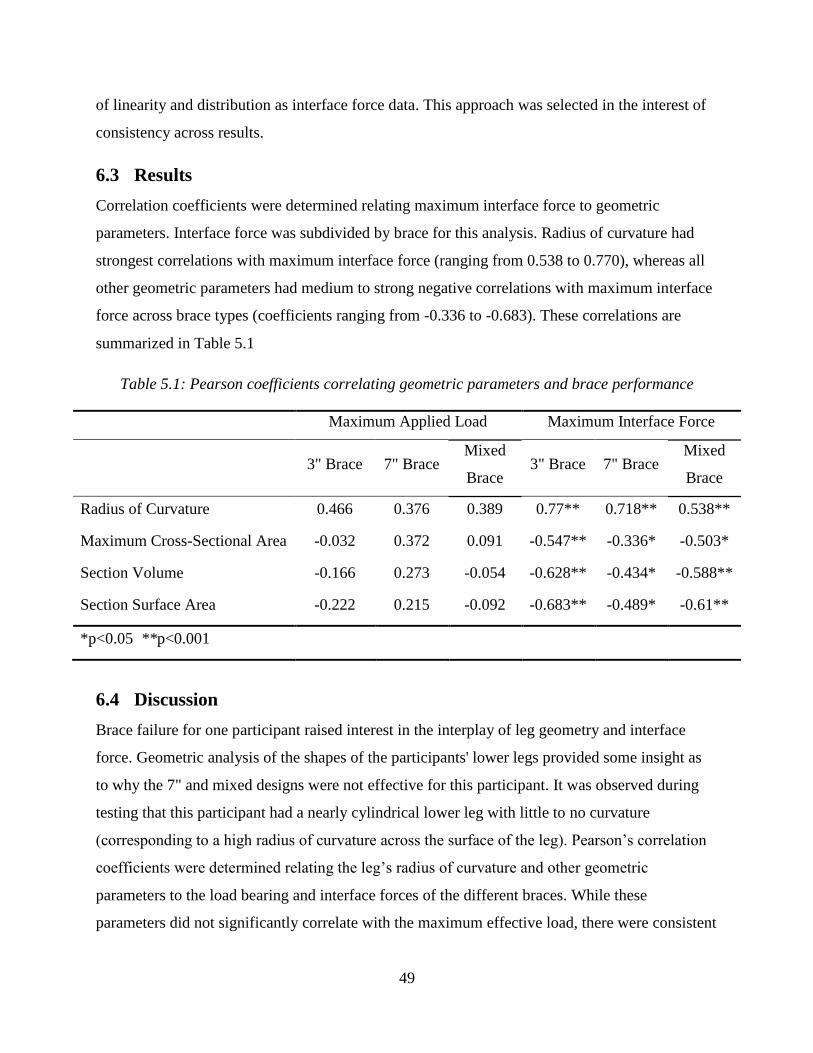
49
of linearity and distribution as interface force data. This approach was selected in the interest of
consistency across results.
6.3 Results
Correlation coefficients were determined relating maximum interface force to geometric
parameters. Interface force was subdivided by brace for this analysis. Radius of curvature had
strongest correlations with maximum interface force (ranging from 0.538 to 0.770), whereas all
other geometric parameters had medium to strong negative correlations with maximum interface
force across brace types (coefficients ranging from -0.336 to -0.683). These correlations are
summarized in Table 5.1
Table 5.1: Pearson coefficients correlating geometric parameters and brace performance
Maximum Applied Load Maximum Interface Force
3" Brace 7" Brace Mixed
Brace 3" Brace 7" Brace
Mixed
Brace
Radius of Curvature 0.466 0.376 0.389 0.77** 0.718** 0.538**
Maximum Cross-Sectional Area -0.032 0.372 0.091 -0.547** -0.336* -0.503*
Section Volume -0.166 0.273 -0.054 -0.628** -0.434* -0.588**
Section Surface Area -0.222 0.215 -0.092 -0.683** -0.489* -0.61**
*p<0.05 **p<0.001
6.4 Discussion
Brace failure for one participant raised interest in the interplay of leg geometry and interface
force. Geometric analysis of the shapes of the participants' lower legs provided some insight as
to why the 7" and mixed designs were not effective for this participant. It was observed during
testing that this participant had a nearly cylindrical lower leg with little to no curvature
(corresponding to a high radius of curvature across the surface of the leg). Pearson’s correlation
coefficients were determined relating the leg’s radius of curvature and other geometric
parameters to the load bearing and interface forces of the different braces. While these
parameters did not significantly correlate with the maximum effective load, there were consistent
50
relationships to the maximum interface force for all braces. Radius of curvature had a positive
relationship with maximum interface force where the other parameters all had negative
correlation coefficients.
We believe the orientation of the leg surface with respect to the applied load was the root of this
relationship – the more aligned the leg surface was to the direction of loading, the less the
proportion of applied load that is normal to the leg surface. The normal force component is
directly related to the maximum friction force that will adheres the knee brace to the leg.
Although all knee braces had similar preload to adhere the brace, the shape of the leg will
ultimately determine the traction load at which friction is overcome and whether the brace slips.
51
7 Discussion
7.1 Overview of Findings
The objectives of this research were to: 1) design lower-leg knee braces that can apply traction
load to the knee; and 2) test these prototype knee brace components and relate traction load to
wearer discomfort and interface force. These objectives were met in this research through the
development of a hypothesis using a simple FE model, the iterative design of a lower leg knee
brace, and a pilot study using a mechanical apparatus to test prototypes of the lower leg knee
brace.
Testing of the prototype knee braces demonstrated their capability to deliver traction load into
the body, thus satisfying Objective 1. The traction forces applied to the braces over the course of
our testing well exceeded 10kg of equivalent weight across all participants and brace designs.
Most participants saw forces up to 225N, often approaching ½ their bodyweight.
Self-reported pain demonstrated a statistically significant difference among the brace designs.
Applied force was demonstrated to significantly increase self-reported pain. This finding is
intuitive – any significant increase in force passing through the body will cause some level of
discomfort. Among the designs, the mixed and 7” designs were the most comfortable. That both
longer models were equally comfortable was a surprise. These results indicate that increasing
covered area is important for distributing load and improving comfort where the posterior side is
less so. Of note, there was a small, non-significant difference between the 7” and mixed brace
designs. It may be that the distal side of the calf muscle body carries more load than the anterior
surface of the leg, thereby explaining this small difference.
In support of this premise, the interface measures indicated that the distal-anterior sectors of the
7” knee began to carry more load than in the mixed design, in addition to the load carried from
preload in the distal-posterior sectors. It appears from these profiles that the distal-posterior
sectors will support large load when present.
Surprisingly, this study did not observe a relationship between maximum interface force and
self-reported pain. Qualitative feedback from participants suggests that this may be due to pain
concentration at the edges of the brace components rather than a cumulative effect from force
52
distributed across the body of the brace. Both pain and interface force in the sensor areas were
observed to increase overall as the applied traction load increased, but the relationship between
these responding variables is unclear. We believe that higher forces must be occurring at the
locations indicated verbally by participants – measurements of interface force at these locations
may provide a more representative correlation with pain.
Our experimental results support the hypothesis developed in Chapter 4 with the FE model, in
that the shorter knee brace performs poorly compared to the longer designs. However, the
comparison of the 7” brace to the mixed design contradicts the hypothesis. The mixed design
offered similar interface forces and pain levels, and was also lighter and less bulky.
7.2 Comparison to Existing Findings
To the best of our knowledge, no other study has examined OA knee braces using an external
testing apparatus to measure traction force. Comparisons of this study to other findings and
standards are then limited to analogy rather than direct comparison.
Other lower leg knee braces are abundant and are often formed using casting methods similar to
that employed in our design52. These knee braces have an abundance of applications that usually
focus on providing support, assisting gait, or correcting alignment. OA knee braces typically do
not apply force over large areas of the knee, instead applying opposing loads over smaller
regions through stiff, light frames. The designs proposed through this research are an amalgam of
what has been learned through different areas of orthotics design, directed specifically at solving
the problem of applying large traction loads. The distraction/traction knee brace proposed
employs casting materials similar to polymer interfaces but is divided into stiff anterior and
posterior sections similar to an OA unloader knee brace.
Previous studies have investigated interface mechanics and pain responses using predictive
models39,40. These models took pressure pain threshold (PPT) measurements of individuals
before determining interface stresses using a subject-specific FE model. Our study attempted to
employ direct measurement of interface pressures in comparison to an overall pain rating (rather
than a series of site-specific PPTs). Our study did not take site-specific PPT values for
comparison, choosing instead to examine of load distribution across the surface. A direct
connection between site-specific PPT values and the self-reported discomfort or interface forces

53
of this study is not clear. The next step in connecting our work to these studies would be to relate
all three of interface force measures, PPT, and the overall comfort rating. However, this level of
detail is outside the scope of our pilot study.
7.3 Strengths and Limitations
The main strength of this research is its novelty. Here, current design ideas from the orthotics
industry were adapted to design a lower leg knee brace component that can apply a new kind of
load to the body. A testing procedure was then developed that could apply this load to new
prototypes. This test method can detect differences in comfort and interface forces among brace
designs and can directly contribute to the validation of future design models and investigation of
biomechanical interfaces.
The primary limitation of this research is the small sample size of the pilot study. As previously
discussed, this small sample size limited the statistical significance of the study results. Further,
brace order was not controlled for or randomized between trials within a single participant
(thereby limiting the statistical power of the results). Despite these limitations, our research was
able to show high-level differences between the braces. At this early stage in design
development, trends in this data are sufficient to prompt further investigation using more refined
designs and higher-resolution measures.
Modifications to the experimental design will improve the ability of the test method to detect
differences among braces. In comparing knee braces, a randomized cross-over design should be
used to randomize the order in which participants wear braces to reduce the potential for intra-
participant effects (such as building of pain tolerance or shifting in position to increase comfort).
Standardization of preload using interface force measures (rather than relative position between
brace pieces) may reduce variance in interface force among participants but such a standard is
not immediately apparent, as interface forces were shown to correlate strongly with individual
leg shape and their relationships with participant pain are not yet clear.
The goal of the designed knee brace is to provide distraction to the knee joint but no measures of
distraction were taken in this research. This study is, to the best of our knowledge, the first to
assess the load-bearing capability of a rigid knee brace. While previous studies have used short-
term loading to unload knees, this study applied increasing traction loads to observe an effect
54
(pain and interface force). Surface palpitations or radiographs may have been used to observe
increases in JSW but these changes would be small – attempting distraction on the scale of
millimeters in a short period drastically increases the risk of rupturing ligaments and tendons.
This pilot study was needed to assess the feasibility and safety of applying traction load through
the rigid lower-leg knee brace in low-level increments of load. To measure distraction, a longer-
term test is required which, in turn, necessitates the completed knee brace design.
55
8 Conclusions and Future Directions
8.1 Conclusions
First, this research provides a viable design for a lower-leg traction knee brace and demonstrates
the brace’s capability to provide traction loading in excess of 1/3rd of the wearer’s bodyweight,
thus fulfilling Objective 1. Objective 2 has also been fulfilled through the pilot testing described
in this thesis. Relationships between load and wearer discomfort were found through this test and
were found to be dependent on brace design. Relationships fulfilling Objective 2 distinguished
between a 3” design, a 7” design, and a mixed design. This test demonstrated a difference in
performance, with the 3” design being the least effective and the 7” and mixed designs the most
effective.
8.2 Contributions
The contributions of this work begin with a proven design concept and prototypes for a lower-leg
traction knee brace and providing evidence of their capability to distribute load into the leg. This
design provides a foundation for future designs that may succeed in providing non-surgical
distraction of the knee joint.
This work also provides a methodology for testing the lower-leg components of new knee brace
designs. Differences in brace comfort and interface behavior can be detected with this method,
providing a useful tool for validating and further optimizing brace designs. Superior brace
designs (the mixed and 7” designs) have already been selected using this method.
Finally, this work provides a comparison of three simple designs that highlights the importance
of surface area coverage, traction, and mechanical compliance, thereby providing grounds for the
immediate refinement of the design.
8.3 Clinical Significance
This research will contribute to clinical practice by guiding the design of highly-effective devices
for the treatment of OA. Using this research as a foundation, knee braces can be designed that
will be able to load the knee in traction without the need for surgical devices. At sufficiently high
magnitudes, this traction load will provide non-invasive distraction of the knee. This research

56
then provides an important utility in expanding research into the effects of knee joint distraction
in reversing the effects of OA.
8.4 Recommendations for Future Research
This research was aimed at piloting investigation into high-load traction knee braces. Next steps
for investigation in this area should be focused on the continued optimization and completing the
design. The results from this study suggest that one improvement could be to improve fit and
comfort near the edges of the brace. Reducing the stiffness of the brace near the edges would
reduce the painful pinching sensation reported by participants in this study.
Improvements on the current design will also need to be studied and validated, using similar
methods to those employed in this study. A high-resolution sensor could provide sufficient
resolution to more closely observe shifts in load distribution across brace interfaces. This higher
resolution would also provide basis for comparison between PPT values and the overall score
given in this study. Data from this study, specifically variances and means of self-reported pain
and interface forces, can be used to estimate effect sizes and determine statistical power for
future studies.
Finally, this research should be expanded to include an upper-leg interface and loading
mechanism. The rigid fiberglass design presented here can be adapted to the upper leg, provided
that attention is given to the greater presence of soft tissue in the upper leg. An even greater
surface of the upper leg may need to be covered to comfortably transfer load. Increasing this area
may also require the point of force application to be moved away from the knee joint (reducing
the effect of moments on shifting load away from the knee).
8.5 Closing Remarks
This research seeks to establish a foundation for the future development of traction-distraction
knee braces to treat osteoarthritis. The lower-leg component of such a knee brace has been
designed and tested on a small population of healthy participants. It has been shown that the
mechanical testing method presented in this study identified relationships among traction load,
interface force, and wearer comfort. Presently these relationships are general in nature but a
method has been established that can be used to delve more deeply into interface biomechanics.

57
This study has shown the importance of moving towards the customizable, quantitative, and
mindfully-optimized design of high-performance orthotics.

58
References
1. Measure Description – Percentage of population with diagnosed osteoarthritis [web
document]. Government of Canada – Canadian Chronic Disease Indicators. Published
September 19th, 2016.
2. McAlindon TE, Bannuru RR, Sullivan MC, Arden NK, Berenbaum F, Bierma-Zeinstra
SM, et al. OARSI guidelines for the non-surgical management of knee osteoarthritis.
Osteoarthr Cartil. 2014; 22(3):363–88.
3. Intema F, Van Roermund M. P, Marijnissen ACA, Cotofana S, Eckstein F, Castelein RM,
et al. Tissue structure modification in knee osteoarthritis by use of joint distraction: an
open 1-year pilot study. Ann Rheum Dis. 2011; 70(8):1441.
4. Wiegant K, van Roermund PM, Intema F, Cotofana S, Eckstein F, Mastbergen SC, et al.
Sustained clinical and structural benefit after joint distraction in the treatment of severe
knee osteoarthritis. Osteoarthr Cartil. 2013; 21(11):1660–7.
5. van der Woude J, Wiegant K, van Roermund PM, Intema F, Custers RJH, Eckstein F, et
al. Five-Year Follow-up of Knee Joint Distraction. Cartilage. 2016; 8(3): 263-71.
6. Squyer E, Stamper DL, Hamilton DT, Sabin JA, Leopold SS. Unloader knee braces for
osteoarthritis: Do patients actually wear them? Clin Orthop Relat Res. 2013.
7. Stammen K. Human Knee Anatomy.jpg. Wikimedia Commons (free image repository)
[Internet]. 2012. Accessed March 13th, 2018.
8. Bijlsma JWJ, Berenbaum F, Lafeber FPJG. Osteoarthritis: an update with relevance for
clinical practice. Lancet. 2016 Nov; 377(9783):2115–26.
9. Kellgren JH, Lawrence JS. Radiological Assessment of Osteo-Arthrosis. Ann Rheum
Dis. 1957; 16(4):494 LP-502.
10. Sato T, Sato N, Masui K, Hirano Y. Immediate Effects of Manual Traction on
Radiographically Determined Joint Space Width in the Hip Joint. J Manipulative Physiol
Ther. 2014; 37(8):580–5.
11. Ogawa D, Usa H, Abiko T, Matsumura M, Ichikawa K, Hata M, et al. Analysis of
separation distance that accompanies the continuous traction of normal knee joints using
ultrasound imaging. Physiotherapy. 2015; 101:e1120.

59
12. Khademi-Kalantari K, Mahmoodi Aghdam S, Akbarzadeh Baghban A, Rezayi M,
Rahimi A, Naimee S. Effects of non-surgical joint distraction in the treatment of severe
knee osteoarthritis. J Bodyw Mov Ther. 2014; 18(4):533–9.
13. van Valburg AA, van Roermund PM, Marijnissen ACA, van Melkebeek J, Lammens J,
Verbout AJ, et al. Joint distraction in treatment of osteoarthritis: a two-year follow-up of
the ankle. Osteoarthr Cartil. 1999; 7(5):474–9.
14. Van Valburg AA, Van Roermund PM, Marijnissen ACA, Wenting MJG, Verbout AJ,
Lafeber FPJG, et al. Joint distraction in treatment of osteoarthritis (II): effects on
cartilage in a canine model. Osteoarthr Cartil. 2000; 8(1):1–8.
15. Brooks KS. Osteoarthritis Knee Braces on the Market: A Literature Review. JPO J
Prosthetics Orthot. 2014; 26(1): 2-30.
16. Brouwer RW, van Raaij TM, Verhaar JAN, Coene LNJEM, Bierma-Zeinstra SMA.
Brace treatment for osteoarthritis of the knee: a prospective randomized multi-centre trial.
Osteoarthr Cartil. 2006; 14(8):777–83.
17. Duivenvoorden T, Brouwer RW, van Raaij TM, Verhagen AP, Verhaar JAN, Bierma-
Zeinstra SMA. Braces and orthoses for treating osteoarthritis of the knee. Cochrane
Database Syst Rev. 2015.
18. Steadman R, Briggs K, Pomeroy S, Wijdicks C, Briggs KK, Pomeroy SM, et al. Current
state of unloading braces for knee osteoarthritis. Knee Surgery, Sport Traumatol
Arthrosc. 2016; 24(1):42–50.
19. Petersen W, Ellermann A, Zantop T, Rembitzki I, Semsch H, Liebau C, et al.
Biomechanical effect of unloader braces for medial osteoarthritis of the knee: a
systematic review. Arch Orthop Trauma Surg. 2016; 136(5):649–56.
20. Maleki M, Arazpour M, Joghtaei M, Hutchins SW, Aboutorabi A, Pouyan A. The effect
of knee orthoses on gait parameters in medial knee compartment osteoarthritis A
literature review. Prosthet Orthot Int. 2016; 40(2):193–201.
21. Moyer R., Birmingham TB, Bryant DM, Giffin JR, Marriott K., Leitch KM.
Biomechanical effects of valgus knee bracing: a systematic review and meta-analysis -
ScienceDirect. Osteoarthr Cartil. 2015; 23(2):178–88.
22. Horlick SG, Loomer RL. Valgus Knee Bracing for Medical Gonarthrosis. Clin J Sport
Med. 1993; 3(4):251–5.
60
23. Richards JD, Sanchez-Ballester J, Jones RK, Darke N, Livingstone BN. A comparison of
knee braces during walking for the treatment of osteoarthritis of the medial compartment
of the knee. J Bone Joint Surg Br. 2005; 87(7):937–39.
24. Jones RK, Nester CJ, Richards JD, Kim WY, Johnson DS, Jari S, et al. A comparison of
the biomechanical effects of valgus knee braces and lateral wedged insoles in patients
with knee osteoarthritis. Gait Posture. 2013; 7(3):368–72.
25. Haladik J, Vasileff W, Peltz C, Lock T, Bey M. Bracing improves clinical outcomes but
does not affect the medial knee joint space in osteoarthritic patients during gait. Knee
Surgery, Sport Traumatol Arthrosc. 2014; 22(11):2715–20.
26. Gaasbeek RDA, Groen BE, Hampsink B, van Heerwaarden RJ, Duysens J. Valgus
bracing in patients with medial compartment osteoarthritis of the knee: A gait analysis
study of a new brace. Gait Posture. 2007; 26(1):3–10.
27. Laroche D, Morisset C, Fortunet C, Gremeaux V, Maillefert J-F, Ornetti P.
Biomechanical effectiveness of a distraction–rotation knee brace in medial knee
osteoarthritis: Preliminary results. Knee. 2014; 21(3):710–6.
28. Draganich L, Reider B, Rimington T, Piotrowski G, Mallik K, Nasson S. The
effectiveness of self- adjustable custom and off-the- shelf bracing in the treatment of
varus gonarthrosis. J bone Joint surgery American 2006; 88(12):2645.
29. Della Croce U, Crapanzano F, Li L, Kasi PK, Patritti BL, Mancinelli C, et al. A
Preliminary Assessment of a Novel Pneumatic Unloading Knee Brace on the Gait
Mechanics of Patients With Knee Osteoarthritis. PM&R. 2013; 5(10):816–24.
30. Pollo FE, Otis JC, Backus SI, Warren RF, Wickiewicz TL. Reduction of medial
compartment loads with valgus bracing of the osteoarthritic knee. Am J Sports Med.
2002; 30(3):414–21.
31. Johnson AJ, Starr R, Kapadia BH, Bhave A, Mont MA. Gait and clinical improvements
with a novel knee brace for knee OA. J Knee Surg. 2013; 26(03):173–8.
32. Hart H, Collins N, Ackland D, Cowan S, Crossley K. The effects of varus bracing for
predominant lateral knee osteoarthritis and valgus malalignment after ACL
reconstruction. J Sci Med Sport. 2014; 18:16–7.
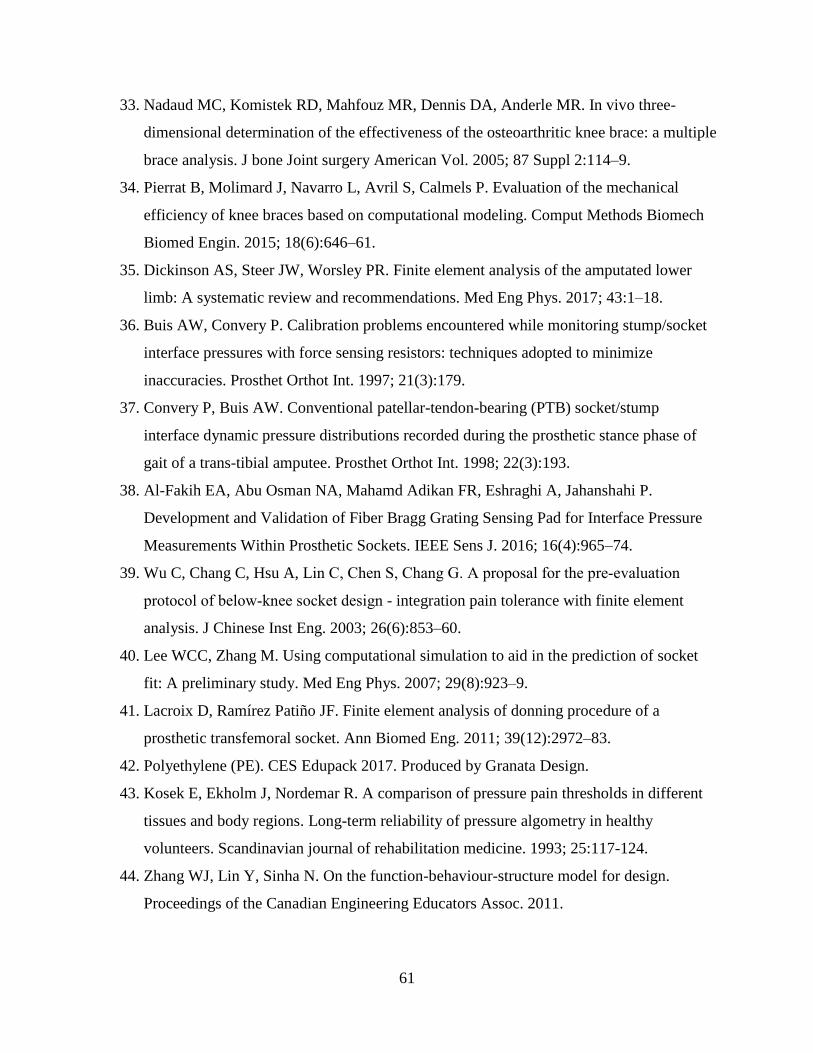
61
33. Nadaud MC, Komistek RD, Mahfouz MR, Dennis DA, Anderle MR. In vivo three-
dimensional determination of the effectiveness of the osteoarthritic knee brace: a multiple
brace analysis. J bone Joint surgery American Vol. 2005; 87 Suppl 2:114–9.
34. Pierrat B, Molimard J, Navarro L, Avril S, Calmels P. Evaluation of the mechanical
efficiency of knee braces based on computational modeling. Comput Methods Biomech
Biomed Engin. 2015; 18(6):646–61.
35. Dickinson AS, Steer JW, Worsley PR. Finite element analysis of the amputated lower
limb: A systematic review and recommendations. Med Eng Phys. 2017; 43:1–18.
36. Buis AW, Convery P. Calibration problems encountered while monitoring stump/socket
interface pressures with force sensing resistors: techniques adopted to minimize
inaccuracies. Prosthet Orthot Int. 1997; 21(3):179.
37. Convery P, Buis AW. Conventional patellar-tendon-bearing (PTB) socket/stump
interface dynamic pressure distributions recorded during the prosthetic stance phase of
gait of a trans-tibial amputee. Prosthet Orthot Int. 1998; 22(3):193.
38. Al-Fakih EA, Abu Osman NA, Mahamd Adikan FR, Eshraghi A, Jahanshahi P.
Development and Validation of Fiber Bragg Grating Sensing Pad for Interface Pressure
Measurements Within Prosthetic Sockets. IEEE Sens J. 2016; 16(4):965–74.
39. Wu C, Chang C, Hsu A, Lin C, Chen S, Chang G. A proposal for the pre‐evaluation
protocol of below‐knee socket design - integration pain tolerance with finite element
analysis. J Chinese Inst Eng. 2003; 26(6):853–60.
40. Lee WCC, Zhang M. Using computational simulation to aid in the prediction of socket
fit: A preliminary study. Med Eng Phys. 2007; 29(8):923–9.
41. Lacroix D, Ramírez Patiño JF. Finite element analysis of donning procedure of a
prosthetic transfemoral socket. Ann Biomed Eng. 2011; 39(12):2972–83.
42. Polyethylene (PE). CES Edupack 2017. Produced by Granata Design.
43. Kosek E, Ekholm J, Nordemar R. A comparison of pressure pain thresholds in different
tissues and body regions. Long-term reliability of pressure algometry in healthy
volunteers. Scandinavian journal of rehabilitation medicine. 1993; 25:117-124.
44. Zhang WJ, Lin Y, Sinha N. On the function-behaviour-structure model for design.
Proceedings of the Canadian Engineering Educators Assoc. 2011.

62
45. BSN Medical. Delta-Lite Plus [webpage]. 2018. Accessed May 29, 2018. Available from:
http://www.bsnmedical.com/products/orthopaedics/category-product-search-o/fracture-
management/synthetic-casting/delta-liter-plus.html
46. Hall RS, Desmoulin GT, Milner TE. A technique for conditioning and calibrating force-
sensing resistors for repeatable and reliable measurement of compressive force. J
Biomech. 2008; 41(16):3492–5.
47. Williamson A, Hoggart B. Pain: a review of three commonly used pain rating scales. J
Clinical Nursing. 2005: 14(7):798-804
48. Digilent: a National Instruments company. Waveforms [Software]. 2015. Available from:
https://store.digilentinc.com/waveforms-previously-waveforms-2015/
49. NextEngine. ScanStudio Proscan [Software]. 2018. Available from:
https://www.nextengine.com/products/scanstudio-hd/specs/overview
50. 3D Systems. Geomagic Studio 14 [Software]. 2014. No longer available. Product updates
available from: https://www.3dsystems.com/software
51. Tuszynski J. Surface Intersection, version 1.0 [Software]. 2014. Accessed March 14,
2018. Available from: https://www.mathworks.com/matlabcentral/fileexchange/48613-
surface-intersection
52. Chernov N. Circle Fit (Pratt method) [Software]. 2009. Accessed March 14, 2018.
Available from: https://www.mathworks.com/matlabcentral/fileexchange/22643-circle-
fit--pratt-method-
53. Hsu JD, Michael JW, Fisk 1943- JR, Surgeons AA of O. AAOS atlas of orthoses and
assistive devices. 4th ed.. Philadelphia: Philadelphia : Mosby/Elsevier; 2008.
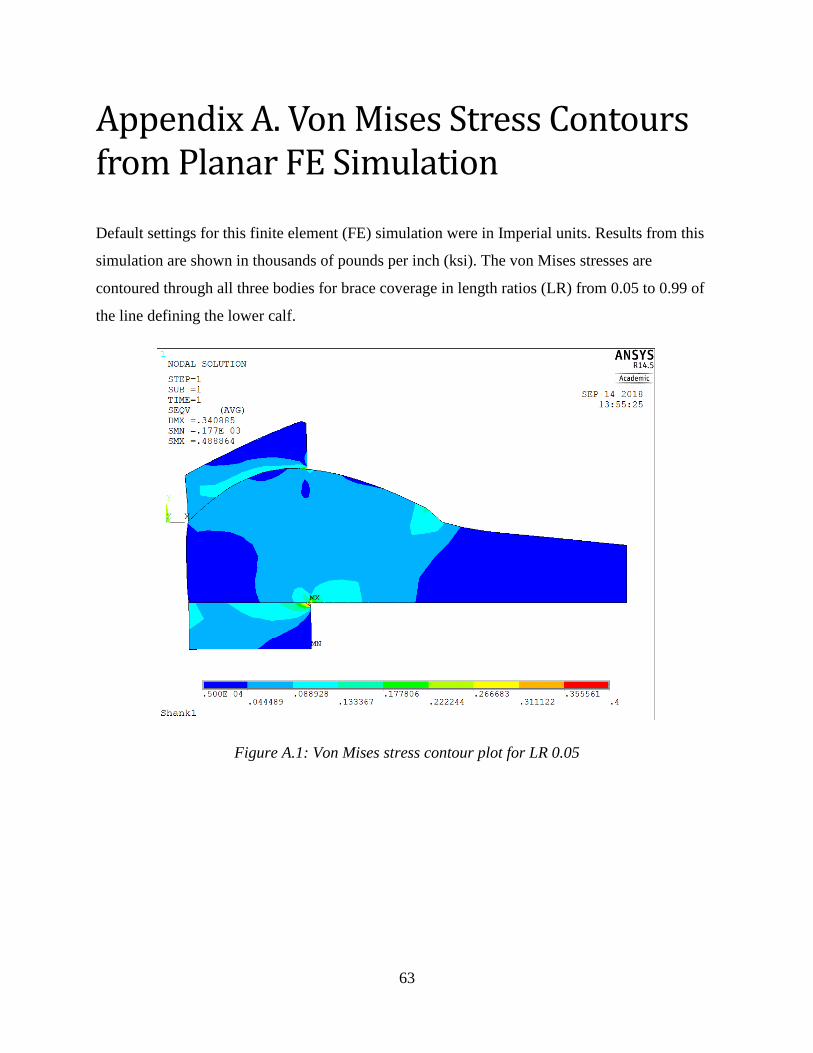
63
Appendix A. Von Mises Stress Contours from Planar FE Simulation
Default settings for this finite element (FE) simulation were in Imperial units. Results from this
simulation are shown in thousands of pounds per inch (ksi). The von Mises stresses are
contoured through all three bodies for brace coverage in length ratios (LR) from 0.05 to 0.99 of
the line defining the lower calf.
Figure A.1: Von Mises stress contour plot for LR 0.05
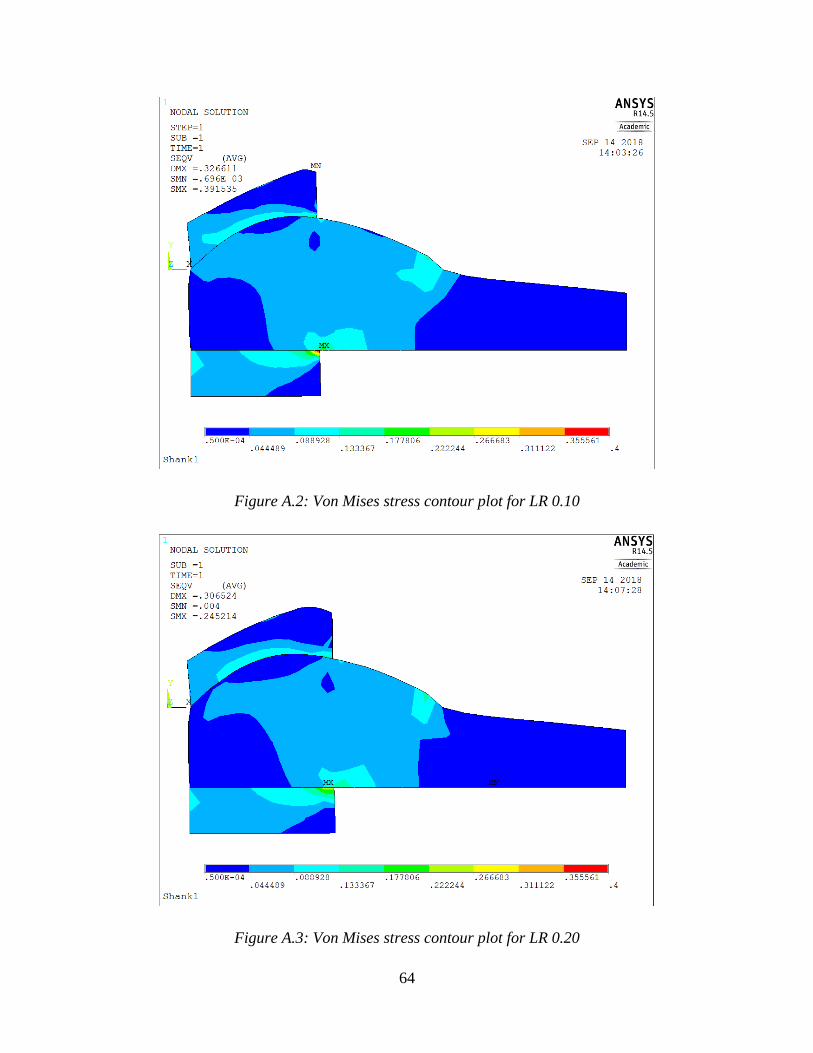
64
Figure A.2: Von Mises stress contour plot for LR 0.10
Figure A.3: Von Mises stress contour plot for LR 0.20
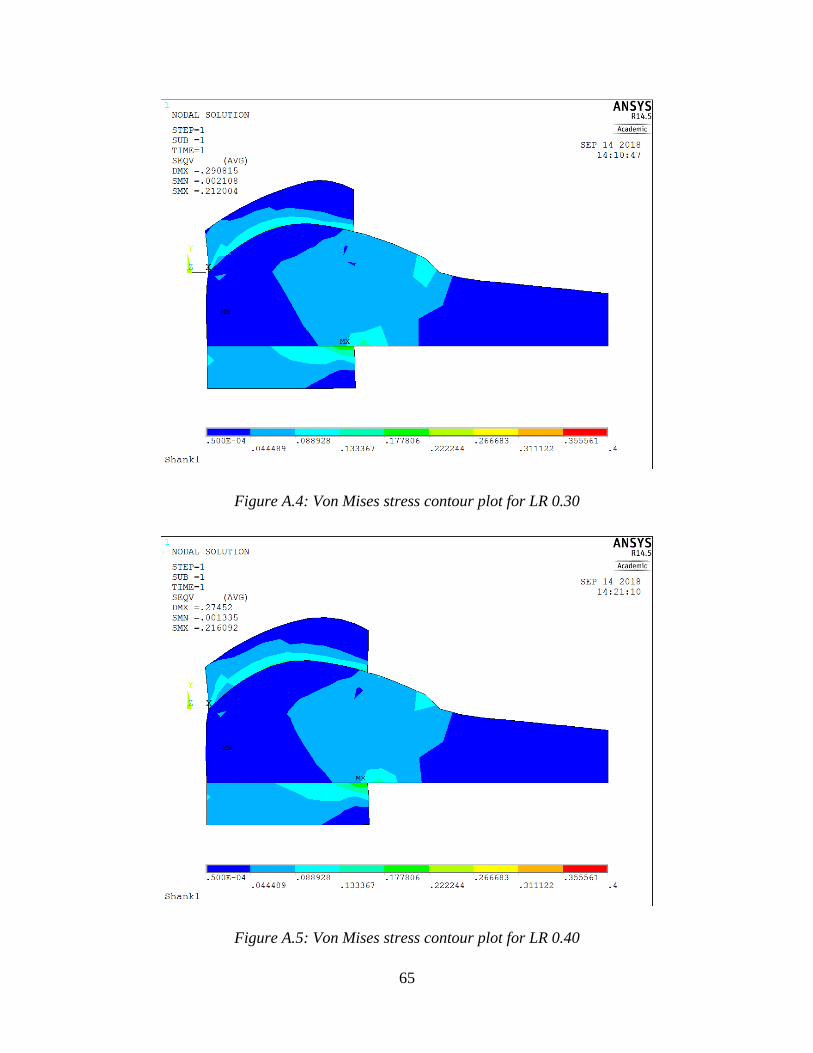
65
Figure A.4: Von Mises stress contour plot for LR 0.30
Figure A.5: Von Mises stress contour plot for LR 0.40

66
Figure A.6: Von Mises stress contour plot for LR 0.50
Figure A.7: Von Mises stress contour plot for LR 0.75
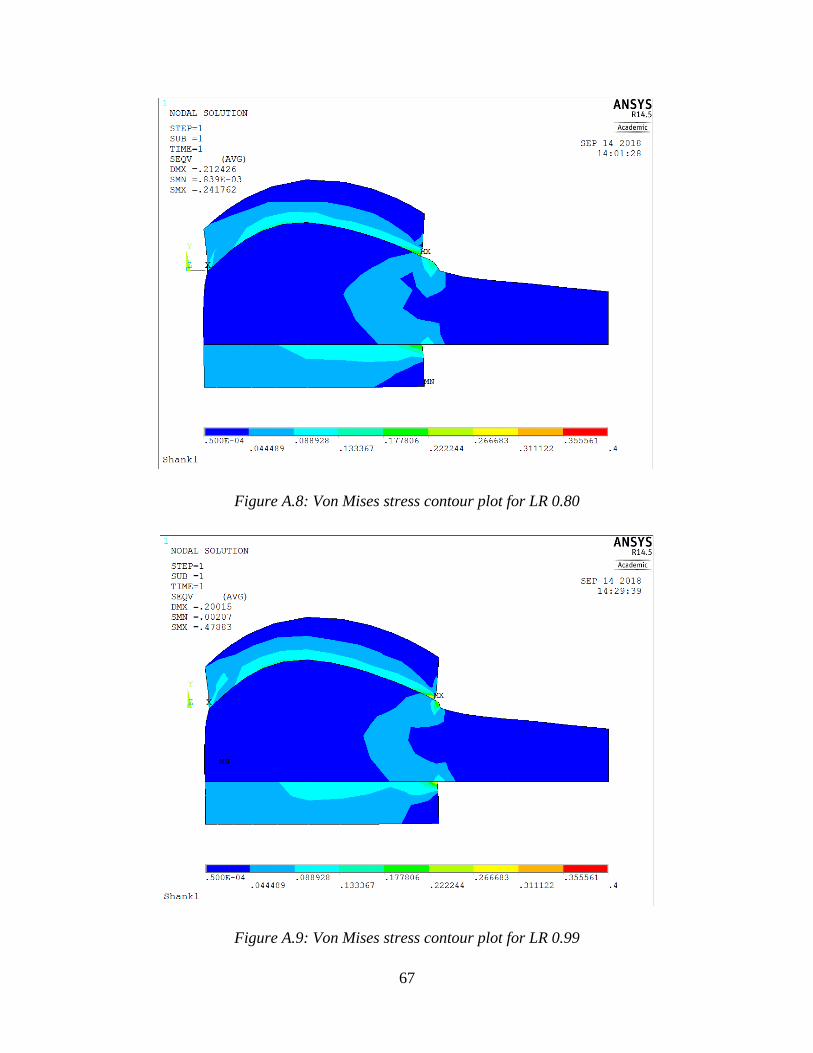
67
Figure A.8: Von Mises stress contour plot for LR 0.80
Figure A.9: Von Mises stress contour plot for LR 0.99
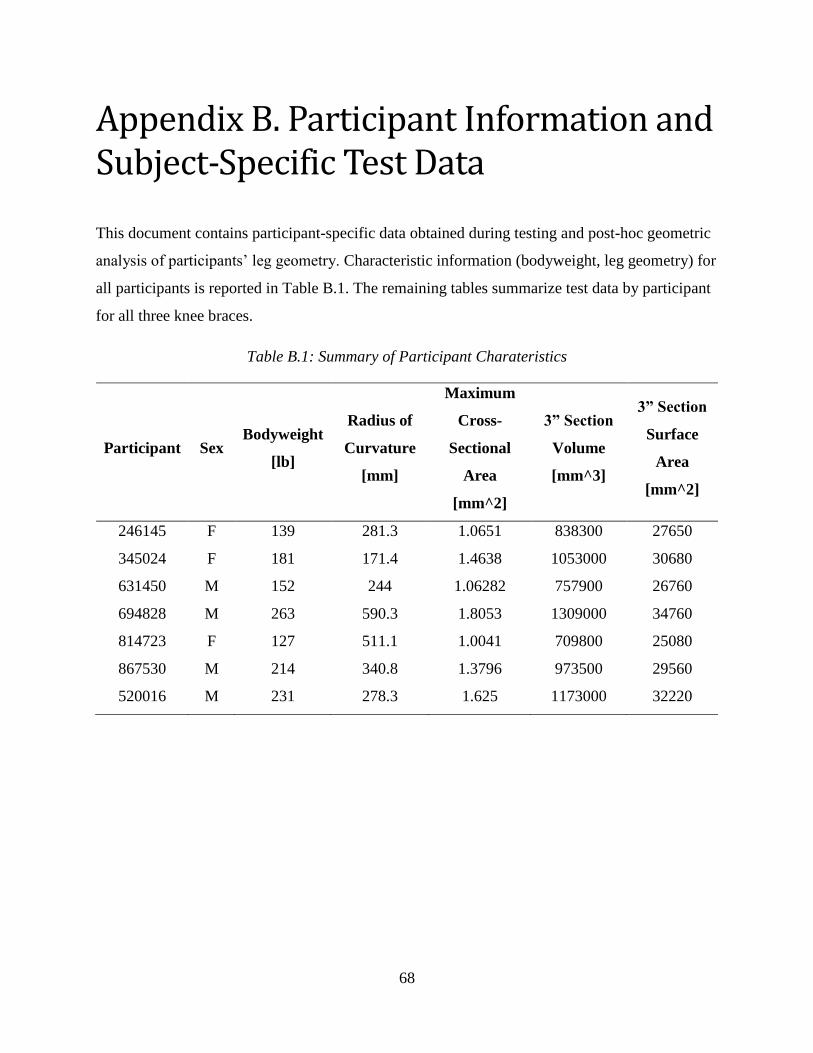
68
Appendix B. Participant Information and Subject-Specific Test Data
This document contains participant-specific data obtained during testing and post-hoc geometric
analysis of participants’ leg geometry. Characteristic information (bodyweight, leg geometry) for
all participants is reported in Table B.1. The remaining tables summarize test data by participant
for all three knee braces.
Table B.1: Summary of Participant Charateristics
Participant Sex Bodyweight
[lb]
Radius of
Curvature
[mm]
Maximum
Cross-
Sectional
Area
[mm^2]
3” Section
Volume
[mm^3]
3” Section
Surface
Area
[mm^2]
246145 F 139 281.3 1.0651 838300 27650
345024 F 181 171.4 1.4638 1053000 30680
631450 M 152 244 1.06282 757900 26760
694828 M 263 590.3 1.8053 1309000 34760
814723 F 127 511.1 1.0041 709800 25080
867530 M 214 340.8 1.3796 973500 29560
520016 M 231 278.3 1.625 1173000 32220
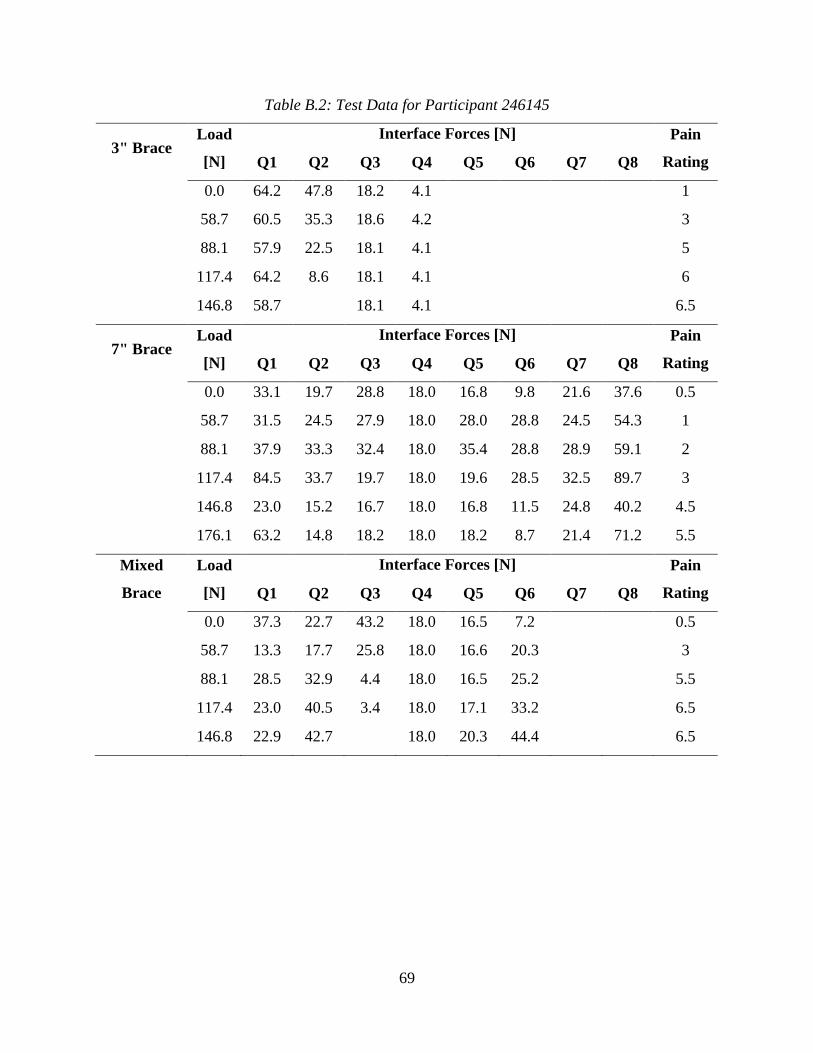
69
Table B.2: Test Data for Participant 246145
3" Brace Load
[N]
Interface Forces [N] Pain
Rating Q1 Q2 Q3 Q4 Q5 Q6 Q7 Q8
0.0 64.2 47.8 18.2 4.1 1
58.7 60.5 35.3 18.6 4.2 3
88.1 57.9 22.5 18.1 4.1 5
117.4 64.2 8.6 18.1 4.1 6
146.8 58.7 18.1 4.1 6.5
7" Brace Load
[N]
Interface Forces [N] Pain
Rating Q1 Q2 Q3 Q4 Q5 Q6 Q7 Q8
0.0 33.1 19.7 28.8 18.0 16.8 9.8 21.6 37.6 0.5
58.7 31.5 24.5 27.9 18.0 28.0 28.8 24.5 54.3 1
88.1 37.9 33.3 32.4 18.0 35.4 28.8 28.9 59.1 2
117.4 84.5 33.7 19.7 18.0 19.6 28.5 32.5 89.7 3
146.8 23.0 15.2 16.7 18.0 16.8 11.5 24.8 40.2 4.5
176.1 63.2 14.8 18.2 18.0 18.2 8.7 21.4 71.2 5.5
Mixed
Brace
Load
[N]
Interface Forces [N] Pain
Rating Q1 Q2 Q3 Q4 Q5 Q6 Q7 Q8
0.0 37.3 22.7 43.2 18.0 16.5 7.2 0.5
58.7 13.3 17.7 25.8 18.0 16.6 20.3 3
88.1 28.5 32.9 4.4 18.0 16.5 25.2 5.5
117.4 23.0 40.5 3.4 18.0 17.1 33.2 6.5
146.8 22.9 42.7 18.0 20.3 44.4 6.5
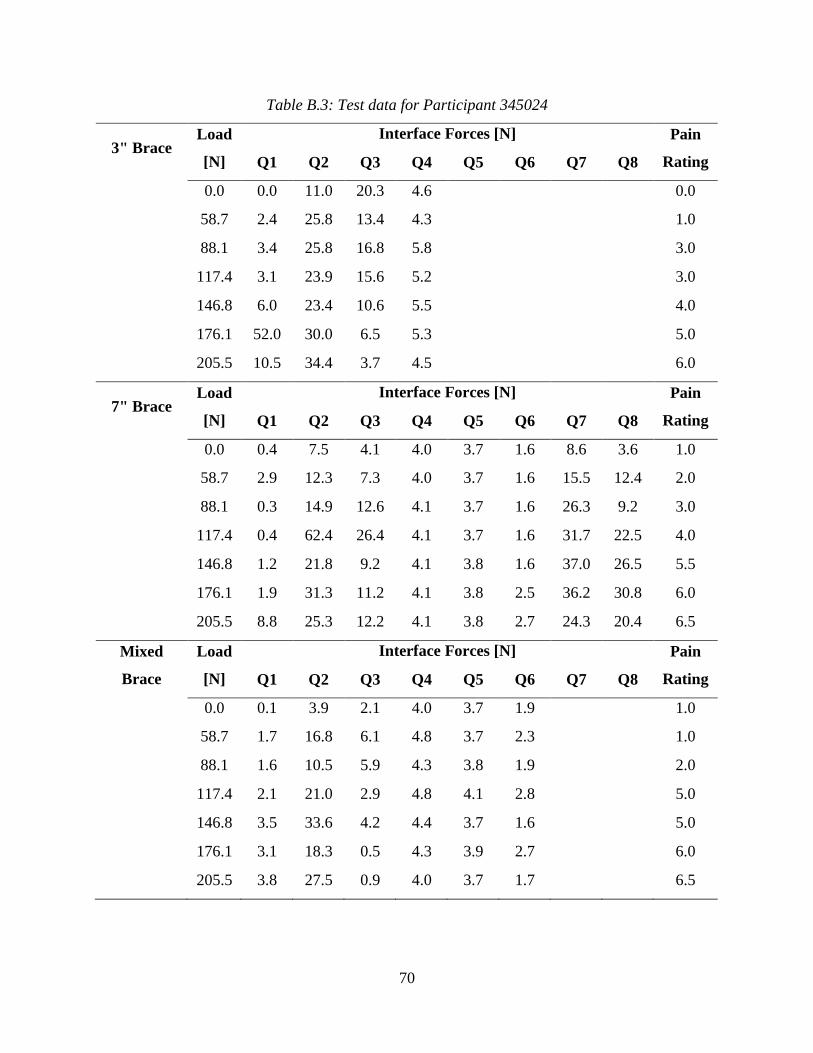
70
Table B.3: Test data for Participant 345024
3" Brace Load
[N]
Interface Forces [N] Pain
Rating Q1 Q2 Q3 Q4 Q5 Q6 Q7 Q8
0.0 0.0 11.0 20.3 4.6 0.0
58.7 2.4 25.8 13.4 4.3 1.0
88.1 3.4 25.8 16.8 5.8 3.0
117.4 3.1 23.9 15.6 5.2 3.0
146.8 6.0 23.4 10.6 5.5 4.0
176.1 52.0 30.0 6.5 5.3 5.0
205.5 10.5 34.4 3.7 4.5 6.0
7" Brace Load
[N]
Interface Forces [N] Pain
Rating Q1 Q2 Q3 Q4 Q5 Q6 Q7 Q8
0.0 0.4 7.5 4.1 4.0 3.7 1.6 8.6 3.6 1.0
58.7 2.9 12.3 7.3 4.0 3.7 1.6 15.5 12.4 2.0
88.1 0.3 14.9 12.6 4.1 3.7 1.6 26.3 9.2 3.0
117.4 0.4 62.4 26.4 4.1 3.7 1.6 31.7 22.5 4.0
146.8 1.2 21.8 9.2 4.1 3.8 1.6 37.0 26.5 5.5
176.1 1.9 31.3 11.2 4.1 3.8 2.5 36.2 30.8 6.0
205.5 8.8 25.3 12.2 4.1 3.8 2.7 24.3 20.4 6.5
Mixed
Brace
Load
[N]
Interface Forces [N] Pain
Rating Q1 Q2 Q3 Q4 Q5 Q6 Q7 Q8
0.0 0.1 3.9 2.1 4.0 3.7 1.9 1.0
58.7 1.7 16.8 6.1 4.8 3.7 2.3 1.0
88.1 1.6 10.5 5.9 4.3 3.8 1.9 2.0
117.4 2.1 21.0 2.9 4.8 4.1 2.8 5.0
146.8 3.5 33.6 4.2 4.4 3.7 1.6 5.0
176.1 3.1 18.3 0.5 4.3 3.9 2.7 6.0
205.5 3.8 27.5 0.9 4.0 3.7 1.7 6.5
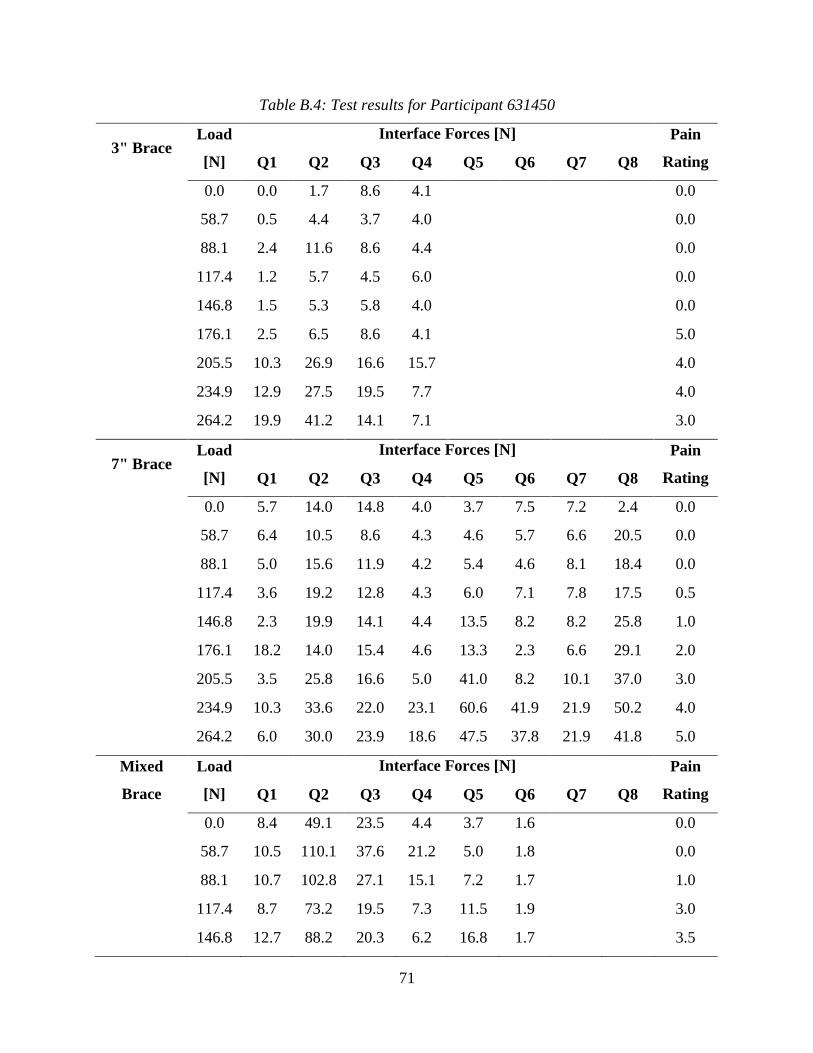
71
Table B.4: Test results for Participant 631450
3" Brace Load
[N]
Interface Forces [N] Pain
Rating Q1 Q2 Q3 Q4 Q5 Q6 Q7 Q8
0.0 0.0 1.7 8.6 4.1 0.0
58.7 0.5 4.4 3.7 4.0 0.0
88.1 2.4 11.6 8.6 4.4 0.0
117.4 1.2 5.7 4.5 6.0 0.0
146.8 1.5 5.3 5.8 4.0 0.0
176.1 2.5 6.5 8.6 4.1 5.0
205.5 10.3 26.9 16.6 15.7 4.0
234.9 12.9 27.5 19.5 7.7 4.0
264.2 19.9 41.2 14.1 7.1 3.0
7" Brace Load
[N]
Interface Forces [N] Pain
Rating Q1 Q2 Q3 Q4 Q5 Q6 Q7 Q8
0.0 5.7 14.0 14.8 4.0 3.7 7.5 7.2 2.4 0.0
58.7 6.4 10.5 8.6 4.3 4.6 5.7 6.6 20.5 0.0
88.1 5.0 15.6 11.9 4.2 5.4 4.6 8.1 18.4 0.0
117.4 3.6 19.2 12.8 4.3 6.0 7.1 7.8 17.5 0.5
146.8 2.3 19.9 14.1 4.4 13.5 8.2 8.2 25.8 1.0
176.1 18.2 14.0 15.4 4.6 13.3 2.3 6.6 29.1 2.0
205.5 3.5 25.8 16.6 5.0 41.0 8.2 10.1 37.0 3.0
234.9 10.3 33.6 22.0 23.1 60.6 41.9 21.9 50.2 4.0
264.2 6.0 30.0 23.9 18.6 47.5 37.8 21.9 41.8 5.0
Mixed
Brace
Load
[N]
Interface Forces [N] Pain
Rating Q1 Q2 Q3 Q4 Q5 Q6 Q7 Q8
0.0 8.4 49.1 23.5 4.4 3.7 1.6 0.0
58.7 10.5 110.1 37.6 21.2 5.0 1.8 0.0
88.1 10.7 102.8 27.1 15.1 7.2 1.7 1.0
117.4 8.7 73.2 19.5 7.3 11.5 1.9 3.0
146.8 12.7 88.2 20.3 6.2 16.8 1.7 3.5

72
176.1 10.0 62.4 19.8 5.9 17.6 1.7 3.0
205.5 10.2 36.1 14.3 5.0 3.8 1.6 3.0
234.9 3.0 7.8 8.2 4.1 3.8 1.7 4.0
264.2 14.8 36.1 15.9 7.3 41.0 2.7 5.0
293.6 17.8 40.1 20.3 11.5 21.1 5.2 4.0

73
Table B.5: Test data for Participant 694828
3" Brace Load
[N]
Interface Forces [N] Pain
Rating Q1 Q2 Q3 Q4 Q5 Q6 Q7 Q8
0.0 5.2 8.7 5.2 4.0 0.0
58.7 8.8 3.5 8.8 4.0 0.0
88.1 7.3 13.2 7.3 4.0 0.0
117.4 27.3 17.1 27.3 4.1 0.5
146.8 25.9 30.6 25.9 4.0 0.5
176.1 37.6 42.3 37.6 4.7 0.5
7" Brace Load
[N]
Interface Forces [N] Pain
Rating Q1 Q2 Q3 Q4 Q5 Q6 Q7 Q8
0.0 6.8 17.1 20.3 4.7 3.7 5.9 4.7 3.2 0.5
58.7 10.0 13.2 23.9 7.5 3.7 4.2 5.1 1.0 1.0
88.1 9.0 12.8 25.2 7.9 3.7 5.4 4.9 1.4 2.0
117.4 7.4 15.3 30.2 5.9 3.7 8.2 4.6 1.2 3.0
Mixed
Brace
Load
[N]
Interface Forces [N] Pain
Rating Q1 Q2 Q3 Q4 Q5 Q6 Q7 Q8
0.0 11.5 10.7 9.7 4.1 3.7 8.6 0.0
58.7 13.9 14.0 18.5 4.2 3.7 11.0 0.0
88.1 15.4 14.2 18.5 4.3 3.7 7.8 0.0
117.4 24.0 12.6 20.0 4.3 3.7 4.8 1.0
146.8 24.0 18.6 23.2 5.7 3.7 1.6 1.0
176.1 11.5 10.7 9.7 4.1 3.7 8.6 0.0
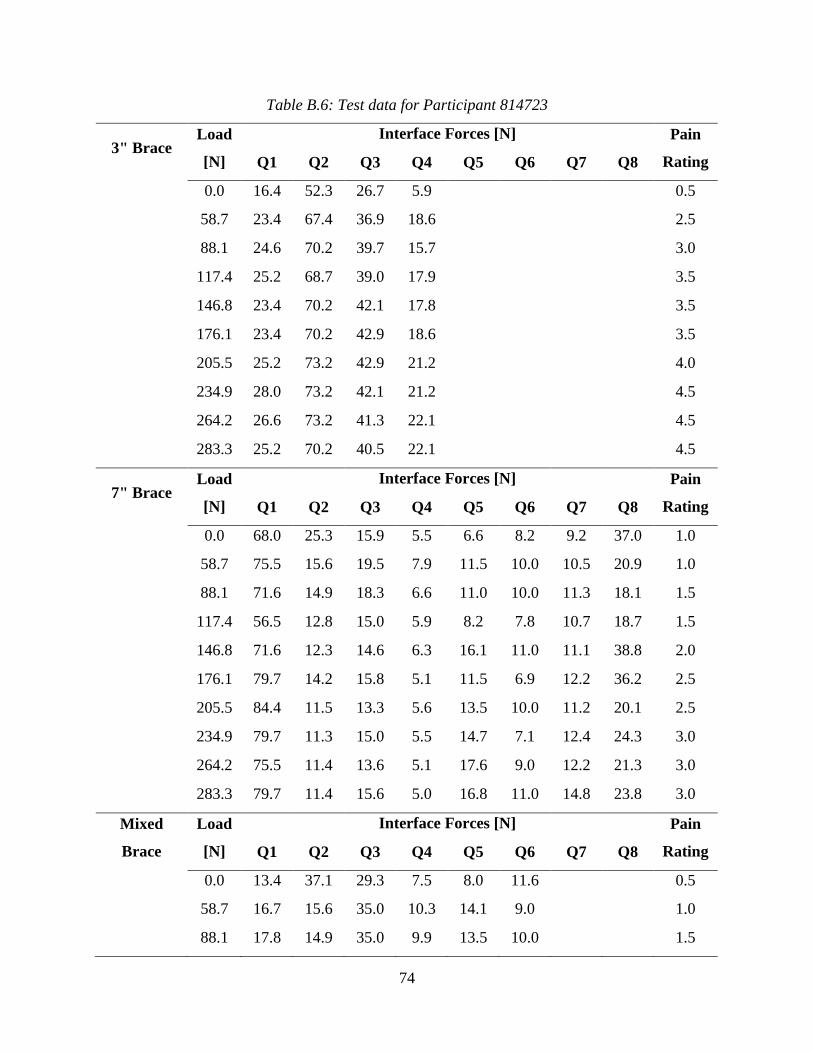
74
Table B.6: Test data for Participant 814723
3" Brace Load
[N]
Interface Forces [N] Pain
Rating Q1 Q2 Q3 Q4 Q5 Q6 Q7 Q8
0.0 16.4 52.3 26.7 5.9 0.5
58.7 23.4 67.4 36.9 18.6 2.5
88.1 24.6 70.2 39.7 15.7 3.0
117.4 25.2 68.7 39.0 17.9 3.5
146.8 23.4 70.2 42.1 17.8 3.5
176.1 23.4 70.2 42.9 18.6 3.5
205.5 25.2 73.2 42.9 21.2 4.0
234.9 28.0 73.2 42.1 21.2 4.5
264.2 26.6 73.2 41.3 22.1 4.5
283.3 25.2 70.2 40.5 22.1 4.5
7" Brace Load
[N]
Interface Forces [N] Pain
Rating Q1 Q2 Q3 Q4 Q5 Q6 Q7 Q8
0.0 68.0 25.3 15.9 5.5 6.6 8.2 9.2 37.0 1.0
58.7 75.5 15.6 19.5 7.9 11.5 10.0 10.5 20.9 1.0
88.1 71.6 14.9 18.3 6.6 11.0 10.0 11.3 18.1 1.5
117.4 56.5 12.8 15.0 5.9 8.2 7.8 10.7 18.7 1.5
146.8 71.6 12.3 14.6 6.3 16.1 11.0 11.1 38.8 2.0
176.1 79.7 14.2 15.8 5.1 11.5 6.9 12.2 36.2 2.5
205.5 84.4 11.5 13.3 5.6 13.5 10.0 11.2 20.1 2.5
234.9 79.7 11.3 15.0 5.5 14.7 7.1 12.4 24.3 3.0
264.2 75.5 11.4 13.6 5.1 17.6 9.0 12.2 21.3 3.0
283.3 79.7 11.4 15.6 5.0 16.8 11.0 14.8 23.8 3.0
Mixed
Brace
Load
[N]
Interface Forces [N] Pain
Rating Q1 Q2 Q3 Q4 Q5 Q6 Q7 Q8
0.0 13.4 37.1 29.3 7.5 8.0 11.6 0.5
58.7 16.7 15.6 35.0 10.3 14.1 9.0 1.0
88.1 17.8 14.9 35.0 9.9 13.5 10.0 1.5
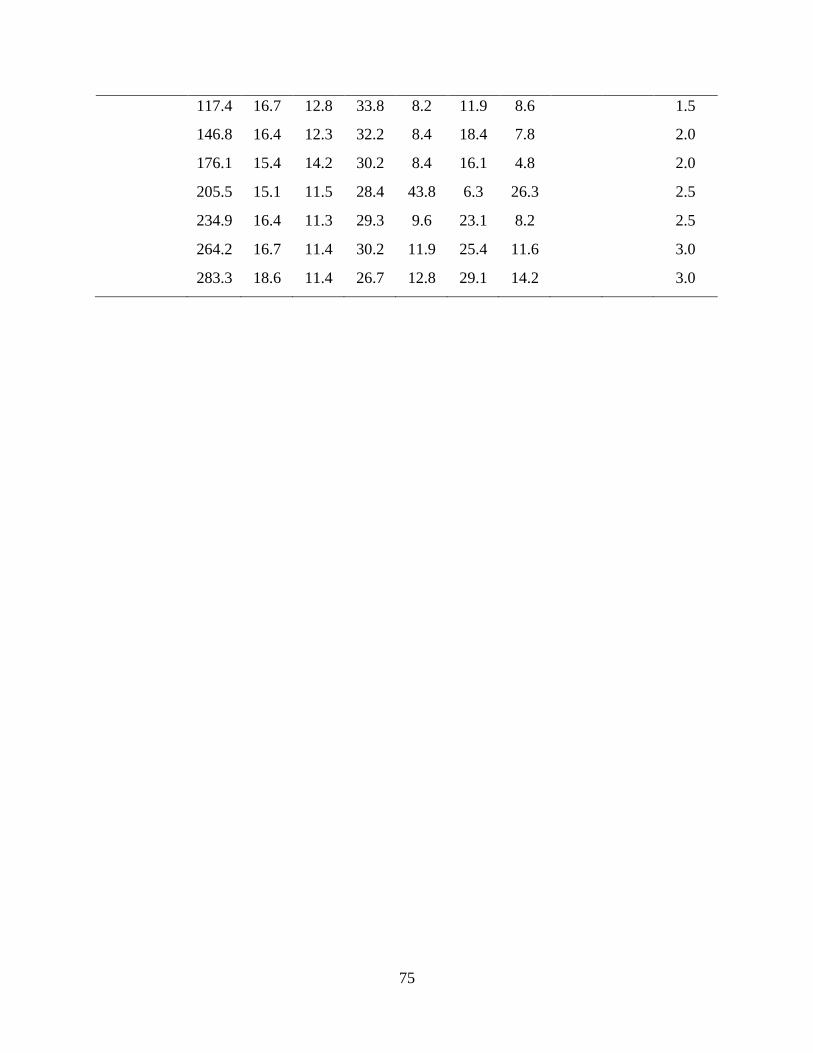
75
117.4 16.7 12.8 33.8 8.2 11.9 8.6 1.5
146.8 16.4 12.3 32.2 8.4 18.4 7.8 2.0
176.1 15.4 14.2 30.2 8.4 16.1 4.8 2.0
205.5 15.1 11.5 28.4 43.8 6.3 26.3 2.5
234.9 16.4 11.3 29.3 9.6 23.1 8.2 2.5
264.2 16.7 11.4 30.2 11.9 25.4 11.6 3.0
283.3 18.6 11.4 26.7 12.8 29.1 14.2 3.0
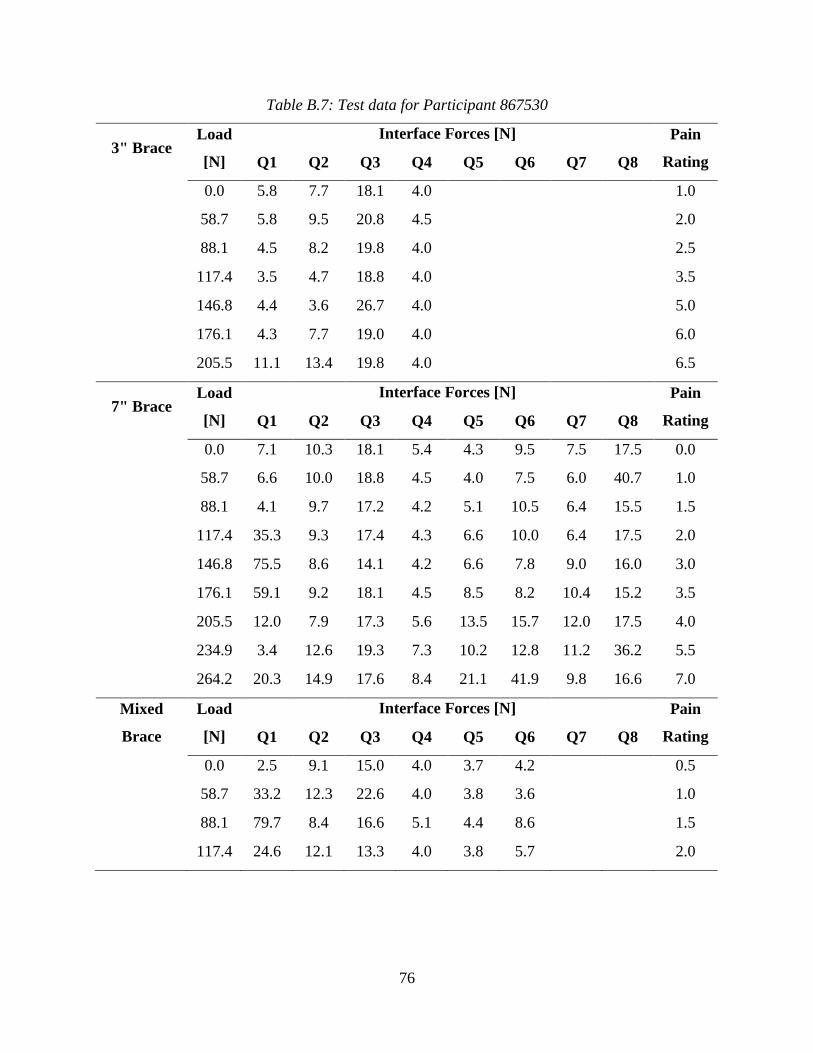
76
Table B.7: Test data for Participant 867530
3" Brace Load
[N]
Interface Forces [N] Pain
Rating Q1 Q2 Q3 Q4 Q5 Q6 Q7 Q8
0.0 5.8 7.7 18.1 4.0 1.0
58.7 5.8 9.5 20.8 4.5 2.0
88.1 4.5 8.2 19.8 4.0 2.5
117.4 3.5 4.7 18.8 4.0 3.5
146.8 4.4 3.6 26.7 4.0 5.0
176.1 4.3 7.7 19.0 4.0 6.0
205.5 11.1 13.4 19.8 4.0 6.5
7" Brace Load
[N]
Interface Forces [N] Pain
Rating Q1 Q2 Q3 Q4 Q5 Q6 Q7 Q8
0.0 7.1 10.3 18.1 5.4 4.3 9.5 7.5 17.5 0.0
58.7 6.6 10.0 18.8 4.5 4.0 7.5 6.0 40.7 1.0
88.1 4.1 9.7 17.2 4.2 5.1 10.5 6.4 15.5 1.5
117.4 35.3 9.3 17.4 4.3 6.6 10.0 6.4 17.5 2.0
146.8 75.5 8.6 14.1 4.2 6.6 7.8 9.0 16.0 3.0
176.1 59.1 9.2 18.1 4.5 8.5 8.2 10.4 15.2 3.5
205.5 12.0 7.9 17.3 5.6 13.5 15.7 12.0 17.5 4.0
234.9 3.4 12.6 19.3 7.3 10.2 12.8 11.2 36.2 5.5
264.2 20.3 14.9 17.6 8.4 21.1 41.9 9.8 16.6 7.0
Mixed
Brace
Load
[N]
Interface Forces [N] Pain
Rating Q1 Q2 Q3 Q4 Q5 Q6 Q7 Q8
0.0 2.5 9.1 15.0 4.0 3.7 4.2 0.5
58.7 33.2 12.3 22.6 4.0 3.8 3.6 1.0
88.1 79.7 8.4 16.6 5.1 4.4 8.6 1.5
117.4 24.6 12.1 13.3 4.0 3.8 5.7 2.0

77
Table B.8: Test data for Participant 520016
3" Brace Load
[N]
Interface Forces [N] Pain
Rating Q1 Q2 Q3 Q4 Q5 Q6 Q7 Q8
0.0 6.8 14.0 17.6 4.4 4.0
58.7 2.9 15.6 23.2 5.2 5.0
88.1 3.8 14.9 21.4 4.8 4.0
117.4 2.9 12.8 21.4 4.7 4.0
146.8 3.6 12.3 26.4 5.2 5.0
176.1 3.4 14.2 32.7 5.8 6.0
205.5 3.9 11.5 36.3 6.3 6.0
234.9 3.2 11.3 38.3 6.9 6.5
264.2 3.3 11.4 39.0 6.2 7.0
7" Brace Load
[N]
Interface Forces [N] Pain
Rating Q1 Q2 Q3 Q4 Q5 Q6 Q7 Q8
0.0 8.7 15.8 18.3 5.5 3.9 21.4 23.1 26.8 3.0
58.7 7.1 15.6 22.6 7.1 4.1 30.8 9.6 28.5 3.0
88.1 7.6 14.9 22.6 7.1 4.8 23.8 8.2 24.3 3.0
117.4 3.9 12.8 22.6 6.4 4.0 20.3 10.2 21.7 4.0
146.8 4.4 12.3 20.6 5.6 4.0 44.1 9.6 22.9 4.0
176.1 1.1 14.2 21.1 4.3 5.1 39.8 7.6 26.8 4.5
205.5 1.2 11.5 22.0 4.7 5.1 41.9 8.0 19.4 5.0
234.9 2.8 11.3 24.5 4.9 5.7 35.9 9.1 23.4 5.0
264.2 1.7 11.4 23.5 5.9 5.8 46.5 9.8 23.4 5.0
293.6 12.9 11.4 48.7 13.4 3.8 12.2 14.0 5.5
322.9 13.1 11.4 49.8 16.3 3.7 4.8 11.2 6.0
352.3 22.3 11.4 52.1 16.3 3.7 2.8 3.2 6.5
Mixed
Brace
Load
[N]
Interface Forces [N] Pain
Rating Q1 Q2 Q3 Q4 Q5 Q6 Q7 Q8
0.0 1.6 10.7 12.2 4.1 3.7 1.6 0.0
58.7 1.9 15.6 14.5 4.0 3.7 6.2 1.0

78
88.1 4.2 14.9 12.3 4.0 3.8 3.5 1.0
117.4 4.4 12.8 12.7 4.0 3.8 3.3 2.5
146.8 8.4 12.3 12.0 9.9 23.1 1.7 3.0
176.1 3.9 14.2 6.7 4.8 3.8 3.2 3.5
205.5 6.0 11.5 6.5 4.0 4.2 4.6 4.5
234.9 10.0 11.3 5.5 4.0 4.5 6.8 5.0
264.2 8.4 11.4 5.3 4.0 4.4 7.1 5.0
293.6 10.2 11.4 4.0 4.8 12.8 5.5
Related Documents