Design and optimization of the HVAC system for a nuclear power plant demineralization station Alexandre Oudet Master of Science Thesis KTH School of Industrial Engineering and Management Energy Technology EGI-2016-058 Division of Energy Technology SE-100 44 STOCKHOLM

Welcome message from author
This document is posted to help you gain knowledge. Please leave a comment to let me know what you think about it! Share it to your friends and learn new things together.
Transcript

Design and optimization of the HVAC
system for a nuclear power plant
demineralization station
Alexandre Oudet
Master of Science Thesis
KTH School of Industrial Engineering and Management Energy Technology EGI-2016-058
Division of Energy Technology SE-100 44 STOCKHOLM

-2-
Master of Science Thesis EGI 2016-058
Design optimization of the HVAC
system for a nuclear power plant
demineralization station
Alexandre Oudet
Approved
2016-09-02
Examiner
Jaime Arias Hurtado
Supervisor
Jaime Arias Hurtado
Commissioner
EDF
Contact person
Anna Cotty

-3-
Abstract
During nuclear power plants shutdown many people could be deprived of electricity and it would have a
negative impact both on the company’s image and on people activities. As a consequence, availability of
equipments in the different buildings which compose the power plant needs to be assured. HVAC system
(Heating, Ventilation and Air Conditioning) plays an important role on the reliability of these equipments
as it makes sure that ambient conditions in the buildings fit the operating temperature range of the
equipments. Consequently sizing a ventilation system is really important and it needs to be carried out
seriously. This paper introduces the methodology to size and optimize a ventilation system for nuclear
power plants’ building. This paper also develops the methodology used to size a smoke control system in a
nuclear related building. Direct application of this methodology has been realised for a specific building
which is the demineralization station of Hinkley Point C project.
Keyword: EDF, nuclear power plant, psychrometry, ventilation, demineralization, regulation, heat
science and thermodynamics, smoke control, pressurization, thermal modelling, Computational
Fluid Dynamic
Sammanfattning
Avstängda kärnkraftverk berövar många människor av elektricitet och det skulle ha en negativ inverkan
både på företagets framtoning och mänskliga aktiviteter. På grund av detta behöver tillgängligheten av
utrustningen i alla byggnaderna som kärnkraftverken består ses till. HVAC-system (Heating, Ventilation
and Air Conditioning) spelar en viktig roll när det gäller tillgänglighet av utrustning eftersom dessa
system ser till pålitligheten är på topp genom att anpassade omgivningsförhållanden till utrustningen.
Att designa ventilationssystemet rätt är därför mycket viktigt och måste göras noggrant. Denna rapport
introducerar metodologin för att designa och optimera ett ventilationssystem för en av byggnaderna i
ett kärnkraftverk. Utöver detta utvecklas och beskrivs en metodologi för att designa ett
rökkontrollssystem för en byggnad som ingår i kärnkraftverket. Dessa metodologier har implementerats
för en byggnad i en demineraliseringsstation, Hinkley Point C project.

-4-
Table of Contents
Abstract ........................................................................................................................................................................... 3
Sammafattning ............................................................................................................................................................... 3
Nomenclature .............................................................................................................................................................. 10
1 Introduction ........................................................................................................................................................ 11
1.1 EDF (Electricité de France) / CNEPE ................................................................................................11
1.2 Hinkley Point C (HPC) nuclear power station project .......................................................................11
2 Methodology and Objectives ........................................................................................................................... 12
2.1 Objectives ...................................................................................................................................................12
2.2 Methodology ..............................................................................................................................................12
2.3 Limitations .................................................................................................................................................12
3 Building description and technical background ............................................................................................ 13
3.1 Demineralization process ........................................................................................................................13
3.1.1 Water in a nuclear power plant ......................................................................................................13
3.1.2 Demineralized water in nuclear power plants .............................................................................15
3.1.3 How to obtain demineralized water? ............................................................................................15
3.2 Demineralization station presentation ...................................................................................................18
3.2.1 Civil works description ...................................................................................................................18
3.2.2 Building’s purpose ...........................................................................................................................18
3.2.3 Operation modes .............................................................................................................................18
4 Literature review ................................................................................................................................................. 19
4.1 Ventilation in industrial building ............................................................................................................19
4.1.1 Natural ventilation ...........................................................................................................................19
4.1.2 Single flow mechanical ventilation ................................................................................................20
4.1.3 Double-flow ventilation system (AHU) .......................................................................................20
4.2 Ventilation rules ........................................................................................................................................22
4.2.1 UK regulation for industrial buildings ..........................................................................................22
4.2.2 Design conditions ............................................................................................................................23
4.3 Smoke and heat control ...........................................................................................................................25
4.3.1 Smoke exhaust and protection system .........................................................................................25
4.3.2 Practical application on the building .............................................................................................27
4.4 Psychrometry .............................................................................................................................................29
4.4.1 Saturation pressure of water ...........................................................................................................30
4.4.2 Water content ...................................................................................................................................30
4.4.3 Dew point .........................................................................................................................................31
4.4.4 Specific enthalpy ..............................................................................................................................31

-5-
4.5 Humid air processes and air mixing .......................................................................................................31
4.5.1 Air mixing..........................................................................................................................................32
4.5.2 Representation on the psychrometric chart .................................................................................32
4.5.3 Extraction temperature for an AHU ............................................................................................33
4.5.4 Air heating .........................................................................................................................................33
4.5.5 Air cooling .........................................................................................................................................34
4.5.6 Air humidifying ................................................................................................................................38
4.5.7 Impossible air processes .................................................................................................................40
4.6 Pressure gradient and infiltration............................................................................................................40
4.6.1 Pressure gradient ..............................................................................................................................41
5 Calculation methodology review ...................................................................................................................... 43
5.1 External conditions ...................................................................................................................................43
5.1.1 Air temperature ................................................................................................................................43
5.1.2 Ground temperature ........................................................................................................................43
5.1.3 Wind ...................................................................................................................................................43
5.2 Heat gains and losses ................................................................................................................................43
5.2.1 Sensible heat gains/losses ...............................................................................................................43
5.2.2 Latent heat load ................................................................................................................................47
5.2.3 Total heat load ..................................................................................................................................48
5.3 Heat gains on supply air ...........................................................................................................................48
5.3.1 Heat gains/losses to the supply distribution duct ......................................................................48
5.3.2 Heat gain from the fan ....................................................................................................................49
5.4 Margins .......................................................................................................................................................51
5.4.1 On heat gains ....................................................................................................................................51
5.4.2 On flow rates ....................................................................................................................................52
5.5 Energy balance of a room ........................................................................................................................53
5.5.1 Heat balance .....................................................................................................................................53
5.5.2 Sensible heat balance .......................................................................................................................53
5.5.3 Humidity balance .............................................................................................................................54
5.5.4 Defining the space line ....................................................................................................................54
5.6 Blowing conditions ...................................................................................................................................54
5.6.1 Characteristic of the blowing air temperature difference ..........................................................55
5.6.2 Mixing rate ........................................................................................................................................55
5.6.3 Theoretical aspect and calculation ................................................................................................55
6 TH-Bât Software ................................................................................................................................................ 59
6.1 Input data ...................................................................................................................................................59
6.2 Zone property ............................................................................................................................................60

-6-
6.3 Wall property .............................................................................................................................................60
6.4 Ventilation property..................................................................................................................................61
6.5 Opening property ......................................................................................................................................61
7 Parametric study ................................................................................................................................................. 62
7.1 Glazed surface ...........................................................................................................................................62
7.2 HVAC system choice ...............................................................................................................................62
7.2.1 40°C outside Temperature .............................................................................................................63
7.2.2 33°C outside temperature, design without AHU ........................................................................66
7.3 Scenario analysis ........................................................................................................................................67
7.3.1 Scenario 1: White painting ..............................................................................................................67
7.3.2 Scenario 2: Insulation ......................................................................................................................68
7.3.3 Scenario 3: Combination of insulation and white painting .......................................................68
7.3.4 Comparison with the baseline scenario ........................................................................................69
7.4 Ventilation system control .......................................................................................................................70
7.4.1 Demineralization station HVAC system control ........................................................................70
7.4.2 HVAC system control cost ............................................................................................................73
7.5 Critical scenario analysis in chemical rooms .........................................................................................75
8 Ansys Fluent Modeling...................................................................................................................................... 77
8.1 Software presentation ...............................................................................................................................77
8.1.1 Meshing .............................................................................................................................................77
8.2 Turbulence modeling ................................................................................................................................80
8.2.1 RANS –based turbulence model ...................................................................................................81
8.3 Methodology adopted ..............................................................................................................................81
9 Results .................................................................................................................................................................. 89
9.1 HVAC system sizing .................................................................................................................................89
9.1.1 Internal Heat Gains .........................................................................................................................89
9.1.2 Blowing conditions justifications ..................................................................................................90
9.1.3 Heat gains on supply air ..................................................................................................................90
9.1.4 Final sizing ........................................................................................................................................91
9.2 Over-pressurization of the hall ...............................................................................................................95
9.3 Smoke Control System Sizing .................................................................................................................96
10 Discussion and Conclusion ........................................................................ Error! Bookmark not defined.
References..................................................................................................................................................................... 99

-7-
Table of figures
Figure 1: The three water circuits of a nuclear power plant. (5) .........................................................................................13
Figure 2: Closed cooling system with its cooling tower. (6) .................................................................................................14
Figure 3: Open cooling system. (6) ....................................................................................................................................14
Figure 4: Water level in two tanks separated by a semi-permeable membrane ....................................................................15
Figure 5: Osmosis principle ..............................................................................................................................................16
Figure 6: Reverse osmosis principle ...................................................................................................................................16
Figure 7: Reverse osmosis in industry ................................................................................................................................16
Figure 8: System without pressure (Water to be treated is on the left of the membrane) ......................................................17
Figure 9: System pressurized: Water is treated and flows in the right part .........................................................................17
Figure 10: Mixed beds working principle .........................................................................................................................17
Figure 11: Natural ventilation system. (11) .....................................................................................................................19
Figure 12: Single flow mechanical ventilation. (11) ...........................................................................................................20
Figure 13: Double flow ventilation system with an AHU. (11) .......................................................................................21
Figure 14: Smoke control pressurization system ................................................................................................................27
Figure 15: Psychrometric chart of humid air (22) .............................................................................................................29
Figure 16: Mixing of two air streams called “1” and “2” ................................................................................................32
Figure 17: Mixing of two humid air streams in a psychrometric chart ...............................................................................33
Figure 18: Heating of humid air on a psychrometric chart .................................................................................................34
Figure 19: Dry cooling of humid air on a psychrometric chart ............................................................................................35
Figure 20: Humid cooling of humid air on a psychrometric chart .......................................................................................36
Figure 21: Representation of sensible and latent heat during humid cooling ........................................................................38
Figure 22: humidification by water injection on a psychrometric chart ................................................................................39
Figure 23: humidification by steam injection on a psychrometric chart (dotted line: reality/ full line: theory) .......................40
Figure 24: (Left) impossible humid cooling process / (Right) impossible mixing of two air streams ....................................40
Figure 25: Drawing of a room’s energy balance .................................................................................................................53
Figure 26: Evolution of psychometry in a room, from the supply state 1 to the extraction 2 (space line) ..............................54
Figure 27: Drawing of two rooms used for Excel modelling and cardinal directions ...........................................................57
Figure 28: Wall modelling inTh-bât software ...................................................................................................................60
Figure 29: Cross section of the demineralization station with an AHU supplying air everywhere .......................................63
Figure 30: Steady state temperature of the basement (10 rooms) for 40°C outside with an AHU .....................................64
Figure 31: Cross section of the demineralization showing the two distinct parts of the building ...........................................64
Figure 32: Steady state temperature of the basement for 40°C outside without an AHU ..................................................65
Figure 33: Cross section of the demineralization station with a single flow ventilation system .............................................66
Figure 34: Temperature evolution in the main hall after a rapid increase of outside temperature from 33°C to 40°C .........66
Figure 35: Zoom in on Figure 34 ....................................................................................................................................67
Figure 36: Temperature of the hall depending on the presence of a control system ...............................................................70
Figure 37: Graphs showing the net present value of the investment for a control system ......................................................74
Figure 38: Evolution of the temperature after ACH increase in chemical rooms (summer) .................................................75
Figure 39: Evolution of the temperature after ACH increase in chemical rooms (winter) ...................................................76
Figure 40: Steady state temperature after ACH increase in chemical rooms (winter) .........................................................76
Figure 41: 2D cell types ...................................................................................................................................................77
Figure 42: 3D cell types ...................................................................................................................................................77
Figure 43: Structured grid around an airfoil .....................................................................................................................78
Figure 44: Unstructured grid around an airfoil .................................................................................................................78
Figure 45: Hybrid grid for a rotor/stator geometry ...........................................................................................................79
Figure 46: Size change between two adjacent cells (<20%) ...............................................................................................80
Figure 47: Geometry of the longest air duct in HY building (Design Modeler) ..................................................................82
Figure 48: Schematic representation of HY building’s ground floor ...................................................................................82
Figure 49: Hexahedral meshing of the air duct .................................................................................................................83

-8-
Figure 50: Tetrahedral meshing of the air duct ..................................................................................................................83
Figure 51: Air duct planes (Plane n°1: green and Plane n°2: red) ...................................................................................84
Figure 52: Temperature in plane n°1 (k-omega model) .....................................................................................................85
Figure 53: Temperature in plane n°1 (k-epsilon realizable model) ....................................................................................85
Figure 54: Temperature in plane n°2 ...............................................................................................................................86
Figure 55: Walls temperature of the air duct ....................................................................................................................86
Figure 56: Temperature in plane n°1 for insulated walls ..................................................................................................87
Figure 57: Temperature in plane n°1 for an inlet temperature equal to 14.6°C ................................................................88
Figure 58: Cooling process of humid air for an external temperature of 40°C ...................................................................93
Figure 59: Psychrometric chart representing evolution of air for rooms housing workers in summer .....................................94
Figure 60: Psychrometric chart representing air humidification in winter for rooms housing employees in winter (-15°C) ....95

-9-
Table of tables
Table 1: Maximum acceptable dB in different building’s area (14) ...................................................................................23
Table 2: Recommended maximum duct velocities for low pressure ductwork. (16) ..............................................................23
Table 3: Admissible temperature range in HY building ...................................................................................................25
Table 4: Minimum ACH in HY building ......................................................................................................................25
Table 5: Recommendations for fire-fighting shafts ventilated by natural means ...................................................................26
Table 6: Electrical room mechanical smoke extraction ......................................................................................................27
Table 7: Basement mechanical smoke extraction ...............................................................................................................27
Table 8: Air leakage depending on the pressure differential applied and the leakage area (20) ...........................................28
Table 9: External temperature considered for HVAC designs .........................................................................................43
Table 10: Wind speed considered for HVAC designs ......................................................................................................43
Table 11: heat transfer coefficients depending on walls and season ......................................................................................44
Table 12: Values of CLTD, LM and k for concrete walls more than 300mm thick ........................................................45
Table 13: Values of CLTD, LM and k for cladding ......................................................................................................45
Table 14: Values of CLTD, MSHGF, SC and CLF for a Pilkington double glazed window .......................................46
Table 15: Power from lighting (28) ..................................................................................................................................46
Table 16: Heat released by human body depending on the activity (26) .............................................................................46
Table 17: Representative rates at which heat and moisture are given off by human beings for different activities (17) ..........47
Table 18: Loss of heat and water vapor in the human body for an individual sitting in light activity (32) ..........................48
Table 19: External convective resistance for different air ducts layout ................................................................................49
Table 20: Internal convective resistance for different air speed ............................................................................................49
Table 21: Efficiency of different fans (16) .........................................................................................................................50
Table 22: Motor efficiency (17) ........................................................................................................................................50
Table 23: Required mixing rate in a room (30) ...............................................................................................................55
Table 24: Thermal conductivity of materials (35) .............................................................................................................59
Table 25: Heat transfer coefficient for doors and windows (35) .........................................................................................59
Table 26: Materials’ thermal diffusivity and layer thickness ..............................................................................................61
Table 27: MSGHF for different wall orientation .............................................................................................................62
Table 28: Heat gains for different windows location ..........................................................................................................62
Table 29: Results obtained with the first and the second HVAC design ...........................................................................65
Table 30: HVAC equipment required for scenario 1 .......................................................................................................68
Table 31: HVAC equipment required for scenario 2 .......................................................................................................68
Table 32: HVAC equipment required for scenario 3 .......................................................................................................68
Table 33: Comparison between the three different scenarios for 40°C and -15°C ..............................................................69
Table 34: Comparison between the three different scenarios for 2°C ..................................................................................69
Table 35: Comparison between the three different scenarios for 20.5°C .............................................................................69
Table 36: Power consumption for HVAC system with and without control by -15°C outside ...........................................70
Table 37: Average temperatures in Somerset England (36) ..............................................................................................71
Table 38: Assessment of energy gains for each month with and without a control system ....................................................72
Table 39: Energy saved each month by having a control ....................................................................................................72
Table 40: Net present value for a control system investment ..............................................................................................73
Table 41: Cell quality depending on the value of skewness ................................................................................................79
Table 42: Internal heat gains in HY building ..................................................................................................................89
Table 43: Temperature in the hall depending on supply air temperature ............................................................................90
Table 44: AHU flow rates, heating and cooling needed to be implemented in the different rooms of HY building ...............92
Table 45: List of fire doors in HY building .....................................................................................................................96

-10-
Nomenclature
EDF Electricité De France
CNEPE National Centre of Electricity Production Equipment
HPC Hinkley Point C
HVAC Heating, Ventilating and Air Conditioning
HY Name of the Demineralization station
SDA System producing water at pH7 and pH9
SER System storing and supplying water at pH9
SED System storing and supplying water at pH7
0REA System producing and supplying degassed water at pH7
DVT Name of the Ventilation system of the Demineralization station
EPR European Pressurized Water Reactor
PWR Pressurized Water Reactor
CFD Computational Fluid Dynamic
RANS Reynolds-Averaged Navier-Stokes
LES Large Eddy Simulation
DNS Direct Numerical Simulation
NPV Net Present Value
I&C Instrumentation and Control
φ Relative humidity (%)
pv Partial pressure of water vapour in air (Pa)
pv’’ Saturation pressure of water in air (Pa)
x Water content (kgwater/kgdry air)
h Enthalpy (kJ/kg)
T Temperature (K)
cp Specific heat (kJ/kg.K)
qm Mass flow rate (kg/s)
qv Volumetric flow rate (m3/s)
P Power (W)
BF Bypass Factor (%)
ξ Efficiency (%)
m Mass (kg)
p Pressure (Pa)
V Volume (m3)
v Speed (m/s)
S Surface (m²)
U Thermal transmission coefficient (W/(m².K))
CLTD Cooling Load Temperature Difference
Fo Fourier Number
α Thermal diffusivity (m²/s)

-11-
1 Introduction
At the moment EDF (Electricité de France) is working on the construction project of two EPR nuclear
reactors in Great Britain (Hinckley Point C project). They are currently carrying out pre-studies. This phase
is really important mainly for two reasons. Firstly nuclear power plants present potential risks to the
population, these risks need to be assessed during this pre-design phase so that they can be avoided during
plant operation. Secondly, EPR reactors produce an important amount of electricity and the least fault or
problem in one of the building could result in a cessation of electricity production. During the breakdown
many people could be deprived of electricity and it would have a negative impact on company’s image.
Safety and reliability are then the main concerns when it comes to nuclear buildings and it has a direct
influence on the price of such a project that is estimated to several billion Euros. Consequently modeling
and optimization studies are necessary in order reduce down to zero the risk of the project. The main goal
of EDF is then to fulfill the different requirements imposed by the regulations and tenderers while trying
to save money.
This report focuses on the HVAC system of a specific building housing the water demineralization process.
By optimizing the size of the ventilation system, installation is easier as there is more space for other
equipment such as electric cables, piping and so on. Moreover over-sizing the ventilation system is energy
consuming especially when it comes to industrial buildings used in nuclear power plants that are supposed
to be operational 24/24h and have a lifespan of sixty years. Within EDF, the CNEPE (National Centre of
Electricity Production Equipment) is among a lot of other activities in charge of the HVAC system of this
specific building.
1.1 EDF (Electricité de France) / CNEPE
EDF is the first electricity producer and supplier in France and worldwide. This company is then specialised
in electricity from design to distribution and it covers almost all sectors of expertise such as trading,
generation and transmission grids. With its mix of nuclear, fossil-fired generation capacity, hydroelectricity
combined with other renewable energy sources, EDF operates a highly diversified and efficient power
generation fleet. In France, nuclear power remains the mainspring of electrical power generation as it
represents 77% of the total power generated. Nuclear is combined with other energy sources such as hydro,
coal and oil to cope with energy peaks as for instance during really cold season. Even though EDF still relies
on fossil fuels, renewable energies are getting more and more importance as EDF consecrates 35% of its
investments into their development. (1)
Within the Engineering and Projects department, the CNEPE (National Centre of Electricity Production
Equipment) founded in 1955 hosts design activities related to non-nuclear buildings such as the Cold Source
and the Conventional Island of nuclear power plants for new projects and plants in operation. The main
role of this unit is to extend the operating time of nuclear power plants. It is located in France and counts
about 700 employees. The HVAC group in which this thesis was carried out is responsible for designing
HVAC system for non-nuclear buildings under CNEPE’s responsibility. (2)
1.2 Hinkley Point C (HPC) nuclear power station project
EDF is currently working on a project in Somerset, South West England. It is a project that will lead to the
construction of two EPR reactors equivalent to 1600MWe each. An EPR reactor is a pressurized water
reactor (PWR) of the third generation which has been designed and developed by EDF and Areva NP. The
branch of EDF that is responsible for this project in United Kingdom is called EDF Energy. (3)

-12-
2 Methodology and Objectives
In order to carry out this project a clear methodology and precise objectives need to be set. They will be
presented in the two following paragraphs.
2.1 Objectives
The main purpose of this thesis is the design and optimization of a ventilation system for an industrial
building. The building considered is the demineralization station building also called HY building. It is a
non-nuclear safety related building which houses the SDA, SER, SED and 0REA systems and their
associated support systems:
SDA system produces water at pH7 and pH9. It gets raw water from industrial water supply system,
transform it and supply it to SER and SED systems.
SER system stores and supplies demineralized water at pH9 in normal unit operation for the plant.
SED system stores and supplies demineralized water at pH7 in normal unit operation for the plant.
0REA system collects demineralized water from SED tanks and then produces, stores and supplies
degassed demineralized water at pH7.
Within this building the HVAC system will be further analyzed. This ventilation system has many purposes
and needs to fulfill the following requirements:
Provide sufficient air renewal for personnel comfort and hygiene but also for workers’ safety in the laboratory and chemical storage rooms.
Continuously maintain the various areas of the building at an acceptable ambient temperature and relative humidity that is suitable for correct functioning of electrical equipment, good working conditions and maintenance operations.
In the event of a fire, the role of DVT system is to ensure smoke control, isolate fire sectors, and
make the evacuation of the staff and the intervention of firemen easier.
Through this thesis the following questions will be answered:
How to maintain the requested ambient conditions within a building at a desired level for extreme external
temperatures? What are the possible optimizations of the HVAC system? What margins are to be considered
in order give robustness to the system?
2.2 Methodology
Getting familiar with the demineralization process thanks to training courses
Literature survey on ventilation system technologies, smoke control systems, UK regulations, psychrometry and humid air.
Modeling of the building in Excel to size the ventilation
Development of a thermal model of the building on Th-bât (EDF software)
Scenario analysis in order to optimize the HVAC system of the building
Modelling on Ansys FLUENT in order to assess potential margins that would need to be taken into account.
2.3 Limitations
Due to confidentiality issues, some documents used in references are not available for people outside EDF.
Moreover, civil works drawings, 3D model of the building and mechanical diagram of the HVAC system
cannot be displayed in a public document. Results and calculations are not fully described to be consistent
with the confidentiality policy of the company.

-13-
3 Building description and technical background
The main role of a ventilation system is to assure the good working of a process. As a consequence in order
to size a ventilation system it is primordial to understand how the demineralization process works.
3.1 Demineralization process
The main purpose of the demineralization station is to transform raw water into purified water. Indeed in
nuclear power plants water has an important role and its quality needs to be constantly controlled in order
to insure the proper functioning of the plant.
3.1.1 Water in a nuclear power plant
French nuclear power plants all work the same way. They are pressurized water reactors (PWR). Their
principle is the same as thermal power plants, with the difference that the fuel used is uranium. Water is
essential to the operation of a nuclear plant. It creates the necessary steam to drive the turbine of the reactor.
It is also used to cool down and condense the vapor. Nuclear power plants are composed of three
independent water circuits: the primary circuit, the secondary circuit and the cooling system (respectively in
orange, blue and green in Figure 1). (4)
The main purpose of the primary circuit is heat extraction. It is a closed pressurized water circuit at
a temperature of 320°C and 155bar. Water runs through the reactor and receives the heat generated by the
nuclear fuel fission reaction. This water heats up water from the secondary circuit via a vapor generator that
enables thermal heat transfer between these two independent circuits. To make it simple pipes from the
primary circuit heats up water from the secondary circuit by contact. (4)
The secondary circuit is used to produce steam. Through contact with thousands of U shaped tubes
composing the steam generator, water from the primary circuit transfer its heat to water flowing in the
secondary circuit. This circuit is not as pressurized as the primary circuit, that’s why water from this circuit
is converted into steam which is used to spin the turbine. It drives the generator that produces electricity.
Then steam goes back to the liquid state when it flows through the condenser. Water is sent back to the
steam generator for a new cycle. (4)
In order to condense steam and evacuate heat, the cooling circuit is made of a condenser. It is a
component composed of thousands of tubes into which cold water from the sea or the river flows. Through
contact with these tubes, steam condenses.
Figure 1: The three water circuits of a nuclear power plant. (5)

-14-
Two kinds of cooling system can be used in nuclear power plants. There are open cooling systems
for nuclear power plants located near the sea or close to a river with a large flow and closed cooling systems
for power plants located next to a low flow river. (6)
In a closed circuit (Figure 2) hot water from the condenser is cooled down by cold air in a large
cooling tower. A fraction of the water is vaporized and exits the cooling tower as a visible plume at the top
of the tower. The rest of the water is sent back to the condenser. With this system the water taken from the
cold source is less important (about 2 cubic meters per second in average). (6)
Figure 2: Closed cooling system with its cooling tower. (6)
In an open cooling circuit (Figure 3), water is pumped directly from the sea or the river in a much
larger amount (about 50 cubic meters per second) and is released in its natural environment at a slightly
higher temperature after having circulated in the condenser. The Hinkley point C nuclear power station is
located close to the sea and will have an open cooling system.
Figure 3: Open cooling system. (6)

-15-
3.1.2 Demineralized water in nuclear power plants
Demineralized water is used in primary and secondary circuit. The main purpose of demineralized water is
to prevent pipe corrosion or chemical reaction that could deteriorate the circuits and limit their performance.
Even if these circuits are closed, make-up water and draining are necessary for the proper functioning of
the nuclear power plant. As consequences make-up demineralized water needs to be provided on a daily
basis. (6)
3.1.3 How to obtain demineralized water?
Demineralized water is water that contains in principle no ions. But some uncharged particles such as
organic matter or bacteria can remain. It is also called purified water. At ambient temperature, the pH of
the demineralized water is about 7.
In order to produce demineralized water three successive steps are carried out. A pretreatment by Granular
Activated Carbon, a reverse osmosis double pass and mixed bed.
The first step is the pretreatment by Granulated Activated carbon (GAC). Its main role is the protection of
reverse osmosis membranes. Even if raw water is supposed to have a good quality and a low fouling
potential, it is always recommendable to have a filtration step in order to protect reverse osmosis
membranes. (7)
The second step is the primary demineralization with two passes of reverse osmosis. Reverse osmosis is a
process that aims at producing demineralized water for various uses in industry or for private individual.
The following experience and technical considerations will lead to a better understanding of the
phenomenon of reverse osmosis. When water is poured into two tanks separated by a semi permeable
membrane, the level in each tank is shown in Figure 4.
A B
Semi-permeable
Membrane
Figure 4: Water level in two tanks separated by a semi-permeable membrane
A semi permeable membrane has the property of blocking the salts contained in water by not allowing them
to migrate through it. However, if one put water of different saline qualities on each side of the membrane,
water as a solvent will migrate from the tank with the lowest concentration (B) to the tank with the highest
concentration (A) in order to equilibrate the concentrations. A level difference will occur (Figure 5).
Consequently a pressure difference appears called “osmotic pressure” given by Van’t Hoff equation. (8)

-16-
A B
Semi-permeable
Membrane
Salt
water
Fresh
water
Direction of water flow
Δh
Figure 5: Osmosis principle
Thus, if one operate in the most saline capacity (A) a pressure greater than osmotic pressure, the
phenomenon will reverse and it will create a migration of water as a solvent without salinity (i.e. desalted
water) to the low concentration tank. It is called reverse osmosis (Figure 6). (9)
A B
Semi-permeable
Membrane
Salt
water
Fresh
water
Direction of water flow
Applied
pressurePure water
Figure 6: Reverse osmosis principle
In industry a high pressure pump (from 25 bars to 80 bars) sends raw water in a compartment separated in
two by a semi permeable membrane that allows water as a solvent without salinity (osmosis purified water)
to flow through it. The salinity will increase in the upstream part of the membrane (left part of the drawing)
that’s why a loss of concentration or “deconcentration” is necessary in order to limit the saline
concentration. The principle of reverse osmosis is simplified in Figure 7: Reverse osmosis in industryFigure 7.
Semi-permeable
Membrane
High pressure
pump
Raw Water
Deconcentration
Osmosed
Water
Figure 7: Reverse osmosis in industry

-17-
In Figure 8 and Figure 9 are shown drawings of the demineralization process:
Semi-permeable
Membrane
High pressure
pump
Raw Water
Figure 8: System without pressure (Water to be treated is on the left of the membrane)
Semi-permeable
Membrane
High pressure
pump
Raw Water
Deconcentration
Osmosed
Water
Figure 9: System pressurized: Water is treated and flows in the right part
The third and last step is the polishing step by mixed beds (Figure 10). It contains both cations and anions
resins. Basically, water flows through ion exchange resins that block anions and cations in the water by
replacing them by ions OH- and H+. System regeneration is made by extracting ions fixed by the resins and
replacing them by ion OH- and H+. This step is performed by in situ regenerated mixed beds which ensure
good reliability of operation in the case of quality variations of the water to be treated. Indeed, even in the
case of a quality degradation of the produced water by the reverse osmosis process, water quality obtained
at the output of mixed bed remains constant (there is an impact on the regeneration frequency, which can
be easily managed). It will then supply good water quality even if one of the several reverse osmosis
membranes is leaking. (10)
Cation
resins
Anion
resins
Water
Rejection Rejection
Demineralized
Water
OH-H
+
Figure 10: Mixed beds working principle

-18-
3.2 Demineralization station presentation
In this part will be presented the demineralization station civil works and purposes. It is necessary in order
to have a better representation of the building.
3.2.1 Civil works description
HY building is a semi-buried parallelepiped building, with a concrete raft foundation, surrounded by
retaining walls. The superstructure is principally made of a metal framework covered by cladding with 10cm
insulation and is approximately 13m high. One entire side of the building superstructure (East side) is in
reinforced concrete, on its entire height. The North wall of the building has 20% of its surface that is glazed
in order to have some natural light entering the building. Due to confidentiality issue, I can’t display the
building’s drawings in this report.
The main dimensions of HY building are approximately the following:
Length: 31m,
Width: 38m,
Height under ground level: 6,80m (except at the neutralization pit location: 10,50m),
Maximum height above ground level: 12.70m.
3.2.2 Building’s purpose
HY is the demineralization station building. It is a non-nuclear safety related building which means that if a
fault appears in this kind of building it won’t harm people around. It will just result in a loss of power
generated by the power plant if the breakdown lasts long enough. The demineralization station houses the
SDA, SER, SED and 0REA systems and their associated support systems:
SDA system produces water at pH7 and pH9. It gets raw water from industrial water supply system,
transform it and supply it to SER and SED systems.
SER system stores and supplies demineralized water at pH9 in normal unit operation for the plant.
SED system stores and supplies demineralized water at pH7 in normal unit operation for the plant.
0REA system collects demineralized water from SED tanks and then produces, stores and supplies
degassed demineralized water at pH7.
3.2.3 Operation modes
The value of 99.9% availability is required by the FMECA (Failure Mode, effects and criticality analysis) study carried out during the execution phase. Consequently temperatures in the building needs to be maintained at the desired level so that demineralized water can be produced 24/24h. However a storage water tank will be implemented to manage unsuspected breakdown or problems.

-19-
4 Literature review
To get familiar with ventilation systems, smoke control systems and psychrometry a literature review has
been carried out on these different topics.
4.1 Ventilation in industrial building
Ventilation in industrial building is necessary in order to maintain acceptable operating temperatures for
equipments and good working conditions for employees. In this part the most common ways of ventilating
a building will be presented.
4.1.1 Natural ventilation
In a natural ventilation system, no fan is involved. Air moves thanks to pressure differences due to wind and density difference depending on its temperature. It is called a thermal draught or chimney effect. The airflow is totally natural. Air can enter a building through leakages. However, it cannot be considered as a proper ventilation system. Indeed, the resulting air flows are completely uncontrollable and depend on the wind, parasites openings, atmospheric pressure... Equipments such as adjustable grilles must be arranged on the frontage for so-called "clean" rooms. Transfer openings allow the passing of air to the so-called "wet" or "contaminated" rooms (bathroom, chemical room ...). In these locals, air is expelled through vertical ducts leading outside. (11)
Figure 11: Natural ventilation system. (11)
Advantages: A fully natural ventilation system requires no power consumption, the engine used to move the air being wind pressure and temperature differences. Thus it is economic and reduces the building's impact on the environment. In addition, natural ventilation elements generally require very little maintenance and do not include noisy fans. Drawbacks: Natural ventilation depends on the natural phenomena creating the movement of air. Therefore air quality might not be ensured in all the rooms. Indeed air change rate (ACH) can be disrupted by wind, temperature, openings and the atmospheric pressure … Requested airflows are therefore hardly reachable especially for rooms housing chemicals that need a huge air change rate of about 10 ACH.

-20-
4.1.2 Single flow mechanical ventilation
One talks about single-flow mechanical ventilation when either air supply or air extraction is realised thanks
to a fan. The most encountered single-flow ventilation consists in creating air circulation in the building so
that air gets in the building by rooms with low pollutants (offices) and then supply all rooms which contains
more pollutants or smell bad (sanitary room) before being extracted on the roof. To do so extraction fan
are required on the roof to suck air out of the building and supply grilles are requested on the building’s
frontages. (11)
Figure 12: Single flow mechanical ventilation. (11)
Advantages:
Single-flow ventilation is simple and cheap. It requires only a limited space within the building as only
extraction air ducts are needed. Even though this method is cheap, airflow can be controlled thanks to
extraction fans. It is easily implementable and maintenance is almost inexistent. Moreover, balancing the
network is quite simple as operating speed of fans can be controlled.
Drawbacks:
The main drawback of this system is that really cold air in winter and really hot air in summer is supplied to
the building. As consequences, if big ACH are requested additional heating and cooling power will be huge.
Moreover a lot of energy is lost as air within the building is evacuated outside without being reused. Energy
used to heat up or cool down this air is then lost.
4.1.3 Double-flow ventilation system (AHU)
In industry double flow ventilation system is the mostly used. Its working principle and its components will
be described in this section.
4.1.3.1 Working Principle
Double-flow ventilation consists in extracting contaminated air from a building while replacing it by fresh
air from outside. Fresh air is mixed with extracted air which heats up fresh air in winter and cools it down
in summer. Then air flows through a heating coil, a cooling coil, a humidifier, filters …
Basically, an Air Handling Unit is an equipment used to heat up, cool down and humidify air supplied to a
building. The double-flow Air Handling Unit allows the mixing between fresh air and extracted air thanks
to a mixing box. (11) Due to space issues other heat recovery system will be overlooked.

-21-
Figure 13: Double flow ventilation system with an AHU. (11)
Advantages:
Whatever the external conditions this system is the easiest to control. Air is treated before being supplied
to the different rooms, thus air is brought to a temperature close to the rooms’ temperatures which reduce
the lack of comfort. You can recycle air from the inside in order to heat up outside air in winter or cool it
down in summer, thus saving energy.
Drawbacks:
This system is expensive and space consuming. Many air ducts have to be installed it might be a problem if
the building is tight and cramped. It is a system really hard to balance and additional margins have to be
taken into account in order to consider the fact that balancing might not be perfect. It might lead to an over
sizing of the ventilation system.
4.1.3.2 Components
An Air Handling Unit can have many components that will depend on the temperature and air quality
requested in the building. Here is a non-exhaustive list of equipment that can be found in the Air Handling
Unit that would be implemented in the demineralization station:
An extraction fan
A supply fan
A filtration system that protect the AHU against dusts and particles harmful to its good working.
It is particularly important in our case as the nuclear power plant is really close to the sea and salt
might deteriorate our equipment. Several level of filtration can be found from low to high efficiency.
Fresh air damper
Reused air damper
A mixing box that mixes air from outside with air extracted from the rooms. Fresh air and reused
air dampers are synchronised to supply the right balance between fresh and extracted air.
Heating coil. It works either with hot water or with electricity.
Cooling coil. It works either directly with refrigerant or with cold water. Cold water flows through
a coil and cool down the air in the AHU. The cold water configuration will be chosen in order to

-22-
limit the mass of refrigerant in our system. Moreover a cold water tank is required in order to
increase the inertia of the system and increase the life span of the water chiller.
A humidifier is used to humidify the air if required. It can work either by steam injection or directly
with water.
4.2 Ventilation rules
Air renewal of a room is insured by fresh, non-polluted air coming from outside. The main purposes of this
air renewal are to maintain an acceptable level of oxygen, eliminate excess humidity and pollutants. As a
consequence, filtration might be necessary in order to treat air from outside before supplying it to the
building.
4.2.1 UK regulation for industrial buildings
4.2.1.1 Minimum fresh air requirements
UK Workplace (Health, Safety and Welfare) Regulations (12), require a minimum fresh air supply of 8 liters
per second per person in the workplace. The minimum air change rate is fixed to 0.5 in rooms where there
are no people working.
4.2.1.2 Room environmental conditions
UK Workplace (Health, Safety and Welfare) Regulations (12) require that the workplace is heated to provide
comfortable work conditions without the need for special clothing. A minimum temperature of 16°C is
advised for normal working environments and 13°C for work requiring rigorous activity. These
requirements don’t need to be applied where it is impractical to do so. According to UK Workplace
regulations relative humidity should not be lower than 30% and not exceed 60% in rooms where people
work permanently. The average value of 45% will be considered in this paper.
4.2.1.3 Protection from certain gases
UK Workplace (Health, Safety and Welfare) Regulations (12)
UK Control of Substances Hazardous to Health (COSHH) Regulations (13)
Regulatory requirements require specific risk assessments to be carried out in respect of gaseous
contaminants that may be released into the workplace for toxic, asphyxiating, flammable and or explosive
gases, vapors or particulates.
Risks to workers must be eliminated or reduced as far as practical by removal of contaminants at the point
of release if possible using local exhaust ventilation systems or sufficient dilution ventilation where this is
not possible.
4.2.1.4 Noise control
UK Control of Noise at Work Regulations (14)
UK Environmental Noise Regulations (15) The regulations stipulate lower exposure action level of 80dB (A) and upper exposure action level of 85dB (A), the exposure limit is 87dB (A). Whenever possible noise should be eliminated from the workplace or reduced as far as it is reasonably practicable. In Table 1 are described the maximum admissible decibel value in different building’s area.

-23-
Rooms Noise level
Main Control Room 45dB
Offices, rest room, laboratories 45dB
Corridors, computer rooms 60dB
Workshops 70dB
Ventilation Plant Rooms 85dB
Space containing local control with low occupancy 80dB
Table 1: Maximum acceptable dB in different building’s area (14)
Noise is generated by fans and will propagate through the ductwork in both directions to all inlets and outlets. Additional noise can be introduced by components in the duct system and along the duct network. Acoustic calculations should be performed when the duct design is completed to check that noise levels in the most critical rooms (or those closest to the fan) are not exceeded. Design guidance limits for low, medium and high velocity duct systems for specific applications / noise constraints are published in CIBSE Guide B. (16) Maximum velocities in ducts are displayed in Table 2 in m/s.
Typical applications Typical noise
rating Velocity in main ducts
Velocity in branch
Velocity in Runouts
Domestic buildings 25 3.0 2.5 <2.0
Theaters, concert halls 20-25 4.0 2.5 <2.0
Private offices, libraries 30-35 6.0 5.5 3.0
General offices, restaurants, banks
35-40 7.5 6.0 3.5
Department stores, supermarkets, shops
40-45 9.0 7.0 4.5
Industrial buildings 45-55 10.0 8.0 5.0
Table 2: Recommended maximum duct velocities for low pressure ductwork. (16)
4.2.2 Design conditions
Water is primordial for the good working of a nuclear power plant. As a consequence, ambient temperature
and air renewal needs to be controlled and maintained at a certain level.
4.2.2.1 Process areas
Temperatures requirements
The process has been designed to be available 99.9% of the time according to the FMECA study made by
the contract holder. Consequently ambient conditions need to be maintained in a certain range. The sensitive
components are the membranes in the reverse osmosis skids that can withstand air temperature up to 43°C.
The process is using water at ambient pressure thus air temperature must be kept above 0°C to prevent
water from freezing. Margins have been taken on these temperatures and process areas ‘temperatures must
be kept between 5°C and 40°C according to the specifications given by the company responsible for the
demineralization process.
ACH requirements
A minimum ACH of 0.5 will be kept everywhere except in rooms housing chemicals that needs to be
supplied with an ACH equals to 10 in normal operation. ACH will be increased to 20 in chemical rooms
for accidental situations as for instance if harmful vapours are detected.

-24-
4.2.2.2 Rooms with employees
Temperatures
This building is almost autonomous as only two employees are present permanently to check the process.
The number of people present in the building can reach 20 during maintenance period but this case will be
neglected as it occurs only once to twice a year. That’s why temperatures must be maintained between a
narrow range of temperatures only for some rooms such as the laboratory and the control room in which
temperatures needs to be between 18°C and 26°C. Toilets, cloakrooms and cleaning rooms must be kept
within the temperature range 18°C/30°C. Humidity won’t be controlled except in the control room and the
laboratory. An average value equals to 45% will be considered for humidity within these rooms. All these
data have been taken from the specifications given by the company in charge of the process and equipments.
ACH requirements
For rooms such as the laboratory an ACH equals to 2 is requested due to the presence of chemicals. An
extractor hood will also be added over each bench in order to prevent fumes from spreading in the room.
For toilets, ASHRAE handbook (17) gives the value of 80m3/h exhaust ventilation. That corresponds to an
ACH equals to 2 in our situation. The same value will be taken for the cleaning room and the cloakroom.
2 people are present all the time in the control room, the reference (17) gives an air renewal rate
corresponding to 0.6L/s.m² or 8L/s per person. Taking the more disadvantageous an ACH equal to 1 is
obtained given the surface of the room.
Relative humidity requirements
According to (12) relative humidity must be maintained between 30% and 60% for the welfare of employees.
4.2.2.3 Stairs and Lobbies
Temperatures
Stairs and lobbies will be kept between 5°C and 40°C. It is a requirement from the contract holder and
firemen.
ACH requirement
For the same reasons as above the client requests a minimum ACH of 0.5 everywhere according to (12) . It
is the value that has been taken as no one is supposed to stay in these rooms
4.2.2.4 Electrical room/HVAC room
Temperatures
Temperature in this room is determined by the equipment within the room. There are transformers and
electrical board. Looking at the specifications of the transformers that are supposed to be installed in the
rooms, temperature must not exceed 30°C and not fall below 10°C. Otherwise transformers might crash
and the power would be out.
For the HVAC room, the temperature will be kept between 10°C and 35°C because of the equipment’s
working conditions.
ACH requirements
An ACH requirement has been fixed to 1 within the electrical room and 0.5 in the HVAC room according
to the equipment’s specification. In the electrical room extract hoods will be placed above each transformer
in order to extract heat released by the transformers. According to the constructor 80% of the heat released
by the transformers can be extracted. The other 20% accounts for heat gains in the room.
4.2.2.5 Summary
In Table 3 is shown the admissible temperature range and the relative humidity that needs to be maintained
in the different rooms. The minimum ACH requirements is displayed in Table 4.

-25-
Temperatures
Table 3: Admissible temperature range in HY building
ACH requirements
Table 4: Minimum ACH in HY building
4.3 Smoke and heat control
Fire is the main risk when it comes to nuclear power plant. Indeed if it can’t be controlled, it might spread
in the nuclear power plant and might have disastrous consequences. Even if it doesn’t spread the loss of
some equipment due to excessive heat would cause a shutdown of the power plant and would result in a
considerable loss of money. Another aspect that needs to be considered is the fact that the metallic structure
might bend and collapse due to excessive heat causing harm to employees or firemen trying to put out the
fire.
4.3.1 Smoke exhaust and protection system
In industrial buildings the main purposes of a smoke and heat control system are according to BS9999 (18)
and CIBSE guide E (19):
Maintain a tenable environment within all exit access and areas of refuge access paths for sufficient
time to allow occupants to reach an exit or an area of refuge
Maintain the smoke layer interface to a predetermined elevation
Allow fire department personnel to approach, locate and put out a fire
Limit the rise of smoke temperature and toxic gas concentration as well as reduction of visibility
Limit smoke damage to equipment
Room description Winter normal
operation
Summer normal
operation
Relative
humidity (%)
Chemical rooms 5 °C 40 °C Not controlled
Degasser room 5 °C 40 °C Not controlled
Basement 5 °C 40 °C Not controlled
Control room 18 °C 26 °C 30%-60%
Electrical room 10 °C 30 °C Not controlled
Laboratory 18 °C 26 °C 30%-60%
Cleaning room / Sanitary room
18 °C 30 °C Not controlled
HVAC room 10 °C 35 °C Not controlled
Corridor 15°C 35°C Not controlled
Other 5 °C 40 °C Not controlled
Room description ACH operational ACH in case of
chemicals
vapor detection
Chemical rooms 10 20
Degasser room 1 /
Basement 0.5 /
Control room 1 /
Electrical room 1 + extractor hood over each transformer
/
Laboratory 2 + extractor hood over each bench /
Cleaning room / Sanitary room
2 /
Other 0.5 /

-26-
4.3.1.1 Natural smoke extraction
For rooms with their ceiling in direct contact with the outside, CIBSE Guide E (19) specifies that natural
openings are enough to extract heat and smoke. The total area of the natural vents needs to be equal to 3%
of the floor surface area. Moreover, air must be supplied through an effective surface at least equivalent to
the openable vents surface area.
4.3.1.2 Forced extraction
For some rooms it is impossible to extract smoke by natural means. Thus an extraction fan needs to be implemented to insure the smoke extraction. It shall provide an air change rate of 10 air change per hour, according to CIBSE Guide E (19).
4.3.1.3 Pressurization of firefighting shafts
Firefighting shafts is an area constituted of stairs and lobbies. It is the place where firemen get ready before
getting in the room in which the fire started to put it out. Therefore, it needs to be free of smoke.
For firefighting shafts (stairs and lobby) two main solutions can be implemented. The first one consists in
implementing openable vents located on external walls or/and sky dome at the top of the stairs located on
the roof. Table 5 has been taken from BS9999 (18) and sums up the different requirements for these
openings.
Table 5: Recommendations for fire-fighting shafts ventilated by natural means
The second solution is more used in the nuclear field and it consists in pressurizing the firefighting shafts
(stairs plus lobby) thanks to a fan. The over-pressurization prevents the smoke from getting in this area.
Thus the area stays free of smoke and fire department personnel can approach, locate and put out a fire.
The regulation BS12101-6 (20) stipulates that a pressure differential equals at least to 50Pa (with all the
doors closed) needs to be maintained between firefighting shafts and the area in which the fire has started.
Moreover air speed must be equal to 0.75m/s through an open door to avoid smoke from getting in the
protected area. Fire cannot start in firefighting shafts as there is no risky equipment.

-27-
4.3.2 Practical application on the building
In this part smoke control systems sizing rules stated in §4.3.1 will be applied directly on the different rooms
constituting the demineralization station.
4.3.2.1 Hall level 0.00 (Process area)
The hall is made of a metal structure that can bend and collapse if the temperature rises too much. Therefore,
a smoke exhaust system must be implemented. It is realized by the mean of openable vents on the roof
equivalent to 3% of the floor surface (corresponding to 28m²). Air must be supplied through an effective
surface at least equivalent to 3% of the floor surface. In this case opening the two “equipment access” doors
located south of the building is more than enough (4.50m x 6.00 m).
4.3.2.2 Electrical room
Smoke released by a fire in this room is toxic that’s why a smoke exhaust system is required. It must be
independent from air conditioning system, shall provide an air change rate of 10 air change per hour, which
is the usual value for this kind of system in the UK, according to CIBSE Guide E (19). For the electrical
room results are presented in Table 6.
Zone level Room Smoke supply (m3/h) Smoke extract (m3/h)
0.00 Electrical room 4500 4500
Table 6: Electrical room mechanical smoke extraction
4.3.2.3 Basement
The basement of this building is more than 200m² and 3m deep so according to BS 9999 a smoke exhaust
system must be implemented. It must be independent from air conditioning system, shall provide an air
change rate equal to 10, which is the usual value for this kind of system in the UK, according to CIBSE
Guide E (19). For the basement results are presented in Table 7.
Zone level Room Smoke supply (m3/h) Smoke extract (m3/h)
-6.80 Basement 71 000 71 000
Table 7: Basement mechanical smoke extraction
4.3.2.4 Firefighting shafts
F
P
0.75 m/s
Stairs Lobby Room
50Pa 50Pa 0Pa
S
Air release path or
smoke exhaust
system of the room
if there is one
F
0.75 m/s
Stairs LobbyRoom
P
50Pa 50Pa 0Pa
F
S
Air release path or
smoke exhaust
system of the room
if there is one
Figure 14: Smoke control pressurization system
This system prevents smoke from entering into stairs and lobby by applying a pressure differential between
the firefighting shafts and other rooms of 50Pa doors closed and an airflow of 0.75m/s through an open
Above ground level Below ground level

-28-
door.
In order to be sure that the overpressure will never reach in the stairwell a value too high to enable the
opening of the door, a pressure relief damper is installed in the stairwell, which opens at 80Pa. The
mechanical diagram of this pressurization system is displayed in Figure 14.
Above ground level
The air is supplied to the stairwell, then goes through each lobby via a grille associated with a fire damper
located on the wall between lobby and stairwell and is exhausted via a pressure relief damper located at each
floor between the lobby and the outside.
Below ground level
The air is supplied to the stairwell, then goes through each lobby via a grille associated with a fire damper
located on the wall between lobby and stairwell and is exhausted via a pressure relief damper mounted with
a fire damper and located at each floor between the lobby and the basement.
Concerning over-pressurisation of the stairwell and lobbies, the necessary airflow to achieve the criteria are
calculated to according to BS12101-6 (20). The necessary airflow to maintain the requested pressure in a
room is equal to the sum of the leaks caused by the pressure differential.
Calculation of the airflow caused by pressure differential (demonstration of the formula in §4.6.1.3):
Q = 0.83 . Ae . P1/R [1]
Where:
Q = airflow (m3/s)
Ae = area of leakage (m²)
P = Pressure differential between both sides of the opening (Pa)
R = 2 (for small openings)
For an opening, Ae is the cross-section of this opening. For a closed door, BS12101-6 (20) gives values of
leakage areas (see Table 8).
Type of door Leakage area
(m²)
Pressure differential
(Pa)
Air leakage
(m3/s)
Single-leaf opening into a
pressurized space 0.01
8 0.02
15 0.03
20 0.04
25 0.04
50 0.06
Single-leaf opening outwards
from a pressurized space 0.02
8 0.05
15 0.06
20 0.07
25 0.08
50 0.12 Table 8: Air leakage depending on the pressure differential applied and the leakage area (20)
Margins are considered in consistence with (20) the following values:
For airflow through a closed door : +50%
For airflow through an open door : +15%
Estimation of the necessary airflow to maintain the air velocity at a value of 0.75 m/s through an open door:
Calculation of the equivalent airflow for a given air velocity through an open door:

-29-
Q = v . A [2]
With:
Q = Airflow (m3/s)
V = Air velocity (m/s)
A = Area of leakage (m²)
4.3.2.5 For other rooms
According to the Global Fire Preliminary Assessment (21), other rooms don’t need any smoke and heat
control as the fire risk is low. Fire damper are enough to isolate them from a fire starting elsewhere.
4.4 Psychrometry
Designing a ventilation system from scratch is quite complex, consequently a strong technical background
is necessary. In this part will be presented the most important technical aspects to consider and understand.
Psychrometry refers to thermodynamic and physical property of a gas-vapor mixture. Humid air being a
gas-vapor mixture, the study of its characteristics is called “psychrometry”. One of the devices allowing the
measurement of two intrinsic data of humid air is the psychrometer or wet-and-dry-bulb thermometers.
Indeed this device composed of two thermometers allows the measurement of:
Dry bulb temperature which is defined by the level of molecular agitation
Wet bulb temperature which is determined by measurement thanks to a scrap of fabric soaked with
water, wrapped around the measurement device and ventilated in order to cause water to evaporate.
This measurement is lower than dry bulb temperature of the air due to the evaporation of water.
These two features define precisely humid air characteristics. The diagram representing the different
characteristics of the humid air is called “psychrometric chart” (Figure 15).
Figure 15: Psychrometric chart of humid air (22)
In a building, temperature and humidity have to be controlled in order to insure the quality of a process and

-30-
acceptable working conditions for employees. Therefore water vapor might need to be added or removed
from air mixture and temperature can also need to be increased or decreased. (23)
4.4.1 Saturation pressure of water
Saturation pressure of water can be calculated thanks to the following formulas found in reference (24):
𝒑𝒗′′ = 𝒆(𝟏𝟐.𝟎𝟑−𝟒𝟎𝟐𝟓
𝒕+𝟐𝟑𝟓) [3] (For 0°C<t<100°C)
𝒑𝒗′′ = 𝒆(𝟏𝟕.𝟑𝟗𝟏−
𝟔𝟏𝟒𝟐
𝒕+𝟐𝟕𝟑.𝟏𝟓) [4] (For -40°C<t<0°C)
With:
t = air temperature (°C)
Thanks to this definition one can define a well-known concept called relative humidity φ which can be
defined thanks to the following equation from (24):
𝝋 =𝒑𝒗
𝒑𝒗′′ [5]
With:
𝑝𝑣= partial pressure of water vapor in air
𝑝𝑣′′= saturation pressure of water at air temperature
Three cases can be distinguished (25):
𝑝𝑣 < 𝑝𝑣′′: Water is in vapor state, it can also be described as a single-phase state. Water vapor is
invisible as it is in gaseous phase. It coexists with dry air to form a homogenous mixture: it is humid
air.
𝑝𝑣 = 𝑝𝑣′′: Water in its liquid state coexists with water vapor and the two phases are in balance: it is
a double-phase state. It means that humid air is at 100% relative humidity. No more water vapor
can be added to the mixture, air is saturated. This equilibrium situation can be represented with a
curve: 𝑝𝑣′′ = 𝑓(𝜑𝛳).
𝑝𝑣 > 𝑝𝑣′′: The totality of water is condensed. Air is supersaturated and water vapor is condensed
in the form of liquid or ice depending on the pressure and the temperature.
4.4.2 Water content
It is the quantity of water hold in air under the form of water vapor compared to the total mass of dry air.
It can be found thanks to the following equation:
𝒙 =𝒎𝒗
𝒎𝑨 [6]
With:
𝑚𝑣= mass of water vapor in air
𝑚𝐴= mass of dry air
𝑥 = water content (kgwater/kgdry air)
By applying ideal gases equation, 𝒑. 𝑽 = 𝒏. 𝑹. 𝑻 [7]:
𝑚𝐴 =𝑝𝐴. 𝑉. 𝑀𝐴
𝑅. 𝑇

-31-
𝑚𝑣 =𝑝𝑣 . 𝑉. 𝑀𝑣
𝑅. 𝑇
With:
𝑀𝑣= Molecular weight of water vapor (18.016 g/mol)
𝑀𝐴=Molecular weight of air (29g/mol)
𝑝𝐴= pressure of dry air
𝑝𝑣= pressure of water vapor
𝒑𝑨 = 𝒑 − 𝒑𝒗 [8]
With:
𝑝 = Total pressure of humid air
By combining the two equations, one get:
𝒙 = 𝟎. 𝟔𝟐 𝒑𝒗
𝒑−𝒑𝒗 [9]
4.4.3 Dew point
It is the temperature at which water vapor in air starts to condense in contact with a cold surface. At this
moment air is saturated. It will only occur when twall<tsat(pv). (24)
4.4.4 Specific enthalpy
It is the sum of the sensible heat of dry air and sensible + latent heat water vapor based on a kilogram of
dry air. Thus the total energy content is divided by the dry air mass. It can be decomposed as followed (25):
Sensible heat of one kilogram of dry air : ℎ𝐴 = 𝑐𝑝𝐴. 𝑇
Sensible heat of water vapor : ℎ𝑣1 = 𝑥. 𝑐𝑝𝑣 . 𝑇
Latent heat of water vapor : ℎ𝑣2 = 𝑥. 𝐿𝑣
𝒉 = 𝒉𝑨 + 𝒙. 𝒉𝒗 = 𝒄𝒑𝑨. 𝑻 + 𝒙. (𝒄𝒑𝒗. 𝑻 + 𝑳𝒗) = 𝑻 + 𝒙. (𝟏. 𝟖𝟔 𝑻 + 𝟐𝟓𝟎𝟎) [10]
With:
ℎ𝐴 = enthalpy of dry air
𝑐𝑝𝐴= specific heat of air (1 kJ/(kg.K))
T= temperature
ℎ𝑣= enthalpy of water vapor
𝐿𝑣= Latent heat of vaporization of water (2500 kJ/kg)
𝑐𝑝𝑣= specific heat of water vapor (1.86 kJ/(kg.K))
ℎ = enthalpy of humid air (kJ/(kg.K)
𝑥 = water content (kgwater/kgdry air)
4.5 Humid air processes and air mixing
Air supplied to a building cannot come directly from outside and needs pretreatment before it is supplied
in the different rooms. Fresh air can be mixed, heated, cooled down or humidified depending on the external
conditions.

-32-
4.5.1 Air mixing
Air mixing is designed to control the adiabatic meeting of two humid air streams from different origins. It
is used to manage at best energy, depending on the ventilation needs. It is the case for the mixing of fresh
air with recycled air from a building. A mixing section is at least made of two synchronized dampers. By
knowing the characteristics of the two air streams one can get the water content, the specific enthalpy and
the temperature of the mixed stream.
4.5.2 Representation on the psychrometric chart
Two air streams “1” and “2” with different psychrometric characteristics are mixed together into a mixing
box. The resulting airflow is called “M.” (see Figure 16)
In the state 1, air has the following characteristics: qm1, h1, x1, T1
In the state 2, air has the following characteristics: qm2, h2, x2, T2
After blending, air has the following characteristics: qmM, hM, xM, TM
With:
qm = Mass flow rate (kg/s)
h = enthalpy of humid air (kJ/(kg.K))
x = water content (kgwater/kgdry air)
T = temperature (°C)
Figure 16: Mixing of two air streams called “1” and “2”
By applying mass balance equations and conservation of energy equation it is possible to determine the
characteristics of the mixed airflow.
𝑞𝑚𝑀 = 𝑞𝑚1 + 𝑞𝑚2
𝑞𝑚𝑀. ℎ𝑀 = 𝑞𝑚1. ℎ1 + 𝑞𝑚2. ℎ2
𝒉𝑴 =𝒒𝒎𝟏.𝒉𝟏+𝒒𝒎𝟐.𝒉𝟐
𝒒𝒎𝟏+𝒒𝒎𝟐 [11]
This reasoning process can be replicated to obtain:
𝑥𝑀 =𝑞𝑚1.𝑥1+𝑞𝑚2.𝑥2
𝑞𝑚1+𝑞𝑚2
𝑇𝑀 =𝑞𝑚1.𝑇1+𝑞𝑚2.𝑇2
𝑞𝑚1+𝑞𝑚2 (considering that thermal capacities are equals and constant)
The mixing of the two air streams can be represented by a line linking the points 1 and 2. The mixing point
“M” will be located on this line. The distance between the incoming airflow and the mixing point
corresponds to the air flow ratio. It is represented in Figure 17.
𝐿2 =𝑞𝑚1
𝑞𝑚1 + 𝑞𝑚2 (𝐿1 + 𝐿2)
qm1, h1, r1, T1
qmM, hM, rM, TM
qm2
h2
r2
T2

-33-
L1
L2Mixing
point
Figure 17: Mixing of two humid air streams in a psychrometric chart
4.5.3 Extraction temperature for an AHU
In order to determine which percentage of fresh air is the better for winter and summer situation, the
extracted airflow temperature needs to be calculated. The main difference between this building and
buildings receiving people is the parameter that needs to be considered in order to assess the percentage of
fresh air required. In buildings hosting people CO2 concentration will be controlled. Nuclear related
buildings are unoccupied; consequently percentage of fresh air will be determined by the temperature of
extracted air. In winter fresh air will be supplied to provide the minimum air renewal rate so that maximum
energy is saved. During summer air will be recycled only if its temperature is inferior to the temperature of
outside air. It is not often the case as transformers and other pieces of equipment produce a lot of heat.
𝑻𝒕𝒐𝒕𝒂𝒍_𝒆𝒙𝒕𝒓𝒂𝒄𝒕𝒊𝒐𝒏 =∑ 𝑻𝒓𝒐𝒐𝒎 .𝒒𝒗𝒓𝒐𝒐𝒎
𝒒𝒗𝒕𝒐𝒕𝒂𝒍 [12]
With:
Troom = temperature in a room (°C)
qvroom = airflow in the room (m3/s)
4.5.4 Air heating
Air heating consists in increasing the enthalpy of humid air. Dry air mass and water vapor receive a certain
amount of sensible heat. The dry bulb temperature increases proportionally to the heat provided.
4.5.4.1 Heating coil types
Three types of heating coil can be found in an Air Handling Unit. Here is an exhaustive list taken from (25):
Hot water heating coils:
They are supplied by water at 90°C coming from boilers (electrical boiler or fuel boiler). When it is possible
it can be supplied by water at lower temperature.
Electrical heating coils:
They are energy consuming but are really convenient as it is easy to regulate them. Moreover installation
cost is low and the response time is short.

-34-
Refrigerant heating coils:
Condensation of a refrigerant in the condenser is used to heat up humid air and increase its enthalpy.
4.5.4.2 Representation on the humid air diagram
Air heating consists in increasing the enthalpy of humid air without adding or extracting water vapor from
the air mixture. Therefore the process occurs at constant water content. Power required to heat up humid
air from a state 1 to a state 2 is given by the following formula:
𝑷𝒉𝒆𝒂𝒕𝒊𝒏𝒈 = 𝒒𝒎 (𝒉𝟏 − 𝒉𝟐) [13]
The process path can be seen on Figure 18:
Figure 18: Heating of humid air on a psychrometric chart
4.5.5 Air cooling
The cooling section of an Air Handling Unit is composed of a heat exchanger and a tray used for collecting
condensed water. This water is then sent to sewage through a siphon. The siphon is an essential component
of the Air Handling Unit. Indeed, there is a depression in the air handling unit, then without a siphon, water
that has been condensed couldn’t be drained away by gravity. This heat exchanger is commonly called
cooling coil.
In order to cool down humid air, dry bulb temperature of the humid air must be above the cooling coil
surface temperature. (25)
4.5.5.1 Cooling coil types
Cold water cooling coil:
Water, whose average temperature can vary between 5 and 10°C, can be added to ethylene glycol in order
to avoid water to freeze depending on the external temperatures. This water is produced thanks to a water
chiller and is sent in the cold water network thanks to pumps. The main characteristic of this cooling coil is
that its temperature is not constant along the heat exchanger. (25)
Refrigerant/evaporator cooling coil:
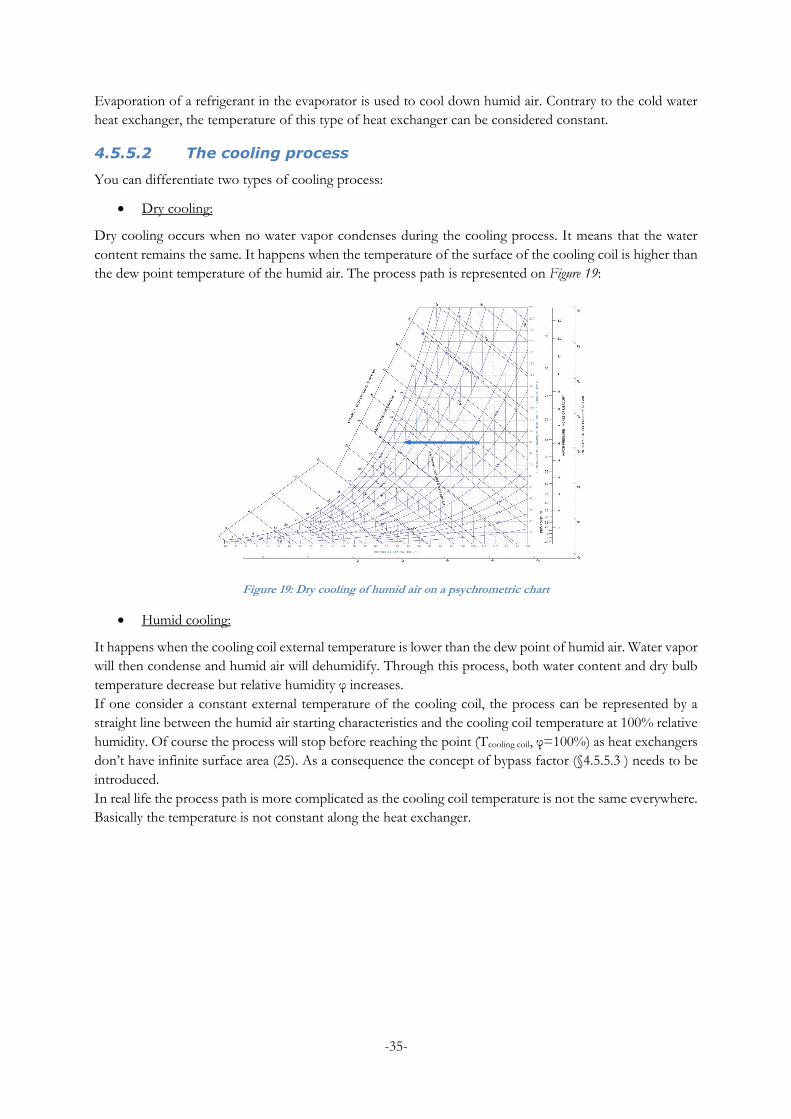
-35-
Evaporation of a refrigerant in the evaporator is used to cool down humid air. Contrary to the cold water
heat exchanger, the temperature of this type of heat exchanger can be considered constant.
4.5.5.2 The cooling process
You can differentiate two types of cooling process:
Dry cooling:
Dry cooling occurs when no water vapor condenses during the cooling process. It means that the water
content remains the same. It happens when the temperature of the surface of the cooling coil is higher than
the dew point temperature of the humid air. The process path is represented on Figure 19:
Figure 19: Dry cooling of humid air on a psychrometric chart
Humid cooling:
It happens when the cooling coil external temperature is lower than the dew point of humid air. Water vapor
will then condense and humid air will dehumidify. Through this process, both water content and dry bulb
temperature decrease but relative humidity φ increases.
If one consider a constant external temperature of the cooling coil, the process can be represented by a
straight line between the humid air starting characteristics and the cooling coil temperature at 100% relative
humidity. Of course the process will stop before reaching the point (Tcooling coil, φ=100%) as heat exchangers
don’t have infinite surface area (25). As a consequence the concept of bypass factor (§4.5.5.3 ) needs to be
introduced.
In real life the process path is more complicated as the cooling coil temperature is not the same everywhere.
Basically the temperature is not constant along the heat exchanger.

-36-
TinToutTcooling_coil
xin
xout
Figure 20: Humid cooling of humid air on a psychrometric chart
Process path for an evaporator cooling coil:
The evaporation temperature is equal to 𝑇𝑒𝑣𝑎𝑝. The process path can be represented by a straight line in the
psychrometric chart as in Figure 20. If the heat exchange was perfect, the surface temperature of the cooling
coil, 𝑇𝑐𝑜𝑜𝑙𝑖𝑛𝑔 𝑐𝑜𝑖𝑙 would be equal to 𝑇𝑒𝑣𝑎𝑝. In reality, according to (25),
𝑻𝒄𝒐𝒐𝒍𝒊𝒏𝒈 𝒄𝒐𝒊𝒍 = 𝑻𝒆𝒗𝒂𝒑 + 𝟒 [14]
Process path for a chilled water cooling coil:
The process path can’t be assimilated to a straight line. The first part of the evolution is a dry cooling, then
water vapor starts to condense along the heat exchanger. It is a lot more complicated than for an evaporator
cooling coil as average temperature depends on the geometry of the cooling coil and the water supplied to
the heat exchanger. Average surface temperature can be estimated as stated in (25):
𝑻𝒄𝒐𝒐𝒍𝒊𝒏𝒈 𝒄𝒐𝒊𝒍 =𝑻𝒘𝒂𝒕𝒆𝒓_𝒐𝒖𝒕+𝒌.𝑻𝒘𝒂𝒕𝒆𝒓_𝒊𝒏
𝟏+𝒌 [15]
With:
𝑇𝑤𝑎𝑡𝑒𝑟_𝑜𝑢𝑡 = Water out of the heat exchanger
𝑇𝑤𝑎𝑡𝑒𝑟_𝑖𝑛 = Water entering the cooling coil
𝑘 = coefficient depending on the cooling coil often estimated equal to 1 when no information concerning
the coil is available.
If k=1, 𝑇𝑐𝑜𝑜𝑙𝑖𝑛𝑔 𝑐𝑜𝑖𝑙 is equal to the arithmetic mean of the inlet and outlet water temperature.
4.5.5.3 Characteristics of a cooling coil
Bypass Factor and efficiency:
A cooling coil as all heat exchangers is not perfect and does not enable to get humid air to a relative humidity
of 100%. As a consequence, a part of the humid air is not in contact with the cooling coil whereas the other
part is in direct contact with the cooling coil, φ=100%. The bypass factor represents the corresponding

-37-
portion of untreated air and is given by the following formula:
𝑩𝑭 =𝑻𝒐𝒖𝒕−𝑻𝒄𝒐𝒐𝒍𝒊𝒏𝒈 𝒄𝒐𝒊𝒍
𝑻𝒊𝒏−𝑻𝒄𝒐𝒐𝒍𝒊𝒏𝒈 𝒄𝒐𝒊𝒍=
𝒉𝒐𝒖𝒕−𝒉𝒄𝒐𝒐𝒍𝒊𝒏𝒈 𝒄𝒐𝒊𝒍
𝒉𝒊𝒏−𝒉𝒄𝒐𝒐𝒍𝒊𝒏𝒈 𝒄𝒐𝒊𝒍=
𝒙𝒐𝒖𝒕−𝒙𝒄𝒐𝒐𝒍𝒊𝒏𝒈 𝒄𝒐𝒊𝒍
𝒙𝒊𝒏−𝒙𝒄𝒐𝒐𝒍𝒊𝒏𝒈 𝒄𝒐𝒊𝒍 [16]
With:
BF = Bypass Factor
𝑇𝑖𝑛, 𝑥𝑖𝑛, ℎ𝑖𝑛 = Temperature, water content and enthalpy of air entering the cooling coil
𝑇𝑜𝑢𝑡, 𝑥𝑜𝑢𝑡 , ℎ𝑜𝑢𝑡 = Temperature, water content and enthalpy of air after the cooling coil
𝑇𝑐𝑜𝑜𝑙𝑖𝑛𝑔 𝑐𝑜𝑖𝑙 , 𝑥𝑐𝑜𝑜𝑙𝑖𝑛𝑔 𝑐𝑜𝑖𝑙 , ℎ𝑐𝑜𝑜𝑙𝑖𝑛𝑔 𝑐𝑜𝑖𝑙 = Surface air temperature, water content and enthalpy of the
cooling coil
𝑇𝑐𝑜𝑜𝑙𝑖𝑛𝑔 𝑐𝑜𝑖𝑙 will always be above 0°C in order to avoid the risks of frosting on the cooling coil surface
otherwise an automatic defrosting will be necessary.
Efficiency of a cooling coil can be defined as the percentage of treated air compared to the total mass of air.
It is defined by the following formula:
𝝃 = 𝟏 − 𝑩𝑭 [17]
With 𝜉 representing the efficiency of the cooling coil
Bypass factor characteristics:
The bypass factor depends on physical properties of the cooling coil and on operating condition foreseen.
Characteristics having the more influence on the bypass factor are the external exchange surface (a decrease
of the exchange surface area leads to a bypass factor rise) and the air speed (a reduction in the air speed
leads to a bypass factor drop). However influence of the exchange surface area is more important than the
one of the air speed. Bypass factor common values are set between 5% and 35% with an average value equal
to 20%. (23)
Thermodynamic characteristic of the cooling process:
On Figure 21 is represented the humid cooling process with its different thermodynamic features.
Global cooling power: It is the power that needs to be given by the cooling coil
𝑷𝒄𝒐𝒐𝒍𝒊𝒏𝒈_𝒕𝒐𝒕 = 𝒒𝒎 (𝒉𝒐𝒖𝒕 − 𝒉𝒊𝒏)[18]
Sensible cooling power: It is the power corresponding to the sensible heat taken from humid air to cool it
down
𝑃𝑐𝑜𝑜𝑙𝑖𝑛𝑔_𝑠𝑒𝑛𝑠𝑖𝑏𝑙𝑒 = 𝑞𝑚 (ℎ𝑜𝑢𝑡 − ℎ𝑆)
Latent cooling power: It is the power corresponding to the latent heat removed from humid air to
dehumidify it.
𝑃𝑐𝑜𝑜𝑙𝑖𝑛𝑔_𝑠𝑒𝑛𝑠𝑖𝑏𝑙𝑒 = 𝑞𝑚 (ℎ𝑆 − ℎ𝑖𝑛)
All these powers are negatives as they are extracted from the humid air.

-38-
Amount of water condensed on the coil:
𝑚𝑤𝑎𝑡𝑒𝑟 = 𝑞𝑚 (𝑥𝑖𝑛 − 𝑥𝑜𝑢𝑡)
TinToutTcooling_coil
Late
nt
Sensible
xin
xout
S
Figure 21: Representation of sensible and latent heat during humid cooling
4.5.6 Air humidifying
Humidifying is done by water or steam injection. The role of humidifiers is to increase the water content
and the relative humidity of air. There are many humidification devices, but they can be grouped into two
main categories:
Humidification by steam injection: injection of steam directly into the duct or in the air handling
unit.
Humidification by spraying of water: Water is sprayed by nozzles in the air stream.
The humidifying process is ruled by the following energy conservation and water mass conservation
equation:
𝒒𝒎𝟏. 𝒉𝟏 + 𝒒𝒎𝒘𝒂𝒕𝒆𝒓. 𝒉𝒘𝒂𝒕𝒆𝒓 = 𝒒𝒎𝟐. 𝒉𝟐 [19]
𝒒𝒎𝟐 . 𝒙𝟐 = 𝒒𝒎𝒘𝒂𝒕𝒆𝒓 + 𝒒𝒎𝟏 . 𝒙𝟏 [20]
With:
𝑞𝑚𝑤𝑎𝑡𝑒𝑟= Introduced mass flow of water
ℎ𝑤𝑎𝑡𝑒𝑟= Enthalpy of added water (steam or liquid)
𝑞𝑚 = 𝑞𝑚2 = 𝑞𝑚1, as one use the dry mass flow rate of air

-39-
By combining the two equations above, ∆ℎ
∆𝑥= ℎ𝑤𝑎𝑡𝑒𝑟
For liquid water, 𝒉𝒘𝒂𝒕𝒆𝒓,𝒍𝒊𝒒 = 𝒄𝒑,𝒘𝒂𝒕𝒆𝒓,𝒍𝒊𝒒. 𝒕𝒘𝒂𝒕𝒆𝒓 [21]
For steam, 𝒉𝒘𝒂𝒕𝒆𝒓,𝒔𝒕𝒆𝒂𝒎 = 𝒄𝒑,𝒘𝒂𝒕𝒆𝒓,𝒔𝒕𝒆𝒂𝒎. 𝒕𝒘𝒂𝒕𝒆𝒓,𝒔𝒕𝒆𝒂𝒎 + 𝑳𝒗 [22]
Where, 𝑐𝑝,𝑤𝑎𝑡𝑒𝑟,𝑙𝑖𝑞 ≈ 4.2𝑘𝐽
𝑘𝑔.𝐾 , 𝐿𝑣 = 2500
𝑘𝐽
𝑘𝑔 and 𝑐𝑝,𝑤𝑎𝑡𝑒𝑟,𝑠𝑡𝑒𝑎𝑚 ≈ 1.8
𝑘𝐽
𝑘𝑔.𝐾
4.5.6.1 Water injection humidification
It is often called adiabatic humidification then it occurs under a constant wet bulb temperature. A humidifier
cannot make the water saturated; indeed an infinite exchange surface would be required. The saturation
efficiency is usually included between 50 and 85%. On Figure 22 below you can find the process path of
water injection humidification:
In
Out
Sat
Figure 22: humidification by water injection on a psychrometric chart
4.5.6.2 Steam injection humidification
The theoretical process path (see Figure 23) is realized at constant temperature. But considering that,
ℎ𝑤𝑎𝑡𝑒𝑟,𝑠𝑡𝑒𝑎𝑚 = 2700𝑘𝐽
𝑘𝑔.𝐾 , the real evolution is not isothermal, the temperature increases of 1 to 2°C
depending on vapor temperature.
The power needed for the process is equal to:
𝑃ℎ𝑢𝑚𝑖𝑑𝑖𝑓𝑦𝑖𝑛𝑔 = 𝑞𝑚 . (ℎ𝑖𝑛 − ℎ𝑜𝑢𝑡]

-40-
Figure 23: humidification by steam injection on a psychrometric chart (dotted line: reality/ full line: theory)
4.5.7 Impossible air processes
On Figure 24, two impossible air processes are displayed. Super-saturation zone needs to be avoided during
cooling or mixing process as there is a risk of condensation on the AHU’s walls, in air ducts and on the
fan’s blades
Cooling Coil
In
Out
L2
L1
Mixing
point
Figure 24: (Left) impossible humid cooling process / (Right) impossible mixing of two air streams
4.6 Pressure gradient and infiltration
In a room where relative pressure is equal to atmospheric pressure, the pressure gradient can be supposed
equal to 0. When an enclosed and airtight space is ventilated by a double flow ventilation system with a
supply airflow equals to the extracted airflow then the pressure gradient is equal to 0.
Infiltration of outdoor air is dependent on:
Building air tightness and number and type of penetrations (doors and windows).
The differential pressure between the internal conditioned space and the exterior
o If the conditioned space is maintained at a positive pressure with respect to the external
atmosphere there will be zero infiltration
o If the conditioned space is maintained under a depression with respect to the outside there
will be infiltration of outside air, this is not easily quantified

-41-
A low over-pressurization around 4Pa is considered to be enough to minimize infiltrations from the outside.
(26)
4.6.1 Pressure gradient
A pressure gradient is defined as a relative pressure difference between atmospheric pressure and pressure
within the building.
4.6.1.1 How to obtain this pressure gradient
This variation can be created by two means:
By varying the supply airflow from the AHU in the room, keeping the extracted airflow constant
By varying the extracted airflow, keeping the airflow supplied by the AHU constant.
4.6.1.2 Calculation of the airflow variation for a given pressure
gradient
In this part the room is supposed airtight, it means that there are no infiltrations. Initial pressure in the room
is equal to atmospheric pressure.
For low pressure, air can be considered as an ideal gas and the following formula applies:
𝑝. 𝑉 = 𝑛. 𝑅. 𝑇 By applying ideal gases equation, 𝒑. 𝑽 = 𝒏. 𝑹. 𝑻 [7]
With:
𝑝 = pressure (Pa)
𝑉 = volume (m3)
𝑛 = number of mols (mol)
T = temperature (K)
R = 8.314 (J/mol.K)
Number of mole variation (Δn) in a room at constant temperature and volume will have a direct influence
on the pressure within the room. If the number of mole varies of Δn, pressure variation will be proportional
and equal to Δp. As a consequence, in order to increase the pressure (Δp>0), the number of mole supplied
by the AHU needs to be superior to the number of mole extracted from the room. It works the other way
around if the pressure needs to be decreased (Δp<0).
From the equation above, in order to get a pressure equals to 𝑝 + ∆𝑝, the mole variation will be equal to:
∆𝑛 =(𝑝 + ∆𝑝). 𝑉
𝑅. 𝑇−
𝑝. 𝑉
𝑅. 𝑇=
∆𝑝. 𝑉
𝑅. 𝑇
With Vo = 22.41 l/mol, molar volume of air at To=273,15K and po=1bar
∆𝑉 = 𝑉𝑜. ∆𝑛
∆𝑛. 𝑉𝑜 = ∆𝑉 = ∆𝑝. 𝑉. 𝑉𝑜
𝑅. 𝑇𝑜
Then,
∆𝑉
𝑉=
∆𝑝. 𝑉𝑜
𝑅. 𝑇𝑜
The molar volume varies with the temperature, let’s call Vo(θ) the molar volume at the temperature:
T (K) = θ(°C) + T0

-42-
𝑝0. 𝑉0
𝑇0=
𝑝. 𝑉0(𝜃)
𝑇=> 𝑉0(𝜃) =
𝑉0. 𝑇
𝑇0
Considering that T=𝑇0 + 𝜃,
𝑉0(𝜃) =𝑉0. (𝑇0 + 𝜃)
𝑇0
Eventually
∆𝑽
𝑽=
∆𝒑.𝑽𝒐.(𝑻𝟎+𝜽)
𝑹.𝑻𝒐²=
∆𝒒
𝒒 [23]
With q = air flow rate (m3/s)
4.6.1.3 Assessment of infiltrations
It corresponds to the gap between the low part of the door and the ground through which outside air can
infiltrate the building. The pressure difference between two rooms will follow this formula:
∆𝑝 =1
2 𝜉. 𝜌. 𝑣²
∆𝑝 = Pressure losses (Pa)
𝜌 = Density of air (kg/m3)
𝑣 = Air speed between the two zones (rooms)
𝜉 = Pressure losses coefficient
But the infiltration flow rate can be written:
𝑞𝑣𝑖𝑛𝑓 = 𝑆. 𝑣
With:
S= surface of the gap (m²)
𝑞𝑣𝑖𝑛𝑓 = infiltration flow rate (m3/s)
By combining the two equations:
𝒒𝒗𝒊𝒏𝒇 = 𝑪. 𝑺. (𝟐.∆𝒑
𝝆)𝟎.𝟓 [24]
With 𝐶 = (1
𝜉)1/2
The determination of the coefficient is really difficult and is determined experimentally.
For small openings:
For a rectangular gap below the door, C can be estimated between 0.62 and 0.64. (26)
By applying the formula above, 𝑞𝑣𝑖𝑛𝑓 = 0.62 . 𝑆 . ( 2
𝜌)0.5. ∆𝑝0.5 ≈ 0.83 . 𝑆. ∆𝑝0.5
The equation Q = 0.83 . Ae . P1/R [1] used in §4.3.1.34.3.1.3 is found.

-43-
5 Calculation methodology review
Main part in ventilation system sizing is the calculation methodology. Indeed it needs to be conducted
seriously since calculation errors might lead to equipment failure.
5.1 External conditions
They depend on the season and the building location. It is the first step of an HVAC sizing project. DVT
system shall perform in accordance with all specified conditions as well as standards and codes of practice,
relevant British and European Standards.
5.1.1 Air temperature
Report (27) gives different values for extreme external temperature in summer and winter. In the nuclear
field, HVAC systems are designed considering steady state temperature in order to be in the worst case
scenario. For HY pre-sizing, the choice was to calculate internal conditions with the permanent values for
air temperature, in summer and winter, which are detailed in Table 9:
Winter Summer
Temperature -15°C / 100% HR 40°C / 32%HR Table 9: External temperature considered for HVAC designs
The temperatures that are presented in Table 9 above are based on statistical calculations carried out by EDF R&D. 40°C and -15°C corresponds to the daily (12 hours) average temperature considering a return period of 10000 years and taking into account climate change. It means that once every 10000 years outside average temperature will be equal to 40°C and -15°C during a period of 12 hours. These temperatures will be considered as design basis for HVAC system according to (27).
5.1.2 Ground temperature
Since HY building is partly underground, ground temperature must be defined for ventilation sizing.
According to (28), the ground can be divided into two parts; above and below 6 meters.
Below -6m, (28) gives a constant temperature equal to 10°C for ground temperature whatever the
season.
Above -6m, at a depth of x meters the temperature is equal to x.(Toutside – 10)/6 + Toutside. It varies
linearly between -6m and 0m.
5.1.3 Wind
Like external temperature, wind conditions are defined in (27) and detailed in Table 10:
Winter Summer
Wind speed 4m/s 1m/s Table 10: Wind speed considered for HVAC designs
5.2 Heat gains and losses
In order to maintain the right temperature in the building then it is necessary to assess heat gains or losses
that need to be compensated by the HVAC system.
5.2.1 Sensible heat gains/losses
It represents heat gained or lost by a room. It is written 𝑃𝑠𝑒𝑛𝑠𝑖𝑏𝑙𝑒 and expressed in Watt.

-44-
5.2.1.1 Heat transfer through walls
Heat exchanges through a wall/roof depend on its dimensions (surface area, thickness), characteristics
(material), connections (between rooms, with ground, with outside air) and position (horizontal or vertical,
exposed to solar radiation). These parameters are taken into account in the following formula:
Pwall = U . S . ΔT [25]
Pwall = heat exchange through the wall [W]
U = thermal transmission coefficient [W/(m².K)]
S = surface area of the wall [m²]
ΔT = Difference of temperature between the two sides of the wall [K]
In HY building, all walls are either made of concrete or cladding and K can be calculated as follows:
𝐔 = (𝟏
𝐡𝐢+
𝒆
𝝀+
𝟏
𝐡𝐞)−𝟏
[26]
hi = internal convection coefficient [W/(m².K)]
e = wall thickness [m]
λ = conductivity coefficient (W/(m.K))
he = external convection coefficient [W/(m².K)]
Heat transfer coefficients depend on wind speed, and are calculated according to CIBSE Guide A (29):
1/he 1/hi
Vertical wall Summer 0.08 0.13
Winter 0.04 0.13
Horizontal wall
(ascending flow)
Summer 0.08 0.10
Winter 0.04 0.10
Horizontal wall
(descending flow)
Summer 0.08 0.17
Winter 0.04 0.17 Table 11: heat transfer coefficients depending on walls and season
Heat transfers with ground:
For walls in contact with the ground, one defines equivalent coefficients for surface heat transfers, according
to RT2000 (30) and AFNOR Norm 13370 (31):
Deep ground: U = 0.21 W/(m².K)
Ground: U = 0.676 W/(m².K)
These coefficients have been calculated considering the depth of the building’s floor.
5.2.1.2 Heat transfer through opaque walls due to solar radiation
For winter conditions, the worst case is considered, with no sunshine. So the following calculations only
apply for summer case for which sunshine is considered as maximum.
In summer conditions, the influence of solar radiation is considered through the definition of virtual outside
temperature. This temperature has been calculated according to ASHRAE method (17), in consistency with
CIBSE Guide A (29). This method takes into consideration the solar radiation, orientation and inertia of

-45-
the building and defines a correction coefficient for the temperature of an external wall under solar radiation.
Solar radiation cause on opaque walls an increase of the external walls temperature which is higher than the
one if there was no sun. Thus calculations take into account a fictive external temperature superior to the
actual temperature outside.
CLTD_corr = [(CLTD + LM). k + (25.5 – Tint) + (Tem – 29.4)]. f [27]
CLTD = It stands for Cooling Load Temperature Difference. Its value depends on orientation, type of wall
and hour of exposure (walls are considered type A for concrete and type G for cladding, walls group depends
on inertia).
LM = correction coefficient depending on month and latitude of exposure (52° for Hinkley Point).
Tint = temperature required in the other side of the wall (40°C has been taken into account, the worst
conditions that can be seen in HY building).
Tem = mean temperature over a period of 24h (40°C for summer conditions).
k = correction factor depending on the color of the wall (here 0.83).
f = correction factor depending on the existence of an attic (here 1).
Values for CLTD, LM, k and f can be found in (17) and (28) and are presented in Table 12 and Table 13
below:
Concrete Class A
Angle Vertical Vertical Vertical Vertical Horizontal
Orientation North East South West -
CLTD 6 12 8 10 22
LM 1,1 1,6 3,3 1,6 0,5
k 0,83 0,83 0,83 0,83 1
CLTDcorr 1,993 7,388 5,479 5,728 18,6
Table 12: Values of CLTD, LM and k for concrete walls more than 300mm thick
Cladding Class G
Angle Vertical Vertical Vertical Vertical Horizontal
Orientation North East South West -
CLTD 13 17 24 31 43
LM 1,1 1,6 3,3 1,6 0,5
k 0,83 0,83 0,83 0,83 1
CLTDcorr 7,803 11,538 18,759 23,158 39,6
Table 13: Values of CLTD, LM and k for cladding
5.2.1.3 Heat gains due to sunshine for a glazed surface:
North wall of the building has 20% of its surface made of windows (see §7.1). Therefore, heat gains through
these windows needs to be considered. The assumption of a double glazed windows from the brand
PILKINGTON PROLIFITTM with U=2.8 W/m²K has been taken.
Heat gains by convection conduction (17):
CLTD_corr = CLTDst + (Tem-29.4) [28]
CLTD = value depending on orientation and hour of exposure
Tem = mean temperature over a period of 24h (40°C for summer conditions).

-46-
Heat gains due to direct radiations (17):
Heat gains = S . MSHGF . SC . CLF [29]
S = Area of the glazed surface
MSHGF = Maximum solar heat gain factor or global solar flux in W/m² depending on the month, wall
orientation and latitude of exposure (52° for Hinkley point).
SC = Shading coefficient between 0 and 1 depending on the nature of the glazed surface, here SC=0.81
CLF = Cooling load factor coefficient between 0 and 1 that correct heat gains depending on the type of
building. One will consider a heavy construction with thick concrete floor (650kg/m² of floor)
These values can be found in (17) are presented in Table 14:
Windows
Angle Vertical Vertical Vertical Vertical
Orientation North East South West
CLTD 8 8 8 8
MSHGF 142 681 609 681
SC 0,81 0,81 0,81 0,81
CLF 0,72 0,49 0,56 0,54
Table 14: Values of CLTD, MSHGF, SC and CLF for a Pilkington double glazed window
5.2.1.4 Internal gains from equipments
Pinternal gains depend on the thermal load of equipment installed in the building. For HY building, February
2015 data are presented in Table 42.
Electrical motor efficiencies given by the constructor are about 92%. Some additional margins coming from
the allowance strategy need to be taken into account.
For lightning, in the absence of precise information an assessment should be made based on room usage and likely lighting levels the recommendation being in the region of 6 to 15W/m². According to (28) the following numbers (Table 15) need to be taken into account depending on the type of room:
Type of room Power per square meter (W/m²)
Mechanical and other rooms 5
Electrical rooms 10
Control rooms 15
Laboratories 25 Table 15: Power from lighting (28)
Additional air heaters and air conditioning unit are also taken into account.
5.2.1.5 Internal gains from people
Activity Total heat (W/person) Sensible heat (W/person)
Reclining 80 55
Seated, relaxed 100 70
Sedentary activity 125 75
Standing, light activity (shopping, light industry) 170 85
Standing, medium activity (shop assistant,
machine work) 210 105
Walking 5 km/h 360 120 Table 16: Heat released by human body depending on the activity (26)

-47-
Sensible heat can be found in Table 16 taken from EN13779 (26). It depends on human activity. It is assumed
that the 2 people permanently present in the building will have a sedentary activity corresponding to a
sensible heat load equals to 75W/person.
5.2.1.6 Heat gains from infiltration
The building part which is above ground level is supposed to be pressurized with a pressure differential
equals to 4Pa in order to avoid infiltration in the building.
The basement is made of heavy concrete and has inherently low leakage with respect to infiltration.
Moreover, being located underground it is impossible that air can get through the walls.
Sensible heat gains from infiltrations can then be neglected in the calculations.
5.2.2 Latent heat load
It is the heat gain in latent form (humidity emission in the form of water vapor). These water emissions are
due to people, industrial process, and type of room … It can be expressed:
By moisture loss M in (gwater/h)
By power written 𝑃𝑙𝑎𝑡𝑒𝑛𝑡 in (W)
𝑃𝑙𝑎𝑡𝑒𝑛𝑡 = 𝑀. 𝐿𝑣
With 𝐿𝑣 = 2500𝑘𝐽
𝑘𝑔
5.2.2.1 From people
Latent heat released by people doing moderately active office work is equal to 55W/person. And can be
found in Table 17 below taken from ASHRAE handbook (17). Loss of water vapor can be found in “Le
Recknagel” (32).
Degree of Activity Total heat, Adult (W) Sensible heat (W) Latent heat (W)
Seated at theater 95 65 30
Seated at theater, night 105 70 35
Seated, very light work 115 70 45
Moderately active office work 130 75 55
Standing, light work: walking 130 75 55
Walking, Standing 145 75 70
Sedentary work 160 75 80
Light bench work 220 80 140
Moderate dancing 250 80 160
Walking 5km/h, light machine work 295 90 185
Bowling 425 110 255
Heavy work 425 170 255
Heavy machine work 470 185 285
Athletics 525 210 315 Table 17: Representative rates at which heat and moisture are given off by human beings for different activities (17)

-48-
Table 18: Loss of heat and water vapor in the human body for an individual sitting in light activity (32)
5.2.2.2 From infiltration
For the same reason as above infiltration are neglected in the sizing of HVAC system. Infiltrations through small openings are neglected due to the fact that building’s atmosphere has a higher pressure than atmospheric pressure. If the conditioned space is maintained at a positive pressure with respect to the external atmosphere there will be zero infiltration. Infiltration in the basement through the walls can also be neglected because concrete thickness is 600mm
and prevent water from getting in.
5.2.2.3 From the process
According to the company in charge of the demineralization process, water is completely enclosed while it
is demineralized. As a consequence they stipulate that no water is emitted in the room. Latent heat load
from the process will then be neglected.
5.2.3 Total heat load
It is written 𝑃𝑡𝑜𝑡𝑎𝑙 in (W) and it is equal to the sum of latent heat and sensible heat.
𝑷𝒕𝒐𝒕𝒂𝒍 = 𝑷𝒍𝒂𝒕𝒆𝒏𝒕 + 𝑷𝒔𝒆𝒏𝒔𝒊𝒃𝒍𝒆 [30]
5.3 Heat gains on supply air
Temperature of air in ducts is not constant and evolves along the air duct due to heat transfers with the
rooms. Air will be heated up in summer as temperature in the room is higher than temperature for air in
ducts. In winter air will be cooled down. However it can be neglected as heat losses in ducts are compensated
by heat gains from fans.
5.3.1 Heat gains/losses to the supply distribution duct
It is considered that not integrating the exhaust metal ductwork is not impacting, as the exhausted rooms are sensibly all at the same average temperature. It means that the exhaust ductwork contains air sensibly at the same temperature as the rooms air ducts are crossing. So heat transfers are almost equal to zero. It only concerns the supply metal ductwork. To be precise, it only concerns, for a given room, the part of the metal ductwork located outside of the room. It means that the supply air, before entering the room it is supposed to cool, will thermally exchange with the rooms that it is passing through. Given that the difference between the temperature of supply air and the temperatures of the crossed rooms is significant (around 15-20K in average), then heat transfers will be important. The impact of this design tolerance is the over-cooling of the rooms crossed by supply ductworks (i.e. close
to the supply shaft), and the under-cooling of the rooms located at the end the distribution network (i.e. far
from the supply shaft). Even if the overall energy balance is correct, it actually results in a destabilization of

-49-
the cooling distribution, and thus the calculated temperatures will be exceeded in some rooms (the further
ones). (28)
The case of heating is neglected as heat gains from the fan compensate heat losses while air is crossing the
rooms. Whereas for the cooling case heat gains from the fan and from the rooms crosses are added, it is a
lot more restrictive.
The rate of heat transfer Φ (W) between the room at temperature Troom and the temperature of the air in
the duct Tduct, with external surface area S (m²) can be written:
Φ = U. S. (Tduct − Troom)Pwall = U . S . ΔT [25]
Where U (W/(m².K)) is the thermal coefficient for the duct (circular or rectangular)
Calculation of thermal transmittance for rectangular ducts (28):
o Internal surface resistance (convective) = 1/hi
o The thermal resistance constituted by successive layers of thickness e with conductivity λ
o Internal surface resistance (convective) = 1/he
1𝑈=1ℎ𝑖+𝑒λ+1ℎ𝑒𝐔=(𝟏𝐡𝐢+𝒆𝝀+𝟏𝐡𝐞)−𝟏 [26
Calculation of thermal transmittance for circular ducts (28):
The principle is the same as for rectangular ducts except that the thermal resistance of the duct
changes.
𝟏
𝑼=
𝟏
𝒉𝒊+ (∑
𝟏
𝛌 𝐥𝐨𝐠 (
𝑫𝑬
𝑫𝒊)) +
𝟏
𝒉𝒆 [31]
With DE external diameter and Di internal diameter of the duct
Information from reference (33), are gathered in Table 19 and Table 20 below:
Duct
arrangement
Vertical
Duct
Duct horizontal (heat
flow up)
Duct horizontal (heat flow
down)
Circular
duct
1/he (m²K/W) 0.12 0.10 0.17 0.15
Table 19: External convective resistance for different air ducts layout
Air Velocity (m/s) 1 2 5 10 12 16
1/hi (m²K/W) 0.10 0.08 0.04 0.02 0.02 0.01
Table 20: Internal convective resistance for different air speed
The influence of heat transfer between air in ducts and rooms will be studied further in the report thanks
to ANSYS Fluent which is a computational fluid dynamics software. After the simulation, it will be possible
to assess the impact of this heat exchange between the room and air within the air duct.
5.3.2 Heat gain from the fan
Heat gain to the airstream is a function of the fan power however the fan arrangement also impacts on the gain. For fans where the fan and motor assembly are located within the airstream, both the fan power and motor efficiencies are imparted to the airstream. For cased fans where the fan motor is located out of the airstream only the fan power is imparted to the airstream, the motor losses are discharged as a heat gain within the plant room in which the fan is located.

-50-
The absorbed fan power is realized in the airstream as a temperature rise across the fan and additionally as temperature rise due to frictional interaction throughout the duct network. For fan arrangements where the motor is outside the airstream, the heat gain to be taken into account is the one of the fan power (16):
𝑷𝒇𝒂𝒏 =𝑸.∆𝑷
𝜼𝑭[32]
Where:
𝑃𝑓𝑎𝑛 = fan power (kW)
Q = volumetric airflow (m3/s)
∆𝑃 = Fan differential pressure (kPa)
𝜂𝐹 = Fan efficiency
However where the fan motor is located in the airstream the motor losses must also be taken into account, the heat gain to be taken into account is the absorbed motor power (16):
𝑷𝑴𝒐𝒕𝒐𝒓 =𝑸.∆𝑷
𝜼𝑭.𝜼𝑴.𝜼𝑫 [33]
Where:
𝑃𝑀𝑜𝑡𝑜𝑟 = Motor absorbed power (kW)
𝜂𝑀 = Motor efficiency
𝜂𝐷 = Drive efficiency
Fan efficiency depends on fan selected and are presented in Table 21 below:
Type of fan Efficiency
Axial fans 50-65%
Forward Curved Centrifugal 45-60%
Backward Curved Centrifugal 65-75%
BC Aerofoil Centrifugal 80-85%
Mixed Flow 45-70% Table 21: Efficiency of different fans (16)
Drive efficiencies are considered to be around 97% for belt driven fans and 100% for direct driven fans.
Motor efficiency can be found in ASHRAE (17) and are presented in the Table 22 below:
Minimum Nominal Full Load Efficiency (%) for Motors Manufactured after December 2010
Number of poles 2 4 6
Synchronous speed (RPM) 3600 1800 1200
Motor (kW)
0.8 77 85.5 82.5
1.1 84 86.5 86.5
1.5 85.5 86.5 87.5
2.2 85.5 89.5 88.5
3.7 86.5 89.5 89.5
5.6 88.5 91.0 90.2
7.5 89.5 91.7 91.7
11.1 90.2 93.0 91.7
14.9 91.0 93.0 92.4
18.7 91.7 93.6 93.0
22.4 91.7 94.1 93.6
29.8 92.4 94.1 94.1
37.3 93.0 94.5 94.1
44.8 93.6 95.0 94.5
56.0 93.6 95.0 94.5 Table 22: Motor efficiency (17)

-51-
The temperature difference can then be calculated by the following formula:
∆𝑻 =∆𝒑
𝜼𝑭.𝜼𝑴.𝜼𝑫.𝒄𝒑𝒂𝒊𝒓.𝝆 [34]
With:
𝝆 = air density (kg/m3)
∆𝑃 = Fan differential pressure (kPa)
𝜂𝑀 = Motor efficiency
𝜂𝐷 = Drive efficiency
𝜂𝐹 = Fan efficiency
∆𝑇 = Temperature variation (K)
5.4 Margins
The objective of this section is to identify and propose compensations to the design tolerances that appear
along the design processes. Without allowance, a design tolerance may pose a threat to several activities,
such as safety justifications, sizing of the systems in interface, contract management, layout activities or
electrical supply sizing. In this part margins that have been taken into account in the design are presented.
The document used for reference in this part is the allowance strategy report (34).
A design tolerance is defined as a characteristic which alters the precision or the correctness of the activities performed in the design process. It mainly comes from uncertainties in input data and from imprecision intrinsic to the establishment of models for calculations. Because of the risk it brings along, the design tolerance needs to be compensated by an allowance. The
design tolerance and the associated allowance can concern different parameters such as: heat load, air flow
rate, cooling power, electrical power or mechanical dimension. (34)
5.4.1 On heat gains
Due to UK grid frequency variation:
The frequency of UK network is not always stable and can fluctuate between 49,5Hz and 50,5Hz. It impacts
several topics that are listed below.
HVAC flow rates: -1% / +1% variations
Heat loads:
o -3% / +3% for pumps and fans
o 0% / +3% for pumps and electrical supplies
o No change for others
Input data variations:
This Design Tolerance regroups all reasons and causes that can result in negative modifications of the input
data considered at the first design stage. A negative modification is understood as negative in terms of
HVAC sizing for instance: increase of heat loads, decrease of maximum temperature...
The impact concerns:
Electrical supplies and Instrumentation and Control system component heat load: +10%
Other system component heat load: +5%

-52-
5.4.2 On flow rates
Due to flow rate balancing
Even if commissioning activities happen at the end of the design stage, they have to be anticipated in the first design stage. Indeed, balancing a HVAC system is a very tricky activity, with results that cannot be as perfect as the theoretical calculations. Actually the thermal calculation results in a minimum supply flow rate, associated to a supply temperature, to be set for each room. The setting is performed by an action on the pressure loss, through setting a manual damper when looking at the flow rate measurement in the associated line. This setting is not precise and moving the damper does not provide a linear response in terms of flow rate. Another issue is that modifying one line unbalances all others. Finally, the final flow rate cannot be lower than the one calculated, as it is a minimal requirement. In addition, the flow rate measurement chain has its own uncertainties. So in fact, two Design Tolerances can be identified as part of the flow rate balancing activity during commissioning activities. The first one is linked with the flow rate measurement uncertainties. The second one is linked to the impossibility of achieving a perfect balancing. It is to be noted that most of the air-conditioning systems are equipped with supply and exhaust ducts. Thus
the balancing is necessary for supply and exhaust ductworks, as flow rate in a given room represents the
pressure balance in supply and exhaust lines. (34)
First Design tolerance
It can be considered as the flow rate measurement uncertainties that is actually a combination of
uncertainties that depend on measurement parameters in reference to the standard depending on the type
of measurement mean used (Hot wire anemometer, Pitot tube …), the I&C system settings and the entire
chain measurement.
This flow rate uncertainty margin is taken equal to 10% and is due to the flow rate measurement uncertainty
using measurement devices as for instance a Pitot tube or an axial anemometer. (34)
Second design tolerance
It represents the difficulty of the ductwork balancing activity due to the technical difficulty of the task.
According to the HVAC tenderer, leeway value can’t be decreased below +5% on the global supply flow
rate. (34)
Total margin
The total margin due to flow rate balancing is equal to 1.05x1.10 = 1.15 = 1+15%
Duct leakages
Ductworks that are used for air distribution in HVAC systems are not airtight as there is a light over-pressure
in supply ducts due to the fan. This non-air tightness means that there is a loss of flow rate between the
supply fan and the rooms to be ventilated. For air-conditioning purposes, this loss is prejudicial as it means
that the calculation conditions are not met. This is a design tolerance. Only the part of the ductwork outside
of the ventilated room is concerned by the design tolerance. A leakage inside the room has no negative
effect.
To cope with this Design Tolerance, allowance acting on the global supply flow rate is defined. This
allowance is a margin, which value represents the average leakages in the system ductwork. The value is
quite difficult to assess though. It has been considered as 1% in previous designs and this value will be
maintained in this thesis. (28)

-53-
5.5 Energy balance of a room
Doing the energy balance of a room where temperature and humidity are constant means that:
Power supplied to the local is equal to the power lost by the local
Humidity supplied to the local is equal to humidity lost due to condensation and extraction
of humid air.
On Figure 25, air is supplied at a state 1 and extracted at a state 2.
Figure 25: Drawing of a room’s energy balance
5.5.1 Heat balance
In order to do this calculation the following assumptions have been made:
Power and air mass supplied will be preceded by a +
Power and air mass extracted will be preceded by a –
qm1 > qm2 in order to maintain an over-pressurization presented in §4.6.1 only in the main hall, for
other rooms qm1 = qm2 , as no over-pressurization is needed.
Total heat balance equation can be written, 𝑃1 + 𝑃𝑡𝑜𝑡𝑎𝑙 = 𝑃2
With:
𝑃1 = 𝑞𝑚1 . ℎ1
𝑃2 = 𝑞𝑚2 . ℎ2
𝑞𝑚2 = 𝑞𝑚1 − ∆𝑞
𝑞 . 𝑞𝑚1 − 𝑞𝑣𝑖𝑛𝑓
Then,
𝒒𝒎𝟏 =𝑷𝒕𝒐𝒕𝒂𝒍+𝒒𝒗𝒊𝒏𝒇.𝒉𝟐
((𝟏−∆𝒒
𝒒).𝒉𝟐−𝒉𝟏)
[35]
5.5.2 Sensible heat balance
In a similar way sensible heat balance equation can be written, 𝑃𝑠𝑒𝑛𝑠𝑖𝑏𝑙𝑒_1 + 𝑃𝑠𝑒𝑛𝑠𝑖𝑏𝑙𝑒 = 𝑃𝑠𝑒𝑛𝑠𝑖𝑏𝑙𝑒_2
With:
𝑃𝑠𝑒𝑛𝑠𝑖𝑏𝑙𝑒_1 = 𝑞𝑚1 . 𝑐𝑝1. 𝜃1
𝑃𝑠𝑒𝑛𝑠𝑖𝑏𝑙𝑒_2 = 𝑞𝑚2 . 𝑐𝑝2. 𝜃2
Considering that the thermal capacities are equal to 𝑐𝑝, then:
𝒒𝒎𝟏 =𝑷𝒔𝒆𝒏𝒔𝒊𝒃𝒍𝒆+𝒒𝒗𝒊𝒏𝒇.𝒄𝒑𝟐.𝜽𝟐
𝒄𝒑.((𝟏−∆𝒒
𝒒).𝜽𝟐−𝜽𝟏)
[36]
ROOM
𝑇 = 𝑐𝑜𝑛𝑠𝑡𝑎𝑛𝑡
𝜑 = 𝑐𝑜𝑛𝑠𝑡𝑎𝑛𝑡
Heat gains
𝑃𝑡𝑜𝑡𝑎𝑙 (W)
M (kgwater/hour)
Air supplied
qm1 (kg/s)
P1 (W)
M1 (kgwater/h)
P2 (W)
qm2 (kg/s)
M2 (kgwater/h)
Air extracted

-54-
5.5.3 Humidity balance
In a similar way humidity equation can be written, 𝑀1 + 𝑀 = 𝑀2
With:
𝑀1 = 𝑞𝑚1 . 𝑥1
𝑀2 = 𝑞𝑚2 . 𝑥2
𝒒𝒎𝟏 =𝑴+ 𝒒𝒗𝒊𝒏𝒇.𝒙𝟐
((𝟏−∆𝒒
𝒒)𝒙𝟐−𝒙𝟏)
=𝑷𝒍𝒂𝒕𝒆𝒏𝒕+ 𝒒𝒗𝒊𝒏𝒇.𝑳𝒗.𝒙𝟐
𝑳𝒗.((𝟏−∆𝒒
𝒒).𝒙𝟐−𝒙𝟏)
[37]
5.5.4 Defining the space line
The following relation can be obtained with the two equations above:
𝒒𝒎 =𝑴+ 𝒒𝒗𝒊𝒏𝒇.𝒙𝟐
((𝟏−∆𝒒
𝒒)𝒙𝟐−𝒙𝟏)
=𝑷𝒕𝒐𝒕𝒂𝒍+𝒒𝒗𝒊𝒏𝒇.𝒉𝟐
((𝟏−∆𝒒
𝒒).𝒉𝟐−𝒉𝟏)
[38]
The parameter γ can then be defined by neglecting 𝑞𝑣𝑖𝑛𝑓 and is equal to:
𝛾 =𝑃𝑡𝑜𝑡𝑎𝑙
𝑀≈
(1 −∆𝑞𝑞
) . ℎ2 − ℎ1
(1 −∆𝑞𝑞 ) . 𝑥2 − 𝑥1
It represents the slope of the space line (see Figure 26); it is an intrinsic characteristic of the room.
1
2
Δh
Δx
Figure 26: Evolution of psychometry in a room, from the supply state 1 to the extraction 2 (space line)
5.6 Blowing conditions
In order to design a ventilation system and calculate airflows to supply, it is necessary to assess blowing
conditions.

-55-
5.6.1 Characteristic of the blowing air temperature difference
It represents the temperature difference between the air supplied to the room and the ambient temperature
in the room.
∆𝑇 = 𝑇𝑟𝑜𝑜𝑚 − 𝑇𝑠𝑢𝑝𝑝𝑙𝑦
It can be either positive or negative. Usual values to be taken are consistent with reference (30):
Cold blowing: +5𝐾 < ∆𝑇 < +12𝐾
Hot blowing: −20𝐾 < ∆𝑇 < −5𝐾
5.6.2 Mixing rate
It is written τ (see Table 23) and is equal to:
τ =qv
V
With:
qv = Blowing volumetric rate (m3/s)
V = Room’s volume (m3)
τ = Mixing rate (Vol/h)
Ventilation type Mixing rate τ
Basic ventilation τ = 0.5 à 2 [V/h]
Heating τ = 2 à 5 [V/h]
Air conditioning τ = 5 à 10 [V/h] Table 23: Required mixing rate in a room (30)
5.6.3 Theoretical aspect and calculation
In this part will be described the calculations that have been carried out in order to find airflows and
temperatures in the rooms.
5.6.3.1 First approach
𝑞𝑚 =𝑃𝑠𝑒𝑛𝑠𝑖𝑏𝑙𝑒 + 𝑞𝑣𝑖𝑛𝑓. 𝑐𝑝2. 𝑇𝑠𝑢𝑝𝑝𝑙𝑦
𝑐𝑝. ((1 −∆𝑞𝑞
) . 𝑇𝑟𝑜𝑜𝑚 − 𝑇𝑠𝑢𝑝𝑝𝑙𝑦)
The first approach can be divided in several stages:
Calculation of heat transfers through the walls for the two cases -15°C/40°C. Temperatures of the
rooms are considered as equal to their maximum admissible temperature in summer and their
minimum acceptable temperature in winter.
Determination of thermal load for each room considering heat transfer through walls, gains from
lighting and other internal gains (in summer only)
Calculation of AHU’s necessary airflow in each room in summer and winter while considering a
blowing temperature equals to 15°C in summer and 15°C in winter. Additional convectors are
added in order to maintain the temperature above 18°C.
In order to optimize the required airflow that needs to supply the AHU, local heating and cooling
are added in some rooms.

-56-
Comparison between the airflow required in winter, summer and the ACH. For each room the
maximum of these three airflows is selected in order to get a first guess of the airflow that needs to
be supplied.

5.6.3.2 Second approach
In order to go a bit further, optimize the system and check the results, exact temperatures in each room have been calculated for steady state under extreme external
temperatures in winter (-15°C) and in summer (40°C). Here are the different stages of this second approach:
Writing of the thermal equation for each room in the building, giving us a system of 25 (number of rooms) equations and 25 unknown data (temperature in
each room).
Conversion of these 25 equations into a matrix system: A*T = B
A is a 25 rows, 25 columns matrix
T is the vector containing the 25 temperatures
B is a constant vector depending on each room’s supplied airflow and constant temperatures.
Inversion of the matrix A in order to get the exact temperatures T, T=A-1*B
Verification of the temperature in each room and optimization of the DVT system by varying the airflow.
The second approach is realized thanks to a matrix system. In order to explain calculations easily a simplified model with only two rooms in contact has been chosen:
Figure 27: Drawing of two rooms used for Excel modelling and cardinal directions
In order to keep the model simple, only two rooms are considered in the model and walls’ temperature is considered to be independent from the orientation (see
Figure 27). Only the floor has a different temperature. Real calculations have been realized considering different temperatures depending on orientation of the wall.
F
C
N
S
W E
q2
Tsupply
q1
Tsupply
Tfloor
Tout T1
P1
T2
P2
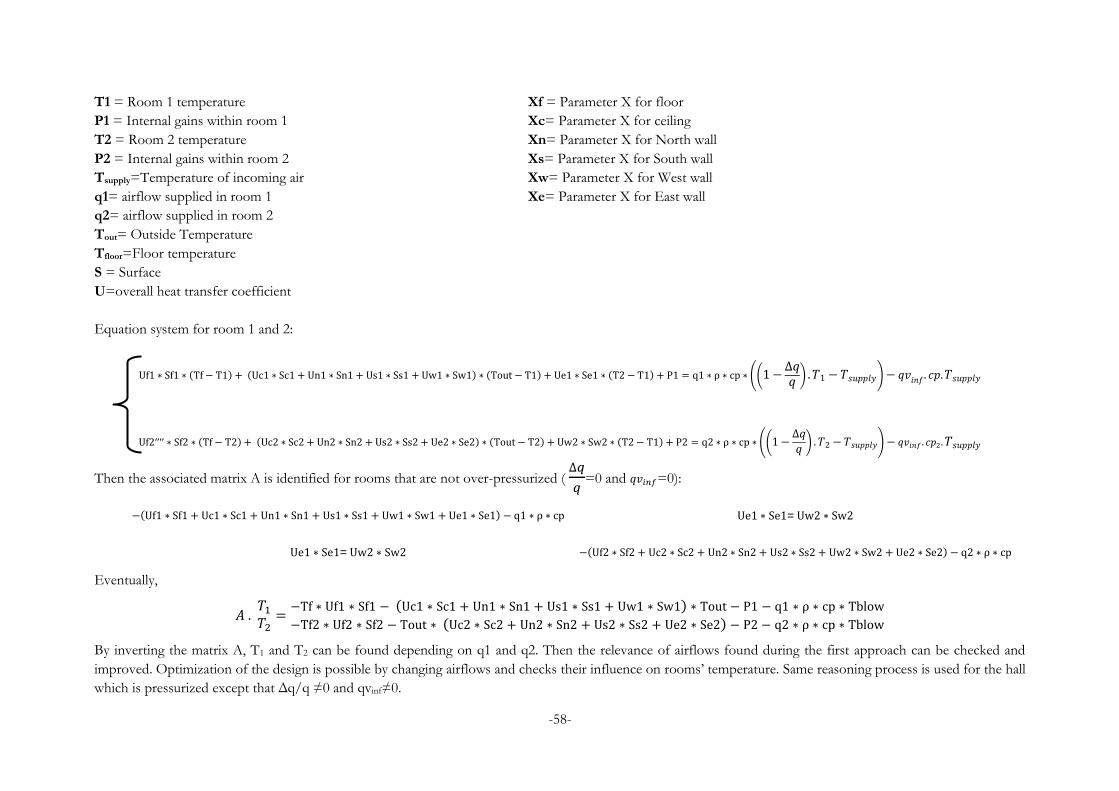
-58-
T1 = Room 1 temperature Xf = Parameter X for floor
P1 = Internal gains within room 1 Xc= Parameter X for ceiling
T2 = Room 2 temperature Xn= Parameter X for North wall
P2 = Internal gains within room 2 Xs= Parameter X for South wall
Tsupply=Temperature of incoming air Xw= Parameter X for West wall
q1= airflow supplied in room 1 Xe= Parameter X for East wall
q2= airflow supplied in room 2
Tout= Outside Temperature
Tfloor=Floor temperature
S = Surface
U=overall heat transfer coefficient
Equation system for room 1 and 2:
Uf1 ∗ Sf1 ∗ (Tf − T1) + (Uc1 ∗ Sc1 + Un1 ∗ Sn1 + Us1 ∗ Ss1 + Uw1 ∗ Sw1) ∗ (Tout − T1) + Ue1 ∗ Se1 ∗ (T2 − T1) + P1 = q1 ∗ ρ ∗ cp ∗ ((1 −∆𝑞𝑞
) . 𝑇1 − 𝑇𝑠𝑢𝑝𝑝𝑙𝑦) − 𝑞𝑣𝑖𝑛𝑓. 𝑐𝑝. 𝑇𝑠𝑢𝑝𝑝𝑙𝑦
Uf2′′′′ ∗ Sf2 ∗ (Tf − T2) + (Uc2 ∗ Sc2 + Un2 ∗ Sn2 + Us2 ∗ Ss2 + Ue2 ∗ Se2) ∗ (Tout − T2) + Uw2 ∗ Sw2 ∗ (T2 − T1) + P2 = q2 ∗ ρ ∗ cp ∗ ((1 −∆𝑞
𝑞) . 𝑇2 − 𝑇𝑠𝑢𝑝𝑝𝑙𝑦) − 𝑞𝑣𝑖𝑛𝑓 . 𝑐𝑝2. 𝑇𝑠𝑢𝑝𝑝𝑙𝑦
Then the associated matrix A is identified for rooms that are not over-pressurized ( ∆𝑞
𝑞=0 and 𝑞𝑣𝑖𝑛𝑓=0):
−(Uf1 ∗ Sf1 + Uc1 ∗ Sc1 + Un1 ∗ Sn1 + Us1 ∗ Ss1 + Uw1 ∗ Sw1 + Ue1 ∗ Se1) − q1 ∗ ρ ∗ cp Ue1 ∗ Se1= Uw2 ∗ Sw2
Ue1 ∗ Se1= Uw2 ∗ Sw2 −(Uf2 ∗ Sf2 + Uc2 ∗ Sc2 + Un2 ∗ Sn2 + Us2 ∗ Ss2 + Uw2 ∗ Sw2 + Ue2 ∗ Se2) − q2 ∗ ρ ∗ cp
Eventually,
𝐴 . 𝑇1
𝑇2=
−Tf ∗ Uf1 ∗ Sf1 − (Uc1 ∗ Sc1 + Un1 ∗ Sn1 + Us1 ∗ Ss1 + Uw1 ∗ Sw1) ∗ Tout − P1 − q1 ∗ ρ ∗ cp ∗ Tblow
−Tf2 ∗ Uf2 ∗ Sf2 − Tout ∗ (Uc2 ∗ Sc2 + Un2 ∗ Sn2 + Us2 ∗ Ss2 + Ue2 ∗ Se2) − P2 − q2 ∗ ρ ∗ cp ∗ Tblow
By inverting the matrix A, T1 and T2 can be found depending on q1 and q2. Then the relevance of airflows found during the first approach can be checked and
improved. Optimization of the design is possible by changing airflows and checks their influence on rooms’ temperature. Same reasoning process is used for the hall
which is pressurized except that Δq/q ≠0 and qvinf≠0.

6 TH-Bât Software
Thermal calculations in buildings are made with ThBat software. This software was developed under the
supervision of EDF Research & Development, specifically to meet the challenges of the Great ‘’Hot’’
project for extreme external temperature in summer.
ThBat is a code dedicated to thermo-aeraulic calculations in buildings for transient regime (permanent
regime appears as a limit case of the transitional regime). It is based on a modeling nodal principle: each
node is called air zone. For each air zone, representing a room or group of rooms, the software solves a
system of differential equations representing mass balance, momentum and energy. It therefore does not
take into account the rooms’ geometry (apart from the heat exchange surfaces through the walls, with
adjacent areas) and assumes the temperature of a thermal zone homogeneous, which leads up to the concept
of ambient temperature. Gases are considered as ideal gases. Heat transfer through the walls follows the
heat diffusion law 1D.
The rooms are represented by homogeneous air zones. For each air zone one associate:
- Thin walls (doors, windows) or thick (walls, partitions).
- Internal gains (regulated or not).
- Ventilations that can be regulated depending on the temperature.
- Vertical or horizontal openings
Elements whose temperatures do not vary during the calculations such as the deep ground are represented
as adjacent zones (ZA).
6.1 Input data
The input data taken into account to build the model on this software are presented in Table 24:
Material Thermal conductivity, λ (W/m.K) Density, ρ (kg/m3) Specific heat, Cp (J/kg.K)
Concrete 2.3 2300 879
Cladding 0.04 50 920
Table 24: Thermal conductivity of materials (35)
Equipments Overall heat transfer coefficient (W/(m².K))
Windows 2.8
Metal doors to outside 5.8
Metal doors to inside 4.5
Fireproof doors 1.17
Table 25: Heat transfer coefficient for doors and windows (35)
The following values also need to be provided and input in the software:
Outside temperature (°C)
Supply temperature in the rooms
Simulation time (s)
The time interval of the calculation (s)
Adjacent zones that are thermodynamic sources at constant temperature and humidity.

-60-
6.2 Zone property
A zone is an object where the evolution of temperatures will be calculated during the simulation. Concretely,
zones represent rooms and are defined by the following characteristics:
Its volume (m3)
Air density and specific heat within the room (kg/m3 and J/kg.K). If the fluid in the zone is air, the
density will be calculated automatically as a function of the temperature, pressure and humidity of
the air.
A total thermal power dissipated within the zone (W). This power will be chosen constant at its
maximum in our case as calculations will be made in the worst case scenario.
Its height under the ceiling (m)
In addition to calculated zones, the outside and adjacent zones are considered as zones with constant
temperature. The adjacent zones and the outside will be considered as “air zone”. It means that density is a
function of the temperature, pressure and humidity.
6.3 Wall property
A wall represents a separation between two “air zones”. This separation can be a wall, a door or a window.
It is defined by:
A surface (m²)
An air zone on the left
An air zone on the right
A type either thin or thick
If the wall is thin, it needs to be defined:
A global thermal heat transfer coefficient between the two air zones located at each side of the wall.
It will be the case for windows.
It the wall is thick, it needs to be defined:
A heat transfer coefficient to the left (W/m²K)
A heat transfer coefficient to the right (W/m²K)
A list of wall layers
Each wall layer represents a part of the wall. A layer has to be defined by:
A material (thermal conductivity, specific heat and density)
A thickness (m)
In Figure 28 one can find a representation of a wall as it is considered in the software:
T1 T2 T3 T4 T5 T6hleft hright
Figure 28: Wall modelling inTh-bât software

-61-
The thickness of each layer must be sagely chosen depending on the nature of the material it is made of and
the timescale of the studied phenomena. The decisive criteria that will be considered to choose a layer
thickness depend mainly on the thermal diffusivity of the material and the speed of the studied phenomena.
For example if studied temperatures are in the range of the minute, the layers will have to be thinner than
for variations in the order of the hour of the day. Indeed if layers are too thick, some quick thermal
phenomena could be hidden. If the layers are too thin, the calculation time might be too long. Results for
concrete and cladding are displayed in Table 26.
A good solution for most of the cases is to take a Fourier number for each layer around 3 or 4.
𝛂 =𝝀
𝝆∗𝒄𝒑 [39]
α is the thermal diffusivity (m²/s)
λ is the thermal conductivity (W/(m.K))
ρ is the density (kg/m3)
cp is the specific heat capacity (J/(kg.K))
𝑭𝒐 =𝛂 .𝒕
𝒍² [40]
Fo is the Fourier number (-)
L is the layer thickness (m)
t is the time of the observed phenomenon (s). Here t = 3600s
Table 26: Materials’ thermal diffusivity and layer thickness
6.4 Ventilation property
Ventilation represents an exchange between two zones, with a fixed airflow. It needs to be defined by:
An airflow (m3/s)
An upstream zone
A downstream zone
Ventilation can be either non-heated and air is blown at the upstream zone temperature either heated and
air is blown at a temperature previously defined.
Ventilation can also be regulated thus a starting temperature, a stopping temperature and a regulation zone
must be chosen.
6.5 Opening property
An opening represents an exchange between two zones. Air flow depends on the pressure differences on
each side of the opening. Concretely an opening represents an open door, a hole ... An opening is defined
by:
An orientation (horizontal or vertical)
A zone on the left
A zone on the right
A width (m)
A height (m)
A thickness (m)
An opening degree. A coefficient equals to 1 corresponds to an open door and a coefficient of 0
represents a completely sealed door. The typical value for doors is 0.01, it represents leakages under
the door.
Material Thermal diffusivity 𝛂 (m²/s) Layer thickness (m)
Concrete 1,14.10-6 0.037
Cladding 8,70.10-7 0.035

-62-
7 Parametric study
Ventilation systems are energy consuming especially in nuclear buildings because they work 24/24h. It is
then necessary to carry out a parametric study in order to optimize the system and thus save money and
energy. In this part the impacts of building civil works and ventilation design on energy consumption of will
be studied.
7.1 Glazed surface
Glazed surface have a lot of influence on the thermal gains of the building. It is more transparent cladding
in this case supposed to be airtight and with the following characteristics:
𝑈 = 2,8𝑊
𝑚2.𝐾
𝑆𝐶 = 0.8
With U the overall heat transfer of the window and SC the shading coefficient. These values have been
taken from ASHRAE book (17) for a double glazed transparent window.
The Maximum solar heat gain factor (“MSGHF” in W/m²) depends on the orientation of the windows and
the latitude of the location. In this case the latitude remains constant but depending where the windows will
be installed, the Maximum Solar Heat Gain Factor won’t be the same and will have a strong influence on
the thermal loads for the building. For a latitude equal to 52° (latitude of HPC project), one has the following
data taken from ASHRAE book. (17).
Wall’s orientation North South East West
MSGHF (W/m²) 142 609 681 681
Table 27: MSGHF for different wall orientation
It is logical that windows should be implemented on the North surface as the MSGHF is much smaller
during summer months. In winter it is not supposed to have any influence as heat gains due to solar
radiations are neglected in order to size the HVAC system in the worst case scenario.
In Table 28 are presented the results obtained with the building model realized on Excel for a glazed surface
equivalent to 20% of the total wall surface, an outside temperature of 40°C and an inner temperature
assumed equal to 40°C (worst acceptable temperature in the hall).
Windows location North South West
Heat gains through walls in the main hall (W) 21800W 36500W 35525W
Comparison compared to the minimum value +0% +67.5% +62.8%
Table 28: Heat gains for different windows location
The location of glazed surfaces has an important impact on thermal heat gains through walls in the hall.
After discussion with engineers responsible for thermal design of nuclear based buildings at EDF, it is more
reasonable to consider windows on the North wall of the building. As a consequence, all the parts that
follow have been made with the assumption that the building will have a glazed surface corresponding to
20% of the total North wall surface. The value of 20% is consistent with UK building regulation. (35)
7.2 HVAC system choice
The demineralization station is a non-classified building. According to regulation this building should be
design for a maximum external temperature of 40°C as stated in §5.1. However, according to my supervisor
within the company Anna Cotty, a study for a maximum external temperature equal to 33°C (corresponding
to one day average temperature with a 10000 years return period taking into account climate change) could

-63-
be interesting if it shows that for a rapid increase of outside temperature to 40°C, it takes long enough to
exceed the maximum admissible temperature.
7.2.1 40°C outside Temperature
As stated in §5.1.1 outside temperature that needs to be considered is equal to 40°C. Different ventilation
system design will be studied with their advantages and drawbacks.
7.2.1.1 AHU supplying the whole building
Figure 29: Cross section of the demineralization station with an AHU supplying air everywhere
As shown in Figure 29, one Air Handling Unit supplies air to the whole building. It means that air sent to
the building is treated by the AHU before.
The calculations for this design have been realized both with Excel and with Th-bât software. Air supplied
to the building by the Air Handling Unit has a temperature of 15°C. Figure 30Figure 31 shows the results
obtained on Th-bât for rooms located in the basement.
The maximum admissible temperature for all these rooms which are located in the basement is 40°C. On
this graph which plots the room temperature as a function of the time it is clear that temperature is not
going over 30°C when the steady state is reached. It is 10°C lower than the maximum admissible
temperature. Using an AHU to insure air renewal in the basement is pointless. Indeed, it has a negative
impact on the energy use and the size of the Air Handling Unit.
AHU
Air supplied by the AHU

-64-
Figure 30: Steady state temperature of the basement (10 rooms) for 40°C outside with an AHU
Discussion:
This design is really energy consuming in summer. Indeed, the basement is underground and naturally
cooled down by the chill ground and deep ground. Using an AHU in order to supply air to the basement is
not the best solution as heat transfers through the basement walls totally compensate heat gains from the
basement. As a consequence, this design is clearly not optimized as it would result in an over-sizing of the
ventilation system.
7.2.1.2 Second design: AHU supplying only rooms above level 0.00
Figure 31: Cross section of the demineralization showing the two distinct parts of the building
15
17
19
21
23
25
27
29
31
0 5 10 15 20 25
Tem
pera
ture
(°C
)
Time (days)
Soda/Acid/Morpholine Room
Bisulphite room
Acid/Base room
Lobby West level -6,8
Stairs West
Degasser room
Lobby South level -6,8
Fire Fighting Valve room
Stairs South East 1
Main hall basement
AHU
Air supplied by the AHU
Air supplied from
outside

-65-
As shown in Figure 31, air supplied to the basement comes directly from outside whereas air that is sent to
rooms above level 0.00 is conditioned by an AHU.
The calculations for this design have been realized both with Excel and with Th-bât software. Air supplied
to the building by the Air Handling Unit has a temperature of 15°C. However conditioned air will only
supply rooms located above ground level. The basement will be supplied with air from outside in order to
take advantage of chill ground to cool down warm air from outside. Below are shown graphs realized with
Th-bât and then exported on Excel.
Figure 32: Steady state temperature of the basement for 40°C outside without an AHU
Discussion:
With this design, the steady state temperature in the basement gets closer to the maximum admissible value
of 40°C without going over it. A simple extraction fan will be required to ventilate the basement. No air
conditioning by an AHU is necessary.
7.2.1.3 Design comparison
With both designs one can maintain the temperature within the given range of temperature but airflows and
powers needed are really different. Results are presented in Table 29.
Air supplied by AHU
(1st design)
Air supplied by AHU above ground
floor (2nd design)
AHU airflow (m3/h) 30286 22050
Pcooling_coil (kW) 455 330
Pheating_coil (kW) 180 110
Padditional heating (kW) 30 111 Table 29: Results obtained with the first and the second HVAC design
The size of the AHU can be decreased by almost 40% with the second design. Moreover energy saving with
the second design in summer is important; there is about 44% difference between the two designs.
Installation costs for the first design are much more important as really long supply and extract air ducts are
needed in order to link the basement to the AHU. Additional costs of a bigger AHU, cooling coil and water
chiller are also quite important. The second design is put aside for the rest of the study as it is not relevant
being more expensive and more energy consuming.
19
21
23
25
27
29
31
33
35
37
0 5 10 15 20 25
Tem
per
ature
(°C
)
Time (days)
Soda/Acid/Morpholine Room
Bisulphite room
Acid/Base room
Lobby West level -6,8
Stairs West
Degasser room
Lobby South level -6,8
Fire Fighting Valve room
Stairs South East 1
Main hall basement

-66-
7.2.2 33°C outside temperature, design without AHU
Some nuclear buildings are designed for 33°C as outside temperature but only if it is possible to provide
enough cooling with a single flow mechanical ventilation system (27). Consequently, no AHU will be used
but only several extraction fans located on the building’s roof (see Figure 33). It is only possible because the
maximum admissible temperature in most of the rooms is bigger than outside air temperature. This design
results in a cost reduction at many levels (HVAC, civil works...). Indeed total length of air ducts is drastically
reduced, AHU and water chillers disappear. In order to validate this design, the influence of a quick
temperature rise from 33°C to 40°C will be studied.
Figure 33: Cross section of the demineralization station with a single flow ventilation system
The calculations for this design have been realized both with Excel and with Th-bât software. Air supplied
to the building has a temperature equal to the outside temperature. Below are shown graphs realized on Th-
bât and then exported on Excel.
Only the rooms with sensitive equipment which are not cooled down by additional air conditioning unit
will be plotted on Figure 34 and Figure 35:
Figure 34: Temperature evolution in the main hall after a rapid increase of outside temperature from 33°C to 40°C
20
25
30
35
40
45
0 10 20 30 40 50
Tem
pera
ture
(°C
)
Time (days)
Main hall level 0
Air supplied from
outside

-67-
Figure 35: Zoom in on Figure 34
The first step is a 33°C outside temperature condition until the steady state is reached (horizontal
asymptote). The second step consists in a rapid increase of the temperature to 40°C. These two graphs
above plot the temperature evolution in the hall housing the demineralization process after a temperature
rise from 33°C to 40°C.
From §4.2.2.1 membranes in the reverse osmosis skids can withstand air temperature up to 43°C. Then the
design will be considered as relevant if the temperature in the hall does not exceed 43°C during six hours
for a constant outside temperature equal to 40°C. (28)
Figure 34 and Figure 35 show that it is impossible to design a reliable ventilation system without an AHU for
33°C outside. Indeed the temperature within the hall reaches 44°C in less than two hours. Thus it is not
reasonable because it represents risks towards the demineralization process which are not consistent with
the FMECA study. This solution will be abandoned for the rest of the study due to the risks it represents
toward the process.
7.3 Scenario analysis
Many parameters have an influence on the energy consumption of an HVAC system. In this section the
impacts of the modification of these parameters will be assessed and studied. For the scenario analysis the
design that has been taken on is the one with the AHU supplying air only for rooms located above ground
level (from §7.2.1.2) because it is the most optimized HVAC system.
7.3.1 Scenario 1: White painting
Painting the building in white might seem quite simple but it can have a big influence on the ventilation
system design.
It has an influence on heat gains through walls due to solar radiations. Indeed from the section §5.2.1.2 the
formula used to calculate the Cooling Load Temperature Difference can be found:
CLTD_corr = [(CLTD + LM) . k + (25.5 – Tint) + (Tem – 29.4)] . f CLTD_corr = [(CLTD + LM). k +
(25.5 – Tint) + (Tem – 29.4)]. f [27]
k = correction factor depending on the color of the wall.
This coefficient has been taken equal to 0.83 for the baseline scenario. For walls painted in white, the value
of this coefficient decreases to 0.65
37
38
39
40
41
42
43
44
45
46
-10 -5 0 5 10
Tem
pera
ture
(°C
)
Time (hours)
Main hall level 0

-68-
Values for k can be found in (17) and (28).
In Table 30 are shown the results obtained with Th-bât and Excel:
AHU airflow 21000 m3/h
Pcooling coil 315 kW
Pheating coil 106 kW
Padditional cooling -26 kW
Padditional heating 115 kW
Table 30: HVAC equipment required for scenario 1
Main purpose of the AHU is to ensure a minimum air change rate but the power supplied by the AHU is
often not enough to maintain air temperature within the requested range in most of the rooms. Thus,
Padditional heating and Padditional cooling refer to air conditioning units and convectors that are added in order to
compensate for the lack of power supplied by the AHU.
7.3.2 Scenario 2: Insulation
Additional insulation on the concrete part of the building can be beneficial for the HVAC system. Insulating
material taken into account in this section has the following properties:
Thermal conductivity, λ = 0,04 W/(m.K)
Thickness, e = 0,2 m
It has a direct influence on the thermal heat transfer coefficient U of the walls §5.2.1.1. In Table 31 are
displayed the results obtained with Th-bât and Excel:
AHU airflow 18900 m3/h
Pcooling coil 283kW
Pheating coil 102 kW
Padditional cooling -26 kW
Padditional heating 91 kW
Table 31: HVAC equipment required for scenario 2
7.3.3 Scenario 3: Combination of insulation and white painting
By combining insulation and white painting, energy consumption reduction is even bigger. Results are
presented in Table 32.
AHU airflow 18200 m3/h
Pcooling coil 273 kW
Pheating coil 101 kW
Padditional cooling -25 kW
Padditional heating 91 kW
Table 32: HVAC equipment required for scenario 3

-69-
7.3.4 Comparison with the baseline scenario
In Table 33, are summarized the differences in AHU airflows and power required in order to maintain
ambient conditions within the rooms at a reasonable level for extreme external temperature.
Baseline scenario Scenario 1 Scenario 2 Scenario 3
AHU airflow 22050 m3/h -4,8 % -14,3 % -17,4 %
Pcooling coil 330 kW -4,8% -14,3 % -17,4%
Pheating coil 115 kW -7,8 % -11,3 % -12,1 %
Padditional cooling -31 kW -16,1% -16,1 % -19,3 %
Padditional heating 111,5 kW +3.1 % -18,4 % -18,4%
Table 33: Comparison between the three different scenarios for 40°C and -15°C
In order to assess what is the influence of the different scenario on the power consumption, it is relevant
to consider reasonable external temperature and not extreme external temperatures which are used to design
the ventilation system. The temperature range that will be studied in this part is the range 2°C/20.5°C which
correspond to the average coldest month and average warmest month temperature in Somerset England
according to (36).
2°C Baseline
scenario
Scenario 1 Scenario 2 Scenario 3
Pheating coil 57kW 54kW 51kW 50kW
Padditional heating 19,5kW 19,5kW 15kW 14,5kW
Total 76,5kW 73,5kW 70,5kW 64,5kW
Table 34: Comparison between the three different scenarios for 2°C
20.5°C Baseline
scenario
Scenario 1 Scenario 2 Scenario 3
Pcooling coil 0kW 0kW 0kW 0kW
Padditional cooling -25kW -23kW -23kW -19kW
Total -25kW -23kW -23kW -19kW
Table 35: Comparison between the three different scenarios for 20.5°C
Influence of these parameters on the power consumption of the system is important for extreme external
temperature (see Table 33) but it can be overlooked for temperatures between 2°C and 20.5°C (see Table 34
and Table 35). Furthermore after discussion with one of the person in charge of civil works in the company,
it is not reasonable to consider these scenarios for the following reasons:
- Concrete walls must be checked for cracks at a regular frequency. Consequently, additional external
insulation is not a feasible solution as it would hide the possible cracks in the walls.
- Painting could be a solution but the power plant is close to the sea and salt from seawater will
damage the painting really quickly. Then they would have to redo it every ten to fifteen years which
is not worth it considering the energy gains.
- The price of the two previous solutions is really important and it would not compensate the energy
gains.
A further analysis month by month could have been carried out as in §7.4 but considering the three previous
statements written before, it has been abandoned.
The baseline scenario will be maintained as the more feasible scenario and used in the following part of this
paper.

-70-
7.4 Ventilation system control
In nuclear power plants HVAC system needs to be kept as simple as possible. Indeed, robustness will be
favored over energy efficiency. As a consequence, in most of the buildings in a nuclear power plant there is
no control. It means that the Air Handling Unit is designed for summer condition which is the most
restrictive season and same airflows are considered for winter conditions.
7.4.1 Demineralization station HVAC system control
Designing a ventilation system without control results in an overconsumption of energy especially during
the winter season as it is displayed in Figure 36. Indeed, without control, temperature reached in the hall is
much higher than the minimum admissible value equal to 5°C. With control, the temperature gets closer to
the minimum admissible temperature. For the demineralization station a control system is possible as it is
not a nuclear safety related building. Thus ventilation system doesn’t need to be that robust and energy
savings thanks to a control system could represent important benefits (see Table 36).
Figure 36: Temperature of the hall depending on the presence of a control system
HVAC control system that is going to be treated in this part is really simple in order to stick to the nuclear
building ventilation sizing rules. It consists in a two speed fan both for supply and extraction (each speed
corresponding to one season either winter or summer), motorized dampers that will balance the network
when the speed changes and one captor that will monitor the outside temperature. If the outside temperature
reaches a certain threshold the fan speed will change and the dampers will be activated.
Airflows have been calculated for summer as it is the most restrictive season. For winter conditions the
minimum air renewal will be insured in order to reduce the heating coil power and AHU’s fan power.
Additional heating elements such as radiator or air heater will be preferred. The outside temperature at
which the fan speed changes is equal to 19°C according to the calculation realized. In order to avoid fan
speed changes all the time when temperature is around 19°C, fan speed will change when temperature
reaches 19°C and will change again at 18°C. This way one has a hysteresis cycle.
Winter (-15°C) / Without control Winter (-15°C) / With control
AHU airflow 22050 m3/h 13069 m3/h
Pheating coil 115kW 98kW
Pheating 111,5kW 116kW
Pmotor fan 7,5kW (495Pa) 1,8kW (200Pa)
Ptotal 234kW 216kW
Table 36: Power consumption for HVAC system with and without control by -15°C outside
5
6
7
8
9
10
11
12
13
14
15
0 5 10 15 20 25
Tem
pera
ture
(°C
)
Time (days)
Main hall level 0 withoutcontrol
Main hall level 0 with control

-71-
By knowing the length and the cross section of the air ducts it is possible to estimate the pressure losses in
the circuit for both scenarios (with and without regulation). The formula used to calculate the motor
absorbed power can be found in section §5.3.2.
𝑃𝑀𝑜𝑡𝑜𝑟 =𝑄. ∆𝑃
𝜂𝐹 . 𝜂𝑀 . 𝜂𝐷 [33]
Q = volumetric airflow (m3/s)
∆𝑃 = Fan differential pressure (kPa)
𝜂𝐹 = Fan efficiency (here 0.8)
𝜂𝑀 = Motor efficiency (here 1.0)
𝜂𝐷 = Drive efficiency (here 0.9) In order to assess the benefits of having a control system, a deeper analysis month by month needs to be carried out. The daily average temperatures are summarized in Table 37.
Month Average temperature
Average warmest
temperature Average coldest
temperature January 4,8°C 7,3°C 2,3°C
February 4,7°C 7,5°C 2,0°C
March 6,5°C 9,7°C 3,4°C
April 8,2°C 12,0°C 4,5°C
May 11,4°C 15,5°C 7,4°C
June 14,1°C 18,1°C 10,1°C
July 16,4°C 20,5°C 12,4°C
August 16,4°C 20,4°C 12,4°C
September 14,1°C 17,7°C 10,6°C
October 11,0°C 14,0°C 8,0°C
November 7,6°C 10,4°C 4,8°C
December 5,8°C 8,3°C 3,3°C Table 37: Average temperatures in Somerset England (36)
The outside temperature rarely exceeds 19°C (fan speed switching temperature) so a control system is necessary otherwise the HVAC system will be oversized. In order to assess the real benefits of a control system it is necessary to calculate the power gains for normal weather condition and not for extreme conditions as it was the case for sizing the HVAC system. Thus for each month the energy consumption of the HVAC system will be assessed with and without the control system (at normal average temperature).
With Control Without Control
January Padditional heating 17,5kW 17kW
Pheating coil 34kW 45,5kW
Pmotor fan 1,8kW (200Pa) 7,5kW (495Pa)
February Padditional heating 17,5kW 17kW
Pheating coil 34kW 45,5kW
Pmotor fan 1,8kW (200Pa) 7,5kW (495Pa)
March Padditional heating 13kW 13kW
Pheating coil 28kW 37,5kW
Pmotor fan 1,8kW (200Pa) 7,5kW (495Pa)
April Padditional heating 17kW 17kW
Pheating coil 0kW 0kW
Pmotor fan 1,8kW (200Pa) 7,5kW (495Pa)

-72-
With Control Without Control
May Padditional heating 11kW 11kW
Pheating coil 0kW 0kW
Pmotor fan 1,8kW (200Pa) 7,5kW (495Pa)
June Padditional heating 6kW 6kW
Pheating coil 0kW 0kW
Pmotor fan 1,8kW (200Pa) 7,5kW (495Pa)
July Padditional heating 3,5kW 3,5kW
Pheating coil 0kW 0kW
Pmotor fan 1,8kW (200Pa) 7,5kW (495Pa)
August Padditional heating 3,5kW 3,5kW
Pheating coil 0kW 0kW
Pmotor fan 1,8kW (200Pa) 7,5kW (495Pa)
September Padditional heating 6kW 6kW
Pheating coil 0kW 0kW
Pmotor fan 1,8kW (200Pa) 7,5kW (495Pa)
October Padditional heating 11kW 11kW
Pheating coil 0kW 0kW
Pmotor fan 1,8kW (200Pa) 7,5kW (495Pa)
November Padditional heating 11kW 11kW
Pheating coil 25kW 34kW
Pmotor fan 1,8kW (200Pa) 7,5kW (495Pa)
December Padditional heating 13kW 13kW
Pheating coil 31kW 41kW
Pmotor fan 1,8kW (200Pa) 7,5kW (495Pa)
Table 38: Assessment of energy gains for each month with and without a control system
Table 39 is a summary of the energy saved each month by having a control system. First column has been
calculated by calculating the difference between Padditional heating Pheating coil and Pmotor fan (from Table 38) for
HVAC system without control and for HVAC system with control.
Month Power saved Energy saved per month
January 16,7kW 12,4MWh
February 16,7kW 11,2MWh
March 15,2kW 11,3MWh
April 5,7kW 4,1MWh
May 5,7kW 4,2MWh
June 5,7kW 4,1MWh
July 5,7kW 4,2MWh
August 5,7kW 4,2MWh
September 5,7kW 4,1MWh
October 5,7kW 4,2MWh
November 14,7kW 10,6MWh
December 15,7kW 11,7MWh
Energy saved in a year 86,4MWh
Table 39: Energy saved each month by having a control

-73-
7.4.2 HVAC system control cost
Having a control system with a two-speed fan involves an additional cost. An assessment of the financial
viability of this investment needs to be carried out. For EDF as an electricity producer, energy saved can be
sold to the consumers because it won’t be used to power HVAC equipment, one can then calculate the net
present value of the investment over a period of 60 years (average lifespan of a nuclear power plant).
𝑵𝑷𝑽 = ∑𝑹𝒕
(𝟏+𝒊)𝒕− 𝑰𝑵
𝒕=𝟎 [41]
With:
𝑅𝑡 = net cash inflow during the period t (110 €/MWh)
𝐼 = total initial investment costs
𝑖 = discount rate (taken equal to 10%)
𝑡 = number of time periods
The calculation has been made considering a selling price equal to 110 €/MWh and a discount rate equal to
10% according to EDF company.
The initial investment for 2 two-speed fans (1 AHU extraction fan and 1 AHU supply fan) with their control
system is about equal to 50 000 Euros according to the constructor documentation. Additional maintenance
cost is considered to be 2% of the additional initial investment. Consequently every year EDF can save up
to 8500 €. Table 40 gives the cash flow and the net present value every year.
86,4 .110 − 50000 . 2% = 8500 €
Year Cash flow Net present value
0 -50000 -50000
1 7731 -42269
2 7028 -35241
3 6389 -28852
4 5808 -23043
5 5280 -17763
6 4800 -12963
7 4364 -8599
8 3967 -4632
9 3607 -1025
10 3279 2253
Table 40: Net present value for a control system investment

-74-
Figure 37: Graphs showing the net present value of the investment for a control system
Discussion:
As shown on Figure 37 above, implementing a control is interesting after a period of 10 years. This
investment would then be economically viable considering the plant in operation for sixty years.
-60000
-50000
-40000
-30000
-20000
-10000
0
10000
20000
0 1 2 3 4 5 6 7 8 9 10 11 12 13 14 15
Net
pre
sen
t va
lue
Net present value of a control investment

-75-
7.5 Critical scenario analysis in chemical rooms
In the basement, some rooms are used for chemicals storage. In §4.2.2.5, it is stated that ACH requirements
needs to be risen to 20 if chemicals vapors are detected within these rooms. An assessment of the
temperature evolution in the basement when the ACH is increased needs to be carried out both for summer
and for winter.
The following results have been obtained on Th-bât and then exported on Excel to plot graphs. On the two
graphs below, the first part (t<0) corresponds to the normal ACH requirement equivalent to ten volumes
per hour. After chemical vapors detection at t=0, ACH is increased to twenty. The influence of this brutal
rise on the temperature is studied.
Summer case:
For summer, results are presented on Figure 38. It is obvious that it is not a problem if ACH rises as
temperature won’t exceed the maximum admissible temperature of 40°C.
Figure 38: Evolution of the temperature after ACH increase in chemical rooms (summer)
Winter case:
For winter case temperature must not drop below 0°C as it would cause water to freeze. Temperature in
the basement drop from 5,3°C to 3,8°C in less than 1h30min. After one day the temperature reaches 3°C
in the basement. According to the tenderer of the demineralization process if toxic vapors are detected in
the basement, actions will be taken to fix the problem in one day. As a consequence, increasing the ACH in
chemical rooms presents no risk even if temperature drops below the minimum admissible temperature
(Tmin=5°C).
30
31
32
33
34
35
36
37
-50 0 50 100 150
Tem
pera
ture
(°C
)
Time (hours)
Soda/Acid/Morpholine Room
Bisulphite room
Acid/Base room
Lobby West level -6,8
Stairs West
Degasser room
Lobby South level -6,8
Fire Fighting Valve room
Stairs South East 1
Main hall basement
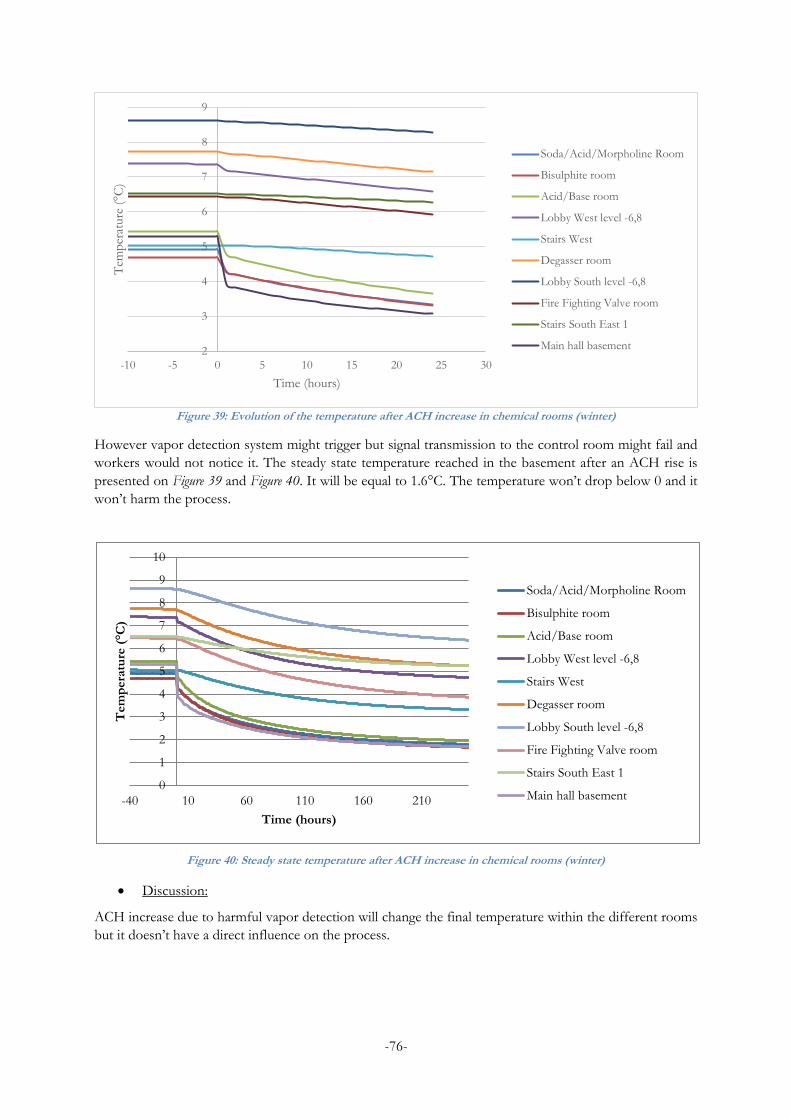
-76-
Figure 39: Evolution of the temperature after ACH increase in chemical rooms (winter)
However vapor detection system might trigger but signal transmission to the control room might fail and
workers would not notice it. The steady state temperature reached in the basement after an ACH rise is
presented on Figure 39 and Figure 40. It will be equal to 1.6°C. The temperature won’t drop below 0 and it
won’t harm the process.
Figure 40: Steady state temperature after ACH increase in chemical rooms (winter)
Discussion:
ACH increase due to harmful vapor detection will change the final temperature within the different rooms
but it doesn’t have a direct influence on the process.
2
3
4
5
6
7
8
9
-10 -5 0 5 10 15 20 25 30
Tem
per
ature
(°C
)
Time (hours)
Soda/Acid/Morpholine Room
Bisulphite room
Acid/Base room
Lobby West level -6,8
Stairs West
Degasser room
Lobby South level -6,8
Fire Fighting Valve room
Stairs South East 1
Main hall basement
0
1
2
3
4
5
6
7
8
9
10
-40 10 60 110 160 210
Tem
pera
ture
(°C
)
Time (hours)
Soda/Acid/Morpholine Room
Bisulphite room
Acid/Base room
Lobby West level -6,8
Stairs West
Degasser room
Lobby South level -6,8
Fire Fighting Valve room
Stairs South East 1
Main hall basement

-77-
8 Ansys Fluent Modeling
Ansys Fluent has been used in order to assess the impact of heat gains to the supply distribution duct due
to the temperature difference between the room and air inside the duct as presented in §5.3.1. The software
that has been used in this part is an academic version (downloaded from KTH webpage) of the actual
software. The simulation process follows four distinct and successive steps:
Building of CAD model
Meshing
Application of boundary conditions
Computational Analysis and Visualization
8.1 Software presentation
Ansys is one of the most powerful Computational Fluid Dynamic software used nowadays. In this part
will be explained the meshing characteristics and the turbulence modeling used in Ansys Fluent.
8.1.1 Meshing
Meshing is the spatial discretization of a continuous medium or a discrete representation of the geometry
involved in a problem. The purpose of meshing is to simplify a system with a model representing the system
in its environment. Mesh generation is a really important step as it has an impact on the solution accuracy
and the rate of convergence. (37)
8.1.1.1 Shapes of Cells
Many different cell types are available both polygonal and polyhedral mesh can be used. In 2D, the most
commonly applied cell types are triangles and quadrilaterals. In 3D volume meshing, the most commonly
used cells are tetrahedrons, pyramid, triangular prism and hexahedron. , they are shown in Figure 41 and
Figure 42 below. (37)
Figure 41: 2D cell types
Figure 42: 3D cell types

-78-
8.1.1.2 Grid Classification
Three different types of grid can be used in order to mesh an object. They are structured grid (Figure 43),
unstructured grid (Figure 44) and hybrid grid (Figure 45). Following information has been taken from
reference (38).
A structured grid is composed of elements which are orthogonal in i, j space (2D) or i, j, k space (3D). It
has many advantages as equations are easily discretized. It gives also a faster convergence with fewer
iterations, a better accuracy and a higher resolution than for unstructured grids but it is difficult to apply
this type of grid to complex geometries. This type of grid usually uses quadrilateral (2D) and hexahedra
(3D).
Figure 43: Structured grid around an airfoil
Unstructured grid is composed of cells that are arranged in an arbitrary fashion. Basically, there is no
regularity to the mesh. The main advantages of this type of mesh are the fast generation of meshes for
complex geometry and its capacity to concentrate easily the meshing where needed in the geometry.
This type of grid usually uses triangles (2D) and tetrahedra (3D).
Figure 44: Unstructured grid around an airfoil

-79-
An hybrid grid is a combination of structured and unstructured grids. Parts of the geometry that are complex
will be meshed with unstructured grids and regular geometry parts are meshed with structured grids. In 2D,
hybrid mesh is composed of both triangles and quadrilateral. In 3D, hybrid mesh is made of tetrahedral and
hexahedra.
Figure 45: Hybrid grid for a rotor/stator geometry
In this project due to the simplicity of the geometry, a structured grid will be used to mesh the air duct.
8.1.1.3 Mesh quality
Mesh quality has an important role in the accuracy of the simulation. It can be assessed by the study of three
different mesh features: Skewness, Smoothness and Aspect Ratio. A poor grid quality will lead to a slow
convergence and inaccurate solutions. This part has been written thanks to ANSYS Fluent User’s Guide
(39).
- Skewness:
Value of skewness 0 – 0.25 0.25 – 0.50 0.50 – 0.80 0.80 – 0.95 0.95 – 0.99 0.99 – 1.00
Cell quality Excellent Good Acceptable Poor Sliver Degenerate
Table 41: Cell quality depending on the value of skewness
In order to obtain good results, skewness needs to be minimized (see Table 41) and its value should not
exceed;
- 0.85 for Hex and quad cells
- 0.85 for triangular cells
- 0.9 for tetrahedral cells
Skewness can be calculated by two methods, one is based on equilateral volume and applies only to triangles
and tetrahedral. The other one is based on the deviation from a normalized equilateral angle and it applies
to all the shape of cells.
o Equilateral volume skewness:
𝑆𝑘𝑒𝑤𝑛𝑒𝑠𝑠 = 𝑂𝑝𝑡𝑖𝑚𝑎𝑙 𝑐𝑒𝑙𝑙 𝑠𝑖𝑧𝑒 − 𝑐𝑒𝑙𝑙 𝑠𝑖𝑧𝑒
𝑂𝑝𝑡𝑖𝑚𝑎𝑙 𝑐𝑒𝑙𝑙 𝑠𝑖𝑧𝑒 [41]
o Skewness based on the deviation from normalized equilateral angle:

-80-
𝑆𝑘𝑒𝑤𝑛𝑒𝑠𝑠 = max [𝜃𝑚𝑎𝑥 − 𝜃𝑒
180 − 𝜃𝑒 ;
𝜃𝑒 − 𝜃𝑚𝑖𝑛
𝜃𝑒 ]
With:
𝜃𝑚𝑎𝑥 = largest angle in face or cell
𝜃𝑚𝑖𝑛= smallest angle in face or cell
𝜃𝑒= angle for equilateral face or cell, (60° for triangle and 90° for square)
Aspect ratio:
Aspect ratio represents the ratio between the longest edge and the shortest edge of a cell. The best achievable
value is equal to 1 for an equilateral triangle or a square.
Smoothness:
The change in the size of cells in a grid must be as smooth as possible. It means that the size of neighbor
cells should not vary more than 20%.
Figure 46: Size change between two adjacent cells (<20%)
8.2 Turbulence modeling
In order to get the most relevant results, the right fluid model needs to be set in the CFD software. Indeed
a bad choice can lead to inaccurate results. In this part a short introduction to the most common turbulence
models will be made.
Turbulences are really challenging as they are defined by an unsteady, aperiodic and chaotic motion. It is
the opposite of a laminar flow in which the velocity, the pressure and other flow properties remain constant
at each point. For turbulent flows talking about steady state makes no sense as the observation of such a
flow at a small scale clearly shows a random motion of the fluid particles (creation of eddies and vortices)
(39).
A number, the Reynolds number (Re) has been set. It is a dimensionless number which represents the ratio
of the inertial forces to viscous forces. Laminar flow occurs for low Reynolds number (fluid with low speed
or with high viscosity) and turbulent flow occurs at high Reynolds number. The transition between turbulent
and laminar flow for a flow in a pipe can be set to 2000 < 𝑅𝑒 < 4000. For Reynolds number below 2000
the flow is laminar, for Re bigger than 4000 the flow can be considered as fully turbulent. In the interval
[2000 ; 4000] both laminar flow and turbulent flow can be found.
Three general methods can be used for turbulent flows: Direct Numerical Simulation (DNS), Reynolds
Averaged Navier Stokes (RANS) and Large Eddy Simulation (LES) (38). Direct Numerical Simuation
(DNS) and Large Eddy Simulation (LES) are mostly used in research for specific problems due to their high
accuracy but they are quite time consuming and computationally expensive. The Reynolds Averages Navier
Stokes (RANS) model gives reliable and fast results. It is a good compromise that’s why it is mostly used
in industry.
In order to be useful a turbulence model needs to fulfill the following requirements, it must be reliable,
simple, economical to run and have a wide range of applicability (39). Thus the simulation realized in this
report has been carried out using the RANS model.

-81-
8.2.1 RANS –based turbulence model
RANS turbulence can be classified in terms of number of transport equation solved simultaneously in
addition to the RANS equation:
Zero equation or algebraic model (Cebeci-Smith, Baldwin Lomax, Johnson King …)
One equation models (Spalart-Allmaras, Baldwin-Barth …)
Two equation models (k-ε, k-ω…)
Zero equation models are often considered too simple to be applied to actual physic problem or general
situation. It is being ignored in CFD software nowadays. One equation models are weak to analyze and
calculate complex internal flows with strong curvature. Then, these RANS – based turbulence models won’t
be used in this work.
Two equation models such as k-epsilon model and k-omega model are the most common models used in
industry to solve the majority of engineering problems. It solves two additional transport equations in
addition to the RANS equation. Most of the time, it solves the turbulent kinetic energy equation “k”. The
second equation that is solved depends on the type of model that is used. For k-epsilon model the turbulent
dissipation rate “ε” is added. For k-omega model the turbulent dissipation rate equation is replaced by the
specific dissipation “ω” (38) (39).
8.2.1.1 k – ε model
K-epsilon model is a really interesting model as it is relatively easy to implement and provides accurate
results for many flows. However its performance is limited for highly curved streamlines, swirling and
rotating flows. Some variations of the k-epsilon model exist and give improved predictions for some flows.
For instance the Renormalization Group Method k-ε or Realizable k-ε improve the standard k-ε model
performances for more complex flow, high streamline curvature flow, wall heat, mass transfer and swirling
flow. This model works only for fully turbulent flow and it will tend to create some turbulence when there
is none. It will increase the heat transfer between the air within the air duct and the outside.
8.2.1.2 k – ω model
K-omega model is similar to k-epsilon model however it solves for the specific dissipation and not the
turbulent dissipation. The k-omega model can be very useful in cases where k-epsilon model fails and can’t
be used as for instance for internal flows, flows with strong curvatures. However calculations take longer
and convergence is a bit more laborious than for k-epsilon model.
8.3 Methodology adopted
In order to assess the relevance of taking into account the impact of heat gains to the supply distribution
duct due to the temperature difference between the room and air inside the duct as presented in §5.3.1, it
was necessary to carry out a simulation on ANSYS Fluent.
Step 1: Geometry generation
In order to assess the impact of heat gains on air in the ducts, the longest and biggest air duct has been
created in design modeler. Indeed in the longest air duct air will have more time to exchange heat with air
outside the duct. In the biggest air duct, external surface is more important which favors heat transfer. A
representation of the geometry is shown on Figure 47. The air duct is composed of one inlet and six outlets
(represented on Figure 48) supplying different rooms with conditioned air.

-82-
Figure 47: Geometry of the longest air duct in HY building (Design Modeler)
The first outlet encountered in the direction of the flow is supplying air to a first set of rooms and the last
five are providing air to the main hall where water is demineralized. Air temperature within the duct and
walls’ temperature needs to be measured for the following reasons:
If the temperature of the walls is inferior to the dew point temperature of humid air of air at 40°C
and 32% relative humidity, then it will be necessary to insulate the air duct to prevent water from
condensing and dripping in the rooms.
Average air temperature in the duct just before it is supplied to the main hall (after outlet 1) needs
to be measured in order to know if additional margins on the supply temperature need to be taken
into account.
Hall
123456
Figure 48: Schematic representation of HY building’s ground floor
Step 2: Mesh generation
For simple geometry, hexahedral cells are preferred as it has fewer errors. Considering the geometry
generated, hexahedral meshing looks like the best option since the geometry is quite simple. A representation
of the hexahedral meshing can be found in Figure 49. However, results will be compared with a meshing
made of tetrahedral cells in order to check the relevance of the simulation (see Figure 50).
Direction of the flow

-83-
Figure 49: Hexahedral meshing of the air duct
Figure 50: Tetrahedral meshing of the air duct
With ANSYS academic version, the number of cells is limited. The size of the cells has then been limited by the software capacity. Size has been chosen so that number of cells used to mesh the geometry is as close as possible to the maximum numbers of cells authorized by the software. In this way, the maximum possible precision will be obtained.
Step 3: Setup (Boundary conditions, turbulence modeling …)
First step is the calculation of the Reynolds Number within the air duct. For flows in pipes or ducts,
Reynolds number can be calculated thanks to the following formula:
𝑅𝑒 =𝑄. 𝐷𝐻
𝜈. 𝐴 [42]
With:
𝑄 = volumetric flow rate (m3/s)
𝐷𝐻 = hydraulic diameter (m)
𝜈 = kinematic viscosity of air (m²/s)
A = duct’s cross sectional area
For shapes such as rectangle or square ducts, the hydraulic diameter is then defined by:

-84-
𝐷𝐻 =4𝐴
𝑃 [43]
P is the wetted perimeter. That means the perimeter of all channel walls in contact with the flow. In this
case it means the total perimeter of the duct.
For this simulation, 𝑅𝑒 = 4,1. 105 > 4000. Then the airflow is turbulent. Moreover, Mach number M<0,3
as a consequence air can be assimilated to an incompressible fluid.
For turbulent flows two main models can be used, k-ε model and k-ω model. Calculations will be realized
with k-omega model that performs better for wall bounded flow with curvatures. However it will be
compared to realizable k-epsilon model which is an improvement of standard k-epsilon model
Second step is the boundary conditions implementation. Inlet has been chosen as a mass flow inlet, outlets
have been set as pressure outlets with a target mass flow. The air duct is placed in an atmosphere at 40°C
and 32% humidity that is identical to actual temperature in the building.
Step 4: Calculation and Visualization of the results
Screenshots that will be presented in the report displays temperature variation of two different cross sections
of the air duct which are shown on Figure 51 below.
Figure 51: Air duct planes (Plane n°1: green and Plane n°2: red)
Results obtained with both meshing are almost the same at +/- 0.1°C. On Figure 52 and Figure 53 are
represented the results obtained after 500 iterations for k-omega model and k-epsilon realizable model. The
air duct is not insulated and made of 2mm thick steel. On these screenshots it is obvious that temperature
varies between the edge and the center of the ducts. Close to the wall temperature is at its maximum and in
the middle temperature is at its lowest. Such a temperature difference can be explained by the fact that
airflow within an air duct has a velocity close to zero near the walls. Velocity keeps increasing by getting
closer to the center of the duct. This difference of velocity leads to a heterogeneous temperature distribution
as shown in Figure 52 and Figure 53.
Direction of the flow

-85-
Figure 52: Temperature in plane n°1 (k-omega model)
Figure 53: Temperature in plane n°1 (k-epsilon realizable model)
Another temperature gradient appears while moving along the air duct. The further from the inlet it is, the
bigger the average temperature of a cross section is. It can be explained by the fact that air within the duct
has more time to exchange heat with the room. Energy = Power x Time, consequently more energy is
exchanged when the distance travelled by air increases resulting in a bigger average temperature within the
air duct. This temperature gradient appears clearly in Figure 54.

-86-
Figure 54: Temperature in plane n°2
For both models, results are really close which gives robustness to the modeling. Average temperature in
plane n°1 has been calculated thanks to the function calculator in ANSYS Fluent. For k-epsilon model,
average temperature is equal to 16.50°C. For k-omega model, average temperature in plane n°1 is 16.55°C.
In ventilation calculations realized, supplied air temperature is supposed to be equal to 15°C so the target
temperature is exceeded by 1.5°C.
Figure 55: Walls temperature of the air duct
Minimum wall temperature (displayed in Figure 55) has been calculated thanks to the function calculator tool
in ANSYS Fluent. It stipulates that it is equal to 18.7°C. Consequently condensation might occur at some
Direction of the flow

-87-
spots along the air duct considering that 18.7°C is inferior to the dew point temperature of air at 40°C and
32% relative humidity equal to 20.20°C.
In order to avoid condensation and decrease the temperature of air in plane n°1, two solutions are possible:
The first one consists in decreasing the temperature of air at the inlet so that it reaches 15°C before
entering in the hall but it would lead in an energy consumption rise and wouldn’t solve the problem
of condensation as minimum wall temperature would remain below 22.20°C.
The second solution consists in insulating the air duct so that its thermal resistance increases and it
gets harder to exchange heat with the room. Consequently temperature increase problem and
condensation problem would be solved.
In Figure 56 are presented the results for an air duct insulated with 4cm of glass wool covered with a thin
aluminum layer. Thermal conductivity of such a material is equal to 0.04 W/(m.K).
Figure 56: Temperature in plane n°1 for insulated walls
One can easily notice that temperature is more homogeneous, there are fewer differences between inner
wall temperature and air temperature within the duct. Function calculator tool in ANSYS Fluent stipulates
that average temperature of air in plane n°1 is equal to 15.4°C.
As a consequence, energy can be saved this way as temperature increase is limited, moreover condensation
problems are avoided. However temperature rise from 15°C to 15.4°C cannot be neglected. Thus a margin
equal to 0.4°C will have to be considered in calculations so that air entering the main hall has a temperature
equal to 15°C in order to be consistent with the calculations carried out. Figure 57 shows the results
considering an inlet air temperature equal to 14.6°C.

-88-
Figure 57: Temperature in plane n°1 for an inlet temperature equal to 14.6°C
Average temperature in plane n°1 considering that air is supplied at a temperature of 14.6°C is equal to
14.95°C. This value is really close to 15°C which is the air supply temperature used for the HVAC system
sizing.
Step 5: Discussion
Heat transfers due to temperature difference between air in ducts and rooms cannot be overlooked and
must be considered even in the case where ducts are insulated. After having carried out this thermal study,
two design choices appear. Either a margin needs to be taken into account on the inlet temperature in order
to maintain the air supply temperature at 15°C or the inlet temperature is maintained at 15°C and air supply
temperature needs to be changed. In the calculations presented in the following paragraph, the system has
been sized for a supply temperature equal to 15°C and considering a margin equal to 0.4°C on the inlet
temperature (14.6°C).

-89-
9 Results
In this part are presented the results about ventilation system and smoke control sizing.
9.1 HVAC system sizing
9.1.1 Internal Heat Gains
Table 42 summarizes internal heat gains considered for each rooms. In order to calculate the power from
lighting assumptions from §5.2.1.4 have been considered. For internal gains from process equipment, data
from constructors have been gathered and used. The column level corresponds to the floor level of the
different rooms compared to ground floor which is at level 0.00m.
Level (m) Room Lighting (W) Internal gains process (W) Total internal gains (W)
-6.80 Chemical room 1 900 0 900
-6.80 Chemical room 2 92 0 92.4
-6.80 Chemical room 3 304 0 304
-6.80 Lobby 1 80 0 80
-6.80 Stairs 1 370 0 370
-6.80 Degasser room 420 950 1370
-6.80 Lobby 2 130 0 130
-6.80 Firefighting valve room 180 0 180
-6.80 Main hall 4500 14600 19100
-6.80 Stairs 2 144 0 144
0.00 Lobby 3 100 0 100
0.00 Electrical room 970 18080 19050
0.00 Lobby 4 120 0 120
0.00 WC 80 0 80
0.00 Cleaning room 30 0 30
0.00 Stairs 3 800 0 800
0.00 Main hall 4200 62000 66200
0.00 HVAC room 610 3240 3850
4.60 Control room 500 5000 5500
4.60 Laboratory 300 1000 1300
4.60 Corridor 200 0 200
4.60 WC 120 0 120
4.60 Cleaning room 60 0 60
4.60 Lobby 5 70 0 68
8.00 Lobby 6 70 0 70
Table 42: Internal heat gains in HY building
For winter conditions, no internal heat gains are considered except the ones provided by local heating
equipment as the worst case scenario with all equipments shut down is considered.
Latent heat gains are neglected as only two people will be permanently present in the building. Moreover
building is pressurized and basement’s walls are made of concrete resulting in negligible infiltrations. The
process of demineralization is completely closed thus there is no water emission by the process.

-90-
9.1.2 Blowing conditions justifications
Summer:
The supply temperature must be as small as possible. Indeed by maximizing the temperature difference
between supplied air and the maximum admissible temperature, airflows will be smaller. The smaller the
airflows, the smaller the air ducts, the AHU and fan energy consumptions are. But it cannot be too low for
comfort and thermodynamic reasons (relative humidity of supplied air, φ cannot be lower than 90%).
15°C is the best compromise as φ=82% and ΔT=26°C -15°C=11°C where 26°C is the maximum admissible
temperatures for rooms with workers inside. It satisfies the condition from §5.6.1.
Winter:
The limiting parameter in winter is the temperature of the hall. Indeed, the hall doesn’t need that much
heating due to its good insulation. If the blowing temperature is too high, then the heating coil will be
oversized and energy will be wasted.
Blowing temperature Hall temperature (without control) Hall temperature (with control)
25°C 13,7°C 11,7°C
15°C 8,2°C 5,9°C Table 43: Temperature in the hall depending on supply air temperature
For winter conditions, blowing temperature will be chosen equal to 15°C to limit the energy loss in the
heating coil for heating the hall. It cannot be lower than 15°C as otherwise it would be uncomfortable for
workers.
9.1.3 Heat gains on supply air
By the fan:
Heat gains on supply air by the fan can be calculated according to the methodology presented in §5.3.2
Q=6,125 m3/s
Estimated Δp = 500 Pa
It is a centrifugal fan and ηF=0,8
Fan absorbed power = (6,125 x 500)/0,8 = 3828 W
Heat gain from the fan and motor = 3828/0,90 = 4253 W (with ηM=0,9)
Taking the specific heat capacity for air as 1.02 kJ/kgK and air density as 1,2kg/m3, then:
Δ T= 4,253/(1.02 x 1.2 x 6.125) = 0,56°C
By air in the rooms:
From §8.38.3, considering an insulated air duct, heat gains rise air temperature from 15°C to 15,4°C in
average. If inlet temperature is reduced down to 14.6°C average temperature in plane n°1 before entering
the main hall is equal to 15°C. As a consequence an additional margin of 0.4°C needs to be considered on
air temperature supplied by the Air Handling Unit.
Conclusion:
Total temperature rise of air in air ducts is assumed to be equal to 1°C. As a consequence, in order to provide
air at 15°C, air must exit the cooling coil at a temperature of 14°C.

-91-
9.1.4 Final sizing
One standalone Air Handling Unit (AHU) of 22050m3/h will be implemented in the HVAC room of HY
building. It will be designed to supply air at 15°C for extreme summer conditions (40°C) and 15°C during
extreme winter conditions (-15°C).
A minimum supply of air is necessary for the removal of odors, carbon dioxide and any other contaminants
produced by human occupation.
The maximum volumetric flow for AHUs has been determined for the summer case. In some cases, heating
and cooling power supplied by the AHU is not enough to maintain the different rooms at the requested
temperature. Therefore additional cooling and heating have to be provided locally.
In order to optimize the ventilation system and save energy during plant operation, the maximum flow that
needs to be supplied by the AHU has to be minimized. To do so, the building has been divided in two
distinct parts as explained in §7.2.1.2. The first one is composed of all the rooms located underground. The
underground part will be supplied with air coming directly from the outside thanks to fans. Indeed due to
the temperature of the ground and deep ground this part doesn’t need cooling in summer. For winter
conditions, additional heating has been added mainly in the hall in order to maintain the required
temperatures.
The AHU will recycle air from the inside (except from the toilets and the laboratory) in winter in order to
save some energy. However for summer conditions it is not worth it to do so because recycled air from the
building is hotter than outside air (especially due to the fact that transformers release a large amount of
heat).
Results are presented in Table 1Table 44 below.
Level Room Airflow
(m3/h)
Heating
(W)
Cooling
(W)
-6.80 Chemical room 1 2970 0 0
-6.80 Chemical room 2 30 0 0
-6.80 Chemical room 3 1002 0 0
-6.80 Lobby 1 13.2 500 0
-6.80 Stairs 1 98 1000 0
-6.80 Degasser room 139 0 0
-6.80 Lobby 2 21.5 0 0
-6.80 Firefighting valve room 29.7 0 0
-6.80 Main hall 3546 60000 0
-6.80 Stairs 2 71 1000
0.00 Lobby 3 42 1000
0.00 Electrical room 2693 0 -17000
0.00 Lobby 4 31 0 0
0.00 WC 271 1500 0
0.00 Cleaning room 191 1500 0
0.00 Stairs 3 563 5000 0
0.00 Main hall 13015 0 0
0.00 HVAC room 4311 25000 0
4.60 Control room 190.8 6000* -9800*
4.60 Laboratory 228.9 4000* -4200*
4.60 Corridor 38 0 0
4.60 WC 237 2000 0

-92-
Level Room Airflow
(m3/h)
Heating
(W)
Cooling
(W)
4.60 Cleaning room 235.7 2000 0
4.60 Lobby 5 13 0 0
8.00 Lobby 6 29.8 500 0
TOTAL 22050 111500 -31000
Table 44: AHU flow rates, heating and cooling needed to be implemented in the different rooms of HY building
Rows colored in red correspond to rooms supplied with air coming from the AHU. The airflow that needs
to be provided by the AHU is equal to 22050m3/h for blowing temperatures equal to 15°C both for summer
and winter.
(*) This symbol represents reversible heat pumps (providing both cooling and heating)
9.1.4.1 Cooling coil sizing
The water chiller used has a water inlet temperature of 5°C and an outlet temperature equals to 10°C.
Average surface temperature can be estimated as:
𝑇𝑐𝑜𝑜𝑙𝑖𝑛𝑔 𝑐𝑜𝑖𝑙 =𝑇𝑤𝑎𝑡𝑒𝑟_𝑜𝑢𝑡 + 𝑘. 𝑇𝑤𝑎𝑡𝑒𝑟_𝑖𝑛
1 + 𝑘
With:
𝑇𝑤𝑎𝑡𝑒𝑟_𝑜𝑢𝑡 = Water out of the heat exchanger
𝑇𝑤𝑎𝑡𝑒𝑟_𝑖𝑛 = Water entering the cooling coil
𝑘 = Coefficient depending on the cooling coil often estimated equal to 1 when no information is available
about the coil.
If k=1, 𝑇𝑐𝑜𝑜𝑙𝑖𝑛𝑔 𝑐𝑜𝑖𝑙 is equal to the arithmetic mean of the inlet and outlet water temperature
Then, 𝑇𝑐𝑜𝑜𝑙𝑖𝑛𝑔 𝑐𝑜𝑖𝑙 = 7,5 °𝐶
The AHU supplies 22050m3/h and needs to cool down outside air having a density of 1.2 kg/m3 from 40°C
to 14°C. By using the psychometric chart shown in Figure 58:
Pcooling = 330kW
𝐵𝐹 =35,6 − 23,8
80,8 − 23,8= 20,7%
ξ = 1 – BF = 79,3%
According to §4.5.5.3 average value for the bypass factor is about 20% which is really close to the value
obtained.

-93-
h = 80,8
h = 23,8
h = 35,6
Figure 58: Cooling process of humid air for an external temperature of 40°C
9.1.4.2 Heating coil sizing
The AHU supplies 13069m3/h and needs to heat up a mix of outside air and reused air from -7°C to 15°C.
By using the formula from §4.5.4.2 and by considering that air density is constant and equal to 1.2kg/m3:
Pheating = 98kW
9.1.4.3 Humidifier sizing
According to §4.2.2.5 relative humidity has to be maintained between 30% and 60% in the rooms where
people are working. Temperature must be maintained between 18°C and 26°C. The average value φ=45%
will be considered for the relative humidity. Humidifiers will be directly integrated into air conditioning units
able to provide heating, cooling and humidifying.
o Summer case:
Relative humidity is not controlled in summer as outside air has a high humidity rate. The space line
represented on Figure 59 has the following characteristics according to §5.5.4. The temperature to be
maintained is supposed to be as close as possible to 26°C when outside temperature is 40°C.
𝛾 =𝑃𝑡𝑜𝑡𝑎𝑙
𝑀=
ℎ2 − ℎ1
𝑥2 − 𝑥1=
∆ℎ
∆𝑥
𝑃𝑡𝑜𝑡𝑎𝑙 = 𝑃𝑖𝑛𝑡𝑒𝑟𝑛𝑎𝑙𝑔𝑎𝑖𝑛𝑠 − 𝑃𝑎𝑑𝑑𝑖𝑡𝑖𝑜𝑛𝑎𝑙 𝑐𝑜𝑜𝑙𝑖𝑛𝑔= 450 W
∆𝑥 = 100 gwater/h
𝛾 =450
0.1. 3600 = 16 200
𝑘𝐽
𝑘𝑔𝑤𝑎𝑡𝑒𝑟
Let’s check if the humidity got for 26°C is within the range 30-60%.

-94-
It means that for ∆ℎ = 40 𝑘𝐽/𝑘𝑔𝑤𝑎𝑡𝑒𝑟 then ∆𝑥 = 2,47 . 10−3𝑘𝑔𝑒𝑎𝑢/𝑘𝑔𝑔𝑎𝑠
Φ=40%
26°C
ΔH=40 kJ/kg
ΔX=0.00247
Figure 59: Psychrometric chart representing evolution of air for rooms housing workers in summer
Relative humidity within the rooms is about 40% which is consistent with UK regulation.
o Winter case:
In winter, air is really dry. Additional humidifiers need to be added in rooms where workers spend most
their time according to (12). In order to stay in the most restrictive scenario, no water emission from workers
is considered in winter. Then ∆𝑥 = 0 and the space line is horizontal according to §5.5.4. (see Figure 60)

-95-
22
h = 34
h = 17,5
0,001
0,0075
Fresh air Extracted airAir mixed Supply air
Figure 60: Psychrometric chart representing air humidification in winter for rooms housing employees in winter (-15°C)
Room Volume (m3) Airflow (m3/h) Relative
humidity Control room 170 190.8 30% - 60%
Laboratory 102 228.9 30% - 60%
From §4.5.6.2 and considering that air density is equal to 1,2 kg/m3:
𝑃ℎ𝑢𝑚𝑖𝑑𝑖𝑓𝑖𝑒𝑟 = 𝑚.̇ 𝛥ℎ =191 + 229
3600. 1,2. (34 − 17,5) = 2,5 𝑘𝑊
9.2 Over-pressurization of the hall
In order to avoid outside air infiltration, an over-pressurization of the hall equal to 4Pa will be maintained.
Only the hall will be considered as it is the only part of the building made of cladding instead of heavy
concrete (supposed air tight). Moreover, it has two big access doors (4,5m x 6m) that could be responsible
for air infiltration from outside. In order to simplify the calculations, only leakages under the doors will be
considered. The summer case will be considered for this calculation as it is the more restrictive. The
extracted airflow will be decreased in order to create an over-pressurization:
Calculation of airflow variation is given by formula from §4.6.1.2:
∆𝑉
𝑉=
∆𝑝. 𝑉𝑜. (𝑇0 + 𝜃)
𝑅. 𝑇𝑜²=
∆𝑞
𝑞

-96-
Here:
∆𝑝 = 4Pa
𝑉𝑜 = 22.41 l/mol
𝑇0=273.15 K
𝜃 = 40°C (Worst case scenario in the calculation)
R=8.31 SI
∆𝑞
𝑞= 4,5% => ∆𝑞 = 0,045 . 𝑞 = 0,045. 13015 = 585
𝑚3
ℎ
Calculation of leakages through doors is given by formula in §4.6.1.3:
𝑞𝑣𝑖𝑛𝑓 = 0.62 . 𝑆 . ( 2
𝜌)0.5. ∆𝑝0.5 ≈ 0.83 . 𝑆. ∆𝑝0.5
Here:
Number of doors = 2
Door size = 4,5m x 6m
Gap = 4mm
∆𝑝 = 4Pa
𝑞𝑣𝑖𝑛𝑓 = 0,83 . (4 . 10−3). 4,5 . 40,5 = 0,030𝑚3
𝑠= 108
𝑚3
ℎ
Conclusion:
∆𝑞𝑡𝑜𝑡𝑎𝑙 = 108 + 585 = 693𝑚3
ℎ
Extracted airflow needs to be decreased by 534 m3/h so qextracted = 12357 m3/h
9.3 Smoke Control System Sizing
In Table 45 is the list of doors within the building:
Level Room Room nearby Size (m²) Type Orientation
-6.80 Lobby 1 Hall 2.2 Single leaf Into pressure
-6.80 Stairs 1 Lobby 1 2.2 Single leaf /
-6.80 Lobby 2 Basement 2.2 Single leaf Into pressure
-6.80 Stairs 2 Lobby 2 2.2 Single leaf /
-6.80 Lobby 2 Degasser room 2.2 Single leaf Into pressure
-6.80 Lobby 2 Firefighting valve 2.2 Single leaf Into pressure
0.00 Stairs 1 Lobby 3 2.2 Single leaf /
0.00 Lobby 3 Outside 2.2 Single leaf Outward
0.00 Lobby 3 Hall 2.2 Single leaf Into pressure
0.00 Stairs 2 Lobby 4 2.2 Single leaf /
0.00 Lobby 4 Outside 2.2 Single leaf Outward
0.00 Lobby 4 Hall 2.2 Single leaf Into pressure
0.00 Lobby 4 Stairs 3 2.2 Single leaf /
4.60 Stairs 3 Lobby 5 2.2 Single leaf /
4.60 Lobby 5 Corridor 2.2 Single leaf Into pressure
8.00 Stairs 3 Lobby 6 2.2 Single leaf /
8.00 Lobby 6 HVAC room 2.2 Single leaf Into pressure
Table 45: List of fire doors in HY building

-97-
From §4.3.1.3, margins to be considered are in consistency with (40):
o For airflow through a closed door : +50%
o For airflow through an open door : +15%
Airflow required for maintaining an air speed of 0.75m/s through an open door with a surface area
equivalent to 2.2m² is equal to:
o Q = (2.2 x 0.75)*1.15 = 1.90 m3/s (for both stairs with margin)
Airflow required for maintaining a pressure difference through closed doors is equal to:
o Q = (0.06 + 0.12 + 0.06)*1.5 = 0.3 m3/s (for stairs 1)
o Q = (0.06 x 6 + 0.12)*1.5 = 0.72m3/s (for stairs 2+3)
For both stairs the required airflow to have 0.75m/s is much higher than the one necessary to get the
pressure differential of 50Pa. As a consequence fans will be sized with an airflow equal to 1.90m3/s

-98-
10 Discussion and Conclusion
The main purpose of this work is the sizing of a robust and efficient ventilation system for a nuclear
related building for HPC project. Literature about HVAC on nuclear building is really simplistic and needs
to be adapt for non-safety classified buildings such as the demineralization station. The main question that
needs to be answered is how to maintain the ambient conditions within a given range of temperature and
relative humidity while assuring the minimum ACH requirements. In order to do so several ventilation
systems have been studied going from natural ventilation systems to double flow ventilation systems. The
most efficient system is halfway between a single flow and a double flow ventilation system. Indeed
investment costs and operating costs are much smaller than for a double flow ventilation system and much
more robust than natural or single flow systems. Before this work, the system was supposed to be a 100%
double flow ventilation system but thanks to the studies carried out in this paper, previous thoughts have
been abandoned for a more energy efficient and cheaper system. Smoke control system has been size
according to regulations taken from CIBSE Guide E (19) and no infringements to these rules is allowed as
it is a matter of safety for employees. Usually, nuclear buildings are deprived of ventilation control system
as robustness is preferred over energy efficiency. However for a non-safety classified building which is
halfway between an industrial and a nuclear building, it makes sense to consider a simple ventilation control
in order to save energy and decrease operating costs. It is something new that hasn’t already been done on
this kind of buildings but the results presented in this thesis show that it is something doable that could be
interesting to consider.
However there are some limitations. Indeed, the model that has been built in this thesis work only for
a given set of input data, if the nuclear safety commission change these data then the calculations will have
to be redone. But the work carried out still provides a good basis for EDF as ideas and some parts of this
design can be used on similar buildings for other projects around the world.
HVAC system is a primordial system for nuclear associated buildings as it insures the quality of a
process. The work presented in this thesis describes the first step of the HVAC system development which
is the system sizing. It has impacts on civil works and installation since shaft needs to be allocated for air
ducts and room needs to be saved for bulky equipment such as extraction fans, water chillers and Air
Handling Unit. Ventilation affects also electrical engineering as power consumption of HVAC equipment
is important and cannot be overlooked. HVAC system sizing is then an important step since it impacts
many downstream activities.
The first part of the design is to set input data for the design such as external temperature, relative
humidity, wind speed and solar radiation in order to carry out thermal calculations. Internal admissible range
of temperatures, relative humidity and minimum ACH in each room also need to be defined. Calculated
heat transfers from previous data will be added to internal heat gains from equipment, lighting and
employees in order to assess the required power (either positive or negative) to maintain the different rooms
at the requested temperature previously stated.
A ventilation system is expensive especially in the nuclear field as some equipment need to be safety
classified. As a consequence, by reducing the number of HVAC equipment investment costs will decrease.
Moreover electricity is produced 24/24h for about 60 years consequently by optimizing the ventilation
system energy and money can be saved. It represents a benefit for the company since which earns more
money and for the environment as energy is saved.
Robustness of the system is one of the complicated parts as additional margins needs to be considered
in order to ensure the reliability of the system. Indeed, if margins are taken too small, it will result in a risk
of failure of HVAC system. If margins are taken too big, it will lead to an over-sizing of the ventilation
system. However it is always preferable to have a system that is over-sized rather than under-sized.

-99-
References
1. Company, EDF. [Online] https://www.edf.fr/.
2. Company, EDF; Au cœur de l'énergie nucléaire. 2015.
3. Hinckley point C, securing the UK's energy future. [Online] EDF energy UK, 2015.
https://www.edfenergy.com/energy/nuclear-new-build-projects/hinkley-point-c.
4. Institute, Nuclear Energy. [Online] http://www.nei.org/.
5. lenergeek. [Online] 2015.
http://lenergeek.com/wp-content/uploads/2012/08/circuits_eau_reacteur_nucl%C3%A9aire.png.
6. Company, EDF. L'utilisation de l'eau dans les centrales nucléaires. 2013.
7. DeSilva, Frank. Water treatment guide. [Online] 2000.
http://www.watertreatmentguide.com/activated_carbon_filtration.htm.
8. Maurel, Alain. Osmose inverse et ultrafiltration, Technologie et applications. s.l. : Techniques de
l'ingénieur.
9. Lenntech. Reverse osmosis. [Online] http://www.lenntech.com/library/reverse-osmosis/whatisro.htm.
10. Distilled,deionized and demineralized water. [Online]
http://www.lenntech.com/applications/process/demineralised/deionised-demineralised-water.htm.
11. La ventilation hygiénique. Energie plus, Efficacité énergétique des bâtiments tertiaires. [Online] 2015.
http://www.energieplus-lesite.be/.
12. UK Workplace (Health, Safety and Welfare) Regulations.
13. UK Control of Substances Hazardous to Health Regulations.
14. UK Control of Noise at Work Regulations.
15. UK Environmental Noise Regulations.
16. CIBSE Guide B; Heating, Ventilating and Air Conditioning.
17. ASHRAE Handbook. 2013.
18. Standards, BSI British. BS9999, Code of practice for fire safety in the design, management and use of
buildings. 2008.
19. CIBSE Guide E, Fire Safety Engineering.
20. BS EN 12101-6; Smoke and heat control systems. 2005.
21. EDF. GFPA, Global FIre Preliminary Assessment for HY building.
22. Tim Dwyer. CIBSE Journal. [Online] http://www.cibsejournal.com/cpd/modules/2009-08/.
23. Duminil, Maxime. Air Humide. Techniques de l'ingénieur. 1986.
24. H.Havtun, P. Bohdanowicz, J.Claesson, E.Granryd and G.Vicatos. Sustainable Energy Utilisation,
Chapter 6 "Psychrometrics".
25. Bensafi, Ahmed. Air humide - Traitement et conditionnement de l’air. Techniques de l'ingénieur. 2007.
26. EN13779 Ventilation for non-residential buildings - Performance requirements for ventilation and
room-conditioning.
27. ECUK121009, "Minute of meeting – HVAC input data & hypothesis".

-100-
28. ECEF040074 B, “Engineering rules ENG 2.83 (MD2) : Ventilation System functional
requirements,preliminary sizing & material selection”.
29. CIBSE Guide A; Environmental Design.
30. RT2000; Thermal regulation.
31. AFNOR. Thermal performance of buildings, Heat transfer via the ground. 2008.
32. Le Recknagel; Manuel pratique du génie climatique – 2ème édition – PYC Edition.
33. Porcher, G. Bases du calcul des installations de climatisation – 4ème édition.
34. EDF. Design tolerances allowance strategy for HVAC systems design.
35. UK building regulation.
36. Weather statisitics for Bath and North East Somerset. [Online]
http://www.yr.no/place/United_Kingdom/England/Bath_and_North_East_Somerset/statistics.html.
37. R.Fahkrai. Introduction to computational methods in energy technology. s.l. : KTH Royal Institute of
Technology.
38. CFD Online. [Online] http://www.cfd-online.com.
39. ANSYS Fluent 12.0 User's Guide. 2009.
40. BSEN12101-6:2005, “Smoke and heat control system – Part 6: Specification for pressure differential
systems – Kits.".
Related Documents


