Design and implementation of a harmony-search-based variable-strength t-way testing strategy with constraints support Abdul Rahman A. Alsewari, Kamal Z. Zamli ⇑ School of Electrical and Electronics Engineering, Universiti Sains Malaysia, Malaysia article info Article history: Received 5 August 2011 Received in revised form 1 December 2011 Accepted 9 January 2012 Available online 25 January 2012 Keywords: Variable-strength t-way testing Combinatorial testing Harmony search algorithm abstract Context: Although useful, AI-based variable strength t-way strategies are lacking in terms of the support for high interaction strength. Additionally, most AI-based strategies generally do not address the support for constraints. Addressing the aforementioned issues, this paper elaborates the design, implementation, and evaluation of a novel variable-strength-based on harmony search algorithm, called Harmony Search Strategy (HSS). Objective: The objective of this work is to investigate the adoption of harmony search algorithm for con- structing variable-strength t-way strategy. Method: Implemented in Java, HSS integrates the harmony search algorithm as parts of its search engine. Result: Benchmarking results demonstrate that HSS gives competitive results against most existing AI- based (and pure computational) counterparts. However, unlike other AI-based counterparts, HSS addresses the support for high interaction strength and permits the support for constraints. Conclusion: AI-based t-way strategies tend to outperform the pure computational-based strategies in terms of test size. Ó 2012 Elsevier B.V. All rights reserved. 1. Introduction Software systems are typically composed of many subcompo- nents. Each subcomponent is responsible for providing one or more functionalities to the overall system. Often, having a different implementation for each subcomponent, with each implementa- tion tailored and configured for a specific set of applications or environments, is desirable. In this way, interoperability and porta- bility can potentially be maximized. Because each subcomponent has a family of potentially thou- sands or millions of program configurations and instantiations, quality assurances activities are heavily burdened (i.e., particularly in terms of increasing testing costs and time-to-market pressure) [1–3]. Testing all of the configurations and instantiations is not fea- sible (i.e., due to combinatorial explosion of configurable test data); thus, a sound sampling mechanism for covering test param- eter interaction is also desirable. A recent work on t-way interaction testing has demonstrated that a combinatorial approach based on variable-strength t-way combinations of inputs (i.e., where t denotes the strength of interaction) can be effective. As a result, many new variable- strength t-way strategies have been developed and are now part of the literature. Existing variable-strength t-way strategies adopt many differ- ent approaches, including pure computational-based (e.g. TVG [4,5], Density [6], ParaOrder [6], WHITCH [7], and PICT [8]) and artificial intelligence (AI)-based approaches (e.g. ACS [9,10], SA [6,10,11], VS-PSTG [12]). Although both approaches have merits, the AI-based approach appears to give better prospects as far as optimality (i.e., covering all the interactions with the most minimal combinations) is concerned. For this reason, we have adopted the AI-based approach as the basis of our implementation. Currently, a number of existing strategies adopt the AI-based approach. Although useful, strategies based on SA [11,13] are prone to local minima problem [14,15], which can potentially lead to non-convergence of solution. Strategies based on GA [9,10,16– 20] and ACA [6,9,10,16,20] are known to be computationally expensive due to the frequent needs to interact with environments during computation. Although GA and ACA give optimal results for small set of configurations, the range of interaction strength cov- ered is limited to (i.e., t 6 3) [9]. At a glance, PSTG, a particle swarm optimization (PSO)-based strategy [21–23], usefully addresses the limitations of GA and ACA, specifically in terms of improving the interaction strength support up to t = 6 (i.e., attributed to lesser computational loads). Nonetheless, a counter argument suggests that supporting up to t = 6 may be inadequate for the testing of highly interacting software systems. The need of support for high interaction (i.e., t > 6) can be attrib- uted to the fact that software systems have grown tremendously in terms of size and functionality, resulting in more interactions with 0950-5849/$ - see front matter Ó 2012 Elsevier B.V. All rights reserved. doi:10.1016/j.infsof.2012.01.002 ⇑ Corresponding author. Tel.: +604 5996003. E-mail address: [email protected] (K.Z. Zamli). Information and Software Technology 54 (2012) 553–568 Contents lists available at SciVerse ScienceDirect Information and Software Technology journal homepage: www.elsevier.com/locate/infsof

Welcome message from author
This document is posted to help you gain knowledge. Please leave a comment to let me know what you think about it! Share it to your friends and learn new things together.
Transcript
Information and Software Technology 54 (2012) 553–568
Contents lists available at SciVerse ScienceDirect
Information and Software Technology
journal homepage: www.elsevier .com/locate / infsof
Design and implementation of a harmony-search-based variable-strengtht-way testing strategy with constraints support
Abdul Rahman A. Alsewari, Kamal Z. Zamli ⇑School of Electrical and Electronics Engineering, Universiti Sains Malaysia, Malaysia
a r t i c l e i n f o
Article history:Received 5 August 2011Received in revised form 1 December 2011Accepted 9 January 2012Available online 25 January 2012
Keywords:Variable-strength t-way testingCombinatorial testingHarmony search algorithm
0950-5849/$ - see front matter � 2012 Elsevier B.V. Adoi:10.1016/j.infsof.2012.01.002
⇑ Corresponding author. Tel.: +604 5996003.E-mail address: [email protected] (K.Z. Zamli)
a b s t r a c t
Context: Although useful, AI-based variable strength t-way strategies are lacking in terms of the supportfor high interaction strength. Additionally, most AI-based strategies generally do not address the supportfor constraints. Addressing the aforementioned issues, this paper elaborates the design, implementation,and evaluation of a novel variable-strength-based on harmony search algorithm, called Harmony SearchStrategy (HSS).Objective: The objective of this work is to investigate the adoption of harmony search algorithm for con-structing variable-strength t-way strategy.Method: Implemented in Java, HSS integrates the harmony search algorithm as parts of its search engine.Result: Benchmarking results demonstrate that HSS gives competitive results against most existing AI-based (and pure computational) counterparts. However, unlike other AI-based counterparts, HSSaddresses the support for high interaction strength and permits the support for constraints.Conclusion: AI-based t-way strategies tend to outperform the pure computational-based strategies interms of test size.
� 2012 Elsevier B.V. All rights reserved.
1. Introduction
Software systems are typically composed of many subcompo-nents. Each subcomponent is responsible for providing one or morefunctionalities to the overall system. Often, having a differentimplementation for each subcomponent, with each implementa-tion tailored and configured for a specific set of applications orenvironments, is desirable. In this way, interoperability and porta-bility can potentially be maximized.
Because each subcomponent has a family of potentially thou-sands or millions of program configurations and instantiations,quality assurances activities are heavily burdened (i.e., particularlyin terms of increasing testing costs and time-to-market pressure)[1–3]. Testing all of the configurations and instantiations is not fea-sible (i.e., due to combinatorial explosion of configurable testdata); thus, a sound sampling mechanism for covering test param-eter interaction is also desirable.
A recent work on t-way interaction testing has demonstratedthat a combinatorial approach based on variable-strength t-waycombinations of inputs (i.e., where t denotes the strength ofinteraction) can be effective. As a result, many new variable-strength t-way strategies have been developed and are now partof the literature.
ll rights reserved.
.
Existing variable-strength t-way strategies adopt many differ-ent approaches, including pure computational-based (e.g. TVG[4,5], Density [6], ParaOrder [6], WHITCH [7], and PICT [8]) andartificial intelligence (AI)-based approaches (e.g. ACS [9,10], SA[6,10,11], VS-PSTG [12]). Although both approaches have merits,the AI-based approach appears to give better prospects as far asoptimality (i.e., covering all the interactions with the most minimalcombinations) is concerned. For this reason, we have adopted theAI-based approach as the basis of our implementation.
Currently, a number of existing strategies adopt the AI-basedapproach. Although useful, strategies based on SA [11,13] areprone to local minima problem [14,15], which can potentially leadto non-convergence of solution. Strategies based on GA [9,10,16–20] and ACA [6,9,10,16,20] are known to be computationallyexpensive due to the frequent needs to interact with environmentsduring computation. Although GA and ACA give optimal results forsmall set of configurations, the range of interaction strength cov-ered is limited to (i.e., t 6 3) [9]. At a glance, PSTG, a particle swarmoptimization (PSO)-based strategy [21–23], usefully addresses thelimitations of GA and ACA, specifically in terms of improving theinteraction strength support up to t = 6 (i.e., attributed to lessercomputational loads). Nonetheless, a counter argument suggeststhat supporting up to t = 6 may be inadequate for the testing ofhighly interacting software systems.
The need of support for high interaction (i.e., t > 6) can be attrib-uted to the fact that software systems have grown tremendously interms of size and functionality, resulting in more interactions with
554 A.R.A. Alsewari, K.Z. Zamli / Information and Software Technology 54 (2012) 553–568
one or more subsets of high interaction strengths. There are alwaysopportunities for new intertwined dependencies between the in-volved parameters; this can potentially be problematic and maycause failure [24].
Apart from the lack of support for high interaction strength, mostAI-based strategies (e.g., GA, ACA, SA, and PSTG) generally do not ad-dress the support for constraints. Here, some parameter interac-tions (or combinations) are deemed impossible; hence, they areconsidered as constraints and must not be part of the final suite.
Complementing and addressing the aforementioned limitationsof existing AI-based strategies, the current paper proposes toimplement a new variable-strength t-way test generation strategycalled Harmony Search Strategy (HSS). HSS is the first variable-strength t-way strategy to adopt harmony search (HS) algorithmas its core implementation. Unlike other competing AI-based vari-able-strength t-way strategies, HSS addresses the support for highinteraction strength (i.e., t > 6), and implements seamless supportfor constraints. Experimental results demonstrate that HSS givescompetitive results against most existing AI-based, as well as com-putational-based, variable-strength t-way strategies.
This paper is organized as follows. Section 2 discusses the math-ematical notations for variable-strength interaction testing. Sec-tion 3 describes the problem definition model. Section 4 outlinesthe related work whilst Section 5 introduces the design and imple-mentation of HSS. Section 6 illustrates the tuning of HSS parame-ters. Section 7 elaborates the benchmarking of HSS against otherexisting strategies. Section 8 illustrates the statistical analysis ofthe results. Finally, Section 9 provides the conclusion.
2. Covering array notations
Interaction test suites can be mapped to corresponding combi-natorial objects, called covering arrays (CA). In order to aid discus-sion, this section elaborates useful notations for expressing CA.
Normally, the CA has four parameters; N, t, P, and v (i.e., CA (N, t,vP)). Here, the symbols P, v, and t are used to refer to number ofparameters (or factors), values (or levels), and interaction strengthfor the CA, respectively. For example, CA (9, 2, 34) represents a testsuite consisting of 9 � 4 arrays (i.e., the rows represent the size oftest cases (N), and the column represents the parameter (P)). In thiscase, the test suite also covers two-way interaction for a systemwith four 3-value parameters.
Similar to CA, mixed covering array (MCA) has three parame-ters; N, t, and Configuration (C) (i.e., MCA (N, t, C)). In addition toN and t that carry the same meaning as in CA, MCA adopts a newsymbol, C. Consistent with earlier given notations, C representsthe parameters and values of each configuration in the followingformat: ðvP1
1 ; vP22 ; . . . ;vPn
n Þ indicating that there are P1 parameterswith v1 values, P2 parameters with v2 values, and so on. For exam-ple, MCA (1265, 4, 102 41 32 27) indicates the test size of 1265 thatcovers four-way interaction. Here, the configuration takes 12parameters: two 10-value parameters, one 4-value parameter,two 3-value parameters, and seven 2-value parameters.
In the case of variable-strength covering array (VCA), theparameters consist of N, t, C, and Set (CS) (i.e., VCA (N, t, C, CS)). Sim-ilar to MCA, N, t, and C carry the same meaning. Set CS consists of a
Table 1Pizza options.
Pizza options (parameters)
Pizza type Crust
Configurations Vegetarian Cheese Thin CrustMeat Lover Extra Thick
multiple set of disjoint (mixed) covering array with strength largerthan t (i.e., as sub-strength from the main strength). For example,VCA (12, 2, 32 22, {CA (3, 31 22)}) indicates the test size of 12 forpairwise interaction (with two 3-value parameters and two 2-va-lue parameters) as the main strength and three-way interaction(with one 3-value parameters and two 2-value parameters) asthe sub-strength.
In constraints covering array (CCA) or mixed-constraints cover-ing array (MCCA); a new variable called forbidden (F) interaction isintroduced to represent the set of disallowed interactions (i.e., CA(N, t, vP, F) or MCCA (N, t, C, F)). For example, consider CCA (10, 2,33, F) where F = {(x, 2, 0), (0, x, 1)}. In this case, the CCA indicatesthe test size of 10 for pairwise interaction of three 3-value param-eters with constraints pair interaction elements of (x, 2, 0), and (0,x, 1), where ‘‘x’’ denotes the ‘‘don’t care’’ values. Here, regardless ofthe ‘‘don’t care’’ values, any test cases covering the interactionelements of (x, 2, 0), and (0, x, 1) are disallowed.
3. Problem definition model
A simple configurable software system is used here as a modelto illustrate the variable strength interaction testing and con-straints. Table 1 represents the simplified pizza ordering system.The system takes different parameters and values (i.e., also termedfactors and levels respectively) depending on the desired orders. Inthis example, the system consists of five parameters with three 2-value parameters (i.e., Pizza Type, Crust, and Delivery) and two 3-value parameters (i.e., Toppings and Size). Specifically, the systemoffers two types of pizza (Vegetarian Cheese, and Meat Lover), twochoices for crust selection (Thin Crust, Extra Thick), three toppings(Ground Beef, Roasted Chicken, Mushroom), three sizes (Small,Medium, Large) to choose from, and two delivery options (Eat In,Take Away).
Exhaustive testing of all possible interactions for the aforemen-tioned pizza ordering system requires 72 test cases (i.e.,2 � 2 � 3 � 3 � 2). As exhaustive testing is practically impossiblein many real systems with large parameters and values (i.e., dueto resources and time constraints), it is often desirable to focusonly on specific interactions [25,26]. In the case of the pizza order-ing system, all pairwise (2-way) interactions can be tested usingnine test cases as shown in Table 2.
Assuming that overall faults are caused by all 2-way interac-tions, and the 3-way interactions between (Pizza Type, Crust, Top-pings), we can also consider variable strength interactions. Here,we can choose 2-way interactions for all five parameters and 3-way interactions just for the three parameters (Pizza Type, Crust,Toppings), which results in 12 test cases (refer to Table 3).
At a glance, the variable strength test suite in Table 3 faithfullycaptures the required interactions for t = 2 and t = 3. Nonetheless, acloser look reveals some unwanted combinations (or constraints).The pair interactions between Pizza Type (Vegetarian) and Topping(Ground Beef, Roasted Chicken) are impossible, hence, must be for-bidden. By the same token, pair interaction between Pizza Type(Meat Lover) and Toppings (Mushroom) is also forbidden. Usingthe mixed-constraints covering array notation discussed earlier,the system configuration can be formally expressed as MCCA
Toppings Size Delivery
Roasted Chicken Large Eat InGround Beef Medium Take AwayMushroom Small

Table 2Test suite for CA (N, 2, 23 32).
No. t = 2
Pizza Type Crust Toppings Size Delivery
1 Vegetarian Cheese Thin Crust Roasted Chicken Small Take Away2 Meat Lover Extra Thick Mushroom Small Eat In3 Vegetarian Cheese Extra Thick Ground Beef Large Take Away4 Meat Lover Thin Crust Ground Beef Medium Eat In5 Vegetarian Cheese Thin Crust Mushroom Large Eat In6 Meat Lover Extra Thick Roasted Chicken Medium Take Away7 Vegetarian Cheese Thin Crust Mushroom Medium Take Away8 Meat Lover Extra Thick Roasted Chicken Large Eat In9 Meat Lover Thin Crust Ground Beef Small Eat In
Table 3Test suite for VCA (N, 2, 23 32, CA (3, 22 31)).
No. t = 2
t = 3 Size Delivery
Pizza type Crust Toppings
1 Vegetarian Cheese Thin Crust Roasted Chicken Small Take Away2 Vegetarian Cheese Thin Crust Ground Beef Large Take Away3 Meat Lover Extra Thick Roasted Chicken Medium Eat In4 Vegetarian Cheese Thin Crust Mushroom Medium Take Away5 Vegetarian Cheese Extra Thick Roasted Chicken Large Take Away6 Vegetarian Cheese Extra Thick Ground Beef Small Eat In7 Vegetarian Cheese Extra Thick Mushroom Large Eat In8 Meat Lover Extra Thick Ground Beef Large Take Away9 Meat Lover Thin Crust Mushroom Small Take Away
10 Meat Lover Thin Crust Ground Beef Medium Eat In11 Meat Lover Thin Crust Roasted Chicken Large Eat In12 Meat Lover Extra Thick Mushroom Medium Eat In
Table 4Test suite for MCCA (VCA (N, 2, 23 32, CA (3, 22 31)), F), where F = {(Vegetarian Cheese, x, Roasted Chicken, x, x), (Vegetarian Cheese, x, Ground Beef, x, x), (Meat Lover, x,Mushroom, x, x)}.
No. t = 2
t = 3 Size Delivery
Pizza type Crust Toppings
1 Vegetarian Cheese Thin Crust Mushroom Large Eat In2 Meat Lover Extra Thick Roasted Chicken Medium Eat In3 Meat Lover Thin Crust Roasted Chicken Small Take Away4 Meat Lover Extra Thick Ground Beef Large Eat In5 Meat Lover Thin Crust Ground Beef Medium Take Away6 Meat Lover Extra Thick Ground Beef Small Eat In7 Vegetarian Cheese Extra Thick Mushroom Medium Eat In8 Vegetarian Cheese Thin Crust Mushroom Small Take Away9 Meat Lover Extra Thick Roasted Chicken Large Take Away
A.R.A. Alsewari, K.Z. Zamli / Information and Software Technology 54 (2012) 553–568 555
(VCA (N, 2, 23 32, CA (3, 22 31)), F), where F = {(Vegetarian Cheese, x,Roasted Chicken, x, x), (Vegetarian Cheese, x, Ground Beef, x, x),(Meat Lover, x, Mushroom, x, x)}. Considering these constraints,the correct representation of MCCA is given in Table 4.
4. Related work
Lei et al. in [27] classified two main approaches for constructinginteraction test suites: algebraic and computational. Algebraic ap-proach is based on the extension of mathematical functions. Exam-ples of strategies that adopt this approach include orthogonal Latinsquares (OLS) [28], CA [29] and MCA [30]. Mandl adopted anorthogonal test design to test a compiler [28]. Williams et al. devel-oped TConfig Tool, which employs a recursive construction processbased on orthogonal arrays to construct test suites [31]. Although
helpful, the applicability of orthogonal array is often restricted tosmall configurations. Thus, recent work has placed significant focuson computational-based approaches that provide the support forvery large configurations. For this reason, our analysis of relatedwork focuses more on the recent work based on computational ap-proaches. In line with the subject of our paper, we also capture thesupport for constraints of each related work reviewed.
Briefly, the computational approaches can be further classifiedas either pure computational-based strategies or AI-basedstrategies.
4.1. Pure computational based strategies
In this case, pure computational-based strategies constructinteraction test suites in two ways: the one-test-at-a-time ap-proach and the one-parameter-at-a-time approach. In the case of
556 A.R.A. Alsewari, K.Z. Zamli / Information and Software Technology 54 (2012) 553–568
the one-test-at-a-time approach, the corresponding strategy oftentraverses all interaction elements and generates a complete testcase per iteration.
The automatic efficient test generator (AETG) [32,33] is perhapsthe first breed of strategies to adopt the one-test-at-a-time ap-proach. AETG generates one final test case for every cycle of itera-tion. For each cycle, AETG generates a number of test casecandidates, and from these candidates, one is greedily selected asthe final test case (i.e., covering the most uncovered tuples). Anumber of variations of AETG have been developed over the years,including AETGm [30] and mAETG_SAT [34]. Unlike AETG andAETGm, mAETG_SAT provides the support for constraints throughits forbidden tuple implementation.
Jenny adopts a greedy algorithm to produce the interaction testsuite [35]. In Jenny, a test suite is first built to cover one-way inter-action. The test suite then is extended to cover two-way interac-tion until all t-way interactions are covered. Jenny’s competitor,Intelligent Test Case Handler (WHITCH) [7] relies on an exhaustivesearch algorithm to construct interaction test suites.
As far as the support for variable strength is concerned, Density[6] adopts the calculation of density of the required interactions inorder to greedily select test cases for the final test suites. PICT[8,36] generates all specified interaction tuples and randomly se-lects their corresponding interaction combinations to form the testcases as part of the complete test suite. Apart from the support forvariable strength, PICT, unlike Density, addresses the support forconstraints. In case a particular test case matches a specified con-straint, PICT randomly generates a new combination for coveringthe interaction tuples. Due to its random behavior, PICT tends togive a non-optimal test size as compared to other strategies.
Claiming to be an AETG variant, the test vector generator (TVG)[4,5] generates the variable-strength test suite based on three algo-rithms: T-reduced, Plus-one, and Random sets. Due to limited liter-ature, the details’ concerning the implementation for eachalgorithm remains unclear. However, based on our experience withTVG implementation, t-reduced often produces the most optimalresult compared with the other algorithms. Similar to TVG, notmuch information can be gathered regarding TestCover [55] apartfrom its commercial availability and some benchmark configura-tions on constraints that can be obtained from its website.
Unlike the one-test-at-a-time approach, the one-parameter-at-a-time strategy begins with a partially complete test suite con-sisting of several selected interaction-element parameters. The testsuite is extended horizontally (horizontal extension) by adding theone-parameter-at-a-time. Upon completion, new test cases may beadded (vertical extension) to ensure maximum interactioncoverage.
The in-parameter-order (IPO) strategy [38] is a pioneer strategythat adopts the one-parameter-at-a-time approach. It is a pairwisestrategy (two-way) based on vertical and horizontal extension. Itfirst generates a pairwise test set for the first two parameters,and then extends the test set by generating the pair for the firstthree parameters and so on, until all the system parameters arecovered. This is followed by vertical extension to cover the uncov-ered interactions, if necessary. The said strategy was later general-ized into IPOG [27], IPOG-D [27], IPOF [39], and IPOF2 [39] toaddress general t-way support with variant algorithms for optimiz-ing the horizontal and vertical extension (i.e., to obtain optimal testsize and fast execution time). Due to its simplicity, IPO has alsobeen adopted by other researchers, notably in the developmentof MIPOG [40]. Unlike IPO and its family, MIPOG removes inherentdependencies between horizontal and vertical extension in orderto permit parallel t-way test suite generation on multiple-core ma-chines. Among the IPO strategies discussed thus far, only IPOG ad-dresses the support for variable-strength interaction [39,41];however, no support is provided for constraints.
Recently, ParaOrder [6] has emerged as the new variant of IPOGfor variable-strength interaction. Unlike IPOG, ParaOrder allowsprioritization of t-way interaction for its horizontal extension. Spe-cifically, the extended parameter for ParaOrder strategy is decidedbased on number of values (i.e., parameter with higher number ofvalues will be extended first), whereas, for IPOG, the extendedparameter is decided based on the defined order-of-parameterfound.
4.2. AI-based strategies
The generation of interaction test suite with optimal test sizecan be regarded as combinatorial optimization problem [42].Naturally, AI-based strategies excel in this respect. As discussedearlier, many useful studies that adopt AI-based strategies exclu-sively exploit the one-test-at-a-time approach. In contrast, for purecomputational-based counterparts, most studies are limited tosmall values of interaction strength (i.e., 2 6 t 6 6). Furthermore,the support for variable-strength constraints has also not been suf-ficiently investigated.
GA [9,16–20] and ACA [6,9,16,20] represent early works inadopting AI-based strategies for t-way test generation. The GAstrategy mimics the natural selection process. GA begins with ran-domly created test cases, which are referred to as chromosomes.These chromosomes undergo a cycle of crossover and mutationprocesses until the predefined fitness function is met. In each cycle,the best chromosomes are selected and added to the final testsuite. Unlike GA, ACA mimics the behavior of colonies of ants insearch for food. Because colonies of ants travel from place to place(representing the parameter) to find food (representing the valueselection of each parameter), the quality of the paths taken (repre-senting the test case) is evaluated based on the amount of phero-mones left behind (representing interaction coverage). The bestpath represents the best value of a test case to be added to the finaltest suite. Thus far, existing strategies based on GA and ACA ad-dress only small values of t (i.e., t 6 3). In fact, they generally donot address variable-strength interactions (with the exception ofa variant of ACA, called ACS [9]). Furthermore, no support is pro-vided for constraints.
SA [11,13] relies on a large random search space for generatinga t-way test suite. Using probability-based transformation equa-tions, SA adopts binary search algorithm to find the best test caseper iteration to be added to the final test suite. Apart from support-ing variable-strength interaction, SA also addresses constraintssupport through its variant, called SA_SAT [34]. Similar to otherAI-based counterparts, SA addresses small values of t (i.e., t 6 3).
PSTG [21–23] is the most recent AI-based t-way strategy forgenerating t-way test suite. PSTG is based on the particle swarmoptimization (PSO) algorithm, which mimics the swarm behaviorof birds. Internally, PSTG iteratively performs local and globalsearches to find the candidate solution to be added to the finalsuite until all the interaction tuples are covered. Unlike other AI-based strategies that address small values of t (i.e., 2 6 t 6 3), PSTGcan support up to t = 6. Although useful for some class systems, re-cent evidence has demonstrated the need to address t > 6 [24,43].As such, the interaction support provided by PSTG is still deemedlimited. Although addressing variable-strength interaction, in itsnew implementation called VS-PSTG [12], PSTG does not caterfor the constraints support.
Addressing the limitation of existing AI-based strategies (i.e., interms of incorporating the support for t > 6 and enabling seamlesssupport for constraints), this paper discusses a new variable-strength t-way strategy, HSS, based on HS algorithm. The rationalefor adopting HS for HSS strategy is because, unlike GA, ACA, ACS,and SA, which typically require heavy computation (i.e., due tocrossover and mutation process in GA, and ant search and
A.R.A. Alsewari, K.Z. Zamli / Information and Software Technology 54 (2012) 553–568 557
probabilistic binary search processes in ACA and SA respectively),HS requires only lightweight computation (i.e., with small numberof parameters that require tuning), similar to PSO. Unlike PSTG, HSoffers good balance of control as far as intensification (i.e., finesearch around local optimal) and diversification (i.e., global inves-tigation of solution space) are concerned [44,45]. Thus, HS tends togive good convergence rate because it does not move too far tounnecessary search locations. Furthermore, musical improvisationanalogy in HS is relatively appealing and straightforward com-pared to swarm behavior in PSO.
5. Overview of HSS
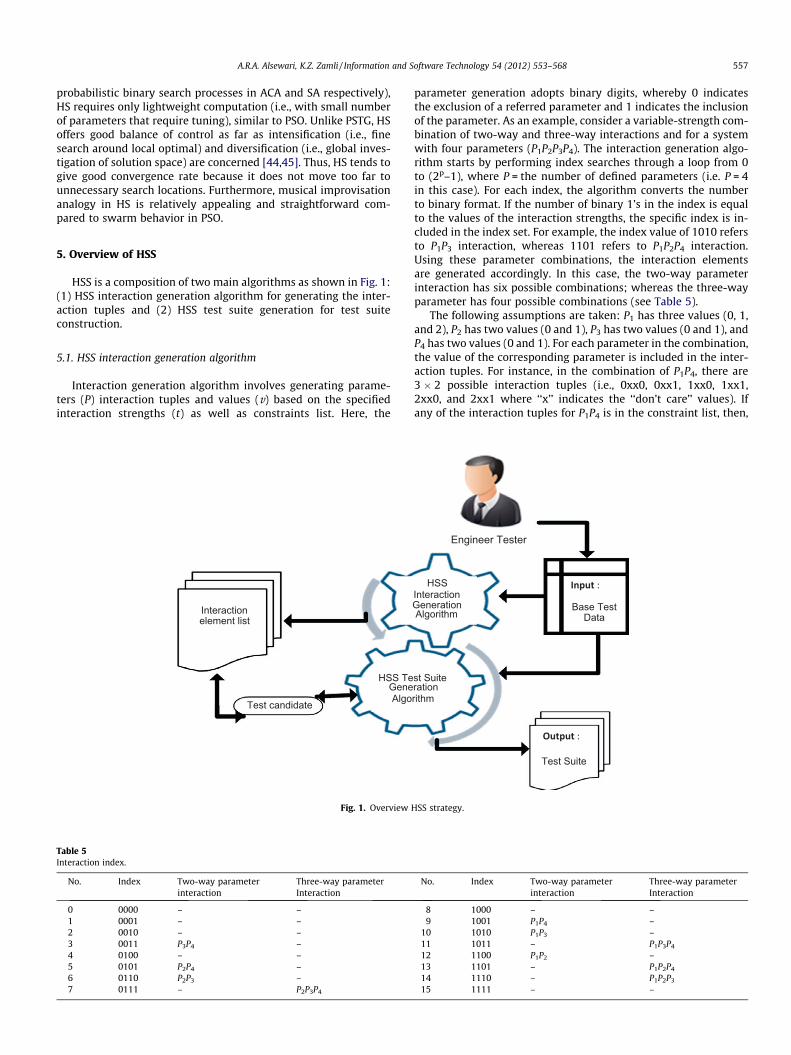
HSS is a composition of two main algorithms as shown in Fig. 1:(1) HSS interaction generation algorithm for generating the inter-action tuples and (2) HSS test suite generation for test suiteconstruction.
5.1. HSS interaction generation algorithm
Interaction generation algorithm involves generating parame-ters (P) interaction tuples and values (v) based on the specifiedinteraction strengths (t) as well as constraints list. Here, the
Interaction element list
Test candidate
HSS TeGeneAlgo
Fig. 1. Overview
Table 5Interaction index.
No. Index Two-way parameterinteraction
Three-way parameterInteraction
0 0000 – –1 0001 – –2 0010 – –3 0011 P3P4 –4 0100 – –5 0101 P2P4 –6 0110 P2P3 –7 0111 – P2P3P4
parameter generation adopts binary digits, whereby 0 indicatesthe exclusion of a referred parameter and 1 indicates the inclusionof the parameter. As an example, consider a variable-strength com-bination of two-way and three-way interactions and for a systemwith four parameters (P1P2P3P4). The interaction generation algo-rithm starts by performing index searches through a loop from 0to (2p–1), where P = the number of defined parameters (i.e. P = 4in this case). For each index, the algorithm converts the numberto binary format. If the number of binary 1’s in the index is equalto the values of the interaction strengths, the specific index is in-cluded in the index set. For example, the index value of 1010 refersto P1P3 interaction, whereas 1101 refers to P1P2P4 interaction.Using these parameter combinations, the interaction elementsare generated accordingly. In this case, the two-way parameterinteraction has six possible combinations; whereas the three-wayparameter has four possible combinations (see Table 5).
The following assumptions are taken: P1 has three values (0, 1,and 2), P2 has two values (0 and 1), P3 has two values (0 and 1), andP4 has two values (0 and 1). For each parameter in the combination,the value of the corresponding parameter is included in the inter-action tuples. For instance, in the combination of P1P4, there are3 � 2 possible interaction tuples (i.e., 0xx0, 0xx1, 1xx0, 1xx1,2xx0, and 2xx1 where ‘‘x’’ indicates the ‘‘don’t care’’ values). Ifany of the interaction tuples for P1P4 is in the constraint list, then,
st Suite ration rithm
HSS Interaction Generation Algorithm
Engineer Tester
Base Test Data
Test Suite
HSS strategy.
No. Index Two-way parameterinteraction
Three-way parameterInteraction
8 1000 – –9 1001 P1P4 –
10 1010 P1P3 –11 1011 – P1P3P4
12 1100 P1P2 –13 1101 – P1P2P4
14 1110 – P1P2P3
15 1111 – –
558 A.R.A. Alsewari, K.Z. Zamli / Information and Software Technology 54 (2012) 553–568
they are excluded from the final interaction tuple for P1P4. Thesame process of tuple generation is iteratively repeated for allother defined interactions (i.e., (P1P2), (P1P3), (P1P4), (P2P3), (P2P4),(P3P4), (P1P2P3), (P1P2P4), (P1P3P4), and (P2P3P4)). The completeinteraction generation algorithm is summarized in Fig. 2.
5.2. HSS test suite generation algorithm
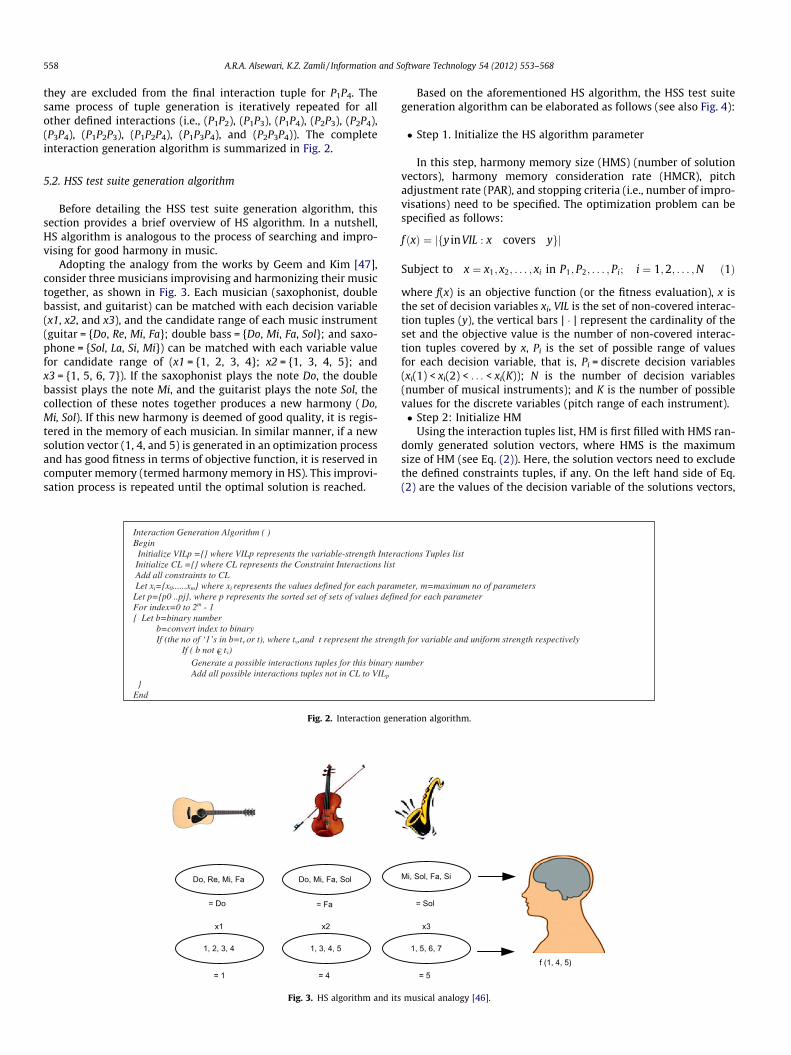
Before detailing the HSS test suite generation algorithm, thissection provides a brief overview of HS algorithm. In a nutshell,HS algorithm is analogous to the process of searching and impro-vising for good harmony in music.
Adopting the analogy from the works by Geem and Kim [47],consider three musicians improvising and harmonizing their musictogether, as shown in Fig. 3. Each musician (saxophonist, doublebassist, and guitarist) can be matched with each decision variable(x1, x2, and x3), and the candidate range of each music instrument(guitar = {Do, Re, Mi, Fa}; double bass = {Do, Mi, Fa, Sol}; and saxo-phone = {Sol, La, Si, Mi}) can be matched with each variable valuefor candidate range of (x1 = {1, 2, 3, 4}; x2 = {1, 3, 4, 5}; andx3 = {1, 5, 6, 7}). If the saxophonist plays the note Do, the doublebassist plays the note Mi, and the guitarist plays the note Sol, thecollection of these notes together produces a new harmony ( Do,Mi, Sol). If this new harmony is deemed of good quality, it is regis-tered in the memory of each musician. In similar manner, if a newsolution vector (1, 4, and 5) is generated in an optimization processand has good fitness in terms of objective function, it is reserved incomputer memory (termed harmony memory in HS). This improvi-sation process is repeated until the optimal solution is reached.
Fig. 2. Interaction gen
Do, Mi, Fa, SolDo, Re, Mi, Fa
1, 2, 3, 4 1, 3, 4, 5
= Do = Fa
x1 x2
= 4= 1
Fig. 3. HS algorithm and its
Based on the aforementioned HS algorithm, the HSS test suitegeneration algorithm can be elaborated as follows (see also Fig. 4):
� Step 1. Initialize the HS algorithm parameter
In this step, harmony memory size (HMS) (number of solutionvectors), harmony memory consideration rate (HMCR), pitchadjustment rate (PAR), and stopping criteria (i.e., number of impro-visations) need to be specified. The optimization problem can bespecified as follows:
f ðxÞ ¼ jfy inVIL : x covers ygj
Subject to x ¼ x1; x2; . . . ; xi in P1; P2; . . . ; Pi; i ¼ 1;2; . . . ;N ð1Þ
where f(x) is an objective function (or the fitness evaluation), x isthe set of decision variables xi, VIL is the set of non-covered interac-tion tuples (y), the vertical bars | � | represent the cardinality of theset and the objective value is the number of non-covered interac-tion tuples covered by x, Pi is the set of possible range of valuesfor each decision variable, that is, Pi = discrete decision variables(xi(1) < xi(2) < . . . < xi(K)); N is the number of decision variables(number of musical instruments); and K is the number of possiblevalues for the discrete variables (pitch range of each instrument).� Step 2: Initialize HM
Using the interaction tuples list, HM is first filled with HMS ran-domly generated solution vectors, where HMS is the maximumsize of HM (see Eq. (2)). Here, the solution vectors need to excludethe defined constraints tuples, if any. On the left hand side of Eq.(2) are the values of the decision variable of the solutions vectors,
eration algorithm.
Mi, Sol, Fa, Si
1, 5, 6, 7
= Sol
x3
= 5f (1, 4, 5)
musical analogy [46].
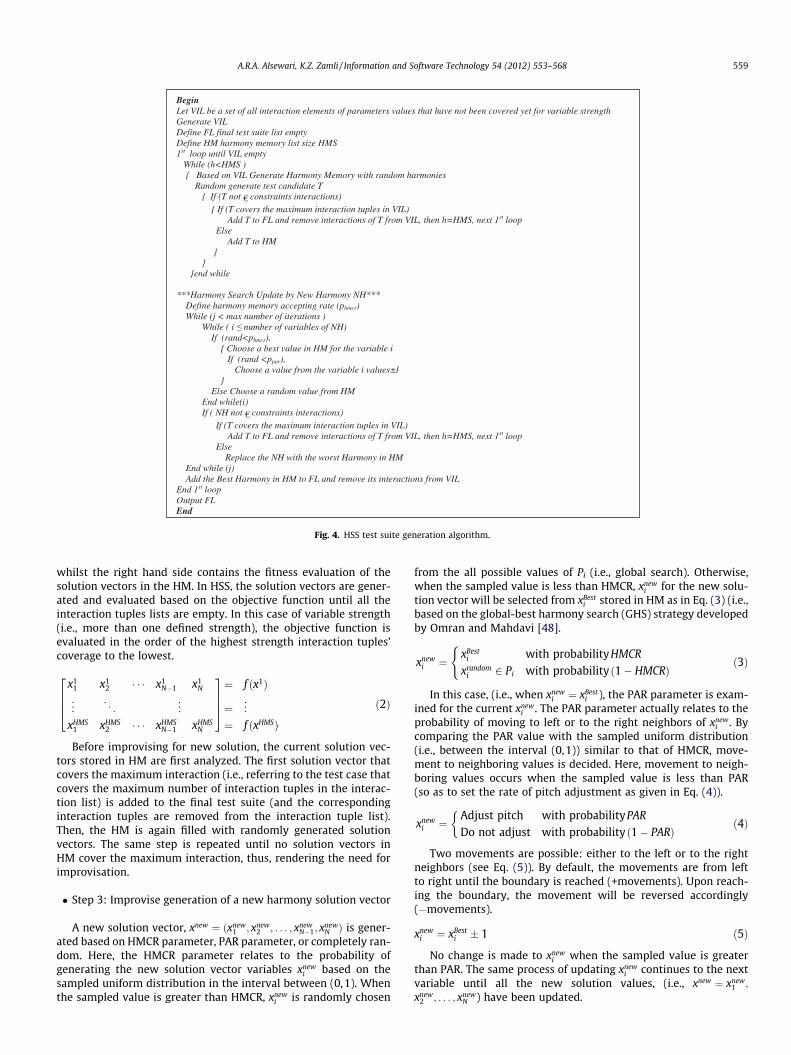
Fig. 4. HSS test suite generation algorithm.
A.R.A. Alsewari, K.Z. Zamli / Information and Software Technology 54 (2012) 553–568 559
whilst the right hand side contains the fitness evaluation of thesolution vectors in the HM. In HSS, the solution vectors are gener-ated and evaluated based on the objective function until all theinteraction tuples lists are empty. In this case of variable strength(i.e., more than one defined strength), the objective function isevaluated in the order of the highest strength interaction tuples’coverage to the lowest.
x11 x1
2 � � � x1N�1 x1
N
..
. . .. ..
.
xHMS1 xHMS
2 � � � xHMSN�1 xHMS
N
2664
3775¼ f ðx1Þ
¼ ...
¼ f ðxHMSÞ
ð2Þ
Before improvising for new solution, the current solution vec-tors stored in HM are first analyzed. The first solution vector thatcovers the maximum interaction (i.e., referring to the test case thatcovers the maximum number of interaction tuples in the interac-tion list) is added to the final test suite (and the correspondinginteraction tuples are removed from the interaction tuple list).Then, the HM is again filled with randomly generated solutionvectors. The same step is repeated until no solution vectors inHM cover the maximum interaction, thus, rendering the need forimprovisation.
� Step 3: Improvise generation of a new harmony solution vector
A new solution vector, xnew ¼ ðxnew1 ; xnew
2 ; . . . ; xnewN�1; x
newN Þ is gener-
ated based on HMCR parameter, PAR parameter, or completely ran-dom. Here, the HMCR parameter relates to the probability ofgenerating the new solution vector variables xnew
i based on thesampled uniform distribution in the interval between (0,1). Whenthe sampled value is greater than HMCR, xnew
i is randomly chosen
from the all possible values of Pi (i.e., global search). Otherwise,when the sampled value is less than HMCR, xnew
i for the new solu-tion vector will be selected from xBest
i stored in HM as in Eq. (3) (i.e.,based on the global-best harmony search (GHS) strategy developedby Omran and Mahdavi [48].
xnewi ¼
xBesti with probabilityHMCR
xrandomi 2 Pi with probability ð1� HMCRÞ
(ð3Þ
In this case, (i.e., when xnewi ¼ xBest
i ), the PAR parameter is exam-ined for the current xnew
i . The PAR parameter actually relates to theprobability of moving to left or to the right neighbors of xnew
i . Bycomparing the PAR value with the sampled uniform distribution(i.e., between the interval (0,1)) similar to that of HMCR, move-ment to neighboring values is decided. Here, movement to neigh-boring values occurs when the sampled value is less than PAR(so as to set the rate of pitch adjustment as given in Eq. (4)).
xnewi ¼
Adjust pitch with probabilityPAR
Do not adjust with probability ð1� PARÞ
�ð4Þ
Two movements are possible: either to the left or to the rightneighbors (see Eq. (5)). By default, the movements are from leftto right until the boundary is reached (+movements). Upon reach-ing the boundary, the movement will be reversed accordingly(�movements).
xnewi ¼ xBest
i � 1 ð5Þ
No change is made to xnewi when the sampled value is greater
than PAR. The same process of updating xnewi continues to the next
variable until all the new solution values, (i.e., xnew ¼ xnew1 ;
xnew2 ; . . . ; xnew
N ) have been updated.
560 A.R.A. Alsewari, K.Z. Zamli / Information and Software Technology 54 (2012) 553–568
� Step 4: Update HM
The update of the HM depends on the following conditions:
– If the new solution vector xnew (i.e., derived from Step 3)excludes forbidden tuples (i.e., not containing constraints),then the tuples’ coverage (i.e., based on the specified objec-tive function) is computed. Here, if the tuples’ coverage ofthe new solution vector is better than the worst vector inHM, the current vector contents in HM is updated (i.e., theworst vector is removed in HM) and rearranged accordingly.
– If the new solution vector xnew includes forbidden tuples, itscontribution is completely ignored (i.e., no update in HM).
� Step 5: Check Exit Criteria for improvisation
When the maximum number of improvisations has not beensatisfied, Steps 3 and 4 are repeated. Otherwise, improvisation iter-ation is terminated. Upon termination, the best solution vector inHM is added into the final test suite and the covered interactionsare removed from the interaction list.
� Step 6: Check Exit Criteria for interaction coverage
When all the interaction tuples are covered (i.e., the interactionlist is empty), the iteration stops. Otherwise, improvisation itera-tion is restarted from Step 2.
6. Tuning HSS parameters
In order to ensure optimality, as far as the generated test size isconcerned, the relevant HSS parameters need to be tuned. Theseparameters include maximum improvisation (i.e., iterations),HMS, HMCR, and PAR. For tuning, we select one case study involv-ing a covering array of CA (N; 2, 57). The rationale for adopting thiscase study stems from the fact that it is a well-known case study intuning many AI-based strategies, as described by Stardom [11] andAhmed et al. [21]. To undertake the tuning of HSS, we repeat therunning of HSS strategy 20 times for CA (N; 2, 57) with various set-tings of improvisation: HMS, HMCR, and PAR (i.e., in order to im-prove the statistical significance of each of the settings). The bestand the average test suite sizes are shown in Tables 6 and 7, wherethe darkened cells indicate the most optimal size.
6.1. Improvisation and HMS
The first HSS parameters for consideration are the improvisa-tion and HMS. A large value of the improvisation may be counter-productive if no better solution is obtained from the previousiterations. In contrast, too few iterations may lead to the interrup-tion of the transition of the harmonies when iterating through the
Table 6Test suite size and average for CA (N, 2, 57) with HMCR = 0.95 and PAR = 0.1.
HMS Improvisation/iteration
1 5 10 50
BestSize
Avg.Size
BestSize
Avg.Size
BestSize
Avg.Size
BestSize
Avg.Size
1 69 71.6 61 63.6 56 59 52 52.25 50 53.4 51 51.8 49 49.6 44 46.2
10 49 50.4 49 49.8 48 49 43 44.620 46 47.2 46 47.2 46 46.2 42 43.250 44 44.8 43 43.8 43 43.6 39 40
100 43 43.2 42 43 42 42.4 39 40.41000 39 39.8 39 39.6 39 39.8 39 39.4
best candidate solutions. Similarly, a large HMS increases compu-tation; whereas a small HMS hampers the indication of goodsolution from appearing. Hence, the selection of maximum impro-visation and HMS must be carefully orchestrated.
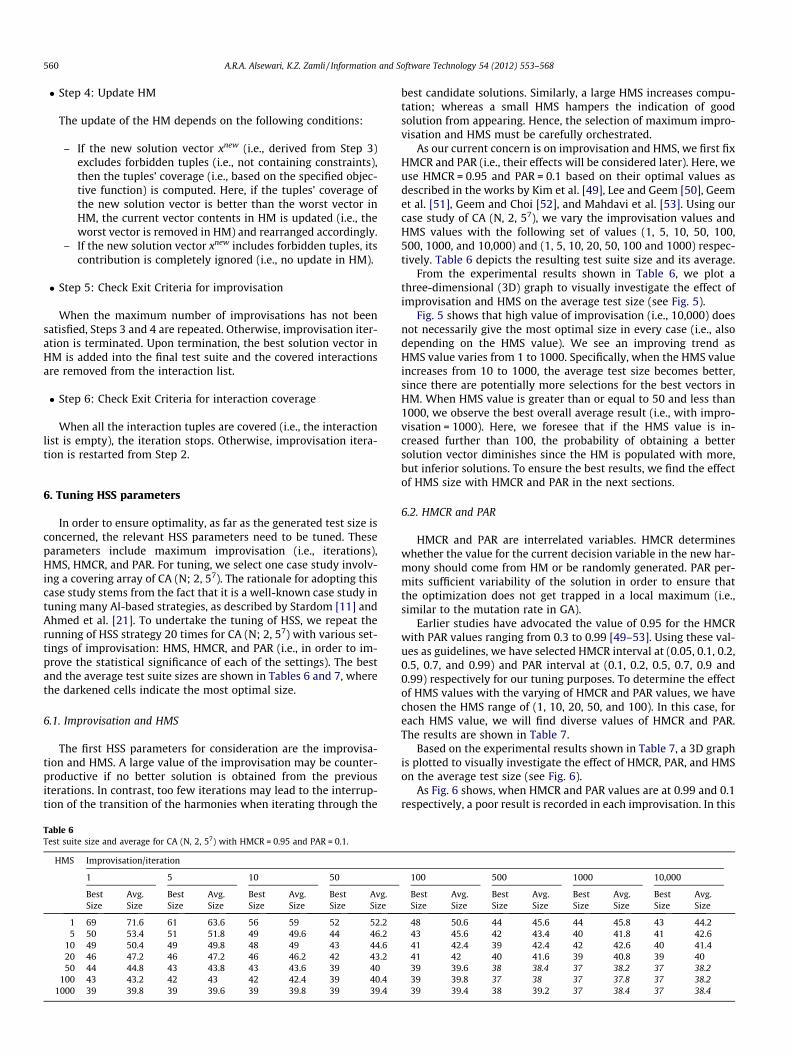
As our current concern is on improvisation and HMS, we first fixHMCR and PAR (i.e., their effects will be considered later). Here, weuse HMCR = 0.95 and PAR = 0.1 based on their optimal values asdescribed in the works by Kim et al. [49], Lee and Geem [50], Geemet al. [51], Geem and Choi [52], and Mahdavi et al. [53]. Using ourcase study of CA (N, 2, 57), we vary the improvisation values andHMS values with the following set of values (1, 5, 10, 50, 100,500, 1000, and 10,000) and (1, 5, 10, 20, 50, 100 and 1000) respec-tively. Table 6 depicts the resulting test suite size and its average.
From the experimental results shown in Table 6, we plot athree-dimensional (3D) graph to visually investigate the effect ofimprovisation and HMS on the average test size (see Fig. 5).
Fig. 5 shows that high value of improvisation (i.e., 10,000) doesnot necessarily give the most optimal size in every case (i.e., alsodepending on the HMS value). We see an improving trend asHMS value varies from 1 to 1000. Specifically, when the HMS valueincreases from 10 to 1000, the average test size becomes better,since there are potentially more selections for the best vectors inHM. When HMS value is greater than or equal to 50 and less than1000, we observe the best overall average result (i.e., with impro-visation = 1000). Here, we foresee that if the HMS value is in-creased further than 100, the probability of obtaining a bettersolution vector diminishes since the HM is populated with more,but inferior solutions. To ensure the best results, we find the effectof HMS size with HMCR and PAR in the next sections.
6.2. HMCR and PAR
HMCR and PAR are interrelated variables. HMCR determineswhether the value for the current decision variable in the new har-mony should come from HM or be randomly generated. PAR per-mits sufficient variability of the solution in order to ensure thatthe optimization does not get trapped in a local maximum (i.e.,similar to the mutation rate in GA).
Earlier studies have advocated the value of 0.95 for the HMCRwith PAR values ranging from 0.3 to 0.99 [49–53]. Using these val-ues as guidelines, we have selected HMCR interval at (0.05, 0.1, 0.2,0.5, 0.7, and 0.99) and PAR interval at (0.1, 0.2, 0.5, 0.7, 0.9 and0.99) respectively for our tuning purposes. To determine the effectof HMS values with the varying of HMCR and PAR values, we havechosen the HMS range of (1, 10, 20, 50, and 100). In this case, foreach HMS value, we will find diverse values of HMCR and PAR.The results are shown in Table 7.
Based on the experimental results shown in Table 7, a 3D graphis plotted to visually investigate the effect of HMCR, PAR, and HMSon the average test size (see Fig. 6).
As Fig. 6 shows, when HMCR and PAR values are at 0.99 and 0.1respectively, a poor result is recorded in each improvisation. In this
100 500 1000 10,000
BestSize
Avg.Size
BestSize
Avg.Size
BestSize
Avg.Size
BestSize
Avg.Size
48 50.6 44 45.6 44 45.8 43 44.243 45.6 42 43.4 40 41.8 41 42.641 42.4 39 42.4 42 42.6 40 41.441 42 40 41.6 39 40.8 39 4039 39.6 38 38.4 37 38.2 37 38.239 39.8 37 38 37 37.8 37 38.239 39.4 38 39.2 37 38.4 37 38.4
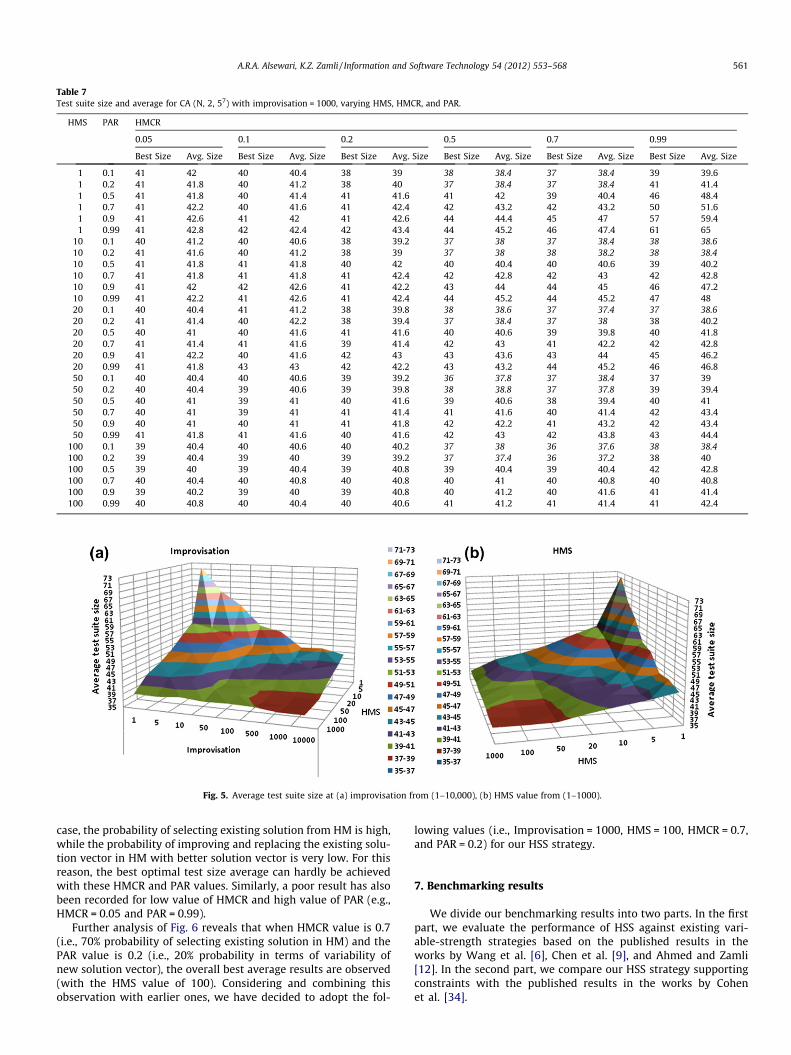
Table 7Test suite size and average for CA (N, 2, 57) with improvisation = 1000, varying HMS, HMCR, and PAR.
HMS PAR HMCR
0.05 0.1 0.2 0.5 0.7 0.99
Best Size Avg. Size Best Size Avg. Size Best Size Avg. Size Best Size Avg. Size Best Size Avg. Size Best Size Avg. Size
1 0.1 41 42 40 40.4 38 39 38 38.4 37 38.4 39 39.61 0.2 41 41.8 40 41.2 38 40 37 38.4 37 38.4 41 41.41 0.5 41 41.8 40 41.4 41 41.6 41 42 39 40.4 46 48.41 0.7 41 42.2 40 41.6 41 42.4 42 43.2 42 43.2 50 51.61 0.9 41 42.6 41 42 41 42.6 44 44.4 45 47 57 59.41 0.99 41 42.8 42 42.4 42 43.4 44 45.2 46 47.4 61 65
10 0.1 40 41.2 40 40.6 38 39.2 37 38 37 38.4 38 38.610 0.2 41 41.6 40 41.2 38 39 37 38 38 38.2 38 38.410 0.5 41 41.8 41 41.8 40 42 40 40.4 40 40.6 39 40.210 0.7 41 41.8 41 41.8 41 42.4 42 42.8 42 43 42 42.810 0.9 41 42 42 42.6 41 42.2 43 44 44 45 46 47.210 0.99 41 42.2 41 42.6 41 42.4 44 45.2 44 45.2 47 4820 0.1 40 40.4 41 41.2 38 39.8 38 38.6 37 37.4 37 38.620 0.2 41 41.4 40 42.2 38 39.4 37 38.4 37 38 38 40.220 0.5 40 41 40 41.6 41 41.6 40 40.6 39 39.8 40 41.820 0.7 41 41.4 41 41.6 39 41.4 42 43 41 42.2 42 42.820 0.9 41 42.2 40 41.6 42 43 43 43.6 43 44 45 46.220 0.99 41 41.8 43 43 42 42.2 43 43.2 44 45.2 46 46.850 0.1 40 40.4 40 40.6 39 39.2 36 37.8 37 38.4 37 3950 0.2 40 40.4 39 40.6 39 39.8 38 38.8 37 37.8 39 39.450 0.5 40 41 39 41 40 41.6 39 40.6 38 39.4 40 4150 0.7 40 41 39 41 41 41.4 41 41.6 40 41.4 42 43.450 0.9 40 41 40 41 41 41.8 42 42.2 41 43.2 42 43.450 0.99 41 41.8 41 41.6 40 41.6 42 43 42 43.8 43 44.4
100 0.1 39 40.4 40 40.6 40 40.2 37 38 36 37.6 38 38.4100 0.2 39 40.4 39 40 39 39.2 37 37.4 36 37.2 38 40100 0.5 39 40 39 40.4 39 40.8 39 40.4 39 40.4 42 42.8100 0.7 40 40.4 40 40.8 40 40.8 40 41 40 40.8 40 40.8100 0.9 39 40.2 39 40 39 40.8 40 41.2 40 41.6 41 41.4100 0.99 40 40.8 40 40.4 40 40.6 41 41.2 41 41.4 41 42.4
Fig. 5. Average test suite size at (a) improvisation from (1–10,000), (b) HMS value from (1–1000).
A.R.A. Alsewari, K.Z. Zamli / Information and Software Technology 54 (2012) 553–568 561
case, the probability of selecting existing solution from HM is high,while the probability of improving and replacing the existing solu-tion vector in HM with better solution vector is very low. For thisreason, the best optimal test size average can hardly be achievedwith these HMCR and PAR values. Similarly, a poor result has alsobeen recorded for low value of HMCR and high value of PAR (e.g.,HMCR = 0.05 and PAR = 0.99).
Further analysis of Fig. 6 reveals that when HMCR value is 0.7(i.e., 70% probability of selecting existing solution in HM) and thePAR value is 0.2 (i.e., 20% probability in terms of variability ofnew solution vector), the overall best average results are observed(with the HMS value of 100). Considering and combining thisobservation with earlier ones, we have decided to adopt the fol-
lowing values (i.e., Improvisation = 1000, HMS = 100, HMCR = 0.7,and PAR = 0.2) for our HSS strategy.
7. Benchmarking results
We divide our benchmarking results into two parts. In the firstpart, we evaluate the performance of HSS against existing vari-able-strength strategies based on the published results in theworks by Wang et al. [6], Chen et al. [9], and Ahmed and Zamli[12]. In the second part, we compare our HSS strategy supportingconstraints with the published results in the works by Cohenet al. [34].
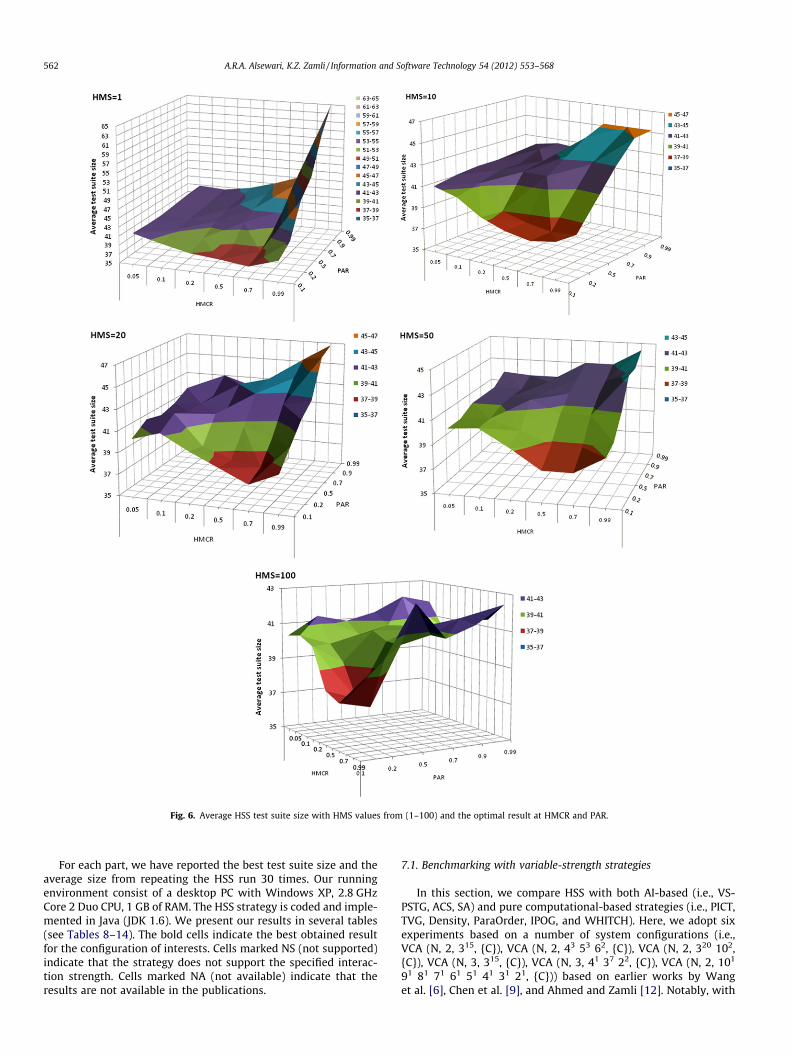
Fig. 6. Average HSS test suite size with HMS values from (1–100) and the optimal result at HMCR and PAR.
562 A.R.A. Alsewari, K.Z. Zamli / Information and Software Technology 54 (2012) 553–568
For each part, we have reported the best test suite size and theaverage size from repeating the HSS run 30 times. Our runningenvironment consist of a desktop PC with Windows XP, 2.8 GHzCore 2 Duo CPU, 1 GB of RAM. The HSS strategy is coded and imple-mented in Java (JDK 1.6). We present our results in several tables(see Tables 8–14). The bold cells indicate the best obtained resultfor the configuration of interests. Cells marked NS (not supported)indicate that the strategy does not support the specified interac-tion strength. Cells marked NA (not available) indicate that theresults are not available in the publications.
7.1. Benchmarking with variable-strength strategies
In this section, we compare HSS with both AI-based (i.e., VS-PSTG, ACS, SA) and pure computational-based strategies (i.e., PICT,TVG, Density, ParaOrder, IPOG, and WHITCH). Here, we adopt sixexperiments based on a number of system configurations (i.e.,VCA (N, 2, 315, {C}), VCA (N, 2, 43 53 62, {C}), VCA (N, 2, 320 102,{C}), VCA (N, 3, 315, {C}), VCA (N, 3, 41 37 22, {C}), VCA (N, 2, 101
91 81 71 61 51 41 31 21, {C})) based on earlier works by Wanget al. [6], Chen et al. [9], and Ahmed and Zamli [12]. Notably, with
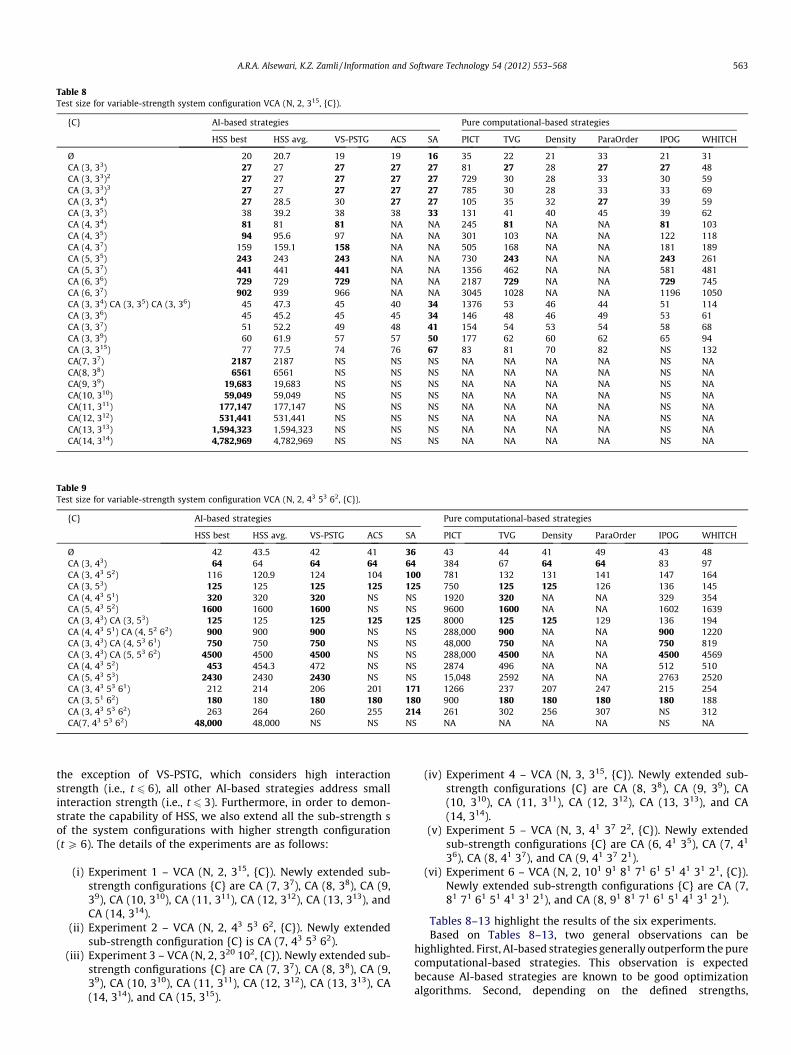
Table 8Test size for variable-strength system configuration VCA (N, 2, 315, {C}).
{C} AI-based strategies Pure computational-based strategies
HSS best HSS avg. VS-PSTG ACS SA PICT TVG Density ParaOrder IPOG WHITCH
Ø 20 20.7 19 19 16 35 22 21 33 21 31CA (3, 33) 27 27 27 27 27 81 27 28 27 27 48CA (3, 33)2 27 27 27 27 27 729 30 28 33 30 59CA (3, 33)3 27 27 27 27 27 785 30 28 33 33 69CA (3, 34) 27 28.5 30 27 27 105 35 32 27 39 59CA (3, 35) 38 39.2 38 38 33 131 41 40 45 39 62CA (4, 34) 81 81 81 NA NA 245 81 NA NA 81 103CA (4, 35) 94 95.6 97 NA NA 301 103 NA NA 122 118CA (4, 37) 159 159.1 158 NA NA 505 168 NA NA 181 189CA (5, 35) 243 243 243 NA NA 730 243 NA NA 243 261CA (5, 37) 441 441 441 NA NA 1356 462 NA NA 581 481CA (6, 36) 729 729 729 NA NA 2187 729 NA NA 729 745CA (6, 37) 902 939 966 NA NA 3045 1028 NA NA 1196 1050CA (3, 34) CA (3, 35) CA (3, 36) 45 47.3 45 40 34 1376 53 46 44 51 114CA (3, 36) 45 45.2 45 45 34 146 48 46 49 53 61CA (3, 37) 51 52.2 49 48 41 154 54 53 54 58 68CA (3, 39) 60 61.9 57 57 50 177 62 60 62 65 94CA (3, 315) 77 77.5 74 76 67 83 81 70 82 NS 132CA(7, 37) 2187 2187 NS NS NS NA NA NA NA NS NACA(8, 38) 6561 6561 NS NS NS NA NA NA NA NS NACA(9, 39) 19,683 19,683 NS NS NS NA NA NA NA NS NACA(10, 310) 59,049 59,049 NS NS NS NA NA NA NA NS NACA(11, 311) 177,147 177,147 NS NS NS NA NA NA NA NS NACA(12, 312) 531,441 531,441 NS NS NS NA NA NA NA NS NACA(13, 313) 1,594,323 1,594,323 NS NS NS NA NA NA NA NS NACA(14, 314) 4,782,969 4,782,969 NS NS NS NA NA NA NA NS NA
Table 9Test size for variable-strength system configuration VCA (N, 2, 43 53 62, {C}).
{C} AI-based strategies Pure computational-based strategies
HSS best HSS avg. VS-PSTG ACS SA PICT TVG Density ParaOrder IPOG WHITCH
Ø 42 43.5 42 41 36 43 44 41 49 43 48CA (3, 43) 64 64 64 64 64 384 67 64 64 83 97CA (3, 43 52) 116 120.9 124 104 100 781 132 131 141 147 164CA (3, 53) 125 125 125 125 125 750 125 125 126 136 145CA (4, 43 51) 320 320 320 NS NS 1920 320 NA NA 329 354CA (5, 43 52) 1600 1600 1600 NS NS 9600 1600 NA NA 1602 1639CA (3, 43) CA (3, 53) 125 125 125 125 125 8000 125 125 129 136 194CA (4, 43 51) CA (4, 52 62) 900 900 900 NS NS 288,000 900 NA NA 900 1220CA (3, 43) CA (4, 53 61) 750 750 750 NS NS 48,000 750 NA NA 750 819CA (3, 43) CA (5, 53 62) 4500 4500 4500 NS NS 288,000 4500 NA NA 4500 4569CA (4, 43 52) 453 454.3 472 NS NS 2874 496 NA NA 512 510CA (5, 43 53) 2430 2430 2430 NS NS 15,048 2592 NA NA 2763 2520CA (3, 43 53 61) 212 214 206 201 171 1266 237 207 247 215 254CA (3, 51 62) 180 180 180 180 180 900 180 180 180 180 188CA (3, 43 53 62) 263 264 260 255 214 261 302 256 307 NS 312CA(7, 43 53 62) 48,000 48,000 NS NS NS NA NA NA NA NS NA
A.R.A. Alsewari, K.Z. Zamli / Information and Software Technology 54 (2012) 553–568 563
the exception of VS-PSTG, which considers high interactionstrength (i.e., t 6 6), all other AI-based strategies address smallinteraction strength (i.e., t 6 3). Furthermore, in order to demon-strate the capability of HSS, we also extend all the sub-strength sof the system configurations with higher strength configuration(t P 6). The details of the experiments are as follows:
(i) Experiment 1 – VCA (N, 2, 315, {C}). Newly extended sub-strength configurations {C} are CA (7, 37), CA (8, 38), CA (9,39), CA (10, 310), CA (11, 311), CA (12, 312), CA (13, 313), andCA (14, 314).
(ii) Experiment 2 – VCA (N, 2, 43 53 62, {C}). Newly extendedsub-strength configuration {C} is CA (7, 43 53 62).
(iii) Experiment 3 – VCA (N, 2, 320 102, {C}). Newly extended sub-strength configurations {C} are CA (7, 37), CA (8, 38), CA (9,39), CA (10, 310), CA (11, 311), CA (12, 312), CA (13, 313), CA(14, 314), and CA (15, 315).
(iv) Experiment 4 – VCA (N, 3, 315, {C}). Newly extended sub-strength configurations {C} are CA (8, 38), CA (9, 39), CA(10, 310), CA (11, 311), CA (12, 312), CA (13, 313), and CA(14, 314).
(v) Experiment 5 – VCA (N, 3, 41 37 22, {C}). Newly extendedsub-strength configurations {C} are CA (6, 41 35), CA (7, 41
36), CA (8, 41 37), and CA (9, 41 37 21).(vi) Experiment 6 – VCA (N, 2, 101 91 81 71 61 51 41 31 21, {C}).
Newly extended sub-strength configurations {C} are CA (7,81 71 61 51 41 31 21), and CA (8, 91 81 71 61 51 41 31 21).
Tables 8–13 highlight the results of the six experiments.Based on Tables 8–13, two general observations can be
highlighted. First, AI-based strategies generally outperform the purecomputational-based strategies. This observation is expectedbecause AI-based strategies are known to be good optimizationalgorithms. Second, depending on the defined strengths,

564 A.R.A. Alsewari, K.Z. Zamli / Information and Software Technology 54 (2012) 553–568
parameters, and values, HSS is able to address high interactionstrength (i.e., up to t = 15). In contrast, the existing AI-based strate-gies often support low interaction strength (i.e., with ACS, and SAstrategies generate test suites with interaction strength t 6 3) andVS-PSTG generates test suites with interaction strength (i.e., t 6 6).
Referring to the system configuration VCA (N, 2, 315, {C}) in Ta-ble 8, SA regularly generates the most optimal results for low inter-action values (i.e., t 6 3). However, SA only partially supports theconfiguration of interests. HSS, VS-PSTG, and ACS obtain competi-tive results either equal or close to that of SA. On a positive note,HSS appears to outperform most other AI counter parts for t > 3.Concerning pure computational based strategies, TVG, IPOG,
Table 10Test size for variable-strength system configuration VCA (N, 2, 320 102, {C}).
{C} AI-based strategies
HSS best HSS avg. VS-PSTG ACS SA
Ø 106 107.1 102 100 10CA (3, 320) 109 109.6 105 100 10CA (3, 320, 102) 450 451.2 481 396 30CA (4, 33, 101) 270 273 270 NS NSCA (5, 33, 102) 2700 2702.5 2700 NS NSCA (6, 34, 102) 8100 8100 8100 NS NSCA(7, 37) 2187 2187 NS NS NSCA(8, 38) 6561 6561 NS NS NSCA(9, 39) 19,683 19,683 NS NS NSCA(10, 310) 59,049 59053.2 NS NS NSCA(11, 311) 177,147 177,147 NS NS NSCA(12, 312) 531,441 531,441 NS NS NSCA(13, 313) 1,594,323 1,594,326 NS NS NSCA(14, 314) 4,782,969 4782970.1 NS NS NSCA(15, 315) 1,4348,907 14348910.1 NS NS NS
Table 11Test size for variable-strength system configuration VCA (N, 3, 315, {C}).
{C} AI-based strategies
HSS best HSS avg. VS-PSTG ACS
Ø 75 75 75 NSCA (4, 34) 87 87 91 NSCA (4, 34)2 90 90 91 NSCA (4, 34)3 91 91 91 NSCA (4, 34)3 CA(3, 33) 89 89 90 NSCA (5, 35) 243 243 243 NSCA (5, 35)2 243 243 245 NSCA (5, 35)3 245 245 245 NSCA (6, 36) 729 729 729 NSCA (6, 36)2 729 729 734 NSCA(7, 37) 2187 2187 NS NSCA (6, 36)2 CA(3, 33) 729 729 734 NSCA (4, 35) 112 112 114 NSCA (5, 36) 309 309.5 314 NSCA (6, 37) 888 888 1002 NSCA (4, 37) 159 160.1 159 NSCA (4, 39) 199 199.8 195 NSCA (4, 311) 242 243 226 NSCA (4, 315) 323 325 284 NSCA (5, 37) 448 449.4 437 NSCA (5, 38) 516 516 516 NSCA (6, 38) 1430 1430.5 1396 NSCA (6, 39) 1739 1739.3 1690 NSCA (3, 34) CA (4, 35) CA (5, 36) 312 312 312 NSCA(8, 38) 6561 6561 NS NSCA(9, 39) 19,683 19,683 NS NSCA(10, 310) 59,049 59,049 NS NSCA(11, 311) 177,147 177,147 NS NSCA(12, 312) 531,441 531,441 NS NSCA(13, 313) 1,594,323 1,594,323 NS NSCA(14, 314) 4,782,969 4,782,969 NS NS
ParaOrder, and Density generate satisfactory results most of thetime. WHITCH and PICT generally generate poor results.
As for the configuration system VCA (N, 2, 43 53 62, {C}) in Table9, SA, HSS, VS-PSTG and ACS generate identical test suite size formost configurations involving low interaction strength (i.e.,t 6 3). HSS outperforms all AI strategies for interaction strengthvalues (i.e., t > 3). TVG, IPOG, Density, and ParaOrder also generateoptimal results in some specific cases. WHITCH and PICT generallygenerate poor results.
In the case of the system configuration VCA (N, 2, 320 102, {C}) inTable 10, SA and ACS consistently produce optimal result forlow interaction values (i.e., t 6 3). HSS and VS-PSTG generate
Pure computational-based strategies
PICT TVG Density ParaOrder IPOG WHITCH
0 100 101 100 100 101 NA0 940 103 100 103 100 NA4 423 423 401 442 NS NA
810 270 NA NA 273 NANA 2700 NA NA 2700 NANA 8100 NA NA 8100 NANA NA NA NA NS NANA NA NA NA NS NANA NA NA NA NS NANA NA NA NA NS NANA NA NA NA NS NANA NA NA NA NS NANA NA NA NA NS NANA NA NA NA NS NANA NA NA NA NS NA
Pure computational-based strategies
SA PICT TVG Density ParaOrder IPOG WHITCH
NS 83 84 NA NA 82 75NS 1507 93 NA NA 87 129NS 19,749 97 NA NA 91 183NS 531,441 97 NA NA 106 237NS NA 98 NA NA 106 237NS 5366 244 NA NA 243 273NS 177,300 245 NA NA 250 459NS NA 245 NA NA 261 645NS 12,609 729 NA NA 729 759NS NA 730 NA NA 744 1431NS NA NA NA NA NS NANS NA 730 NA NA 744 1431NS 1793 118 NA NA 119 151NS 5387 323 NA NA 337 287NS 16,792 1018 NA NA 1215 1044NS 2781 168 NA NA 183 219NS 3095 214 NA NA 227 289NS 2824 256 NA NA 259 354NS NS 327 NA NA NS 498NS 7475 471 NA NA 713 481NS 8690 556 NA NA 714 620NS 22,833 1479 NA NA 2108 1513NS 26,725 1840 NA NA 2124 1964NS NA 331 NA NA 419 312NS NA NA NA NA NS NANS NA NA NA NA NS NANS NA NA NA NA NS NANS NA NA NA NA NS NANS NA NA NA NA NS NANS NA NA NA NA NS NANS NA NA NA NA NS NA

Table 12Test size for variable-strength system configuration VCA (N, 3, 41 37 22, {C}).
{C} AI-based strategies Pure computational-based strategies
HSS best HSS avg. VS-PSTG ACS SA PICT TVG Density ParaOrder IPOG WHITCH
Ø 66 66.8 65 NS NS 72 70 NA NA 73 112CA (4, 41 33) 108 108 108 NS NS 1377 111 NA NA 108 193CA (4, 41 33) CA (4, 34) 108 108 108 NS NS 17,496 112 NA NA 108 253CA (4, 41 33) CA (6, 34 22) 324 324 324 NS NS NS 324 NA NA 326 497CA (4, 41 34) 133 133.1 136 NS NS 1500 141 NA NA 149 217CA (4, 41 35) 170 170 171 NS NS 1547 183 NA NA 207 226CA (4, 41 34) CA (5, 33 22) 122 122.8 136 NS NS NS 141 NA NA 149 307CA (5, 41 34) 324 324 324 NS NS 3586 325 NA NA 324 369CA (5, 41 34) CA (5, 33 22) 324 324 324 NS NS NS 325 NA NA 324 482CA(6, 41 35) 972 972.2 NS NS NS NA NA NA NA NA NSCA(7, 41 36) 2916 2916 NS NS NS NA NA NA NA NS NSCA(8, 41 37) 8748 8748 NS NS NS NA NA NA NA NS NSCA(9, 41 37 21) 17,496 17,496 NS NS NS NA NA NA NA NS NS
Table 13Test size for variable-strength system configuration VCA (N, 2, 101 91 81 71 61 51 41 31 21{C}).
{C} AI-based strategies Pure computational-based strategies
HSS best HSS avg. VS-PSTG ACS SA PICT TVG Density ParaOrder IPOG WHITCH
94 94.6 97 NA NA 102 99 NA NA 91 119CA (3, 101 91 81) 720 720 720 NA NA 31,256 720 NA NA 720 765CA (3, 71 61 51) 210 210 210 NA NA 19,515 210 NA NA 221 301CA (3, 41 31 21) 94 94.7 97 NA NA 2397 99 NA NA 91 140CA (3, 101 91 81 71) 740 740 742 NA NA 22,878 784 NA NA 772 806CA (3, 101 91 81) 720 720.6 720 NA NA NA 720 NA NA 720 947CA (3, 71 61 51)CA (3, 101 91 81) 5040 5040 5040 NA NA NA 5040 NA NA 5041 5803CA (6, 71 61 51 41 31 21)CA (3, 101 91 81) 720 720 720 NA NA NA 720 NA NA 720 968CA (3, 71 61 51)CA (3, 41 31 21)CA (4, 51 41 31 21) 120 120.2 120 NA NA 1200 123 NA NA 142 237CA (5, 101 91 41 31 21) 2160 2160 2160 NA NA 124,157 2160 NA NA 2160 2276CA (6, 71 61 51 41 31 21) 5040 5040 5040 NA NA NA 5040 NA NA 5041 5157CA (7, 81 71 61 51 41 31 21) 40,320 40,320 NS NA NA NA NA NA NA NS NACA (8, 91 81 71 61 51 41 31 21) 322,560 322,560 NS NA NA NA NA NA NA NS NA
Table 14Benchmarking HSS Constraints with Other Strategies.
No. CCA AI-based Strategies Pure Computational-based Strategies
HSS best HSS avg. SA_SAT mATEG_SAT PICT TestCover
1 CCA(N, 2,33,F{}) 9 9 9 9 10 9F = {(x,2,0)(x,1,0)(0,x,1)(2,3,x)(2,x,2)(1,2,2)} 10 10 10 10 10 10
2 CCA(N, 2,43,F{}) 16 16 16 16 17 16F = {(0,1,x)(2,x,3)(3,3,0)(2,1,x)} 16 16 17 17 19 17
3 CCA(N, 2,53,F{}) 25 25 25 25 26 25F = {(1,1,x),(4,x,2),(4,x,4),(4,3,1),(4,2,x),(1,3,x)} 26 26 26 26 27 30
4 CCA(N, 2,63,F{}) 36 36.5 36 37 39 36F = {(3,5,x),(x,3,4),(2,0,x),(x,1,2),(3,x,1),(x,3,1),(5,4,4)} 36 36.4 36 37 39 38
5 CCA(N, 2,73,F{}) 49 49.7 49 52 55 49F = {(x,0,5),(5,5,3),(4,x,0),(6,4,x),(1,4,x),(6,3,x)} 51 51.2 52 52 56 54
6 CCA(N, 3,54,F{}) 138 138.9 127 143 151 NSF = {(3,x,2,1),(x.1,x,4),(2,3,x,x),(1,x,3,x)} 139 139.4 140 138 143 NS
7 CCA(N, 3,64,F{}) 240 241 222 247 260 NSF = {(4,x,x,2),(x,x,3,1),(x,2,x,2),(x,1,2,x)} 238 239 251 241 250 NS
8 CCA(N, 3,74,F{}) 377 378.2 351 395 413 NSF = {(x,2,6,x),(x,5,6,x),(x,4,2,x),(x,0,1,5),(x,x,2,4),(2,x,6,x)} 377 377.9 438 383 401 NS
9 CCA(N, 4,35,F{}) 89 89.3 NS NS NS NSF = {(1,1,1,1,x),(x,0,0,0,0)} 97 97.2 NS NS NS NS
A.R.A. Alsewari, K.Z. Zamli / Information and Software Technology 54 (2012) 553–568 565
HSS
vs.d
ensi
tyH
SSvs
.Par
aOrd
erH
SSvs
.IPO
GH
SSvs
.WH
ITC
H
5;R
ejec
tH
0,w
ith
w�¼
10;w� a¼
10;
w�6
w� a
Rej
ect
H0,w
ith
w�¼
1;w� a¼
8;w�6
w� a
Rej
ect
H0,w
ith
w�¼
0;w� a¼
21;
w�6
w� a
Rej
ect
H0,w
ith
w�¼
0;w� a¼
47;
w�6
w� a
;
No
enou
ghda
tafo
rD
ensi
tyR
ejec
tH
0,w
ith
w�¼
0;w� a¼
2;w�6
w� a
Rej
ect
H0,w
ith
w�¼
0;w� a¼
10;
w�6
w� a
Rej
ect
H0,w
ith
w�¼
0;w� a¼
30;
w�6
w� a
aN
oen
ough
data
for
Den
sity
No
enou
ghda
tafo
rPa
raO
rder
No
enou
ghda
tafo
rIP
OG
No
enou
ghda
tafo
rW
HIT
CH
7;N
oda
tafo
rD
ensi
tyN
oda
tafo
rPa
raO
rder
Rej
ect
H0,w
ith
w�¼
0;w� a¼
53;
w�6
w� a
Rej
ect
H0,w
ith
w�¼
1;w� a¼
60;
w�6
w� a
;
No
data
for
Den
sity
No
data
for
Para
Ord
erR
ejec
tH
0,w
ith
w�¼
0;w� a¼
0;w�6
w� a
Rej
ect
H0,w
ith
w�¼
0;w� a¼
8;w�6
w� a
No
data
for
Den
sity
No
data
for
Para
Ord
erC
ann
otre
ject
H0,
wit
hw�¼
7;w� a¼
3;w�>
w� a
Rej
ect
H0,w
ith
w�¼
0;w� a¼
13;
w�6
w� a
566 A.R.A. Alsewari, K.Z. Zamli / Information and Software Technology 54 (2012) 553–568
acceptable results for low strength; however, they generate themost optimal result for higher strength. As expected, only HSS ad-dresses high interaction strength (i.e., 6 6 t 6 15). IPOG does notsupport interaction strength more than t = 6 (i.e., t 6 6). No pub-lished result is available for WHITCH.
For the system configuration VCA (N, 3, 315, {C}) given in Table11, HSS generally outperforms all other existing strategies.VS-PSTG also produces optimal results in some of the sub-configu-rations, particularly for (i.e., 4 6 t 6 6). TVG and WHITCH give com-petitive results. PICT has non-optimal results. No published resultsare available for SA, ACS (i.e., they do not support the interactionstrength t > 3 for most sub-configurations), Density, and ParaOrder.
Referring to the system configuration VCA (N, 3, 41 37 22, {C}) inTable 12, HSS outperforms all other existing strategies. IPOG andVS-PSTG also produce matching optimal results with HSS in someof the sub-configurations. TVG and WHITCH give competitive re-sults, where as PICT produces the worst overall result. Similar toearlier experiments, no published results are available for SA,ACS, Density, and ParaOrder.
Concerning the final system configuration VCA (N, 2, 101 91 81
71 61 51 41 31 21{C}) given in Table 13, in most cases, HSS outper-forms all other existing strategies. Here, VS-PSTG, TVG, and IPOGalso produce comparable optimal results in many sub-configura-tions. WHITCH produces competitive results, where as PICT consis-tently generates poor overall results. As for SA, ACS, Density andParaOrder, no published results are available.
Pure
com
puta
tion
al-b
ased
stra
tegi
es
HSS
vs.S
AH
SSvs
.PIC
TH
SSvs
.TV
G
tH
0,w
ith
¼0;
Can
not
reje
ctH
0,w
ith
w�¼
28;w� a¼
3;w�>
w� a
Rej
ect
H0,w
ith
w�¼
0;w� a¼
47;
w�6
w� a
Rej
ect
H0,w
ith
w�¼
0;w� a¼
2w�6
w� a
ata
No
enou
ghda
tafo
rSA
Rej
ect
H0,w
ith
w�¼
2;w� a¼
30;
w�6
w� a
Rej
ect
H0,w
ith
w�¼
0;w� a¼
2w�6
w� a
ata
No
enou
ghda
tafo
rSA
Can
not
reje
ctH
0,w
ith
w�¼
3;w� a¼
0;w�>
w� a
No
enou
ghda
tfo
rTV
G
AC
SN
oda
tafo
rSA
Rej
ect
H0,w
ith
w�¼
0;w� a¼
41;
w�6
w� a
Rej
ect
H0,w
ith
w�¼
0;w� a¼
6w�6
w� a
AC
SN
oda
tafo
rSA
Rej
ect
H0,w
ith
w�¼
0;w� a¼
2;w�6
w� a
Rej
ect
H0,w
ith
w�¼
0;w� a¼
5w�6
w� a
AC
SN
oda
tafo
rSA
Rej
ect
H0,w
ith
w�¼
0;w� a¼
3;w�6
w� a
No
enou
ghda
tafo
r
7.2. Benchmarking with constraint supporting strategiesIn this section, we benchmark HSS with other existing strategiesthat support constraints based on the results published in theworks by Cohen et al. [34]. Here, SA_SAT is the only AI-based strat-egy, while the others (e.g., PICT, TestCover, and mAETG_SAT) arepure computational-based strategies. Notably, although TestCoverand mAETG_SAT address the support for constraints, they do notsupport variable-strength t-way generation. Furthermore, notmuch information is available on their benchmarking results inthe literature. For these reason, they are not considered in our ear-lier variable-strength experiments.
Table 14 highlights the overall results.As Table 14 shows, HSS outperforms most other existing strat-
egies as far as addressing constraints support is concerned. SA_SAT,mAETG_SAT, and TestCover also produce optimal results in somesystem configurations. PICT produces the worst overall results.Also notably, most existing strategies support constraints forstrength t 6 3, and HSS has the potential to address high interac-tion strength.
Tabl
e15
Wilc
oxon
sign
ed-r
ank
test
for
pair
test
size
com
pari
son.
Wilc
oxon
test
sA
I-ba
sed
stra
tegi
es
HSS
vs.V
S-PS
TGH
SSvs
.AC
S
Expe
rim
enta
lre
sult
sfr
omTa
ble
8C
ann
otre
ject
H0,w
ith
w�¼
17;w� a¼
5;w�>
w� a
Can
not
reje
cw�¼
15;w� a
w�>
w� a
Expe
rim
enta
lre
sult
sfr
omTa
ble
9N
oen
ough
data
for
VS-
PSTG
No
enou
ghd
for
AC
S
Expe
rim
enta
lre
sult
sfr
omTa
ble
10N
oen
ough
data
for
VS-
PSTG
No
enou
ghd
for
AC
S
Expe
rim
enta
lre
sult
sfr
omTa
ble
11C
ann
otre
ject
H0,w
ith
w�¼
65;w� a¼
30;
w�>
w� a
No
data
for
Expe
rim
enta
lre
sult
sfr
omTa
ble
12N
oen
ough
data
for
VS-
PSTG
No
data
for
Expe
rim
enta
lre
sult
sfr
omTa
ble
13N
oen
ough
data
for
VS-
PSTG
No
data
for
8. Statistical analysis
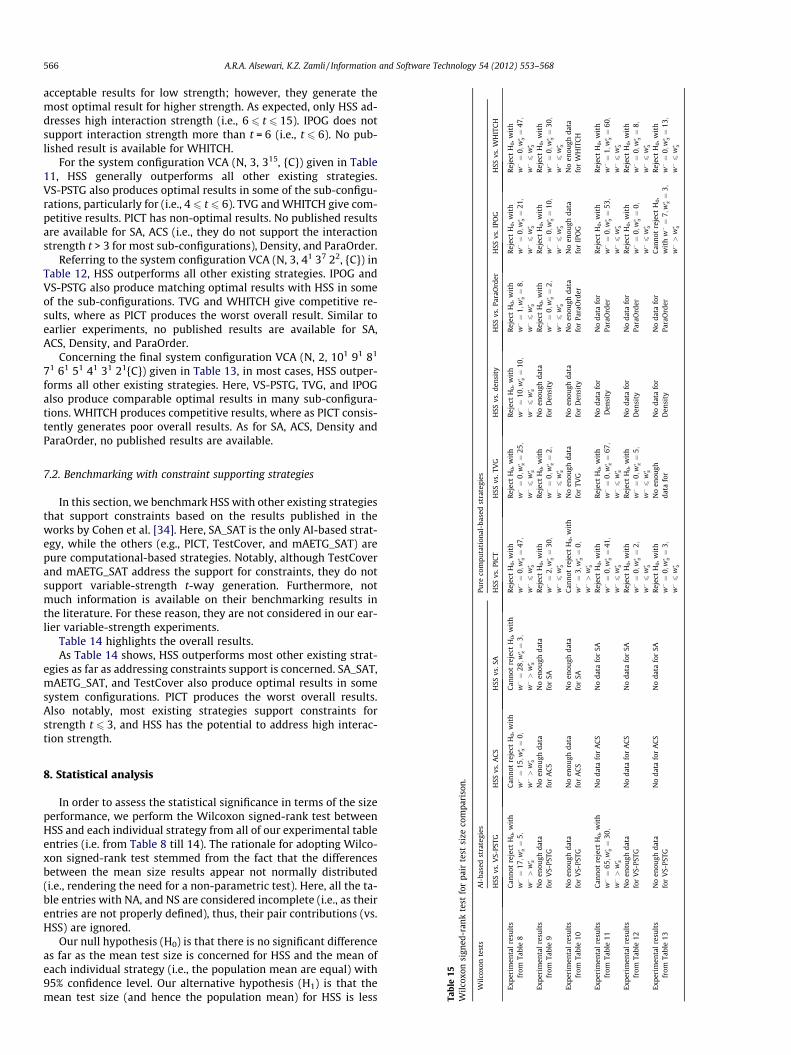
In order to assess the statistical significance in terms of the sizeperformance, we perform the Wilcoxon signed-rank test betweenHSS and each individual strategy from all of our experimental tableentries (i.e. from Table 8 till 14). The rationale for adopting Wilco-xon signed-rank test stemmed from the fact that the differencesbetween the mean size results appear not normally distributed(i.e., rendering the need for a non-parametric test). Here, all the ta-ble entries with NA, and NS are considered incomplete (i.e., as theirentries are not properly defined), thus, their pair contributions (vs.HSS) are ignored.
Our null hypothesis (H0) is that there is no significant differenceas far as the mean test size is concerned for HSS and the mean ofeach individual strategy (i.e., the population mean are equal) with95% confidence level. Our alternative hypothesis (H1) is that themean test size (and hence the population mean) for HSS is less
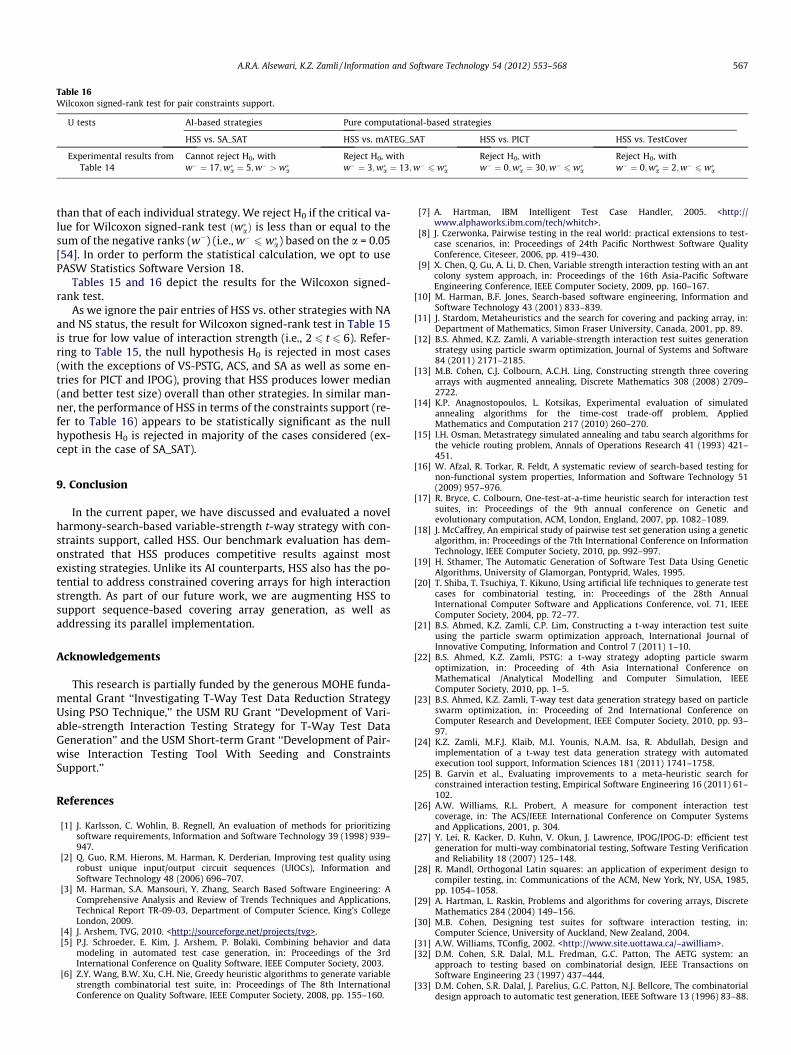
Table 16Wilcoxon signed-rank test for pair constraints support.
U tests AI-based strategies Pure computational-based strategies
HSS vs. SA_SAT HSS vs. mATEG_SAT HSS vs. PICT HSS vs. TestCover
Experimental results fromTable 14
Cannot reject H0, withw� ¼ 17;w�a ¼ 5;w� > w�a
Reject H0, withw� ¼ 3;w�a ¼ 13;w� 6 w�a
Reject H0, withw� ¼ 0;w�a ¼ 30;w� 6 w�a
Reject H0, withw� ¼ 0;w�a ¼ 2;w� 6 w�a
A.R.A. Alsewari, K.Z. Zamli / Information and Software Technology 54 (2012) 553–568 567
than that of each individual strategy. We reject H0 if the critical va-lue for Wilcoxon signed-rank test ðw�aÞ is less than or equal to thesum of the negative ranks (w�) (i.e., w� 6 w�a) based on the a = 0.05[54]. In order to perform the statistical calculation, we opt to usePASW Statistics Software Version 18.
Tables 15 and 16 depict the results for the Wilcoxon signed-rank test.
As we ignore the pair entries of HSS vs. other strategies with NAand NS status, the result for Wilcoxon signed-rank test in Table 15is true for low value of interaction strength (i.e., 2 6 t 6 6). Refer-ring to Table 15, the null hypothesis H0 is rejected in most cases(with the exceptions of VS-PSTG, ACS, and SA as well as some en-tries for PICT and IPOG), proving that HSS produces lower median(and better test size) overall than other strategies. In similar man-ner, the performance of HSS in terms of the constraints support (re-fer to Table 16) appears to be statistically significant as the nullhypothesis H0 is rejected in majority of the cases considered (ex-cept in the case of SA_SAT).
9. Conclusion
In the current paper, we have discussed and evaluated a novelharmony-search-based variable-strength t-way strategy with con-straints support, called HSS. Our benchmark evaluation has dem-onstrated that HSS produces competitive results against mostexisting strategies. Unlike its AI counterparts, HSS also has the po-tential to address constrained covering arrays for high interactionstrength. As part of our future work, we are augmenting HSS tosupport sequence-based covering array generation, as well asaddressing its parallel implementation.
Acknowledgements
This research is partially funded by the generous MOHE funda-mental Grant ‘‘Investigating T-Way Test Data Reduction StrategyUsing PSO Technique,’’ the USM RU Grant ‘‘Development of Vari-able-strength Interaction Testing Strategy for T-Way Test DataGeneration’’ and the USM Short-term Grant ‘‘Development of Pair-wise Interaction Testing Tool With Seeding and ConstraintsSupport.’’
References
[1] J. Karlsson, C. Wohlin, B. Regnell, An evaluation of methods for prioritizingsoftware requirements, Information and Software Technology 39 (1998) 939–947.
[2] Q. Guo, R.M. Hierons, M. Harman, K. Derderian, Improving test quality usingrobust unique input/output circuit sequences (UIOCs), Information andSoftware Technology 48 (2006) 696–707.
[3] M. Harman, S.A. Mansouri, Y. Zhang, Search Based Software Engineering: AComprehensive Analysis and Review of Trends Techniques and Applications,Technical Report TR-09-03, Department of Computer Science, King’s CollegeLondon, 2009.
[4] J. Arshem, TVG, 2010. <http://sourceforge.net/projects/tvg>.[5] P.J. Schroeder, E. Kim, J. Arshem, P. Bolaki, Combining behavior and data
modeling in automated test case generation, in: Proceedings of the 3rdInternational Conference on Quality Software, IEEE Computer Society, 2003.
[6] Z.Y. Wang, B.W. Xu, C.H. Nie, Greedy heuristic algorithms to generate variablestrength combinatorial test suite, in: Proceedings of The 8th InternationalConference on Quality Software, IEEE Computer Society, 2008, pp. 155–160.
[7] A. Hartman, IBM Intelligent Test Case Handler, 2005. <http://www.alphaworks.ibm.com/tech/whitch>.
[8] J. Czerwonka, Pairwise testing in the real world: practical extensions to test-case scenarios, in: Proceedings of 24th Pacific Northwest Software QualityConference, Citeseer, 2006, pp. 419–430.
[9] X. Chen, Q. Gu, A. Li, D. Chen, Variable strength interaction testing with an antcolony system approach, in: Proceedings of the 16th Asia-Pacific SoftwareEngineering Conference, IEEE Computer Society, 2009, pp. 160–167.
[10] M. Harman, B.F. Jones, Search-based software engineering, Information andSoftware Technology 43 (2001) 833–839.
[11] J. Stardom, Metaheuristics and the search for covering and packing array, in:Department of Mathematics, Simon Fraser University, Canada, 2001, pp. 89.
[12] B.S. Ahmed, K.Z. Zamli, A variable-strength interaction test suites generationstrategy using particle swarm optimization, Journal of Systems and Software84 (2011) 2171–2185.
[13] M.B. Cohen, C.J. Colbourn, A.C.H. Ling, Constructing strength three coveringarrays with augmented annealing, Discrete Mathematics 308 (2008) 2709–2722.
[14] K.P. Anagnostopoulos, L. Kotsikas, Experimental evaluation of simulatedannealing algorithms for the time-cost trade-off problem, AppliedMathematics and Computation 217 (2010) 260–270.
[15] I.H. Osman, Metastrategy simulated annealing and tabu search algorithms forthe vehicle routing problem, Annals of Operations Research 41 (1993) 421–451.
[16] W. Afzal, R. Torkar, R. Feldt, A systematic review of search-based testing fornon-functional system properties, Information and Software Technology 51(2009) 957–976.
[17] R. Bryce, C. Colbourn, One-test-at-a-time heuristic search for interaction testsuites, in: Proceedings of the 9th annual conference on Genetic andevolutionary computation, ACM, London, England, 2007, pp. 1082–1089.
[18] J. McCaffrey, An empirical study of pairwise test set generation using a geneticalgorithm, in: Proceedings of the 7th International Conference on InformationTechnology, IEEE Computer Society, 2010, pp. 992–997.
[19] H. Sthamer, The Automatic Generation of Software Test Data Using GeneticAlgorithms, University of Glamorgan, Pontyprid, Wales, 1995.
[20] T. Shiba, T. Tsuchiya, T. Kikuno, Using artificial life techniques to generate testcases for combinatorial testing, in: Proceedings of the 28th AnnualInternational Computer Software and Applications Conference, vol. 71, IEEEComputer Society, 2004, pp. 72–77.
[21] B.S. Ahmed, K.Z. Zamli, C.P. Lim, Constructing a t-way interaction test suiteusing the particle swarm optimization approach, International Journal ofInnovative Computing, Information and Control 7 (2011) 1–10.
[22] B.S. Ahmed, K.Z. Zamli, PSTG: a t-way strategy adopting particle swarmoptimization, in: Proceeding of 4th Asia International Conference onMathematical /Analytical Modelling and Computer Simulation, IEEEComputer Society, 2010, pp. 1–5.
[23] B.S. Ahmed, K.Z. Zamli, T-way test data generation strategy based on particleswarm optimization, in: Proceeding of 2nd International Conference onComputer Research and Development, IEEE Computer Society, 2010, pp. 93–97.
[24] K.Z. Zamli, M.F.J. Klaib, M.I. Younis, N.A.M. Isa, R. Abdullah, Design andimplementation of a t-way test data generation strategy with automatedexecution tool support, Information Sciences 181 (2011) 1741–1758.
[25] B. Garvin et al., Evaluating improvements to a meta-heuristic search forconstrained interaction testing, Empirical Software Engineering 16 (2011) 61–102.
[26] A.W. Williams, R.L. Probert, A measure for component interaction testcoverage, in: The ACS/IEEE International Conference on Computer Systemsand Applications, 2001, p. 304.
[27] Y. Lei, R. Kacker, D. Kuhn, V. Okun, J. Lawrence, IPOG/IPOG-D: efficient testgeneration for multi-way combinatorial testing, Software Testing Verificationand Reliability 18 (2007) 125–148.
[28] R. Mandl, Orthogonal Latin squares: an application of experiment design tocompiler testing, in: Communications of the ACM, New York, NY, USA, 1985,pp. 1054–1058.
[29] A. Hartman, L. Raskin, Problems and algorithms for covering arrays, DiscreteMathematics 284 (2004) 149–156.
[30] M.B. Cohen, Designing test suites for software interaction testing, in:Computer Science, University of Auckland, New Zealand, 2004.
[31] A.W. Williams, TConfig, 2002. <http://www.site.uottawa.ca/~awilliam>.[32] D.M. Cohen, S.R. Dalal, M.L. Fredman, G.C. Patton, The AETG system: an
approach to testing based on combinatorial design, IEEE Transactions onSoftware Engineering 23 (1997) 437–444.
[33] D.M. Cohen, S.R. Dalal, J. Parelius, G.C. Patton, N.J. Bellcore, The combinatorialdesign approach to automatic test generation, IEEE Software 13 (1996) 83–88.
568 A.R.A. Alsewari, K.Z. Zamli / Information and Software Technology 54 (2012) 553–568
[34] M.B. Cohen, M.B. Dwyer, J. Shi, Interaction testing of highly-configurablesystems in the presence of constraints, in: Proceeding of InternationalSymposium on Software Testing and Analysis, ACM, London, UK, 2007, pp.129–139.
[35] D. Pallas, Jenny, 2003. <http://www.burtleburtle.net/bob/math>.[36] Keith, H. Doug, PICT, 2006. <http://testmuse.wordpress.com/2006/04/05/pict-
tool-available/2006>.[38] Y. Lei, K.C. Tai, In-parameter-order: a test generation strategy for pairwise
testing, in: Proceedings of The 3rd IEEE International Symposium on High-Assurance Systems Engineering, Washington, DC, USA, 1998, pp. 254–261.
[39] M. Forbes, J. Lawrence, Y. Lei, R.N. Kacker, D.R. Kuhn, Refining the in-parameter-order strategy for constructing covering arrays, Journal of Researchof the National Institute of Standards and Technology 113 (2008) 287–297.
[40] M.I. Younis, K.Z. Zamli, MC-MIPOG: a parallel t-way test generation strategyfor multicore systems, ETRI Journal 32 (2010).
[41] NIST, ACTS, 2010. <http://csrc.nist.gov/acts>.[42] C.A. Floudas, P.M. Pardalos, C.S. Adjiman, W.R. Esposito, Z.H. Gümüs, S.T.
Harding, J.L. Klepeis, C.A. Meyer, C.A. Schweiger, Handbook of Test Problems inLocal and Global Optimization, Kluwer Academic Publishers, Dordrecht, 1999.
[43] M.I. Younis, K.Z. Zamli, ITTW: T-way minimization strategy based onintersection of tuples, in: Proceeding of IEEE Symposium on IndustrialElectronics & Applications, IEEE Computer Society, 2009, pp. 221–226.
[44] P. Angeline, Evolutionary optimization versus particle swarm optimization:philosophy and performance differences, in: Proceedings of the 7thInternational Conference on Evolutionary Programming VII, Springer, Berlin/Heidelberg, San Diego, USA, 1998, pp. 601–610.
[45] A. Kaveh, S. Talatahari, Particle swarm optimizer, ant colony strategy andharmony search scheme hybridized for optimization of truss structures,Computers & Structures 87 (2009) 267–283.
[46] Z.W. Geem, C.-L. Tseng, Y. Park, Harmony search for generalized orienteeringproblem: best touring in China, Lecture Notes in Computer Science 3612(2005) 741–750.
[47] Z.W. Geem, J.H. Kim, A new heuristic optimization algorithm: harmony search,Simulation 76 (2001) 60–68.
[48] M.G.H. Omran, M. Mahdavi, Global-best harmony search, AppliedMathematics and Computation 198 (2008) 643–656.
[49] J.H. Kim, Z.W. Geem, E.S. Kim, Parameter estimation of the nonlinearMuskingum model using harmony search, Journal of the American WaterResources Association 37 (2001) 1131–1138.
[50] K.S. Lee, Z.W. Geem, A new structural optimization method based on theharmony search algorithm, Computers & Structures 82 (2004) 781–798.
[51] Z.W. Geem, K.S. Lee, Y. Park, Application of harmony search to vehicle routing,American Journal of Applied Sciences 2 (2005) 1552–1557.
[52] Z.W. Geem, J.Y. Choi, Music composition using harmony search algorithm,Applications of Evolutionary Computing 4448 (2007) 593–600.
[53] M. Mahdavi, M. Fesanghary, E. Damangir, An improved harmony searchalgorithm for solving optimization problems, Applied Mathematics andComputation 188 (2007) 1567–1579.
[54] D.C. Montgomery, G.C. Runger, Applied Statistics and Probability for Engineers,4th ed., John Wiley and Sons, 2007.
[55] G. Sherwood, 2006. TestCover. <http://testcover.com/pub/constex.php>.
Related Documents