www.wjpr.net Vol 8, Issue 9, 2019. 263 DESIGN AND DEVELOPMENT OF SELF EMULSIFYING DRUG DELIVERY SYSTEM OF MARAVIROC Patel Rajendra*, Patel Dr. Arun, Patel Shailendra, Dwivedi Neelesh and Patel Bhavesh Department of Pharmaceutics, Shri Ram Group of Institutions Faculty of Pharmacy, Near Iti Madhotal, Jabalpur. (M.P.). ABSTRACT Self emulsifying drug delivery systems (SEDDS) are isotropic mixtures of natural or synthetic oils, solids or liquid surfactants or alternatively, one or more hydrophilic solvents, and co-solvents or co- surfactants Maraviroc SEDDS formulation when diluted with 250 times gives globule size of 110 nm and zeta potential of -5.18. There is no significant difference in globule size when diluted with medias like 0.1 N HCl and Phosphate buffer of pH 6.8). Maraviroc drug release from the SEDDS formulation was performed in 0.1 N HCl and 87.92 (± 4.78) % released within 15 minutes. In-vitro drug diffusion study in dialysis membrane showed that 80.56 ± 2.81% maraviroc diffused from the SEDDS formulation in the Phosphate buffer of pH 7.4 in five hours, whereas only 42.86 (±2.12) % released from Maraviroc suspension at the same conditions. Maraviroc SEDDS formulation can be used in the treatment of AIDS. KEYWORDS: AIDS, MARAVIROC, Self emulsifying drug delivery systems, HIV. 1 INTRODUCTION Acquired immune deficiency syndrome (AIDS) is characterized by progressive loss of the CD4C helper/inducer subset of T lymphocytes. Loss of T cells leads to severe impairment of immune function, constitutional diseases, opportunistic infections, neurological complications (AIDS dementia complex), and neoplasms that seldom occur in persons with intact immune function. [1-10] While the precise mechanisms that result in destruction of the immune system are not completely understood, an abundance of epidemiologic, virologic, World Journal of Pharmaceutical Research SJIF Impact Factor 8.074 Volume 8, Issue 9, 263-275. Review Article ISSN 2277– 7105 Article Received on 25 May 2019, Revised on 16 June 2019, Accepted on 06 July 2019 DOI: 10.20959/wjpr20199-15398 *Corresponding Author Patel Rajendra Department of Pharmaceutics, Shri Ram Group of Institutions Faculty of Pharmacy, Near Iti Madhotal, Jabalpur. (M.P.).

Welcome message from author
This document is posted to help you gain knowledge. Please leave a comment to let me know what you think about it! Share it to your friends and learn new things together.
Transcript

www.wjpr.net Vol 8, Issue 9, 2019. 263
Rajendra et al. World Journal of Pharmaceutical Research
DESIGN AND DEVELOPMENT OF SELF EMULSIFYING DRUG
DELIVERY SYSTEM OF MARAVIROC
Patel Rajendra*, Patel Dr. Arun, Patel Shailendra, Dwivedi Neelesh and Patel Bhavesh
Department of Pharmaceutics, Shri Ram Group of Institutions Faculty of Pharmacy, Near Iti
Madhotal, Jabalpur. (M.P.).
ABSTRACT
Self emulsifying drug delivery systems (SEDDS) are isotropic
mixtures of natural or synthetic oils, solids or liquid surfactants or
alternatively, one or more hydrophilic solvents, and co-solvents or co-
surfactants Maraviroc SEDDS formulation when diluted with 250
times gives globule size of 110 nm and zeta potential of -5.18. There is
no significant difference in globule size when diluted with medias like
0.1 N HCl and Phosphate buffer of pH 6.8). Maraviroc drug release
from the SEDDS formulation was performed in 0.1 N HCl and 87.92
(± 4.78) % released within 15 minutes. In-vitro drug diffusion study in
dialysis membrane showed that 80.56 ± 2.81% maraviroc diffused
from the SEDDS formulation in the Phosphate buffer of pH 7.4 in five
hours, whereas only 42.86 (±2.12) % released from Maraviroc
suspension at the same conditions. Maraviroc SEDDS formulation can be used in the
treatment of AIDS.
KEYWORDS: AIDS, MARAVIROC, Self emulsifying drug delivery systems, HIV.
1 INTRODUCTION
Acquired immune deficiency syndrome (AIDS) is characterized by progressive loss of the
CD4C helper/inducer subset of T lymphocytes. Loss of T cells leads to severe impairment of
immune function, constitutional diseases, opportunistic infections, neurological
complications (AIDS dementia complex), and neoplasms that seldom occur in persons with
intact immune function.[1-10]
While the precise mechanisms that result in destruction of the
immune system are not completely understood, an abundance of epidemiologic, virologic,
World Journal of Pharmaceutical Research SJIF Impact Factor 8.074
Volume 8, Issue 9, 263-275. Review Article ISSN 2277– 7105
Article Received on
25 May 2019,
Revised on 16 June 2019,
Accepted on 06 July 2019
DOI: 10.20959/wjpr20199-15398
*Corresponding Author
Patel Rajendra
Department of
Pharmaceutics, Shri Ram
Group of Institutions
Faculty of Pharmacy, Near
Iti Madhotal, Jabalpur.
(M.P.).
www.wjpr.net Vol 8, Issue 9, 2019. 264
Rajendra et al. World Journal of Pharmaceutical Research
and immunologic data support the conclusion that infection with HIV (human
immunodeficiency virus) is the underlying cause of AIDS.
HIV was originally designated human T lymphotropic virus (HTLV)-III, lymphadenopathy-
associated virus (LAV), or AIDS-associated retrovirus (ARV). AIDS is induced by the HIV
virus. Therefore, it is specifically referred to as HIV/AIDS because other factors such as
corticosteroids, cancer chemotherapy, and alkylating agents can also produce AIDS-like
symptoms
1.1 Structure of HIV
HIV is a lentivirus of the family Retroviridae, mostly known for being the causative agent of
AIDS.[13]
This virus can be seen as a biological nanostructure (around 100–150 nm). Its outer
envelope or coat is composed of a double layer of lipid envelope that bears numerous spikes.
Each spike is composed of four molecules of gp120 and the same number of gp41 embedded
in the membrane. Beneath the envelope is a layer of matrix protein that surrounds the core
(capsid). The capsid has a hollow, truncated cone shape and is composed of another protein,
p24 that contains the genetic material of the HIV virus. Two strands of RNA consisting of
about 9200 nucleotide bases, integrase, a protease, ribonuclease, and two other proteins, p6
and p7, fit inside the viral core.
1.2 HIV pathogenesis
After initial infection and local amplification at the mucosal site, infected cells migrate to
regional lymph nodes, leading to a mild initial viral amplification in naïve T cells (39). The
viral infection is then quickly disseminated by T cells to lymphoid organs, particularly the
gut-associated lymphoid tissues (GALT), spleen, and bone marrow, being accompanied by a
burst in the viral load (acute infection).[40]
During the acute and early stages of infection the
gastrointestinal tract is particularly affected by the virus, leading to a dramatic loss of CD4+
and CD8+ T cells which never quite recover completely and remain despite antiretroviral
treatment.[41-42]
Individuals during this acute phase pose an increased risk for sexual
transmission as result of high blood and genital viral load, with clear implications in the
prevention of HIV transmission.[43]
CD4+ cell levels recover soon after; in the case of CD8+
cells there is a rise followed by a rapid recovery of normal levels. Levels of the virus are then
down regulated in response to the intense immune response, but never completely depleted,
resulting in clinical latent and asymptomatic infection.[44]
During latency, the virus persists
particularly in extra-vascular tissues, lymph node dendritic cells and resting CD4+ memory

www.wjpr.net Vol 8, Issue 9, 2019. 265
Rajendra et al. World Journal of Pharmaceutical Research
cells. This state can evolve to a symptomatic clinical stage (usually several years after the
initial infection), designated by AIDS, which is characterized by decreased CD4+ T cell
counts and rising viral load.[13]
With the progression of infection, HIV genetic diversity
increases noticeably due to intense error-prone reverse transcription and evolutionary
pressure to evade the immune system.[36]
This new heterogeneous population dramatically
increases the generation of viruses resistant to cellular and humoral immune response, and
represents a major challenge in the development of therapy and preventative strategies.
1.3 General principles of HIV therapy
Antiretroviral therapy (ART) of HIV-1 was initiated in 1987 with the use of zidovudine
(AZT). Although it was initially hoped that HIV- 1 could be eradicated from the body, it is
now clear that virus suppression is the best that can be achieved by continuous ART. Therapy
can fail due to low adherence or the evolution of drug-resistant HIV-1 variants, while drug-
toxicity may be another reason to stop therapy. HAART aims to prevent emergence of drug-
resistant HIV-1 variants by suppressing its replication to negligible levels. Also, it is very
difficult for the virus to acquire complex combination of mutations required for multi-drug
resistance. In cases when the virus succeeds, it usually pays great fitness costs and becomes
less aggressive within the given host and less transmissible to other hosts. A major barrier to
curing HIV infection remains the ability of HIV to integrate in the host genome and remain
latent. HAART cannot completely eradicate the virus from the organism and patients have to
commit to the therapy for life.
1.4 Limitations of available therapies
Even if HAART regimens present considerable anti-HIV activity, several factors frequently
compromise its success. To begin with, current therapy is not able to provide a cure mainly
because of HIV's ability to persist in latency state in cellular and anatomical reservoir sites.
Beside this fact, problems of current antiretroviral therapy also include prolonged treatment
periods with drugs possessing important adverse effects, poor drug-regimen compliance, drug
resistance, drug–drug interactions, poor drug pharmacokinetics, viral levels rebound after
therapy cessation, and costs.
2. SELF EMULSIFYING DRUG DELIVERY SYSTEMS
Self emulsifying drug delivery systems (SEDDS) are defined as isotropic mixtures of natural
or synthetic oils, solids or liquid surfactants or alternatively, one or more hydrophilic
solvents, and co-solvents or co-surfactants.[53]
SEDDS are able to self emulsify rapidly into

www.wjpr.net Vol 8, Issue 9, 2019. 266
Rajendra et al. World Journal of Pharmaceutical Research
fine O/W emulsion in the gastrointestinal fluids, under gentle agitation provided by the
gastrointestinal tract. This fine O/W emulsion results in small droplets of oil dispersed in the
gastrointestinal fluids that provide a large interfacial area enhancing the activity and
minimizing the irritation due to contact of drug in the gut wall. Self Emulsifying System
(SES) can be formulated with little energy input and the shelf life is longer than conventional
emulsions (54, 55-58). SEDDS typically produce emulsion with a droplet size between 100 to
300nm, while self micro emulsifying drug delivery system (SMEDDS) form transparent
micro-emulsions with a drop let size of less than 50nm.
2.1 Advantages of SEDDS
1. SEDDS is novel approach to improve water solubility and ultimate bioavailability of
lipophilic drugs.
2. Many drugs show large inter-subject and intra-subject variation in absorption leading to
variable plasma profile. SEDDS produce reproducible plasma profile.
3. Fine oil droplets empty rapidly from the stomach and promote wide distribution of the
drug throughout the intestinal tract thus minimizing the irritation frequently encountered
with extended contact of drug and gut wall.
4. As compared to emulsions, which are sensitive and metastable dispersed forms, SEDDS
are physically stable formulations that are easy to manufacture.
5. SEDDS require very simple and economical manufacturing facility like simple mixture
with agitator and volumetric liquid filling equipment for large-scale manufacturing.
6. SEDDS/SMEDDS has potential to deliver peptides that are prone to enzymatic hydrolysis
in GastroI intestinal tract (GIT).[59]
3.1 PREFORMULATION STUDIES
3.1.1. Physico-chemical Characterization of Drug
Organoleptic evaluation revealed that the drug is a white crystalline powder.
3.2. Analytical method development
3.2.1. Development of spectrophotometric method for the detection of Maraviroc
Experimentally working wavelength (λ) in different medium such as methanol, 0.1N HCl,
Phosphate buffer pH 7.4 was determined & found to be 210 nm. The standard calibration
curves for Maraviroc in above mentioned medias with regression value (R2) are shown in
figure 1. The coefficient of correlation showed excellent correlation between concentration
and absorbance with the coefficient of variance (CV) in the range of 0.999 to 1. The relation

www.wjpr.net Vol 8, Issue 9, 2019. 267
Rajendra et al. World Journal of Pharmaceutical Research
between drug concentration and absorbance is linear and the curves obeys Beer-Lambert’s
law within the concentration range of 2-12 µg/ml of Maraviroc. Calibration curve of
methanol, 0.1N HCl, and Phosphate buffer pH 7.4 was used for solubility analysis of drug in
various oils & surfactants in-vitro dissolution studies and in-vitro permeation study
respectively.
Table 1: Concentration and absorbance of standard drug solutions in different media.
Sr. No Concentration
(µg/ml)
Absorbance
Methanol 0.1 N HCl PB pH 7.4
1 2 0.037 0.034 0.029
2 4 0.075 0.064 0.058
3 6 0.108 0.097 0.089
4 8 0.145 0.130 0.119
5 10 0.180 0.158 0.148
6 12 0.212 0.191 0.178
Figure 1: Regressed calibration curve of Maraviroc in methanol.
Figure 2: Regressed calibration curve of Maraviroc in 0.1N HCl.
www.wjpr.net Vol 8, Issue 9, 2019. 268
Rajendra et al. World Journal of Pharmaceutical Research
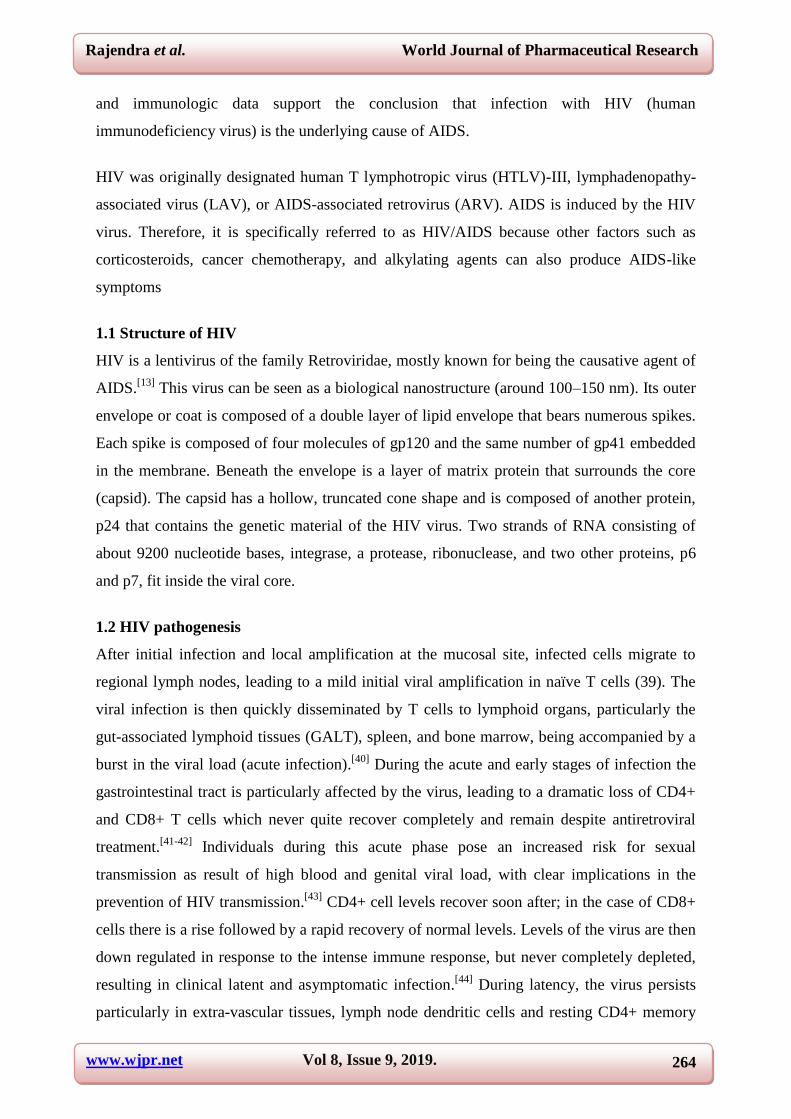
Figure 3: Regressed calibration curve of Maraviroc in Phosphate buffer pH 7.4.
Formulation of self emulsifying drug delivery system (SEDDS)
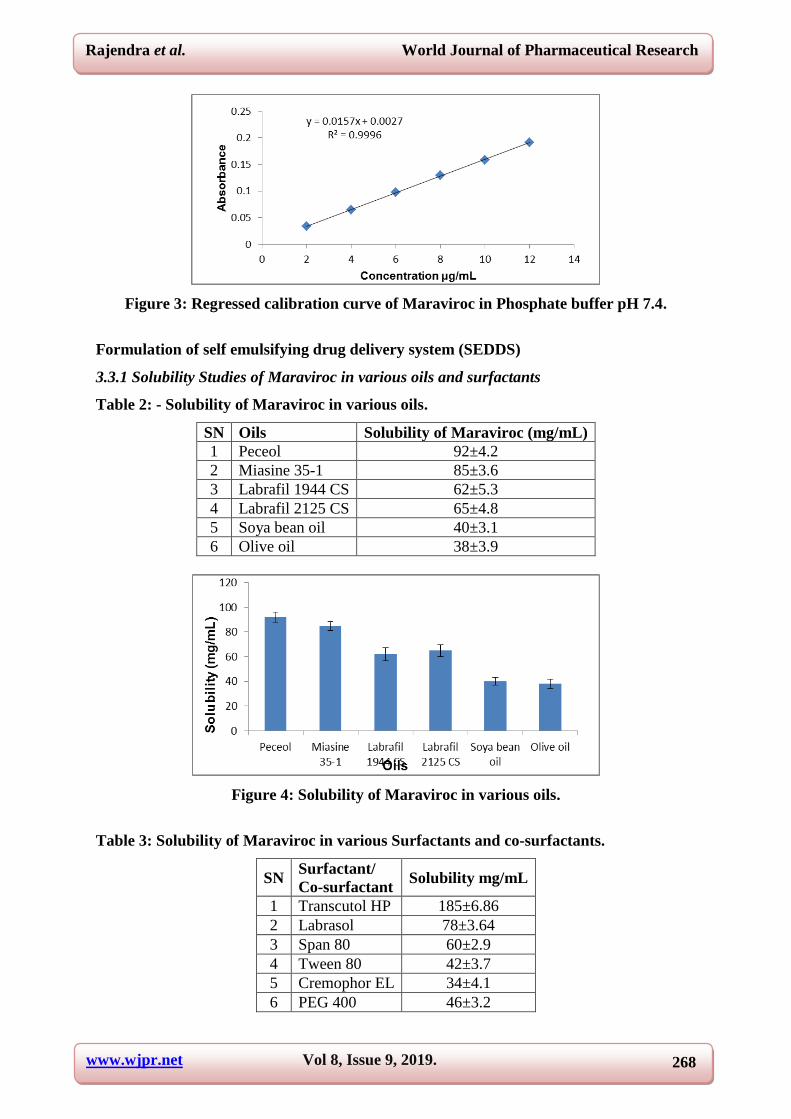
3.3.1 Solubility Studies of Maraviroc in various oils and surfactants
Table 2: - Solubility of Maraviroc in various oils.
SN Oils Solubility of Maraviroc (mg/mL)
1 Peceol 92±4.2
2 Miasine 35-1 85±3.6
3 Labrafil 1944 CS 62±5.3
4 Labrafil 2125 CS 65±4.8
5 Soya bean oil 40±3.1
6 Olive oil 38±3.9
Figure 4: Solubility of Maraviroc in various oils.
Table 3: Solubility of Maraviroc in various Surfactants and co-surfactants.
SN Surfactant/
Co-surfactant Solubility mg/mL
1 Transcutol HP 185±6.86
2 Labrasol 78±3.64
3 Span 80 60±2.9
4 Tween 80 42±3.7
5 Cremophor EL 34±4.1
6 PEG 400 46±3.2
www.wjpr.net Vol 8, Issue 9, 2019. 269
Rajendra et al. World Journal of Pharmaceutical Research
Figure 5: Solubility of Maraviroc in various Surfactants.
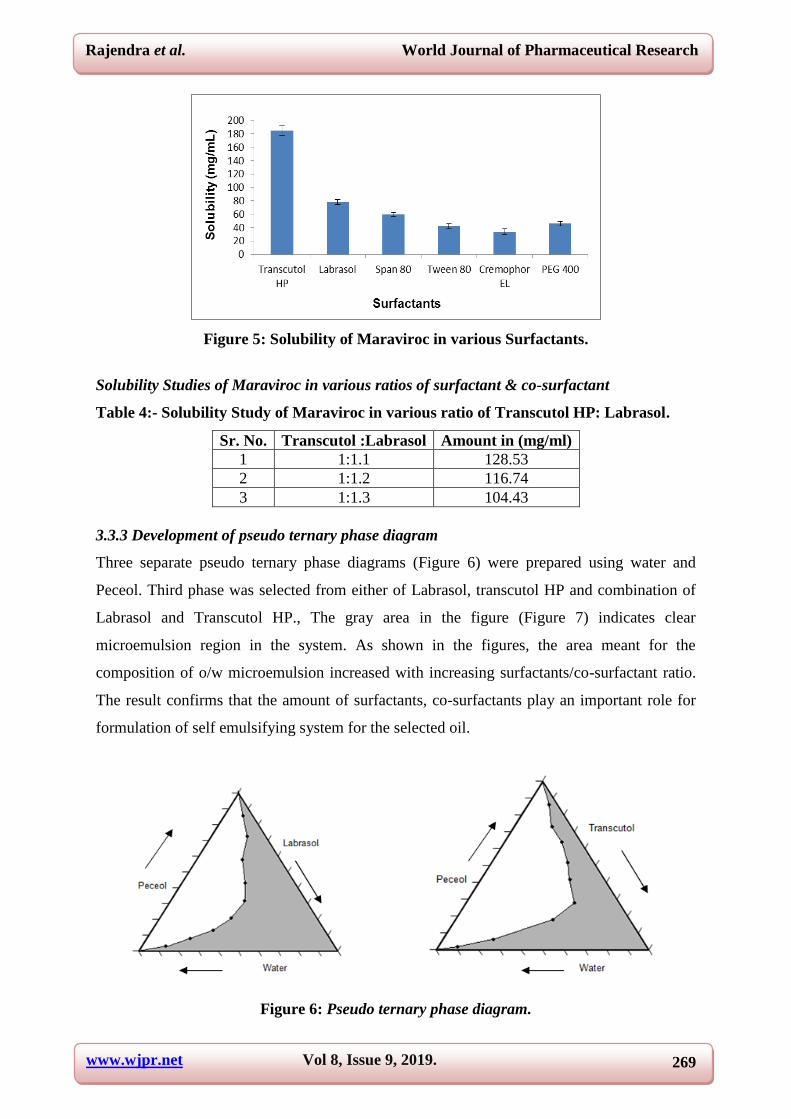
Solubility Studies of Maraviroc in various ratios of surfactant & co-surfactant
Table 4:- Solubility Study of Maraviroc in various ratio of Transcutol HP: Labrasol.
Sr. No. Transcutol :Labrasol Amount in (mg/ml)
1 1:1.1 128.53
2 1:1.2 116.74
3 1:1.3 104.43
3.3.3 Development of pseudo ternary phase diagram
Three separate pseudo ternary phase diagrams (Figure 6) were prepared using water and
Peceol. Third phase was selected from either of Labrasol, transcutol HP and combination of
Labrasol and Transcutol HP., The gray area in the figure (Figure 7) indicates clear
microemulsion region in the system. As shown in the figures, the area meant for the
composition of o/w microemulsion increased with increasing surfactants/co-surfactant ratio.
The result confirms that the amount of surfactants, co-surfactants play an important role for
formulation of self emulsifying system for the selected oil.
Figure 6: Pseudo ternary phase diagram.
www.wjpr.net Vol 8, Issue 9, 2019. 270
Rajendra et al. World Journal of Pharmaceutical Research
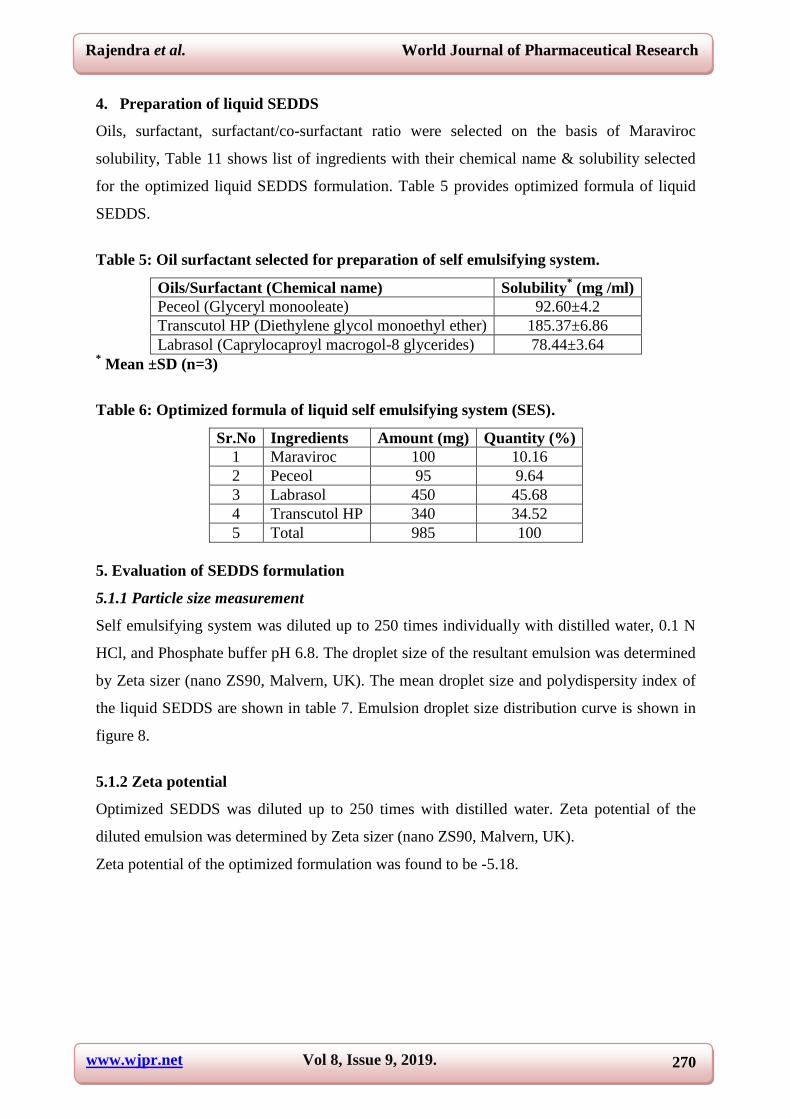
4. Preparation of liquid SEDDS
Oils, surfactant, surfactant/co-surfactant ratio were selected on the basis of Maraviroc
solubility, Table 11 shows list of ingredients with their chemical name & solubility selected
for the optimized liquid SEDDS formulation. Table 5 provides optimized formula of liquid
SEDDS.
Table 5: Oil surfactant selected for preparation of self emulsifying system.
Oils/Surfactant (Chemical name) Solubility* (mg /ml)
Peceol (Glyceryl monooleate) 92.60±4.2
Transcutol HP (Diethylene glycol monoethyl ether) 185.37±6.86
Labrasol (Caprylocaproyl macrogol-8 glycerides) 78.44±3.64 * Mean ±SD (n=3)
Table 6: Optimized formula of liquid self emulsifying system (SES).
Sr.No Ingredients Amount (mg) Quantity (%)
1 Maraviroc 100 10.16
2 Peceol 95 9.64
3 Labrasol 450 45.68
4 Transcutol HP 340 34.52
5 Total 985 100
5. Evaluation of SEDDS formulation
5.1.1 Particle size measurement
Self emulsifying system was diluted up to 250 times individually with distilled water, 0.1 N
HCl, and Phosphate buffer pH 6.8. The droplet size of the resultant emulsion was determined
by Zeta sizer (nano ZS90, Malvern, UK). The mean droplet size and polydispersity index of
the liquid SEDDS are shown in table 7. Emulsion droplet size distribution curve is shown in
figure 8.
5.1.2 Zeta potential
Optimized SEDDS was diluted up to 250 times with distilled water. Zeta potential of the
diluted emulsion was determined by Zeta sizer (nano ZS90, Malvern, UK).
Zeta potential of the optimized formulation was found to be -5.18.

www.wjpr.net Vol 8, Issue 9, 2019. 271
Rajendra et al. World Journal of Pharmaceutical Research
Figure 7:- Zeta potential in water.
5.1.3. Dilution Potential
The prepared formulation was diluted 250 times with continuous media (distilled water, 0.1
N HCl, Phosphate buffer pH 6.8). There was no significant difference in the globule size of
diluted SEDDS formulation after dilution by different medium at the beginning and after 8
hour of dilution.
Table 7: Globule size of diluted SEDDS formulation.
Dilution medium Distilled water 0.1 N HCl Phosphate buffer pH 6.8
Size (nm)
0 hour 108.5 110.7 112.1
8 hour 120.8 119.0 124.7
Figure 8:- Zeta potential in water and phosphate buffer pH 6.8.
www.wjpr.net Vol 8, Issue 9, 2019. 272
Rajendra et al. World Journal of Pharmaceutical Research
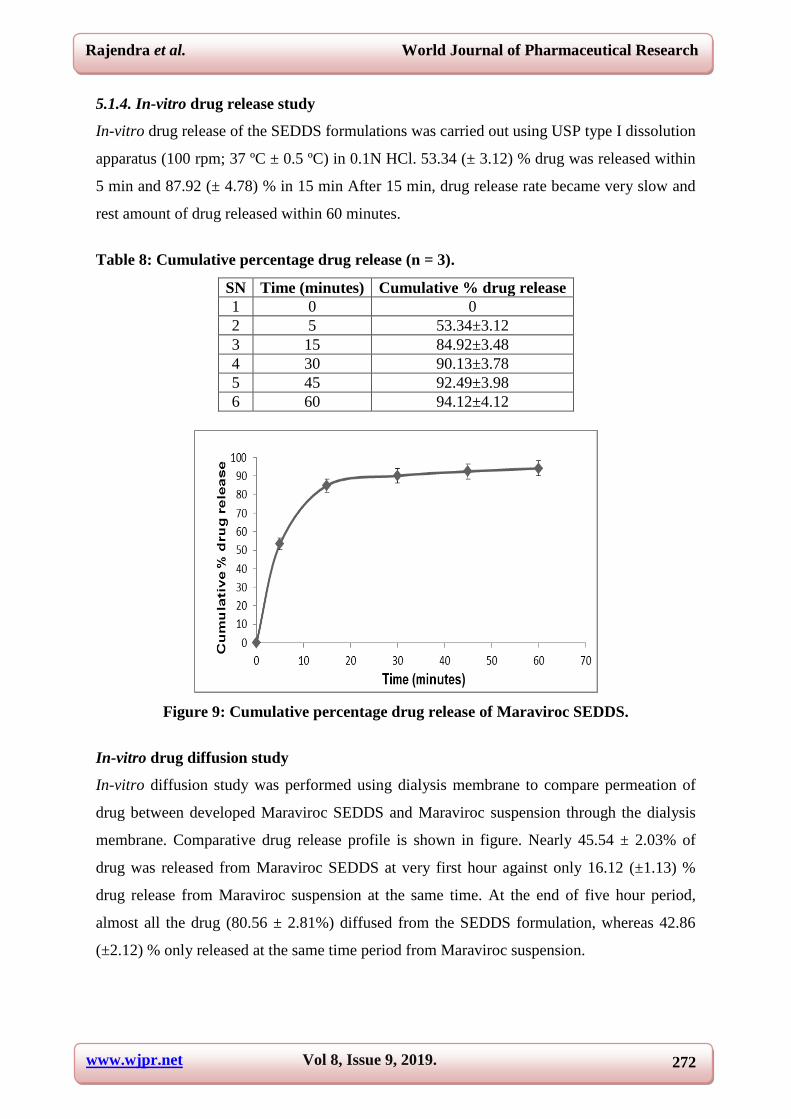
5.1.4. In-vitro drug release study
In-vitro drug release of the SEDDS formulations was carried out using USP type I dissolution
apparatus (100 rpm; 37 ºC ± 0.5 ºC) in 0.1N HCl. 53.34 (± 3.12) % drug was released within
5 min and 87.92 (± 4.78) % in 15 min After 15 min, drug release rate became very slow and
rest amount of drug released within 60 minutes.
Table 8: Cumulative percentage drug release (n = 3).
SN Time (minutes) Cumulative % drug release
1 0 0
2 5 53.34±3.12
3 15 84.92±3.48
4 30 90.13±3.78
5 45 92.49±3.98
6 60 94.12±4.12
Figure 9: Cumulative percentage drug release of Maraviroc SEDDS.
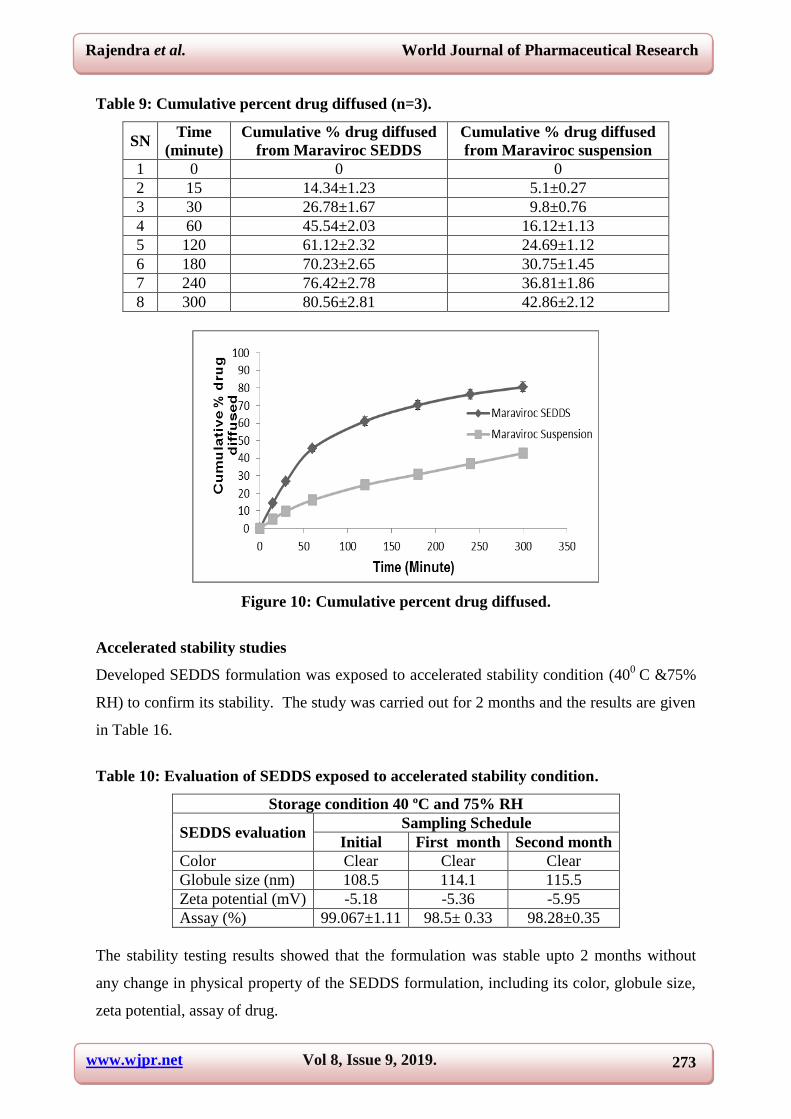
In-vitro drug diffusion study
In-vitro diffusion study was performed using dialysis membrane to compare permeation of
drug between developed Maraviroc SEDDS and Maraviroc suspension through the dialysis
membrane. Comparative drug release profile is shown in figure. Nearly 45.54 ± 2.03% of
drug was released from Maraviroc SEDDS at very first hour against only 16.12 (±1.13) %
drug release from Maraviroc suspension at the same time. At the end of five hour period,
almost all the drug (80.56 ± 2.81%) diffused from the SEDDS formulation, whereas 42.86
(±2.12) % only released at the same time period from Maraviroc suspension.
www.wjpr.net Vol 8, Issue 9, 2019. 273
Rajendra et al. World Journal of Pharmaceutical Research
Table 9: Cumulative percent drug diffused (n=3).
SN Time
(minute)
Cumulative % drug diffused
from Maraviroc SEDDS
Cumulative % drug diffused
from Maraviroc suspension
1 0 0 0
2 15 14.34±1.23 5.1±0.27
3 30 26.78±1.67 9.8±0.76
4 60 45.54±2.03 16.12±1.13
5 120 61.12±2.32 24.69±1.12
6 180 70.23±2.65 30.75±1.45
7 240 76.42±2.78 36.81±1.86
8 300 80.56±2.81 42.86±2.12
Figure 10: Cumulative percent drug diffused.
Accelerated stability studies
Developed SEDDS formulation was exposed to accelerated stability condition (400
C &75%
RH) to confirm its stability. The study was carried out for 2 months and the results are given
in Table 16.
Table 10: Evaluation of SEDDS exposed to accelerated stability condition.
Storage condition 40 ºC and 75% RH
SEDDS evaluation Sampling Schedule
Initial First month Second month
Color Clear Clear Clear
Globule size (nm) 108.5 114.1 115.5
Zeta potential (mV) -5.18 -5.36 -5.95
Assay (%) 99.067±1.11 98.5± 0.33 98.28±0.35
The stability testing results showed that the formulation was stable upto 2 months without
any change in physical property of the SEDDS formulation, including its color, globule size,
zeta potential, assay of drug.

www.wjpr.net Vol 8, Issue 9, 2019. 274
Rajendra et al. World Journal of Pharmaceutical Research
CONCLUSION
Analytical method of Maraviroc by UV Visible spectrophotometer was developed at
wavelength () 210nm. The developed UV method was used for determination of Maraviroc
solubility in different excipients, in-vitro drug release and in-vitro drug diffusion study of
formulation. Oils, surfactants and co-surfactants were selected based on solubility of drug and
triglycerides of longer carbon chain length along with surfactant and co-surfactants with the
self emulsification potential. Peceol (solubility 92±4.2 mg/mL) was selected as oil while
Labrasol (solubility 78±3.64 mg/mL) and Transcutol HP (solubility 185±6.86 mg/mL) as
surfactant and co-surfactant respectively. Pseudo-ternary phase diagram was developed for
different ratios of oils, surfactants co-surfactants and Smix for microemulsion area. The
different ratios of excipients for microemulsion region in phase diagram were determined to
draw conclusion for self emulsifying system formulation
REFERENCES
1. Ho, D.D., Pomerantz, R.J., and Kaplan, J.C. Pathogenesis of infection with human
immunodeficiency virus. New England Journal of Medicine, 1987; 317: 278–86.
2. Fauci, A.S. The human immunodeficiency virus: infectivity and mechanisms of pathogenesis.
Science, 1988; 239(3840): 617–22.
3. Fauci, A.S. Multifactorial nature of human immunodeficiency virus disease: implications for
therapy. Science, 1993; 262: 1011–18.
4. Greene, W.C. AIDS and the immune system. Scientific American, 1993; 269(3): 98–105.
5. Levy, J.A. Pathogenesis of human immunodeficiency virus infection. Microbiological
Reviews, 1993; 57(1): 183–289.
6. Weiss, R.A. How does HIV cause AIDS?. Science, 1993; 260: 1273–79.
7. Bethesda, M.D. The Relationship of the Human Immunodeficiency Virus and the Acquired
Immunodeficiency Syndrome: National Institute of Allergy and Infectious Diseases, 1995.
8. Clavel, F., Guyader, M., Guetard, D., Salle, M., Montagnier, L., and Alizon, M. Molecular
cloning and polymorphism of the human immune deficiency virus type 2. Nature, 1986; 324:
691–95.
9. Fisher, A.G., Ensoli, B., Looney, D., Rose, A., and Gallo, R.C. Biologically diverse
molecular variants within a single HIV-1 isolate. Nature, 1988; 334: 444–447.
10. Price, R.W., Brew, B., Sidtis, J., Rosenblum, M., Scheck, A.C., and Cleary, P. The brain in
AIDS: central nervous system HIV-1 infection and AIDS dementia complex. Science, 1988;
239: 586–92.

www.wjpr.net Vol 8, Issue 9, 2019. 275
Rajendra et al. World Journal of Pharmaceutical Research
11. Darby, S.C., Ewart, D.W., Giangrande, P.L.F., Dolin, P.J., Spooner, R.J.D., and Rizza, C.R.
Mortality before and after HIV infection in the complete UK population of haemophiliacs.
Nature, 1995; 377: 79–82.
12. Stine, G.J. AIDS Update 2000: An Annual Overview of Acquired Immune Deficiency
Syndrome. Englewood Cliffs, NJ: Prentice Hall, 2000; 486.
13. Levy, J.A. HIV and the pathogenesis of AIDS, 3rd edition American Society of Microbiology
Press, 2007.
14. Thomson, M.M., and Najera, R. Molecular epidemiology of HIV-1 variants in the global
AIDS pandemic: an update. AIDS Reviews, 2005; 7: 210–224.
15. De Silva, T.I., Cotton, M., and Rowland-Jones, S.L. HIV-2: the forgotten AIDS virus. Trends
in Microbiology, 2008; 16: 588–595.
16. Cohen, M.S., Hellmann, N., Levy, J.A., DeCock, K., and Lange, J. The spread, treatment, and
prevention of HIV-1: evolution of a global pandemic. Journal of Clinical Investigation, 2008;
118: 1244–1254.
17. Quinn, T.C. AIDS in Africa: evidence for heterosexual transmission of the human
immunodeficiency virus. New York state journal of medicine, 1987; 87(5): 286–89.
18. Francis, D.P., Curran, J.W., and Essex, M. Epidemic acquired immune deficiency syndrome:
epidemiologic evidence for a transmissible agent. Journal of the National Cancer Institute,
1983; 71(1): 1– 4.
19. Curran, J.W., Lawrence, D.N., Jaffe, H., Kaplan, J.E., and Zyla, L.D. Acquired
immunodeficiency syndrome (AIDS) associated with transfusions. New England Journal of
Medicine, 1984; 310(2): 69–75.
20. C.D.C. CDC task force on Kaposi’s sarcoma and opportunistic infections. New England
Journal of Medicine, 1982; 306: 248–52.
21. Wolinsky, S.M., Wike, C.M., Korber, B.T.M., Hutto, C., and Parks, W.P. Selective
transmission of human immunodeficiency virus type-1 variants from mothers to infants.
Science, 1992; 255: 1134–37.
22. Wike, C.M., Korber, B.T.M., Daniels, M.R., Hutto, C., and Munoz, J. HIV-1 sequence
variation between isolates from mother-infant transmission pairs. AIDS Research and Human
Retroviruses, 1992; 8: 1297–300.
23. Andreasson, P., Dias, F., Naucler, A., Andersson, S., and Biberfeld, G. A prospective study of
vertical transmission of HIV-2 in Bissau, Guinea-Bissau. AIDS, 1993; 7: 989–93.
Related Documents


