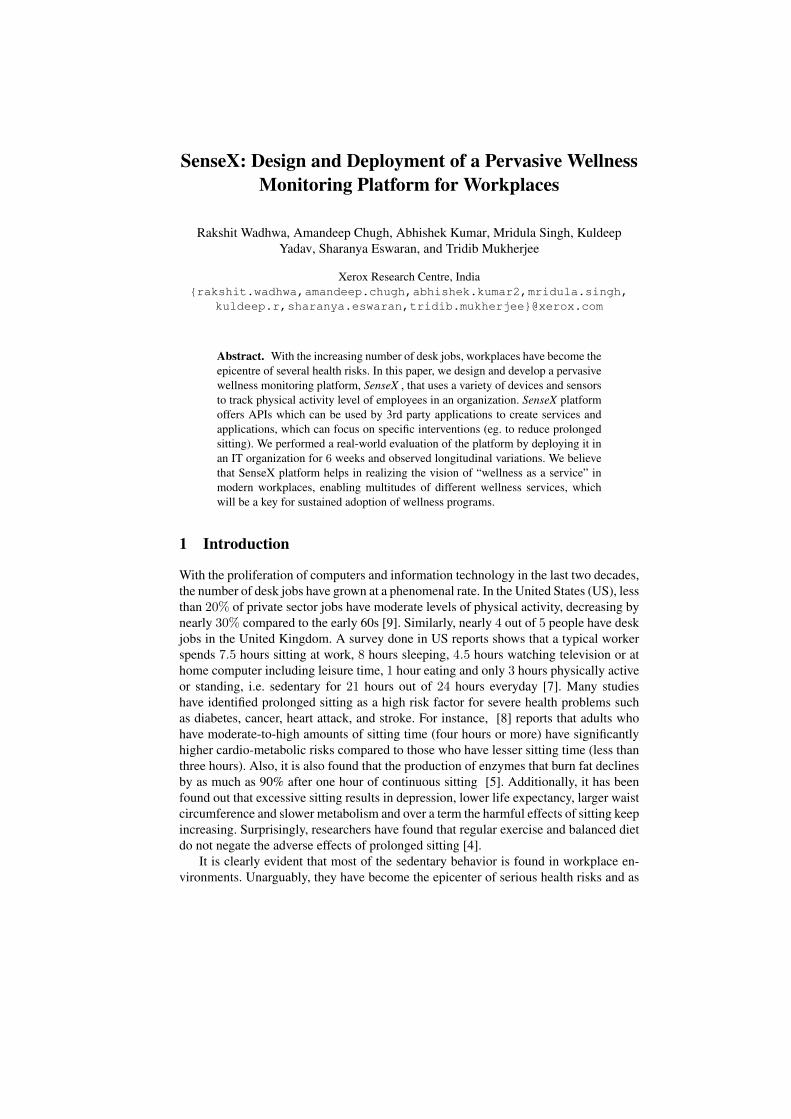
SenseX: Design and Deployment of a Pervasive Wellness Monitoring Platform for Workplaces Rakshit Wadhwa, Amandeep Chugh, Abhishek Kumar, Mridula Singh, Kuldeep Yadav, Sharanya Eswaran, and Tridib Mukherjee Xerox Research Centre, India {rakshit.wadhwa,amandeep.chugh,abhishek.kumar2,mridula.singh, kuldeep.r,sharanya.eswaran,tridib.mukherjee}@xerox.com Abstract. With the increasing number of desk jobs, workplaces have become the epicentre of several health risks. In this paper, we design and develop a pervasive wellness monitoring platform, SenseX , that uses a variety of devices and sensors to track physical activity level of employees in an organization. SenseX platform offers APIs which can be used by 3rd party applications to create services and applications, which can focus on specific interventions (eg. to reduce prolonged sitting). We performed a real-world evaluation of the platform by deploying it in an IT organization for 6 weeks and observed longitudinal variations. We believe that SenseX platform helps in realizing the vision of “wellness as a service” in modern workplaces, enabling multitudes of different wellness services, which will be a key for sustained adoption of wellness programs. 1 Introduction With the proliferation of computers and information technology in the last two decades, the number of desk jobs have grown at a phenomenal rate. In the United States (US), less than 20% of private sector jobs have moderate levels of physical activity, decreasing by nearly 30% compared to the early 60s [9]. Similarly, nearly 4 out of 5 people have desk jobs in the United Kingdom. A survey done in US reports shows that a typical worker spends 7.5 hours sitting at work, 8 hours sleeping, 4.5 hours watching television or at home computer including leisure time, 1 hour eating and only 3 hours physically active or standing, i.e. sedentary for 21 hours out of 24 hours everyday [7]. Many studies have identified prolonged sitting as a high risk factor for severe health problems such as diabetes, cancer, heart attack, and stroke. For instance, [8] reports that adults who have moderate-to-high amounts of sitting time (four hours or more) have significantly higher cardio-metabolic risks compared to those who have lesser sitting time (less than three hours). Also, it is also found that the production of enzymes that burn fat declines by as much as 90% after one hour of continuous sitting [5]. Additionally, it has been found out that excessive sitting results in depression, lower life expectancy, larger waist circumference and slower metabolism and over a term the harmful effects of sitting keep increasing. Surprisingly, researchers have found that regular exercise and balanced diet do not negate the adverse effects of prolonged sitting [4]. It is clearly evident that most of the sedentary behavior is found in workplace en- vironments. Unarguably, they have become the epicenter of serious health risks and as

Welcome message from author
This document is posted to help you gain knowledge. Please leave a comment to let me know what you think about it! Share it to your friends and learn new things together.
Transcript
SenseX: Design and Deployment of a Pervasive WellnessMonitoring Platform for Workplaces
Rakshit Wadhwa, Amandeep Chugh, Abhishek Kumar, Mridula Singh, KuldeepYadav, Sharanya Eswaran, and Tridib Mukherjee
Xerox Research Centre, India{rakshit.wadhwa,amandeep.chugh,abhishek.kumar2,mridula.singh,
kuldeep.r,sharanya.eswaran,tridib.mukherjee}@xerox.com
Abstract. With the increasing number of desk jobs, workplaces have become theepicentre of several health risks. In this paper, we design and develop a pervasivewellness monitoring platform, SenseX , that uses a variety of devices and sensorsto track physical activity level of employees in an organization. SenseX platformoffers APIs which can be used by 3rd party applications to create services andapplications, which can focus on specific interventions (eg. to reduce prolongedsitting). We performed a real-world evaluation of the platform by deploying it inan IT organization for 6 weeks and observed longitudinal variations. We believethat SenseX platform helps in realizing the vision of “wellness as a service” inmodern workplaces, enabling multitudes of different wellness services, whichwill be a key for sustained adoption of wellness programs.
1 Introduction
With the proliferation of computers and information technology in the last two decades,the number of desk jobs have grown at a phenomenal rate. In the United States (US), lessthan 20% of private sector jobs have moderate levels of physical activity, decreasing bynearly 30% compared to the early 60s [9]. Similarly, nearly 4 out of 5 people have deskjobs in the United Kingdom. A survey done in US reports shows that a typical workerspends 7.5 hours sitting at work, 8 hours sleeping, 4.5 hours watching television or athome computer including leisure time, 1 hour eating and only 3 hours physically activeor standing, i.e. sedentary for 21 hours out of 24 hours everyday [7]. Many studieshave identified prolonged sitting as a high risk factor for severe health problems suchas diabetes, cancer, heart attack, and stroke. For instance, [8] reports that adults whohave moderate-to-high amounts of sitting time (four hours or more) have significantlyhigher cardio-metabolic risks compared to those who have lesser sitting time (less thanthree hours). Also, it is also found that the production of enzymes that burn fat declinesby as much as 90% after one hour of continuous sitting [5]. Additionally, it has beenfound out that excessive sitting results in depression, lower life expectancy, larger waistcircumference and slower metabolism and over a term the harmful effects of sitting keepincreasing. Surprisingly, researchers have found that regular exercise and balanced dietdo not negate the adverse effects of prolonged sitting [4].
It is clearly evident that most of the sedentary behavior is found in workplace en-vironments. Unarguably, they have become the epicenter of serious health risks and as

2 Rakshit et al
a result, organizations have started investing in wellness programs. Workplace well-ness is a $6 billion industry in the United States alone where majority of organizationsspending at least $521 per employee per year [1]. Organizations are investing in thesewellness programs to improve social, mental, and physical health of their employees aswell as to reduce their healthcare payback costs. Most of these wellness programs in-corporate costly wearable devices such as Fitbit, Nike Fuel Band, and Jawbone UP foractivity tracking with physiological attributes. However, these wearables do not resultin sustained adoption due to their obtrusiveness. For the users, it is more of an overheadto carry, wear and maintain an extra device. A study in US shows that more than 50% ofconsumers who owned an activity tracker stopped using them after 6 months [6]. Sim-ilar to activity trackers, standing workstations have also failed to have sustained impactand most users stop using those desks after one month of use [2]. Additionally, there aremany playstore apps such as Motion24x7, Moves, Google Fit performs activity recogni-tion using sensors available on the smartphone itself. However, these apps too fail to geta sustained adoption due to factors such as limited coverage i.e. users tend to leave theirmobile phones stranded on desks while at work, and high battery consumption, which isdue to nonstop sensing. Hence, there is a need for an unobtrusive, frugal, and pervasiveplatform for wellness monitoring and interventions in workplace environments.
In this paper, we design a pervasive wellness monitoring platform SenseX whichleverages an employee’s everyday devices and existing infrastructure (i.e. intercon-nected desktop/laptop, enterprise WiFi) for activity tracking and physiological mea-surements (i.e heart rate). SenseX builds services to interface with different workstationdevices (i.e. keyboard, mouse, webcam), workplace infrastructure (i.e. enterprise WiFi,calendar, BLE), and mobile phone sensors to sense activities and context of an em-ployee. SenseX employs intelligent sensing approaches such as triggered-sensing i.e.offloading sensing load to infrastructure sensors whenever possible and opportunistic-sensing i.e. switching a sensor ON only when there is an opportunity to sense. Such ap-proaches help in minimizing energy-consumption and increase sensing coverage. Sen-seX processes the device-specific measurements to infer fine-grained activities of a useras well as to extract high-order contextual information. A cloud-based SenseX serviceis used for the fusion of multiple device-specific activity profiles into a single profile,which is used for pushing appropriate interventions and notifications. Further, SenseXplatform offers APIs which can be used by 3rd party applications to create services andapplications, which can focus on specific interventions (eg. to reduce prolonged sitting)to induce systematic behavior changes. We believe that SenseX platform helps in real-izing the vision of “wellness as a service” in modern workplaces, enabling multitudesof different wellness services, which will be a key for sustained adoption of wellnessprograms. Specifically, this paper makes the following contributions:
1. First of its kind pervasive wellness monitoring platform which intelligently com-bine mobile, workstation, and infrastructure sensors to perform activity monitoringin workplaces.
2. Intelligent sensing approaches i.e. triggered-sensing to increase sensing coverageand reduce battery consumption. SenseX provided multitude of services and APIsto enable quick development of workplace-specific intervention and challenges.

SenseX 3
3. A real-world deployment with 30 participants and detailed evaluation of SenseXplatform with StandUp wellness challenge.
2 Related Work
The enhancement in the sensing capabilities of computerized devices along with theadvancement in the area of ubiquitous and pervasive computing has resulted into theevolution of many fitness and healthcare applications/systems. We can broadly dividethe previous work related to ours in three categories namely, Mobile-enabled sensing,Workstation-based sensing and Wellness platforms and services.
Mobile-enabled sensing Modern-day smartphones are computationally powerful andat the same time are equipped with array of sensors, and thus have been widely used forday-to day sensing, activity recognition and health monitoring systems. . Kwapisz et. al.[10] proposed and developed a system for android devices, which could recognize, logand maintain simple physical activities like walking, jogging, sitting, standing etc usingphone based accelerometer. Similarly smartphones have been used widely for activityrecognition [14], [11], [13]. Physiological parameter monitoring is yet another focusarea in which researchers have exploited the capabilities of the smartphone. Aishwaryaet.al. [21] proposed smartphone based methodology to estimate the range of humanblood pressure (BP) using Photoplethysmography. Similar to this [22] discuss a sys-tem which enables tracking the heart rate with user’s finger tip placed on smartphone’scamera. Sumida et.al. [19] correlate the accelerometer, walking speed readings with theheartrate and estimate its variation while walking. There is no dearth of mobile-basedsystems designed with physiological parameter monitoring capability using integratedexternal sensors [25] and only internal sensors like camera etc. [23], [24].
Workstation-based sensing Although workstations generally do not have any dedi-cated sensors, but many sensing hints can be obtained from inherent components likemouse, keyboard, touchapad, webcam etc. Thus researchers have exploited these sens-ing capabilities of workstation for measuring a number of health-related parameters likeheart-rate, stress levels, emotional state etc. Sun et.al [15] suggest and demonstrate theuse of mouse events to detect stress. Epp et. al [26] show that emotional states canbe recognized using keystroke features. On the other hand [18], [17], [16] discuss andexhibit the ability of webcam equipped workstations to predict heart-rate.
Wellness Platforms and Services The growing awareness and realization regardingthe effectiveness of preventive healthcare has motivated the research community to de-sign and develop several dedicated and ubiquitous healthcare platforms/systems. [28]discuss a service-oriented architecture platform for integration of health-data from var-ious personal health devices. Li et. al. designed and implemented a cloud-based plat-form for personal health sensor data management in a collaborative manner. Similarly[30] discuss the implementation of a scalable, robust cloud-based platform which canmanage the semistructured, unstructured, and heterogeneous physiological signal effec-tively and can satisfy high concurrent requests from ubiquitous healthcare services.
SenseX builds upon the research work done in mobile and workstation-based sens-ing outlined above. However, there is lack of a platform that provides pervasive sensing

4 Rakshit et al
capabilities such as SenseX and flexibility to create new interventions/challenges espe-cially in workplaces.
3 System Design
Fig. 1: System design of SenseX platformwith different layers.
Modern workplace environment con-sists of existing infrastructure of inter-connected desktops (i.e. laptop/PCs)equipped with web cameras, and employ-ees carry their mobile phones with them.SenseX platform is designed to performmulti-modal sensing that encomapassesexisting workplace infrastructure as sen-sor hints along with mobile-based sen-sors to accurately track activity levels aswell as wellness of an employee. Sen-seX platform follows a layered architec-ture involving three different layers de-signed for sensing raw data, and sub-sequently extracting high-level attributesto enable appropriate interventions. Fig-ure 1 presents a snapshot of proposedthree layered design with each layer consisting of a set of components. These com-ponents are part of the various services that run on end-user devices (i.e. mobile, work-station) and a cloud instance. SenseX follows a decentralized model where most of thesensing and processing of data is performed on end-user devices and aggregation is per-formed using a cloud instance. Further, the rationale of having layered design is that itenables flexibility of adding or removing layers as well as components by third partyapplications and services. These services can use activity tracking and context inferencecapabilities of SenseX and build their own wellness management and intervention so-lutions.
3.1 Sensing & Actuation Layer
This layer is responsible for interfacing with hardware devices and sensors to col-lect sensory measurements. Some of the primary components of this layer are device-specific integrations, sensor controller and scheduler, data collector, and a rule engine.SenseX using following device-specific integrations.
1. Mobile Phone: Mobile phone is equipped with a variety of different sensors suchas location, light, proximity, accelerometer, gyroscope, microphone, etc. SenseXhas a dedicated service running on the mobile phone, which can start/stop sam-pling any of these sensors based on the application requirements. All these sen-sors provide raw data values, which are later processed in higher layers to inferuser-specific activity and contextual attributes. For example, accelerometer sensordata capture provides x, y, and z coordinate values corresponding to the motion

SenseX 5
in three axes/dimensions of a mobile phone while location sensor can provide thegeo-coordinates or WiFi/GPS/Bluetooth fingerprint of user’s current location.
2. Workstation Devices: Many people use desktop/laptop in their workplaces. SenseXruns a workstation service to capture different sensing cues from the workstationdevices including activity on mouse/keyboard, name of foreground application (s),and webcam video feed. Based on the application requirements, SenseX servicesubscribe to one or more of these cues from the OS to collect raw sensor data. Forexample, an OS-based interrupt is generated whenever the keyboard or mouse isused. SenseX listens for such interrupts and records them with their respective timestamps. This data is processed in subsequent layers to infer high-order activities i.e.to find if a person was sitting or not in a given time interval. The main assumptionis that if there is a steady stream of keyboard and mouse interrupts, the user is sit-ting continuously. Similarly, webcam-based video feed can be recorded as part ofsensing, which could be used for simply detecting the presence of a person at work-station or to do more complex ones such as extracting physiological parameters.
3. Infrastructure-based Devices/Services: Most of the organizations use different hard-ware sensors and software services as part of their day-to-day functioning. Someof these services include RFID card for access control, enterprise WiFi for ubiq-uitous network access, Bluetooth low energy (BLE) devices for tracking intra-organization movements, organization-wide calendar services for maintaining sched-ules, and messenger services for communication. SenseX provides customized ser-vices to gather sensor cues from available organization-wide sensors and services.For example, cues from calendar service can indicate the schedule of employeeswhereas enterprise WiFi or BLE can be used for localization of employees in theworkplace environment.
Sensing Service Controller and Scheduler Some of the above sensors are battery-constrained (i.e. mobile sensors) whereas some of them have near continuous powersupply (i.e. workstation devices). One of the main responsibilities of this layer is tocontrol different sensors based on the application requirements, posed by higher lay-ers. This module also identifies opportunities where battery-constrained sensors can becomplemented with the data from infrastructure or workstation sensors. In a nutshell, itemploys a novel triggered-sensing based approach to dynamically start/stop a device-specific service whenever there is an opportunity to use infrastructure-based sensors.The main idea behind triggered-sensing is to reduce sensing data redundancy as muchas possible, thus improving battery life.
We present a use-case to demonstrate applicability and effectiveness of triggered-sensing based approach. For example, SenseX need to monitor a user Alice’s sittingand standing patterns to provide an intervention for excessive sitting. Lets assume thatAlice goes to her office by foot. While walking, SenseX mobile service will remainON to keep track of Alice’s activities. After, Alice reaches her workplace and startsusing her workstation devices (i.e. keyboard, mouse), a trigger is generated by Sen-seX workstation service to the cloud instance and it pushes a notification to mobileservice for switching off mobile sensors as shown by the first trigger in Figure 2.Meanwhile, workstation service keeps reporting the current activity (i.e. sitting) to the

6 Rakshit et al
cloud instance. Whenever, there is an activity change detected by the SenseX worksta-tion service i.e. there is no activity for a certain time, it starts sampling the webcam feedas represented by second trigger of Figure 2. If it concludes that Alice is not presenton workstation, then cloud instance send a trigger to mobile service to resume activitytracking.
Another advantage of triggered-sensing based approach comes in the form of in-creased sensing coverage where different sensing schemes can complement each otherin terms of data collection. Consider the above scenario, Alice may place her phone onthe table while working on the workstation and in such a case, a system using only mo-bile sensors will not be able to sense current state/activity. However, SenseX can sensethe activity of Alice based on the usage of workstation devices. Further, the applica-bility of triggered-sensing based approach is not restricted to above described use-caseonly and it can be easily extended to a variety of other scenarios. For example, SenseXmay use enterprise WiFi-based tracking for finding current location of a user rather thanactively scanning mobile-based WiFi.
Fig. 2: An instance of triggered-sensingbased approach employed in SenseX .Red color markers shows different triggers,which initiates other sensors
Rule engine component translateshigher order activity inference require-ments into low-level sensor mappings.For instance, if an application wants totrack sitting-standing pattern of an em-ployee, it enables mobile service andworkstation-based sensors to track activ-ity patterns. One of primary challengesfaced by SenseX platform is in terms ofheterogeneity that includes different de-vices and lack of a standardized repre-sentation in sensing data. Sensing and ac-tuation layer handles device heterogene-ity by implementing different sensing in-terfaces for different devices and provideability to control as well as collect sen-sory data from them. However, data het-erogeneity still remains a challenge and higher layers as presented in Figure 1 providea solution for the same.
3.2 Activity Inference and Fusion Layer
The primary responsibility of this layer is to infer various high-level activities (i.e. sit-ting, standing, walking) as well as contextual attributes (i.e. inMeeting, Indoor/Outdoor,DeviceOnTable) from the raw data collected by sensing and actuation layer. Aftersensor/device specific inference, the different activities are fused together to create awholistic activity profile for every user. Additionally, this layer hosts components toestimate physiological parameters from the sensing data.
Activity and Context Inference This component aims to recognize high order activi-ties from raw sensor measurements. Some of the activity inferences are straightforwardi.e. if a person is typing on a keyboard/mouse or her presence is detected using webcam,

SenseX 7
her activity can be classified as ‘sitting’. However, some of the activity inferences needprocessing and in most of the cases require three different steps i.e. pre-processing ofsensor data, extracting features, and applying a classification scheme to recognize theactivity. Due to significant heterogeneity among sensed data values in SenseX , theseprocessing steps need to be implemented distinctively for each device/sensor category.For example, accelerometer sensors provide X, Y, Z values representing motion in threeaxes/dimensions and it can be used to infer user activities such as sitting, standing,walking, climbing stairs, etc. The pre-processing steps involves dividing accelerometerdata stream into segments (say x seconds) based on application and accuracy require-ments. For each segment, it calculate set of statistical (mean, standard deviation, skew-ness, RMS), time-domain (integral, auto-correlation) and frequency-domain (spectralenergy, spectral entropy) features. These feature values are then fed into a classificationframework such as decision tree or SVM to recognize users’ activity.
Contextual information is an integral part of a wellness platform and it enriches theuser-specific activity profile as well as notification delivery/intervention mechanism.For example, notifications could be smarter and will not be delivered when a person isin meeting. Some of the contextual information is easy to sense, for example, contextinformation of a person being in a meeting or not, can be easily sensed from the cal-endar information. However, some of the contextual attributes such as detecting mobilephones’ presence in pocket require processing and fusion of multiple sensors data. Forexample, to detect whether the phone is in pocket or not, SenseX uses accelerometersensor readings to find angle of inclination which is fused with proximity sensor infor-mation to classify whether a phone is in pocket or lying flat while facing up or lying flatwhile facing down, etc. SenseX also interfaces with enterprise WiFi network and BLEtechnology to infer current location of the user [20].
Activity Fusion Aforementioned components infer activity and context from device-specific sensor measurements and convert data representation from low-level to high-level activity or contextual constructs. SenseX utilizes different kinds of devices/sensorsfor activity and context tracking and most of higher order inferences (activity recogni-tion) are performed on the device itself, while periodically reporting to SenseX cloudinstance. This module perform fusion of activity constructs coming from two or moredifferent devices/sensors. For example, the SenseX workstation service may detect thata person was sitting from 09:00 to 09:44 AM where as mobile service infers that theperson was walking from 9:45 to 10:15 AM. This information is fused to make a singleactivity profile. In some of the cases, time information across two different activitiesmay overlap due to errors in inferencing. In such cases, this module assigns higherpriority to the infrastructure and workstation based sensors.
Physiological Analysis Considerable research has been done to extract physiologicalparameters such as heart rate from activity data [19] as well as webcam-based videofeed [18]. Further, there have been efforts to use webcam-based video feed to detectrespiratory problems, emotions, etc. The focus of SenseX platform is to use existingresearch work as a pervasive mechanism to measure vital signs in day-to-day life. Heartrate measurement is an important vital parameter to diagnose various ailments such asanxiety, stress, cardio-vascular disease, etc.

8 Rakshit et al
Opportunistic Sensing This component works in-conjunction with sensing servicecontroller component to enable sensor tracking only when there is an opportunity de-tected. For example, physiological analysis does not work when there is motion w.r.t.subject’s face in the video. In case of SenseX , there could be two kinds of opportunity-based sensing. Based on the detection of an opportunity, this component sends triggerto sensor controller module to enable tracking.
– Context-directed/Detection: In this case, detection of contextual attributes decidewhether sensing should be enabled or not. For example, an application may requiresensing of heart rate just after lunch time. To enable such sensing, required contextis continuously tracked and a notification is issued to the user when there is anopportunity.
– Sensing-directed/Prediction: This is a completely automated and non-obtrusiveapproach where sensing is dependent on end-result i.e. automatically figuring outthe instances where there is likely to be little motion so that heart rate trackingis possible using webcam. SenseX achieves this by continuously tracking systemusage logs (i.e. mouse activity, keyboard activity, open applications) and using thisinformation to predict the right moments with the help of a supervised classifier.
3.3 Analytics and Notifications
This layer performs high-level analytics on user-specific activity profiles and contex-tual attributes. High-level analytics is performed to detect broad patterns across anorganization or a group of people as well as personalized behavior specific to a user.Based on these patterns, appropriate notifications can be generated and issued to usersat opportune moments. This layer also contains a user profile component which trackslongitudinal data of users’ response to the interventions/notifications, contextual infor-mation, privacy policies and the end result i.e. whether a user complied with the no-tification or not. The context tracking along with notification history captures specificbehavioral attributes such as user X does not like to get disturbed while coding. Thisdata in conjunction with behavior modelling component is used to employ the rightpersuasion strategies to motivate the user to comply with notifications. For example, anapplication dealing with prolonged sitting of employees can sense the sitting time usingSenseX and accordingly, send notification in time to alert user to take break periodi-cally. Based on the contextual attributes and longitudinal history, the notification maylook like following:
“You have a meeting in “10” minutes and working from last 35 minutes. Please takea break now and walk for 2 minutes”
4 Implementation Details
We developed SenseX platform with most of components described in Figure 1. Todemonstrate the efficacy of the platform for performing pervasive sensing and appro-priate interventions, we developed an application StandUp to monitor activity levels ofemployees in an organization.
Mobile Service: It is a native OS service developed for Android devices due toits popularity and large market-share, especially in developing markets. SenseX mobile

SenseX 9
service is able to perform low-level sensory measurement i.e. acclerometer, proxmity,microphone, etc and contains activity inference algorithms to extract high-order activ-ities and contextual attributes. StandUp is implemented as a native mobile applicationthat accesses SenseX service to sense various activities (i.e. sitting, standing, walking,unknown, etc). An activity sensed from mobile service is categorized as ‘unknown’ ifthe phone is kept on a flat surface (eg. table). StandUp visualizes sensed activities ina day-based activity profile along with timeline as shown in Figure 3a. Apart fromday-based activity profile, users can see their weekly performance and an organiza-tion leaderboard where they can compare their performance with peers as shown inFigure 3c. StandUp also uses SenseX intervention mechanism to provide engaging no-tifications to the users which provide “just-in-time” alerts for daily goals, compliancelevel etc.
(a) (b) (c) (d)
Fig. 3: a,b,c. Snapshots of StandUp Mobile Application d. Snapshot of workstation ser-vice ticker and notification
Workstation Service: SenseX workstation service is implemented using Microsoft’s.NET Framework 3.5 and supports all destops/laptops running Windows OS. The ser-vice is configured to run whenever system is rebooted or awakens after sleep mode. Itsupports functionality to track keyboard activity, mouse activity, webcam-based feed,and front ground application usage. StandUp uses the workstation service to track ac-tivity of an employee and builds a simple windows form based application to visualizesuch activity levels. StandUp application places a ticker on the users’ desktop to showthe current station of user activity as shown in Figure 3d. Similar to mobile service,StandUp application uses workstation service to provide timely notifications in case ofprolonged sitting as shown in Figure 3d.
Cloud-based Instance: The server is hosted on a VM (virtual machine) providedby a public cloud service provider. The end-device services such as workstation serviceand mobile service communicate with the cloud-based instance using HTTP Get/Postrequests. SenseX uses Google Cloud Messaging (GCM) to push updates on mobiledevices. StandUp application uses APIs to provide a web-based dashboard which can beaccessed by organization administrator to track installation, status of running services,application usage, organization leaderboard, and broad patterns.
5 Evaluation
SenseX is a platform designed for pervasive wellness monitoring platform in work-places; consists of different services running across devices. As described in Section 4,

10 Rakshit et al
StandUp application uses these services to provide activity monitoring and interven-tions for prolonged sitting in workplaces. The system evaluation of a platform suchas SenseX is important to establish the effectiveness of different features (i.e. triggered-sensing) where as a typical wellness monitoring system will be questioned on how muchcan it contribute towards increasing activity levels, especially in a workplace setting.Specifically, for SenseX and StandUp , we conduct a mix of both system-evaluation (i.e.measuring impact of triggered-sensing, sensing coverage) and a user-study evaluationto capture the personal characteristic of users. We frame following research questionsto guide both of these evaluation mechanisms.
– R1: How much sensing coverage is provided by different services of SenseX ? Howdoes sensing coverage vary across different users of the system?
– R2: What is the impact of triggered-sensing on the SenseX system? How muchis the trigger-delay among different services? Does it help in saving energy forbattery-constrained devices?
– R3: What are the activity patterns (i.e. continuous sitting time, daily steps) of em-ployees working in a workplace environment? How do these patterns fair when putalong organization wide leaders and slackers?
– R4: What is the impact of nudging an employee to take a stroll in case of prolongedsitting? How long does she take to respond to these notifications?
– R5: What is the impact of gamification and incentivizing the top performing em-ployees? What is the observed difference between leaders and slackers in the sys-tem?
Deployment Details: We did a pilot deployment of proposed platform in an ITorganization with a total of 30 participants (25 males and 5 females). The ages of par-ticipants ranged from 21 to 45 years, with a mean age of 29 years (male = 28, female= 31). All the participants used StandUp mobile and desktop application which werebuilt upon SenseX services. The participants were given flexibility to specify the timeintervals where activity tracking can be performed on desktop and mobile applications;default interval was set from 7AM to 7PM . To make the challenge engaging and com-petitive, we announced awards for top 3 weekly leaders chosen based on their perfor-mance over two metrics, i.e. average step count and average notification compliancescore. Initially, we planned to run the deployment for 4 weeks but extended it for an-other 4 weeks keeping in mind engagement and interest of the participants. During thepilot, SenseX logged several parameters related to participants’ performance and in-teraction with the system. We analyzed the collected data to answer aforementionedresearch questions.
5.1 Sensing Coverage
The sensing coverage in the context of SenseX is defined as the fraction of time whereactivity monitoring is possible in a participant’s day-to-day life. SenseX uses mobilesensors along with contextual and environmental information, sensed by the worksta-tion service. Using logs, we characterized activity monitoring w.r.t. sources i.e. mobile,workstation, or unknown. An activity is said to be ‘unknown’ if mobile device hap-pened to be placed on a flat surface and there was no activity sensed by the workstation

SenseX 11
(a) (b) (c)
Fig. 4: a. Measured trigger-delay between mobile service to workstation service b. Bat-tery decay comparison for both mobile-only activity tracking approach and SenseXbased triggered-sensing with baseline c. Comparison of sensing coverage for mobileand workstation based services across different participants
service. Across all the participants in our deployment study, we observed that mobileservice sensed nearly 50% of the total time, nearly 25% of the time was monitoredby the workstation service and rest of the time was categorized as unknown as can beinferred from Figure 4c. This brings an interesting observation that mobile-based well-ness applications such as Moves and Google Fit are not able to track activities for morethan 50% of time. Further, Figure 4c shows the sensing coverage pattern for the subsetof participants who had both mobile and desktop services actively running throughoutthe deployment study. We observe that for some users (ID: 5 & 16), more informa-tion is obtained from workstation service as compared to mobile sensors. It could bedue to limited monitoring because some of the users enabled activity tracking duringworkplace timings only. Our analysis show that workstation-based service increases thesensing coverage to a large extent especially during workplace timings.
5.2 Triggered-sensing & Battery Consumption
Section 3 presents triggered-sensing approach to offload sensing responsibilities toworkstation service when there is an opportunity. In such cases, workstation servicewith the help of cloud instance need to send a trigger to mobile service indicating that itshould stop sensing. We use push-based notification system to send trigger to a mobileservice instead of a pull-model where it has to continuously look for a trigger by sendingrepeated request to the cloud instance. It is important to characterize the time to sendthis trigger from workstation service till it reaches to mobile service, represented astrigger delay. We emulated trigger-delay using SenseX platform where a total of 1200requests where sent from workstation service to mobile service for a duration of 8 hours.We present the observed trigger-delay in Figure 4a, most of the time the delay wasless than 10 seconds. Similarly, we compared energy consumption of SenseX activitytracking services w.r.t. only mobile-based tracker and baseline as shown in Figure 4b. Inmobile-based tracking approach, a continuous activity tracker that uses accelerometerran on a MotoE phone till the battery reached to a low level where as baseline shows thebattery decay without any external service. We found that SenseX using its triggered-sensing approach could increase the battery life time by nearly 25% of the time. Fromour experimental results, we conclude that triggered-sensing works in near real-timeand helps in increasing sensing coverage as well as result in significant energy-savings.

12 Rakshit et al
(a) (b) (c) (d)
Fig. 5: a. CDF of day-wise steps across different participants b. CDF of sitting timesessions across different weeks c. CDF of the response time observed for all the noti-fications during the deployment d. Average number of leaderboard hits per user eachweek during the deployment
5.3 Workplace Activity Patterns
StandUp challenge was designed to increase the overall activity level of employees ata workplace. Figure 5a presents the CDF of the number of steps for each week acrossall participants. We see a clear shift among the first and sixth week, indicating thatmore people have increased their number of steps over the course of the pilot. Fig-ure 5b shows the CDF of the sitting time of users, i.e., the time for which a user sitscontinuously at a stretch. We see that the duration of sitting segment of the users havemarginally decreased from week 1 to week 6, which indicates that the users startedadhering to the notifications and had been avoiding sitting continuously for longer du-rations. We conclude that StandUp challenge was effective in increasing the overallactivity level among employees. Considering that, there was no effective way to cap-ture baseline (i.e. participants’ performance before intervention), we have only providedperformance comparison on week-to-week basis.
5.4 Effect of Notifications
One of the important aspects of StandUp challenge was to continuously monitor thesitting-standing pattern of the people and send notifications if they sit for more than athreshold time t. In case of StandUp , t was set to 40 minutes based on the prior medicalstudies and repetitive notifications were pushed every 5 minutes. The participants alsohad an option to stop the notification temporarily if they were busy. We compute acompliance score which is an indicator of percentage of time a participant has actedon notification or remain active at least 2 minutes in an hour. Figure 5c shows theCDF of response time for both workstation and mobile notifications. Response time isthe time between when a notification is pushed and the user moves out of his sittingposition (and proceeds to stand or walk). We see that for nearly half of the notifications,participants have acted in less than 10 minutes. We also observe that there is a slightpreference of mobile-based notifications over workstation ones. Also, long tail of largerresponse times are observed because many time participants did not carry their mobilephone when they took a break.

SenseX 13
5.5 Effect of Incentives and Gamification
With the help of SenseX analytics capabilities, StandUp maintained an organization-wide leaderboard which could be accessed by the participants. The leaderboard wasestablished based on two metrics i.e. average step count and compliance score. At theend of each week, cash prizes worth 15 USD each were announced for the top 3 leaders.We did not collect any qualitative data to measure the impact of leaderboard or incen-tives. However, we collected quantitative data on how many times leaderboard page wasaccessed by different participants during the deployment and we used that as a proxy tocapture the interest of participants. Figure 5d presents the average number of leader-board hits per user each week, (i.e., the number of times the leaderboard was visitedby a user). We see that initially, it was visited two times per day on average, and thefrequency gradually reduced as the initial excitement of the pilot settled in. However,the leaderboard visits have remained stable over the last 3 weeks, converging at aroundone visit every day by each user on an average.
Next, we analyzed the performance attributes of leaders and slackers during thedeployment study. The participants above the 95th percentile of step count are taken asthe leaders and those below the 5th percentile of step count are taken as the slackers. Itmay be noted that the set of leaders and slackers may vary in each week. We see a clearcorrelation between the leaders/slackers and the average sitting time, response time,and leaderboard hits, i.e., the step count-based leaders also feature in the above-averagecategory for leader board hits, and below average (i.e., shorter duration) for sitting timeand response time, and vice versa for the slackers.
6 Discussion
Modern day workplace forces a sedentary lifestyle that involves reduced physical ac-tivity and prolonged sitting, which poses a risk of severe ailments including diabetes,cancer, heart attack and stroke. Current wellness solutions are costly, dependent onwearable devices, which do not have a sustainable impact. We designed and developeda comprehensive wellness monitoring platform i.e. SenseX , which intelligently usescombination of mobile, workstation, and infrastructure sensors to do pervasive activ-ity and physiological monitoring in workplaces. With multitude of different services,SenseX enables easy creation of different wellness interventions and challenges thatcan drive sustained behavioral changes among employees. As an example, we createda wellness challenge i.e. StandUp to increase the activity levels of employees in anorganization. We ran the challenge for nearly 6 weeks and observed several key in-sights i.e. increased daily step count across weeks, reduced sitting sessions, positiveeffect of gamification/incentives, etc. From a systems’ evaluation perspective, SenseXuses triggered-sensing approach to increase the sensing coverage by nearly 25% andreduced the battery consumption considerably.
Through its pervasive sensing capabilities, we believe that SenseX helps in realiz-ing the vision of “wellness as a service in modern workplaces, enabling plethora ofdifferent wellness services and interventions. We provide a sample of some of the otherchallenges/interventions that can be created using SenseX .
1. Vitamin D Challenge: IT workers suffer from lack of vitamin D, which is obtainedby sun-exposure. A service can be created using SenseX activity monitoring and

14 Rakshit et al
contextual inference capabilities that infer the presence of a person in outdoor anduses weather data to estimate the vitamin D exposure.
2. Healthy Meetings: A significant amount of sitting time in an IT workplace happensduring the meetings. SenseX can be used to create a challenge to have meetingswhere people opt to stand, which can be compared across different departments ina workplace.
In essence, SenseX can help in creating many such challenges, which will drivesustained adoption of wellness programs. The layered architecture of SenseX can beused to enhance specific components, for example, accurate behavior modelling willhelp in enhancing the response time of the platform notifications. Similarly, pervasivesensing capabilities of SenseX could be enhanced to measure conditions such as sensingstress using keyboard and mouse activity.
References
1. Employee Wellness Program, https://hbr.org/2010/12/whats-the-hard-return-on-employee-wellness-programs
2. http://ergo.human.cornell.edu/CUESitStand.html3. http://usatoday30.usatoday.com/news/health/
medical/health/medical/cancer/story/2011-11-03/Prolonged-sitting-linked-to-breast-cancer-colon-cancer/51051928/1
4. http://www.runnersworld.com/health/sitting-is-the-new-smoking-\\even-for-runners
5. http://blogs.hbr.org/2013/01/sitting-is-the-smoking-of-our-\\generation/
6. http://endeavourpartners.net/assets/Wearables-and-the-Science-\\of-Human-Behavior-Change-EP4.pdf
7. Ergotron JustStand Survey and Index Report - JustStand.org http://www.juststand.org/portals/3/literature/SurveyIndexReport.pdf
8. Staiano AE1, Harrington DM, Barreira TV, Katzmarzyk PT., Sitting time and cardiometabolicrisk in US adults: associations by sex, race, socioeconomic status and activity level, BritishJournal of Sports Medicine http://www.ncbi.nlm.nih.gov/pubmed/23981954
9. Church, Timothy S., Diana M. Thomas, Catrine Tudor-Locke, Peter T. Katzmarzyk, Conrad P.Earnest, Ruben Q. Rodarte, Corby K. Martin, Steven N. Blair, and Claude Bouchard. ”Trendsover 5 decades in US occupation-related physical activity and their associations with obesity.”PloS One 6, no. 5 (2011): e19657.
10. Kwapisz, J. R., Weiss, G. M., and Moore, S. A. Activity recognition using cell phone ac-celerometers. ACM SigKDD Explorations Newsletter 12, 2 (2011), 74-82.
11. Brezmes, T., Gorricho, J.-L., and Cotrina, J. Activity recognition from accelerometer data ona mobile phone. In Distributed computing, articial intelligence, bioinformatics, soft comput-ing, and ambient assisted living. Springer, 2009, pp. 796-799.
12. Hache, G., Lemaire, E., and Baddour, N. Mobility change-of-state detection usinga smartphone-based approach. In Medical Measurements and Applications Proceedings(MeMeA), 2010 IEEE International Workshop on (2010), IEEE, pp. 43-46.
13. Khan, A. M., Lee, Y.-K., Lee, S., and Kim, T.-S. Human activity recognition via anaccelerometer-enabled-smartphone using kernel discriminant analysis. In Future InformationTechnology (FutureTech), 2010 5th International Conference on (2010), IEEE, pp. 1-6.

SenseX 15
14. Zhang, S., McCullagh, P., Nugent, C., and Zheng, H. Activity monitoring using a smartphone’s accelerometer with hierarchical classifcation. In Intelligent Environments (IE), 2010Sixth International Conference on (2010), IEEE, pp. 158-163.
15. Sun, David, Pablo Paredes, and John Canny. ”MouStress: detecting stress from mouse mo-tion.” In Proceedings of the 32nd annual ACM conference on Human factors in computingsystems, pp. 61-70. ACM, 2014.
16. Poh, Ming-Zher, Daniel J. McDuff, and Rosalind W. Picard. ”Non-contact, automated car-diac pulse measurements using video imaging and blind source separation.” Optics express18, no. 10 (2010): 10762-10774.
17. Mestha, Lalit K., Survi Kyal, Beilei Xu, Leslie Edward Lewis, and Vijay Kumar. ”Towardscontinuous monitoring of pulse rate in neonatal intensive care unit with a webcam.” In Engi-neering in Medicine and Biology Society (EMBC), 2014 36th Annual International Confer-ence of the IEEE, pp. 3817-3820. IEEE, 2014.
18. Wei, Lan, Yonghong Tian, Yaowei Wang, Touradj Ebrahimi, and Tiejun Huang. ”Automaticwebcam-based human heart rate measurements using laplacian eigenmap.” In Computer Vi-sionACCV 2012, pp. 281-292. Springer Berlin Heidelberg, 2013.
19. Sumida, Mayu, Teruhiro Mizumoto, and Keiichi Yasumoto. ”Estimating heart rate variationduring walking with smartphone.” Proceedings of the 2013 ACM international joint confer-ence on Pervasive and ubiquitous computing. ACM, 2013.
20. Balaji, B., Xu, J., Nwokafor, A., Gupta, R., & Agarwal, Y. (2013, November). Sentinel: occu-pancy based HVAC actuation using existing WiFi infrastructure within commercial buildings.In Proceedings of the 11th ACM Conference on Embedded Networked Sensor Systems (p.17). ACM.
21. Aishwarya Visvanathan, Rohan Banerjee, Anirban Dutta Choudhury, Aniruddha Sinha,ShaswatiKundu. ”Smart Phone Based Blood Pressure Indicator”, MobileHealth’14, August11 - 14 2014, Philadelphia, PA, USA
22. Pal A., Sinha A., Choudhary A., Chattopadyay T., Visvanathan A. A robust heart rate de-tection using smart-phone video,MobileHealth ’13 In Proceedings of the 3rd ACM MobiHocworkshop on Pervasive wireless healthcare Pages 43-48
23. Grimaldi D., Kurylyak Y., Lamonaca F., Nastro A., Photoplethysmography Detection bySmartphones Videocamera, in Proc. IEEE International Conference IDAACS2011, September2011, pp. 488-491.
24. Scully C. G, Lee J., MeyerJ., Gorbach A.M., Granquist-Fraser D., Mendelson Y., Chon K.H.,Physiological Parameter Monitoring from Optical Recordings With a Mobile Phone IEEETrans. on Biomedical Engineering, Vol. 59, No.2, February 2012, pp. 303-306.
25. Kang, S., Kwon, S., Yoo, C., Seo, S., Park, K., Song, J., and Lee, Y. Sinabro: Sinabro: Oppor-tunistic and unobtrusive mobile electrocardiogram monitoring system. Proc. Of HotMobile,Santa Barbara, CA, 2014
26. Clayton Epp, Michael Lippold, and Regan L. Mandryk, ”Identifying Emotional States usingKeystroke Dynamics”, CHI 2011, May 712, 2011, Vancouver, BC, Canada.
27. L. Zeng L, P. Hsueh, H. Chang, ”Greenolive: an Open Platform for Wellness ManagementEcosystem”. In IEEE/INFORMS International Conference on Service Operations and Logis-tics (SOLI 2010).
28. S.-H. Leel, J. H. Song, J.-H. Ye, H. J. Lee, B.-K. Yi, and I. K. Kim, SOA-based integratedpervasive personal health management system using PHDs, in Proc. 4th Int. Conf. PervasiveComput. Technol.Healthcare, Munich, Germany, Mar. 2010, pp. 14.
29. Y. Li, L. Guo, C. Wu, C.-H. Lee, and Y. Guo, ”Building a cloud-based platform for personalhealth sensor data management,” in Biomedical and Health Informatics (BHI), 2014 IEEE-EMBS International Conference on, 2014, pp. 223-226
30. C He, X Fan, Y Li, Toward ubiquitous healthcare services with a novel efficient cloud plat-form. IEEE Transactions on Biomedical Engineering 60 (1), 230-234
Related Documents