Design and Co-simulate control of an Extractive Distillation Column Using Aspen plus Dynamics with MATLAB and Simulink Toolbox Thesis Report ENG470 – Engineering Honours Thesis A report submitted to the School of Engineering and Energy, Murdoch University in partial fulfilment of the requirements for the degree of Bachelor of Engineering. Muhammad Syahmi Khairul Sham 1/28/2016 Unit Co-ordinator: Dr. Gareth Lee Thesis Supervisor: Dr. Linh Vu

Welcome message from author
This document is posted to help you gain knowledge. Please leave a comment to let me know what you think about it! Share it to your friends and learn new things together.
Transcript
Design and Co-simulate control of an Extractive
Distillation Column Using Aspen plus Dynamics
with MATLAB and Simulink Toolbox Thesis Report
ENG470 – Engineering Honours Thesis
A report submitted to the School of Engineering and Energy, Murdoch University in partial fulfilment of
the requirements for the degree of Bachelor of Engineering.
Muhammad Syahmi Khairul Sham
1/28/2016
Unit Co-ordinator: Dr. Gareth Lee
Thesis Supervisor: Dr. Linh Vu
I, Muhammad Syahmi Khairul Sham, submit this document to School of Engineering and Energy
completing the requirements of the undergraduate course at Murdoch University. I with this declare
that this thesis document is my own work except the idea of the project which is referenced.
Furthermore, this document has not been submitted to any other school or academic institution.
___________________________ Date: _____________
Muhammad Syahmi Khairul Sham

i
Abstract
This case study investigates the co-simulation of an extractive distillation column using Aspen Dynamics
together with MATLAB Simulink toolbox. This extractive distillation column separates Methyl Cyclo
Hexane (MCH) from Toluene by using input Phenol as a third component (entractant) to move the
ternary system beyond the azeotropic point. The study started with testing the steady state model of
the process in Aspen Plus; then continued with importing and testing the process dynamic model in both
manual and automatic modes using Aspen Dynamics. Finally, the process model in Aspen Dynamics was
connected to the built-in controllers in Simulink then the co-simulation of the controlled process was
performed using Aspen Dynamics together with the MATLAB Simulink toolbox.
The case study was an example taken from Aspen Dynamics version 8.4v. With the newest version of
Aspen Dynamics and Simulink version 8.4 operating platform Windows 7, it is required to install the 32
bit MATLAB to address compatibility issues between Aspen Dynamics and MATLAB.
The same control system design including four conventional controllers was implemented by Aspen
Tech in two different software package structures: in Aspen Dynamics stand-alone simulations and in
Aspen Dynamics – Simulink co-simulations to control the feed tank level, reboiler level, reflux drum level
and top stream pressure of column by adjusting feed 2 flowrate, coolant flowrate to condenser, bottom
(Toluene and Phenol) flowrate and product (MCH) flowrate. Then a new controller was developed in
Aspen Dynamics and co-simulation to control the product (MCH) purity by adjusting entrainer (Phenol)
flowrate. Advanced controller (DMC) has tried to be developed in co-simulation to replace PI controller.
However, attempts to develop DMC had failed after few trials.
All conventional controllers were tuned using auto tuning method in Aspen Dynamics using a special
tool, which is 'tuning' tool. It gives the best control parameters to achieve the best possible control
response. Set point changes and disturbance changes have been made to PI controllers and variables
respectively, and it is intended to investigate the effect on product purity. The new controller is very
helpful in improving the level of product purity. All run shows that Aspen Dynamics stand alone, or co-
simulation gives the same results in every test.
ii
Before developing Dynamics Model control (DMC) in co-simulation, DMC examples exercises from ‘ENG
420’ was implemented on a simple first order system in MATLAB to understand the basics of the
predictive control strategy along with the effect of design parameters.
All results obtained are discussed in Section Results and Discussion. Guideline for the next thesis
student has been outlined at the end of this report. Overall, most of the main objectives of this thesis
was achieved with very satisfying results. However due to unforeseen circumstances and time
constraints, DMC controller is not fully functional.

iii
Acknowledgements I welcome this opportunity to acknowledge, and to express my gratitude and appreciation towards my
supervisor, Dr. Linh Vu for her passion for helping, guiding and spend much time throughout this
project. I consider myself fortunate to be able working with her as she is entirely dedicated to giving
opinions and advice in preparing this report, and pushing me further to give my best effort. Also, I would
like to thank Will Stirling for his support and technical assistance during this project was carried out. He
had provided necessary facilities during the running of this project. Thank you also to all my colleagues,
especially Mohd Umair for his help and support during my project work.
Lastly and never forgotten, my deepest gratitude goes to my family for being my backbone throughout
my journey in completing this project.

iv
Table of Contents Abstract .......................................................................................................................................................... i
Acknowledgements ...................................................................................................................................... iii
1 Introduction and Layout of the Project ................................................................................................ 1
2 Background, Scope, and Aim of the Project ......................................................................................... 3
2.1 Project Overview ........................................................................................................................... 3
2.2 Software Overview ........................................................................................................................ 6
2.2.1 Aspen Plus ............................................................................................................................. 6
2.2.2 Aspen Dynamics .................................................................................................................... 7
2.2.3 Simulink ................................................................................................................................. 7
2.3 Solvent (entractant) Overview ...................................................................................................... 8
2.4 Project Scope ................................................................................................................................ 9
2.5 Project Aims ................................................................................................................................ 10
3 Process modelling and simulation in Aspen Plus ................................................................................ 11
3.1 Component Selection .................................................................................................................. 12
3.2 Selection of Distillation Column .................................................................................................. 13
3.3 Azeotropic Distillation Analysis ................................................................................................... 13
3.4 Steady State Simulation .............................................................................................................. 17
4 Dynamic simulation and process control in Aspen Dynamics ............................................................ 18
4.1 Manual Operation of the System ................................................................................................ 20
4.2 Control Loop Design .................................................................................................................... 22
4.3 Controller Tuning ........................................................................................................................ 24
4.4 Set Point Change ......................................................................................................................... 26
4.5 Disturbance Change .................................................................................................................... 26
5 Co-simulation of the Extractive Distillation Column using Aspen Dynamics and MATLAB Simulink
Toolbox ....................................................................................................................................................... 27
5.1 Linking Aspen Dynamics and MATLAB Simulink ......................................................................... 28
5.2 DMC Design Parameter ............................................................................................................... 30
6 Results and Discussion ........................................................................................................................ 31
6.1 Sensitivity of Purity ..................................................................................................................... 31
6.2 Open Loop System Testing Aspen Dynamics Stand-Alone and Co-Simulation ........................... 33
6.3 Set Point Tracking Aspen Dynamics Stand-Alone and Co-Simulation......................................... 33
6.4 Disturbance Rejection Aspen Dynamics Stand-Alone and Co-Simulation .................................. 39

v
6.4.1 Phenol Flowrate .................................................................................................................. 39
6.4.2 Coolant Flowrate ................................................................................................................. 44
6.5 Effects of Phenol Flowrate on Product Purity ............................................................................. 50
6.6 Developing Dynamic Matrix Control (DMC) ............................................................................... 53
7 Conclusion ........................................................................................................................................... 54
8 Future Work ........................................................................................................................................ 55
8.1 Review the Composition Controller and the Dynamic Matrix Control (DMC) ............................ 55
8.2 Implementing the Solvent Recovery Column ............................................................................. 55
8.3 Relative Gain Analysis (RGA) ....................................................................................................... 56
8.4 Aspen Custom Modeler (ACM) ................................................................................................... 57
9 Bibliography ........................................................................................................................................ 58
10 Works Cited ..................................................................................................................................... 60
11 Appendices ...................................................................................................................................... 63
11.1 Appendix A – Results ................................................................................................................... 63
11.1.1 Feed Stream ........................................................................................................................ 63
11.1.2 Product Stream ................................................................................................................... 63
11.1.3 Results of process stream ................................................................................................... 63
11.2 Appendix B – Open loop System ................................................................................................. 65
11.3 Appendix C – Set Point Change ................................................................................................... 69
vi
List of Figures
Figure 1: Extractive Column and Solvent Recovery Column [3] ................................................................... 4
Figure 2: Residue Curve Map ...................................................................................................................... 14
Figure 3: Main Flowsheet ............................................................................................................................ 16
Figure 4: Controller Faceplates (Manual Mode) ......................................................................................... 20
Figure 5: Open Loop Flowshee .................................................................................................................... 21
Figure 6: Controller Faceplates (Auto Mode) ............................................................................................. 22
Figure 7: Closed Loop Flowsheet ................................................................................................................ 23
Figure 8: Test ‘Tuning’ Tool ......................................................................................................................... 25
Figure 9: Calculation ‘Tuning’ Tool .............................................................................................................. 25
Figure 10: AMS Configuration Block ........................................................................................................... 29
Figure 11: Phenol Flowrate vs. Purity ......................................................................................................... 32
Figure 12(a): Step Change in Feed Level +10% ........................................................................................... 35
Figure 13(a): Step Change in Pressure -10% ............................................................................................... 37
Figure 14(a): Step up Phenol (entractant) Flowrate (Disturbance Rejection) ............................................ 40
Figure 15(a): Step down Phenol (entractant) Flowrate (Disturbance Rejection) ....................................... 42
Figure 16(a): Step up Coolant Flowrate (Disturbance Rejection) ............................................................... 45
Figure 17(a): Step down Coolant Flowrate (Disturbance Rejection) .......................................................... 47
Figure 18: Step up Purity from 0.97257 to 0.98634 in Aspen Dynamics and Co-simulation ...................... 51
Figure 19: Error When Implementing DMC ................................................................................................ 53
Figure 20: Gain Matrix (G) ........................................................................................................................... 56
Figure 21: Product Purity Concentration When Step up Feed 2 Flowrate To 60% ..................................... 65
Figure 22: Product Purity Concentration When Step down Feed 2 Flowrate To 40% ................................ 65
Figure 23: Product Purity Concentration When Step up Coolant Flowrate To 60% ................................... 66
Figure 24: Product Purity Concentration When Step down Coolant Flowrate To 40% .............................. 66
Figure 25: Product Purity Concentration When Step up MCH Flowrate To 60% ....................................... 67
Figure 26: Product Purity Concentration When Step down MCH Flowrate To 40% .................................. 67
Figure 27: Product Purity Concentration When Step up Bottom Flowrate To 60% ................................... 68
Figure 28: Product Purity Concentration When Step down Bottom Flowrate To 40% .............................. 68
Figure 29: Step up Feed Tank Level Set Point To 60% ................................................................................ 69
Figure 30: Step down Feed Tank Level Set Point To 40% ........................................................................... 70
Figure 31: Step up Pressure Set Point To 60% ............................................................................................ 71
Figure 32: Step down Pressure Set Point To 40% ....................................................................................... 72
Figure 33: Step up Reflux Level Set Point To 60% ....................................................................................... 73
Figure 34: Step down Reflux Level Set Point To 40% .................................................................................. 74
Figure 35: Step up Reboiler Level Set Point To 60% ................................................................................... 75
Figure 36: Step down Reboiler Level Set Point To 40% .............................................................................. 76
vii
List of Tables
Table 1: Types of Components.................................................................................................................... 12
Table 2: Components Specification ............................................................................................................ 12
Table 3: Synthesis Analysis .......................................................................................................................... 15
Table 4: Stream Results ............................................................................................................................... 17
Table 5: The Control Strategies ................................................................................................................... 22
Table 6: Controller Parameters ................................................................................................................... 26
Table 7: Sensitivity Analysis Results ............................................................................................................ 31
Table 8: Purity Response (Open Loop System) ........................................................................................... 33
Table 9: Comparison between Phenol Flowrate in Aspen Plus, Aspen Dynamics, and Co-simulation ...... 50
Table 10: Feed Stream ................................................................................................................................ 63
Table 11: Product Stream ........................................................................................................................... 63
Table 12: Results of Process Stream ........................................................................................................... 63

1
1 Introduction and Layout of the Project
Engineering students at Murdoch University, especially those enrolled in Instrumentation and Control
Engineering (ICE) course have been exposed to various software packages within three years of study.
The most used software in the process control area includes Aspen One, MATLAB and toolboxes, and
Lab VIEW.
Each of these packages has its advantages and disadvantages in the process modelling and simulation.
The primary objective of this project is to combine the special features of each software package, for
example, co-simulating a distillation column using Aspen Plus, Aspen Dynamics, together with MATLAB
Simulink toolbox. To achieve this target, the following work has been covered throughout the project
and is presented in the thesis.
Section 1: Introduction and layout of the project
Section 2: Background, scope, and aim of the project
This section describes the extractive distillation column used in the case study of the project.
The comparison of different software packages used in modelling and simulation are presented.
The scope and aim of the project are defined.
Section 3: Process modelling and simulation in Aspen Plus
This section details the modelling of the extractive distillation column in Aspen Plus. Results of
the simulations essential for exporting the model to Aspen Dynamics are presented as well
Section 4: Dynamic simulation and process control in Aspen Dynamics
This section defines the dynamic simulation of the extractive distillation column in Aspen
Dynamics. The system will be tested in open loop and closed loop. The purity of distillate is
controlled to achieve the quality of the product as required.
Section 5: Co-simulation of the extractive distillation column using Aspen Dynamics and
MATLAB Simulink toolbox
This section illustrates the dynamic simulation of the extractive distillation column with co-
simulating using Aspen Dynamics and MATLAB Simulink toolbox. The process is tested by the
same method as in Section 4.

2
Section 6: Results and discussion
This section describes and discusses the outcomes of the simulation obtained in the case study.
Section 7: Conclusion
This section summarises and concludes the report.
Section 8: Future work
This section explains the future work suggested for future students.

3
2 Background, Scope, and Aim of the Project This project discusses the co-simulation of extractive distillation column using Aspen Plus Dynamics with
Simulink and MATLAB. This section contains all necessary background and related information of the
simulation; it covers an overview of the project, software, distillation column and Solvent (entractant)
used in these simulations.
2.1 Project Overview This project focuses on steady state and dynamic simulations of distillation column using Aspen Plus,
Aspen Dynamic, and Simulink. Aspen Plus is a steady state simulation to obtain modelling of the
extractive column, as the aim is to express dynamic processes according to the laws of conservation of
mass and energy. Therefore, it is very helpful especially in understanding the process behaviour and
control design. Dynamic simulation is performed by Aspen Dynamics to understand system dynamics.
Lastly, co-simulate the process of the distillation column is conducted using Aspen Dynamics and
Simulink.
Usually in the industry, extractive distillation process is a combination of some other processes, in which
it can be divided into two parts (refer to Figure 1); part one is the extractive column and part two is
solvent recovery column. For the extractive column (part one), it is used to separate substance from
composition mixture of the solvent that is hard to be separated by conventional distillation, producing a
distillate product comprising of the substances with desired purity. This is done by using a third
component (entractant) to give effect to the separation of the substances. The component use must
non-volatile, higher boiling point, and miscible with mixtures, but it does not form an azeotrope in the
mixture [1]. The difference in the interaction of the third component and the mixture causes a change in
relative volatility. This allows the new mixture of components and solvent to be separated. The
component with the highest volatility will separate as the main product as the top stream [2]. For the
solvent recovery column (part two), it is used to separate the low volatility solvent from the extractive
column, with this the entrainer is circulating round and round.
The components used in the case study are Methyl Cyclo Hexane (MCH), Toluene, and Phenol. The first
feed stream is a mixture of Methyl Cyclo Hexane (MCH) and Toluene while the second feed stream is
Phenol (entractant). The mixture of MCH and Toluene will be separated by the Phenol, which acts as the
third component. Phenol is extracting Toluene from the mixture, and these two components go down to
the bottom of the distillation column because they are heavy elements. Meanwhile, MCH is going to the
top of distillation column as it is a light component [1]. Then the mixture of Toluene and Phenol after

4
leaving the extractive column is fed to the solvent recovery column to separate Toluene and Phenol. In
the solvent recovery column, pure Toluene is obtained at the top and Phenol (entractant) at the bottom
stream, which is recycled to be fed to the extraction column as the entrainer. It essentially charges the
system with the amount of entrainer and that entrainer is recirculated in the system. This means under
ideal conditions, none of the entrainer is lost. Figure 1 shows the system of the extractive column and
solvent recovery column.
Figure 1: Extractive Column and Solvent Recovery Column [3]
In this case study only the extractive column is modelled, simulated and controlled. While, the solvent
recovery is left for future students. The extractive column will be tested starting with steady state
process until dynamic process. Aspen Plus is used to perform the steady state process while Aspen
Dynamics and Simulink are used to run the dynamic process. In the dynamic process, the system was
tested with open and closed loop system, and both the software programs are using the same
5
parameters for the controllers. Results of both software were compared to determine which software is
better for controlling the process.
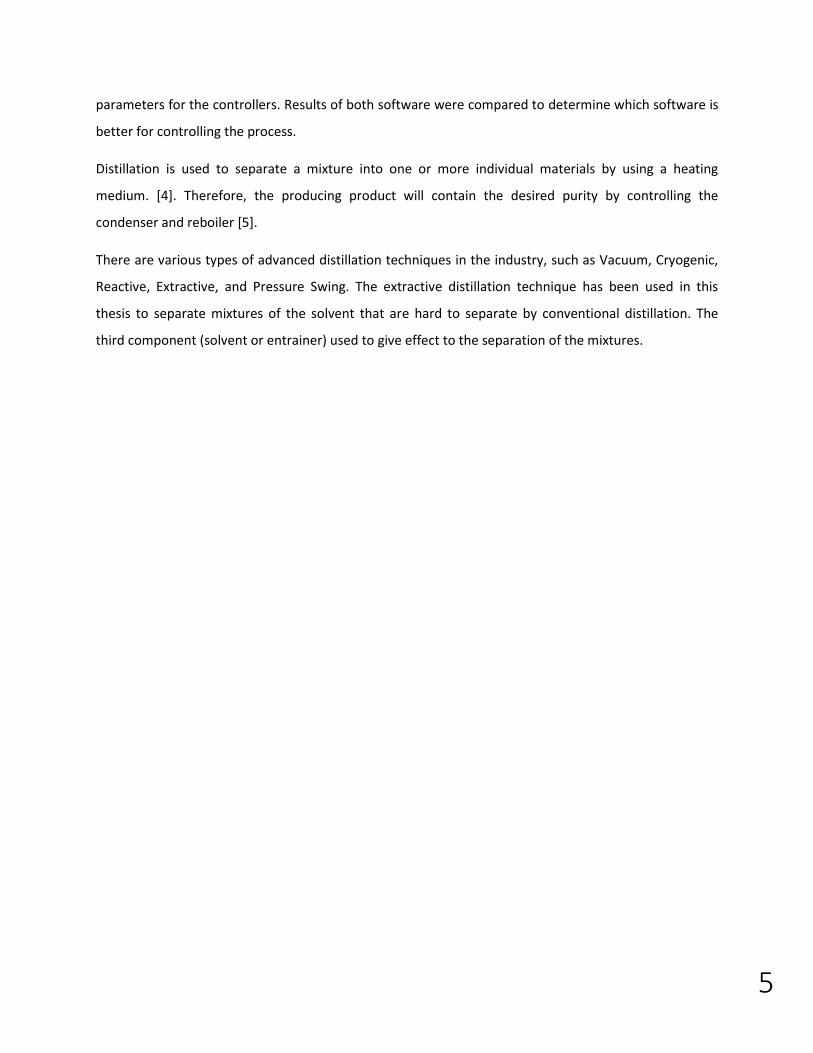
Distillation is used to separate a mixture into one or more individual materials by using a heating
medium. [4]. Therefore, the producing product will contain the desired purity by controlling the
condenser and reboiler [5].
There are various types of advanced distillation techniques in the industry, such as Vacuum, Cryogenic,
Reactive, Extractive, and Pressure Swing. The extractive distillation technique has been used in this
thesis to separate mixtures of the solvent that are hard to separate by conventional distillation. The
third component (solvent or entrainer) used to give effect to the separation of the mixtures.
6
2.2 Software Overview This project is about co-simulation of the controller for distillation column by using Aspen Plus, Aspen
Dynamics, and MATLAB Simulink as each software package used has different capabilities and purposes.
This section will discuss the software that has been used to perform simulations for this project.
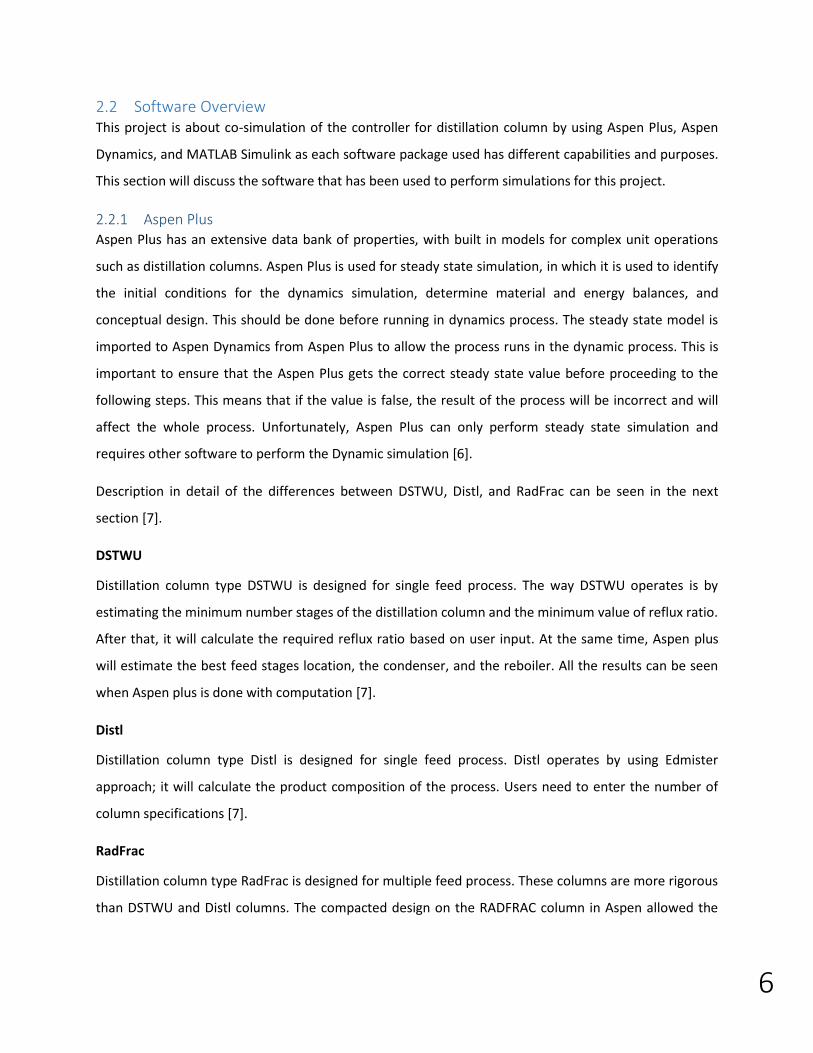
2.2.1 Aspen Plus Aspen Plus has an extensive data bank of properties, with built in models for complex unit operations
such as distillation columns. Aspen Plus is used for steady state simulation, in which it is used to identify
the initial conditions for the dynamics simulation, determine material and energy balances, and
conceptual design. This should be done before running in dynamics process. The steady state model is
imported to Aspen Dynamics from Aspen Plus to allow the process runs in the dynamic process. This is
important to ensure that the Aspen Plus gets the correct steady state value before proceeding to the
following steps. This means that if the value is false, the result of the process will be incorrect and will
affect the whole process. Unfortunately, Aspen Plus can only perform steady state simulation and
requires other software to perform the Dynamic simulation [6].
Description in detail of the differences between DSTWU, Distl, and RadFrac can be seen in the next
section [7].
DSTWU
Distillation column type DSTWU is designed for single feed process. The way DSTWU operates is by
estimating the minimum number stages of the distillation column and the minimum value of reflux ratio.
After that, it will calculate the required reflux ratio based on user input. At the same time, Aspen plus
will estimate the best feed stages location, the condenser, and the reboiler. All the results can be seen
when Aspen plus is done with computation [7].
Distl
Distillation column type Distl is designed for single feed process. Distl operates by using Edmister
approach; it will calculate the product composition of the process. Users need to enter the number of
column specifications [7].
RadFrac
Distillation column type RadFrac is designed for multiple feed process. These columns are more rigorous
than DSTWU and Distl columns. The compacted design on the RADFRAC column in Aspen allowed the
7
modelling of condensers and reboilers to be taken care of within the column’s specifications. This
eliminated the need for the pumps, reflux tanks, heat streams, and heat exchangers [7].
2.2.2 Aspen Dynamics Aspen Dynamics is used for dynamic simulation as it is designed to simulate the dynamic process. Aspen
Dynamics is firmly integrated with Aspen Plus, where the Aspen Plus is a simulator for steady state. Then
the model in the Aspen Plus is imported into Aspen Dynamics to run the dynamics simulation, and this
allows the existing steady state in Aspen Plus simulation to create a dynamics simulation [1]. This
software can identify the dynamic of the process, implement and control loop tuning controller.
However, the control scheme in Aspen Dynamics is limited to conventional controllers [8].
2.2.3 Simulink Simulink software is used to perform dynamic simulation similar to Aspen Dynamics. Simulink can
develop conventional and advanced control scheme, and it also can perform real-time simulation [9].
The real time simulation can be done when a physical device replaces the virtual device. Thus, costs are
reduced when a replacement is carried out, and the quality of the physical system can be improved.
Besides, the simulation can be tested without having prototypes and tests can be conducted
continuously. Realistic simulation means inputs and outputs in a virtual world simulation must be
updated simultaneously with the real world. Therefore, real-time simulation is required to ensure that
realistic simulation occurs. Simulink also has a special feature called control system toolbox and offers
industry-standard algorithms in designing, tuning, and analysing the control systems. Control System
Toolbox provides facilities to examine the model [10]. Thus, the performance parameters can be
checked, such as settling time and maximum overshoot. Aspen Dynamics and Simulink will be
implemented from the same type of controller scheme and parameters values. Therefore, the results
can be compared to verify the results of which are better for this process control strategy [11].
8
2.3 Solvent (entractant) Overview In this thesis, extractive methods will be used. It is the process by which a third component or solvents
are used to give effect to the separation of the chemical. The third component will act to generate or
increase volatility differences between components to be separated. The third component and the less
volatile component will flow downstream of the distillation column so that the subsequent distillation
process can recover the extracted components. On the other hand, the non-extracted component will
be distilled at the top of the distillation column [2].
In choosing a solvent, several things should be considered [2]:
The solvent can enhance the natural volatility of the main component.
Have low latent heat.
The solvent is not corrosive and not a toxic agent.
Easily dissolved in the main component, so as to not lead to the formation of two phases.
Easy to stabilize the temperature of distillation and solvent extraction.
Quality and capability of the solvent must be considered.

9
2.4 Project Scope This thesis is intended to investigate the co-simulation of a process of the distillation column by using
Aspen Plus, Aspen Dynamics, and MATLAB Simulink. This case study is only involved with the extractive
distillation column, the process modelling, and the steady state simulation in Aspen Plus, importing the
steady state model from Aspen Plus to Aspen Dynamics, and the designing and testing the controllers in
Aspen Dynamics and MATLAB Simulink toolbox.
The aim is to revise an example that has been done in 2004 with the new software versions and new
operating system. Sensitivity analysis is conducted in Aspen Plus to find the mass flowrate of the phenol
entering the distillation column so that the purity of Methyl Cyclo Hexane (MCH) leaving the distillation
column can achieve at least 0.98 molar or 98%.
Existing controllers are tuned in Aspen Dynamics to get the appropriate parameters. Then set point
changes are made in each controller while disturbance changes are introduced in certain variables to
examine the impact and response onto the purity of the product. Finally, a controller is setup to control
the flowrate of phenol. The same method is used in co-simulation to test the purity of the product.
However, working with another different column is not in the scope of this project.
10
2.5 Project Aims The primary aim of this project is to test the co-simulation and connection of different software
programs. This is because there was an error to link Aspen Dynamics version 8.4v and MATLAB Simulink
version 8.4 by using the Windows 7 operating platform.
PI controllers is used in Aspen Dynamics and Simulink to control the feed tank level, reboiler level,
reflux drum level, and top stream pressure for an extractive distillation and a new controller in the
phenol flowrate (entractant).
The development of a project plan is furthered with efforts focusing on some areas to attain the set
goals. Following to the very sophisticated software involved, it is important to understand every
software used. The areas of exploration include:
Understanding and getting familiar with Aspen Plus.
Exploring Aspen Dynamics
Mastering Simulink and MATLAB.
The crucial purpose of choosing to explore in depth is due to the limitation of understanding in using the
software. Throughout the further understanding on the real interactions between the streams and on
the software especially how data is sent, received and collected
11
3 Process modelling and simulation in Aspen Plus
Aspen Plus is well-known simulation software in the industry [6]. This is because of its ability to solve
problems involving many calculations, where most of the equations used are very complicated. It is
difficult and almost impossible to solve them by hand due to human errors and time constraints. This
software is often used in industrial oil production, refining, and environmental studies.
This software can predict the behaviour of a process from “engineering relationships such as mass and
energy balances, phase and chemical equilibrium, and reaction kinetics” [12]. With practical operation
and reliable model, it allows process and control engineers to simulate process like an actual plant.
Each process has its process model, and thus Aspen Plus is used for the process model. There are three
steps to follow to obtain the process model; flowsheet, specifying the chemical components and
operating conditions. Aspen Plus acts in regard to all specifications and simulations involved in different
processes. Also, it predicts the behaviour and calculates the results of the system. Aspen Plus will list the
results for each of the streams and the unit when the calculation is complete [13].
1. Flowsheet
The process flowsheet model will reflect the entire system. The flowsheet shows the inlet streams
entering into the unit operation (distillation column, reboiler, and heat exchanger) and outlet
streams from the unit operation, thus all inlet streams and outlet streams can be identified [13].
2. Chemical Components
The components used in the Aspen should be defined before moving to the next step. Each of the
components used must be explained in detail to facilitate simulation [13].
3. Operating Conditions
Normally, all the operating units have specific operating conditions such as temperature, and
pressure. It is determined according to the operating conditions of the process [13].
12
3.1 Component Selection
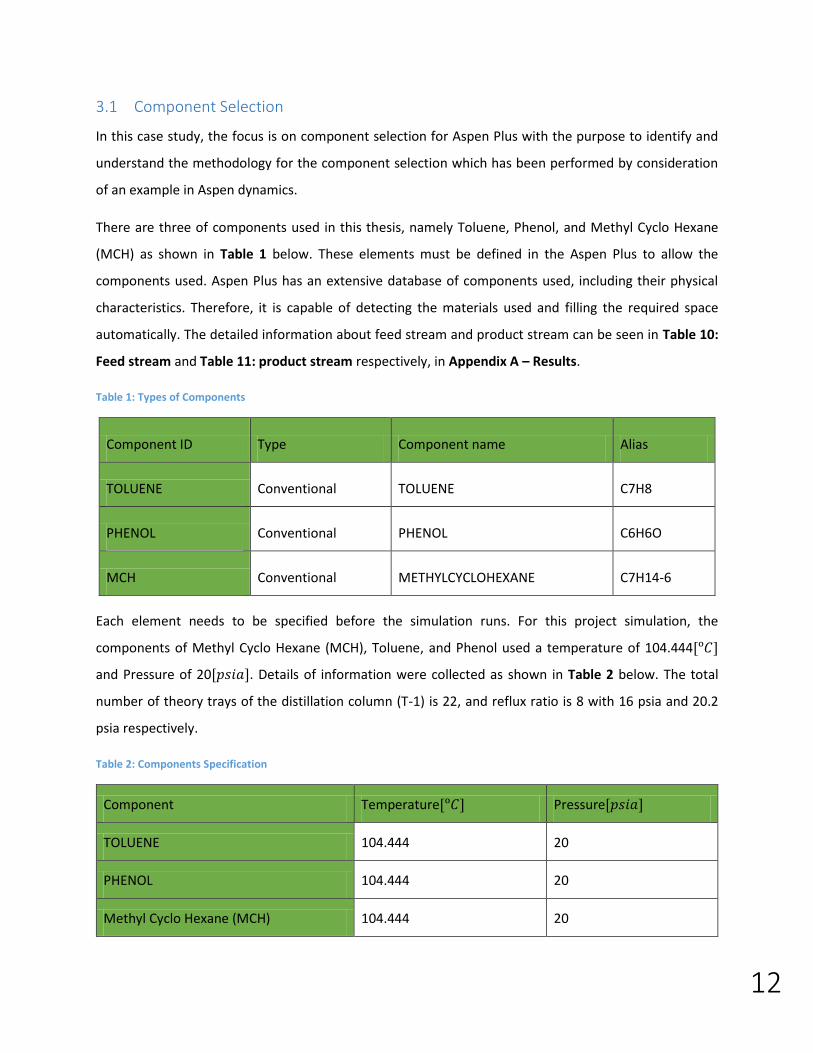
In this case study, the focus is on component selection for Aspen Plus with the purpose to identify and
understand the methodology for the component selection which has been performed by consideration
of an example in Aspen dynamics.
There are three of components used in this thesis, namely Toluene, Phenol, and Methyl Cyclo Hexane
(MCH) as shown in Table 1 below. These elements must be defined in the Aspen Plus to allow the
components used. Aspen Plus has an extensive database of components used, including their physical
characteristics. Therefore, it is capable of detecting the materials used and filling the required space
automatically. The detailed information about feed stream and product stream can be seen in Table 10:
Feed stream and Table 11: product stream respectively, in Appendix A – Results.
Table 1: Types of Components
Component ID Type Component name Alias
TOLUENE Conventional TOLUENE C7H8
PHENOL Conventional PHENOL C6H6O
MCH Conventional METHYLCYCLOHEXANE C7H14-6
Each element needs to be specified before the simulation runs. For this project simulation, the
components of Methyl Cyclo Hexane (MCH), Toluene, and Phenol used a temperature of 104.444
and Pressure of 20 . Details of information were collected as shown in Table 2 below. The total
number of theory trays of the distillation column (T-1) is 22, and reflux ratio is 8 with 16 psia and 20.2
psia respectively.
Table 2: Components Specification
Component Temperature Pressure
TOLUENE 104.444 20
PHENOL 104.444 20
Methyl Cyclo Hexane (MCH) 104.444 20

13
3.2 Selection of Distillation Column
Selection of distillation column was performed by Aspen. Nevertheless, the selection was studied to
understand the reason behind of the selection and for the purpose of learning.
Aspen Plus has multiple choices of distillation column namely DSTWU, Distl, and RadFrac. Each of them
has different uses and capabilities. To simulate the distillation columns with reboiler and reflux,
RADFRAC columns were used. Moreover it is more rigorous than DSTWU columns and suitable for
extractive distillation for allowing multiple product and feed streams.
The compacted design on the RADFRAC column in Aspen allowed the modelling of condensers and
reboilers to be taken care of within the column’s specifications.
3.3 Azeotropic Distillation Analysis “A balanced composition of vapor and liquid in defined as an azeotrope. In the distillation column, the
liquid and vapor compositions will therefore remain same. An azeotrope is therefore categorized as
Distillation Boundary or Sets of Limits” [14]. This means no matter how tall the tower is, or no matter
how much reflux is used even if the column is operating at the total reflux, the best it can do is getting a
distillate that is close to the azeotropic composition. However, it simply cannot be produced using
standard distillation because of this azeotrope, so no matter how much it is boiled; the vapor is not any
richer in the light component. Therefore, no further separation is possible, no matter how tall the
column is. This composition cannot be bypassed, and it is impossible to reach pure Methyl Cyclo Hexane
(MCH) [15].
There are various processing techniques to alter the vapor-liquid equilibrium and the system such that
pure Methyl Cyclo Hexane (MCH) and pure Toluene can be obtained. There are two common ways; one
is referred to as homogeneous extractive distillation, and the other is heterogeneous azeotropic
distillation. The former is a type of stage separation in which the mixture is not separated into different
stages. However, the latter splits the mixture into aqueous and organic stages. The mixture in the
aqueous stage is richer in water, and the mixture is richer in organic for the organic stage. Hence, in
heterogeneous azeotropic distillation - by adding an entrainer or a solvent - it will mostly cause a phase
split, whereby the liquid separates into two stages which are water rich and organic rich, and because of
this stage separation it crosses the azeotropic composition. The idea behind homogeneous extractive
distillation is to add an entrainer, which is heavy. It preferentially soaks up either component Methyl
Cyclo Hexane (MCH) or component Toluene causing the alteration of the vapor-liquid equilibrium in

14
such a way that it absorbs one of the elements, and, therefore, a pure Methyl Cyclo Hexane (MCH) and
pure Toluene can be obtained [16].
Figure 2: Residue Curve Map

15
Notice that all the residue curves in Figure 2 were ending up at Phenol. This means Phenol is an
attractor or also known as the stable node, in which it attracts all residue curves towards itself. The
azeotropic composition at temperature 100.72ᵒC being the lightest of the entire residue curves and it
does not draw any residue curves, but all residue curves emanate from it, this is called an unstable node.
Methyl Cyclo Hexane (MCH) and Toluene are neither attracted nor unstable nodes. These are called
saddles depending on what the initial condition is. For a better understanding, Table 3 below shows the
classification and temperature of each component [17].
Table 3: Synthesis Analysis
Temperature (ᵒC) Classification Type No. Comp. Toluene Phenol MCH
110.68 Saddle Homogeneous 1 1.0000 0.0000 0.0000
181.93 Stable node Homogeneous 1 0.0000 1.0000 0.0000
100.73 Saddle Homogeneous 1 0.0000 0.0000 1.0000
100.72 Unstable node Homogeneous 2 0.0206 0.0000 0.9794
From the residue curve in Figure 2, it can be seen that (MCH) and Toluene form an azeotrope while
Phenol is an entrainer, which is heavy and does not form an azeotrope with either (MCH) or Toluene.
Since both (MCH) and Toluene vertices are saddles in a simple configuration where it has a single feed, it
cannot reach Methyl Cyclo Hexane (MCH) or Toluene. To reach Methyl Cyclo Hexane (MCH) as a vertex,
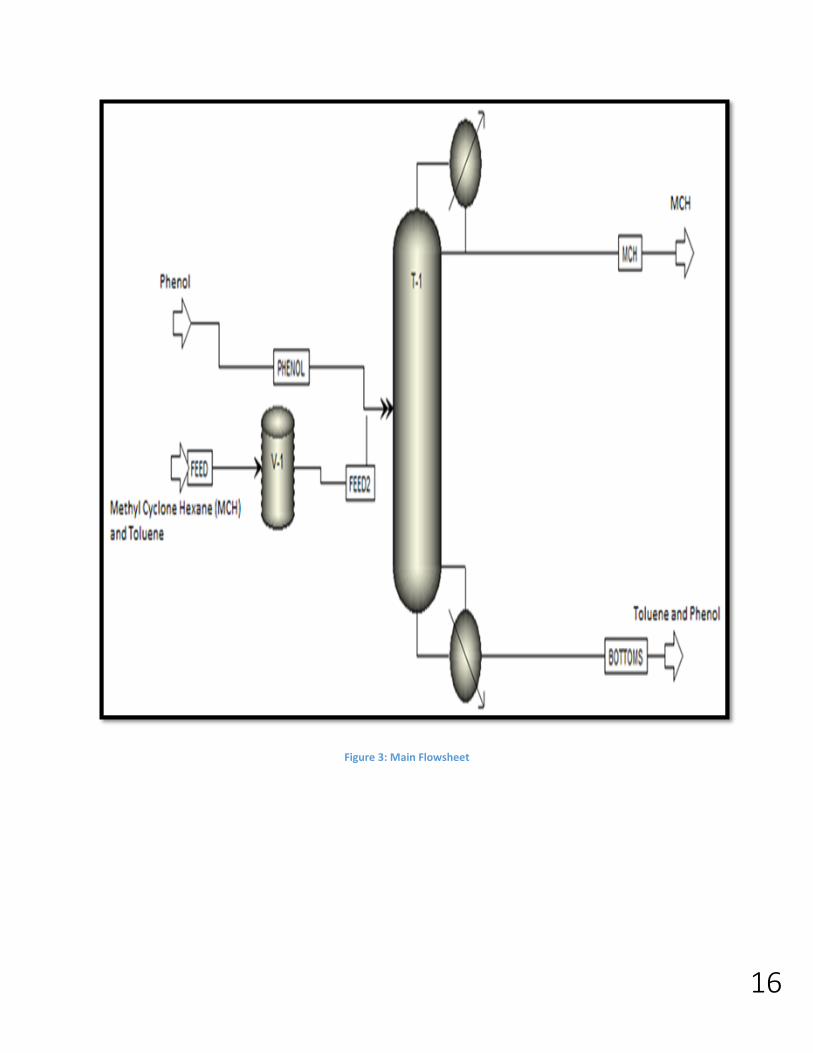
it is necessary to add the entrainer, not with Feed Stream, but somewhere on top as shown in Figure 3
below. Therefore, to sufficiently break the azeotrope, it is necessary to have the heavy entrainer on
almost all trays which require the heavy solvent Phenol fed some place near the top of the column
above the feed. Therefore, the top product is essentially Methyl Cyclo Hexane (MCH) with a little bit of
Phenol, and the bottom product is all of the Toluene, all of the Phenol, and maybe a little bit of Methyl
Cyclo Hexane (MCH). However, if the entrainer is mixed with the feed, the separation becomes
infeasible.
16
Figure 3: Main Flowsheet

17
3.4 Steady State Simulation The simulation of steady state distillation column was carried out, and summary of results is presented
in Table 4 below. The full results can be seen in Table 12 in Appendix A – Results section.
Table 4: Stream Results
Units BOTTOMS FEED FEED2 MCH PHENOL
Component Mole Flow
TOLUENE KMOL/SEC 0.0245417 0.0251995 0.0251995 0.000657837 0
PHENOL KMOL/SEC 0.1511644 0 0 3.30E-05 0.1511975
MCH KMOL/SEC 0.000690852 0.0251995 0.0251995 0.0245087 0
TOLUENE 0.1391293 0.5 0.5 0.0260951 0
PHENOL 0.8569557 0 0 0.00131024 1
MCH 0.00391506 0.5 0.5 0.9725946 0
Mole Flow KMOL/SEC 0.176397 0.0503991 0.0503991 0.0251995 0.1511975
Mass Flow KG/SEC 16.55567 4.796202 4.796202 2.470187 14.22965
Volume Flow CUM/SEC 0.0182011 0.0065064 0.0065064 0.00354467 0.0141035
Temperature ᵒC 162.947 104.444 104.444 103.7937 104.444
Pressure PSIa 20.2 20 20 16 20
Vapour Fraction 0 0 0 0 0
Sensitivity analysis was performed to identify the variables that produce the best performance in the
process. In this case study, the sensitivity analysis was conducted to determine the flow rate of phenol
entering distillation column so that the purity of (MCH) can reach the best purity.
Two important steps need to be considered to perform sensitivity analysis:
1. State manipulated variable
In this case study, Phenol flowrate is the manipulated variable. This step is performed so that Phenol
flowrate can be varied.
2. State manipulated range
Manipulated range used is 1200 lbmol/hr (lower) and 2000 lbmol/hr (upper). This is done so that
the phenol flow rate can be specified either as equidistant points within an interval.

18
Results of the sensitivity analysis were discussed in Section 6.1 Results and Discussion. After the results
were satisfied, then they will be exported to Aspen Dynamics to be tested in dynamic simulation.
4 Dynamic simulation and process control in Aspen Dynamics
Aspen Dynamics is a dynamic process simulator, which is used to understand the dynamic behaviour of
the process. Aspen Dynamics is firmly integrated with Aspen Plus, whereby it is a simulator for steady
state. This allows the existing steady state from Aspen Plus simulation to create a dynamic simulation
[8].
Process dynamics means the situation is changing, in other words, the process changes over time.
Specifically, what it does mean is when the input of the process is changing, how the output variable
would respond over the time. Mostly process dynamic deals with the systematic characterization of the
time response of the affected variable to a change in the causal variable, the affected variable is also
sometimes referred to as the output variable, and the causal variable is also usually referred to as the
input variable [8].
Aspen Dynamics allows users to obtain a comprehensive understanding of the dynamics of processes.
This knowledge could be exploited by users to design and operate with optimum safety achieving
consistent product quality and operability of the process. A linear state space model can be extracted
from Aspen dynamics using the control design interface in Aspen [18].
Before starting to simulate the dynamic process in Aspen Dynamics software, a steady state simulation
must be done in advance in the Aspen Plus software. When the steady-state simulation was completed
in the Aspen Plus, all the necessary results can be obtained, and tabulation graphs can be carried out
where it will show behaviour corresponding to particular inputs. This information is then exported into
Aspen Dynamics.
Sizing of the equipment such as column diameter, size of vessels, tray spacing, trays active area, weir
length and height, reflux drum length and height, and reboiler length and height is the information
needed for Aspen Dynamics. A tool called tray sizing provided by the Aspen Dynamics can be used to
calculate the tray sizes based on the flow conditions in the column, but the sizing can also be done in
Aspen Plus [19].
The process will then be tested in open loop and closed loop system. This is done to study the
differences and implications between these two types of system in the process. PI controller is used to

19
controlling all variables in the system, and it requires some information so that it can be tuned properly
and the information is gathered through process identification. Set point change will be made in each
controller, and disturbance change will be introduced to individual variables to examine the impact of
changes on the purity of the product. Then, a new composition controller will be developed to control
the flowrate of phenol as it affects the purity.
20
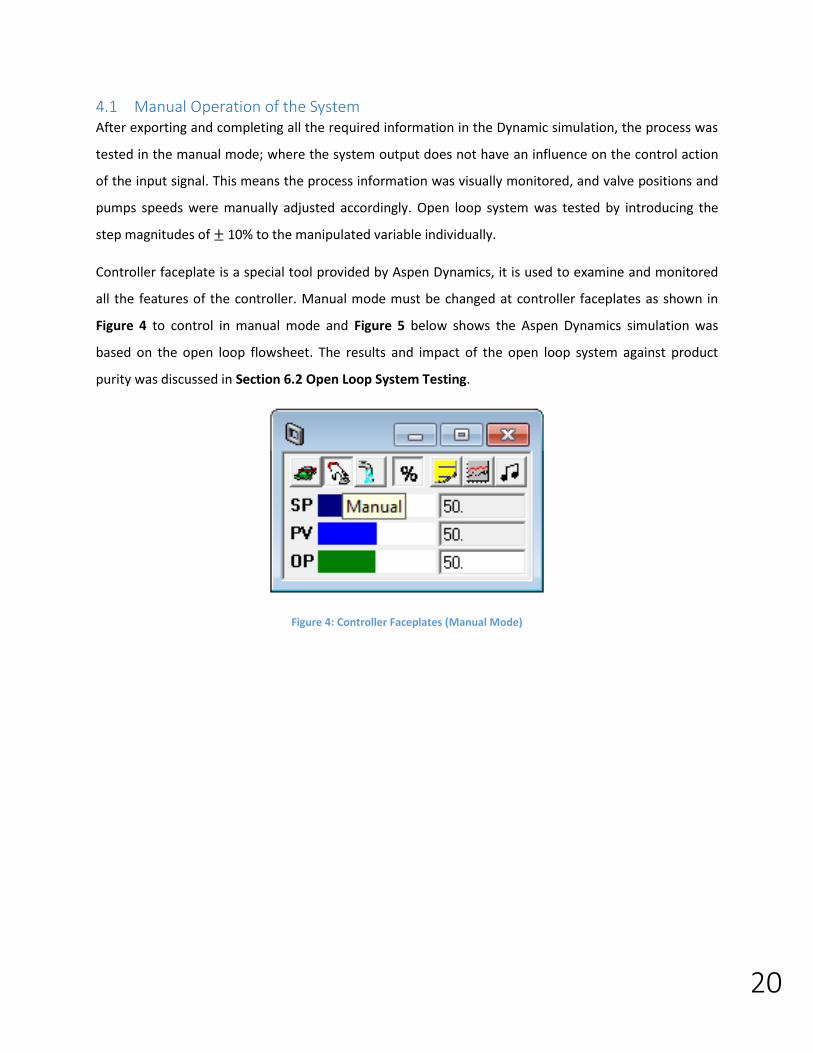
4.1 Manual Operation of the System After exporting and completing all the required information in the Dynamic simulation, the process was
tested in the manual mode; where the system output does not have an influence on the control action
of the input signal. This means the process information was visually monitored, and valve positions and
pumps speeds were manually adjusted accordingly. Open loop system was tested by introducing the
step magnitudes of 10% to the manipulated variable individually.
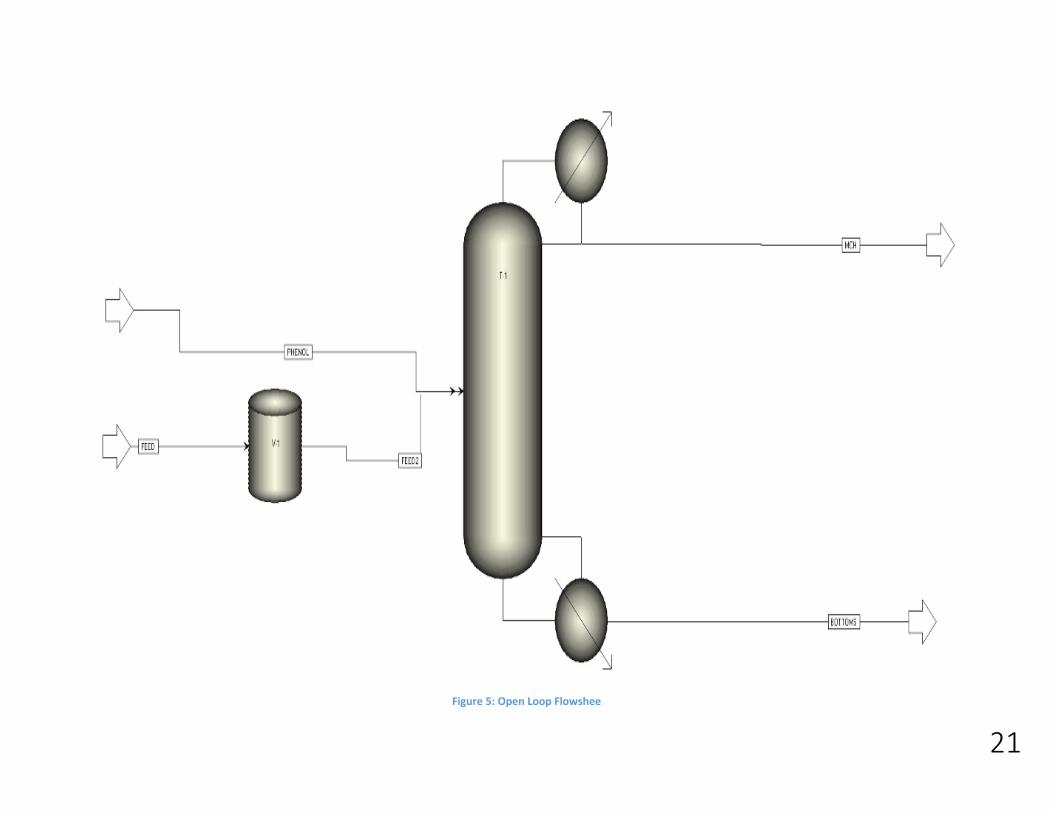
Controller faceplate is a special tool provided by Aspen Dynamics, it is used to examine and monitored
all the features of the controller. Manual mode must be changed at controller faceplates as shown in
Figure 4 to control in manual mode and Figure 5 below shows the Aspen Dynamics simulation was
based on the open loop flowsheet. The results and impact of the open loop system against product
purity was discussed in Section 6.2 Open Loop System Testing.
Figure 4: Controller Faceplates (Manual Mode)
21
Figure 5: Open Loop Flowshee

22
4.2 Control Loop Design Control loops were placed/utilized around each important aspect inside of that process. The controller
will react when the system senses the change in value of process variable, then loop back to the
controller and compare with the reference value of the system. If there is a difference, it will adjust the
system to its reference value.
For this case study, Aspen has developed four types of controllers to control the feed tank level, reboiler
level, reflux drum level, and top stream pressure for an extractive distillation. However, from the results
obtained in Aspen Plus shows that phenol flow rate must be controlled to achieve a better purity.
Therefore, a new controller was built to control the phenol (entractant) flowrate. Methyl Cyclo Hexane
composition controller will manipulate phenol flowrate, and the purity product (MCH) will be the
process variable.
Table 5 shows the control strategies used in this project.
Table 5: The Control Strategies
Process Variable (PV) Manipulated Variable (MV)
Feed Tank Level Feed Flowrate
Condenser Pressure Coolant Flowrate to condenser
Reboiler Level Bottom Flowrate (Toluene and Phenol)
Reflux Level MCH distillate Flowrate
MCH Purity Phenol Flowrate
Figure 6 shows the controller faceplates must be changed to automatic mode to control in a closed loop
system, and Figure 7 shows the control loop has been placed in the flowsheet.
Figure 6: Controller Faceplates (Auto Mode)

23
Figure 7: Closed Loop Flowsheet

24
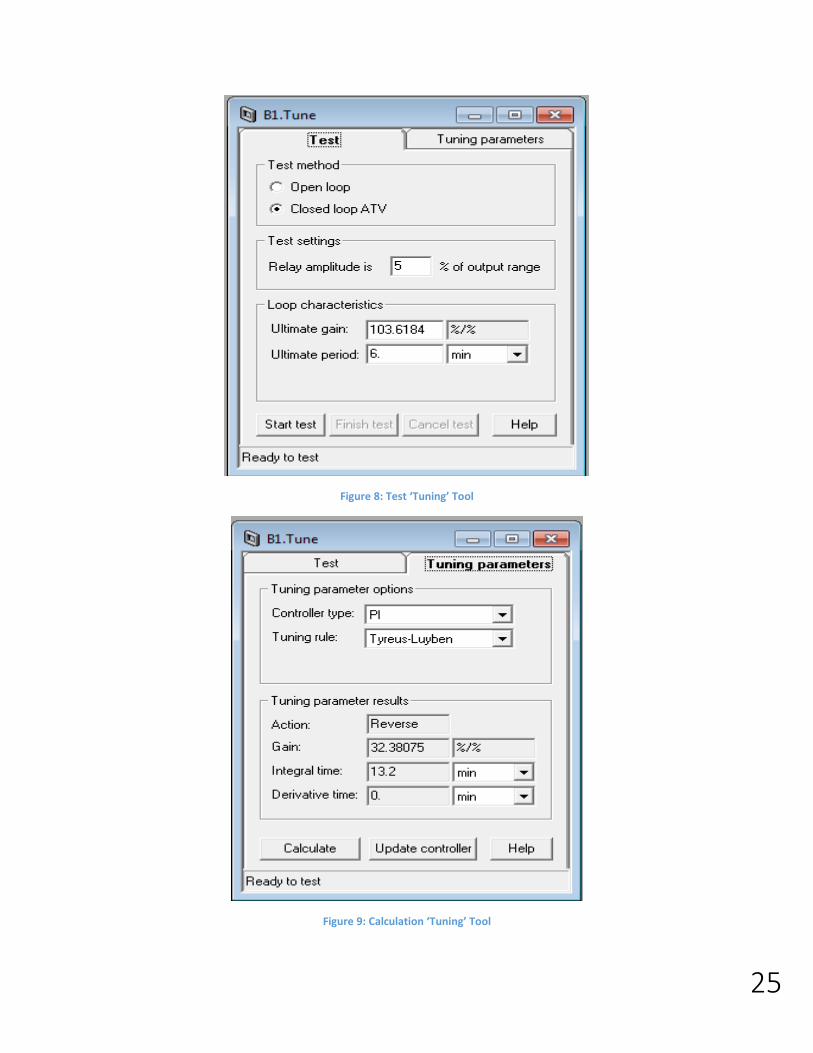
4.3 Controller Tuning Firstly, all controllers must be tuned to ensure control parameters reach the best value to achieve the
best possible control response. Therefore, all PI controllers were tuned individually using the 'Tuning'
tool [14]. The 'Tuning' is a special tool available in Aspen Dynamics to perform auto tuning. To use the
'Tuning', the 'Test Method' must be selected to the 'Closed Loop ATV' before pressing the 'Start Test' as
shown in Figure 8. When the 'Start Test' has been pressed, the process variable and manipulated
variable response of Methyl Cyclo Hexane (MCH) purity were recorded.
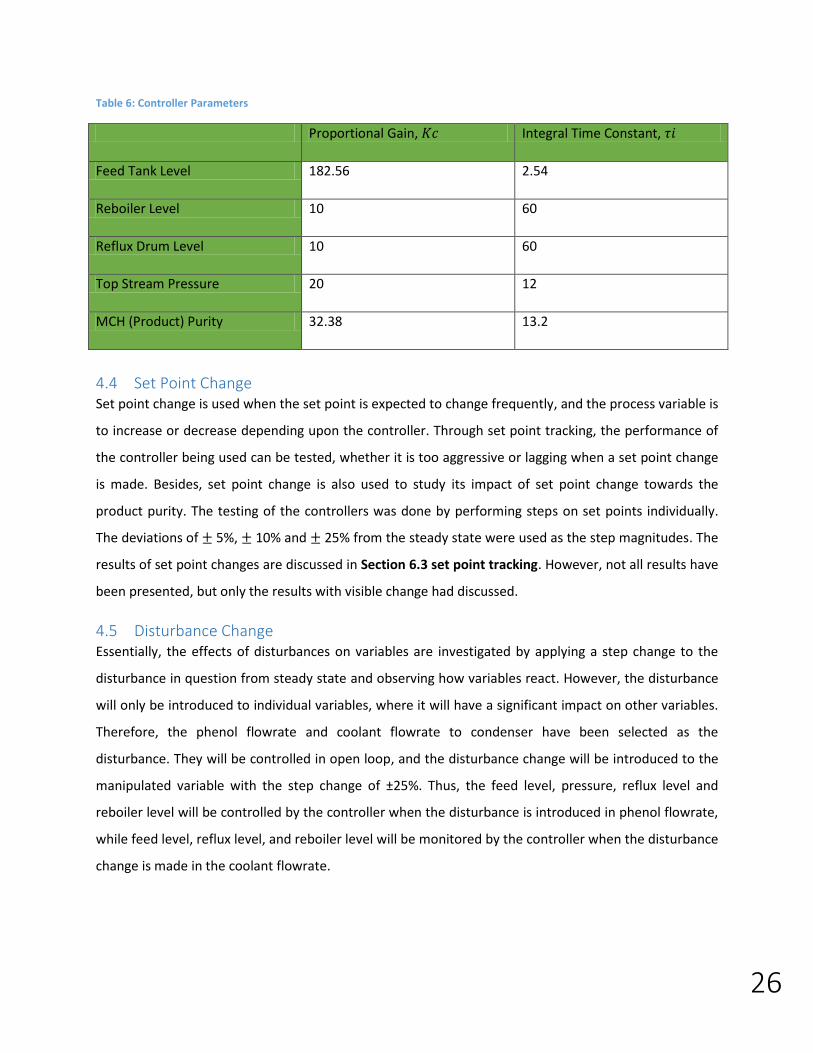
After 10 seconds, the 'Calculate' should be pressed to the 'Tuning' start calculating. The 'Tuning' will
provide the optimal parameter values to be able to respond the best control. After that, the button
'Update Controller' must be pressed as shown in Figure 9 so the parameters can be updated into the
controller.
From Figure 9, the 'Tuning Rule' is an option so that users can choose which tuning method to use.
Ziegler Nichols and Tyreus Luyben tunings are of popular methods. Ziegler Nichols tuning is quite
aggressive compared to Tyreus Luyben tuning that is quite loose. Tyreus Luyben is typically used for
distillation column to avoid the colossal, sudden increments or aggressive changes in the process. For
example, the reboiler duty could lead to hydraulic problems if the combative changes occur on the
reboiler. So, Tyreus Luyben is a more conservative tuning method compared with Ziegler Nichols in this
kind of process [20]. All controllers have been tuned using the same steps. Table 6 shows the parameter
results obtained from the tuning.
25
Figure 8: Test ‘Tuning’ Tool
Figure 9: Calculation ‘Tuning’ Tool
26
Table 6: Controller Parameters
Proportional Gain, Integral Time Constant,
Feed Tank Level 182.56 2.54
Reboiler Level 10 60
Reflux Drum Level 10 60
Top Stream Pressure 20 12
MCH (Product) Purity 32.38 13.2
4.4 Set Point Change Set point change is used when the set point is expected to change frequently, and the process variable is
to increase or decrease depending upon the controller. Through set point tracking, the performance of
the controller being used can be tested, whether it is too aggressive or lagging when a set point change
is made. Besides, set point change is also used to study its impact of set point change towards the
product purity. The testing of the controllers was done by performing steps on set points individually.
The deviations of 5%, 10% and 25% from the steady state were used as the step magnitudes. The
results of set point changes are discussed in Section 6.3 set point tracking. However, not all results have
been presented, but only the results with visible change had discussed.
4.5 Disturbance Change Essentially, the effects of disturbances on variables are investigated by applying a step change to the
disturbance in question from steady state and observing how variables react. However, the disturbance
will only be introduced to individual variables, where it will have a significant impact on other variables.
Therefore, the phenol flowrate and coolant flowrate to condenser have been selected as the
disturbance. They will be controlled in open loop, and the disturbance change will be introduced to the
manipulated variable with the step change of ±25%. Thus, the feed level, pressure, reflux level and
reboiler level will be controlled by the controller when the disturbance is introduced in phenol flowrate,
while feed level, reflux level, and reboiler level will be monitored by the controller when the disturbance
change is made in the coolant flowrate.

27
5 Co-simulation of the Extractive Distillation Column using Aspen
Dynamics and MATLAB Simulink Toolbox After simulation in Aspen Plus and Aspen Dynamics has been successful, the co-simulation of Aspen
Dynamics and MATLAB Simulink toolbox is tested. This allows control engineers to design, develop and
to test the controllers for complex chemical processes.
The process of linking Aspen Dynamics and MATLAB Simulink has been studied to get a better
understanding of this linkage process between the two softwares. The controller is developed in
Simulink to control the flowsheet in Aspen Dynamics.
The system in co-simulation is tested by the open loop and closed loop system, as was done in Aspen
Dynamics. However, the controller in co-simulation is not tuned, but it uses the same parameters as in
Aspen Dynamics. This means that the reaction in Aspen Dynamics and co-simulation must have the
same response and if the response is different further analysis will be done. The steps of implementing
the test are exactly the same as in Aspen Dynamics.
After that, step on set points and disturbances are introduced to the controllers and variables
respectively to identify the impact on product purity, the same method as in Aspen Dynamics has been
used. As the co-simulation can implement advanced controller, the Model predictive controller (MPC)
was constructed to replace the conventional controller.
28
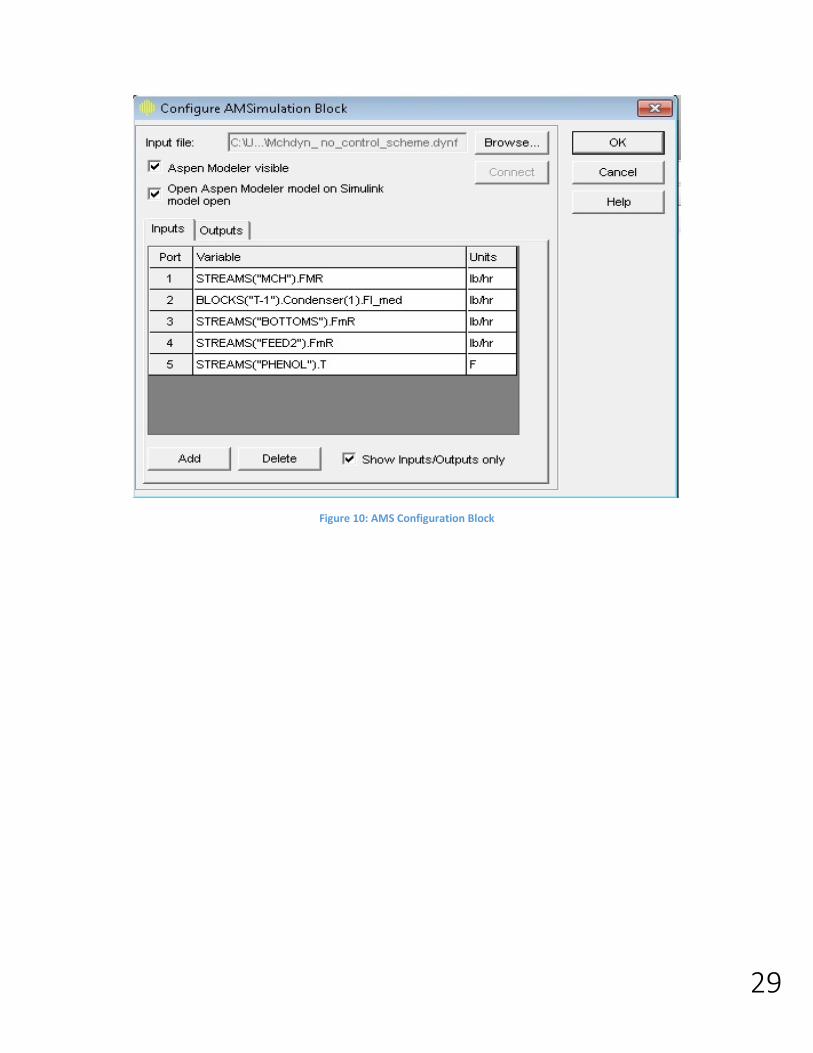
5.1 Linking Aspen Dynamics and MATLAB Simulink As mentioned before, the process of linking Aspen Dynamics and MATLAB Simulink has been done by
Aspen. However, it has been studied to understand and learn how to implement it. Aspen Simulation
Modeler (AMS) is an important block in making the link. AMS block can be found at ‘C:\Program
Files\AspenTech\AMSystem 2004\Bin’ folder [21].
AMS block must be configured before it can be used, and the following variables must be defined:
Input file to connect with
Input port and output port
This configuration is important in determining the AMS input to connect to, make the associated Aspen
Modeler product visible during runtime, determine which AMS variables are connected to which
Simulink block port and specify the unit of measurement of the information passed through the Simulink
block port.
Input port represents information sent from Simulink to the AMS, where only variables with fixed
specification in the AMS can be used for inputs. These variables would represent those typically
manipulated by a controller. While, output ports represents information received from the AMS by
Simulink, where only variables with free, initial and rate Initial specifications in the Aspen Modeler
simulation can be used for outputs. These variables would represent those typically measured by a
controller [21]. Figure 10 shows the AMS block which has been configured in this case study.
29
Figure 10: AMS Configuration Block

30
5.2 DMC Design Parameter Dynamic Matrix Control (DMC) is a Model Predictive Control (MPC) “technique that was developed by
Shell Oil and considered to be the algorithm of the decade in the 1980s” [22]. The development of MPC
techniques is established by utilizing the discrete-time convolution model. Advanced control schemes
like this are implemented into systems which exhibit unusual dynamic behaviour
Model Predictive Control is an approach where “a model of the process helps in the prediction of the
future changes in the process by observing the past control events helping in the optimization of the
control signal” [23]. The most comprehensive techniques for model predictive control are those based
on the objective function optimization which encompasses the error between the set point and
predicted outputs.
The DMC has a number of design parameters that can be manipulated to achieve the desired response:
the model horizon, sampling period, control horizon, prediction horizon, and two weighting matrices for
predicted errors and control moves respectively. Model horizon along with sampling period are both
defined first, as they are needed to obtain step response data. A general rule is that the model horizon
multiplied by the sampling period should exceed the time taken for the process to be ninety nine
percent complete. The model horizon needs to be large enough so that it captures enough data on the
dynamics of the system [24].

31
6 Results and Discussion This section discusses issues relating to the results obtained in Aspen Plus, Aspen Dynamics, and co-
simulation and the major problems encountered.
6.1 Sensitivity of Purity During the testing the model of the extractive distillation column in Aspen Plus, a sensitivity analysis was
conducted. Increasing the phenol (entractant) flowrate will increase MCH concentration in the distillate
as shown in Table 7.
Initially, the extractive column had produced a distillate of sufficient Methyl Cyclo Hexane (MCH) purity
upon simulation, at the initial phenol (entractant) flowrate of 1200 (lbmole/hr) and 0.97257 molar
purity. However, after the sensitivity analysis it was possible to increase the MCH purity in the distillate
to 0.98634 molar purity with flowrate of 2000 (lbmole/hr)
Table 7: Sensitivity Analysis Results
Row/Status Case Phenol Flowrate (lbmol/hr) Methyl Cyclo Hexane (MCH)
Purity in Distillate
1 1200 0.97257
2 1300 0.97535
3 1400 0.97771
4 1500 0.97971
5 1600 0.98143
6 1700 0.98292
7 1800 0.98422
8 1900 0.98534
9 2000 0.98634
Figure 11 illustrates the results in Table 7, purity against phenol flowrate. It can be clearly seen from
the figure that increasing phenol flowrate will increase the distillate purity. This means that if it is
necessary to develop another control loop to control the distillate purity by manipulating the phenol
flowrate can be selected as MV, which confirms the control system proposed in Table 5 on page 22. The
other three control loops shown in the same table remain the same: Feed Tank Level – Feed Flowrate
(Toluene + MCH), Condenser Pressure – Coolant Flowrate to condenser, Reboiler Level – Bottom
Flowrate (Toluene + Phenol), Reflux Level – Distillate MCH Flowrate, MCH Purity – Phenol Flowrate.

32
Figure 11: Phenol Flowrate vs. Purity

33
6.2 Open Loop System Testing Aspen Dynamics Stand-Alone and Co-Simulation For the purpose of analysis, the system in the Aspen Dynamics and co-simulation was tested with the
open loop system. The testing of open loop system was done by implementing step on each
manipulated variable individually, and the deviation of 10% from steady state was used as the step
magnitudes. Table 8 shows the results of the purity product was obtained when the step was introduced
in manipulated variable.
Table 8: Purity Response (Open Loop System)
Step size Purity (Molar)
Phenol Flowrate (1000lbmol/lb) 60% 0.975
40% 0.83
Coolant Flowrate 60% 0.92
40% 0.9735
MCH Flowrate 60% 0.865
40% 0.9725
Toluene and Phenol Flowrate 60% 0.973
40% 0.973
The purity of the product was at the highest level of 0.975 molar when the step up was introduced in
phenol flowrate. The purity of the product was at the lowest level of 0.83 molar when the step down
was introduced in phenol flowrate. Most of the product purity above than the minimum purity (0.97257
molar) when the steps are introduced except when coolant Flowrate and MCH Flowrate were stepped
up, and phenol Flowrate was stepped down. Therefore, the closed loop system is developed to maintain
product quality.
6.3 Set Point Tracking Aspen Dynamics Stand-Alone and Co-Simulation The ability of feed tank level, reboiler level, reflux drum level, and top stream pressure for an extractive
distillation to track the set point changes were tested in Aspen dynamics and co-simulation using PI
control scheme, where the purity of distillate was run in open loop system. The testing of the controllers
was done by performing step on set points individually. The deviations of 5%, 10% and 25% from
the steady state were used as the step magnitudes. All tests were run with the same parameters as
shown in Table 6 in Section 4.4.1.3 Controller Tuning. The period of the simulation was kept constant
for all controller performance tests; 300 units.
In the other hand, the purposes of set point changes were implemented are to investigate the effect of
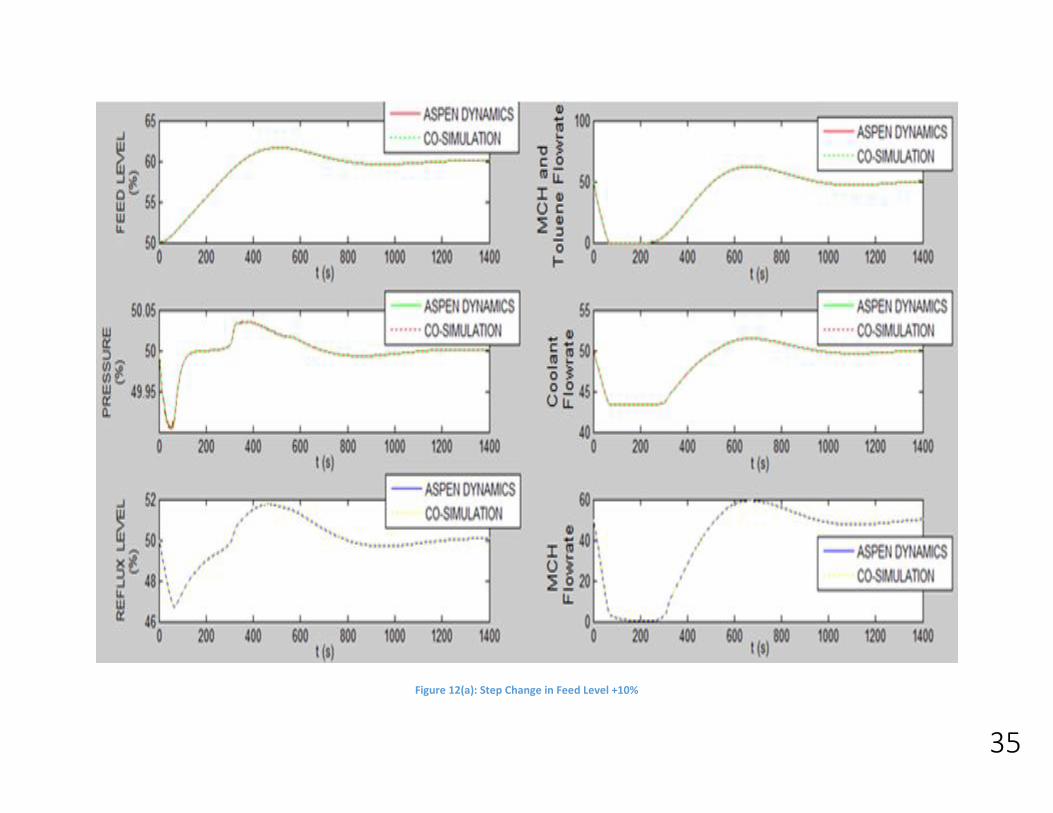
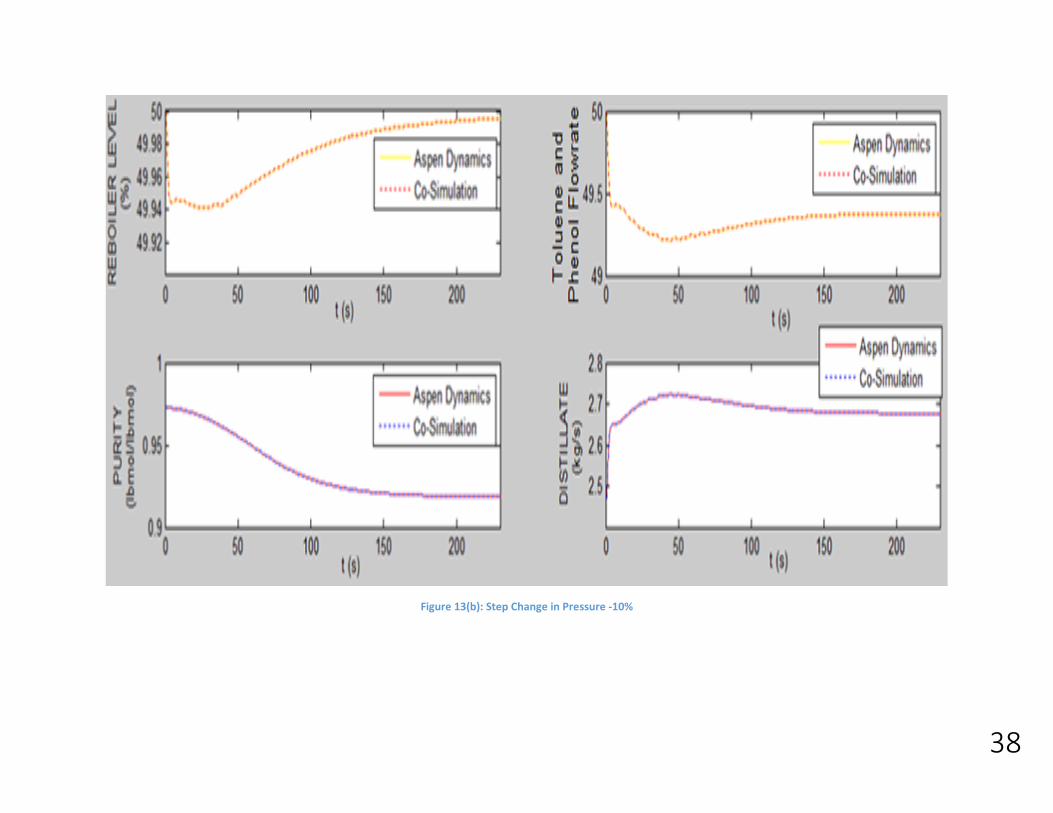
set point changes in each variable towards distillate and purity of the product. Figure 12(a)(b) and
Figure 13(a)(b) show the responses of the set point changes +10% in the Feed level and -10% in the top

34
stream pressure respectively, as they are most noticeable affect the distillate and purity of the product.
For the full results of the set point changes, please refer to Appendix C.
The minimum requirements to achieve excellent purity must be at least 0.97 molars, and purity will
consider as unsatisfactory if it is lower than the minimum requirement. From the tests that have been
carried out, the results obtained in Aspen Dynamics stand-alone and co-simulation is the same. The
results have been illustrated in Figure 12(a)(b), and it is clearly shows the purity of distillate is at the
minimum requirement with 0.97 molars when the step changes of +10% is introduced to feed level.
Besides, the change in feed level has affected the pressure, reflux drum and reboiler level but the
controller managed to control them back to the desired set point. The purity in Figure 13(a)(b) shows
unsatisfactory when the pressure set point was reduced by -10% because it is less than the minimum
requirement with 0.92 molars.
35
Figure 12(a): Step Change in Feed Level +10%

36
Figure 12(b): Step Change in Feed Level +10%

37
Figure 13(a): Step Change in Pressure -10%
38
Figure 13(b): Step Change in Pressure -10%

39
In conclusion, the results obtained in Aspen Dynamics stand-alone and co-simulation is the same. This
shows that the link is successfully made to connect the co-simulation. Furthermore, the performances of
the controllers in both strategies are at satisfactory levels.
6.4 Disturbance Rejection Aspen Dynamics Stand-Alone and Co-Simulation The ability of the controller in each variable to reject disturbance in the stream was tested using PI
controller. The method for performing disturbance changes was slightly different than the set point
tracking, where Phenol flowrate and coolant flowrate to the condenser were set as a disturbance in
order to investigate the effect of disturbances toward purity of the product. The feed level, pressure,
reflux level and reboiler level have been set to automatic mode when the disturbance in phenol flow
rate was introduced. The feed level, reflux level, and reboiler level have been set to automatic mode
when the disturbance in coolant flowrate to the condenser was introduced. The ±25% deviations from
the steady state were used for disturbance rejection. Also, the effects of disturbance toward the
distillate and the purity product were considered and analyzed. The minimum level of purity is 0.95
molar, which is the same as in set point tracking.
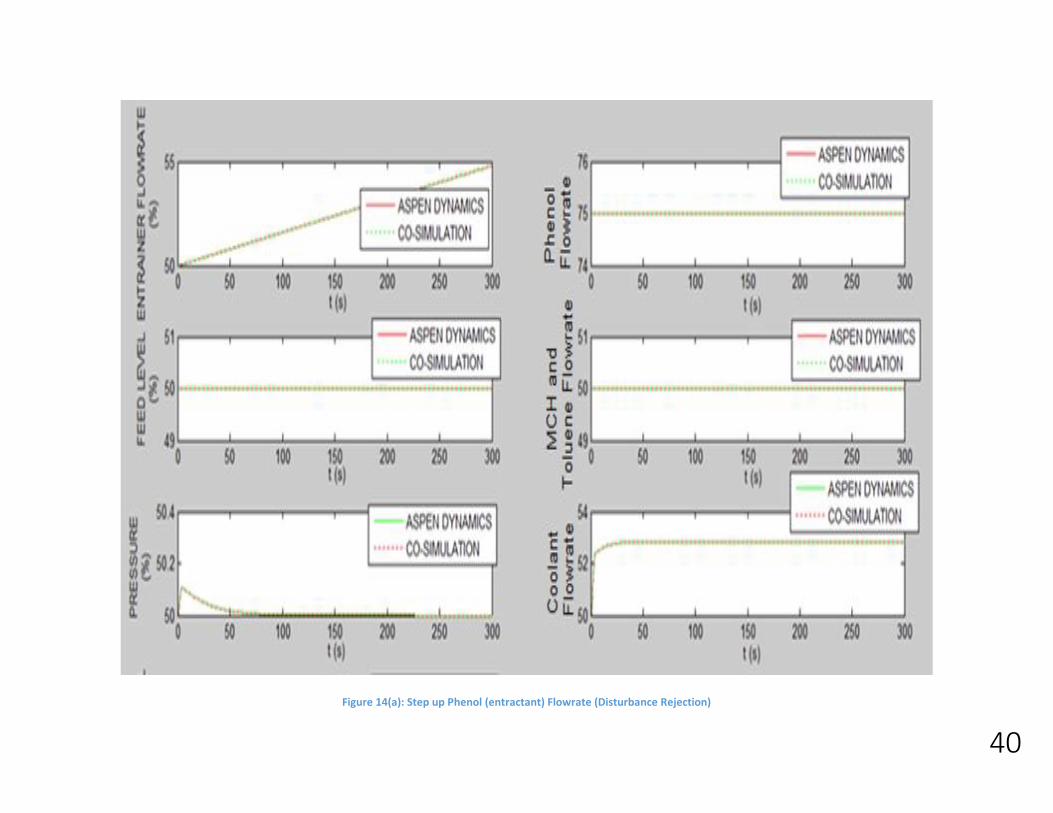
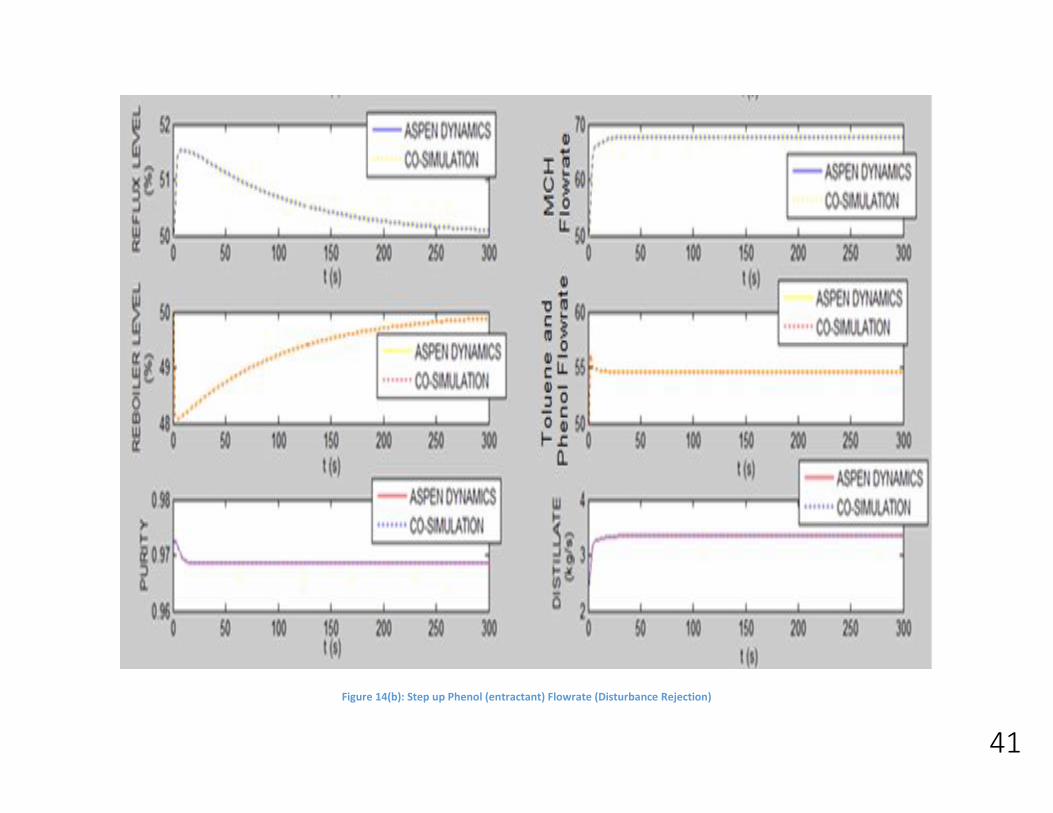
6.4.1 Phenol Flowrate The first disturbance rejection involving the Phenol flowrate was a step up of25%. This has affected the
reboiler level because the flow has been affected by the feed stream which remains at the initial steady
state and disturbance changes in phenol flowrate. Due to the change in the reboiler level, then it causes
changes in pressure, reflux level, distillate and purity of product.
Observe Figure 14(a)(b) where the controllers managed to eliminate the disturbance to achieve the
desired set point. Besides, although the purity of phenol was affected by the changes in the flowrates at
0 (s) to 20 (s), but the purity of product was below the minimum condition with result of 0.96 molar.
Overall disturbance rejection is as expected; the purity and amount of distillate are at the effective level.
40
Figure 14(a): Step up Phenol (entractant) Flowrate (Disturbance Rejection)
41
Figure 14(b): Step up Phenol (entractant) Flowrate (Disturbance Rejection)

42
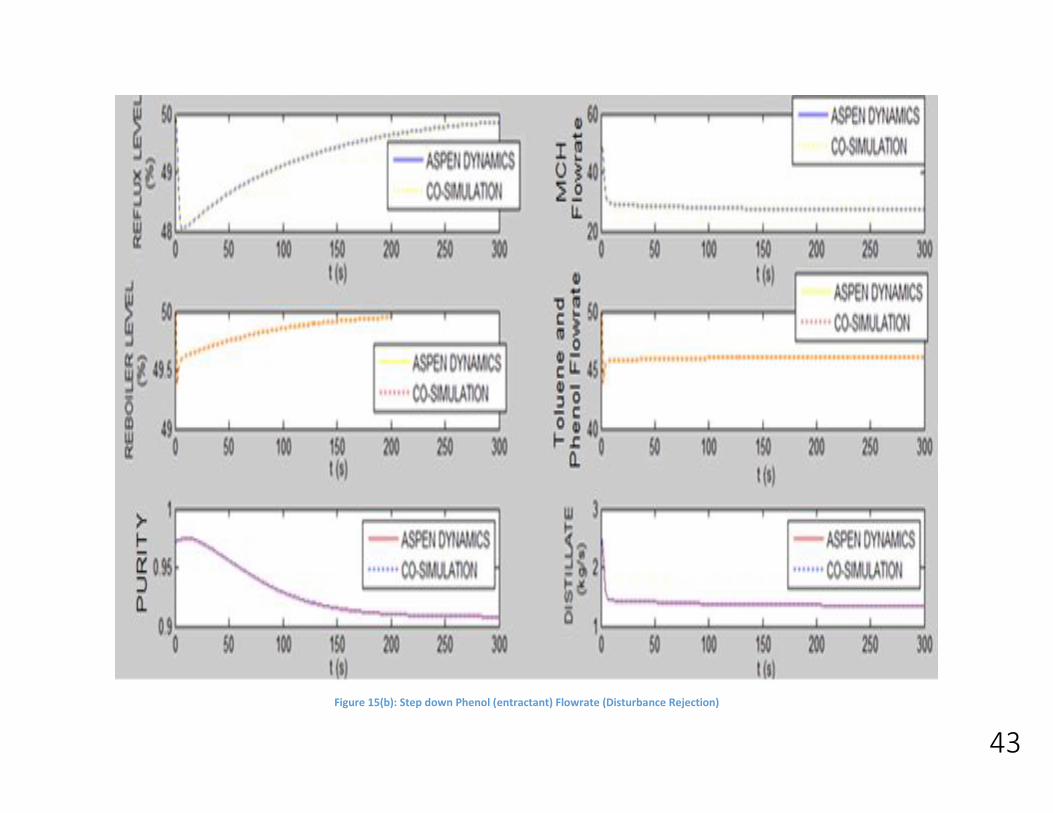
Figure 15(a): Step down Phenol (entractant) Flowrate (Disturbance Rejection)
43
Figure 15(b): Step down Phenol (entractant) Flowrate (Disturbance Rejection)

44
The second disturbance rejection involving the Phenol flowrate was based on a step down of 25%. The
controllers on all variables managed to control and eliminate the disturbance when it was introduced in
the phenol flowrates. As can be seen in Figure 15(a)(b), the purity of the product (0.91 molar) is affected
when the step down was introduced in the phenol flowrate. The result was expected because as
discussed in Section 6.1 Sensitivity of Purity, the purity depends on the phenol flowrate. Therefore, the
purity of distillate is increase if the Phenol flow rate increased as shown in Figure 14(a)(b), and the
purity will decrease if the phenol flow rate is decreased as illustrated in Figure 15(a)(b). Therefore, the
changes in phenol flowrate must be considered in order not to affect the purity. Lastly, the feed flowrate
was not affected by the disturbance change in the phenol flowrate nor water input flowrate at the
pressure.
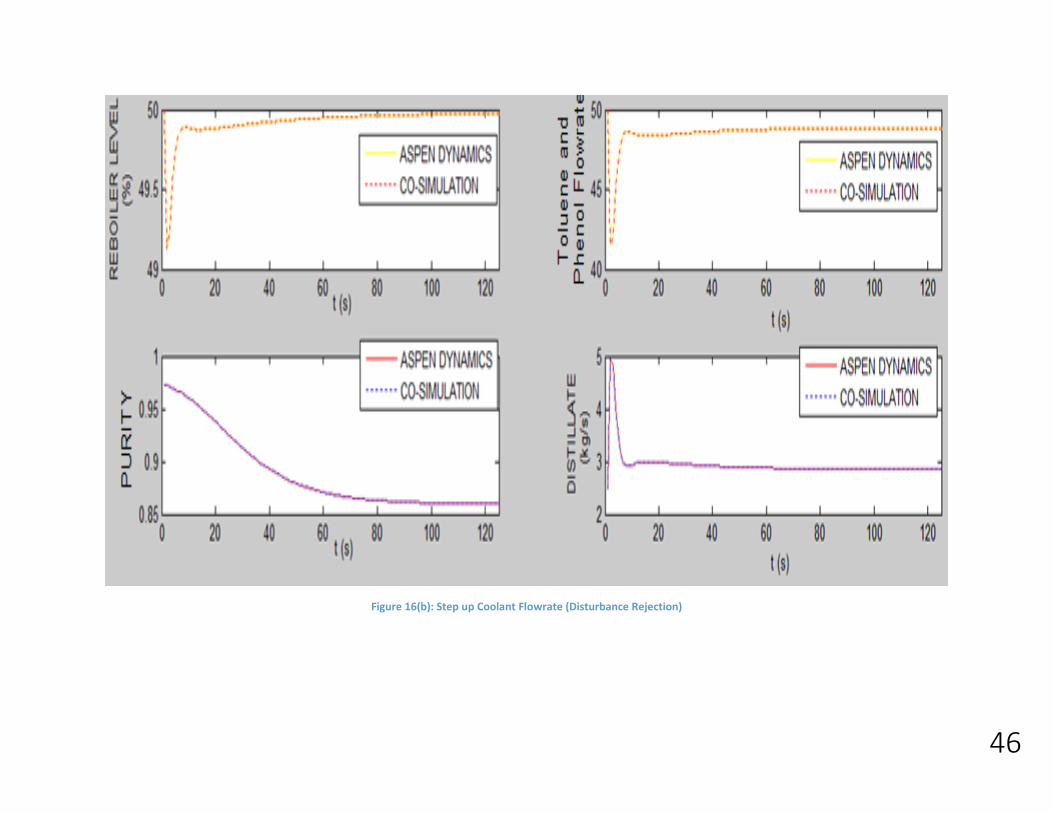
6.4.2 Coolant Flowrate The coolant flowrate to the condenser was used as the disturbance for this case, by using twenty five
percent steps up. This would inadvertently affect the reflux level and reboiler level. The response in
reflux and reboiler did overshoot at the beginning then they started to reach the desired set point after
10 (s). From the results obtained in Figure 16(a)(b), the purity of the product decreased to 0.86 molar
when the top stream pressure for an extractive distillation drops as it had affected the reflux ratio. The
reflux was changed to get the appropriate temperature at the top tray to get the absolute purity of
product. Some of the condensate in reflux drum is recycled back into the column, while the remaining is
discharged as top stream product. This becomes even worse when the flowrate of distillate products are
at a high level (3 kg/s) when the purity drops.

45
Figure 16(a): Step up Coolant Flowrate (Disturbance Rejection)
46
Figure 16(b): Step up Coolant Flowrate (Disturbance Rejection)

47
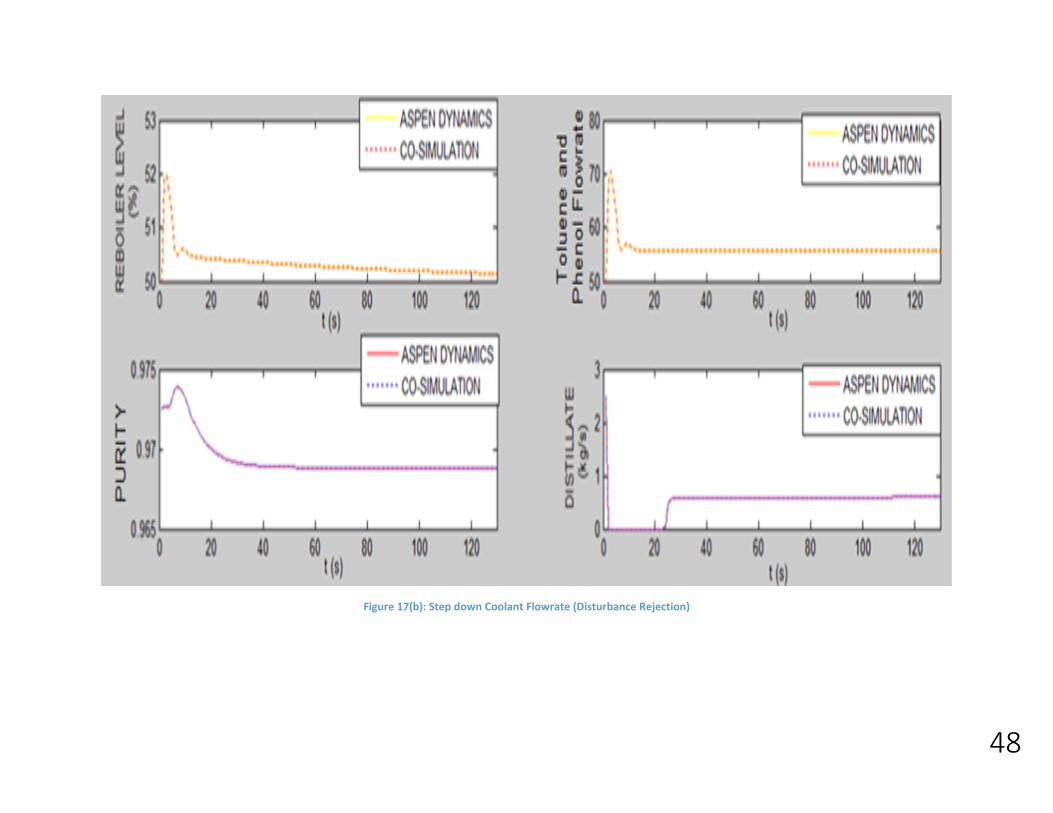
Figure 17(a): Step down Coolant Flowrate (Disturbance Rejection)
48
Figure 17(b): Step down Coolant Flowrate (Disturbance Rejection)

49
The final disturbance rejection involved the use of the coolant flowrate with the step down of 25%. The
purity of the product was reduced from 0.974 molar to 0.969 molar when the disturbance was
introduced. However, the purity is still considered good because it is above the minimum level of purity.
From the results obtained in Figure 16(a)(b) and Figure 17(a)(b), it can be seen that the purity of the
product produced a better response when the step down of disturbance was introduced compared to
the step up. However, the flowrate of distillate product has decreased from 2.6 kg/s to 0.7 kg/s when
the step down of coolant flowrate was conducted. The result was as expected because as discussed
earlier, the output stream of reflux drum is divided into two streams. The first stream is withdrawn as a
final product, and another stream is recycled back to the distillation column. Most of the condensate in
the reflux drum was frequently recycled for multiples times to get a better purity before the condensate
is withdrawn as a final product.
To sum up, the results of disturbance rejection is observed the same as in Aspen Dynamics stand-stand
alone and co-simulation. This proves that when the link between Aspen Dynamics and MATLAB Simulink
is done properly, then the co-simulation works successfully. The advantages of co-simulation are able to
develop advanced controller strategy such as Dynamic Model Control (DMC), and perform real time
simulation.
50
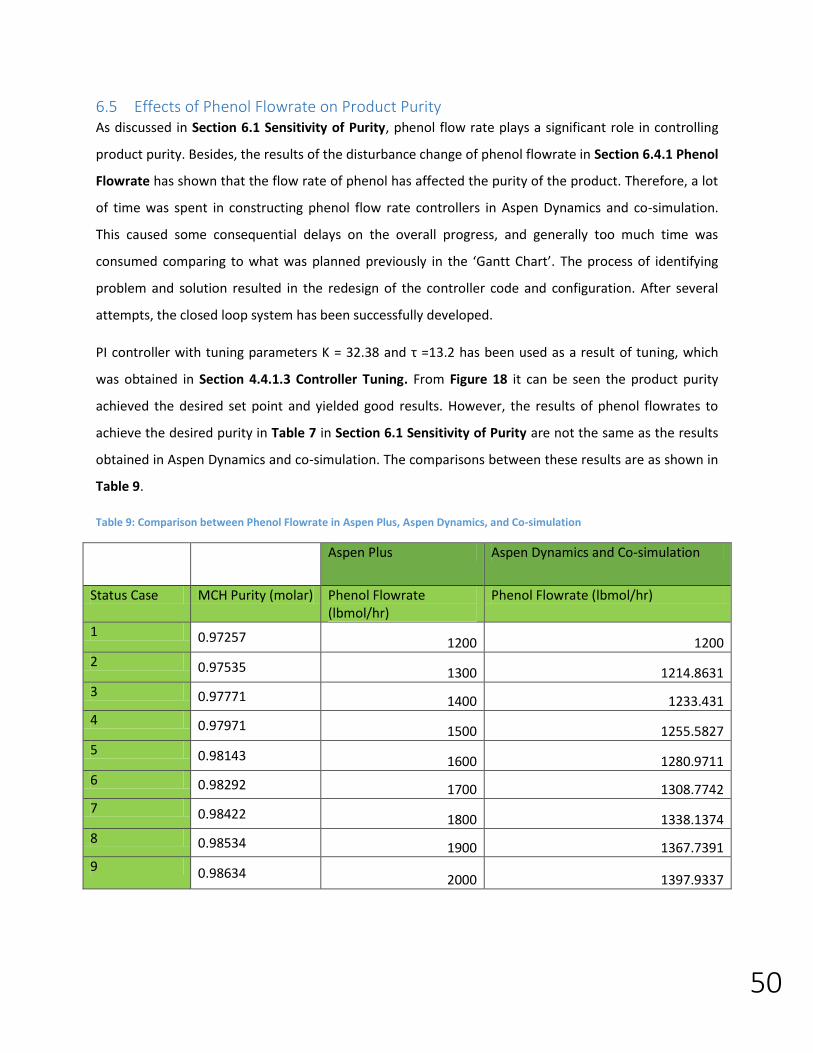
6.5 Effects of Phenol Flowrate on Product Purity As discussed in Section 6.1 Sensitivity of Purity, phenol flow rate plays a significant role in controlling
product purity. Besides, the results of the disturbance change of phenol flowrate in Section 6.4.1 Phenol
Flowrate has shown that the flow rate of phenol has affected the purity of the product. Therefore, a lot
of time was spent in constructing phenol flow rate controllers in Aspen Dynamics and co-simulation.
This caused some consequential delays on the overall progress, and generally too much time was
consumed comparing to what was planned previously in the ‘Gantt Chart’. The process of identifying
problem and solution resulted in the redesign of the controller code and configuration. After several
attempts, the closed loop system has been successfully developed.
PI controller with tuning parameters K = 32.38 and τ =13.2 has been used as a result of tuning, which
was obtained in Section 4.4.1.3 Controller Tuning. From Figure 18 it can be seen the product purity
achieved the desired set point and yielded good results. However, the results of phenol flowrates to
achieve the desired purity in Table 7 in Section 6.1 Sensitivity of Purity are not the same as the results
obtained in Aspen Dynamics and co-simulation. The comparisons between these results are as shown in
Table 9.
Table 9: Comparison between Phenol Flowrate in Aspen Plus, Aspen Dynamics, and Co-simulation
Aspen Plus Aspen Dynamics and Co-simulation
Status Case MCH Purity (molar) Phenol Flowrate (lbmol/hr)
Phenol Flowrate (lbmol/hr)
1 0.97257 1200 1200
2 0.97535 1300 1214.8631
3 0.97771 1400 1233.431
4 0.97971 1500 1255.5827
5 0.98143 1600 1280.9711
6 0.98292 1700 1308.7742
7 0.98422 1800 1338.1374
8 0.98534 1900 1367.7391
9 0.98634 2000 1397.9337

51
Figure 18: Step up Purity from 0.97257 to 0.98634 in Aspen Dynamics and Co-simulation

52
From Table 9 it can be seen that phenol flowrates in Aspen Plus require 2000 lbmol/hr to achieve
0.98634 molar purity of the product. However, Aspen Dynamics and co-simulation only requires
1397.9337 lbmol/hr of phenol flowrates to achieve 0.98634 molar purity of the product. Out of nine
status cases, only the first status cases have the same phenol flowrates to achieve 0.97257 molar purity
of product. At first, it was expected to get the same flowrate for all product purity.
As the results arisen with some problem, some assumption had been made. The first assumption was:
probably a mistake occurred while performing some changes during the redesign and configuration of
the controller code. The second assumption: maybe the dead time need to be installed on composition
controller, this is to avoid the limitation of the doable response in the system. However, a full analysis
was unable to be performed due to time constraints.

53
6.6 Developing Dynamic Matrix Control (DMC) Dynamic Matrix Control (DMC) has been trying to implement in co-simulation because it can perform
advanced controller. Initially, DMC examples exercises from 'ENG420' was implemented on a simple first
order system in MATLAB to understand the basics of the predictive control strategy along with the effect
of design parameters [25].
However, after repeatedly trying to develop DMC ended unsuccessfully because of the system was
showing a "linearization" error as illustrated in Figure 19. Further analysis was not done because of time
constraints and will be recommended for future work.
Figure 19: Error When Implementing DMC
54
7 Conclusion This section discusses the achievements and efforts made throughout this project. The aims will be
reviewed again, and achievements will be presented.
Studying and understanding the Aspen Plus, Aspen Dynamics and Co-Simulation has been done since the
beginning of this project, as they are sophisticated software. The results indicate the software used are
very helpful especially in developing and testing process simulation by providing a comprehensive
system.
Aspen Plus was used to obtain the results of the process model as it can predict the behaviour and
calculate the steady state value. The first task is to conduct sensitivity analysis in Aspen Plus. Steady
state simulation has given good results. The results show the flowrate of phenol was substantially
affecting the composition of the product. Increasing the phenol flowrate will increase composition of
the product. Therefore, the new controller has been developed to control the product composition.
It is possible for a complex system such as extractive distillation to perform dynamics simulation in
Aspen Dynamics. The new controller has been designed, and all controllers have been tuned to ensure
the best response is achieved. Phenol flowrate controller has been developed to control the quality of
the product. Tyreus Luyben tuning method was used because it is less aggressive than other tuning
methods. The special tool which available in Aspen Dynamics has been used to perform auto tuning, and
it has given the optimal parameter values. The set point changes and disturbance changes have been
introduced to the controllers and variables respectively.
After that, the Co-Simulation has been developed by linking Aspen Dynamics and MATLAB Simulink.
Steps to perform the link have been described in detail. Co-simulation are using the same controller
design and tuning parameters as in Aspen Dynamics. The set point changes and disturbance changes
have been implemented in co-simulation using the same method as in Aspen Dynamics. Then DMC has
been tried to be developed to replace PI controller as it is able to develop the advanced controller.
However, attempts to develop DMC had failed after a few trials. Further analysis was not done due to
time constraints.
Although failing to develop DMC in co-simulation, the co-simulation has its advantages, where it can
perform real time simulation, provide rigorous dynamic simulation and is able to optimize the process
performance. This project is a privilege for me to gain valuable knowledge in exploring the software. The
software is one of the most popular software in the industry and is often used by control engineers.
55
8 Future Work This section emphasizes on potential directions that should be of the concerns by the next students
moving on this project.
8.1 Review the Composition Controller and the Dynamic Matrix Control (DMC) From the results obtained in Section Sensitivity Analysis and Section Effects of Phenol Flowrate on
Purity shows that they have different flowrate to achieve desired MCH purity. In contrast, flowrate from
both sections should be the same to achieve the desired MCH purity. This problem is assumed that the
controller code configuration caused it. Besides, death time might be installed on composition controller
as it helps to avoid response limitation inside the system.
DMC was failed to be developed in this case study as the system was showing a "linearization" error.
Hence, this issue must be solved to ensure the process to be controlled by DMC. This error was probably
caused by the matter of setting and configuring the variables in MATLAB Simulink. If this problem could
be solved, comparison control strategies in Aspen Dynamics and co-simulation can be done through
performance criteria method.
Therefore, it is suggested that future student to try to solve this first before moving forward on any
other recommendations.
8.2 Implementing the Solvent Recovery Column As stated earlier, this project consists of two parts as a whole; the extractive column is part one, and
part two is the solvent recovery column. However, this project is focused on the first part, and it has
been tested with the steady state and dynamic process. In the second part, they have to separate the
product from part one, namely Toluene and Phenol (entractant). Therefore, Phenol (entractant) will be
circulated back to the extractive distillation column for reuse, while Toluene would be a product. The
steps to be taken on the second part is the same as in the first part where it needs to be tested by the
open-loop system, closed loop system, a step change, and performance criteria.

56
8.3 Relative Gain Analysis (RGA)
It should be noted that the control loop pairings in this project were chosen from a logical basis rather
than following the RGA approach. This was the case to ensure time was spent on design,
implementation, and analysis of the conventional controller achieved. Therefore, relative gain analysis
(RGA) is used to define the optimal input-output variable pairings. Through the use of a gain matrix, it is
possible to derive the use of the pumps and valves for the project about the impact each pump and the
valve has on each other.
For this section, the relative gain analysis will be based on the distillation column, reboiler, and
condenser. Before getting straight into the matrix calculations, the gains of the pump and valves must
be determined. This is done by stepping up each valve or pump individually. Stepping the valves or
pumps up separately allows the gains to be calculated at the temperatures, flows or levels that interact
with it.
To calculate the gains of each response, regression analysis is to be used. Regression analysis has been
used before in determining the mathematical models for the system. When each gain value is obtained,
they will be placed in a gain matrix. This gain matrix will then be inversed and transposed based on the
relative gain analysis equation, ( ) , where G is the gain matrix and T is the transpose of the
inverse matrix.
Once the matrix has been inverse and transposed, it will then be multiplied by the gain matrix. However,
this is not a normal matrix calculation as its element number will multiply each element. An example is
based on the matrix below, gain matrix. When conducting the multiplication, , will be multiplied by
the corresponding value in the transposed matrix, i.e. . This will occur for every element in the matrix
[26].
Figure 20: Gain Matrix (G)

57
8.4 Aspen Custom Modeler (ACM)
Aspen has created different types of software such as Aspen Dynamics, Aspen Plus, and Aspen Custom
Modeler (ACM). For future works, it is encouraged if future students can implement this project in
Aspen Custom Modeler because students can identify the software and compare this software other
types of software. Aspen Custom Modeler (ACM) is very different from the software used in this project,
where ACM is a standing alone software; in which it does not require other software to do steady state
process, dynamic process, and optimization because it can do it by itself. Therefore, this software is very
beneficial to students because it does not require different types of software to perform and test a
process. Apart from that, students can analyze and compare controller in Aspen Custom Modular with
software used in this project, whether it unnecessarily aggressive or too lagging.
58
9 Bibliography B. A. Ogunnaike and W. H. Ray, Process Dynamics, Modeling, And Control, Oxford, New York: Oxford
University Press, 1994
This book is very useful and often serves as a reference throughout the study at Murdoch University and
especially in this thesis. Among chapter that has been referred were chapter 14 (Feedback control
system) and chapter 15 (Conventional feedback control design) on page 461 and 513 respectively.
Chapter 14 had become the reference for a better understanding of the concept of feedback control and
conventional feedback controllers. Meanwhile, chapter 15 had been referred as to study the analytical
method of performance criteria of the controller. Through this method, the performance of the
controller can be identified, whether it is too aggressive or lagging when the set point change is made.
aspentech, "Jump Start: Getting Started with Aspen Plus V8," AspenTech, Bedford, 2015.
Aspen Plus is smart and sophisticated software. Therefore, this document has been used to understand
how it operates and the basic operation of the software. Apart from that, this document also describes
in detail ways to use this software, and this helps the reader to understand more about this software.
courses.washington.edu, "Aspen Tutorial #6: Aspen Distillation," 2015.
This document explains the fundamental of the distillation column and its usefulness. Distillation column
was used in this thesis, and it is the most important unit operation to separate the mixture into its parts.
Apart from that, the distillation column is divided into several types, and each type has different
functions. Therefore, it is important to know, get an idea and understand how distillation column
separates the mixture and types of distillation column so as to identify the best to use in this thesis.
59
J. Haydary and T. Pavlík, "STEADY-STATE AND DYNAMIC SIMULATION OF CRUDE OIL DISTILLATION
USING ASPEN PLUS AND ASPEN DYNAMICS,".
This thesis was a good source of reference especially in giving the idea in writing a technical report. Also,
the concept and the software used is almost the same but different regarding controller type and
component. Some of the techniques used such as in Aspen Plus and Aspen Dynamics had been referred
on ways to operate although flow sheet model used in thesis slightly different.
60
10 Works Cited
[1] I. D. Gil, D. C. Botı´a, P. Ortiz and O. F. Sa´nchez, “Extractive Distillation of Acetone/Methanol
Mixture Using Water as Entrainer,” Ind. Eng. Chem. Res., vol. Vol. 48, no. 10, pp. 4858-4865, 2009.
[2] 1rv07ch.files.wordpress, “Extractive Distillation,” 28 December 2015. [Online]. Available:
https://1rv07ch.files.wordpress.com/2010/05/extractive-distillation.pdf. [Accessed 30 December
2015].
[3] Scielo.org.ar, “Simulation of the tetrahydrofuran dehydration process by extractive distillation,” 30
December 2015. [Online]. Available:
http://www.scielo.org.ar/img/revistas/laar/v39n4/a01g01.png. [Accessed 28 December 2015].
[4] HowStuffWorks.com, “Distillation,” 1 July 2009. [Online]. Available:
http://www.howstuffworks.com/distillation-info.htm. [Accessed 28 December 2015].
[5] M. T. Tham, “Distillation: An Introduction,” October 1997. [Online]. Available:
http://aussiedistiller.com.au/books/Chocaholic/Introduction%20to%20Distillation.pdf. [Accessed
28 December 2015].
[6] aspentech, “Jump Start: Getting Started with Aspen Plus V8,” AspenTech, Bedford, 2015.
[7] courses.washington.edu, “Aspen Tutorial #6: Aspen Distillation,” 2015. [Online]. Available:
http://courses.washington.edu/overney/Aspen/Aspen_Tutorial_Unit_6.pdf. [Accessed 28
December 2015].
[8] aspentech, “Aspen Dynamics,” 15 February 2004. [Online]. Available: www.aspentech.com.
[Accessed 29 December 2015].
[9] MathWorks, “Real-Time Simulation,” 28 December 2015. [Online]. Available:
http://au.mathworks.com/help/physmod/simscape/real-time-simulation.html. [Accessed 29
December 2015].
[10] MathWorks, “Control System Toolbox Design and analyze control systems,” 28 December 2015.
[Online]. Available: http://au.mathworks.com/products/control/index.html?s_tid=gn_loc_drop.
[Accessed 29 December 2015].
[11] MathWorks, “Tuning Control Systems,” 28 December 2015. [Online]. Available:
http://au.mathworks.com/products/control/features.html#tuning-control-systems. [Accessed 29
December 2015].
[12] Aspen Plus, “Process modeling environment for conceptual design, optimization, and
performance,” 2015. [Online]. Available:
https://www.google.com.au/url?sa=t&rct=j&q=&esrc=s&source=web&cd=1&ved=0ahUKEwiflIDgl
MLKAhVEJpQKHepLCL8QFggcMAA&url=https%3A%2F%2Fwww.aspentech.com%2FBrochure%2FAs
pen-
61
Plus.pdf&usg=AFQjCNE2moLFL44Pp81FJaU9PD3k_qVStA&sig2=LwlIdlHW_i2ZRprCjaP16Q&cad=rja.
[Accessed 27 December 2015].
[13] umich.edu, “Aspen Plus Information,” 2007. [Online]. Available:
http://www.umich.edu/~elements/fogler&gurmen/html/help/software/html/aspen/index.htm.
[Accessed 28 December 2015].
[14] W. L. Luyben, Distillation Design and Control Using Aspen Simulation, New York: John Wiley & Sons,
2006.
[15] I. D. Gil, J. M. Gómez and G. Rodríguez, “Control of an extractive distillation process to dehydrate
ethanol using glycerol as entrainer,” Computers and Chemical Engineering, no. 39, p. 129– 142,
2012.
[16] I. D. Gil, A. M. Uyazán, J. L. Aguilar, G. Rodríguez and L. A. Caicedo, “SEPARATION OF ETHANOL AND
WATER BY EXTRACTIVE DISTILLATION WITH SALT AND SOLVENT AS ENTRAINER: PROCESS
SIMULATION,” Brazilian Journal of Chemical Engineering, vol. 25, no. 1, pp. 207 - 215, 2008.
[17] nt.ntnu.no, “SHORTCUT DESIGN OF EXTRACTIVE DISTILLATION COLUMNS,” 2015. [Online].
Available: http://www.nt.ntnu.no/users/skoge/prost/proceedings/distillation02/dokument/32-
2.pdf. [Accessed 30 December 2015].
[18] M. Khodadoost and J. Sadeghi, “Dynamic Simulation of Distillation Sequences in Dew Pointing Unit
of South Pars Gas Refinery,” Journal of Chemical and Petroleum Engineering, University of Tehran,
vol. 45, no. 2, pp. 109-116, 2011.
[19] J. Haydary and T. Pavlík, “STEADY-STATE AND DYNAMIC SIMULATION OF CRUDE OIL DISTILLATION
USING ASPEN PLUS AND ASPEN DYNAMICS,” Petroleum & Coal, vol. 51, no. 2, pp. 100-109, 2009.
[20] W. L. Luyben, Process Modeling, Simulation, and Control for Chemical Engineers, New York:
McGraw-Hill Publishing Company, 1999.
[21] MathWorks Support Team, “MATLAB Answers,” MathWorks, 2015. [Online]. Available:
http://au.mathworks.com/matlabcentral/answers/101771-where-can-i-get-more-information-on-
link-between-aspendynamics-and-simulink. [Accessed 26 December 2015].
[22] S. J. Qin and T. A. Badgwell, “A survey of industrial model predictive control technology,” Control
Engineering Practice, vol. 11, p. 733–764, 2002.
[23] seas.upenn, “Model Predictive Control : Basic Concept,” 2015. [Online]. Available:
http://www.seas.upenn.edu/~ese680/papers/IntroductionMPC.pdf. [Accessed 28 December
2015].
[24] D. E. Seborg, D. A. Mellichamp, T. F. Edgar and F. J. Doyle III, Process Dynamics and Control,
Chichester, United Kingdom: John Wiley & Sons, 2010.
[25] P. A. Bahri, “ENG420 Lecture Materials,” Murdoch university Web site, 2015. [Online]. Available:

62
http://moodleprod.murdoch.edu.au/pluginfile.php/327028/mod_resource/content/3/ENG420Lect
ure1-15.pdf. [Accessed 28 December 2015].
[26] J. Carey, B. v. Kuiken, C. Longcore and A. Yeung, “RGA,” 1 November 2007. [Online]. Available:
https://controls.engin.umich.edu/wiki/index.php/RGA. [Accessed 28 December 2015].
[27] H. Ling, “Temperature Control of the BTX Divided-Wall Column,” Ind. Eng. Chem. Res., vol. 49, no.
1, p. 189–203, 2010.
[28] N. P. Cheremisinoff, Handbook of Chemical Processing Equipment., Massachusetts, USA:
Butterworth-Heinemann, 2000.
[29] B. A. Ogunnaike and W. H. Ray, Process Dynamics, Modeling, And Control, Oxford, New York:
Oxford University Press, 1994.
[30] P. Zhang, Advanced Industrial Control Technology, United Kingdom: Elsevier Inc, 2010.
[31] controlguru, “Integral Action and PI Control,” 7 April 2015. [Online]. Available:
http://controlguru.com/integral-action-and-pi-control/. [Accessed 28 December 2015].
[32] controlguru, “Control Loop,” 2015. [Online]. Available: http://controlguru.com/wp-
content/uploads/2015/03/loopgeneralbig.jpg. [Accessed 2015 December 28].
[33] T. E. Marlin, Process Control: Designing Processes and Control Systems for Dynamics Performance,
Singapore: McGraw-Hill, 1995.
[34] M. Kano, N. Showchaiya, S. Hasebe and I. Hashimoto, “Inferential control of distillation
compositions: selection of model and control configuration,” Control Engineering Practice, vol. 11,
p. 927–933, 2003.
[35] W. L. Luyben, Practice Distillation Control, New York: Van Nostrand Reinhold, 1992.
[36] L. Vu, “ENG303 Moving from Steady state to Dynamic Simulation: Sizing,” Murdoch University,
2014. [Online]. [Accessed 22 April 2014].
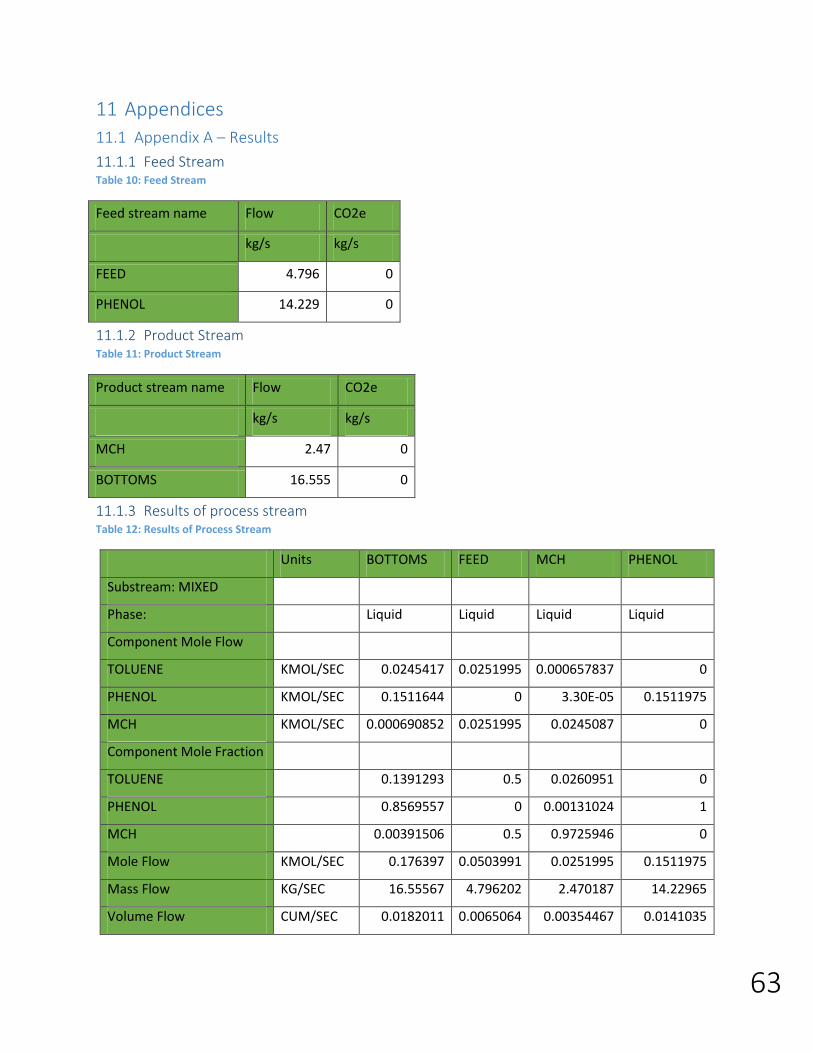
63
11 Appendices
11.1 Appendix A – Results
11.1.1 Feed Stream Table 10: Feed Stream
Feed stream name Flow CO2e
kg/s kg/s
FEED 4.796 0
PHENOL 14.229 0
11.1.2 Product Stream Table 11: Product Stream
Product stream name Flow CO2e
kg/s kg/s
MCH 2.47 0
BOTTOMS 16.555 0
11.1.3 Results of process stream Table 12: Results of Process Stream
Units BOTTOMS FEED MCH PHENOL
Substream: MIXED
Phase: Liquid Liquid Liquid Liquid
Component Mole Flow
TOLUENE KMOL/SEC 0.0245417 0.0251995 0.000657837 0
PHENOL KMOL/SEC 0.1511644 0 3.30E-05 0.1511975
MCH KMOL/SEC 0.000690852 0.0251995 0.0245087 0
Component Mole Fraction
TOLUENE 0.1391293 0.5 0.0260951 0
PHENOL 0.8569557 0 0.00131024 1
MCH 0.00391506 0.5 0.9725946 0
Mole Flow KMOL/SEC 0.176397 0.0503991 0.0251995 0.1511975
Mass Flow KG/SEC 16.55567 4.796202 2.470187 14.22965
Volume Flow CUM/SEC 0.0182011 0.0065064 0.00354467 0.0141035
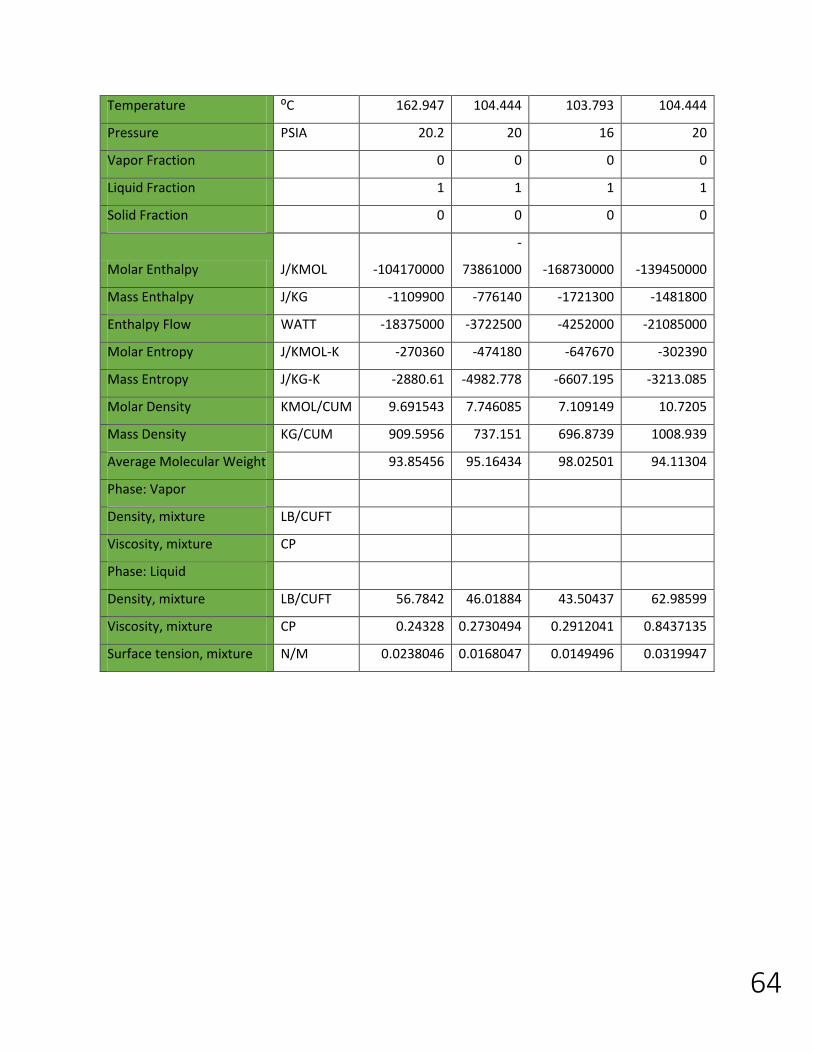
64
Temperature ⁰C 162.947 104.444 103.793 104.444
Pressure PSIA 20.2 20 16 20
Vapor Fraction 0 0 0 0
Liquid Fraction 1 1 1 1
Solid Fraction 0 0 0 0
Molar Enthalpy J/KMOL -104170000
-
73861000 -168730000 -139450000
Mass Enthalpy J/KG -1109900 -776140 -1721300 -1481800
Enthalpy Flow WATT -18375000 -3722500 -4252000 -21085000
Molar Entropy J/KMOL-K -270360 -474180 -647670 -302390
Mass Entropy J/KG-K -2880.61 -4982.778 -6607.195 -3213.085
Molar Density KMOL/CUM 9.691543 7.746085 7.109149 10.7205
Mass Density KG/CUM 909.5956 737.151 696.8739 1008.939
Average Molecular Weight 93.85456 95.16434 98.02501 94.11304
Phase: Vapor
Density, mixture LB/CUFT
Viscosity, mixture CP
Phase: Liquid
Density, mixture LB/CUFT 56.7842 46.01884 43.50437 62.98599
Viscosity, mixture CP 0.24328 0.2730494 0.2912041 0.8437135
Surface tension, mixture N/M 0.0238046 0.0168047 0.0149496 0.0319947
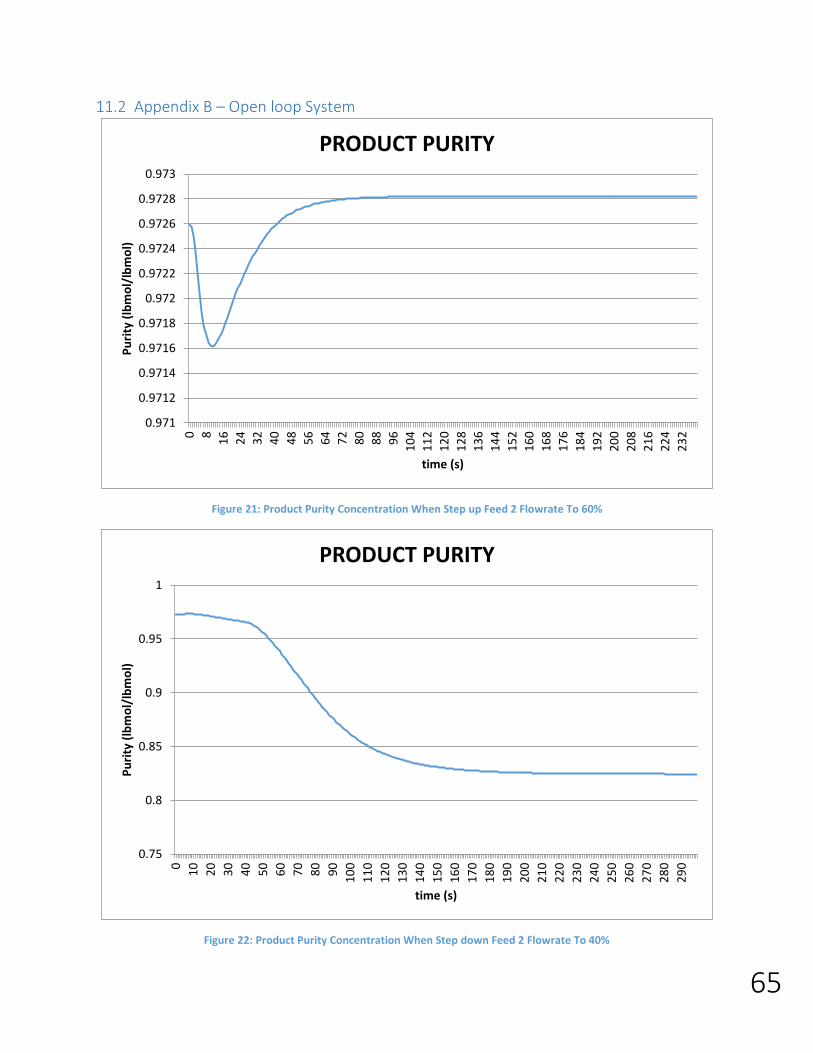
65
11.2 Appendix B – Open loop System
Figure 21: Product Purity Concentration When Step up Feed 2 Flowrate To 60%
Figure 22: Product Purity Concentration When Step down Feed 2 Flowrate To 40%
0.971
0.9712
0.9714
0.9716
0.9718
0.972
0.9722
0.9724
0.9726
0.9728
0.9730 8
16
24
32
40
48
56
64
72
80
88
96
10
4
11
2
12
0
12
8
13
6
14
4
15
2
16
0
16
8
17
6
18
4
19
2
20
0
20
8
21
6
22
4
23
2
Pu
rity
(lb
mo
l/lb
mo
l)
time (s)
PRODUCT PURITY
0.75
0.8
0.85
0.9
0.95
1
0
10
20
30
40
50
60
70
80
90
10
0
11
0
12
0
13
0
14
0
15
0
16
0
17
0
18
0
19
0
20
0
21
0
22
0
23
0
24
0
25
0
26
0
27
0
28
0
29
0
Pu
rity
(lb
mo
l/lb
mo
l)
time (s)
PRODUCT PURITY

66
Figure 23: Product Purity Concentration When Step up Coolant Flowrate To 60%
Figure 24: Product Purity Concentration When Step down Coolant Flowrate To 40%
0.89
0.9
0.91
0.92
0.93
0.94
0.95
0.96
0.97
0.98
0
10
20
30
40
50
60
70
80
90
10
0
11
0
12
0
13
0
14
0
15
0
16
0
17
0
18
0
19
0
20
0
21
0
22
0
23
0
24
0
25
0
26
0
27
0
28
0
29
0
Pu
rity
(lb
mo
l/lb
mo
l)
time (s)
PRODUCT PURITY
0.969
0.97
0.971
0.972
0.973
0.974
0.975
0.976
0.977
0
13
26
39
52
65
78
91
10
4
11
7
13
0
14
3
15
6
16
9
18
2
19
5
20
8
22
1
23
4
24
7
26
0
27
3
28
6
29
9
31
2
32
5
33
8
35
1
36
4
37
7
39
0
Pu
rity
(lb
mo
l/lb
mo
l)
time (s)
PRODUCT PURITY

67
Figure 25: Product Purity Concentration When Step up MCH Flowrate To 60%
Figure 26: Product Purity Concentration When Step down MCH Flowrate To 40%
0.8
0.82
0.84
0.86
0.88
0.9
0.92
0.94
0.96
0.98
1
0
13
26
39
52
65
78
91
10
4
11
7
13
0
14
3
15
6
16
9
18
2
19
5
20
8
22
1
23
4
24
7
26
0
27
3
28
6
29
9
31
2
32
5
33
8
35
1
36
4
37
7
39
0
Pu
rity
(lb
mo
l/lb
mo
l)
time (s)
PRODUCT PURITY
0.972582
0.972584
0.972586
0.972588
0.97259
0.972592
0.972594
0.972596
0.972598
0
17
34
51
68
85
10
2
11
9
13
6
15
3
17
0
18
7
20
4
22
1
23
8
25
5
27
2
28
9
30
6
32
3
34
0
35
7
37
4
39
1
40
8
42
5
44
2
45
9
47
6
49
3
Pu
rity
(lb
mo
l/lb
mo
l)
time (s)
PRODUCT PURITY
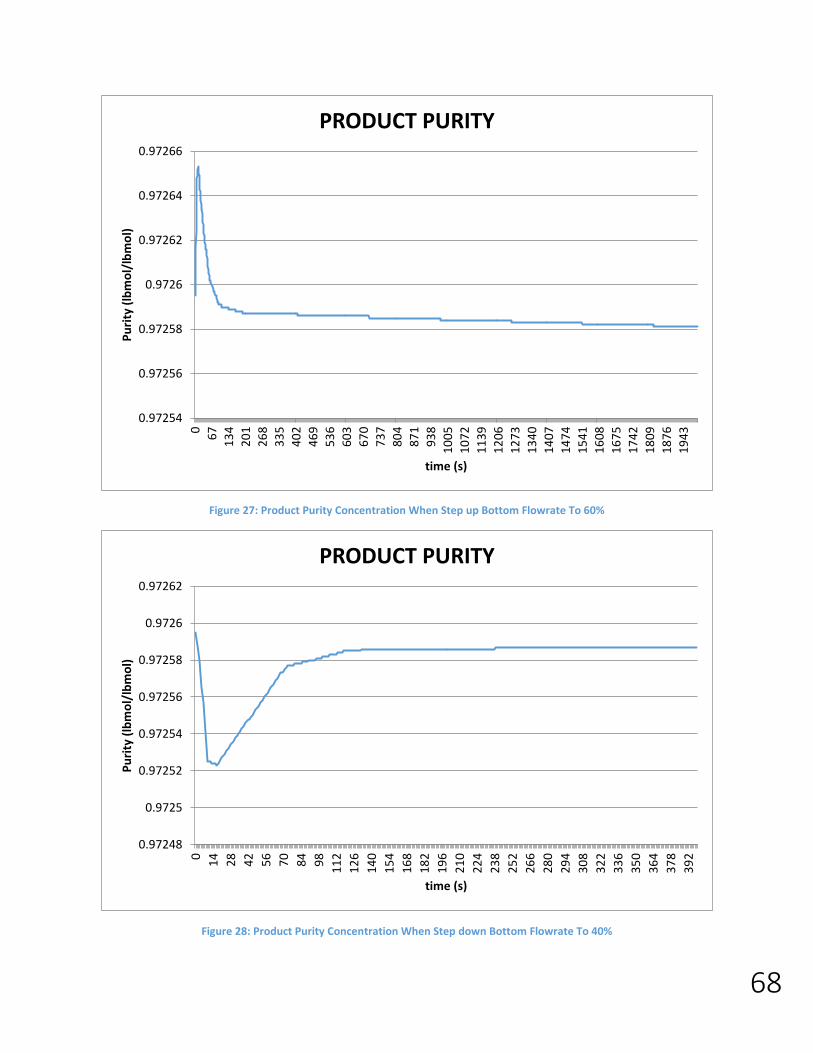
68
Figure 27: Product Purity Concentration When Step up Bottom Flowrate To 60%
Figure 28: Product Purity Concentration When Step down Bottom Flowrate To 40%
0.97254
0.97256
0.97258
0.9726
0.97262
0.97264
0.97266
0
67
13
4
20
1
26
8
33
5
40
2
46
9
53
6
60
3
67
0
73
7
80
4
87
1
93
8
10
05
10
72
11
39
12
06
12
73
13
40
14
07
14
74
15
41
16
08
16
75
17
42
18
09
18
76
19
43
Pu
rity
(lb
mo
l/lb
mo
l)
time (s)
PRODUCT PURITY
0.97248
0.9725
0.97252
0.97254
0.97256
0.97258
0.9726
0.97262
0
14
28
42
56
70
84
98
11
2
12
6
14
0
15
4
16
8
18
2
19
6
21
0
22
4
23
8
25
2
26
6
28
0
29
4
30
8
32
2
33
6
35
0
36
4
37
8
39
2
Pu
rity
(lb
mo
l/lb
mo
l)
time (s)
PRODUCT PURITY
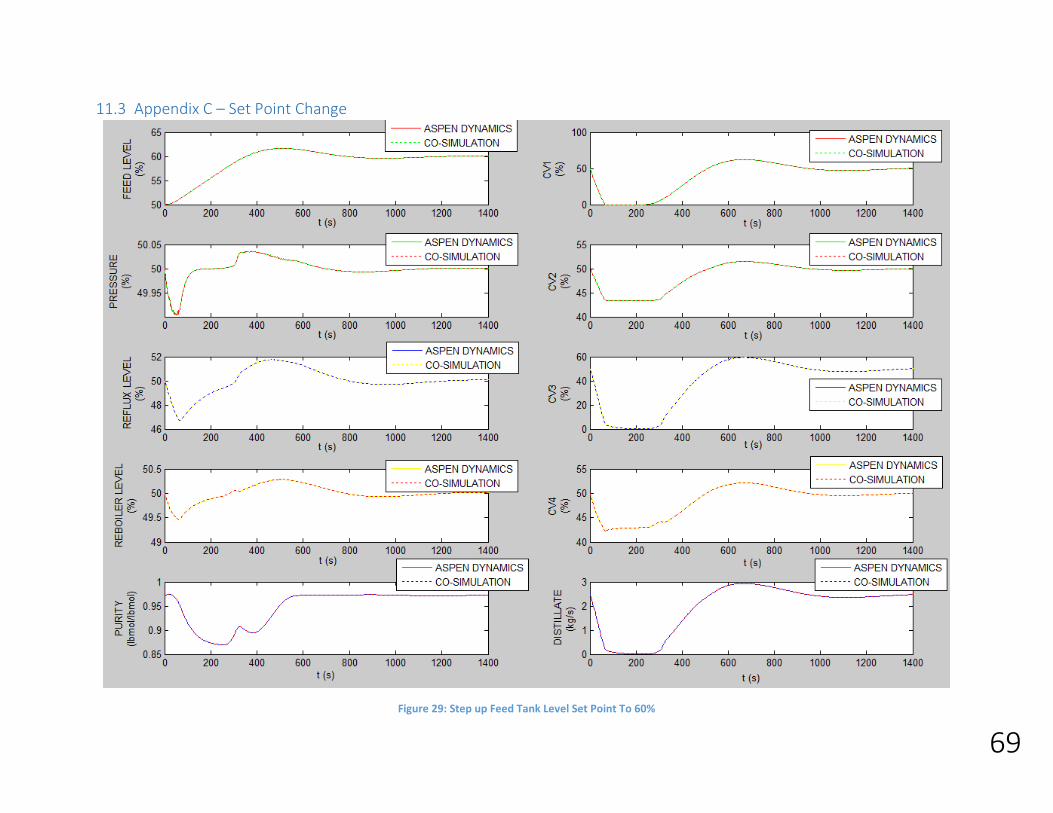
69
11.3 Appendix C – Set Point Change
Figure 29: Step up Feed Tank Level Set Point To 60%

70
Figure 30: Step down Feed Tank Level Set Point To 40%

71
Figure 31: Step up Pressure Set Point To 60%

72
Figure 32: Step down Pressure Set Point To 40%
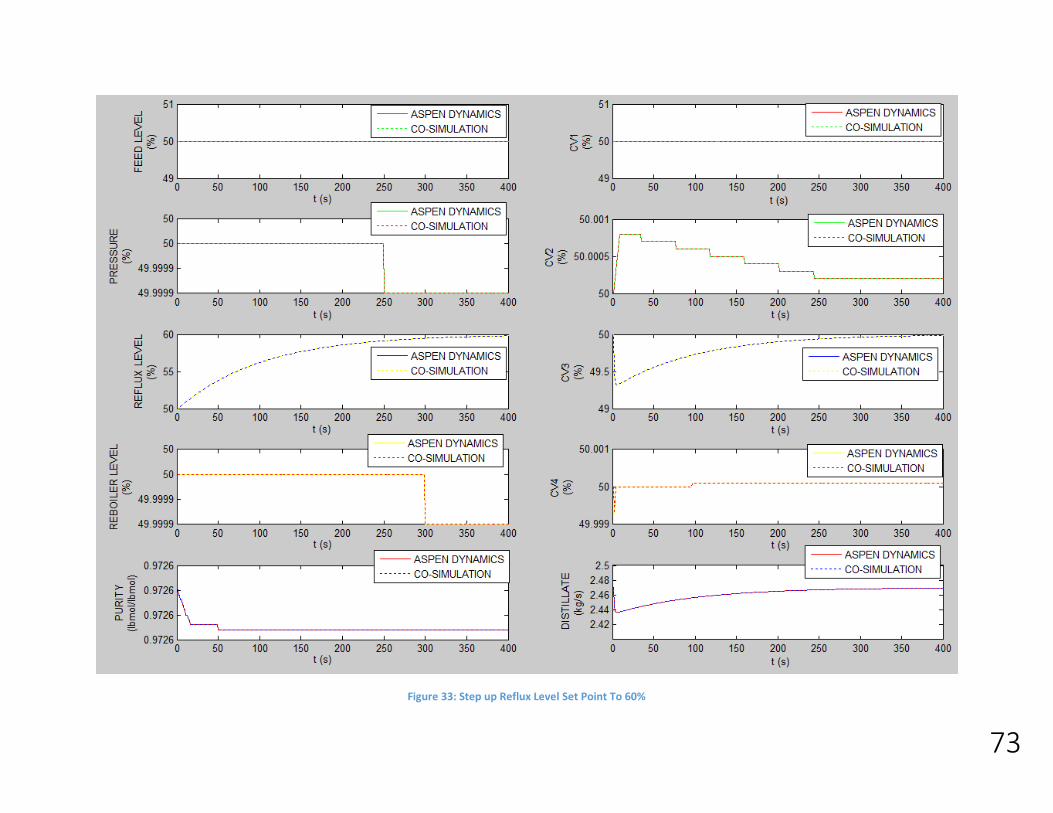
73
Figure 33: Step up Reflux Level Set Point To 60%
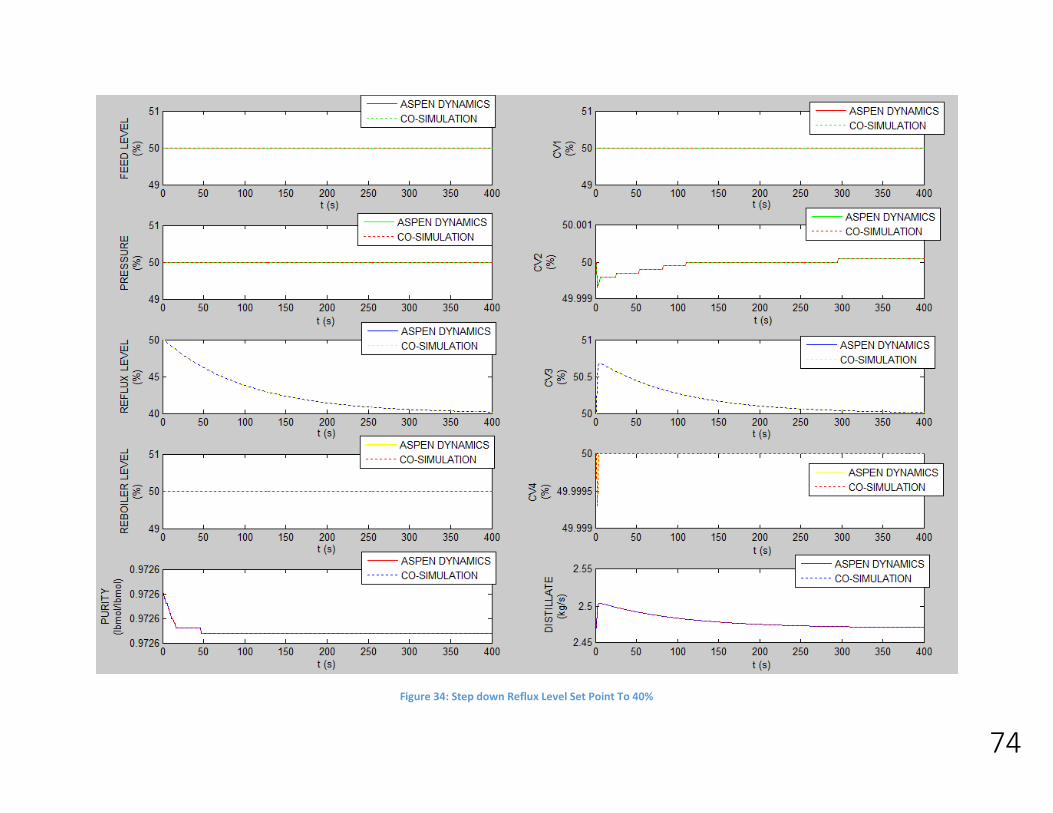
74
Figure 34: Step down Reflux Level Set Point To 40%

75
Figure 35: Step up Reboiler Level Set Point To 60%
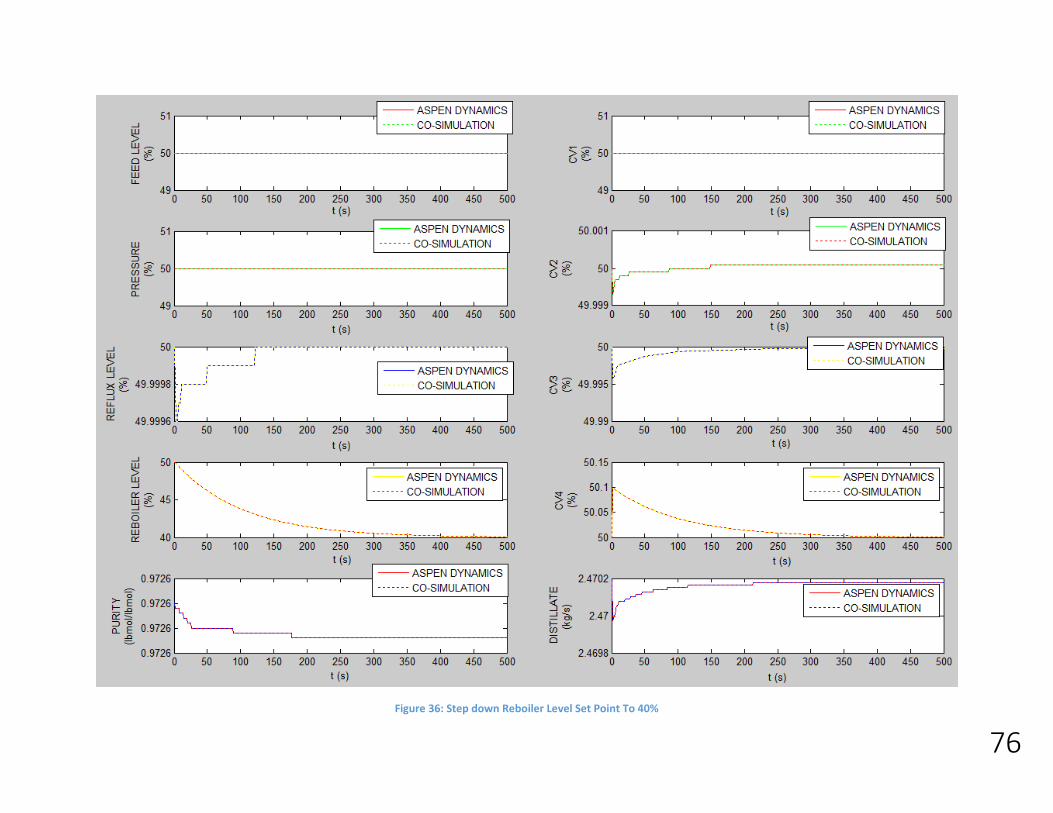
76
Figure 36: Step down Reboiler Level Set Point To 40%
Related Documents