Descriptive Statistics

Welcome message from author
This document is posted to help you gain knowledge. Please leave a comment to let me know what you think about it! Share it to your friends and learn new things together.
Transcript

Descriptive Statistics
Descriptive Statistics:Summarizing your data and getting an overview of the dataset
Why do you want to start with Descriptive Statistics? Descriptive Frequencies
Allows us to answer questions like: What are the trends in my data? What is my sample population? (e.g., male/female,
students, young/old, Freshmen/Sophomore/Junior/Senior, etc.)
Are there any errors in my data?!

Descriptive StatisticsStep 1. “Week1_Descriptives_Examples.sav”

Descriptive StatisticsStep 2.
Switch to Data View
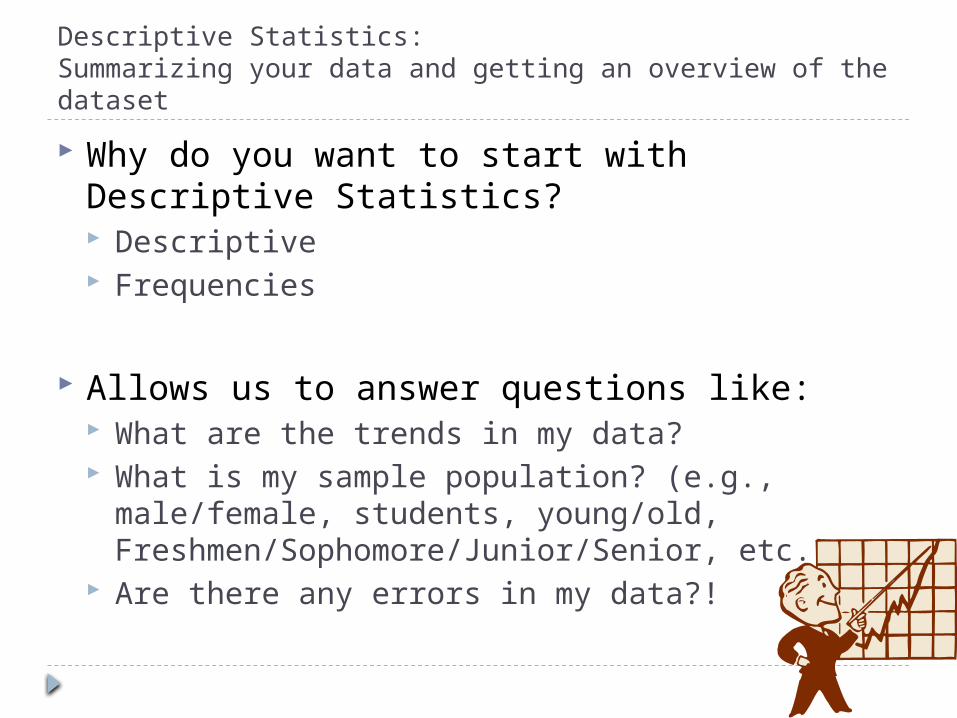
Descriptive StatisticsStep 3. “Analyze” then hover over “Descriptive
Statistics”
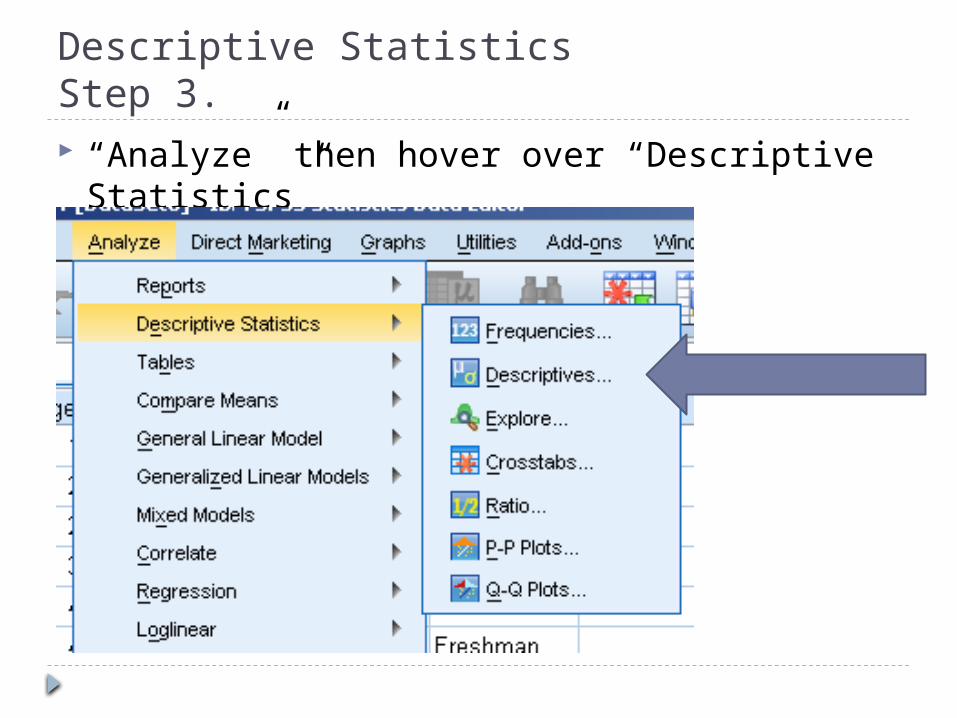
Descriptive StatisticsStep 4. Select the variables you’re interested in Click on the middle arrow to move them over
to the “Variable(s):” column. Click on “Options” to select additional
information for this analysis (see next screen)
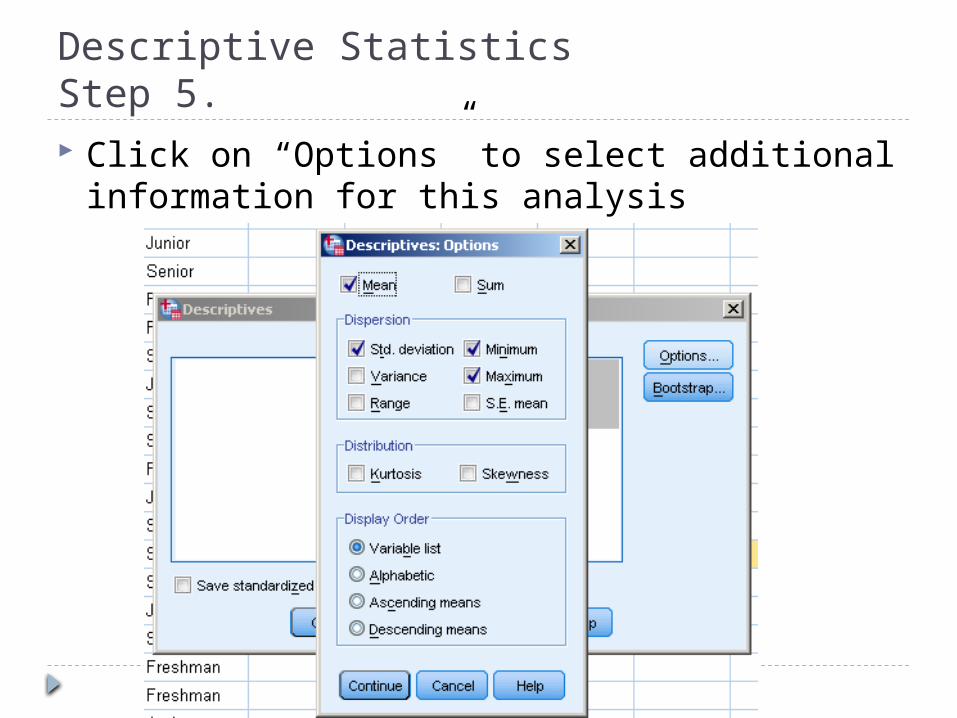
Descriptive StatisticsStep 5. Click on “Options” to select additional
information for this analysis

Descriptive StatisticsStep 6. In the “Output” window, you will see the result
of your analysis.

Descriptive Statistics cont.Frequencies Frequency distributions are useful to
summarizing data such as grades, constructing tables for a paper, and checking for errors (range and limits).
Normally, it is easier to work with a Code that is represented by a Score. For example, the Letter Grade A is a Code that is represented by a score of 4.0.
__X ____ f _ 4.0 10 3.0 7 2.0 21 1.0 2 0.0 0
Frequencies

FrequenciesStep 1. “Analyze” then hover over “Descriptive
Statistics” Select Frequencies
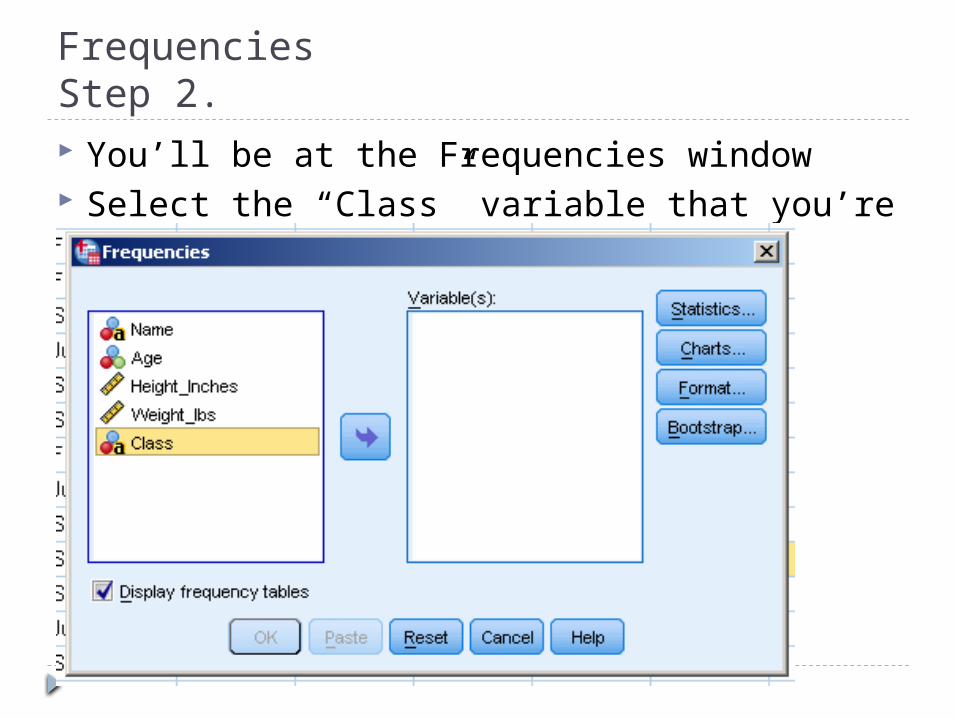
FrequenciesStep 2. You’ll be at the Frequencies window Select the “Class” variable that you’re
interested in.
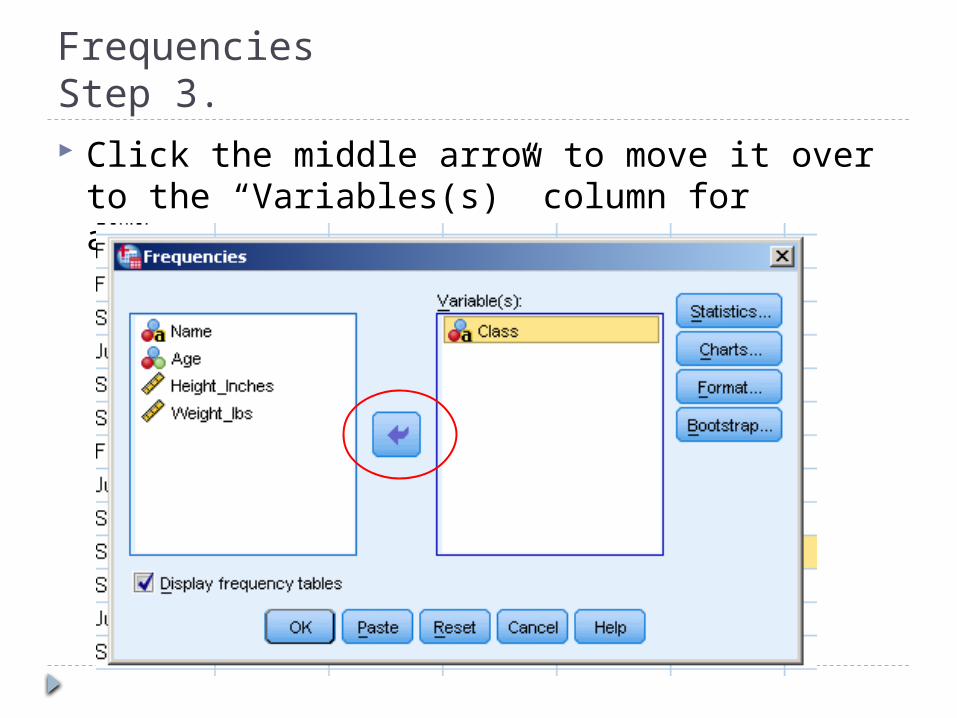
FrequenciesStep 3. Click the middle arrow to move it over to the
“Variables(s)” column for analysis
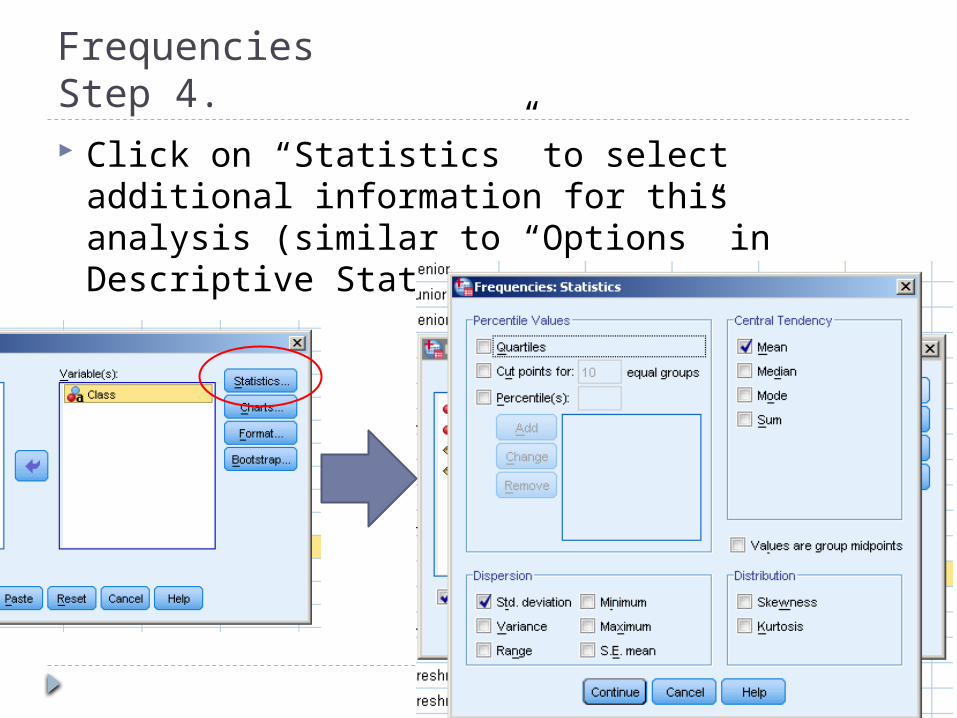
FrequenciesStep 4. Click on “Statistics” to select additional
information for this analysis (similar to “Options” in Descriptive Statistics)
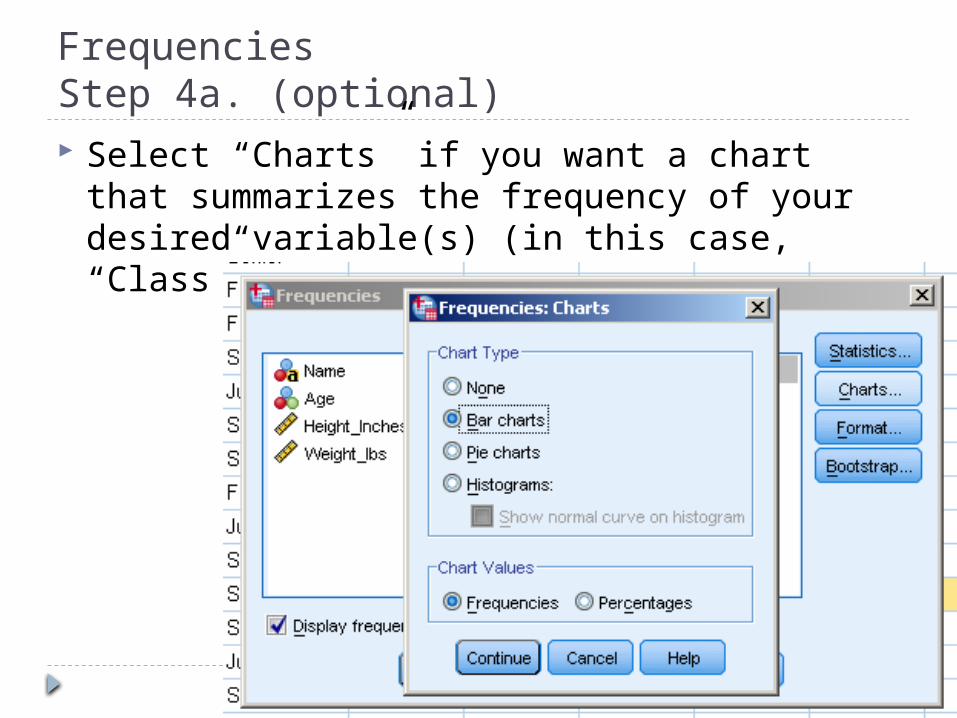
FrequenciesStep 4a. (optional) Select “Charts” if you want a chart that
summarizes the frequency of your desired variable(s) (in this case, “Class”)
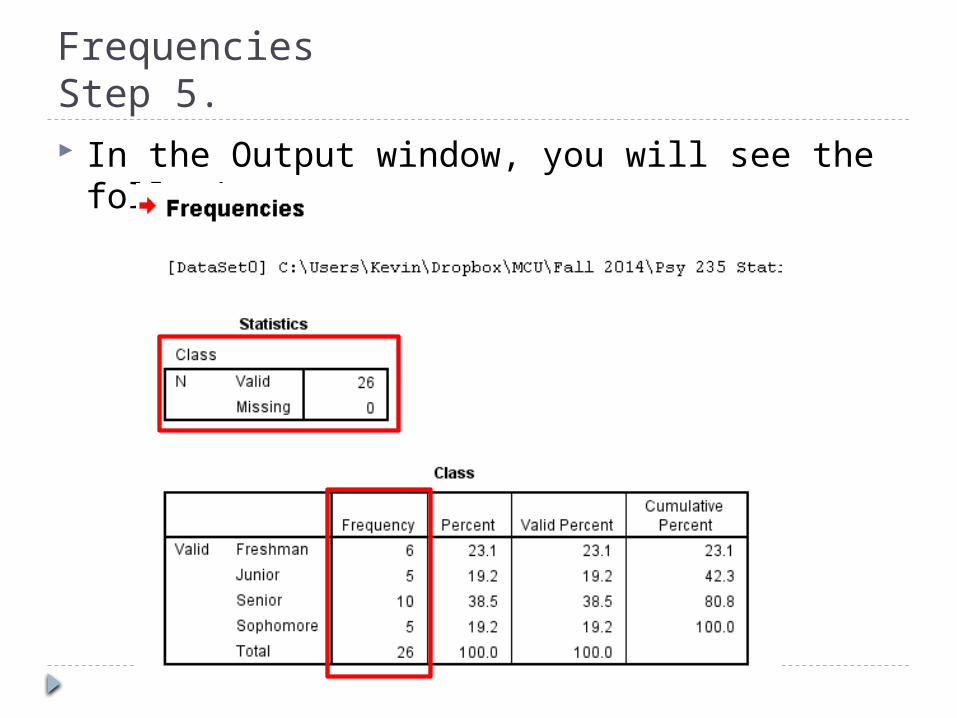
FrequenciesStep 5. In the Output window, you will see the
following:
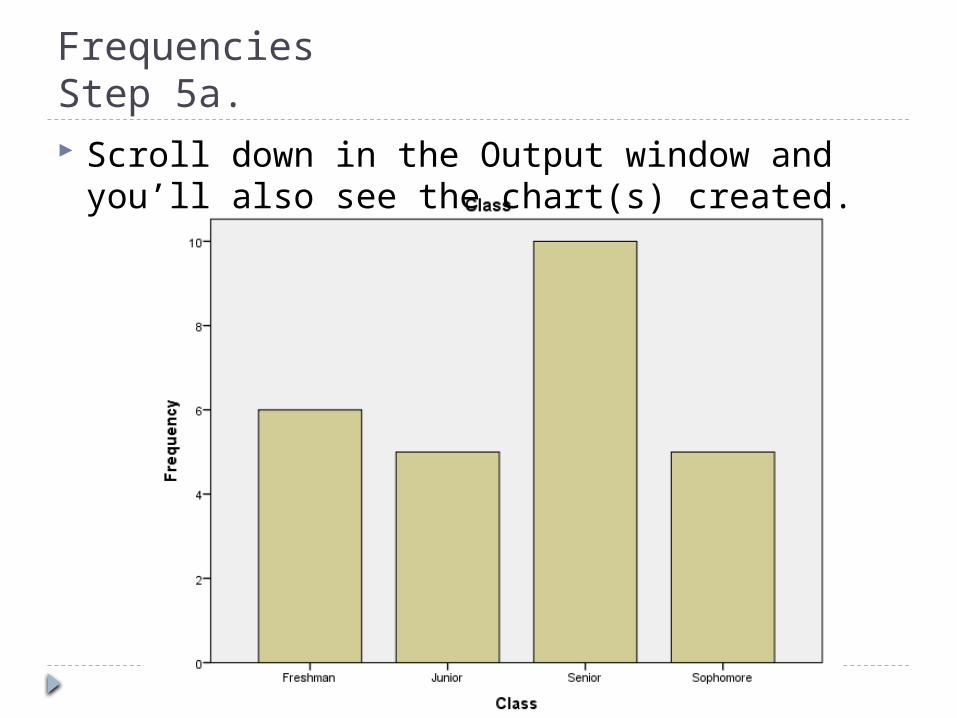
FrequenciesStep 5a. Scroll down in the Output window and you’ll
also see the chart(s) created.
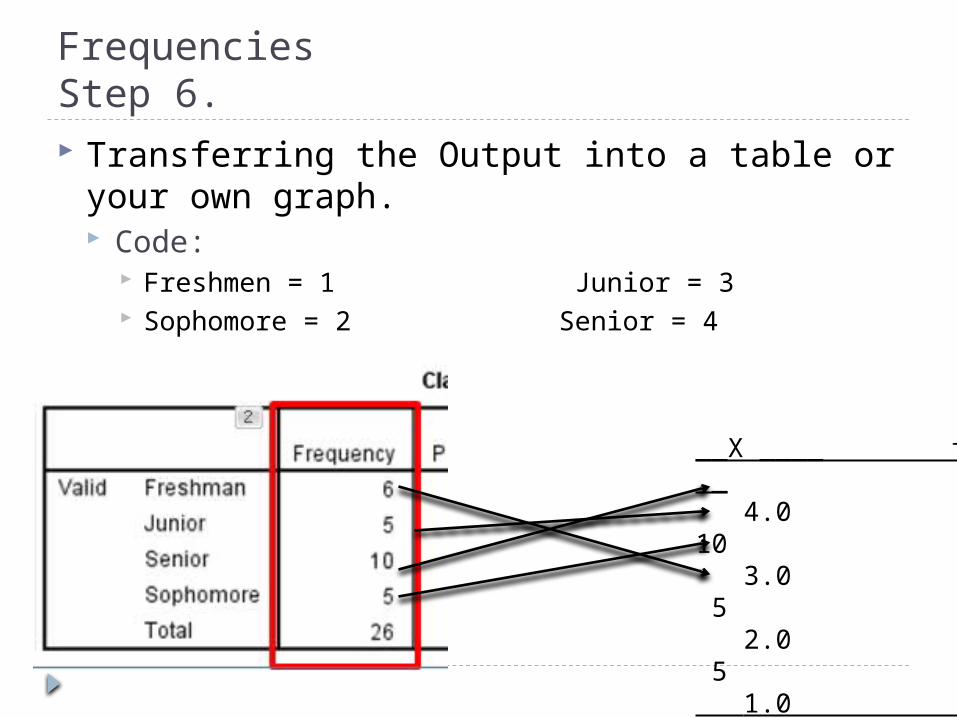
FrequenciesStep 6. Transferring the Output into a table or your
own graph. Code:
Freshmen = 1 Junior = 3 Sophomore = 2 Senior = 4
__X ____ f _ 4.0 10 3.0 5 2.0 5 1.0 6 _ N = 26
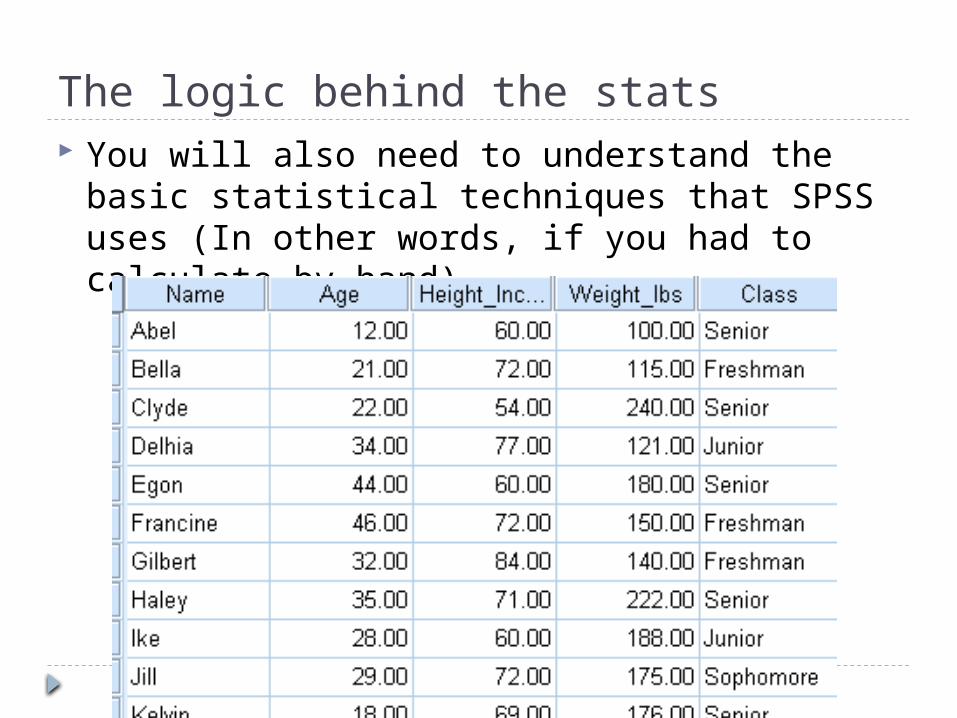
The logic behind the stats You will also need to understand the basic
statistical techniques that SPSS uses (In other words, if you had to calculate by hand).

The logic behind the stats You will also need to understand the basic
statistical techniques that SPSS uses (In other words, if you had to calculate by hand).
Name Age Height (inches) Weight (lbs.) Class StandingAbel 12 60 100.00 SeniorBella 21 72 115.00 FreshmanClyde 22 54 240.00 SeniorDelhia 34 77 121.00 JuniorEgon 44 60 180.00 SeniorFrancine 46 72 150.00 FreshmanGilbert 32 84 140.00 FreshmanHaley 35 71 222.00 SeniorIke 28 60 188.00 JuniorJill 29 72 175.00 SophomoreKelvin 18 69 176.00 SeniorLaura 10 63 142.00 FreshmanMike 9 64 133.00 JuniorNaomi 56 60 165.00 SeniorOscar 68 66 100.00 SophomorePaula 43 62 90.00 SophomoreQuinn 27 60 97.00 JuniorRussell 38 68 91.00 SeniorSam 34 60 111.00 Freshman
Name Age Height (inches) Weight (lbs.) Class StandingAbel 12 60 100.00 SeniorBella 21 72 115.00 FreshmanClyde 22 54 240.00 SeniorDelhia 34 77 121.00 JuniorEgon 44 60 180.00 SeniorFrancine 46 72 150.00 FreshmanGilbert 32 84 140.00 FreshmanHaley 35 71 222.00 SeniorIke 28 60 188.00 JuniorJill 29 72 175.00 SophomoreKelvin 18 69 176.00 SeniorLaura 10 63 142.00 FreshmanMike 9 64 133.00 JuniorNaomi 56 60 165.00 SeniorOscar 68 66 100.00 SophomorePaula 43 62 90.00 SophomoreQuinn 27 60 97.00 JuniorRussell 38 68 91.00 Senior
Name Age Height (inches) Weight (lbs.) Class StandingAbel 12 60 100.00 SeniorBella 21 72 115.00 FreshmanClyde 22 54 240.00 SeniorDelhia 34 77 121.00 JuniorEgon 44 60 180.00 Senior
Francine 46 72 150.00 FreshmanGilbert 32 84 140.00 FreshmanHaley 35 71 222.00 SeniorIke 28 60 188.00 JuniorJill 29 72 175.00 Sophomore
Kelvin 18 69 176.00 SeniorLaura 10 63 142.00 FreshmanMike 9 64 133.00 JuniorNaomi 56 60 165.00 SeniorOscar 68 66 100.00 SophomorePaula 43 62 90.00 SophomoreQuinn 27 60 97.00 JuniorRussell 38 68 91.00 Senior

The logic behind the statsName Age Height (inches) Weight (lbs.) Class Standing
Abel 12 60 100.00 SeniorBella 21 72 115.00 FreshmanClyde 22 54 240.00 SeniorDelhia 34 77 121.00 JuniorEgon 44 60 180.00 SeniorFrancine 46 72 150.00 FreshmanGilbert 32 84 140.00 FreshmanHaley 35 71 222.00 SeniorIke 28 60 188.00 JuniorJill 29 72 175.00 SophomoreKelvin 18 69 176.00 SeniorLaura 10 63 142.00 FreshmanMike 9 64 133.00 JuniorNaomi 56 60 165.00 SeniorOscar 68 66 100.00 SophomorePaula 43 62 90.00 SophomoreQuinn 27 60 97.00 JuniorRussell 38 68 91.00 SeniorSam 34 60 111.00 Freshman
Count how many
participant you have
N = ?
Find the highest score and lowest score in the distribution
Range of X to Y
(All scores / # of scores) of each column
Mean of Age, Height, Weight
Count how many Freshmen, Sophomore, Junior, and Senior you
have
Frequency Distribution of Class Standing
X f
Related Documents