C o lle ctin g In fo rm ation D e sc rip tiv e R esearch Q u a n tita tiv e M ethod S tatistica lM ethod C o m p a ra tiv e R esearch S tatistica lC om parisons E xp e rim e n ta l R e s e a rch A n a lys is o f S tatistica lD a ta Q u a n tita tive R e s e a rch C h ara cte ristics Q u a lita tive Reseach R e se a rc h D esigns

Welcome message from author
This document is posted to help you gain knowledge. Please leave a comment to let me know what you think about it! Share it to your friends and learn new things together.
Transcript

C olle cting In fo rm ation
D e sc r ip tiv e R esea rchQ u an tita tiv e M eth od
S ta tis tica l M eth od
C o m p ara tiv e R ese archS ta tis tica l C om pa r iso ns
E xpe r im en ta l R esea rchA n a lys is o f S ta tis t ica l D a ta
Q u an ti ta tive R e sea rch
C h ara cte r is t ics
Q u a li ta tive R e sea ch
R e sea rch D es ig ns

Descriptive Research: Quantitative Method
• Descriptive Analysis
– Limits generalization to the particular group of individuals observed.
– No conclusions are extended beyond this group
– Any similarities to those outside the group can not be assumed
– The data describe one group and that group only
– Provides information about the nature of a particular group of individuals.

Descriptive Research: Quantitative Method
• Raw Data– Frequencies
• Measures of Central Tendency– Mean
• Used with Interval and Ratio Scaled data• Is the most stable measure of central tendency• Extreme scores may have undo influence over the results• used when the distribution of scores has approximately the same number of extremely high and low scores
– Median• Preferred when an Ordinal Scale is used• Used when data is anticipated to be missing and a reporting of mean would be misleading (slow learners
example)
– Mode• Quickest method• Best used only when Nominal Data are being described• Mode can fluctuate wildly with a small change in a few scores

Descriptive Research: Statistical Method• Measures of Variability
– Range• The difference between the values of the largest and smallest scores in a
distribution• Changes of only a few scores can effect it greatly: least stable measure• Can not be used with Nominal Data• Use should be restricted to Ordinal or Interval Data
– Standard Deviation• Most widely used measure of Variability
– The larger the standard deviation the greater the degree of variability– Can never be less than 0
• The absolute value of the standard deviation has little meaning.• SD should be considered a relative measure (i.e., SD’s of 5 and 60 mean
exactly the same thing when foot and inch scales are used.

Descriptive Research: Statistical Method• Standard Scores
– Z-Score Scale• Used to convert measurements from any arbitrary unit to a common standard• Used to allow direct comparison of individual scores obtained from scales of
measurement with quantitatively or even qualitatively different units of measurement.
• The unit of measurement on the z-score scale is the standard deviation of the distribution of the original measurements
• The mean of the z-score scale is 0.
– Other Standard Scores in Common Use• T score: M=50, SD=10• GRE, SAT: M=500, SD=100• IQ: M=100, SD=15• ACT: M= 20, SD=5

Statistical Method: Foundations
– Type I and Type II Error
He is cheating He is not cheating
You decide he is cheating
You decide he is not cheating
You are correct
You are wrong (Type I error – alpha)
You are correctYou are wrong (Type II error – beta)

Statistical Method: Foundations
• Probability– Definition of Probability
• The probability of an event is the number of favorable events divided by the number of possible events
– Additive Law of Probability• When the events are related by the word or• Probability of pulling an Ace or King
P(ace)= 4/52 (.08) P(king)= 4/52 (.08): P(ace or king) = 8/52 (.16)
– Multiplicative Law of Probability• When the events are related by the word and• Probability of pulling an Ace and a King
P(ace or king)=8/52 (.16) P(what was not drawn 1st)= 4/51 (.08):P(ace and king) = .16 x .08 = .01

Statistical Method: Foundations
• Subject Selection– Random
• All elements in a population have an equal chance of being chosen to participate in the sample
– Independent• The probability of an event does not depend on previous
events (the gambler’s fallacy)

Descriptive Research: Statistical Method
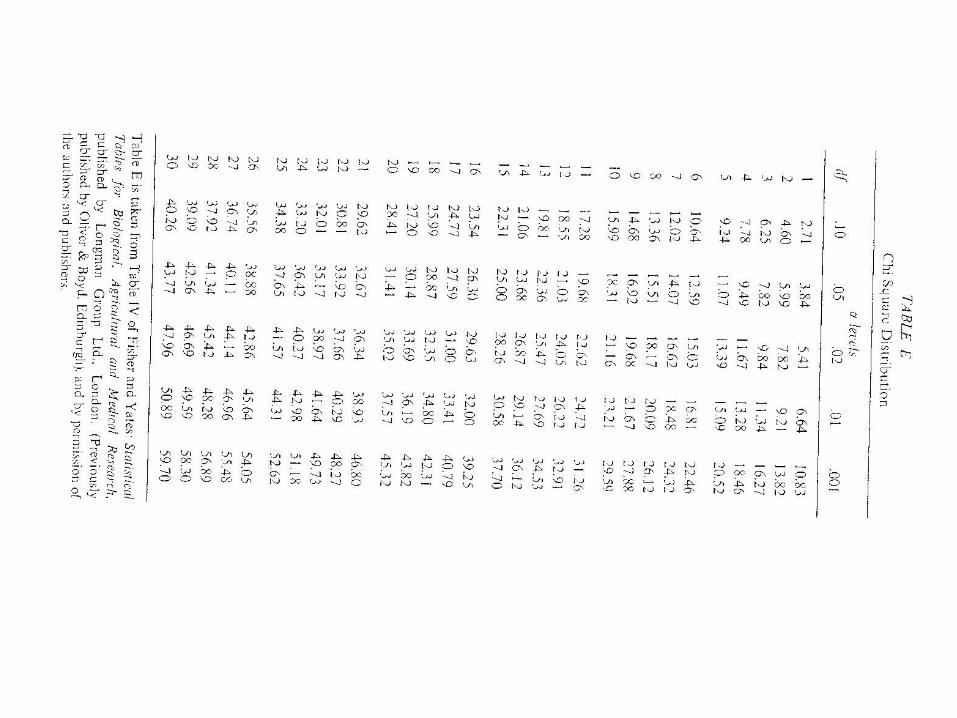
• Chi Square (χ2)– Typically used with Nominal data to compare
proportions
– Used to ascertain a probability that proportions of representation within categories are similar or different across groups
– Compares what was Observed to what was Expected
χ2 = Σ ((fo – fe)2 / fe)
– Assigns a probability that what was observed was not a function of random error

Descriptive Research: Statistical Method
• Chi Square (χ2)
SPED 6370 SPED Grad
Male 3 33
Female 13 180

6370 SPED
M 3 33
F 13 180
36 193
22916 213
Compute Expected
(16 x 33) / 229 = 2.31(16 x 193) / 229 = 13.49(213 x 33) / 229 = 30.69(213 x 193) / 229 = 179.52
6370 SPED
M 3 (2.31) 42 (30.69)
F 13 (13.49) 180 (179.52)
Compute χ2
(3 – 2.31)2 / 2.31 = .21(13– 13.49)2 / 13.49 = .02(42 – 30.69)2 / 30.69 = .17(180 – 179.52)2 / 179.52 = .00
χ2 = .21 + .02 + .17 + .00 = .40 (ns)Table Lookup (1 df)
* .05 must be > 3.84** .01 must be > 6.64
χ2 = Σ ((fo – fe)2 / fe)

Descriptive Research: Statistical Method
• Correlation– A measure of the relationship between two or more
paired variables or two or more sets of data– The degree of relationship may be measured and
represented by the coefficient of correlation: -1 to +1– Represented by either the letter r or the Greek letter
rho р)– Positive correlation Negative correlation
Intelligence Academic Achievement Academic Achievement TV timeProductivity Value of Farm Total corn production $ per bushelHeight Shoe size Practice time ErrorsIncome Value of Home Age of automobile trade-in value

Variables in Correlational Research
Predictor Variables:– ones in which participants' scores enable
prediction of their scores on some criterion variable. May be thought of as independent variables
Criterion Variables:– the object of the research. the variable about
which researchers seek to discover more information. May be thought of as dependent variables.
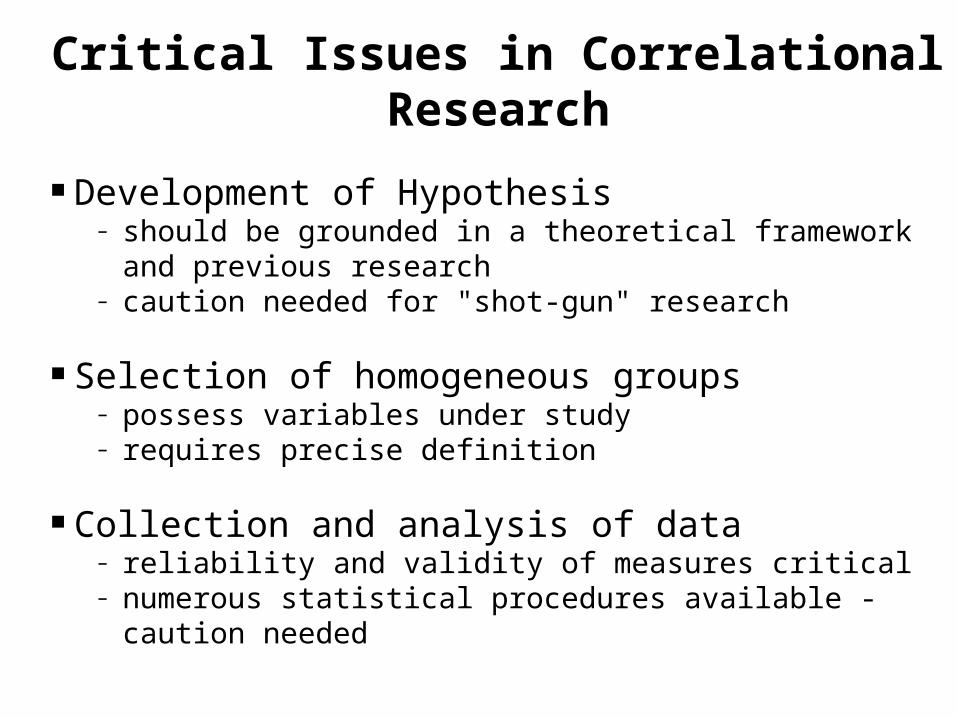
Critical Issues in Correlational Research
Development of Hypothesis– should be grounded in a theoretical framework and previous
research– caution needed for "shot-gun" research
Selection of homogeneous groups– possess variables under study– requires precise definition
Collection and analysis of data– reliability and validity of measures critical– numerous statistical procedures available - caution needed

Calculation of Correlation
(Zx1 * Zy1) + (Zx2 * Zy2) + (Zx3 * Zy3) + .....
Nr =
a correlation is a covariance ratio
∑(Zx)(Zy)
Nr =
1 +1.5 +1.2 + 1.82 - .75 - .9 + .683 + .2 + .7 + .144 - 1.0 - .75 + .75 5 +1.4 +1.2 + 1.686 -.10 - .30 + .03
5.08
r = 5.08 / 6 = .85
x y xy

Correlationpositive: +.99 negative: -.95
positive: +.45 none: 0

Interpreting Correlation Look at correlation (r) separate from probability (p)correlation tells you amount of relationship
positive and negative define direction of relationshipr defines amount of relationship
probability (p) tells you the odds that you observed the relationship by chance
Interpretation Coefficient Interpretation
.00 to .20 Negligible .20 to .40 Low .40 to .60 Moderate .60 to .80 Substantial .80 to 1.00 High to Very High

Common Correlations• Pearson Product Moment Correlation
– both variables are continuous
• Spearman Rank-order Correlation – both variables are measured as rank data
• Biserial Correlation– one variable is continuous and one is an
‘artificial’ dichotomy with an underlying normal distribution
• Point-Biserial Correlation– one variable is continuous and one is a ‘true’
dichotomy
• Phi Coefficient– both variables are ‘true’ dichotomies

More Correlations• Tetrachoric Correlation
– both variables are ‘artificial’ dichotomies with underlying normal distributions
• Polychoric Correlation– both variables are ordinally measured with both having
underlying normal distributions
• Polyserial Correlation (rps, Dps)– one variable is continuous and one is ordinal with an
underlying normal distribution
• Kendall Tau-b– measures agreement between two rankings
• Kendall’s Coefficient of Concordance– measures of the extent to which members of a set of m distinct rank orderings of N things tend to be similar
Related Documents


