RESEARCH ARTICLE Open Access Descriptive epidemiology of cholera outbreak in Nigeria, January–November, 2018: implications for the global roadmap strategy Kelly Osezele Elimian 1,2* , Anwar Musah 3 , Somto Mezue 2 , Oyeronke Oyebanji 1 , Sebastian Yennan 1 , Arisekola Jinadu 1 , Nanpring Williams 1 , Adesola Ogunleye 1 , Ibrahima Soce Fall 4 , Michel Yao 4 , Womi-Eteng Eteng 1 , Patrick Abok 4 , Michael Popoola 1 , Martin Chukwuji 5 , Linda Haj Omar 4 , Eme Ekeng 1 , Thieno Balde 4 , Ibrahim Mamadu 5 , Ayodele Adeyemo 6 , Geoffrey Namara 5 , Ifeanyi Okudo 5 , Wondimagegnehu Alemu 5 , Clement Peter 5 and Chikwe Ihekweazu 1 Abstract Background: The cholera outbreak in 2018 in Nigeria reaffirms its public health threat to the country. Evidence on the current epidemiology of cholera required for the design and implementation of appropriate interventions towards attaining the global roadmap strategic goals for cholera elimination however seems lacking. Thus, this study aimed at addressing this gap by describing the epidemiology of the 2018 cholera outbreak in Nigeria. Methods: This was a retrospective analysis of surveillance data collected between January 1st and November 19th, 2018. A cholera case was defined as an individual aged 2 years or older presenting with acute watery diarrhoea and severe dehydration or dying from acute watery diarrhoea. Descriptive analyses were performed and presented with respect to person, time and place using appropriate statistics. Results: There were 43,996 cholera cases and 836 cholera deaths across 20 states in Nigeria during the outbreak period, with an attack rate (AR) of 127.43/100,000 population and a case fatality rate (CFR) of 1.90%. Individuals aged 15 years or older (47.76%) were the most affected age group, but the proportion of affected males and females was about the same (49.00 and 51.00% respectively). The outbreak was characterised by four distinct epidemic waves, with higher number of deaths recorded in the third and fourth waves. States from the north-west and north-east regions of the country recorded the highest ARs while those from the north-central recorded the highest CFRs. Conclusion: The severity and wide-geographical distribution of cholera cases and deaths during the 2018 outbreak are indicative of an elevated burden, which was more notable in the northern region of the country. Overall, the findings reaffirm the strategic role of a multi-sectoral approach in the design and implementation of public health interventions aimed at preventing and controlling cholera in Nigeria. Keywords: Cholera, Outbreak, Attack rate, Case fatality rate, Global roadmap, Nigeria, Multi-sectoral © The Author(s). 2019 Open Access This article is distributed under the terms of the Creative Commons Attribution 4.0 International License (http://creativecommons.org/licenses/by/4.0/), which permits unrestricted use, distribution, and reproduction in any medium, provided you give appropriate credit to the original author(s) and the source, provide a link to the Creative Commons license, and indicate if changes were made. The Creative Commons Public Domain Dedication waiver (http://creativecommons.org/publicdomain/zero/1.0/) applies to the data made available in this article, unless otherwise stated. * Correspondence: [email protected] 1 Nigeria Centre for Disease Control, Abuja, Nigeria 2 University of Benin, Benin City, Edo State, Nigeria Full list of author information is available at the end of the article Elimian et al. BMC Public Health (2019) 19:1264 https://doi.org/10.1186/s12889-019-7559-6

Welcome message from author
This document is posted to help you gain knowledge. Please leave a comment to let me know what you think about it! Share it to your friends and learn new things together.
Transcript

RESEARCH ARTICLE Open Access
Descriptive epidemiology of choleraoutbreak in Nigeria, January–November,2018: implications for the global roadmapstrategyKelly Osezele Elimian1,2*, Anwar Musah3, Somto Mezue2, Oyeronke Oyebanji1, Sebastian Yennan1, Arisekola Jinadu1,Nanpring Williams1, Adesola Ogunleye1, Ibrahima Soce Fall4, Michel Yao4, Womi-Eteng Eteng1, Patrick Abok4,Michael Popoola1, Martin Chukwuji5, Linda Haj Omar4, Eme Ekeng1, Thieno Balde4, Ibrahim Mamadu5,Ayodele Adeyemo6, Geoffrey Namara5, Ifeanyi Okudo5, Wondimagegnehu Alemu5, Clement Peter5 andChikwe Ihekweazu1
Abstract
Background: The cholera outbreak in 2018 in Nigeria reaffirms its public health threat to the country. Evidence on thecurrent epidemiology of cholera required for the design and implementation of appropriate interventions towardsattaining the global roadmap strategic goals for cholera elimination however seems lacking. Thus, this study aimed ataddressing this gap by describing the epidemiology of the 2018 cholera outbreak in Nigeria.
Methods: This was a retrospective analysis of surveillance data collected between January 1st and November 19th,2018. A cholera case was defined as an individual aged 2 years or older presenting with acute watery diarrhoea andsevere dehydration or dying from acute watery diarrhoea. Descriptive analyses were performed and presented withrespect to person, time and place using appropriate statistics.
Results: There were 43,996 cholera cases and 836 cholera deaths across 20 states in Nigeria during the outbreakperiod, with an attack rate (AR) of 127.43/100,000 population and a case fatality rate (CFR) of 1.90%. Individuals aged15 years or older (47.76%) were the most affected age group, but the proportion of affected males and females wasabout the same (49.00 and 51.00% respectively). The outbreak was characterised by four distinct epidemic waves, withhigher number of deaths recorded in the third and fourth waves. States from the north-west and north-east regions ofthe country recorded the highest ARs while those from the north-central recorded the highest CFRs.
Conclusion: The severity and wide-geographical distribution of cholera cases and deaths during the 2018 outbreak areindicative of an elevated burden, which was more notable in the northern region of the country. Overall, the findingsreaffirm the strategic role of a multi-sectoral approach in the design and implementation of public health interventionsaimed at preventing and controlling cholera in Nigeria.
Keywords: Cholera, Outbreak, Attack rate, Case fatality rate, Global roadmap, Nigeria, Multi-sectoral
© The Author(s). 2019 Open Access This article is distributed under the terms of the Creative Commons Attribution 4.0International License (http://creativecommons.org/licenses/by/4.0/), which permits unrestricted use, distribution, andreproduction in any medium, provided you give appropriate credit to the original author(s) and the source, provide a link tothe Creative Commons license, and indicate if changes were made. The Creative Commons Public Domain Dedication waiver(http://creativecommons.org/publicdomain/zero/1.0/) applies to the data made available in this article, unless otherwise stated.
* Correspondence: [email protected] Centre for Disease Control, Abuja, Nigeria2University of Benin, Benin City, Edo State, NigeriaFull list of author information is available at the end of the article
Elimian et al. BMC Public Health (2019) 19:1264 https://doi.org/10.1186/s12889-019-7559-6

BackgroundCholera is an acute watery diarrhoeal disease caused bythe ingestion of food or water contaminated with thetoxigenic strains of Vibrio cholerae serogroups O1 orO139 [1]. Cholera is often characterised by watery diar-rhoea, with or without vomiting, and severe dehydration,resulting in death if left untreated [2]. The Case FatalityRate (CFR) from untreated cholera can be as high as30–50%, but prompt administration of rehydration ther-apy can reduce it to as low as 1% [2]. The global esti-mates for cholera cases and deaths are about 2.9 millionand 95,000 per year, respectively [3], disproportionatelyaffecting sub-Saharan African countries especially sinceonset of the seventh pandemic in 1961 [1]. For instance,17 African countries reported over 150,000 cholera casesfrom all the outbreaks in 2017.Historically, Nigeria has experienced several cholera
outbreaks characterised by high CFRs, notable ones beingthe epidemic of 1991 which resulted in 59,478 cases and7654 deaths, and the CFR of 12.9% reported for that out-break remains the highest for the country to date. Further-more, another major cholera outbreak occurred in Kanostate in March, 1999, with cases spreading to Adamawaand Edo states by May of that year; and the outbreak re-sulted in 26,358 cases and 2085 deaths. From January toDecember 2010, Nigeria reported 41,787 cases and 1716deaths (CFR 4.1%) across 18 states [4]. The last majorcholera outbreak prior to 2018 was in 2014, during whichthe number of cases recorded cases surpassed over half ofthe number of cases recorded between 2012 and 2013 aswell as between 2015 and 2017. In line with global evi-dence, however, it is likely that cholera burden in Nigeriais underestimated due to factors ranging from differencesin case definitions and completeness to social, political,and economic disincentives for reporting cholera [5].Nonetheless, in response to the increasing global choleraburden, the Global Task Force on Cholera Control(GTFCC), in 2017, launched the Global Roadmap Strat-egies which seek to reduce cholera-related deaths by 90%as well as eliminate cholera infections in at least 20 out ofthe 47 endemic countries by 2030 [6]. Nigeria has takenfundamental steps toward attaining these goals by deploy-ing Oral Cholera Vaccines (OCVs) in cholera hotspots.Since the first deployment in September 2017 to date, mil-lion doses of OCVs have been deployed, albeit in a react-ive context, across several hotspot areas, predominantly inthe northern states (e.g. Borno, Bauchi, Yobe and Ada-mawa states) of Nigeria. Also in line with the GTFCC rec-ommendations, Nigeria is finalising its National StrategicPlan of Action on Cholera Control. Despite the aforemen-tioned efforts toward cholera prevention and control, thecholera outbreak of 2018 however reaffirms the seriouspublic health threat of cholera and, importantly, the needfor the country to adopt holistic countermeasures.
In brief, a surge in reported diarrhoea cases amongadults in Kano and Kaduna states towards the end of2017 raised a suspicion of cholera, prompting an epi-demiological investigation by a rapid response team. Theinvestigation involved using rapid diagnostic tests andmicrobiological investigations of stool samples or rectalswabs for diagnosis as per the Nigeria Centre for DiseaseControl (NCDC) guidelines [7]. Upon confirmation of V.cholerae in line with the NCDC guidelines, cholera out-break was declared on January 1, 2018. Health facilitiesat various levels of care (primary, secondary, tertiary,and specialised units such as Cholera Treatment Centres(CTCs)) in affected Local Government Areas (LGAs) re-lied on rapid diagnosis for subsequent testing of sus-pected cholera cases, but sending stool samples to theNCDC reference laboratory in Abuja for confirmatorytest. In line with the Integrated Disease Surveillance Re-sponse (IDSR) system, all the reported cholera caseswere collated and submitted by each reporting health fa-cility to the Disease Surveillance and Notification Officer(DSNO) with the aid of predefined line-lists; the datawere transmitted by the DSNO on a weekly basis to theState Epidemiologist for aggregation and further trans-mission to the Surveillance and Epidemiology Depart-ment (SED) at NCDC in Abuja, where basic statisticalanalyses and disseminations of findings to reportingstates are undertaken. The National Cholera EmergencyOperations Centre was de-escalated to a TechnicalWorking Group on November 20, 2018, but with con-tinued monitoring and support to affected states. Indeed,the 2018 cholera outbreak represents an opportunity tore-assess how well and how far Nigeria is progressing to-wards attaining global roadmap strategic goals, and toprovide current epidemiology of cholera in the country,with a view to providing the evidential-basis for a holis-tic public health planning and effective interventions.For example, identifying the most affected age groupand areas, especially in the context of emerging cholerahotspots in the country, will be useful for an efficient al-location of limited resources towards cholera preventionand control. To this end, this study describes the epi-demiology of the 2018 cholera outbreak in Nigeria interms of time, place and person.
MethodsStudy approach, period, and settingThis was a retrospective analysis of secondary surveillancedata spanning between January 1st and November 19th,2018. The 20 states affected by the outbreak and their cor-responding geopolitical zones were: Anambra and Ebonyi(south-east); Adamawa, Borno, Bauchi, Gombe and Yobe(north-east); Abuja, Kogi, Kwara, Nasarawa, Niger and Plat-eau (north-central); and Jigawa, Kaduna, Kano, Katsina,Kebbi, Sokoto and Zamfara (north-west).
Elimian et al. BMC Public Health (2019) 19:1264 Page 2 of 11

Data source and managementSecondary surveillance data in MS Excel format fromthe NCDC SED (primarily mandated for the coordin-ation of cholera outbreak surveillance and response ac-tivities in Nigeria) was exported into Stata version 15(StataCorp LP, College Station, TX, USA) for manage-ment and organisation. In line with NCDC ethical guide-lines, specifically with respect to confidentiality andanonymity, all forms of identifiers (e.g. names, addresses,and telephone numbers) were deleted prior to data man-agement. The processes for selecting the final dataset isshown in Fig. 1.
Study population, and definition of key variablesThe study population comprised individuals classified ashaving suspected cholera (herein: cholera cases) duringthe outbreak period. In accordance with the NCDCguidelines for preparedness and response to acute waterydiarrhoea outbreak [7], a cholera case was defined as thedetection of a cluster of persons aged 2 years or olderwith acute watery diarrhoea and severe dehydration ordying from acute watery diarrhoea from the same areawithin 1 week. In line with best practice in the contextof a cholera outbreak [4], however, children under theage of 2 years who met the case definition were includedin the current study as cholera cases. A confirmed chol-era was defined as a cholera case in which Vibrio cho-lerae O1 or O139 was isolated in the stool bymicrobiological investigation [7]. The definition of otherkey study variables is shown in Table 1.
Statistical analysesExploratory analysis of baseline characteristics of thestudy population was conducted using appropriate stat-istical summaries including frequency and percentagefor binary/categorical variables, and mean and standarddeviation for normally distributed continuous variables.Primary outcomes included attack rate (AR) and case fa-tality rate (CFR), and were presented with respect toother key study variables (Table 1). The standard ap-proach to the description of a disease outbreak in termsof person, place and time was then used for further ana-lyses. Similar to data management, all statistical analyseswere performed in Stata version 15, and a p-value of lessthan 0.05 was considered statistically significant.
ResultsDescription of the study populationTwenty out of 36 states (plus the federal capital city ofNigeria, Abuja) were affected by the cholera outbreak,resulting in a total of 43,996 cases and 836 deaths duringthe outbreak period. Figure 2 shows the epidemiologicalcurve for cholera cases and deaths by epidemic week. Theoutbreak was characterised by four distinct epidemicwaves and mirrored a propagated epidemic pattern, sug-gesting a person-to-person transmission. Notably, the ma-jority of cholera cases occurred in the second and fourthwaves, with a peak at week 37; there was however a pre-ponderance of cholera deaths towards the end of the thirdwave and beginning of the fourth wave, with sporadiccases of death in between the two waves. As expected, the
Fig. 1 The Selection Process of Study Records, January 1st-November 19th, 2018
Elimian et al. BMC Public Health (2019) 19:1264 Page 3 of 11

Table 1 Definition of key study variables
Variable Definition
Epidemiological week The first epidemiological week [herein: week] was defined as the week ending on the first Saturday of January 2018;subsequent weeks however began on Sunday and ended on Saturday. The current study covered week 1 to 47 out ofthe 52 weeks.
Epidemiological wave In line with 2018 epidemiological weeks and a previous study [4], an epidemiological wave (herein: wave) was defined asthe time between the commencement of a peak (first week with marked increase in the numbers of reported cases) andthe end of a peak (epidemiological week marked decrease in the number of reported cases before the next rise inreported cases). The variable was classified as a categorical: first wave (between week 1 and week 9), second wave(between week 10 and week 28), third wave (between week 29 and week 34), and fourth wave (between week 35 andweek 47).
Age Age was defined in years and presented as a categorical variable.
Season Dry season was defined as the period between week 1 and 12 and week 45 to 47, while rainy season was defined as theperiod between week 13 and 44.
Time to health seeking This was defined as the difference between the reported date of health seeking and reported date of illness onset. Itwas classified as a categorical variable: same day, 1–2 days, and more than 2 days.
Location health care wassought
This was defined as primary healthcare centre, secondary hospital, tertiary hospital, cholera treatment centre (in any ofthe aforementioned health facilities), private clinic, and home. Information for its classification was validated by theDSNOs or State Epidemiologists of each affected state.
Outbreak setting The affected LGAs were classified as rural, peri-urban or urban, using criteria of the population division of the UnitedNations which classifies an urban area as a settlement with 20,000 or more inhabitants, of which 75% or more areengaged in work other than agriculture, and a rural area as a settlement with fewer than 20,000 inhabitants whoseprimary occupation is agriculture. However, in the absence of a standard classification scheme, we classified a peri-urbanarea as a transition zone that is neither urban nor rural in the traditional sense. The provisional classifications were thenvalidated using the respective state DSNOs’ or Epidemiologists’ final classifications.
Hospitalization Hospitalization was defined as the admission of a cholera case to a formal health facility for at least one night.
Cholera death Cholera death was defined as death of an individual classified as having cholera case in line with the case definition inthe NCDC guidelines.
Attack Rate (AR) AR was defined as the ratio of cholera cases in a defined area (e.g. state) to the estimated population of that area. AR foreach reporting state was calculated using the estimated population of 2018, which was based on a 3.3% projectedgrowth rate from the 2006 national census results; the values were multiplied by 100,000 for easier interpretation ofsmall values.
Case Fatality Rate (CFR) CFR was defined as the ratio of individuals classified as cholera cases who die to all those classified as cholera cases(alive and dead). CFR was expressed in percentage (%).
Fig. 2 Reported cholera cases and deaths by epidemiological week, wk01–47, 2018
Elimian et al. BMC Public Health (2019) 19:1264 Page 4 of 11
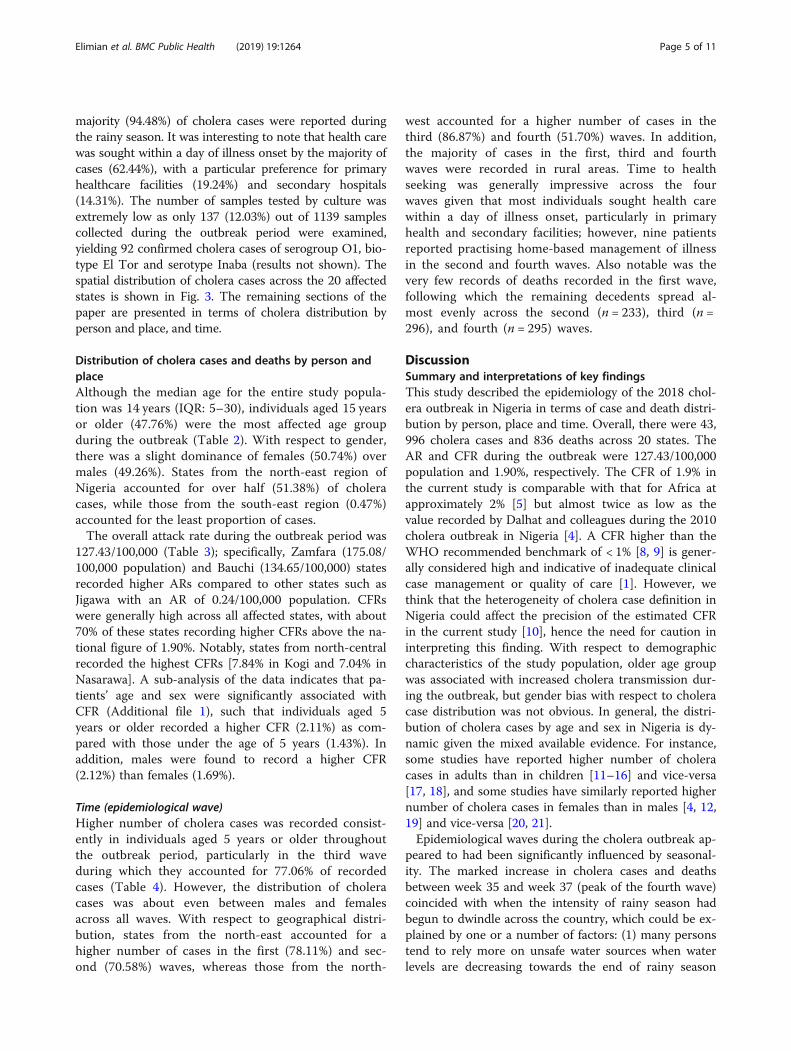
majority (94.48%) of cholera cases were reported duringthe rainy season. It was interesting to note that health carewas sought within a day of illness onset by the majority ofcases (62.44%), with a particular preference for primaryhealthcare facilities (19.24%) and secondary hospitals(14.31%). The number of samples tested by culture wasextremely low as only 137 (12.03%) out of 1139 samplescollected during the outbreak period were examined,yielding 92 confirmed cholera cases of serogroup O1, bio-type El Tor and serotype Inaba (results not shown). Thespatial distribution of cholera cases across the 20 affectedstates is shown in Fig. 3. The remaining sections of thepaper are presented in terms of cholera distribution byperson and place, and time.
Distribution of cholera cases and deaths by person andplaceAlthough the median age for the entire study popula-tion was 14 years (IQR: 5–30), individuals aged 15 yearsor older (47.76%) were the most affected age groupduring the outbreak (Table 2). With respect to gender,there was a slight dominance of females (50.74%) overmales (49.26%). States from the north-east region ofNigeria accounted for over half (51.38%) of choleracases, while those from the south-east region (0.47%)accounted for the least proportion of cases.The overall attack rate during the outbreak period was
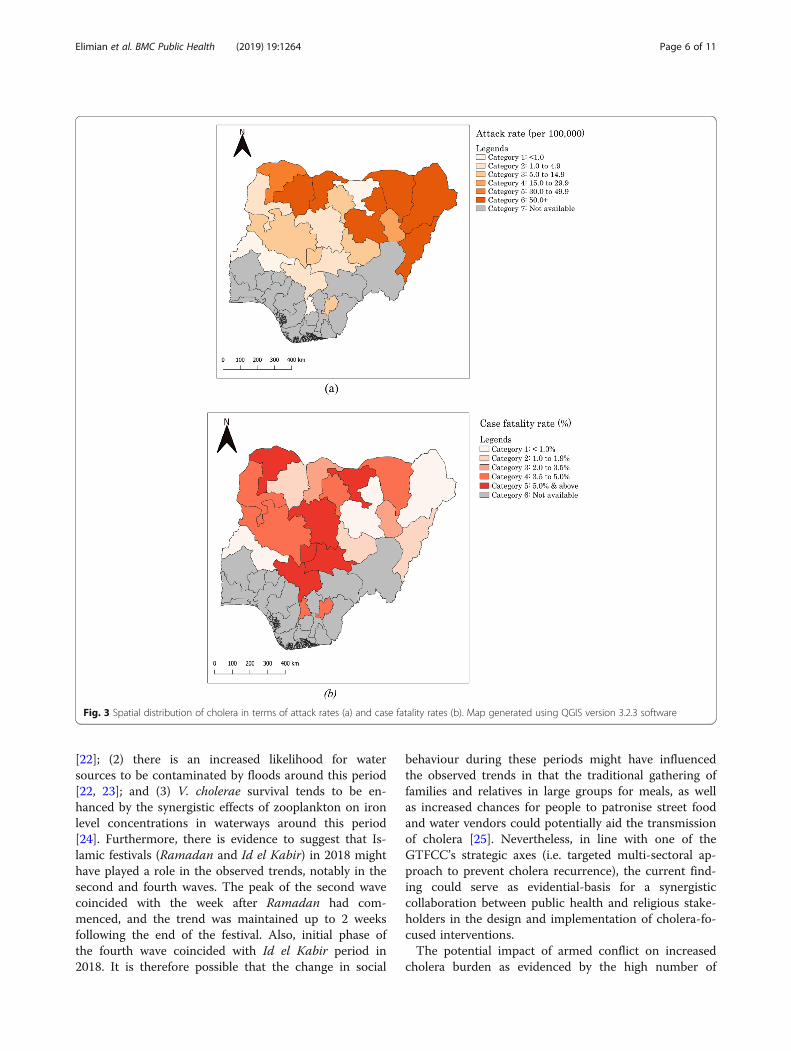
127.43/100,000 (Table 3); specifically, Zamfara (175.08/100,000 population) and Bauchi (134.65/100,000) statesrecorded higher ARs compared to other states such asJigawa with an AR of 0.24/100,000 population. CFRswere generally high across all affected states, with about70% of these states recording higher CFRs above the na-tional figure of 1.90%. Notably, states from north-centralrecorded the highest CFRs [7.84% in Kogi and 7.04% inNasarawa]. A sub-analysis of the data indicates that pa-tients’ age and sex were significantly associated withCFR (Additional file 1), such that individuals aged 5years or older recorded a higher CFR (2.11%) as com-pared with those under the age of 5 years (1.43%). Inaddition, males were found to record a higher CFR(2.12%) than females (1.69%).
Time (epidemiological wave)Higher number of cholera cases was recorded consist-ently in individuals aged 5 years or older throughoutthe outbreak period, particularly in the third waveduring which they accounted for 77.06% of recordedcases (Table 4). However, the distribution of choleracases was about even between males and femalesacross all waves. With respect to geographical distri-bution, states from the north-east accounted for ahigher number of cases in the first (78.11%) and sec-ond (70.58%) waves, whereas those from the north-
west accounted for a higher number of cases in thethird (86.87%) and fourth (51.70%) waves. In addition,the majority of cases in the first, third and fourthwaves were recorded in rural areas. Time to healthseeking was generally impressive across the fourwaves given that most individuals sought health carewithin a day of illness onset, particularly in primaryhealth and secondary facilities; however, nine patientsreported practising home-based management of illnessin the second and fourth waves. Also notable was thevery few records of deaths recorded in the first wave,following which the remaining decedents spread al-most evenly across the second (n = 233), third (n =296), and fourth (n = 295) waves.
DiscussionSummary and interpretations of key findingsThis study described the epidemiology of the 2018 chol-era outbreak in Nigeria in terms of case and death distri-bution by person, place and time. Overall, there were 43,996 cholera cases and 836 deaths across 20 states. TheAR and CFR during the outbreak were 127.43/100,000population and 1.90%, respectively. The CFR of 1.9% inthe current study is comparable with that for Africa atapproximately 2% [5] but almost twice as low as thevalue recorded by Dalhat and colleagues during the 2010cholera outbreak in Nigeria [4]. A CFR higher than theWHO recommended benchmark of < 1% [8, 9] is gener-ally considered high and indicative of inadequate clinicalcase management or quality of care [1]. However, wethink that the heterogeneity of cholera case definition inNigeria could affect the precision of the estimated CFRin the current study [10], hence the need for caution ininterpreting this finding. With respect to demographiccharacteristics of the study population, older age groupwas associated with increased cholera transmission dur-ing the outbreak, but gender bias with respect to choleracase distribution was not obvious. In general, the distri-bution of cholera cases by age and sex in Nigeria is dy-namic given the mixed available evidence. For instance,some studies have reported higher number of choleracases in adults than in children [11–16] and vice-versa[17, 18], and some studies have similarly reported highernumber of cholera cases in females than in males [4, 12,19] and vice-versa [20, 21].Epidemiological waves during the cholera outbreak ap-
peared to had been significantly influenced by seasonal-ity. The marked increase in cholera cases and deathsbetween week 35 and week 37 (peak of the fourth wave)coincided with when the intensity of rainy season hadbegun to dwindle across the country, which could be ex-plained by one or a number of factors: (1) many personstend to rely more on unsafe water sources when waterlevels are decreasing towards the end of rainy season
Elimian et al. BMC Public Health (2019) 19:1264 Page 5 of 11
[22]; (2) there is an increased likelihood for watersources to be contaminated by floods around this period[22, 23]; and (3) V. cholerae survival tends to be en-hanced by the synergistic effects of zooplankton on ironlevel concentrations in waterways around this period[24]. Furthermore, there is evidence to suggest that Is-lamic festivals (Ramadan and Id el Kabir) in 2018 mighthave played a role in the observed trends, notably in thesecond and fourth waves. The peak of the second wavecoincided with the week after Ramadan had com-menced, and the trend was maintained up to 2 weeksfollowing the end of the festival. Also, initial phase ofthe fourth wave coincided with Id el Kabir period in2018. It is therefore possible that the change in social
behaviour during these periods might have influencedthe observed trends in that the traditional gathering offamilies and relatives in large groups for meals, as wellas increased chances for people to patronise street foodand water vendors could potentially aid the transmissionof cholera [25]. Nevertheless, in line with one of theGTFCC’s strategic axes (i.e. targeted multi-sectoral ap-proach to prevent cholera recurrence), the current find-ing could serve as evidential-basis for a synergisticcollaboration between public health and religious stake-holders in the design and implementation of cholera-fo-cused interventions.The potential impact of armed conflict on increased
cholera burden as evidenced by the high number of
Fig. 3 Spatial distribution of cholera in terms of attack rates (a) and case fatality rates (b). Map generated using QGIS version 3.2.3 software
Elimian et al. BMC Public Health (2019) 19:1264 Page 6 of 11

cases in states from the north-east region of Nigeria isworth discussing. When water sources and waste man-agement system are disrupted, as they have been duringBoko-Haram insurgency activities in this region, thetransmission of cholera is likely. This hypothesis is sup-ported by studies in Yemen [26] and Liberia [27]. Inaddition, the high number of cholera cases in Bauchi(21.38%) in comparison to states directly affected byBoko Haram insurgency (e.g. 17.33% in Borno) could beexplained by a ‘spill-over’ effect of armed conflict. Therapid influx of internally displaced persons from statesdirectly affected by conflict to neighbouring states suchas Bauchi could also create an enabling environment(e.g. inadequate or contaminated water sources, poorsanitation facilities, overcrowding, and limited capacityfor healthcare delivery by health workers) for choleratransmission. This hypothesis is in line with the findingsby Siddique and colleagues wherein poor living conditionsof Rwandan refugees in Goma, Zaire, significantly in-creased cholera transmission [28]. Again, these findings
Table 2 Baseline characteristics of cases during the 2018cholera outbreak in Nigeria (N = 43,996)
Baseline characteristic Frequency (%)
Sociodemographic characteristic
Sex
Female 22,322 (50.74)
Male 21,674 (49.26)
Median (IQR) age, yearsa 14 (5–30)
Age, years
< 2 2602 (5.91)
2–4 7651 (17.39)
5–10 8068 (18.34)
10–14 3300 (7.50)
> 15 21,014 (47.76)
Missing 1361 (3.09)
Geopolitical zone
South-east 205 (0.47)
North-central 1335 (3.03)
North-west 19,850 (45.12)
North-east 22,606 (51.38)
Epidemiological wave
First wave (week 1–9 of 2018) 1119 (2.54)
Second wave (week 10–28 of 2018) 17,528 (39.84)
Third wave (week 29–34 of 2018) 7454 (16.94)
Fourth wave (week 35–47 of 2018) 17,895 (40.67)
Season
Dry 2427 (5.52)
Rainy 41,569 (94.48)
Outbreak setting
Rural 15,501 (35.23)
Peri-urban 5941 (13.50)
Urban 22,077 (50.18)
Missing 477 (1.08)
Clinical characteristic
Time to healthcare seeking
Same day 27,470 (62.44)
1–2 days 10,159 (23.09)
> 2 days 1695 (3.85)
Missing 4672 (10.62)
Location healthcare was sought
Primary healthcare centre 8464 (19.24)
Secondary hospital 6294 (14.31)
Tertiary hospital 58 (0.13)
Private clinic 143 (0.33)
Cholera treatment centre (including IDP camps) 730 (1.66)
Home 9 (0.02)
Table 2 Baseline characteristics of cases during the 2018cholera outbreak in Nigeria (N = 43,996) (Continued)
Baseline characteristic Frequency (%)
Missing 28,298 (64.32)
Hospitalisation
No 6096 (13.86)
Yes 20,224 (45.97)
Missing 17,676 (40.18)
Stool sample collected for microbial test
No 21,597 (49.09)
Yes 1139 (2.59)
Missing 21,260 (48.32)
Stool sample tested for V. cholerae
No 42,928 (97.57)
Yes 1068 (2.43)
Rapid diagnostic test outcome
Negative 205 (0.47)
Positive 888 (2.02)
Pending 3 (0.01)
Unknown 42,900 (97.51)
Culture outcome
Negative 41 (0.09)
Positive 92 (0.21)
Pending 4 (0.01)
Unknown 43,859 (99.69)
Clinical outcome
Alive 43,160 (98.10)
Died 836 (1.90)aIQR Interquartile range
Elimian et al. BMC Public Health (2019) 19:1264 Page 7 of 11
are suggestive of the need to extend cholera stakeholdersbeyond the traditional public health actors. This would in-volve actively engaging the security agency such as the Ni-gerian military in planning, training and implementingcholera-focused interventions, particularly given the factthat security personnel are usually among the first re-sponders to such contexts. The feasibility of such collabor-ation is worth exploring in a follow-up study. Flooding in2018 appeared to have aided cholera transmission and as-sociated CFRs, particularly in Anambra, Kogi and Nigerstates. Flooding generally disrupts access to essential com-modities including safe water sources and health care de-livery, thereby exacerbating the occurrence of cholera andadverse clinical outcomes such as deaths [29]. The poten-tial impact of flooding on cholera deaths in Nigeria is not anew phenomenon as underlined in the 2010 outbreak [4].The public health implications of Inaba serotype dom-
inance in the 2018 outbreak is also worth mentioninggiven the dominance by Ogawa serotype for long periodin Nigeria. For instance, the Ogawa serotype of V. cho-lerae was in circulation during the 2010 cholera inNigeria as evidenced by the molecular characterisationof samples from Borno, Bauchi and Gombe states [30].Unlike the Ogawa serotype which appears to have estab-lished its niche in diverse contexts across Nigeria, the
Inaba serotype appears to be localised in northernNigeria such as Kano, Bauchi and Plateau states [31–33].This could potentially explain why the 2018 cholera ap-peared to have originated from communities in Kanostate; and why there were more cholera cases in adultsthan in children under the age of 5 years in the currentstudy as evidenced by a study conducted in Bangladesh[34], albeit further evidence is required for a thoroughexplanation. Nevertheless, in the absence of a concreteevidence as to how and why V. cholerae serotypeschange, the dominance of Inaba serotype in the 2018outbreak could be attributable to ‘natural conversion aspart of survival mechanism [34, 35]. Also, we do notthink the severity of the 2018 cholera outbreak com-pared with previous years is related to the dominance ofInaba serotype as the two serotypes are similar patho-genicity [36, 37].
Study strengths and limitationsThe current study has the advantage of using a morerepresentative data than similar studies in Nigeria, as allthe 20 affected states were captured in the analyses. Indescribing the epidemiology of the 2010 cholera out-break in Nigeria, for example, Dalhat and colleagues uti-lised data from only 10 out of the 18 affected states that
Table 3 Distribution of cholera attack rates and case fatality rates by state, Nigeria, 2018
State Projected 2018 population Cases Deaths Attack rate/100,000 population CFR (%)
Adamawa 4,464,609.877 2748 41 61.55 1.50
Anambra 5,825,118.003 23 1 0.40 4.35
Bauchi 6,984,963.699 9405 35 134.65 0.37
Borno 6,200,395.472 7626 74 123.00 0.97
Ebonyi 3,027,451.68 182 7 6.01 3.85
FCTa 4,084,890.258 221 14 5.41 6.33
Gombe 3,435,108.839 552 18 16.07 3.26
Jigawa 6,128,283.561 15 1 0.24 6.67
Kaduna 8,649,466.817 401 25 4.64 6.23
Kano 13,854,062.42 1905 73 13.75 3.83
Katsina 8,258,831.146 7400 190 89.60 2.57
Kebbi 4,671,593.545 198 7 4.24 3.54
Kogi 4,674,338.533 102 8 2.18 7.84
Kwara 3,380,605.955 10 0 0.30 0.00
Nasarawa 2,656,584.616 71 5 2.67 7.04
Niger 5,900,257.11 584 29 9.90 4.97
Plateau 4,376,193.378 347 6 7.93 1.73
Sokoto 5,271,036.573 1602 84 30.40 5.24
Yobe 3,508,083.395 2275 83 64.85 3.65
Zamfara 4,757,222.358 8329 135 175.08 1.62
Total 34,524,321.92 43,996 836 127.43 1.90a Federal Capital Territory of Nigeria (Abuja)
Elimian et al. BMC Public Health (2019) 19:1264 Page 8 of 11
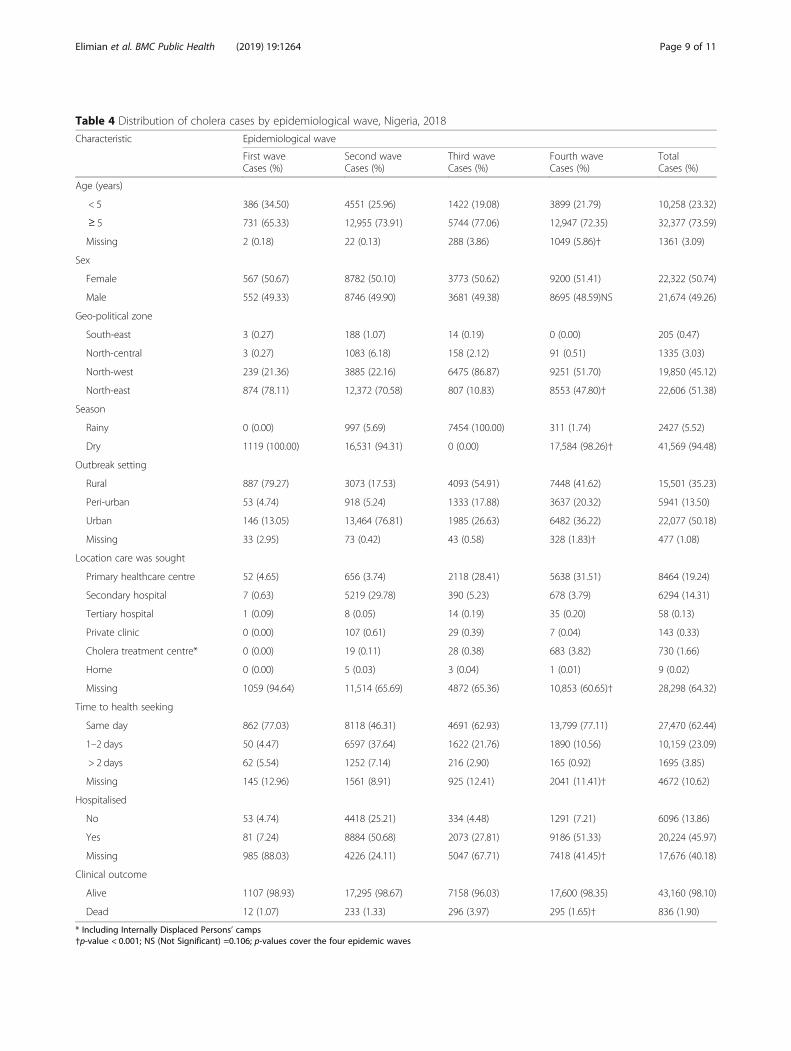
Table 4 Distribution of cholera cases by epidemiological wave, Nigeria, 2018
Characteristic Epidemiological wave
First waveCases (%)
Second waveCases (%)
Third waveCases (%)
Fourth waveCases (%)
TotalCases (%)
Age (years)
< 5 386 (34.50) 4551 (25.96) 1422 (19.08) 3899 (21.79) 10,258 (23.32)
≥ 5 731 (65.33) 12,955 (73.91) 5744 (77.06) 12,947 (72.35) 32,377 (73.59)
Missing 2 (0.18) 22 (0.13) 288 (3.86) 1049 (5.86)† 1361 (3.09)
Sex
Female 567 (50.67) 8782 (50.10) 3773 (50.62) 9200 (51.41) 22,322 (50.74)
Male 552 (49.33) 8746 (49.90) 3681 (49.38) 8695 (48.59)NS 21,674 (49.26)
Geo-political zone
South-east 3 (0.27) 188 (1.07) 14 (0.19) 0 (0.00) 205 (0.47)
North-central 3 (0.27) 1083 (6.18) 158 (2.12) 91 (0.51) 1335 (3.03)
North-west 239 (21.36) 3885 (22.16) 6475 (86.87) 9251 (51.70) 19,850 (45.12)
North-east 874 (78.11) 12,372 (70.58) 807 (10.83) 8553 (47.80)† 22,606 (51.38)
Season
Rainy 0 (0.00) 997 (5.69) 7454 (100.00) 311 (1.74) 2427 (5.52)
Dry 1119 (100.00) 16,531 (94.31) 0 (0.00) 17,584 (98.26)† 41,569 (94.48)
Outbreak setting
Rural 887 (79.27) 3073 (17.53) 4093 (54.91) 7448 (41.62) 15,501 (35.23)
Peri-urban 53 (4.74) 918 (5.24) 1333 (17.88) 3637 (20.32) 5941 (13.50)
Urban 146 (13.05) 13,464 (76.81) 1985 (26.63) 6482 (36.22) 22,077 (50.18)
Missing 33 (2.95) 73 (0.42) 43 (0.58) 328 (1.83)† 477 (1.08)
Location care was sought
Primary healthcare centre 52 (4.65) 656 (3.74) 2118 (28.41) 5638 (31.51) 8464 (19.24)
Secondary hospital 7 (0.63) 5219 (29.78) 390 (5.23) 678 (3.79) 6294 (14.31)
Tertiary hospital 1 (0.09) 8 (0.05) 14 (0.19) 35 (0.20) 58 (0.13)
Private clinic 0 (0.00) 107 (0.61) 29 (0.39) 7 (0.04) 143 (0.33)
Cholera treatment centre* 0 (0.00) 19 (0.11) 28 (0.38) 683 (3.82) 730 (1.66)
Home 0 (0.00) 5 (0.03) 3 (0.04) 1 (0.01) 9 (0.02)
Missing 1059 (94.64) 11,514 (65.69) 4872 (65.36) 10,853 (60.65)† 28,298 (64.32)
Time to health seeking
Same day 862 (77.03) 8118 (46.31) 4691 (62.93) 13,799 (77.11) 27,470 (62.44)
1–2 days 50 (4.47) 6597 (37.64) 1622 (21.76) 1890 (10.56) 10,159 (23.09)
> 2 days 62 (5.54) 1252 (7.14) 216 (2.90) 165 (0.92) 1695 (3.85)
Missing 145 (12.96) 1561 (8.91) 925 (12.41) 2041 (11.41)† 4672 (10.62)
Hospitalised
No 53 (4.74) 4418 (25.21) 334 (4.48) 1291 (7.21) 6096 (13.86)
Yes 81 (7.24) 8884 (50.68) 2073 (27.81) 9186 (51.33) 20,224 (45.97)
Missing 985 (88.03) 4226 (24.11) 5047 (67.71) 7418 (41.45)† 17,676 (40.18)
Clinical outcome
Alive 1107 (98.93) 17,295 (98.67) 7158 (96.03) 17,600 (98.35) 43,160 (98.10)
Dead 12 (1.07) 233 (1.33) 296 (3.97) 295 (1.65)† 836 (1.90)
* Including Internally Displaced Persons’ camps†p-value < 0.001; NS (Not Significant) =0.106; p-values cover the four epidemic waves
Elimian et al. BMC Public Health (2019) 19:1264 Page 9 of 11

submitted surveillance data to the ministry of health [4].Given the current nature and scope of our study, thefindings will be useful in developing prevention and con-trol measures towards attaining the global roadmap stra-tegic goals. Scientifically, the findings will also be usefulto public health researchers in assessing the impact ofinterventions such as OCV campaigns. Our study how-ever has a number of potential limitations worth men-tioning. The definition of a cholera case [7] is at variancewith the WHO’s definition with respect to age – our def-inition uses 2 years as the benchmark while that of WHOuses 5 years, albeit children under five meeting the casedefinition for cholera in endemic areas are considered sus-pected cases in both definitions [38]. Pathogens other thanV. cholerae could be responsible for cholera-like symp-toms [39], which could potentially affect the precision ofour findings as children under-5 years were included inthe definition of suspected cholera cases in the currentstudy. The lack of a homogenous definition of cholera es-pecially in an endemic setting such as Nigeria made thedirect comparison of our findings with similar studieschallenging. For example, studies in Nigeria have used 5years [12, 17, 40], 2 years [21, 41, 42], and no age restric-tions [14, 19] for the definition of suspected cholera cases.Thus, this challenge should be prioritised by the GTFCCgiven the relevance to cholera case management and as-sessment of cholera burden, which would be strategic inthe objective assessment of the global roadmap goals ofcholera elimination by 2030.
ConclusionThe severity and wide-geographical distribution of choleracases and deaths during the 2018 outbreak are indicativeof an elevated burden, which was more notable in thenorthern region of the country. Overall, the current distri-bution of cholera cases and cholera-related deaths by per-son, place and time reaffirms the strategic role of a multi-sectoral approach in the design and implementation ofpublic health interventions aimed at preventing and con-trolling cholera in Nigeria.
Additional file
Additional file 1: Table showing the age and sex distribution of casefatality rates among cholera cases, Nigeria, 2018. (DOCX 12 kb)
AbbreviationsAR: Stands for Attack Rate; CFR: Stands for Case Fatality Rate; DSNO: Standsfor Disease Surveillance and Notification Officer; GTFCC: Stands for GlobalTask Force on Cholera Control; LGA: Stands for Local Government Area;NCDC: Stands for Nigeria Centre for Disease Control; SED: Stands forSurveillance and Epidemiology Department
AcknowledgmentsWe wish to thank the NCDC and WHO staff, especially those in the choleraTechnical Working Group; the State Epidemiologists and Disease Notification
and Surveillance Officers who coordinated the collection of data used forthis study.
Authors’ contributionsKOE contributed to the conceptualization, literature search, datamanagement, data analysis, writing and formatting of paper; AM contributedto literature search, data management, generation of spatial map, dataanalysis, and writing (original draft, review and editing); SM contributed todata management, data analysis, and writing (review and editing) of paper;OO was involved in the conceptualisation and writing (original draft, reviewand editing) of paper; SY was involved in the conceptualisation, dataacquisition and writing (review and editing) of paper; AY contributed to theconceptualisation and writing (original draft, review and editing) ofmanuscript; NW contributed to the conceptualisation, data acquisition andwriting (review and editing) of paper; AO contributed to theconceptualisation, data acquisition and writing (review and editing) of paper;ISF contributed to the conceptualisation, writing (review and editing), andfunding acquisition; MY contributed to the conceptualisation, writing(editing), and funding acquisition; WE contributed to the conceptualisation,data acquisition and writing (review) of paper; PA contributed to theconceptualisation, data acquisition and writing (review) of paper; MPcontributed to the conceptualisation, data acquisition and writing (reviewand editing); MC contributed to data acquisition, data management, dataanalysis, and writing (review) of paper; LHO contributed to theconceptualisation, data acquisition and writing (review) of paper; EEcontributed to the conceptualisation, data acquisition and writing (reviewand editing) of paper; TB contributed to data acquisition and writing (reviewand editing) of paper; IM contributed to the conceptualisation, software, andwriting (review and editing) of paper; AA contributed to theconceptualisation, software, and writing (review and editing) of paper; GNcontributed to data acquisition, project administration, and writing (reviewand editing) of paper; IO contributed to data acquisition, projectadministration, and writing (review and editing) of paper; WA contributed tothe conceptualization, supervision, and writing (review and editing) of paper;CP contributed to the conceptualization, supervision, writing (review andediting), funding acquisition, and project administration; CI contributed tothe conceptualization, supervision, writing (review and editing), fundingacquisition, and project administration. All authors read and approved thefinal manuscript.
FundingThe corresponding author, Kelly Osezele Elimian, was paid a consultancy feeby the World Health Organization. However, the World Health Organizationneither played a role in the design of the study, collection, analysis, andinterpretation of data nor in writing the manuscript.
Availability of data and materialsThe datasets used for this study are available from the corresponding authorupon reasonable request.
Ethics approval and consent to participateThe protocol for this study was reviewed and approved by the FederalCapital Territory (FCT, Nigeria) Health Research Ethics Committee (FCT HREC)(Approval Number: FHREC/2019/01/05/21–01-19).
Consent for publicationNot applicable.
Competing interestsThe authors declare that they have no competing interests.
Author details1Nigeria Centre for Disease Control, Abuja, Nigeria. 2University of Benin,Benin City, Edo State, Nigeria. 3University College London, London, UK.4World Health Organization/ Regional Office for Africa, Brazzaville,Democratic Republic of Congo. 5World Health Organization/ Nigeria, Abuja,Nigeria. 6eHealth Africa, Abuja, Nigeria.
Elimian et al. BMC Public Health (2019) 19:1264 Page 10 of 11

Received: 8 July 2019 Accepted: 28 August 2019
References1. Clemens JD, Nair GB, Ahmed T, et al. Cholera. Lancet. 2017;390:1539–49.2. Microbiology Society. Factfile: cholera: death by Diarrhoea., 2016.3. Ali M, Nelson AR, Lopez AL, et al. Updated global burden of cholera in
endemic countries. PLoS Negl Trop Dis. 2015;9:e0003832.4. Dalhat MM, Isa AN, Nguku P, et al. Descriptive characterization of the 2010
cholera outbreak in Nigeria. BMC Public Health. 2014;14:1167.5. Mengel M, Delrieu I, Heyerdahl L, et al. Cholera outbreaks in Africa. Curr Top
Microbiol Immunol. 2014;379:117–44.6. Global Task Force on Cholera Control. Ending Cholera: A Global Roadmap
to 2030. Annecy; 2017.7. Nigeria Centre for Disease Control. Preparedness and response to acute
watery Diarrhoea outbreaks: a guide for health workers and authorities inNigeria. Abuja: Nigeria Centre for Disease Control; 2017.
8. World health organization. Cholera case fatality rate: situations and trends.Geneva: WHO; 2017.
9. World Health Organization. Cholera case fatality ratio (%). Geneva: WHO;2011.
10. Sack D. How valid is a case fatality rate (CFR) when monitoring choleracare? Stop Cholera 2017.
11. Umoh JU, Adesiyun AA, Adekeye JO, et al. Epidemiological features of anoutbreak of gastroenteritis/cholera in Katsina, northern Nigeria. J Hyg(Lond). 1983;91:101–11.
12. Ibrahim BS, Mohammed Y, Usman R, et al. Outbreak of cholera atDutsen-Abba Ward Zaria local government area, Kaduna state Nigeria2015: the importance of hygienic practices. Int J Community MedPublic Health. 2017;4:1473.
13. Shittu OB, Akpan I, Popoola TOS, et al. Epidemiological features of a GIS-supported investigation of cholera outbreak in Abeokuta, Nigeria. J PublicHealth Epidemiol. 2010;2:152–62.
14. Ishaku A, Shadrack B, Ajumobi O, et al. Investigation of cholera outbreak inan urban north central Nigerian community-the Akwanga experience.Public Health Res. 2014;4:7–12.
15. Falade A, Lawoyin T. News from the regions - newsletter from Nigeria.Features of the 1996 cholera epidemic among Nigerian children in Ibadan,Nigeria. J Trop Pediatr. 1999;45:59–62.
16. Sule IB, Yahaya M, Aisha AA, et al. Descriptive epidemiology of a choleraoutbreak in Kaduna state, Northwest Nigeria, 2014. Pan Afr Med J. 2017;27:172.
17. Fatiregun AA, Isere EE, Ayede AI, et al. Epidemiology of an outbreak ofcholera in a south-west state of Nigeria: brief report. South African JEpidemiol Infect. 2012;27:201–4.
18. Utsalo SJ, Eko FO, Antia-Obong EO. Features of cholera and Vibrio parahaemolyticusdiarrhoea endemicity in Calabar, Nigeria. Eur J Epidemiol. 1992;8:856–60.
19. Hutin Y, Luby S, Paquet C. A large cholera outbreak in Kano City, Nigeria:the importance of hand washing with soap and the danger of street-vended water. J Water Health. 2003;1:45–52.
20. Schram R. The 1971 cholera epidemic in Zaria, Nigeria. Savanna A J EnvironSoc Sci. 1972;1:213–22.
21. Nnaji RN, Ajumobi O, bala U, et al. Cholera outbreak investigation, Gajalacommunity, Birnin kudu local government area (LGA), Jigawa state, Nigeria,September 2015. Int J Infect Dis. 2016;45:144–5.
22. Ruiz-Moreno D, Pascual M, Bouma M, et al. Cholera seasonality in Madras(1901–1940): dual role for rainfall in endemic and epidemic regions.Ecohealth. 2007;4:52–62.
23. Hashizume M, Faruque ASG, Wagatsuma Y, et al. Cholera in Bangladesh.Epidemiology. 2010;21:706–10.
24. Faruque SM, Naser IB, Islam MJ, et al. Seasonal epidemics of cholerainversely correlate with the prevalence of environmental cholera phages.Proc Natl Acad Sci. 2005;102:1702–7.
25. Camacho A, Bouhenia M, Alyusfi R, et al. Cholera epidemic in Yemen, 2016-18: an analysis of surveillance data. Lancet Glob Health. 2018;6:e680–90.
26. Dureab F, Shibib K, Al-Yousufi R, et al. Yemen: cholera outbreak and theongoing armed conflict. J Infect Dev Ctries. 2018;12:397–403.
27. Centers for Disease Control and Prevention. Cholera epidemic afterincreased civil conflict -Monrovia, Liberia. MMWr. 2003;52(45);1093-5.
28. Siddique AK, Salam A, Islam MS, et al. Why treatment centres failed toprevent cholera deaths among Rwandan refugees in Goma, Zaire. Lancet(London, England). 1995;345:359–61.
29. Sur D, Dutta P, Nair GB, et al. Severe cholera outbreak following floods in anorthern district of West Bengal. Indian J Med Res. 2000;112:178–82.
30. Oyedeji KS, Niemogha M-T, Nwaokorie FO, et al. Molecular characterizationof the circulating strains of Vibrio cholerae during 2010 cholera outbreak inNigeria. J Health Popul Nutr. 2013;31:178–84.
31. Adewale AK, Pazhani GP, Abiodun IB, et al. Unique clones of Vibrio choleraeO1 El Tor with Haitian type ctxB allele implicated in the recent choleraepidemics from Nigeria, Africa. Kirk M (ed.). PLoS One. 2016;11:e0159794.
32. Usman A, Sarkinfada F, Mufunda J, et al. Recurrent cholera epidemics inKano-northern Nigeria. Cent Afr J Med. 2005;51:34–8.
33. Opajobi S, Kandakai-Olukemi Y, Mawak J, et al. Vibrio Cholerae 01 infectionsin Jos, Nigeria. African J Clin Exp Microbiol. 2004;5:260–4.
34. Khan AI, Chowdhury F, Harris JB, et al. Comparison of clinical features andimmunological parameters of patients with dehydrating diarrhoea infectedwith Inaba or Ogawa serotypes of Vibrio cholerae O1. Scand J Infect Dis.2010;42:48–56.
35. Alam M, Ray S, Chun C, et al. Major shift of toxigenic V. cholerae O1 fromOgawa to Inaba serotype isolated from clinical and environmental samplesin Haiti. Vinetz JM (ed.). PLoS Negl Trop Dis. 2016;10:e0005045.
36. Woodward WE. Cholera reinfection in man. J Infect Dis. 1971;123:61–6.37. Benenson AS, Mosley WH, Fahimuddin M, et al. Cholera vaccine field trials
in East Pakistan. 2. Effectiveness in the field. Bull World Health Organ. 1968;38:359–72.
38. World Health Organization. Cholera outbreak: assessing the outbreakresponse and improving preparedness, vol. 2004. Geneva.
39. World Health Organization. The treatment of Diarrhoea: a manual forphysicians and other senior health workers, vol. 2005. Geneva.
40. Kolo P, Jibrin Y, Sanya E, et al. Outcome of cholera admissions in Bauchi,Nigeria. South African J Epidemiol Infect. 2013;28:143–6.
41. Gidado S, Awosanya E, Haladu S, et al. Cholera outbreak in a naïve ruralcommunity in northern Nigeria: the importance of hand washing with soap,September 2010. Pan Afr Med J. 2018;30. https://doi.org/10.11604/pamj.2018.30.5.12768.
42. Abubakar AT, Dalhat M, Nguku P. Cholera outbreak - IDP camps inMaiduguri, northern Nigeria, September 2015. Int J Infect Dis. 2016;45:132.
Publisher’s NoteSpringer Nature remains neutral with regard to jurisdictional claims inpublished maps and institutional affiliations.
Elimian et al. BMC Public Health (2019) 19:1264 Page 11 of 11
Related Documents