Describing and Measuring Emotional Response to Shopping Experience Karen A. Machleit UNIVERSITY OF CINCINNATI Sevgin A. Eroglu GEORGIA STATE UNIVERSITY Research has shown that shopping environments can evoke emotional Shoppers come to stores with specific goals and constraints (e.g., a specific item to be found, recreation needs, the presence responses in consumers and that such emotions, in turn, influence shopping behaviors and outcomes. This article broadens our understanding of emo- of time pressure, a budget limit), and affective reactions occur as they work toward meeting such goals. Specifically, past tions within the shopping context in two ways. First, it provides a descrip- tive account of emotions consumers feel across a variety of shopping research has shown that store atmospherics can evoke emo- tional responses in shoppers (Donovan and Rossiter, 1982; environments. Second, it empirically compares the three emotion measures most frequently used in marketing to determine which best captures the Darden and Babin, 1994; Hui, Dube, and Chebat, 1997; Sher- man, Mathur, and Smith, 1997). various emotions shoppers experience. The results indicate that the broad range of emotions felt in the shopping context vary considerably across In retail settings, design elements are construed to provide consumers a satisfying shopping experience and to project a different retail environments. They also show that the Izard (Izard, C. E.: Human Emotions, Plenum, New York. 1977) and Plutchik (Plutchik, R.: favorable store image. By manipulating all the available ambi- ent factors, retailers strive to induce certain desirable emotions Emotion: A Psychoevolutionary Synthesis, Harper and Row, New York. 1980) measures outperform the Mehrabian and Russell (Mehrabian, A., in their patrons while trying to minimize negative affective responses that may arise from undesirable conditions, such as and Russell, J. A.: An Approach to Environmental Psychology, MIT Press, Cambridge, MA. 1974) measure by offering a richer assessment of emo- crowding, excessive noise, or unpleasant odors. Furthermore, store design can be constructed to minimize unpleasant emo- tional responses to the shopping experience. J BUSN RES 2000. 49.101– 111. 2000 Elsevier Science Inc. All rights reserved. tional responses, such as those that may arise due to shoppers’ perceptions of being crowded (Eroglu and Harrell, 1986). Upon entering a shopping environment, consumers might experience a vast array of emotions ranging from, for example, T he notion that people have emotional responses to excitement, joy, interest, and pleasure to anger, surprise, frus- tration, or arousal. Knowledge of the specific feelings pro- their immediate environment is widely accepted in psychology. Researchers from different fields and van- duced by manipulations in the retail environment can lead to a greater understanding of the role emotions play in influ- tage points agree that the first response level to any environ- ment is affective, and that this emotional impact generally encing shopping behaviors and outcomes. But what types of emotional responses do individuals have during the shopping guides the subsequent relations within the environment (Ittel- son, 1973). experience? And how should these emotions be measured? These are the questions that guide the present study. The pervasive influence of emotional response has been long recognized by marketing researchers in various contexts, such as advertising, product consumption, and shopping Measures of Emotion (Holbrook, Chestnut, Oliva, and Greenleaf, 1984; Batra and Ray, 1986; Westbrook, 1987; Batra and Holbrook, 1990; Co- The English language provides hundreds of words for describ- hen, 1990). A shopping episode is a situation in which individ- ing emotions. In environmental psychology, researchers have uals would be particularly likely to have emotional responses. studied how to most efficiently describe the emotional experi- ence and have tried to provide better descriptors to assess emotional responses to places and experiences therein (Russell Address correspondence to Karen Machleit, P.O. Box 210145, University of Cincinnati, Cincinnati, OH 45221-0145. and Pratt, 1980). In the marketing discipline, measures from Journal of Business Research 49, 101–111 (2000) 2000 Elsevier Science Inc. All rights reserved. ISSN 0148-2963/00/$–see front matter 655 Avenue of the Americas, New York, NY 10010 PII S0148-2963(99)00007-7

Welcome message from author
This document is posted to help you gain knowledge. Please leave a comment to let me know what you think about it! Share it to your friends and learn new things together.
Transcript

Describing and Measuring EmotionalResponse to Shopping ExperienceKaren A. MachleitUNIVERSITY OF CINCINNATI
Sevgin A. ErogluGEORGIA STATE UNIVERSITY
Research has shown that shopping environments can evoke emotional Shoppers come to stores with specific goals and constraints(e.g., a specific item to be found, recreation needs, the presenceresponses in consumers and that such emotions, in turn, influence shopping
behaviors and outcomes. This article broadens our understanding of emo- of time pressure, a budget limit), and affective reactions occuras they work toward meeting such goals. Specifically, pasttions within the shopping context in two ways. First, it provides a descrip-
tive account of emotions consumers feel across a variety of shopping research has shown that store atmospherics can evoke emo-tional responses in shoppers (Donovan and Rossiter, 1982;environments. Second, it empirically compares the three emotion measures
most frequently used in marketing to determine which best captures the Darden and Babin, 1994; Hui, Dube, and Chebat, 1997; Sher-man, Mathur, and Smith, 1997).various emotions shoppers experience. The results indicate that the broad
range of emotions felt in the shopping context vary considerably across In retail settings, design elements are construed to provideconsumers a satisfying shopping experience and to project adifferent retail environments. They also show that the Izard (Izard, C. E.:
Human Emotions, Plenum, New York. 1977) and Plutchik (Plutchik, R.: favorable store image. By manipulating all the available ambi-ent factors, retailers strive to induce certain desirable emotionsEmotion: A Psychoevolutionary Synthesis, Harper and Row, New York.
1980) measures outperform the Mehrabian and Russell (Mehrabian, A., in their patrons while trying to minimize negative affectiveresponses that may arise from undesirable conditions, such asand Russell, J. A.: An Approach to Environmental Psychology, MIT Press,
Cambridge, MA. 1974) measure by offering a richer assessment of emo- crowding, excessive noise, or unpleasant odors. Furthermore,store design can be constructed to minimize unpleasant emo-tional responses to the shopping experience. J BUSN RES 2000. 49.101–
111. 2000 Elsevier Science Inc. All rights reserved. tional responses, such as those that may arise due to shoppers’perceptions of being crowded (Eroglu and Harrell, 1986).Upon entering a shopping environment, consumers mightexperience a vast array of emotions ranging from, for example,
The notion that people have emotional responses to excitement, joy, interest, and pleasure to anger, surprise, frus-tration, or arousal. Knowledge of the specific feelings pro-their immediate environment is widely accepted in
psychology. Researchers from different fields and van- duced by manipulations in the retail environment can leadto a greater understanding of the role emotions play in influ-tage points agree that the first response level to any environ-
ment is affective, and that this emotional impact generally encing shopping behaviors and outcomes. But what types ofemotional responses do individuals have during the shoppingguides the subsequent relations within the environment (Ittel-
son, 1973). experience? And how should these emotions be measured?These are the questions that guide the present study.The pervasive influence of emotional response has been
long recognized by marketing researchers in various contexts,such as advertising, product consumption, and shopping Measures of Emotion(Holbrook, Chestnut, Oliva, and Greenleaf, 1984; Batra andRay, 1986; Westbrook, 1987; Batra and Holbrook, 1990; Co- The English language provides hundreds of words for describ-hen, 1990). A shopping episode is a situation in which individ- ing emotions. In environmental psychology, researchers haveuals would be particularly likely to have emotional responses. studied how to most efficiently describe the emotional experi-
ence and have tried to provide better descriptors to assessemotional responses to places and experiences therein (RussellAddress correspondence to Karen Machleit, P.O. Box 210145, University of
Cincinnati, Cincinnati, OH 45221-0145. and Pratt, 1980). In the marketing discipline, measures from
Journal of Business Research 49, 101–111 (2000) 2000 Elsevier Science Inc. All rights reserved. ISSN 0148-2963/00/$–see front matter655 Avenue of the Americas, New York, NY 10010 PII S0148-2963(99)00007-7
102 J Busn Res K. A. Machleit and S. A. Eroglu2000:49:101–111
psychology are commonly adapted to fit the consumption be represented with the summary factors of positive and nega-tive affect. Similarly, Mano and Oliver (1993) worked withcontext, and there exists an even greater need to examinesummary dimensions of positive affect, negative affect, andmeasure appropriateness and adequacy (Peter, 1981; Sheth,arousal in their model of antecedents to a postconsumption1982). The three typologies of emotion that marketers mostsatisfaction response. While presumably appropriate in theseoften borrow from psychology are Izard’s (Izard, 1977) 10cases, it is suspect if and how such reductions could be used infundamental emotions from his Differential Emotions Theory,assessing the emotional response to the shopping environmentPlutchik’s (Plutchik, 1980) eight basic emotion categories,and experience.and Mehrabian and Russell’s (Mehrabian and Russell, 1974)
There seem to be enough differences between the temporalPleasure, Arousal, and Dominance dimensions of response.and physical characteristics of the shopping experience andWith the exception of evidence provided by Havlena andthose of advertising and product consumption situations thatHolbrook’s (Havlena and Holbrook, 1986) work directly com-would lead us to expect differences in the range and intensityparing two emotional measures, our knowledge of which emo-of emotional responses to them. An exposure to advertising,tion measure is most appropriate for use in marketing contextsfor example, is a fleeting, short-lived phenomenon that mayis limited. Consequently, direct comparison of alternativenot parallel the complexity of a shopping episode. If this isemotion measures has been called for by several marketingthe case, then the question becomes whether affect from ascholars (Havlena and Holbrook, 1986; Westbrook and Oli-multifarious shopping experience can be reduced down tover, 1991; Oliver, 1993).two or three primary dimensions? If the answer is affirmative,Havlena and Holbrook (1986) compared the Plutchik andthen researchers can simplify their theorizing and analysis ofthe Mehrabian and Russell (M-R) schemes with respect toemotional responses by employing the summary dimensions.consumption experiences. Their results showed evidence inIf not, use of inappropriate summary dimensions can lead tofavor of the latter, concluding that the three PAD dimensionsloss of important information about the specific nature of thecaptured more information about the emotional character ofemotional response and its effects.the consumer experience than did Plutchik’s eight categories.
However, Havlena and Holbrook’s study focused on emotionsconcerning the general consumption experience, not the spe- Study Objectivescific shopping context. Even though Havlena and Holbrookasked their subjects to report a consumption experience with Accordingly, three research objectives guide this study. First,strong emotional content, we contend that the emotive stimu- we evaluate the nature of emotional responses to the shoppinglants in a shopping experience are likely to be far greater in experience and provide a descriptive account of emotionsnumber and perhaps in intensity. We argue that the need for consumers feel across a wide variety of store types. This istesting the adequacy and appropriateness of existing emotion consistent with Darden and Babin’s (Darden and Babin, 1994)measures is even more accentuated in the shopping context. call for broadening the range of stores examined in order toA case in point is the M-R measure, which is widely used in show the full spectrum of affective qualities possible acrossmarketing to evaluate emotional responses. While Mehrabian all types of retailers. As part of this objective, we examine theand Russell contended that their dimensions can sufficiently potential role store atmosphere expectations play in influenc-capture emotional response to primary domains (such as resi- ing emotional responses to the shopping experience. The sec-dential and work places), it is not clear if the measure can ond objective involves comparing the three emotion measuresrepresent (or better represent than other alternatives) the range developed in psychology, and frequently used in marketing,of emotions likely to be experienced by shoppers. Using Hav- to determine which best captures the range of emotions experi-lena and Holbrook’s phrasing, it remains an empirical question enced by shoppers. This analysis will allow researchers inwhether all the emotion types included are pertinent to the the area to make a better choice among emotion measuresstudy of the shopping experience. appropriate for use in the shopping context. Third, we aim
Closely related to this external validity issue is the way in to determine whether various emotions evoked during thewhich emotional measures borrowed from psychology are shopping episode can be represented by a limited number ofused in marketing. In the context of the shopping environ- summary dimensions in lieu of the separate scale components.ment, for example, Hui and Bateson (1991) have examined Of the various measures of emotion, this study focuses onconsumers’ emotional and behavioral responses to crowding the three that have received the most attention in examiningin a retail service setting. Interestingly, however, their emotion consumption-related affect in the marketing literature. Meh-measure consisted of only the “pleasure” dimension of the rabian and Russell’s (Mehrabian and Russell, 1974) Pleasure,PAD scale. Similar reductions have been used in gauging Arousal, and Dominance (PAD) dimensions of response repre-emotions in other marketing contexts. As an alternative to sent the premier measure in the field of environmental psy-selecting only a subset of emotion types, consumer researchers chology for assessing individuals’ emotional responses to theirhave used “summary dimensions” to measure emotional re- environment. It also has been widely employed in marketingsponses evoked by product consumption. For example, West- for evaluating emotions in various marketing contexts (Dono-
van and Rossiter, 1982; Holbrook, Chestnut, Oliva, and Green-brook (1987) found that six of Izard’s 10 emotion types could
103Describing and Measuring Emotional Response to Shopping Experience J Busn Res2000:49:101–111
leaf, 1984; Hui and Bateson, 1991). The second emotion bookstore, or mall). To help them retrieve from memory thedetails of their shopping trip, we first asked the respondentsmeasure examined here is that of Plutchik (1980) that, ac-
cording to Havlena and Holbrook (1986), has received the to indicate whether they made a purchase, their shoppingintention (to browse, to buy a specific item, or both), thewidest usage in consumer research along with the PAD mea-
sure. Plutchik contends that the eight emotion categories he approximate number of times they have previously visited thestore, and a few other descriptive questions. Expectations ofidentified are the root of all human emotional responses.
The third measure is Izard’s (Izard, 1977) 10 fundamental the store atmosphere were measured by asking respondentsemotions from his Differential Emotions Theory. In addition to: “Please think back to the ‘atmosphere’ of the store—theto becoming highly popular among consumer researchers, lighting, the music, the displays, the type of people shoppingIzard was selected here due to the diversity of emotions it there, etc. Before entering a store, people often have someencompasses. It includes a number of negative emotions that expectations about what the store will be like. Think for aare not captured in the PAD and Plutchik scales but that, we moment about the overall atmosphere of the store and com-feel, are pertinent to the shopping experience (such as anger pare with what you expected the store to be like before youor disgust due to poor interactions with salespersons, guilt went in the store. With this in mind, was the store: (semanticover purchase, and so forth). differential format scale with endpoints of ‘Exactly like what
The following sections provide a descriptive account of I expected’ [1] and ‘Not at all like I expected’ [7]).”consumers’ emotional responses across a wide variety of store Next, the emotion adjectives for the Izard and Plutchiktypes and shopping situations. We describe the nature of measures were presented (mixed in with some other adjec-emotional responses with the three emotion measures to iden- tives), and respondents were asked to indicate on a 1 (low)tify which may be most appropriate for assessing emotion in to 5 (high) scale how strongly they felt each of the emotionthe shopping experience, and we determine if and how sum- types. They then completed the semantic differential scalemary dimensions can be used. items for the Mehrabian-Russell PAD dimensions.1 Finally,
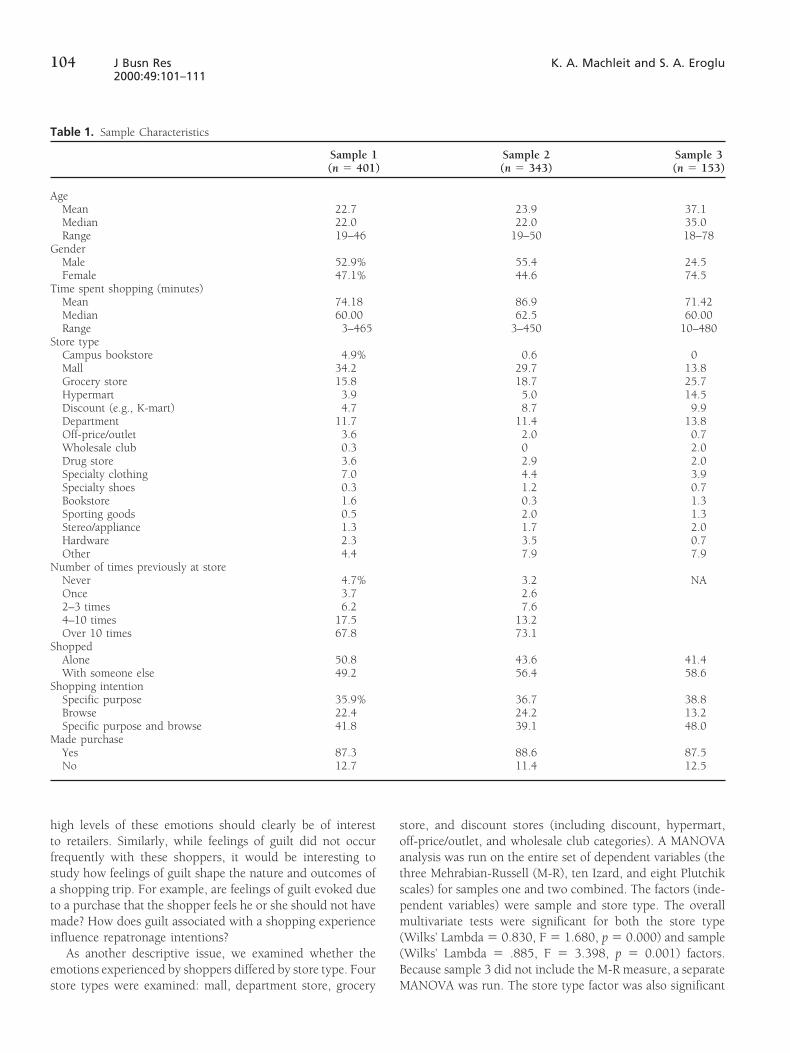
several classification measures were taken such as approximatetime spent in the store, whether shopped alone or with an-Methodother, and age and gender information (Table 1).
SampleTo address the call for increasing sample heterogeneity in Resultsevaluating emotional responses to retail environments (Dar-den and Babin, 1994), this study encompasses three waves Descriptive Account of Emotionalof data collection. The first sample was collected from 401 Experience While Shoppingundergraduate students at a large midwestern university. The The first objective of the study is to provide a descriptivesecond data collection (n 5 343) also involved undergraduate account of the nature and variety of emotional responsesstudents but from two other universities, a midwestern and experienced while shopping. Table 2 provides the mean levelsa southern. The second wave of data collection was done for
of the various emotion types that were experienced across thereplication purposes as well as for insuring a wide variety of
samples for a wide variety of shopping situations in differentshopping experiences. Increasing the diversity of shopping
store types. The Mehrabian-Russell emotion dimensions wereexperiences was deemed especially desirable in evaluating and
measured on a seven-point semantic differential format (thuscomparing the three emotion scales. For the last set of data,
4.0 would be the neutral point), and the magnitude of thesethe sample consisted entirely of adult respondents (n 5 153)
mean values should not be compared directly with the Izardwho were recruited from two different day care centers and
and Plutchik mean values (which were measured on a 1–5a suburban parenting/social group. The day care centers and
Likert format scale). Note that across all measures, some ofthe parenting group were given $2.00 for each questionnaire
the emotion types are experienced with more frequency andthat was completed. As a fundraising activity for these organi-
intensity (e.g., joy, interest, acceptance, expectancy). How-zations, the staff and parents completed questionnaires and
ever, while the mean levels on many of the emotion types arealso recruited people who they knew to complete question-
low, this should not be interpreted to mean that these emotionnaires. All respondents were asked to complete the question-types are not relevant or important in the shopping episode.naire after the next time they went shopping, and they wereFor example, emotions such as anger and disgust do not haveinstructed to take the task seriously. Table 1 provides descrip-high mean values, but the few shoppers who did experiencetive characteristics of the three samples and their shopping
experiences.
1 For two reasons, the Mehrabian-Russell measure was not included in theQuestionnaire questionnaire for sample 3. First, there was concern about the willingness
of the adult (nonstudent) sample to complete a long survey. Also, resultsThe questionnaires were given to respondents to be completedfrom samples 1 and 2 that were examined before sample 3 was taken indicated
immediately after their next shopping trip (such as to the that the M-R measure did not perform as well as the others; thus, it wasdeleted from the third wave of data collection.grocery store, department store, discount store, drugstore,
104 J Busn Res K. A. Machleit and S. A. Eroglu2000:49:101–111
Table 1. Sample Characteristics
Sample 1 Sample 2 Sample 3(n 5 401) (n 5 343) (n 5 153)
AgeMean 22.7 23.9 37.1Median 22.0 22.0 35.0Range 19–46 19–50 18–78
GenderMale 52.9% 55.4 24.5Female 47.1% 44.6 74.5
Time spent shopping (minutes)Mean 74.18 86.9 71.42Median 60.00 62.5 60.00Range 3–465 3–450 10–480
Store typeCampus bookstore 4.9% 0.6 0Mall 34.2 29.7 13.8Grocery store 15.8 18.7 25.7Hypermart 3.9 5.0 14.5Discount (e.g., K-mart) 4.7 8.7 9.9Department 11.7 11.4 13.8Off-price/outlet 3.6 2.0 0.7Wholesale club 0.3 0 2.0Drug store 3.6 2.9 2.0Specialty clothing 7.0 4.4 3.9Specialty shoes 0.3 1.2 0.7Bookstore 1.6 0.3 1.3Sporting goods 0.5 2.0 1.3Stereo/appliance 1.3 1.7 2.0Hardware 2.3 3.5 0.7Other 4.4 7.9 7.9
Number of times previously at storeNever 4.7% 3.2 NAOnce 3.7 2.62–3 times 6.2 7.64–10 times 17.5 13.2Over 10 times 67.8 73.1
ShoppedAlone 50.8 43.6 41.4With someone else 49.2 56.4 58.6
Shopping intentionSpecific purpose 35.9% 36.7 38.8Browse 22.4 24.2 13.2Specific purpose and browse 41.8 39.1 48.0
Made purchaseYes 87.3 88.6 87.5No 12.7 11.4 12.5
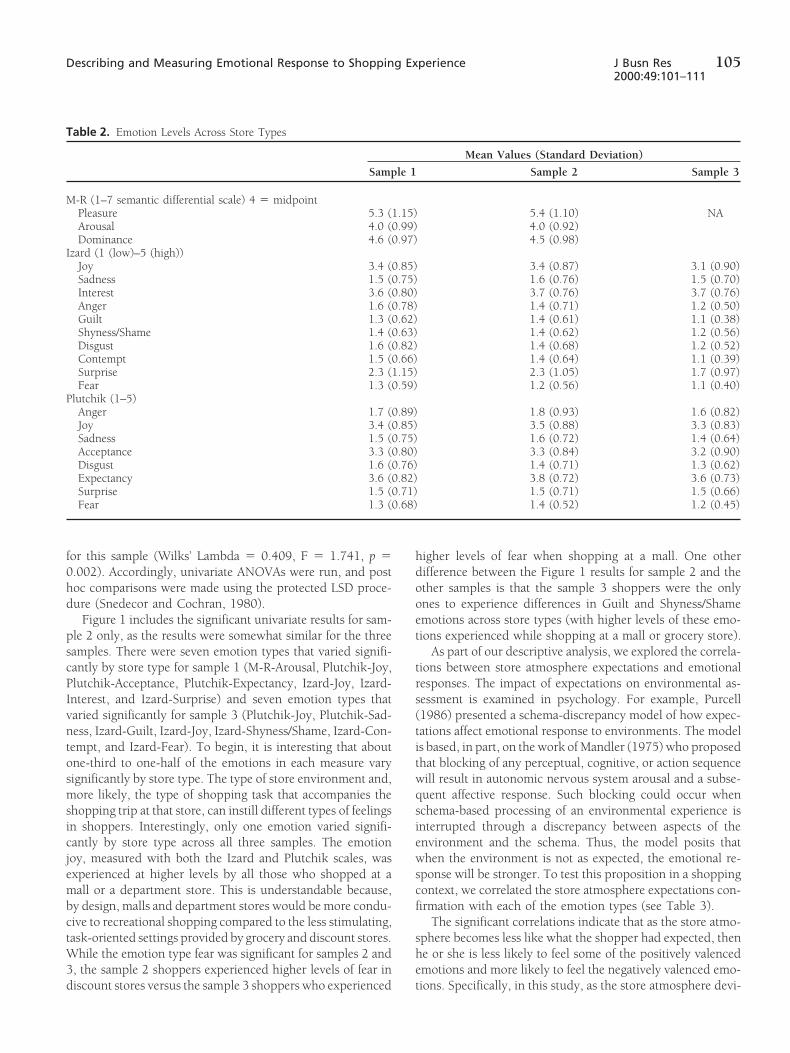
high levels of these emotions should clearly be of interest store, and discount stores (including discount, hypermart,off-price/outlet, and wholesale club categories). A MANOVAto retailers. Similarly, while feelings of guilt did not occur
frequently with these shoppers, it would be interesting to analysis was run on the entire set of dependent variables (thethree Mehrabian-Russell (M-R), ten Izard, and eight Plutchikstudy how feelings of guilt shape the nature and outcomes of
a shopping trip. For example, are feelings of guilt evoked due scales) for samples one and two combined. The factors (inde-pendent variables) were sample and store type. The overallto a purchase that the shopper feels he or she should not have
made? How does guilt associated with a shopping experience multivariate tests were significant for both the store type(Wilks’ Lambda 5 0.830, F 5 1.680, p 5 0.000) and sampleinfluence repatronage intentions?
As another descriptive issue, we examined whether the (Wilks’ Lambda 5 .885, F 5 3.398, p 5 0.001) factors.Because sample 3 did not include the M-R measure, a separateemotions experienced by shoppers differed by store type. Four
store types were examined: mall, department store, grocery MANOVA was run. The store type factor was also significant
105Describing and Measuring Emotional Response to Shopping Experience J Busn Res2000:49:101–111
Table 2. Emotion Levels Across Store Types
Mean Values (Standard Deviation)
Sample 1 Sample 2 Sample 3
M-R (1–7 semantic differential scale) 4 5 midpointPleasure 5.3 (1.15) 5.4 (1.10) NAArousal 4.0 (0.99) 4.0 (0.92)Dominance 4.6 (0.97) 4.5 (0.98)
Izard (1 (low)–5 (high))Joy 3.4 (0.85) 3.4 (0.87) 3.1 (0.90)Sadness 1.5 (0.75) 1.6 (0.76) 1.5 (0.70)Interest 3.6 (0.80) 3.7 (0.76) 3.7 (0.76)Anger 1.6 (0.78) 1.4 (0.71) 1.2 (0.50)Guilt 1.3 (0.62) 1.4 (0.61) 1.1 (0.38)Shyness/Shame 1.4 (0.63) 1.4 (0.62) 1.2 (0.56)Disgust 1.6 (0.82) 1.4 (0.68) 1.2 (0.52)Contempt 1.5 (0.66) 1.4 (0.64) 1.1 (0.39)Surprise 2.3 (1.15) 2.3 (1.05) 1.7 (0.97)Fear 1.3 (0.59) 1.2 (0.56) 1.1 (0.40)
Plutchik (1–5)Anger 1.7 (0.89) 1.8 (0.93) 1.6 (0.82)Joy 3.4 (0.85) 3.5 (0.88) 3.3 (0.83)Sadness 1.5 (0.75) 1.6 (0.72) 1.4 (0.64)Acceptance 3.3 (0.80) 3.3 (0.84) 3.2 (0.90)Disgust 1.6 (0.76) 1.4 (0.71) 1.3 (0.62)Expectancy 3.6 (0.82) 3.8 (0.72) 3.6 (0.73)Surprise 1.5 (0.71) 1.5 (0.71) 1.5 (0.66)Fear 1.3 (0.68) 1.4 (0.52) 1.2 (0.45)
for this sample (Wilks’ Lambda 5 0.409, F 5 1.741, p 5 higher levels of fear when shopping at a mall. One otherdifference between the Figure 1 results for sample 2 and the0.002). Accordingly, univariate ANOVAs were run, and post
hoc comparisons were made using the protected LSD proce- other samples is that the sample 3 shoppers were the onlyones to experience differences in Guilt and Shyness/Shamedure (Snedecor and Cochran, 1980).
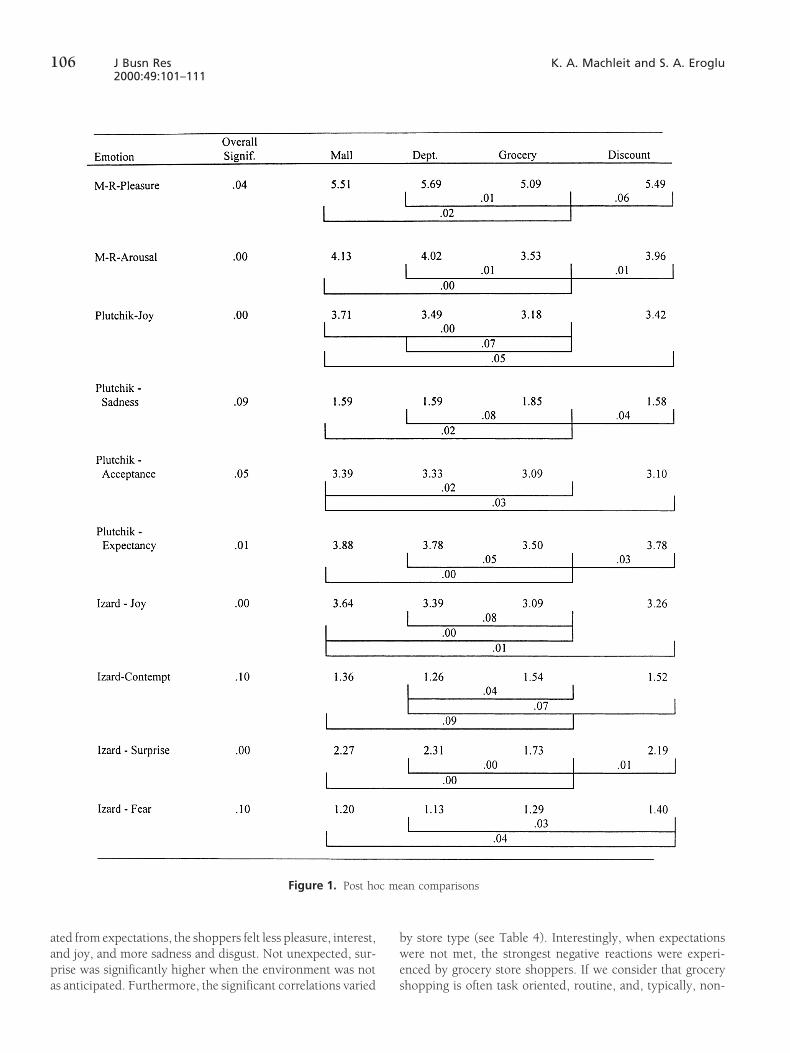
Figure 1 includes the significant univariate results for sam- emotions across store types (with higher levels of these emo-tions experienced while shopping at a mall or grocery store).ple 2 only, as the results were somewhat similar for the three
samples. There were seven emotion types that varied signifi- As part of our descriptive analysis, we explored the correla-tions between store atmosphere expectations and emotionalcantly by store type for sample 1 (M-R-Arousal, Plutchik-Joy,
Plutchik-Acceptance, Plutchik-Expectancy, Izard-Joy, Izard- responses. The impact of expectations on environmental as-sessment is examined in psychology. For example, PurcellInterest, and Izard-Surprise) and seven emotion types that
varied significantly for sample 3 (Plutchik-Joy, Plutchik-Sad- (1986) presented a schema-discrepancy model of how expec-tations affect emotional response to environments. The modelness, Izard-Guilt, Izard-Joy, Izard-Shyness/Shame, Izard-Con-
tempt, and Izard-Fear). To begin, it is interesting that about is based, in part, on the work of Mandler (1975) who proposedthat blocking of any perceptual, cognitive, or action sequenceone-third to one-half of the emotions in each measure vary
significantly by store type. The type of store environment and, will result in autonomic nervous system arousal and a subse-quent affective response. Such blocking could occur whenmore likely, the type of shopping task that accompanies the
shopping trip at that store, can instill different types of feelings schema-based processing of an environmental experience isinterrupted through a discrepancy between aspects of thein shoppers. Interestingly, only one emotion varied signifi-
cantly by store type across all three samples. The emotion environment and the schema. Thus, the model posits thatwhen the environment is not as expected, the emotional re-joy, measured with both the Izard and Plutchik scales, was
experienced at higher levels by all those who shopped at a sponse will be stronger. To test this proposition in a shoppingcontext, we correlated the store atmosphere expectations con-mall or a department store. This is understandable because,
by design, malls and department stores would be more condu- firmation with each of the emotion types (see Table 3).The significant correlations indicate that as the store atmo-cive to recreational shopping compared to the less stimulating,
task-oriented settings provided by grocery and discount stores. sphere becomes less like what the shopper had expected, thenhe or she is less likely to feel some of the positively valencedWhile the emotion type fear was significant for samples 2 and
3, the sample 2 shoppers experienced higher levels of fear in emotions and more likely to feel the negatively valenced emo-tions. Specifically, in this study, as the store atmosphere devi-discount stores versus the sample 3 shoppers who experienced
106 J Busn Res K. A. Machleit and S. A. Eroglu2000:49:101–111
Figure 1. Post hoc mean comparisons
ated from expectations, the shoppers felt less pleasure, interest, by store type (see Table 4). Interestingly, when expectationswere not met, the strongest negative reactions were experi-and joy, and more sadness and disgust. Not unexpected, sur-
prise was significantly higher when the environment was not enced by grocery store shoppers. If we consider that groceryshopping is often task oriented, routine, and, typically, non-as anticipated. Furthermore, the significant correlations varied
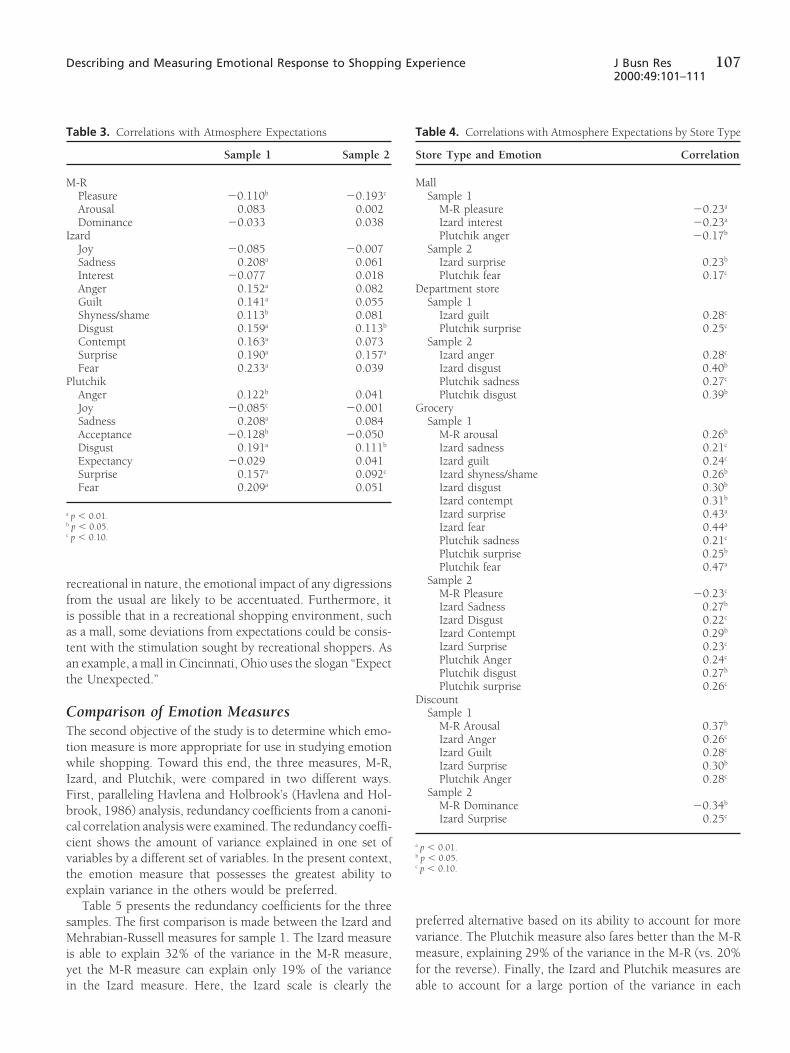
107Describing and Measuring Emotional Response to Shopping Experience J Busn Res2000:49:101–111
Table 4. Correlations with Atmosphere Expectations by Store TypeTable 3. Correlations with Atmosphere Expectations
Sample 1 Sample 2 Store Type and Emotion Correlation
MallM-RPleasure 20.110b 20.193c Sample 1
M-R pleasure 20.23aArousal 0.083 0.002Dominance 20.033 0.038 Izard interest 20.23a
Plutchik anger 20.17bIzardJoy 20.085 20.007 Sample 2
Izard surprise 0.23bSadness 0.208a 0.061Interest 20.077 0.018 Plutchik fear 0.17c
Department storeAnger 0.152a 0.082Guilt 0.141a 0.055 Sample 1
Izard guilt 0.28cShyness/shame 0.113b 0.081Disgust 0.159a 0.113b Plutchik surprise 0.25c
Sample 2Contempt 0.163a 0.073Surprise 0.190a 0.157a Izard anger 0.28c
Izard disgust 0.40bFear 0.233a 0.039Plutchik Plutchik sadness 0.27c
Plutchik disgust 0.39bAnger 0.122b 0.041Joy 20.085c 20.001 Grocery
Sample 1Sadness 0.208a 0.084Acceptance 20.128b 20.050 M-R arousal 0.26b
Izard sadness 0.21cDisgust 0.191a 0.111b
Expectancy 20.029 0.041 Izard guilt 0.24c
Izard shyness/shame 0.26bSurprise 0.157a 0.092c
Fear 0.209a 0.051 Izard disgust 0.30b
Izard contempt 0.31b
Izard surprise 0.43aa p , 0.01.b p , 0.05. Izard fear 0.44a
c p , 0.10. Plutchik sadness 0.21c
Plutchik surprise 0.25b
Plutchik fear 0.47a
Sample 2recreational in nature, the emotional impact of any digressionsM-R Pleasure 20.23c
from the usual are likely to be accentuated. Furthermore, itIzard Sadness 0.27b
is possible that in a recreational shopping environment, such Izard Disgust 0.22c
as a mall, some deviations from expectations could be consis- Izard Contempt 0.29b
Izard Surprise 0.23ctent with the stimulation sought by recreational shoppers. AsPlutchik Anger 0.24c
an example, a mall in Cincinnati, Ohio uses the slogan “ExpectPlutchik disgust 0.27b
the Unexpected.”Plutchik surprise 0.26c
DiscountSample 1Comparison of Emotion Measures
M-R Arousal 0.37bThe second objective of the study is to determine which emo-
Izard Anger 0.26c
tion measure is more appropriate for use in studying emotion Izard Guilt 0.28c
while shopping. Toward this end, the three measures, M-R, Izard Surprise 0.30b
Plutchik Anger 0.28cIzard, and Plutchik, were compared in two different ways.Sample 2First, paralleling Havlena and Holbrook’s (Havlena and Hol-
M-R Dominance 20.34bbrook, 1986) analysis, redundancy coefficients from a canoni-
Izard Surprise 0.25c
cal correlation analysis were examined. The redundancy coeffi-cient shows the amount of variance explained in one set of a p , 0.01.
b p , 0.05.variables by a different set of variables. In the present context,c p , 0.10.the emotion measure that possesses the greatest ability to
explain variance in the others would be preferred.Table 5 presents the redundancy coefficients for the three
preferred alternative based on its ability to account for moresamples. The first comparison is made between the Izard andvariance. The Plutchik measure also fares better than the M-RMehrabian-Russell measures for sample 1. The Izard measuremeasure, explaining 29% of the variance in the M-R (vs. 20%is able to explain 32% of the variance in the M-R measure,for the reverse). Finally, the Izard and Plutchik measures areyet the M-R measure can explain only 19% of the variance
in the Izard measure. Here, the Izard scale is clearly the able to account for a large portion of the variance in each
108 J Busn Res K. A. Machleit and S. A. Eroglu2000:49:101–111
Table 5. Canonical Correlation Analysis
Redundancy AnalysisNumber Cumulative
of Proportion Variance in First Variance in SecondEmotion Sets Variates of Variance Explained by Second Explained by First
Sample 1Izard/M-R 2 0.95 0.19 0.32Plutchik/M-R 2 0.97 0.20 0.29Izard/Plutchik 5 0.95 0.63 0.69
Sample 2IzardM-R 2 0.97 0.18 0.30Plutchik/M-R 2 0.95 0.21 0.28Izard/Plutchik 4 0.96 0.53 0.58
Sample 3Izard/Plutchik 4 0.95 0.56 0.58
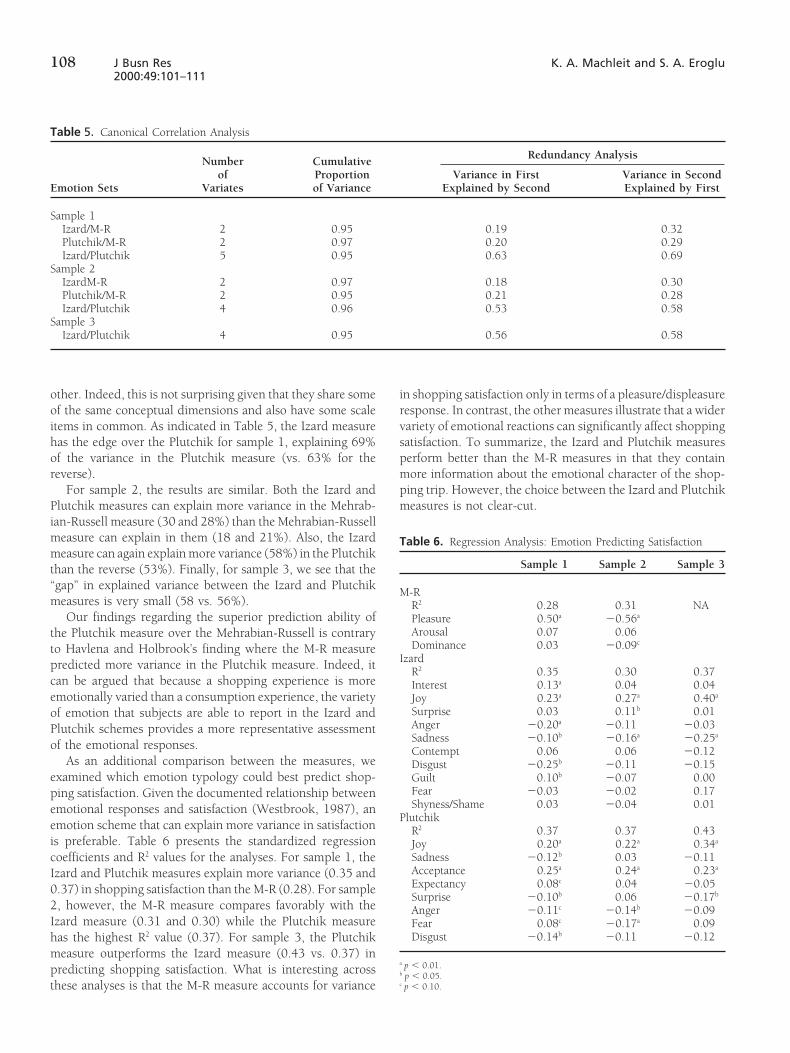
other. Indeed, this is not surprising given that they share some in shopping satisfaction only in terms of a pleasure/displeasureresponse. In contrast, the other measures illustrate that a widerof the same conceptual dimensions and also have some scale
items in common. As indicated in Table 5, the Izard measure variety of emotional reactions can significantly affect shoppingsatisfaction. To summarize, the Izard and Plutchik measureshas the edge over the Plutchik for sample 1, explaining 69%
of the variance in the Plutchik measure (vs. 63% for the perform better than the M-R measures in that they containmore information about the emotional character of the shop-reverse).
For sample 2, the results are similar. Both the Izard and ping trip. However, the choice between the Izard and Plutchikmeasures is not clear-cut.Plutchik measures can explain more variance in the Mehrab-
ian-Russell measure (30 and 28%) than the Mehrabian-Russellmeasure can explain in them (18 and 21%). Also, the Izard Table 6. Regression Analysis: Emotion Predicting Satisfactionmeasure can again explain more variance (58%) in the Plutchik
Sample 1 Sample 2 Sample 3than the reverse (53%). Finally, for sample 3, we see that the“gap” in explained variance between the Izard and Plutchik
M-Rmeasures is very small (58 vs. 56%). R2 0.28 0.31 NA
Our findings regarding the superior prediction ability of Pleasure 0.50a 20.56a
Arousal 0.07 0.06the Plutchik measure over the Mehrabian-Russell is contraryDominance 0.03 20.09c
to Havlena and Holbrook’s finding where the M-R measureIzardpredicted more variance in the Plutchik measure. Indeed, it
R2 0.35 0.30 0.37can be argued that because a shopping experience is more Interest 0.13a 0.04 0.04emotionally varied than a consumption experience, the variety Joy 0.23a 0.27a 0.40a
Surprise 0.03 0.11b 0.01of emotion that subjects are able to report in the Izard andAnger 20.20a 20.11 20.03Plutchik schemes provides a more representative assessmentSadness 20.10b 20.16a 20.25a
of the emotional responses. Contempt 0.06 0.06 20.12As an additional comparison between the measures, we Disgust 20.25b 20.11 20.15
examined which emotion typology could best predict shop- Guilt 0.10b 20.07 0.00Fear 20.03 20.02 0.17ping satisfaction. Given the documented relationship betweenShyness/Shame 0.03 20.04 0.01emotional responses and satisfaction (Westbrook, 1987), an
Plutchikemotion scheme that can explain more variance in satisfaction R2 0.37 0.37 0.43is preferable. Table 6 presents the standardized regression Joy 0.20a 0.22a 0.34a
Sadness 20.12b 0.03 20.11coefficients and R2 values for the analyses. For sample 1, theAcceptance 0.25a 0.24a 0.23a
Izard and Plutchik measures explain more variance (0.35 andExpectancy 0.08c 0.04 20.050.37) in shopping satisfaction than the M-R (0.28). For sampleSurprise 20.10b 0.06 20.17b
2, however, the M-R measure compares favorably with the Anger 20.11c 20.14b 20.09Izard measure (0.31 and 0.30) while the Plutchik measure Fear 0.08c 20.17a 0.09
Disgust 20.14b 20.11 20.12has the highest R2 value (0.37). For sample 3, the Plutchikmeasure outperforms the Izard measure (0.43 vs. 0.37) in
a p , 0.01.predicting shopping satisfaction. What is interesting across b p , 0.05.c p , 0.10.these analyses is that the M-R measure accounts for variance

109Describing and Measuring Emotional Response to Shopping Experience J Busn Res2000:49:101–111
Table 7. Fit Indices for Two-Factor Model
x2 p AGFI RMSR NFI CFI Standardized Residuals
IzardSample 1 214.49 0.00 0.82 0.072 0.84 0.86 high 5 7.58, 33% . 2.5Sample 2 156.91 0.00 0.85 0.064 0.87 0.89 high 5 6.77, 24% . 2.5Sample 3 177.17 0.00 0.65 0.090 0.69 0.73 high 5 5.43, 31% . 2.5
PlutchikSample 1 123.33 0.00 0.86 0.068 0.84 0.86 high 5 5.32, 36% . 2.5Sample 2 83.27 0.00 0.89 0.061 0.89 0.92 high 5 5.60, 25% . 2.5Sample 3 33.81 0.02 0.90 0.060 0.87 0.94 high 5 3.24, 4% . 2.5
ever, the fit is acceptable and only one residual is above theAre Summary Dimensions of Emotion Appropriate?2.5 cutoff level.The third objective of the study is to determine whether the
As an illustration of the problems that can arise whenemotions experienced by shoppers can be reduced down tomeasures are inappropriately combined into a summary di-a smaller set of summary dimensions. Past studies have exam-mension, we compared the positive and negative affect sum-ined separate positive and negative dimensions, and a fewmary factors with the individual emotion types that make upincluded arousal as an additional dimension (Mano and Oli-each factor. Specifically, we looked at the correlations betweenver, 1993). Paralleling some of the studies that have usedshopping satisfaction and the summary factors and shoppingsummary dimensions (e.g., Westbrook, 1987), confirmatorysatisfaction and the individual emotion types. For sample 1,factor analysis (via LISREL 8.12) was used to test whether thethe Izard-Negative Affect summary factor significantly corre-Plutchik and Izard measures can be reduced down to the twolated with shopping satisfaction (20.38, p , 0.01), yet onepositive and negative summary dimensions. For the Izardof the components of that factor, guilt, does not correlatemeasure, joy and interest were modeled as loading on thesignificantly with shopping satisfaction (20.07, p . 0.10).positive affect dimension; anger, disgust, contempt, guilt, fear,Similarly in sample 3, the Izard-Negative Affect factor corre-shame/shyness, and sadness were specified to load on thelates with satisfaction (20.33, p , 0.01), yet three of thenegative affect dimension, and surprise was modeled as load-components, guilt (20.12, p . 0.10), shame/shyness (20.07,ing on both dimensions. Surprise has been conceptualized byp . 0.10), and fear (20.06, p . 0.10) do not correlateIzard (1977) as an amplifier of both positive and negativewith shopping satisfaction. Clearly, by combining emotionalaffective response; thus, surprise was specified to load onresponse into a summary factor, we lose important informationboth factors. This is consistent with Westbrook’s (Westbrook,that can advance our understanding of the specific nature of1987) study where he found that surprise loaded on boththe effects. A more compelling example of this problem ispositive and negative affect factors for automobile and cablefound when looking at correlations with a different variable.television consumption experiences. Table 7 shows the fitIn samples 1 and 2, respondents were asked to respond tostatistics for this model for the three samples. Note that whilethe statement “I found a bargain at the store” on a Likertthe some of the fit indices approach what might be consideredformat scale. As a strong illustration of this point, we founda minimum acceptable level (in particular, the AGFI for samplethat in sample 1, the Izard-Negative Affect and Plutchik-Nega-2 does meet the 0.85 rule-of-thumb minimum level), theretive Affect summary factors do not correlate significantly withare many standardized residuals over 2.5, and many of themthis statement (20.02 and 20.07, respectively) while theare very high in magnitude, indicating a poor fit of the model.Izard emotion types of anger and guilt do significantly corre-Note also that the two-dimensional model clearly does not fitlate with the statement (20.16, p , 0.01, and 0.12, p ,the data for sample 3.0.01, respectively). Additionally, the Plutchik emotion typeFor the Plutchik model, joy, acceptance, and expectancyanger also significantly correlates with finding a bargainwere specified for the positive affect factor, and anger, sadness,(20.15, p , 0.01). For sample 2, again the Izard-Negativefear, disgust, and surprise were specified for the negativeAffect summary factor does not significantly correlate withaffect factor. In the Plutchik measure, surprise is measuredfinding a bargain (20.05), yet the emotion type sadness doesdifferently than the Izard measure (with the items “puzzled,”(20.12, p , 0.01). Hence, in this case, if summary factors“confused,” and “startled” vs. “astonished,” “surprised,” andwere used in the analysis, we would inappropriately conclude“amazed”) and contain more of a negative tone. Therefore,that negative affect has no relationship with finding a bargainsurprise was specified to load only on the negative affect factor.at a store, yet in actuality, some of the components of theThe fit indices for the Plutchik two-dimensional model are alsosummary factor do, indeed, have a relationship.in Table 8. The fit indices for samples 1 and 2 are marginally
Overall, the issue of whether summary dimensions can beacceptable overall, although the standardized residuals arequite high, indicating misspecification. For sample 3, how- an appropriate representation of emotional responses while
110 J Busn Res K. A. Machleit and S. A. Eroglu2000:49:101–111
shopping does not have a clear-cut answer. The evidence types experienced. From a managerial point of view, grocerypresented here illustrates that across a wide variety of shopping retailers should be particularly interested in addressing theseepisodes it is best not to combine emotion types into a sum- issues because patronage frequency, shopping duration, andmary factor. Yet, it is possible that in a study more limited in purchase outcomes might all hinge, in part, on the emotionalscope a summary factor could adequately capture the range impact their stores have on customers. Because the tangiblein the emotional responses. We recommend that researchers and intangible atmospheric qualities of a store are under theuse caution in constructing summary dimensions. Summary control of management, a further understanding of the rela-dimensions have the advantage of simplifying data analysis tionship between emotions and functional characteristics ofand reducing potential problems of multicollinearity among a retail setting could help managers caliber their in-store envi-the emotion types. Confirmatory factor analysis is a recom- ronments to elicit desired emotional and therefore behavioralmended step in determining whether it is appropriate to com- shopping outcomes.bine the emotional responses. Under certain circumstances, Our findings also indicate relationships between expecta-only a limited subset of emotion types may be sufficient, tions and emotions. As the store atmosphere digressed fromfor instance, if respondent fatigue in completing a lengthy what shoppers expected, they were more likely to feel nega-questionnaire is of concern or if the range of emotional re- tively valenced emotions. Given the limitations of survey re-sponse elicited may not necessitate the use of the full scale. search and the recall technique used in this study, futureFor example, Izard (1977) defined the emotion types of anger, research might overcome these weaknesses by experimentallydisgust, and contempt as a “hostility triad” that may be most controlling some of the potentially confounding factors. Therelevant in studies that focus on external attributions (either aforementioned schema-discrepancy theory offers a concep-toward other shoppers or toward the store) for the dissatisfac- tual framework for examining individuals’ emotional re-tion that might be experienced (Oliver, 1997). Similarly, the sponses to shopping environments and the role of expectationsinternally attributed emotions (shame/shyness or guilt) may within this context.be relevant to the researcher when examining, for example, The comparison of the three emotion measures indicatedshopping outcomes of unplanned and/or excessive purchases. that the Izard and Plutchik measures perform considerably
better than the Mehrabian-Russell measure; they simply con-tain more information about the emotional response. TheDiscussion choice between the Izard and Plutchik measures, however, isnot an obvious one. While the Izard measure had a slight edgeResearch to date has shown that retail environments evokein the canonical correlation analysis, the Plutchik measure hademotional responses, and that shoppers perceive substantialthe edge in the regression analysis. We recommend that thedifferences in affective qualities of different stores (Dardenchoice between these measures be made on the basis of theand Babin, 1994). One of the contributions of this study isresearch questions to be addressed, given that each measureto present the specific nature of these emotions and theircaptures different emotion types. In some instances, feelingsvariability across different retail environments. The resultsof guilt, shame, or contempt may be relevant and in others,indicated that up to 50% of all the emotions encompassed infeelings of acceptance or expectancy may be more appropriate.each measure varied significantly by store type. Furthermore,Our findings indicate that in the specific context of the shop-these differences were in the expected direction, in that moreping experience, both Izard and Plutchik have emotion typesfunctional and task-oriented environments (such as grocerythat can, indeed, be relevant. The Izard measure containsand discount stores) were associated with lower levels of plea-many negative emotion types and may be more appropriatesure- and arousal-related emotions. Given these findings, fu-for studies that look at the unpleasant, rather than the pleasant,ture research might examine the specific relationship betweenaspects of shopping. The Plutchik emotion types of expectancyemotional and functional qualities across different retail envi-and acceptance also may be particularly relevant in studies ofronments. Of particular interest is which tangible or intangiblesalesperson interactions with shopper.environmental qualities instigate which types of emotional
We do, however, recognize that the Mehrabian-Russellresponses. Particularly in the context of grocery shopping, themeasure also has its strengths. First, it is the only measure ofnegative emotions dominated in both quantity and intensity.the three that includes an arousal component. Given thatWhile it is clear why our subjects were not overjoyed witharousal has been shown to play a role in models of emotionalgrocery shopping, their strong negative reactions in this partic-reactions (Russell, 1979, 1980), researchers using the Plutchikular retail setting call for further research and managerialand Izard measures should consider that the arousal compo-attention.nent is not adequately represented in these scales. As anotherFrom a theoretical perspective, one important questionalternative, Mano and Oliver (1993) have developed a scaleconcerns the types of situational (e.g., time pressure, rou-made up of items taken from different emotion measures thattineness of the buying task) and atmospheric (e.g., brightdoes include arousal components. As an additional benefit oflights, loud music, crowded aisles) qualities of the grocery
store environment that enhance or inhibit different emotion the M-R measure, their dominance dimension may be relevant
111Describing and Measuring Emotional Response to Shopping Experience J Busn Res2000:49:101–111
of Crowding and Consumer Choice on the Service Experience.in studies where control over one’s environment is at issue,Journal of Consumer Research 18 (September 1991): 174–184.such as retail crowding, waiting time, and so forth. However,
Hui, M. K., Dube, L., and Chebat J. C.: The Impact of Music onin situations where the researcher wants to gauge a full rangeConsumers’ Reactions to Waiting for Services. Journal of Retailingof emotional reactions, the Izard and Plutchik measures are 73 (1997): 87–104.
the superior choice.Ittelson, W. H.: Environment Perception and Contemporary Percep-
Finally, the results indicate that researchers who desire to tual Theory. Environment and Cognition, W. H. Ittelson, ed. Semi-combine emotions together into separate positive and negative nar Press, New York. 1973.summary factors should do so with caution. Confirmatory Izard, C. E.: Human Emotions, Plenum, New York. 1977.factor analysis can aid in determining whether such a factor Mandler, G.: Mind and Emotion, John Wiley, New York. 1975.structure is appropriate. As illustrated by the results, mixing Mano, H., and Oliver, R. L.: Assessing the Dimensionality and Struc-conceptually separate emotion types can result in a nonsignifi- ture of the Consumption Experience: Evaluation, Feeling andcant finding for an overall summary factor that could be com- Satisfaction. Journal of Consumer Research 13 (December 1993):
418–430.prised of distinct emotion types with various effects of theirMehrabian, A., and Russell, J. A.: An Approach to Environmentalown. This could, in turn, lead to losing important information
Psychology, MIT Press, Cambridge, MA. 1974.regarding the specific nature of the effects.Oliver, R. L.: Cognitive, Affective, and Attribute Bases of the Satisfac-
tion Response. Journal of Consumer Research 20 (December 1993):The authors thank Dogan Eroglu and Susan Powell Mantel for their assistance418–430.with this project. The project was supported, in part, by a University of
Oliver, R. L.: Satisfaction: A Behavioral Perspective on the Consumer,Cincinnati CBA Summer Faculty Research Grant.McGraw-Hill, New York. 1997.
Peter, J. P.: Construct Validity: A Review of Basic Issues and MarketingReferences Practices. Journal of Marketing Research 18 (May 1981): 3–13.Batra, R., and Holbrook, M. B.: Developing a Typology of Affective Plutchik, R.: Emotion: A Psychoevolutionary Synthesis, Harper and Row,
Responses to Advertising: A Test of Validity and Reliability. Psy- New York. 1980.chology and Marketing 7 (Spring 1990): 11–25.
Purcell, A. T.: Environmental Peception and Affect: A Schema Dis-Batra, R., and Ray, L. R.: Affective Responses Mediating Acceptance crepancy Model. Environment and Behavior 18 (January 1986):
of Advertising. Journal of Consumer Research 13 (September 1986): 3–30.234–249. Russell, J. A.: Affective Space Is Bipolar. Journal of Personality and
Cohen, J. B.: Attitude, Affect and Consumer Behavior, in Affect and Social Psychology 37 (September 1979): 345–356.Social Behavior, B. S. Moore and A. M. Isen, eds., Cambridge Russell, J. A.: A Circumplex Model of Affect. Journal of PersonalityUniversity Press, New York. 1990, pp. 152–206. and Social Psychology 39 (December 1980): 1161–1178.
Darden, R. W., and Babin, B. J.: Exploring the Concept of Affective Russell, J. A., and Pratt, G.: A Description of the Affective QualityQuality: Expanding the Concept of Retail Personality. Journal of Attributed to Environments. Journal of Personality and Social Psy-Business Research 29 (1994): 101–109. chology 38 (1980): 311–322.
Donovan, R. J.. and Rossiter, J. R.: Store Atmosphere: An Environ- Sherman, E., Mathur, A., and Smith, R. B.: Store Environment andmental Psychology Approach. Journal of Retailing 58 (Spring Consumer Purchase Behavior: Mediating Role of Consumer Emo-1982): 34–57. tions. Psychology and Marketing 14 (July 1997): 361–378.
Eroglu, S. A., and Harrell, G. D.: Retail Crowding: Theoretical and Sheth, J. N.: Consumer Behavior: Shortages and Surpluses, in Ad-Strategic Implications. Journal of Retailing 62 (1986): 347–363. vances in Consumer Research, A. A. Mitchell, ed., ACR, Ann Arbor,
MI. 1982, pp. 13–16.Havlena, W. J., and Holbrook, M. B.: The Varieties of ConsumptionExperience: Comparing Two Types of Typologies of Emotion in Snedecor, G. W., and Cochran, W. G.: Statistical Methods, The IowaConsumer Behavior. Journal of Consumer Research 13 (December State University Press, Ames, IA. 1980.1986): 394–404. Westbrook, R. A.: Product/Consumption-Based Affective Responses
Holbrook, M. B., Chestnut, R. W., Oliva T. A., and Greenleaf, E. A.: and Postpurchase Processes. Journal of Marketing Research 24 (Au-Play as a Consumption Experience: The Role of Emotions, Perfor- gust 1987): 258–270.mance and Personality in the Enjoyment of Games. Journal of Westbrook, R. A., and Oliver, R. L.: The Dimensionality of Consump-Consumer Research 11 (September 1984): 728–739. tion Emotion Patterns and Consumer Satisfaction. Journal of Con-
sumer Research 18 (June 1991): 84–91.Hui, M. K., and Bateson, E. G.: Perceived Control and the Effects
Related Documents