Describe the motion in the following illustrations Ticker tapes reveal data on which two kinematic variables?

Describe the motion in the following illustrations Ticker tapes reveal data on which two kinematic variables?
Dec 13, 2015
Welcome message from author
This document is posted to help you gain knowledge. Please leave a comment to let me know what you think about it! Share it to your friends and learn new things together.
Transcript
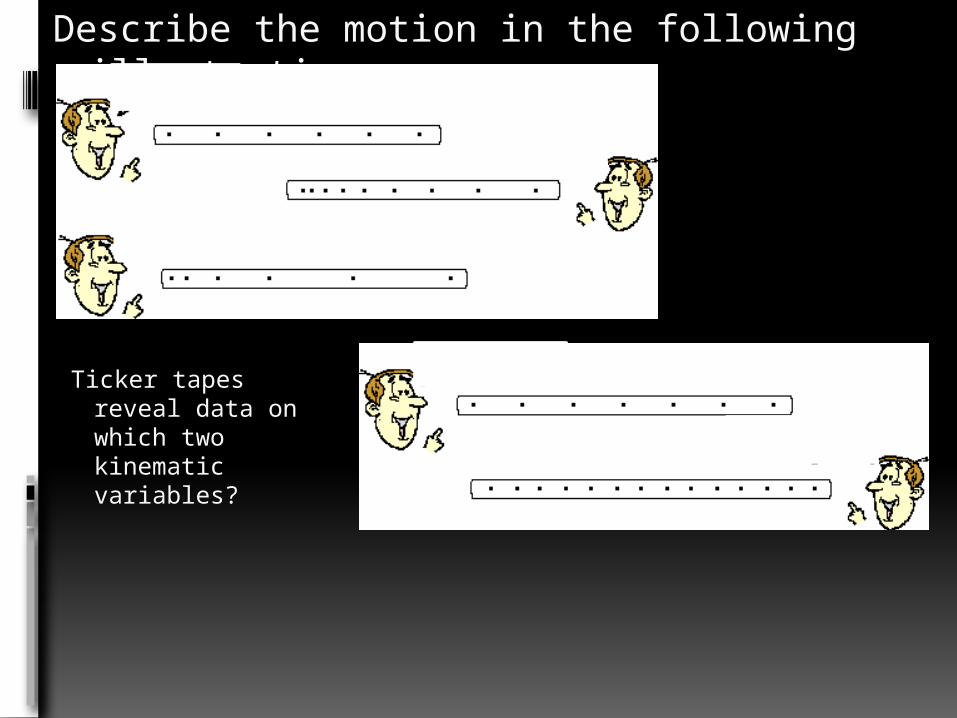
Describe the motion in the following illustrations
Ticker tapes reveal data on which two kinematic variables?

Match each d-t graph to the proper v-t & a-t graph
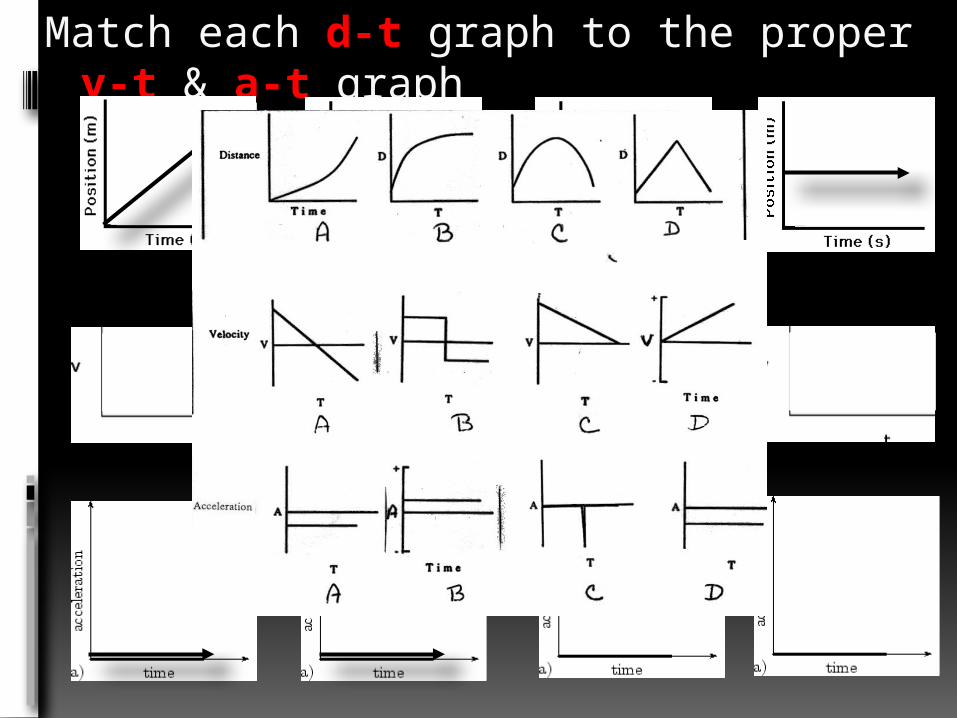
Match each d-t graph to the proper v-t & a-t graph

2D KINEMATIC – ALGEBRA REVIEW
• Review yesterdays lesson with 3 practice problems
SP
H 3
U
Gra
de 1
1 U
Ph
ysic
s
2
010

Motion in Two Dimensions –Problem Set

1
2
3
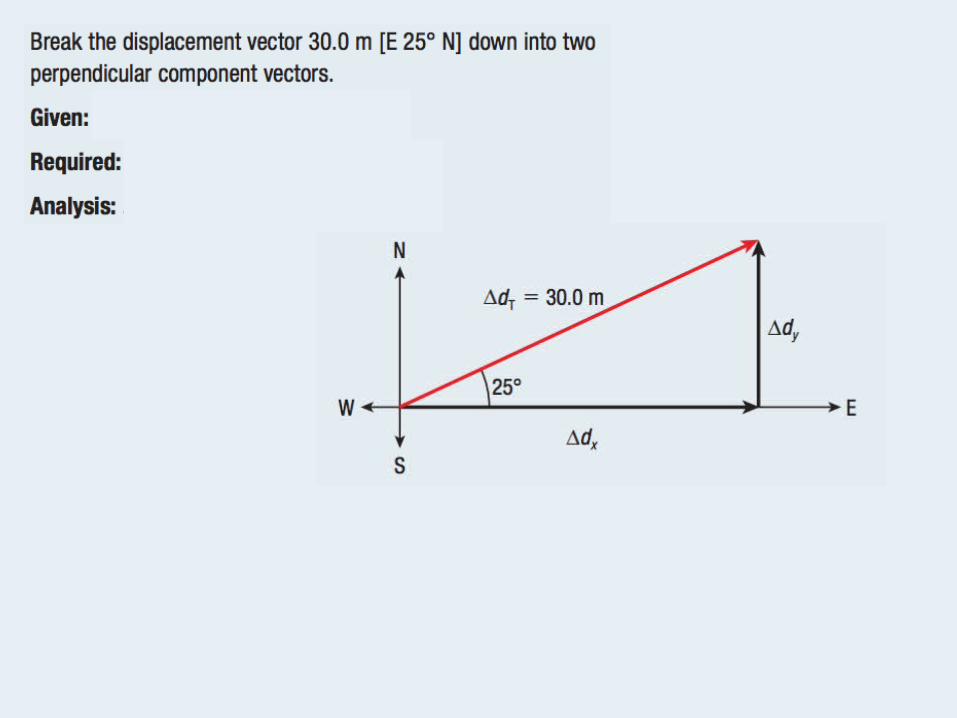

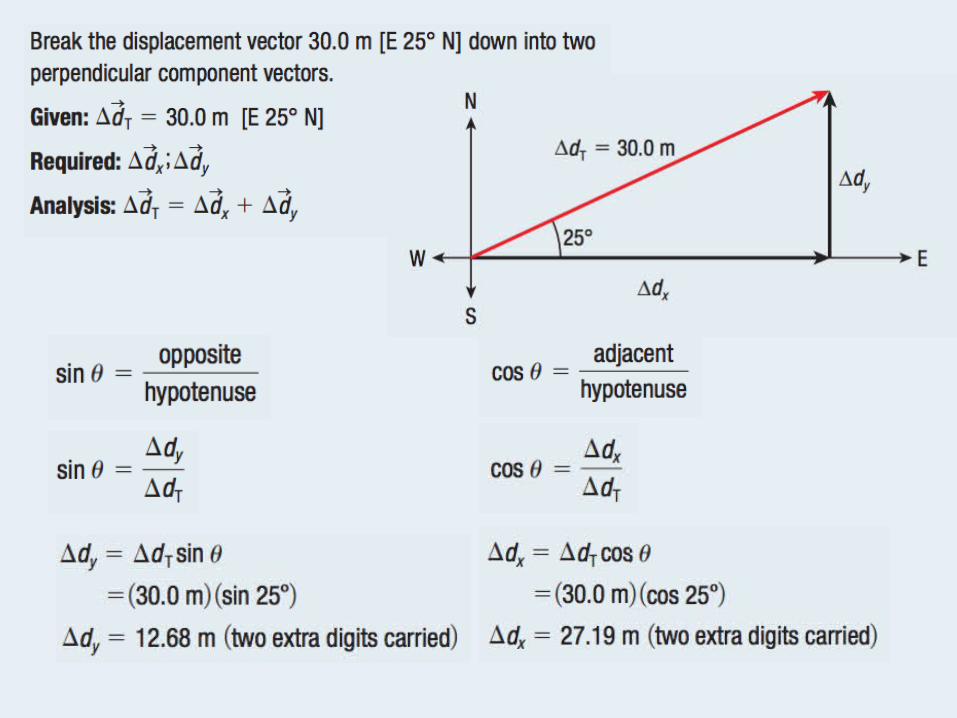

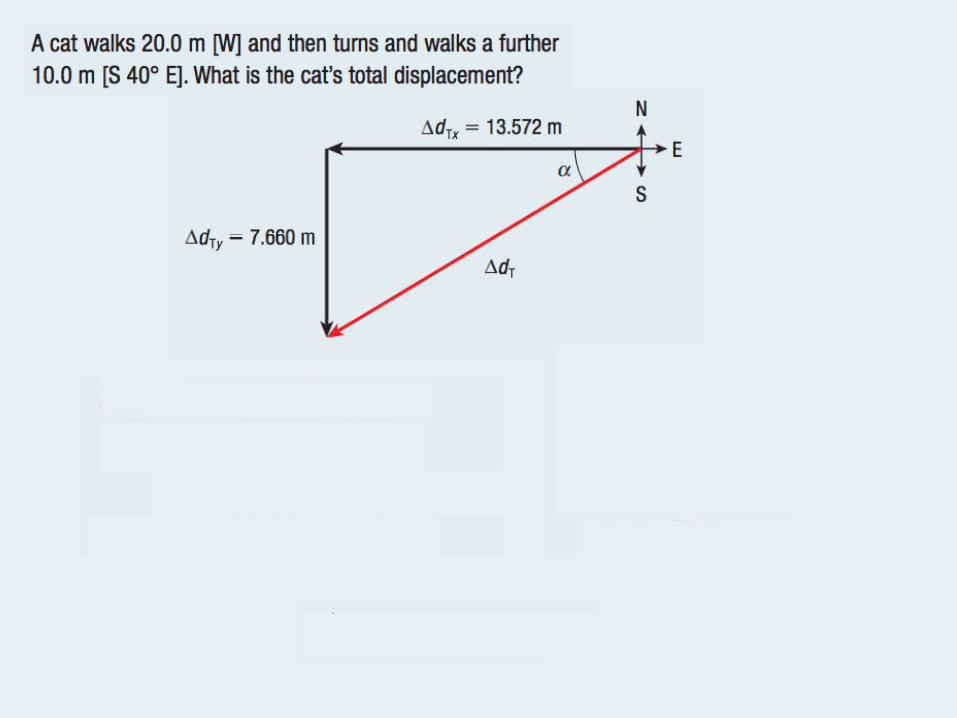
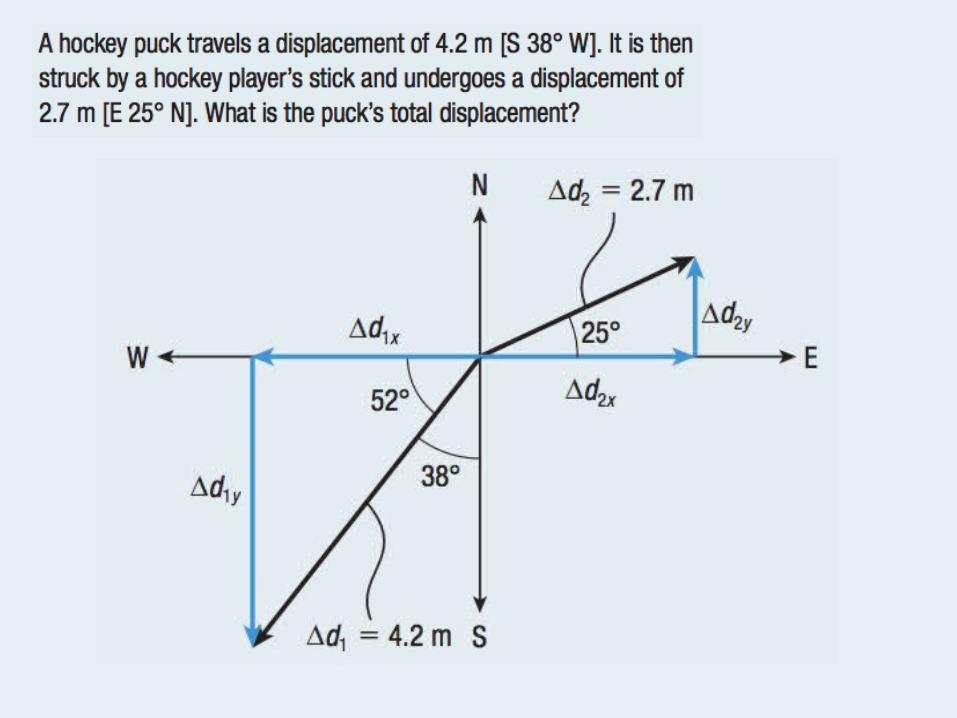
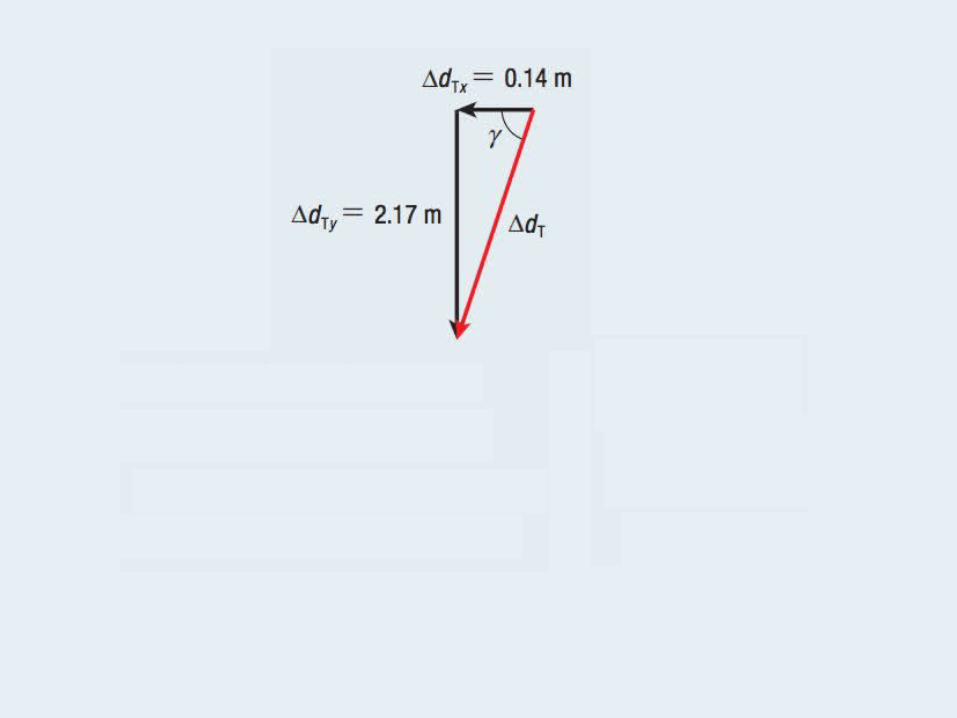
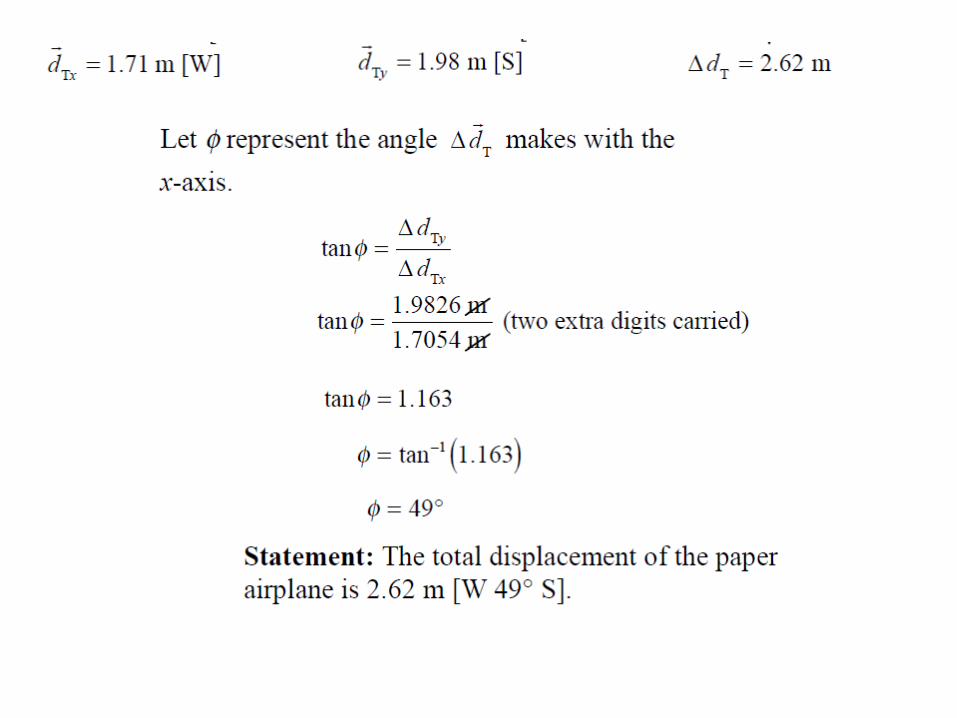
Now we have two perpendicular vectors:
make a right triangle!

Now we have two perpendicular vectors:
make a right triangle!


How did we do?
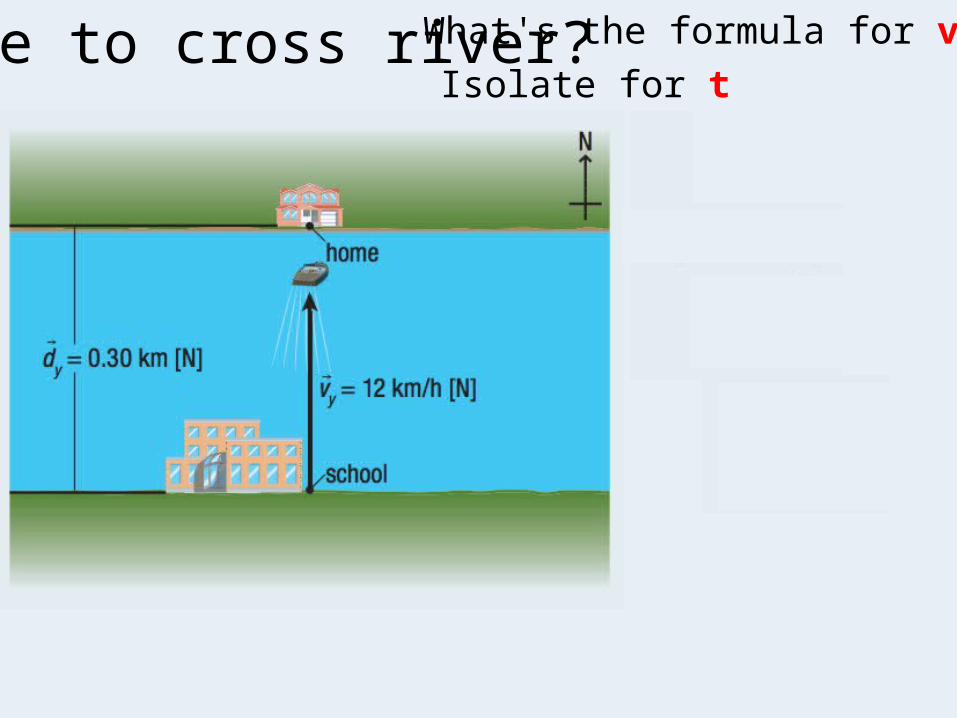
Time to cross river?Isolate for tWhat's the formula for v?

Time to cross river?Isolate for t !What's the formula for v?

Time to cross river?
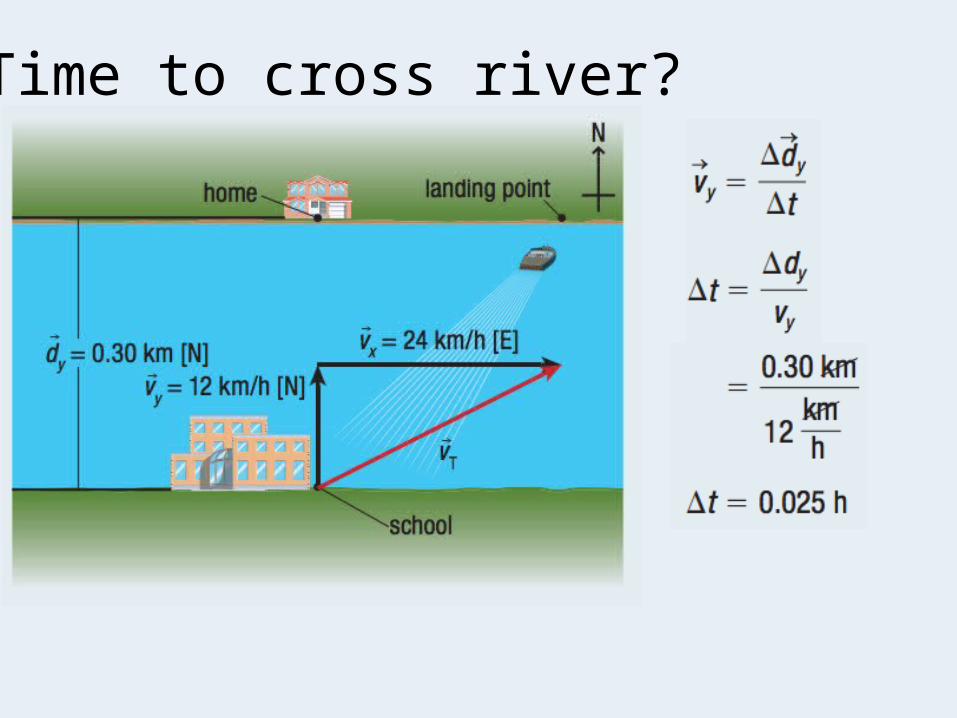
Time to cross river?

Time to cross depends on y-velocity only
“Current” or x-velocity just pushes you
downstream as you cross
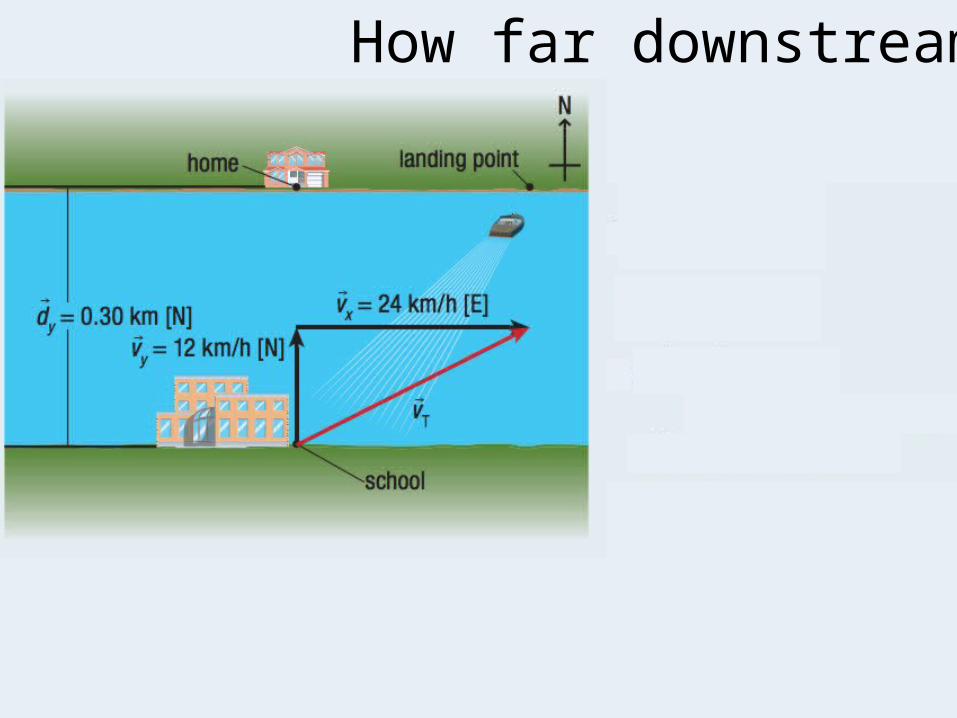
How far downstream?
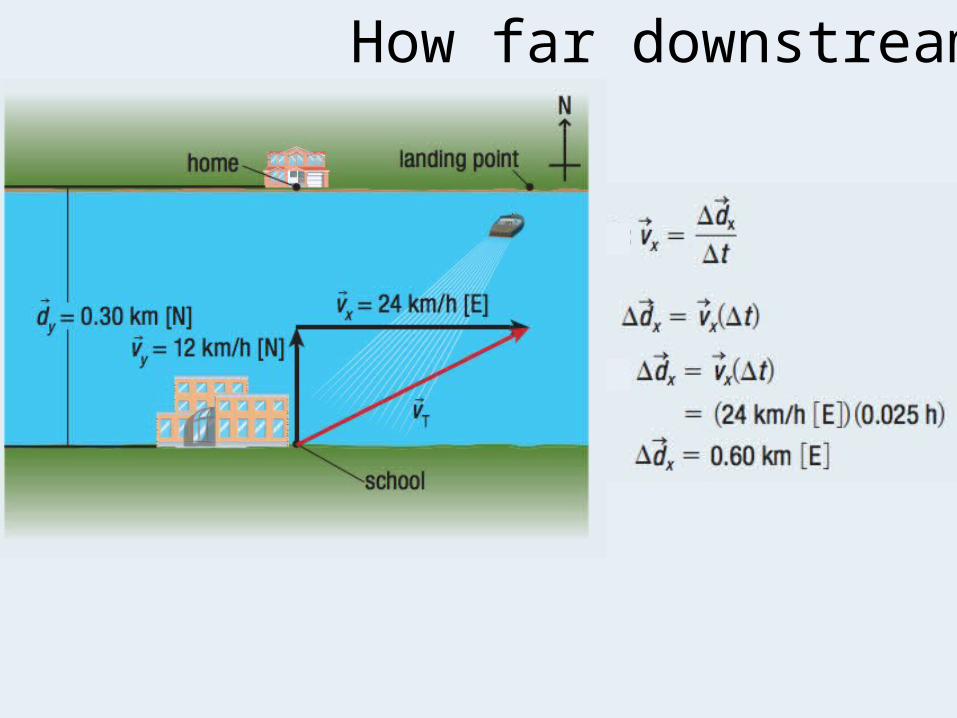
How far downstream?

Resultant velocity?

Resultant velocity?

Resultant velocity?


Lets look at our 5 vector problem from yesterday– Ie.
• 10m N30ºE = V1 • 13m E15ºN = V2• 21m E83ºN = V3• 20m W45ºN = V4• 11m N72ºE = V5
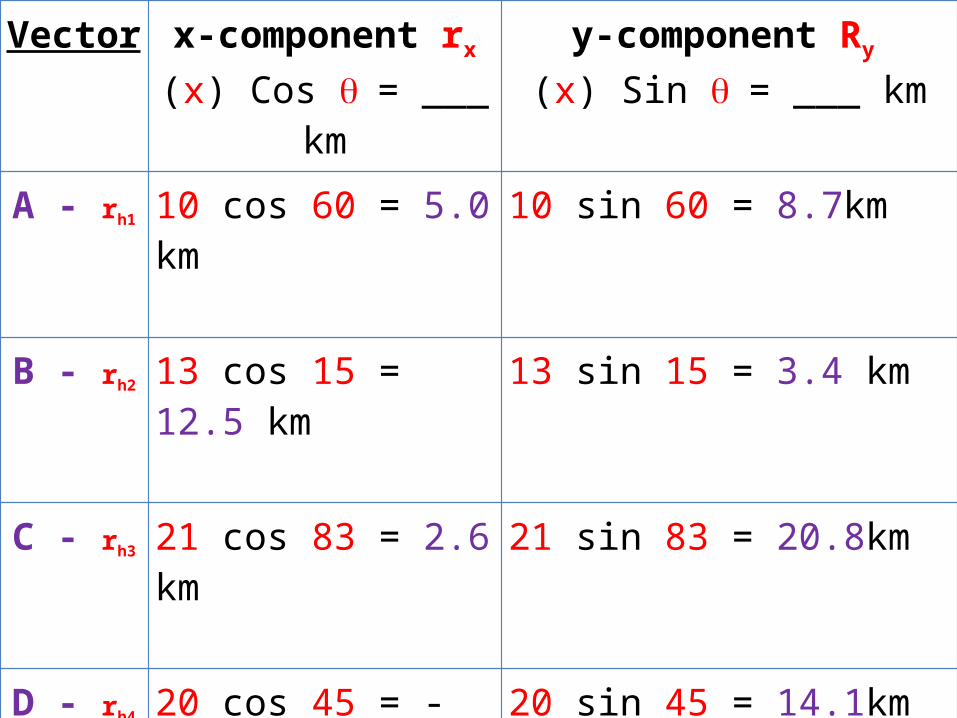
Vector x-component rx
(x) Cos q = ___ kmy-component Ry
(x) Sin q = ___ kmA - rh1 10 cos 60 = 5.0 km 10 sin 60 = 8.7km
B - rh2 13 cos 15 = 12.5 km 13 sin 15 = 3.4 km
C - rh3 21 cos 83 = 2.6 km 21 sin 83 = 20.8km
D - rh4 20 cos 45 = -14.1 km 20 sin 45 = 14.1km
E - rh5 11 cos 18 = 10.5 km 11 sin 18 = 3.4km
R - rh rx1 + rx2… = rxtotal
16.42 km [E]ry1 + ry2… = rytotal
50.4 km [N]
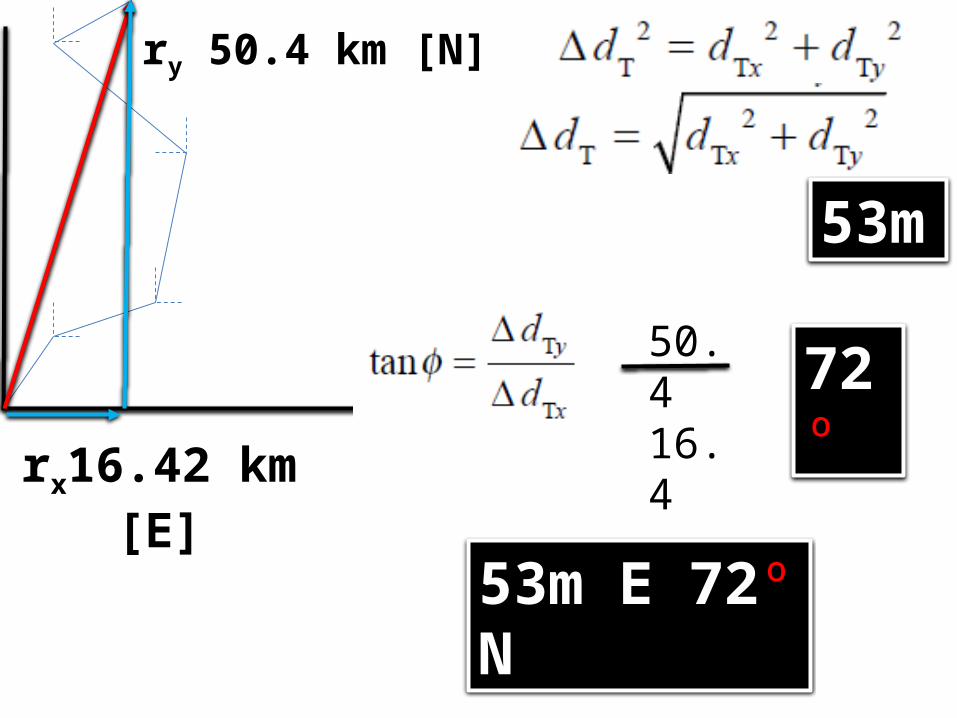
ry 50.4 km [N]
rx16.42 km [E]
53m E 72º N
53m
72º 50.4 16.4

Split up into 3 groups
• Create a multi-vector (2d) word problem– With solution
• Exchange your problem with the group to your right
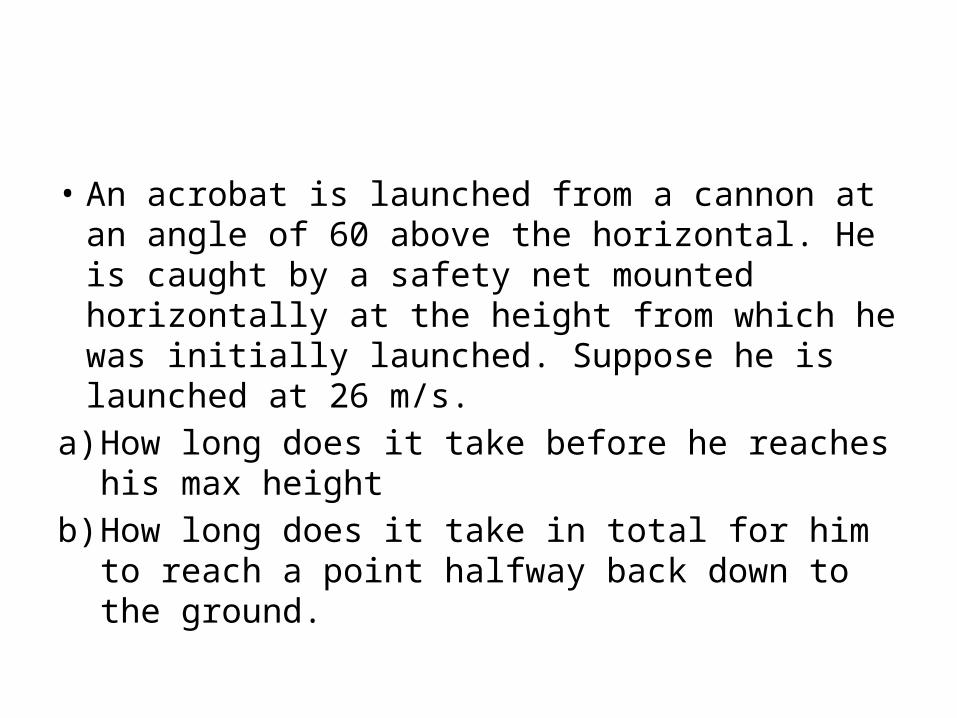
• An acrobat is launched from a cannon at an angle of 60 above the horizontal. He is caught by a safety net mounted horizontally at the height from which he was initially launched. Suppose he is launched at 26 m/s.
a) How long does it take before he reaches his max height
b) How long does it take in total for him to reach a point halfway back down to the ground.
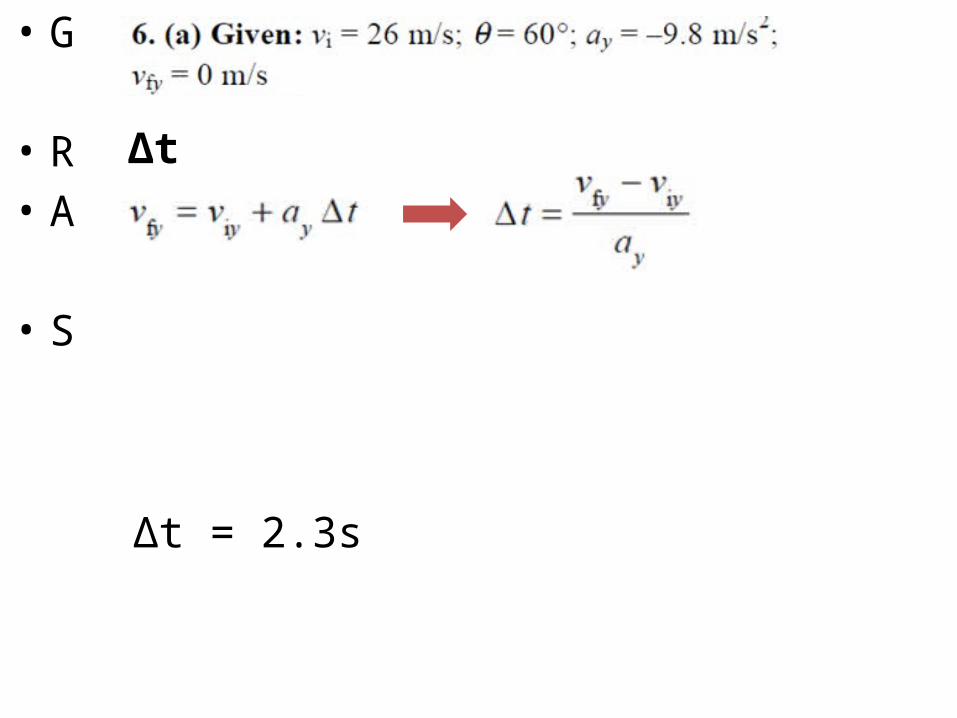
• G
• R• A
• S
Δt
Δt = 2.3s

• G
• R• A
• S
Δdy
Half or mid-height would be 13m – would occur twice
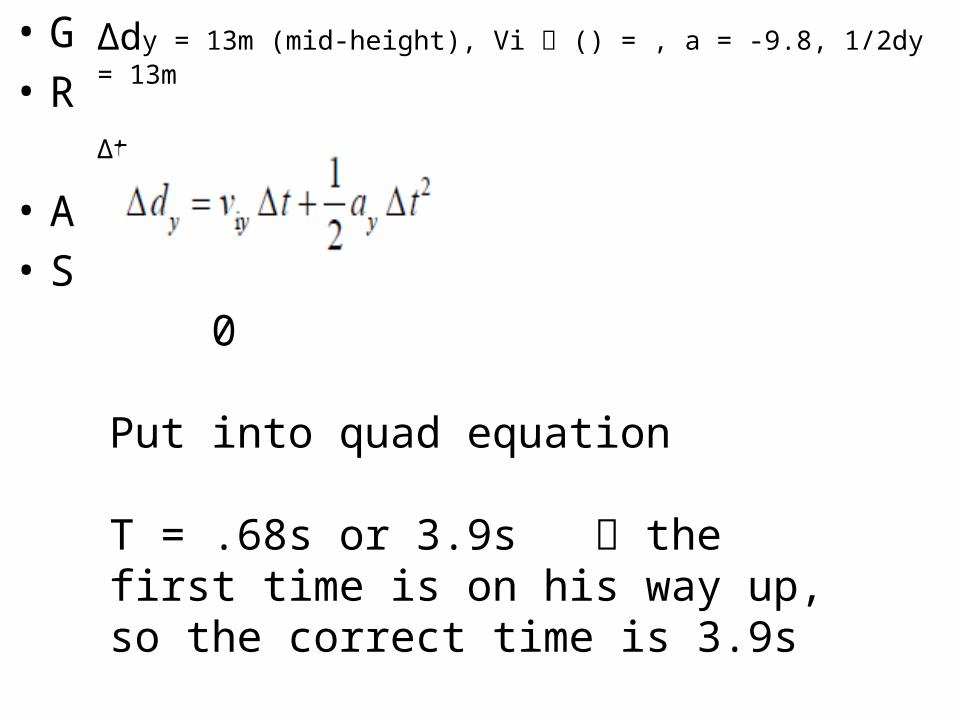
• G• R
• A• S
Δdy = 13m (mid-height), Vi () = , a = -9.8, 1/2dy = 13m
Δt
0
Put into quad equation
T = .68s or 3.9s the first time is on his way up, so the correct time is 3.9s


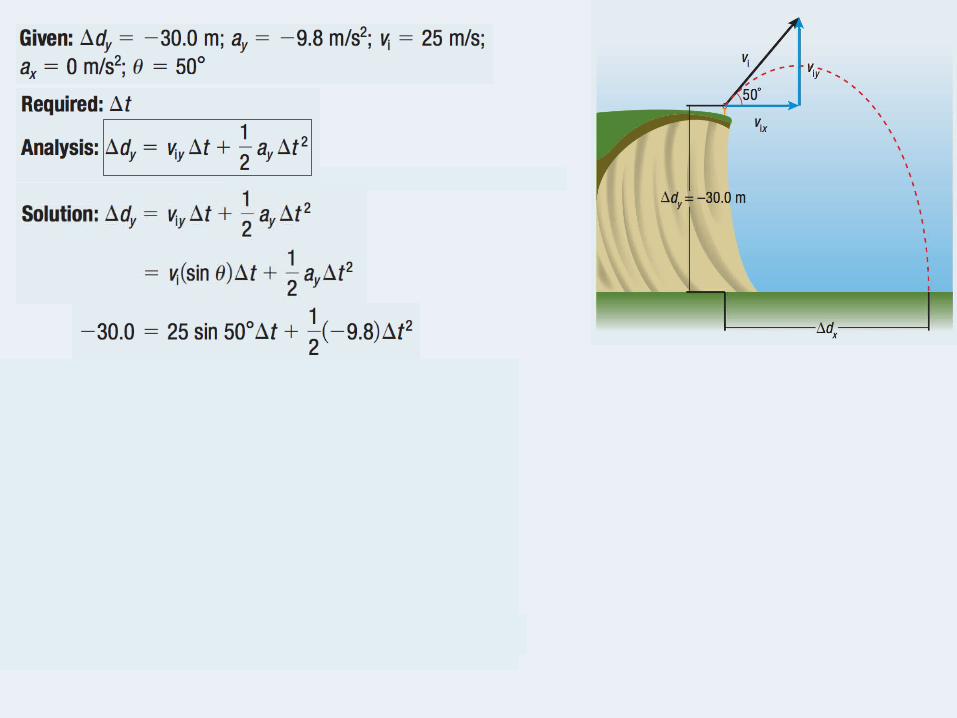

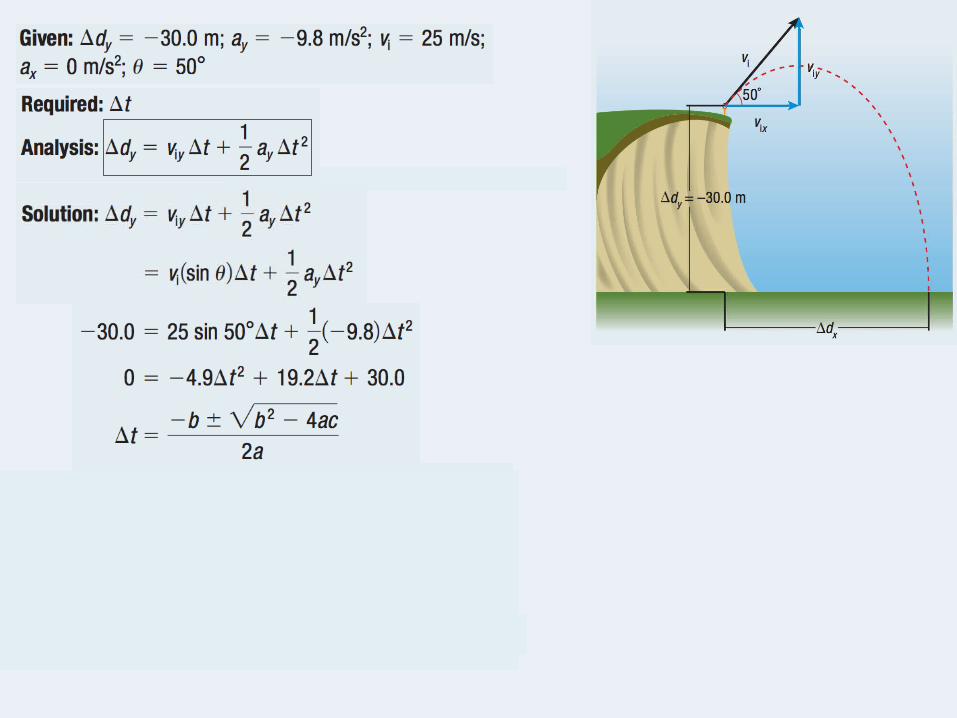


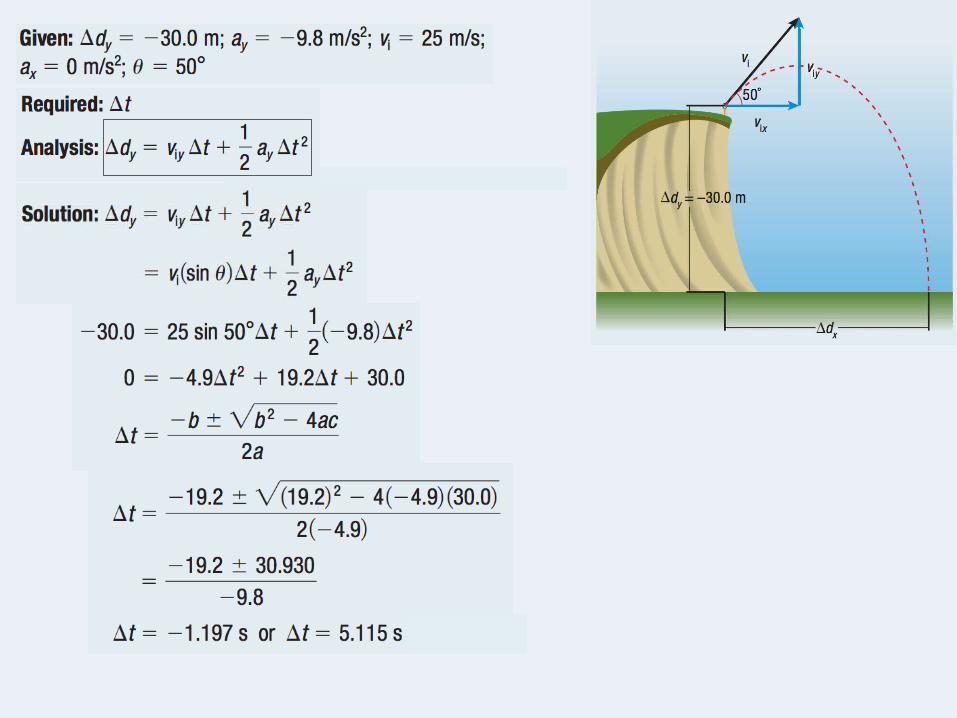

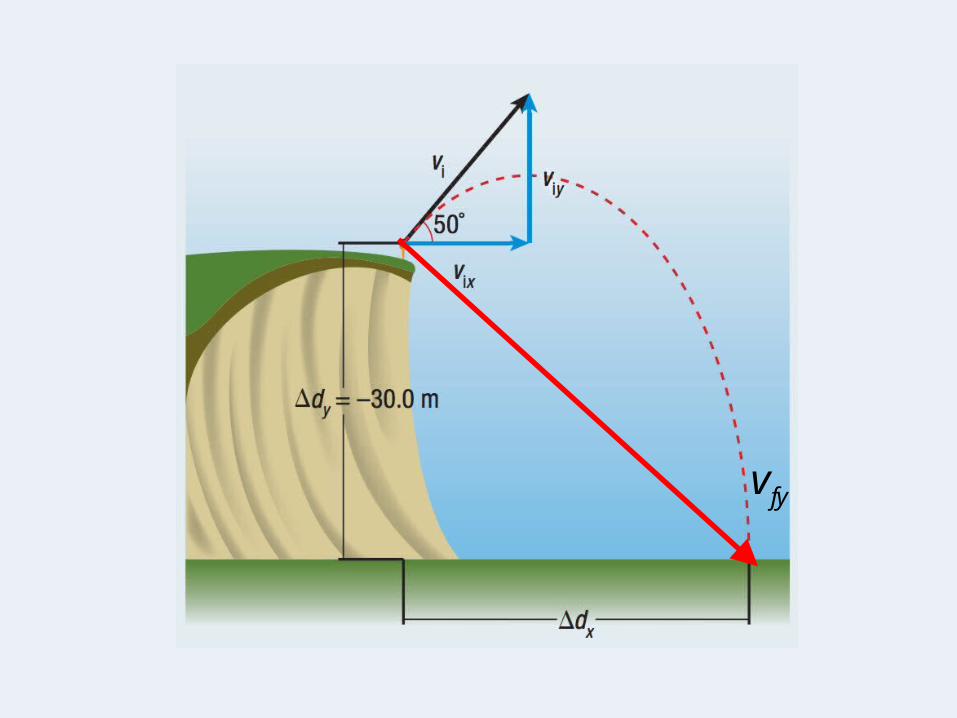
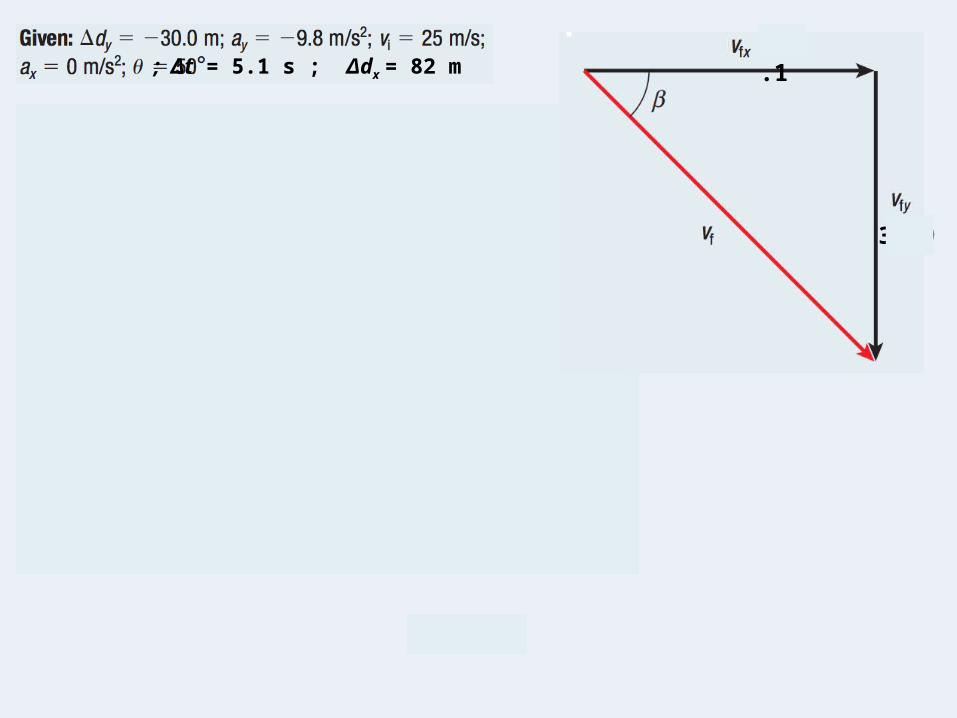
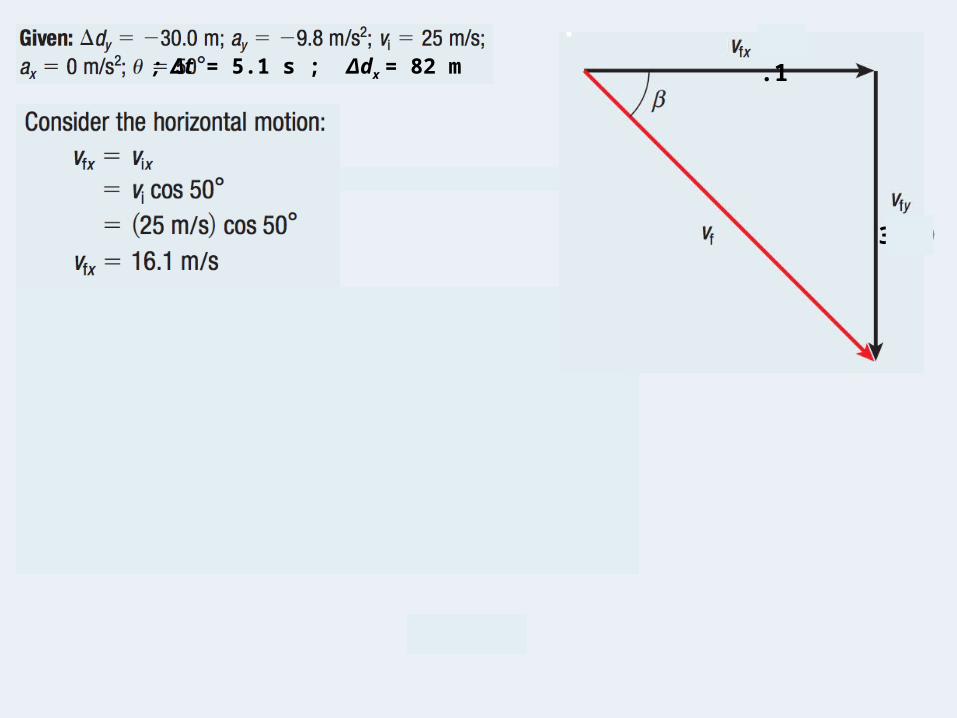
; Δt = 5.1 s

; Δt = 5.1 s
; Δt = 5.1 s
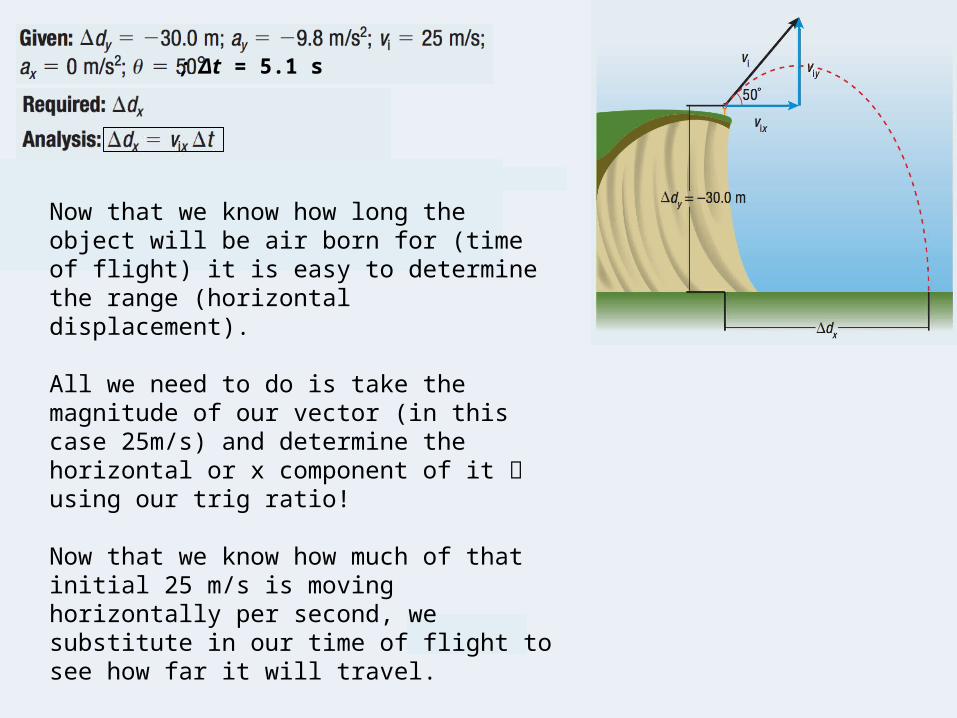
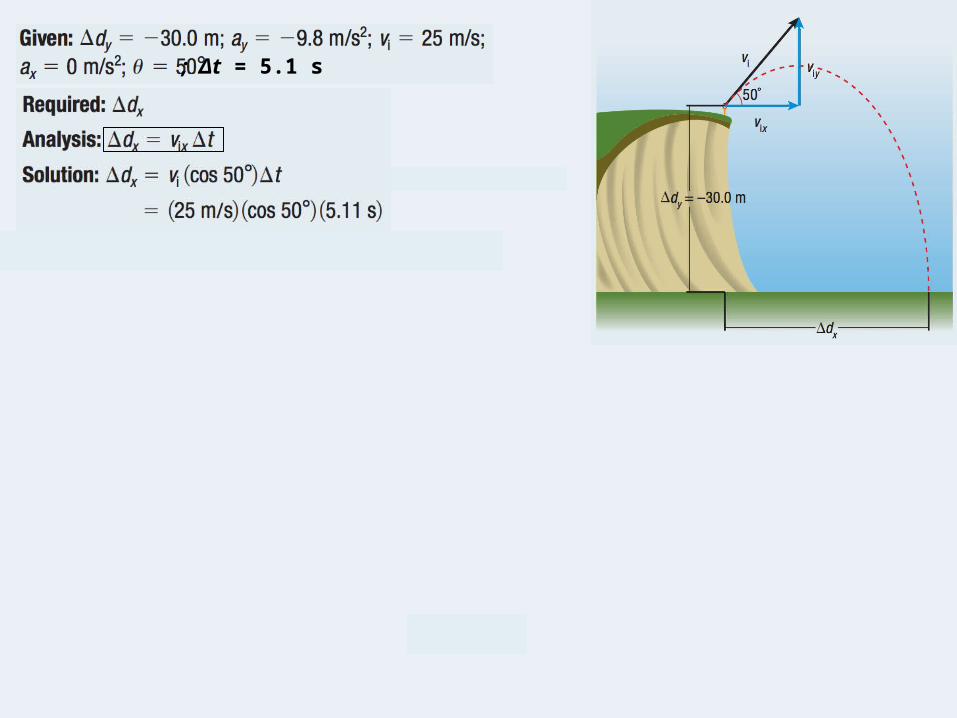
Now that we know how long the object will be air born for (time of flight) it is easy to determine the range (horizontal displacement).
All we need to do is take the magnitude of our vector (in this case 25m/s) and determine the horizontal or x component of it using our trig ratio!
Now that we know how much of that initial 25 m/s is moving horizontally per second, we substitute in our time of flight to see how far it will travel.
; Δt = 5.1 s

; Δt = 5.1 s

fyv
16.1
30.9

16.1
30.9
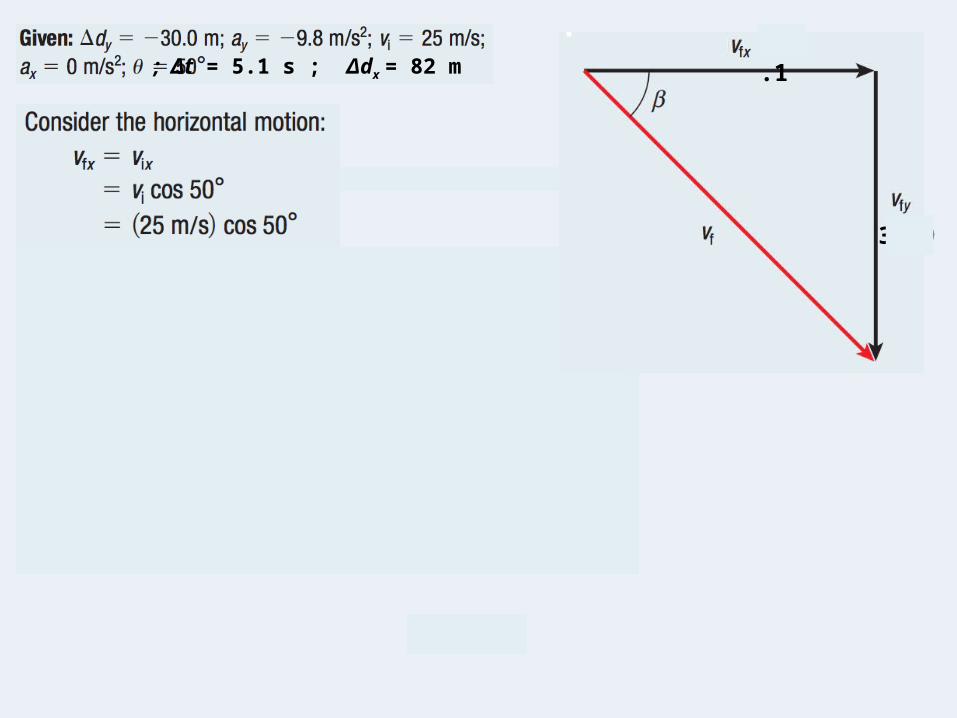
; Δt = 5.1 s ; Δdx = 82 m16.1
30.9

; Δt = 5.1 s ; Δdx = 82 m16.1
30.9

; Δt = 5.1 s ; Δdx = 82 m16.1
30.9
; Δt = 5.1 s ; Δdx = 82 m16.1
30.9
; Δt = 5.1 s ; Δdx = 82 m16.1
30.9

; Δt = 5.1 s ; Δdx = 82 m16.1
30.9
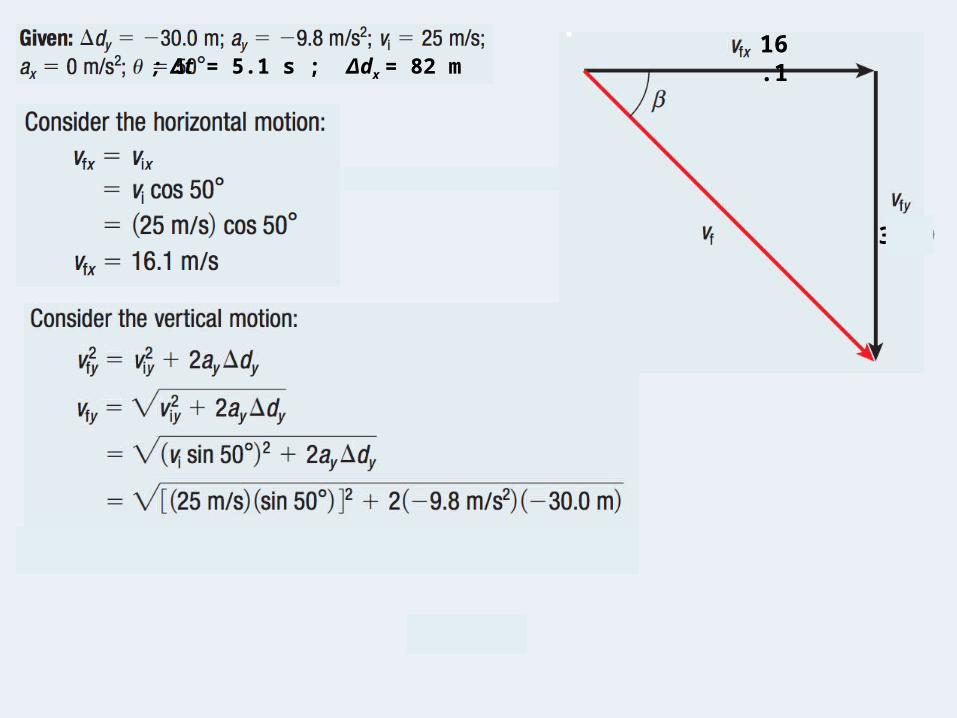
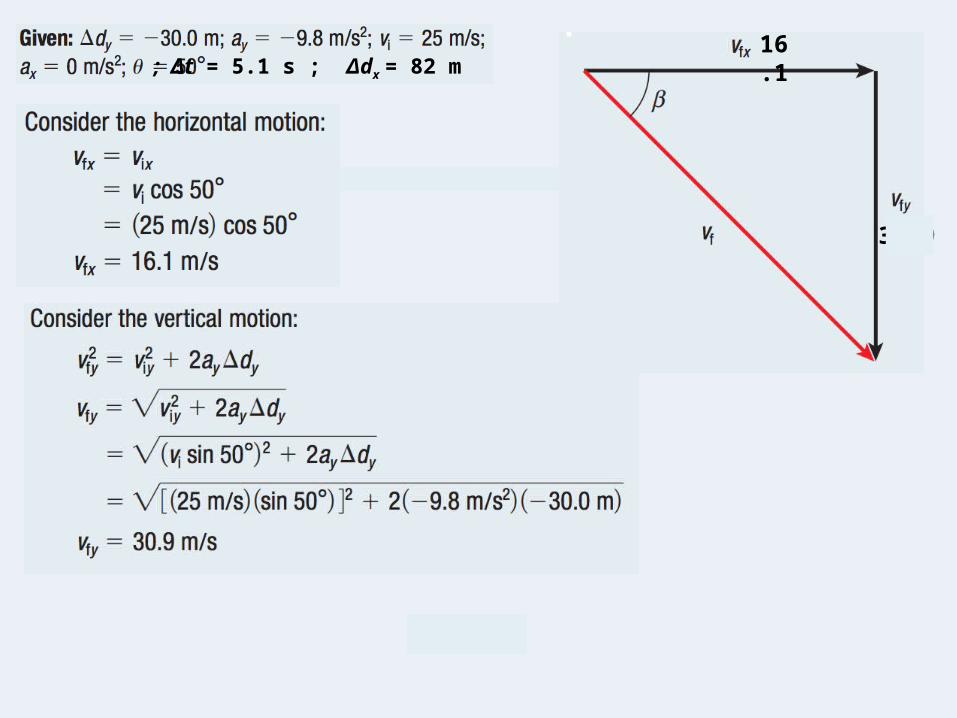
Since we have uniform acceleration (via gravity) we can use 1 of our 5 acceleration formula’s…. We must determine which variable we are missing and select our formula accordingly.
In this case equation 4!

; Δt = 5.1 s ; Δdx = 82 m16.1
30.9

; Δt = 5.1 s ; Δdx = 82 m16.1
30.9
; Δt = 5.1 s ; Δdx = 82 m16.1
30.9
; Δt = 5.1 s ; Δdx = 82 m16.1
30.9

; Δt = 5.1 s ; Δdx = 82 m16.1
30.9

; Δt = 5.1 s ; Δdx = 82 m16.1
30.9
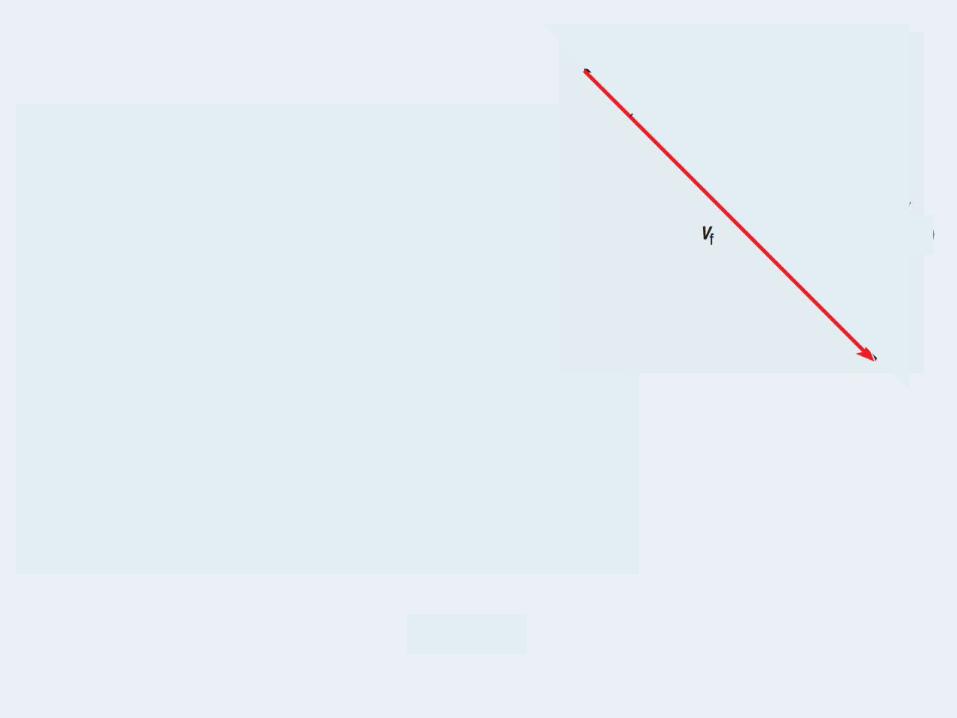
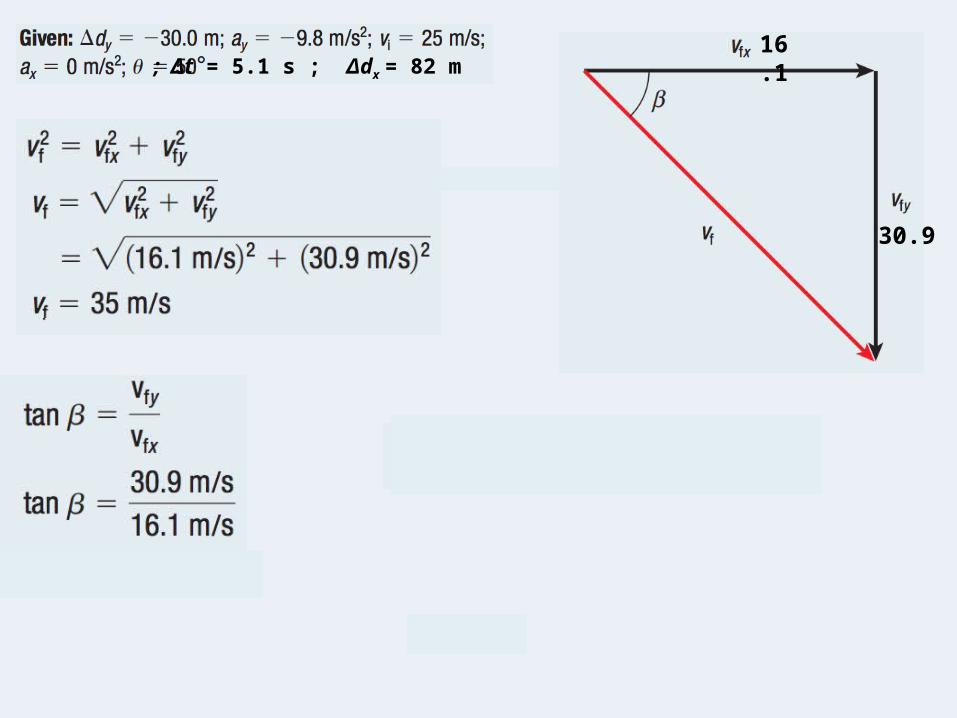
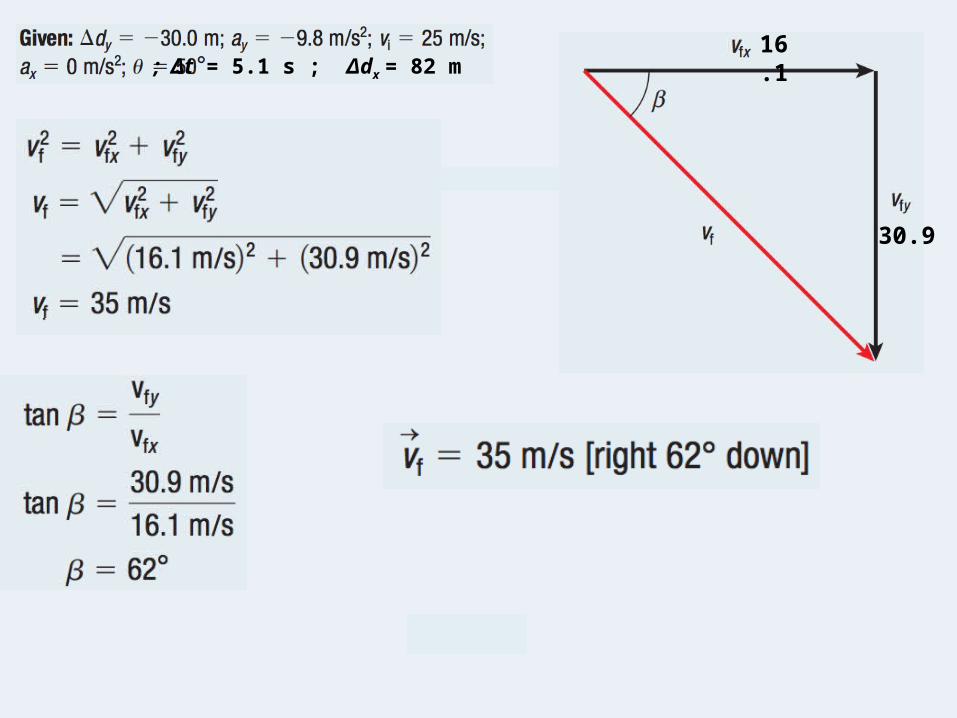
Similar to displacement vectors, we can now use Pythagorean theorem to determine the resultant vector of this right angle triangle.
This is the convenient thing about using the component vector process – by breaking every movement (whether it be a velocity or a displacement) into its sub-components (i.e. a vertical and a horizontal) we can determine the resultant vector rather easily.
In this case, as the diagram to the right highlights… we have the final velocity in the horizontal direction and the final velocity in the vertical direction… by determining the resultant vector we should get the overall final velocity and the angle at which it is travelling

; Δt = 5.1 s ; Δdx = 82 m16.1
30.9

; Δt = 5.1 s ; Δdx = 82 m16.1
30.9

; Δt = 5.1 s ; Δdx = 82 m16.1
30.9

; Δt = 5.1 s ; Δdx = 82 m16.1
30.9

; Δt = 5.1 s ; Δdx = 82 m16.1
30.9
; Δt = 5.1 s ; Δdx = 82 m16.1
30.9

; Δt = 5.1 s ; Δdx = 82 m16.1
30.9
We can check out answer by using our trig ratio’s to see if we still get the same horizontal and vertical sub-components
Vfx = 35 cos62Vfx = 16.4 m/s
Vfy = 35 sin62Vfy = 30.9 m/s
; Δt = 5.1 s ; Δdx = 82 m16.1
30.9
Related Documents