www.nseindia.com Derivatives Market ISMR 159 Derivatives Market Introduction The emergence and growth of market for derivative instruments can be traced back to the willingness of risk-averse economic agents to guard themselves against uncertainties arising out of fluctuations in asset prices. Derivatives are meant to facilitate hedging of price risk of inventory holding or a financial/commercial transaction over a certain period. They serve as instruments of risk management. By locking-in asset prices, derivative products minimize the impact of fluctuations in asset prices on the profitability and cash flow situation of risk-averse investors. By providing investors and issuers with a wider array of tools for managing risks and raising capital, derivatives improve the allocation of credit and the sharing of risk in the global economy, lowering the cost of capital formation and stimulating economic growth. Now that world markets for trade and finance have become more integrated, derivatives have strengthened these important linkages between global markets, increasing market liquidity and efficiency and are seen to be facilitating the flow of trade and finance. The financial derivatives gained prominence in post-1970 period due to growing instability in the financial markets and became very popular, accounting for about two-thirds of total transactions in derivative products. In the recent years, the market for financial derivatives has grown both in terms of variety of instruments available, their complexity and turnover. Financial derivatives have changed the world of finance through creation of innovative ways to comprehend measure and manage risks. India’s tryst with equity derivatives began in the year 2000 on the NSE and BSE. Trading first commenced in Index futures contracts, followed by index options in June 2001, options in individual stocks in July 2001 and futures in single stock derivatives in November 2001. Since then, equity derivatives have come a long way. New products; expanding list of eligible investors; rising volumes and best of risk management framework for exchange traded derivatives have been the hallmark of the journey of equity derivatives so far. India’s experience with the launch of equity derivatives market has been extremely positive. The derivatives turnover on the NSE has surpassed the equity market turnover. The turnover of derivatives on the NSE increased from Rs. 23,654 million (US $ 207 million) in 2000-01 to Rs. 110,104,821 million (US $ 2,161 bn) in 2008-09. The average daily turnover in this segment of the markets on the NSE was Rs. 453,106 mn in 2008-09. India is one of the most successful developing countries in terms of a vibrant market for exchange-traded derivatives. This reiterates the strengths of the modern development of India’s securities markets, which are based on nationwide market access, anonymous electronic trading, and a predominantly retail market. There is an increasing sense that the equity derivatives market is playing a major role in shaping price discovery.

Welcome message from author
This document is posted to help you gain knowledge. Please leave a comment to let me know what you think about it! Share it to your friends and learn new things together.
Transcript
www.nseindia.com
Derivatives Market ISMR159
Derivatives Market
Introduction
The emergence and growth of market for derivative instruments can be traced back to the willingness of risk-averse economic agents to guard themselves against uncertainties arising out of fl uctuations in asset prices. Derivatives are meant to facilitate hedging of price risk of inventory holding or a fi nancial/commercial transaction over a certain period. They serve as instruments of risk management. By locking-in asset prices, derivative products minimize the impact of fl uctuations in asset prices on the profi tability and cash fl ow situation of risk-averse investors. By providing investors and issuers with a wider array of tools for managing risks and raising capital, derivatives improve the allocation of credit and the sharing of risk in the global economy, lowering the cost of capital formation and stimulating economic growth. Now that world markets for trade and fi nance have become more integrated, derivatives have strengthened these important linkages between global markets, increasing market liquidity and effi ciency and are seen to be facilitating the fl ow of trade and fi nance.
The fi nancial derivatives gained prominence in post-1970 period due to growing instability in the fi nancial markets and became very popular, accounting for about two-thirds of total transactions in derivative products. In the recent years, the market for fi nancial derivatives has grown both in terms of variety of instruments available, their complexity and turnover. Financial derivatives have changed the world of fi nance through creation of innovative ways to comprehend measure and manage risks.
India’s tryst with equity derivatives began in the year 2000 on the NSE and BSE. Trading fi rst commenced in Index futures contracts, followed by index options in June 2001, options in individual stocks in July 2001 and futures in single stock derivatives in November 2001. Since then, equity derivatives have come a long way. New products; expanding list of eligible investors; rising volumes and best of risk management framework for exchange traded derivatives have been the hallmark of the journey of equity derivatives so far.
India’s experience with the launch of equity derivatives market has been extremely positive. The derivatives turnover on the NSE has surpassed the equity market turnover. The turnover of derivatives on the NSE increased from Rs. 23,654 million (US $ 207 million) in 2000-01 to Rs. 110,104,821 million (US $ 2,161 bn) in 2008-09. The average daily turnover in this segment of the markets on the NSE was Rs. 453,106 mn in 2008-09.
India is one of the most successful developing countries in terms of a vibrant market for exchange-traded derivatives. This reiterates the strengths of the modern development of India’s securities markets, which are based on nationwide market access, anonymous electronic trading, and a predominantly retail market. There is an increasing sense that the equity derivatives market is playing a major role in shaping price discovery.

www.nseindia.com
Derivatives MarketISMR 160
Table 7.1: Benchmark Indices Contracts & Volume in futures & Options Segment of NSE for the fi scal 2008-09 and the quarter (April 2009- June 2009)
Indices/ Period No of Contracts
Traded Value (Rs. Mn.)
Traded Value (US $ Mn.)
Percentage of
Contracts to total
contracts
No of Contracts
Traded Value (Rs. Mn.)
Traded Value (US $ Mn.)
Percentage of
Contracts to total
contracts
Index Futures
2008-09 April 2009-June 2009
NIFTY 184,877,940 3,338,319 65,521 43.76 43,805,244 853,774 17,835 35.31
MINIFTY 18,079,260 127,076 2,494 4.28 5,223,831 40,340 843 4.21
BANKNIFTY 7,360,831 102,690 2,016 1.74 2,450,827 71,763 1,499 1.98
CNXIT 99,171 1,781 35 0.02 7,883 233 5 0.01
JUNIOR 6,370 128 3 0.00 22 1 0 0.00
NFTYMCAP50 1,669 30 1 0.00 15 1 0 0.00
CNX100 154 3 0 0.00 35 1 0 0.00
DEFTY 2,708 84 2 0.00 0 0 0 0.00
Index Options
NIFTY 211,942,965 3,729,509 73,199 50.16 72,472,369 1,427,733 29,825 58.42
MINIFTY 27,819 190 4 0.01 25,448 203 4 0.02
BANKNIFTY 112,555 1,686 33 0.03 62,071 1,580 33 0.05
CNXIT 4,314 89 2 0.00 0 0 0 0.00
JUNIOR 0 0 0 0.00 0 0 0 0.00
NFTYMCAP50 790 28 1 0.00 7,219 430 9 0.01
CNX100 0 0 0 0.00 46 1 0 0.00
DEFTY 1 0 0 0.00 0 - - 0.00
Total of all Indices 422,516,547 7,301,613.28 143,309 100.00 124,055,010 2,396,059.44 50,053 100.00
Total of Nifty IndexFutures and Options
396,820,905 7,067,827 138,721 93.92 116,277,613 2,281,507 47,660 93.73
(w.e.f. 31-07-2009 contracts on DEFTY, CNX 100 and JUNIOR have been discountinued.)
Global Derivatives Markets1. As per the FIA Annual Volume Survey, 2008-09 was a turbulent year for the derivatives markets following the
events surrounding the Lehman Brothers’ bankruptcy and its after effects seen throughout the global fi nancial world. Despite all the turbulence, the overall growth trend in Futures and Options was still positive. The total number of futures and options contracts traded on the 69 exchanges tracked by the Futures Industry Association was USD 17.65 billion during January to December 2008, an increase of 13.69% over 2007. Volume in the U.S., the epicenter of the credit crisis, rose 14% from 2007 and in Europe and Asia by 16%.
Looking at global trends in derivatives volume by category, we fi nd that Equity futures and options, both index and single stock and commodity products were the most powerful drivers of increase in volumes of exchange traded derivative contracts in 2008. The trading in foreign currency derivatives grew at 25.5% in 2008 (Table 7-2).
However, with the credit crisis the trading of interest rate products was greatly reduced. On a global basis, interest rate volumes went down by 14.4% relative to 2007, the fi rst time in many years the markets have had such a

www.nseindia.com
Derivatives Market ISMR161
big setback. Long-term interest rate futures were especially hard hit. Ten-year Treasury futures trading tumbled 26.5% from 2007; Euro bund futures fell 23.8%; and JGB futures slid 21.5%. Short-term interest rate products were mixed, with Euribor futures up slightly, Eurodollar futures down slightly, and Euroyen futures way downby 42.6%.
Table 7-2: Global Exchange traded derivatives volume by category(in millions)
GLOBAL Jan-Dec 2008 Jan-Dec 2007 (%) Change
Equity Indices 6,488.62 5,499.83 17.98
Individual Equities 5,511.19 4,400.44 25.24
Interest Rate 3,204.84 3,745.18 -14.43
Agricultural 888.83 640.68 38.73
Energies 580.4 496.77 16.83
Currency 577.16 459.75 25.54
Precious Metals 180.37 150.98 19.47
Non-precious metals 175.79 106.86 64.50
Others 45.5 26.14 74.06
Total Volume 17,652.7 15,526.63 13.69
Source: Futures Industry Annual Volume Survey, March 2009
2. In terms of number of single stock futures contracts traded in 2008, NSE held the second position. It was fourth in terms of number of stock index options contracts traded and third in terms of number of stock index futures contracts traded in 2008. These rankings are based on World Federation of Exchanges (WFE) Annual Report and Statistics 2008. (Table 7-3)
Table 7-3: Top 5 exchanges in various derivative contracts(in million)
2008 2007 % change
Top 5 exchanges by number of single stock futures contracts traded in 2008
1 Johannesburg Stock Exchange 420 265 58.5
2 National Stock Exchange of India 226 179 26.3
3 Eurex 130 53 145.3
4 NYSE Liffe (European Markets) 125 75 66.7
5 Australian Securities Exchange 69 13 430.8
Top 5 exchanges by number of single stock options contracts traded in 2008
2008 2007 % change
1 International Securities Exchange 988 788 25.4
2 Chicago Board Options Exchange 934 714 30.8
3 NASDAQ OMX PHLX 538 399 34.8
4 NYSE Acra Options 417 336 24.1
5 BM&F Bovespa 350 367 -4.6
Contd.
www.nseindia.com
Derivatives MarketISMR 162
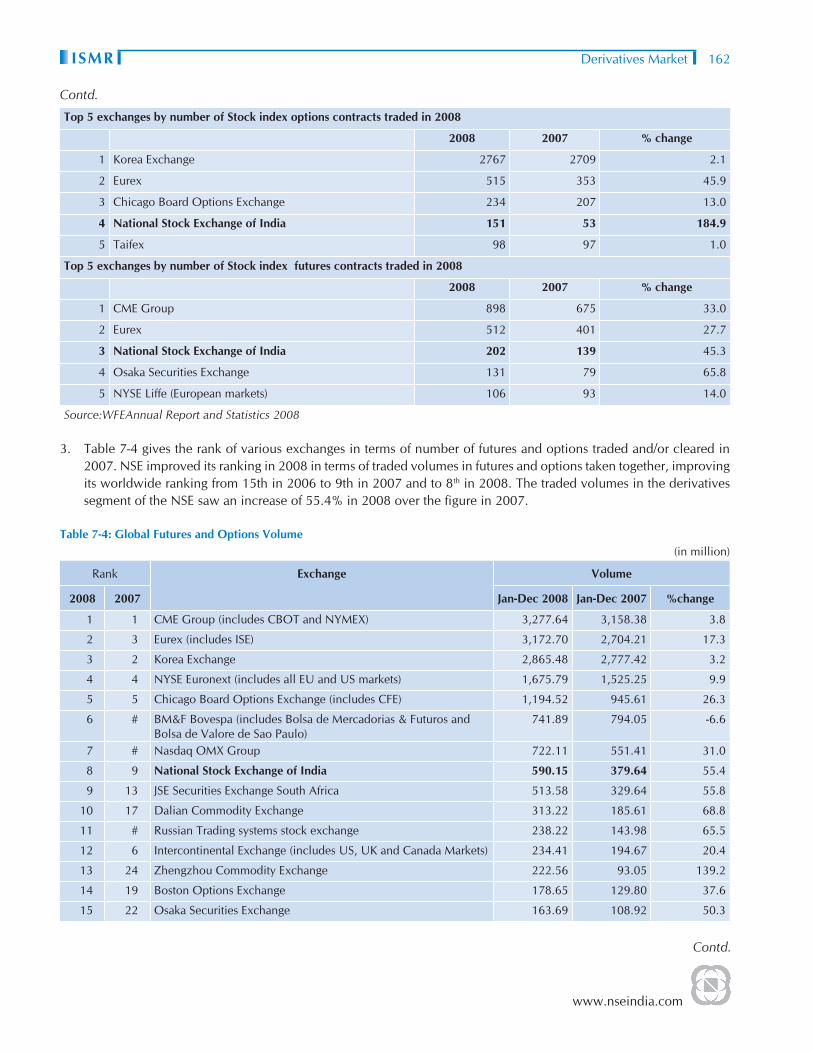
Top 5 exchanges by number of Stock index options contracts traded in 2008
2008 2007 % change
1 Korea Exchange 2767 2709 2.1
2 Eurex 515 353 45.9
3 Chicago Board Options Exchange 234 207 13.0
4 National Stock Exchange of India 151 53 184.9
5 Taifex 98 97 1.0
Top 5 exchanges by number of Stock index futures contracts traded in 2008
2008 2007 % change
1 CME Group 898 675 33.0
2 Eurex 512 401 27.7
3 National Stock Exchange of India 202 139 45.3
4 Osaka Securities Exchange 131 79 65.8
5 NYSE Liffe (European markets) 106 93 14.0
Source:WFEAnnual Report and Statistics 2008
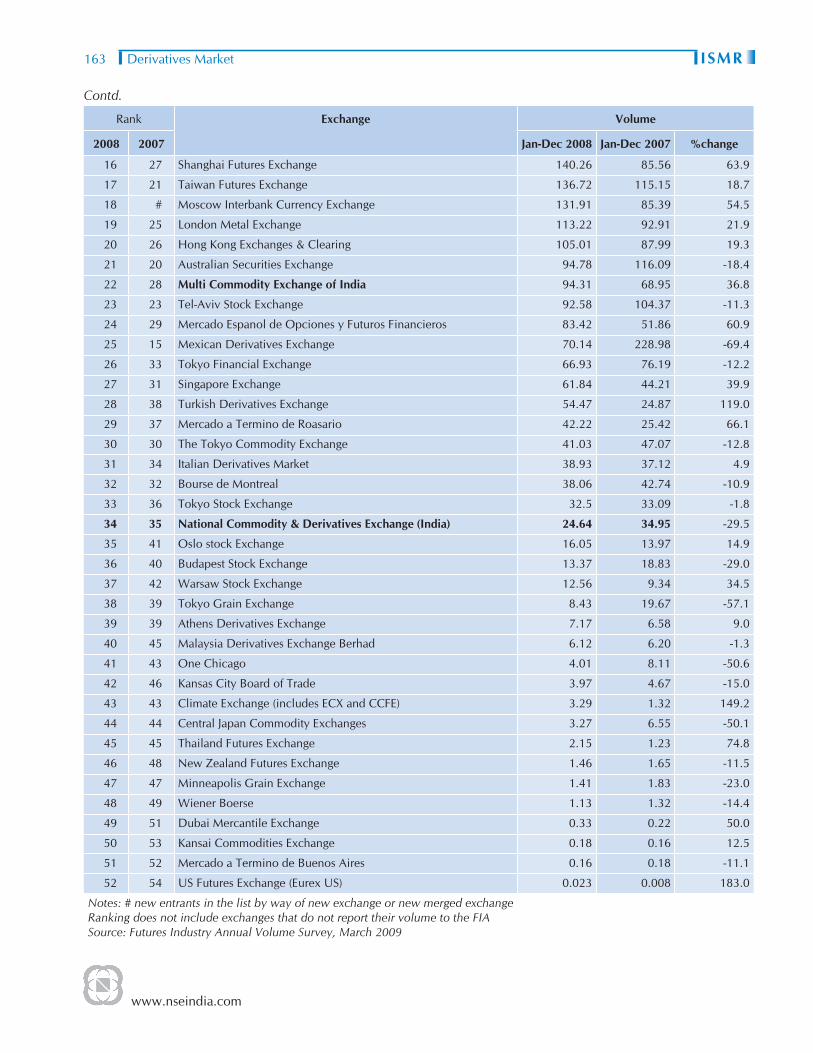
3. Table 7-4 gives the rank of various exchanges in terms of number of futures and options traded and/or cleared in 2007. NSE improved its ranking in 2008 in terms of traded volumes in futures and options taken together, improving its worldwide ranking from 15th in 2006 to 9th in 2007 and to 8th in 2008. The traded volumes in the derivatives segment of the NSE saw an increase of 55.4% in 2008 over the fi gure in 2007.
Table 7-4: Global Futures and Options Volume(in million)
Rank Exchange Volume
2008 2007 Jan-Dec 2008 Jan-Dec 2007 %change
1 1 CME Group (includes CBOT and NYMEX) 3,277.64 3,158.38 3.8
2 3 Eurex (includes ISE) 3,172.70 2,704.21 17.3
3 2 Korea Exchange 2,865.48 2,777.42 3.2
4 4 NYSE Euronext (includes all EU and US markets) 1,675.79 1,525.25 9.9
5 5 Chicago Board Options Exchange (includes CFE) 1,194.52 945.61 26.3
6 # BM&F Bovespa (includes Bolsa de Mercadorias & Futuros and Bolsa de Valore de Sao Paulo)
741.89 794.05 -6.6
7 # Nasdaq OMX Group 722.11 551.41 31.0
8 9 National Stock Exchange of India 590.15 379.64 55.4
9 13 JSE Securities Exchange South Africa 513.58 329.64 55.8
10 17 Dalian Commodity Exchange 313.22 185.61 68.8
11 # Russian Trading systems stock exchange 238.22 143.98 65.5
12 6 Intercontinental Exchange (includes US, UK and Canada Markets) 234.41 194.67 20.4
13 24 Zhengzhou Commodity Exchange 222.56 93.05 139.2
14 19 Boston Options Exchange 178.65 129.80 37.6
15 22 Osaka Securities Exchange 163.69 108.92 50.3
Contd.
Contd.
www.nseindia.com
Derivatives Market ISMR163
Rank Exchange Volume
2008 2007 Jan-Dec 2008 Jan-Dec 2007 %change
16 27 Shanghai Futures Exchange 140.26 85.56 63.9
17 21 Taiwan Futures Exchange 136.72 115.15 18.7
18 # Moscow Interbank Currency Exchange 131.91 85.39 54.5
19 25 London Metal Exchange 113.22 92.91 21.9
20 26 Hong Kong Exchanges & Clearing 105.01 87.99 19.3
21 20 Australian Securities Exchange 94.78 116.09 -18.4
22 28 Multi Commodity Exchange of India 94.31 68.95 36.8
23 23 Tel-Aviv Stock Exchange 92.58 104.37 -11.3
24 29 Mercado Espanol de Opciones y Futuros Financieros 83.42 51.86 60.9
25 15 Mexican Derivatives Exchange 70.14 228.98 -69.4
26 33 Tokyo Financial Exchange 66.93 76.19 -12.2
27 31 Singapore Exchange 61.84 44.21 39.9
28 38 Turkish Derivatives Exchange 54.47 24.87 119.0
29 37 Mercado a Termino de Roasario 42.22 25.42 66.1
30 30 The Tokyo Commodity Exchange 41.03 47.07 -12.8
31 34 Italian Derivatives Market 38.93 37.12 4.9
32 32 Bourse de Montreal 38.06 42.74 -10.9
33 36 Tokyo Stock Exchange 32.5 33.09 -1.8
34 35 National Commodity & Derivatives Exchange (India) 24.64 34.95 -29.5
35 41 Oslo stock Exchange 16.05 13.97 14.9
36 40 Budapest Stock Exchange 13.37 18.83 -29.0
37 42 Warsaw Stock Exchange 12.56 9.34 34.5
38 39 Tokyo Grain Exchange 8.43 19.67 -57.1
39 39 Athens Derivatives Exchange 7.17 6.58 9.0
40 45 Malaysia Derivatives Exchange Berhad 6.12 6.20 -1.3
41 43 One Chicago 4.01 8.11 -50.6
42 46 Kansas City Board of Trade 3.97 4.67 -15.0
43 43 Climate Exchange (includes ECX and CCFE) 3.29 1.32 149.2
44 44 Central Japan Commodity Exchanges 3.27 6.55 -50.1
45 45 Thailand Futures Exchange 2.15 1.23 74.8
46 48 New Zealand Futures Exchange 1.46 1.65 -11.5
47 47 Minneapolis Grain Exchange 1.41 1.83 -23.0
48 49 Wiener Boerse 1.13 1.32 -14.4
49 51 Dubai Mercantile Exchange 0.33 0.22 50.0
50 53 Kansai Commodities Exchange 0.18 0.16 12.5
51 52 Mercado a Termino de Buenos Aires 0.16 0.18 -11.1
52 54 US Futures Exchange (Eurex US) 0.023 0.008 183.0
Notes: # new entrants in the list by way of new exchange or new merged exchangeRanking does not include exchanges that do not report their volume to the FIASource: Futures Industry Annual Volume Survey, March 2009
Contd.
www.nseindia.com
Derivatives MarketISMR 164
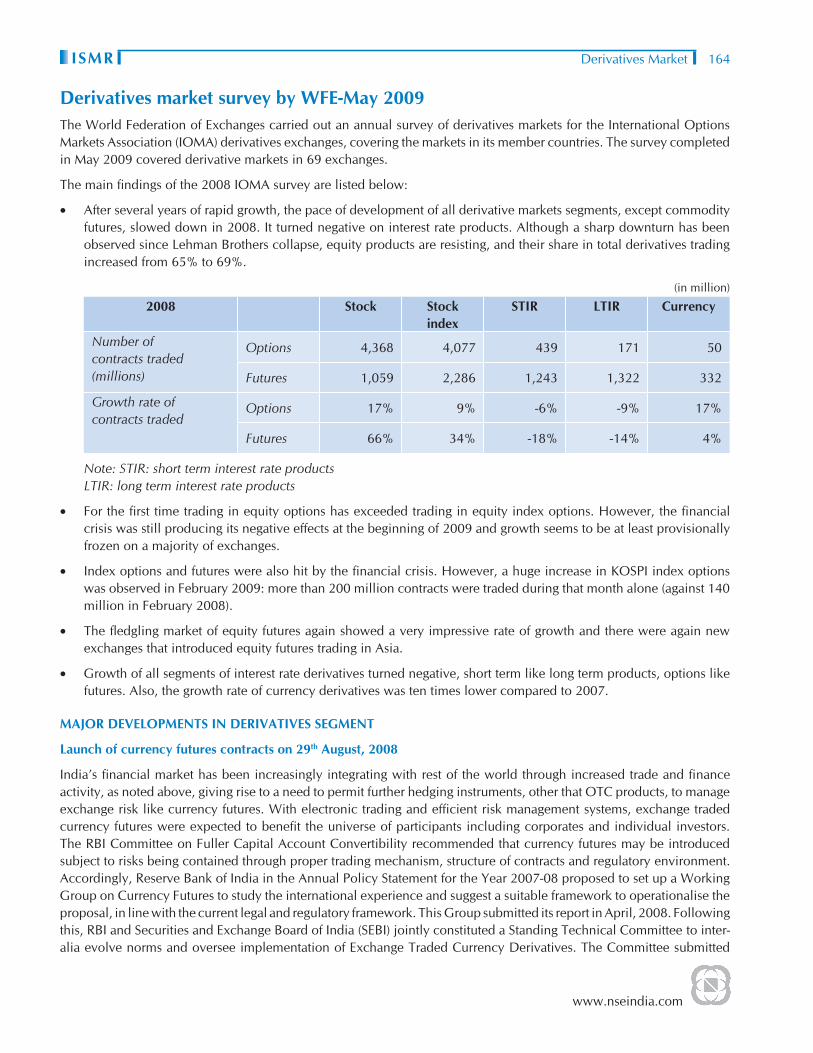
Derivatives market survey by WFE-May 2009The World Federation of Exchanges carried out an annual survey of derivatives markets for the International Options Markets Association (IOMA) derivatives exchanges, covering the markets in its member countries. The survey completed in May 2009 covered derivative markets in 69 exchanges.
The main fi ndings of the 2008 IOMA survey are listed below:
• After several years of rapid growth, the pace of development of all derivative markets segments, except commodity futures, slowed down in 2008. It turned negative on interest rate products. Although a sharp downturn has been observed since Lehman Brothers collapse, equity products are resisting, and their share in total derivatives trading increased from 65% to 69%.
(in million)
2008 Stock Stock index
STIR LTIR Currency
Number ofcontracts traded(millions)
Options 4,368 4,077 439 171 50
Futures 1,059 2,286 1,243 1,322 332
Growth rate ofcontracts traded
Options 17% 9% -6% -9% 17%
Futures 66% 34% -18% -14% 4%
Note: STIR: short term interest rate productsLTIR: long term interest rate products
• For the fi rst time trading in equity options has exceeded trading in equity index options. However, the fi nancial crisis was still producing its negative effects at the beginning of 2009 and growth seems to be at least provisionally frozen on a majority of exchanges.
• Index options and futures were also hit by the fi nancial crisis. However, a huge increase in KOSPI index options was observed in February 2009: more than 200 million contracts were traded during that month alone (against 140 million in February 2008).
• The fl edgling market of equity futures again showed a very impressive rate of growth and there were again new exchanges that introduced equity futures trading in Asia.
• Growth of all segments of interest rate derivatives turned negative, short term like long term products, options like futures. Also, the growth rate of currency derivatives was ten times lower compared to 2007.
MAJOR DEVELOPMENTS IN DERIVATIVES SEGMENT
Launch of currency futures contracts on 29th August, 2008
India’s fi nancial market has been increasingly integrating with rest of the world through increased trade and fi nance activity, as noted above, giving rise to a need to permit further hedging instruments, other that OTC products, to manage exchange risk like currency futures. With electronic trading and effi cient risk management systems, exchange traded currency futures were expected to benefi t the universe of participants including corporates and individual investors. The RBI Committee on Fuller Capital Account Convertibility recommended that currency futures may be introduced subject to risks being contained through proper trading mechanism, structure of contracts and regulatory environment. Accordingly, Reserve Bank of India in the Annual Policy Statement for the Year 2007-08 proposed to set up a Working Group on Currency Futures to study the international experience and suggest a suitable framework to operationalise the proposal, in line with the current legal and regulatory framework. This Group submitted its report in April, 2008. Following this, RBI and Securities and Exchange Board of India (SEBI) jointly constituted a Standing Technical Committee to inter-alia evolve norms and oversee implementation of Exchange Traded Currency Derivatives. The Committee submitted

www.nseindia.com
Derivatives Market ISMR165
its report on May 29, 2008. This report laid down the framework for the launch of Exchange Traded Currency Futures in terms of the eligibility norms for existing and new Exchanges and their Clearing Corporations/Houses, eligibility criteria for members of such Exchanges/Clearing Corporations/Houses, product design, risk management measures, surveillance mechanism and other related issues.
The Regulatory framework for currency futures trading in the country, as laid down by the regulators, provide that persons resident in India are permitted to participate in the currency futures market in India subject to directions contained in the Currency Futures (Reserve Bank) Directions, 2008, which have come into force with effect from August 6, 2008.
Standardized currency futures have the following features: a. USD INR, EUR INR, JPY INR and GDP INR contracts are allowed to be traded. b. The size of each contract is - USD 1000, EUR 1000, GDP 1000 and JPY 1,00,000.c. The contracts shall be quoted and settled in Indian Rupees. d. The maturity of the contracts shall not exceed 12 months.e. The settlement price shall be the Reserve Bank’s Reference Rate on the last trading day.
The membership of the currency futures market of a recognised stock exchange has been mandated to be separate from the membership of the equity derivative segment or the cash segment. Banks authorized by the Reserve Bank of India under section 10 of the Foreign Exchange Management Act, 1999 as ‘AD Category - I bank’ are permitted to become trading and clearing members of the currency futures market of the recognized stock exchanges, on their own account and on behalf of their clients, subject to fulfi lling certain minimum prudential requirements pertaining to net worth, non-performing assets etc.
NSE was the fi rst exchange to have received an in-principle approval from SEBI for setting up currency derivative segment. The exchange lunched its currency futures trading platform on 29th August, 2008. While BSE commenced trading in currency futures on 1st October, 2008, Multi-Commodity Exchange of India (MCX) started trading in this product on 7th October, 2008.
Re-launch of Interest Rate Futures on Indian Stock Exchanges
An Interest Rate Future (IRF) is a fi nancial derivative with an interest-bearing instrument as the underlying asset. In case of IRF contracts, a borrower and a lender agree to fi x the rate at which they will borrow or lend at a future date. As with other futures instruments, such as in commodities, the contract can help protect against rate swings. Interest rate futures are based on an underlying security which is a debt obligation and moves in value as interest rate changes.
IRFs were introduced in India in June 2003 on the NSE through launch of three contracts - a contract based on a notional 10-year coupon bearing bond, a contract based on a notional 10-year zero coupon bond and a contract based on 91-day Treasury bill. All the contracts were valued using the Zero Coupon Yield Curve (ZCYC) (a curve which estimates relationship between maturity and interest rate). The contracts design did not provide for physical delivery. However, the product did not meet much success primarily due to the way the product was designed and market microstructure. According to the market participants, the use of a ZCYC for determining the settlement and daily mark-to-market price resulted in large errors between zero coupon yields and underlying bond yields, which lead to large basis risk (the risk that offsetting investments in a hedging strategy will not experience price changes in entirely opposite directions from each other) between IRF and the underlying. The contract traded only for 3 months and then withered out.
A proposal for change in the product design - introducing pricing based on the YTM of a basket of securities in lieu of ZCYC - was made in January 2004 but has not been implemented.
In the background of this experience with the IRF product, amidst an otherwise rapidly evolving fi nancial market, the RBI, set up a Working Group on IRF in August, 2007 to, inter-alia, review the experience with the IRF so far, with particular reference to product design issue and make recommendations for activating the IRF. The Group submitted its report in February, 2008, following which an RBI-SEBI Standing Technical Committee on Exchange-Traded Currency and Interest Rate Derivatives was constituted. The Report of this Committee has been made public on 17th June 2009.

www.nseindia.com
Derivatives MarketISMR 166
SEBI had invited eligible exchanges to apply for permission to offer this product on their trading platforms.
National Stock Exchange became the fi rst exchange to receive approval from SEBI to introduce Exchange traded Interest Rate Futures (IRF) contracts for trading on the Currency Derivatives Segment of the exchange. Trading in IRF commenced on August 31, 2009. On its fi rst day of trading, 14,559 contracts being traded at a total value of Rs 267.31 crores.
Distinguishing features between the IRFs launched in 2003 and new prodcuts launched on August 31, 2009 are:
Features of Products launched in June 2003 Re-launched IRF product (Sept 2009)
1. To be traded on Derivatives Segment To be Traded on CDS segment
2. Participation of FIIs not allowed Participation of FIIs allowed
3. Three underlyings- Futures on 10-year notional GoI security with 6% coupon rate; futures on 10-year notional zero-coupon GoI security and futures on 91-day Treasury bill.
Underlying: 10-year 7% Notional GOI Bond
4. Contracts were valued using the Zero Coupon Yield Curve (ZCYC). The contracts design did not provide for physical delivery.
These futures contracts would be based on 10-year government bond yield, which should be settled by physical delivery.
5. Cash Settled Physical delivery - The deliverable grade of securities are GOI Securities maturing at least 8 years but not more than 12 years from fi rst day of the delivery month with a minimum total outstanding of Rs 10,000 crores.
Other Policy Developments
1. Guidelines on Exchange Traded Interest Rate Derivatives
The guidelines on Exchange-Traded Interest Rate Derivatives were issued by RBI vide circular dated June 3, 2003. In terms of this circular, banks were permitted to transact in Interest Rate Futures (IRFs) for the purpose of hedging the risk in their underlying investment portfolio. RBI also decided to allow banks to take trading positions in IRFs. Vide its circular dated October 13, 2008.
2. Revised Exposure Margin for Exchange Traded Equity Derivatives
SEBI had vide its circular dated December 18, 2002, inter-alia, specifi ed that the exposure margin shall be higher of 5% or 1.5 times the standard deviation (of daily logarithmic returns of the stock price) of the notional value of the gross open position in single stock futures and gross short open position in stock options in a particular underlying.
With a view to ensure market safety and safeguard the interest of investors, SEBI decided that the said exposure margin shall be higher of 10% or 1.5 times the standard deviation (of daily logarithmic returns of the stock price), with effect from October 22, 2008.
3. Issuance of Electronic Contract Notes (ECNs) in Equity Derivatives Segment
In continuation of SEBI’s circular dated February 3, 2004, on the issuance of electronic contract notes as a legal document like the physical contract note for the equity segment, SEBI, in consultation with the exchanges, decided to extend the facility of issuance of ECNs as a legal document using Straight Through Processing (STP) to the equity derivatives segment also. Accordingly a model contract note in electronic form (IFN 515 messaging format) and confi rmation of electronic contract note (IFN 598 messaging format) was released by SEBI on November 6, 2008.
SEBI advised the exchanges to modify/amend their bye-laws, rules and regulations to:

www.nseindia.com
Derivatives Market ISMR167
a) Permit issuance of electronic contract note including all the standard pre-printed terms and conditions as given in the physical contract note.
b) Permit signing of the electronic contract note with a digital signature so as to make the modifi ed format of the electronic contract note a valid legal document like the physical contract note.
c) Prescribe a standard format for the issuance of the electronic contract note.
Market DesignOnly two exchanges in India have been permitted to trade in derivatives contracts, the NSE and the BSE. NSE’s contribution to the total turnover in the market is nearly 99%. Hence, the market design enumerated in this section is the derivative segment of NSE (hereafter referred to as the F&O segment). The different aspects of market design for F&O segment of the exchanges can be summarized as follows:
TradingMechanism
NEAT-F&O system: a fully automated screen-based, anonymous order driven trading system for derivatives on a nationwide basis.a. There are four entities in the trading system:1. Trading members who can trade either on their own account or on behalf of their clients
including participants.2. Clearing members who are members of NSCCL and carry out risk management activities and
confi rmation/inquiry of trades through the trading system. These clearing members are also trading members and clear trades for themselves and/or others.
3. Professional clearing members are clearing members who are not trading members. Typically, banks and custodians become PCMs and clear and settle for their trading members.
4. Participants who are client of trading members like fi nancial institutions. These clients may trade through multiple trading members, but settle their trades through a single clearing member only.
Membership The members are admitted by NSE for its F&O segment in accordance with the rules and regulations of the Exchange and the norms specifi ed by the SEBI. The eligibility criteria for membership on F&O segment has been mentioned in Chapter 4 Secondary Market – Trading. At the end of June 2009, there were 1020 members in the CM and F&O segment taken together.
Contractsavailable
• Index futures and index options contracts on NSE are based on Nifty 50 Index, CNX IT Index, Bank Nifty Index, and Nifty Midcap 50 index.
• Stock Futures and options, based on 180 individual securities.Charges Transaction charges payable to the exchange by the trading member for the trades executed by
him on the F&O segment were fi xed at Rs. 2 per lakh of turnover (0.002%) subject to a minimum of Rs. 1,00,000 per year. However for the transactions in the options sub-segment the transaction charges are levied on the premium value at the rate of 0.05% (each side) instead of on the strike price as levied earlier.The NSE reviewed these transaction charges and further reduced the transaction charges for trades done in the Futures segment from its present level to a slab based structure as given below (w.e.f. October 1, 2009) –
Total Traded Value in a month Revised Transaction Charges (Rs. per lakh of Traded Value)
Up to First Rs. 2500 cores Rs. 1.90 each side
More than Rs. 2500 crores up to Rs. 7500 crores (on incremental volume)
Rs. 1.85 each side
More than Rs. 7500 crores up to Rs. 15000 crores (on incremental volume)
Rs. 1.80 each side
Exceeding Rs.15000 crores (on incremental volume) Rs. 1.75 each side
www.nseindia.com
Derivatives MarketISMR 168
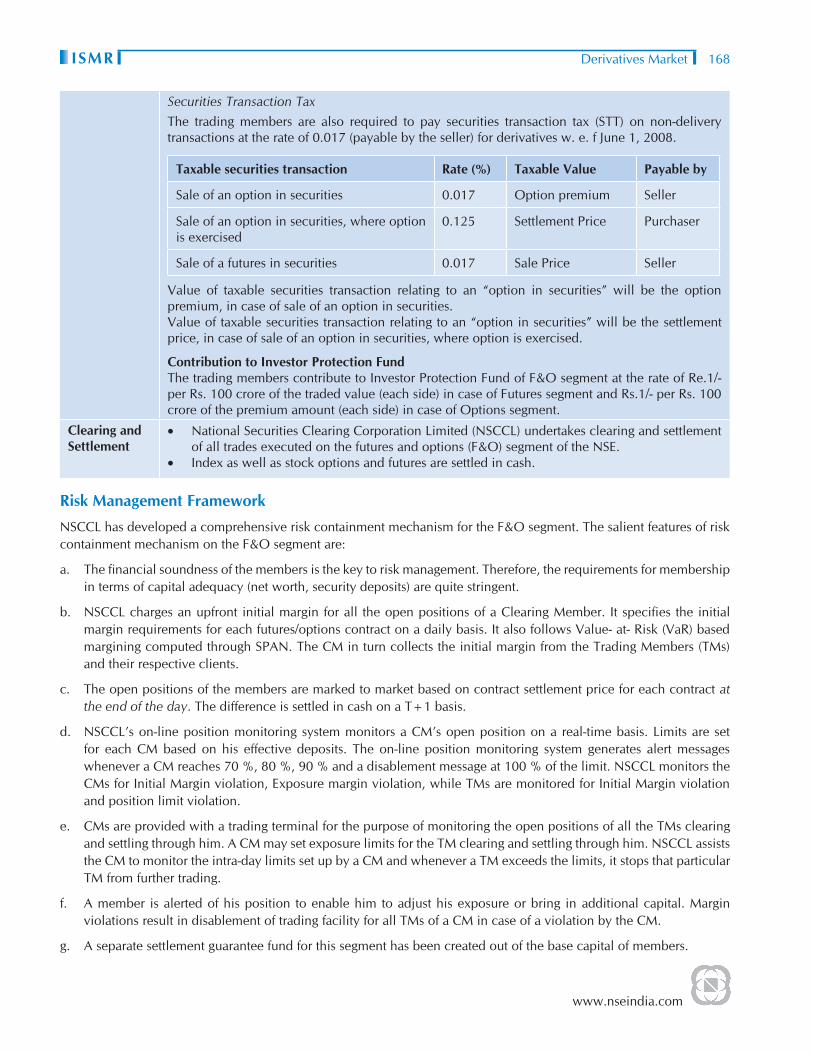
Securities Transaction TaxThe trading members are also required to pay securities transaction tax (STT) on non-delivery transactions at the rate of 0.017 (payable by the seller) for derivatives w. e. f June 1, 2008.
Taxable securities transaction Rate (%) Taxable Value Payable by
Sale of an option in securities 0.017 Option premium Seller
Sale of an option in securities, where option is exercised
0.125 Settlement Price Purchaser
Sale of a futures in securities 0.017 Sale Price Seller
Value of taxable securities transaction relating to an “option in securities” will be the option premium, in case of sale of an option in securities.Value of taxable securities transaction relating to an “option in securities” will be the settlement price, in case of sale of an option in securities, where option is exercised.
Contribution to Investor Protection FundThe trading members contribute to Investor Protection Fund of F&O segment at the rate of Re.1/- per Rs. 100 crore of the traded value (each side) in case of Futures segment and Rs.1/- per Rs. 100 crore of the premium amount (each side) in case of Options segment.
Clearing andSettlement
• National Securities Clearing Corporation Limited (NSCCL) undertakes clearing and settlement of all trades executed on the futures and options (F&O) segment of the NSE.
• Index as well as stock options and futures are settled in cash.
Risk Management Framework
NSCCL has developed a comprehensive risk containment mechanism for the F&O segment. The salient features of risk containment mechanism on the F&O segment are:
a. The fi nancial soundness of the members is the key to risk management. Therefore, the requirements for membership in terms of capital adequacy (net worth, security deposits) are quite stringent.
b. NSCCL charges an upfront initial margin for all the open positions of a Clearing Member. It specifi es the initial margin requirements for each futures/options contract on a daily basis. It also follows Value- at- Risk (VaR) based margining computed through SPAN. The CM in turn collects the initial margin from the Trading Members (TMs) and their respective clients.
c. The open positions of the members are marked to market based on contract settlement price for each contract at the end of the day. The difference is settled in cash on a T+1 basis.
d. NSCCL’s on-line position monitoring system monitors a CM’s open position on a real-time basis. Limits are set for each CM based on his effective deposits. The on-line position monitoring system generates alert messages whenever a CM reaches 70 %, 80 %, 90 % and a disablement message at 100 % of the limit. NSCCL monitors the CMs for Initial Margin violation, Exposure margin violation, while TMs are monitored for Initial Margin violation and position limit violation.
e. CMs are provided with a trading terminal for the purpose of monitoring the open positions of all the TMs clearing and settling through him. A CM may set exposure limits for the TM clearing and settling through him. NSCCL assists the CM to monitor the intra-day limits set up by a CM and whenever a TM exceeds the limits, it stops that particular TM from further trading.
f. A member is alerted of his position to enable him to adjust his exposure or bring in additional capital. Margin violations result in disablement of trading facility for all TMs of a CM in case of a violation by the CM.
g. A separate settlement guarantee fund for this segment has been created out of the base capital of members.

www.nseindia.com
Derivatives Market ISMR169
The most critical component of risk containment mechanism for F&O segment is the margining system and on-line position monitoring. The actual position monitoring and margining is carried out on–line through Parallel Risk Management System (PRISM). PRISM uses SPAN®1 (Standard Portfolio Analysis of Risk). SPAN system is for the purpose of computation of on-line margins, based on the parameters defi ned by SEBI.
Risk Containment Measures
A. Eligibility Criteria for stock selection
The stock selection criteria for derivatives trading in India ensure that stock is large in terms of market capitalization, turnover and has suffi cient liquidity in the underlying market and there are no adverse issues related to market manipulation.
Eligibility Criteria for selection of stocks and indices for futures and options contracts
The following criteria was adopted by the Exchange w.e.f September 22, 2006, for selecting stocks and indices on which Futures & Options contracts are to be introduced.
1. Eligibility criteria of stocks
• The stock are to be chosen from amongst the top 500 stocks in terms of average daily market capitalization and average daily traded value in the previous six months on a rolling basis.
• The stock’s median quarter-sigma order size over the last six months should be not less than Rs. 0.10 million (Rs. 1 lac). For this purpose, a stock’s quarter-sigma order size would mean the order size (in value terms) required to cause a change in the stock price equal to one-quarter of a standard deviation.
• The market wide position limit in the stock should not be less than Rs. 500 million (Rs. 50 crores). The market wide position limit (number of shares) is be valued taking the closing prices of stocks in the underlying cash market on the date of expiry of contract in the month. The market wide position limit of open position (in terms of the number of underlying stock) on futures and option contracts on a particular underlying stock is :
• 20% of the number of shares held by non-promoters in the relevant underlying security i.e. free-fl oat holding.
• If an existing security fails to meet the eligibility criteria for three months consecutively, then no fresh month contract can be issued on that security.
However, the existing unexpired contracts may be permitted to trade till expiry and new strikes may also be introduced in the existing contract months.
Selection criteria for unlisted companies
For unlisted companies coming out with initial public offering, if the net public offer is Rs. 500 crore or more, then the Exchange may consider introducing stock options and stock futures on such stocks at the time of its’ listing in the cash market.
Re-introduction of dropped stocks
• A stock which is dropped from derivatives trading may become eligible once again. In such instances, the stock is required to fulfi ll the eligibility criteria for three consecutive months to be re-introduced for derivatives trading.
Eligibility criteria of stocks for derivatives trading especially on account of corporate restructuring
1 SPAN ® is a registered trademark of the Chicago Mercantile (CME) used here under license.
www.nseindia.com
Derivatives MarketISMR 170
The eligibility criteria for stocks for derivatives trading on account of corporate restructuring is as under:
I. All the following conditions should be met in the case of shares of a company undergoing restructuring through any means, for eligibility to re-introduce derivative contracts on that company from the fi rst day of listing of the post restructured company/(s)’s (as the case may be) stock (herein referred to as post restructured company) in the underlying market:
a. the Futures and options contracts on the stock of the original (pre restructure) company were traded on any exchange prior to its restructuring;
b. the pre restructured company had a market capitalisation of at least Rs.1000 crores prior to its restructuring;
c. the post restructured company would be treated like a new stock and if it is, in the opinion of the exchange, likely to be at least one-third the size of the pre restructuring company in terms of revenues, or assets, or (where appropriate) analyst valuations; and
d. in the opinion of the exchange, the scheme of restructuring does not suggest that the post restructured company would have any characteristic (for example extremely low free fl oat) that would render the company ineligible for derivatives trading
II. If the above conditions are satisfi ed, then the exchange takes the following course of action in dealing with the existing derivative contracts on the pre-restructured company and introduction of fresh contracts on the post restructured company.
a) In the contract month in which the post restructured company begins to trade, the Exchange shall introduce near month, middle month and far month derivative contracts on the stock of the restructured company.
b) In subsequent contract months, the normal rules for entry and exit of stocks in terms of eligibility requirements would apply. If these tests are not met, the exchange does not permit further derivative contracts on this stock and future month series are not be introduced.
2. Eligibility criteria of Indices
• The Exchange may consider introducing derivative contracts on an index if the stocks contribution to 80% weight age of the index are individually eligible for derivative trading. However, no single ineligible stocks in the index shall have a weightage of more than 5% in the index.”
• The above criteria is applied every month, if the index fails to meet the eligibility criteria for three months consecutively, then no fresh month contract shall be issued on that index. However, the existing unexpired contracts are permitted to trade till expiry and new strikes may also be introduced in the existing contracts.
B. Margins Requirements
As pointed out above, one of the critical components of risk containment mechanism for F&O segment is the margining system. This is explained below:
• Initial margin: Margin in the F&O segment is computed by NSCCL upto client level for open positions of CMs/ TMs. These are required to be paid up-front on gross basis at individual client level for client positions and on net basis for proprietary positions. NSCCL collects initial margin for all the open positions of a CM based on the margins computed by NSE-SPAN. A CM is required to ensure collection of adequate initial margin from his TMs up-front. The TM is required to collect adequate initial margins up-front from his clients.
www.nseindia.com
Derivatives Market ISMR171
• Initial margin requirement is based on 99% VaR and worst case loss over a specifi ed horizon, which depends on the time in which Mark to Market margin is collected. A portfolio based margining approach has been adopted which takes an integrated view of the risk involved in the portfolio of each individual client comprising of his positions in all derivative contracts. The initial margin requirements are based on worst scenario, loss of a portfolio of an individual client to cover 99% VaR over a one day horizon across various scenarios of price changes and volatility shifts.
• Premium Margin: In addition to Initial Margin, Premium Margin is charged at client level. This margin is required to be paid by a buyer of an option till the premium settlement is complete.
• Assignment Margin for Options on Securities: Assignment margin is levied in addition to initial margin and premium margin. It is required to be paid on assigned positions of CMs towards interim and fi nal exercise settlement obligations for option contracts on individual securities, till such obligations are fulfi lled. The margin is charged on the net exercise settlement value payable by a CM towards interim and fi nal exercise settlement.
• Exposure margins: Clearing members are subject to exposure margins in addition to initial margins.
• Client Margins: NSCCL intimates all members of the margin liability of each of their client. Additionally members are also required to report details of margins collected from clients to NSCCL, which holds in trust client margin monies to the extent reported by the member as having been collected form their respective clients.
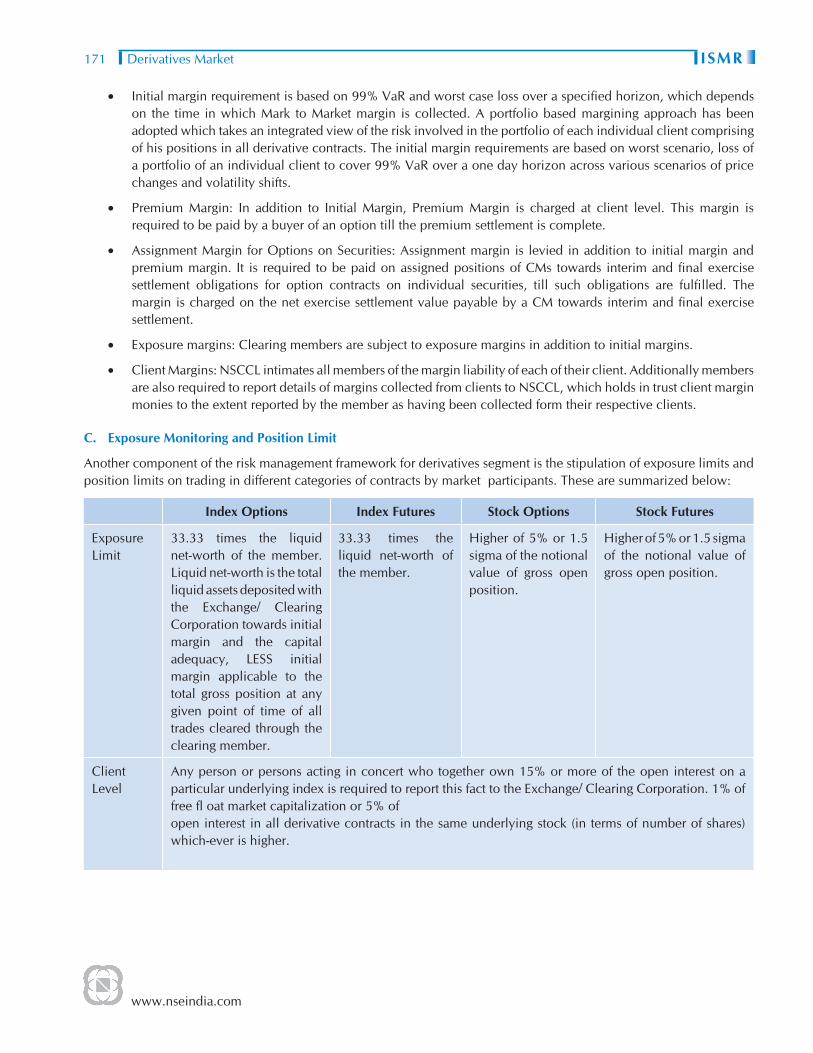
C. Exposure Monitoring and Position Limit
Another component of the risk management framework for derivatives segment is the stipulation of exposure limits and position limits on trading in different categories of contracts by market participants. These are summarized below:
Index Options Index Futures Stock Options Stock Futures
ExposureLimit
33.33 times the liquid net-worth of the member. Liquid net-worth is the total liquid assets deposited with the Exchange/ Clearing Corporation towards initial margin and the capital adequacy, LESS initial margin applicable to the total gross position at any given point of time of all trades cleared through the clearing member.
33.33 times the liquid net-worth of the member.
Higher of 5% or 1.5 sigma of the notional value of gross open position.
Higher of 5% or 1.5 sigma of the notional value of gross open position.
Client Level
Any person or persons acting in concert who together own 15% or more of the open interest on a particular underlying index is required to report this fact to the Exchange/ Clearing Corporation. 1% of free fl oat market capitalization or 5% ofopen interest in all derivative contracts in the same underlying stock (in terms of number of shares) which-ever is higher.

www.nseindia.com
Derivatives MarketISMR 172
TradingMemberLevel
The trading member position limits in equity index option contracts ishigher of Rs.500 Crore or 15% of the total open interest in the market in equity index option contracts. This limit is applicable on open positions in all option contracts on a particularunderlying index.
The trading member position limits in equity index futures contracts is higher of Rs.500 Crore or 15% of the total open interest in the market in equity index futures contracts. This limit is applicable on open positions in all futures contracts on a particular underlyingindex.
• For stocks having applicable market-wide position limit (MWPL) of Rs. 500 crores or more, the combined futures and options position limit is 20% of applicable MWPL or Rs. 300 crores, whichever is lower and within which stock futures position cannot exceed 10% of applicable MWPL or Rs. 150 crores, whichever is lower.
• For stocks having applicable MWPL less than Rs. 500 crores, the combined futures and options position limit would be 20% of applicable MWPL and futures position cannot exceed 20% of applicable MWPL or Rs. 50 crore which ever is lower
Market wide
The market wide limit of open position (in terms of the number of underlying stock) on futures and option contracts on a particular underlying stock should be 20% of the number of shares held by non-promoters in the relevant underlying security i.e. free–fl oat holding. This limit is applicable on all open positions in all futures and option contracts on a particular underlying stock.
Position limits for FIIs, Mutual Funds:
Index Options Index Futures Stock Options Stock Futures
Rs.500 Crore or 15 % of the total open interest of the market in index options, whichever is higher. This limit is applicable on open positions in all options contracts on a particular underlying index.
Rs. 500 crores or 15 % of the total open interest of the market in index futures, whichever is higher. This limit is applicable on open positions in all futures contracts on a particular underlying index.
• For stocks having applicable market-wide position limit (MWPL) of Rs. 500 crores or more, the combined futures and options position limit is 20% of applicable MWPL or Rs. 300 crores, whichever is lower and within which stock futures position cannot exceed 10% of applicable MWPL or Rs.150 crores, whichever is lower.
In addition to the above, FIIs & MFs can exposure in equity index derivatives subject to the following limits:
a. Short positions in index derivatives (short futures, short calls and long puts) not exceeding (in notional value) the FII’s / MF’s holding of stocks.
b. Long positions in index derivatives (long futures, long calls and short puts) not exceeding (in notional value) the FII’s / MF’s holding of cash, government securities, T-Bills and similar instruments.
• For stocks having applicable market-wide position limit (MWPL) less than Rs. 500 crores, the combined futures and options position limit is 20% of applicable MWPL and futures position cannot exceed 20% of applicable MWPL or Rs. 50 crore which ever is lower.
www.nseindia.com
Derivatives Market ISMR173
NSE – SPAN*
The objective of NSE-SPAN is to identify overall risk in a portfolio of all futures and options contracts for each member. The system treats futures and options contracts uniformly, while at the same time recognising the unique exposures associated with options portfolios, like extremely deep out-of-the-money short positions and inter-month risk.
Its over-riding objective is to determine the largest loss that a portfolio might reasonably be expected to suffer from one day to the next day based on 99% VaR methodology.
SPAN considers uniqueness of option portfolios. The following factors affect the value of an option:• Underlying market price.• Volatility (variability) of underlying instrument, and• Time to expiration.• Interest rate• Strike price
As these factors change, the value of options maintained within a portfolio also changes. Thus, SPAN constructs scenarios of probable changes in underlying prices and volatilites in order to identify the largest loss a portfolio might suffer from one day to the next. It then sets the margin requirement to cover this one-day loss.
The complex calculations (e.g. the pricing of options) in SPAN are executed by NSCCL. The results of these calculations are called risk arrays. Risk arrays, and other necessary data inputs for margin calculation are provided to members daily in a fi le called the SPAN Risk Parameter fi le. Members can apply the data contained in the Risk Parameter fi les, to their specifi c portfolios of futures and options contracts, to determine their SPAN margin requirements.
Hence, members need not execute a complex option pricing calculation, which is performed by NSCCL. SPAN has the ability to estimate risk for combined futures and options portfolios, and also re-value the same under various scenarios of changing market conditions.
NSCCL generates six risk parameters fi le for a day taking into account price and volatilities at various time intervals and are provided on the website of the Exchange
Market Design for Currency Derivatives
Currency derivatives have been launched on the NSE in August, 2008. The market design, including the risk management framework for this new product is summarized below:
Eligibility criteria
The following entities are eligible to apply for membership subject to the regulatory norms and provisions of SEBI and as provided in the Rules, Regulations, Byelaws and Circulars of the Exchange –a. Individuals;b. Partnership Firms registered under the Indian Partnership Act, 1932;c. Corporations, Companies or Institutions or subsidiaries of such Corporations, Companies or Institutions set up for
providing fi nancial services;d. Such other person as may be permitted under the Securities Contracts (Regulation) Rules 1957
Professional Clearing Member (PCM)
The following persons are eligible to become PCMs of NSCCL for Currency Futures Derivatives provided they fulfi ll the prescribed criteria:a. SEBI Registered Custodians; andb. Banks recognised by NSEIL/NSCCL for issuance of bank guarantees
* SPAN® is a register trademark of Chicago Mercantile Exchange (CME) use here under license.

www.nseindia.com
Derivatives MarketISMR 174
Banks authorized by the Reserve Bank of India under section 10 of the Foreign Exchange Management Act, 1999 as ‘AD Category - I bank’ are permitted to become trading and clearing members of the currency futures market of the recognized stock exchanges, on their own account and on behalf of their clients, subject to fulfi lling the following minimum prudential requirements:a. Minimum net worth of Rs. 500 crores.b. Minimum CRAR of 10 per cent.c. Net NPA should not exceed 3 per cent.d. Made net profi t for last 3 years.
The AD Category - I banks which fulfi ll the prudential requirements are required to lay down detailed guidelines with the approval of their Boards for trading and clearing of currency futures contracts and management of risks.
AD Category - I banks which do not meet the above minimum prudential requirements and AD Category - I banks which are Urban Co-operative banks or State Co-operative banks can participate in the currency futures market only as clients, subject to approval therefore from the respective regulatory Departments of the Reserve Bank.
Other applicable eligibility criteria
a. Where the applicant is a partnership fi rm/corporate entity, the applicant shall identify a Dominant Promoter Group as per the norms of the Exchange at the time of making the application. Any change in the shareholding of the company including that of the said Dominant Promoter Group or their shareholding interest shall be effected only with the prior permission of NSEIL/SEBI.
b. The applicant has to ensure that at any point of time they would ensure that atleast individual/one partner/one designated director/compliance offi cer would have a valid NCFM certifi cation as per the requirements of the Exchange. The above norm would be a continued admittance norm for membership of the Exchange.
c. An applicant must be in a position to pay the membership and other fees, deposits etc, as applicable at the time of admission within three months of intimation to him of admission as a Trading Member or as per the time schedule specifi ed by the Exchange.
d. The trading members and sales persons in the currency futures market must have passed a certifi cation programme which is considered adequate by SEBI. The approved users and sales personnel of the trading member should have passed the certifi cation programme.
e. To begin with, FIIs and NRIs would not be permitted to participate in currency futures market.
f. Strict enforcement of “Know your customer” rule is required. Therefore every client shall be registered with the member. The members are also required to make their clients aware of the risks involved in derivatives trading by issuing to the client the Risk Disclosure Document and obtain a copy of the same duly signed by the client. The members shall enter into a member constituent agreement as stipulated.
g. The Exchange may specify such standards for investor service and infrastructure with regard to any category of applicants as it may deem necessary, from time to time.
Position limits
Client Level Position Limit: The client level position limit as prescribed in the Report of the RBI-SEBI Standing Technical Committee shall be applicable where the gross open position of the client across all contracts exceeds 6% of the total open interest or 5 million USD, whichever is higher.
The client level gross open position would be computed on the basis of PAN across all members.
Trading Member Level Position Limit: The trading member position limit shall be higher of 15% of the total open interest or 25 million USD. However, the position limit for a Trading Member, which is a bank, shall be higher of 15% of the total open interest or 100 million USD.
www.nseindia.com
Derivatives Market ISMR175
Margins
• Initial Margins: Initial margin shall be payable on all open positions of Clearing Members, upto client level, and shall be payable upfront by Clearing Members in accordance with the margin computation mechanism and/ or system as may be adopted by the Clearing Corporation from time to time. Initial Margin shall include SPAN margins, futures fi nal settlement margin and such other additional margins, that may be specifi ed by the Clearing Corporation from time to time.
• Calendar Spread Margins: A currency futures position in one expiry month which is hedged by an offsetting position in a different expiry month would be treated as a calendar spread. The calendar spread margin shall be Rs. 250/- per contract for all months of spread. The benefi t for a calendar spread would continue till expiry of the near month contract.
• Minimum Margins: The minimum margin percentage shall be 1.75% on the fi rst day of currency futures trading and 1 % thereafter which shall be scaled up by look ahead period as may be specifi ed by the Clearing Corporation from time to time.
• Futures Final Settlement Margin: Futures Final Settlement Margin shall be levied at the clearing member level in respect of the fi nal settlement amount due. The fi nal settlement margins shall be levied from the last trading day of the contract till the completion of pay-in towards the Final Settlement.
• Extreme Loss margins: Clearing members shall be subject to extreme loss margins in addition to initial margins. The applicable extreme loss margin shall be 1% on the mark to market value of the gross open positions or as may be specifi ed by the relevant authority from time to time.
Market Design for Interest Rate Futures
About the product
• 10YGS7 Interest Rate Futures contract will be based on notional 10 year coupon bearing GOI security.
• The notional coupon will be 7% per annum with semi-annual compounding.
• 10YGS7 futures contracts will have a maximum of 12 month expiration cycle.
• Quarterly contracts will be available for trading. To begin with December 2009 and March 2010 contracts will be made available for trading. A new quarterly expiry contract will be introduced on the expiration of a contract.
• The 10YGS7 futures contracts will expire seven working days prior to the last business day of the expiry month. The IRF contracts will expire at the normal market closing time on the expiry day.
• Permitted lot size for 10YGS7 future contracts will be Rs 2 lacs face value of GOI securities equivalent to 2000 units.
• Members will place orders in terms of number of lots.
• The day count convention for interest payments would be on the basis of a 360-day year, consisting of 12 months of 30 days each and half yearly coupon payment.
• Price steps (tick size) in respect of all IRF contracts admitted to dealing on the Exchange will be Rs.0.0025.
• Quantity Freeze for IRF contracts will be 501 lots or greater i.e. orders having quantity up to 500 lots will be allowed.
Settlement of contracts
• The contract will be settled by physical delivery of deliverable grade securities using the electronic book entry system of the existing Depositories, namely, National Securities Depositories Ltd. and Central Depository Services (India) Ltd. and Public Debt Offi ce of the Reserve Bank.

www.nseindia.com
Derivatives MarketISMR 176
• NSE has constituted a group of market participants to advise the Exchange/Clearing Corporation on the securities which may be included in the deliverable basket. Based on the recommendations of this group, it has been decided that GoI securities maturing at least 8 years but not more than 12 years from the fi rst day of the delivery month with minimum total outstanding stock of Rs 10,000 crore will be eligible deliverable grade securities.
Membership and trading
• For participating in Interest Rate Futures (IRF) all members registered by SEBI for trading in Currency Derivatives Segment (CDS)/ Futures & Options (F&O) Segment are eligible to trade in IRF, subject to meeting the Balance Sheet net worth requirement of Rs. 1 crore for a trading member and Rs 10 crores for a clearing member.
• All members registered by SEBI for trading in Currency Derivatives Segment (CDS)/ Futures & Options (F&O) Segment shall be eligible to trade in IRF, subject to meeting the Balance Sheet net worth requirement of Rs. 1 crore for a trading member and Rs 10 crores for a clearing member. New members interested in participating in IRF would be required to register in CDS.
• RBI-SEBI standing Technical Committee has also allowed FIIs and NRIs to trade in the Interest Rate Futures.
Interest Rate Futures (Reserve Bank) Directors, 2009
The Reserve Bank of India (RBI) issued Interest Rate Futures (Reserve Bank) Directions, 2009, on August 28, 2009, covering the framework for trading of IRFs in recognized exchanges for persons dealing in the instrument. The highlights of the directions are:
– These directions defi ne the Interest Rate futures product; list out the permitted instruments and features of the product.
– Foreign Institutional Investors, registered with Securities and Exchange Board of India, have been permitted to purchase or sell Interest Rate Futures subject to the condition that the total gross long (bought) position in cash and Interest Rate Futures markets taken together does not exceed their individual permissible limit for investment in government securities and the total gross short (sold) position, for the purpose of hedging only, does not exceed their long position in the government securities and in Interest Rate Futures at any point in time.
– No scheduled bank or such other agency falling under the regulatory purview of the Reserve Bank under the Reserve Bank of India Act, 1934, the Banking Regulation Act, 1949 or any other Act or instrument having the force of law is allowed to participate in the Interest Rate Futures market without the permission from the respective regulatory Department of the Reserve Bank.
– The agencies falling under the regulatory purview of any other regulator established by law are not allowed to participate in Interest Rate Futures market except with the permission of their respective regulators and participation of such agencies as members or clients will be in accordance with the guidelines issued by the regulator concerned.
Market OutcomeTrading Volumes
NSE’s derivatives market witnessed an increase in volumes over the period 2003-2007. The market had achieved a growth of 522% over this period with volumes in the derivatives segment of NSE and BSE increasing from USD 494 bn in 2003-04 to USD 3336 bn in 2007-08.
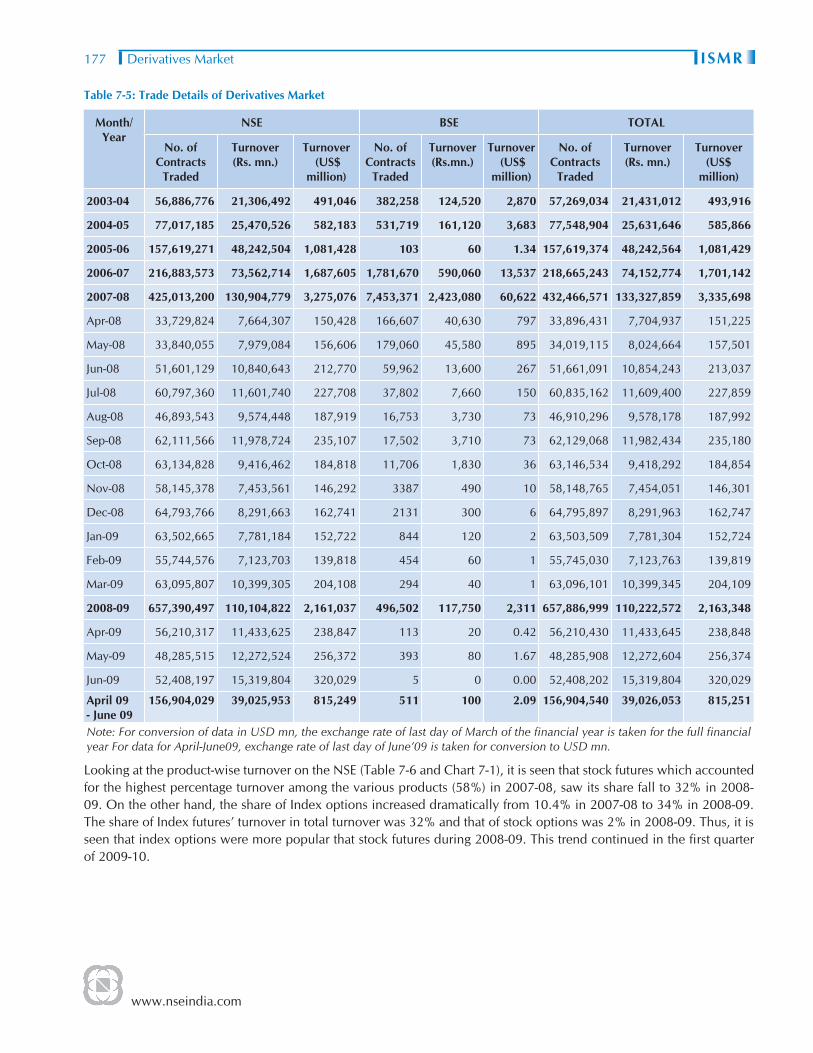
However, the year 2008-09 saw a drop in volumes in this segment largely due to the global slowdown in the derivatives segment as an aftereffect of the sub-prime crisis. The turnover in this segment on the NSE fell 16% in 2008-09 as compared to 2007-08. The turnover on the BSE fall was a dramatic 97% over this period (Table 7-5).
The share of BSE in the total derivative markets turnover fell from 1.81% in 2007-08 to 0.11% in 2008-09.
www.nseindia.com
Derivatives Market ISMR177
Table 7-5: Trade Details of Derivatives Market
Month/Year
NSE BSE TOTAL
No. of Contracts
Traded
Turnover (Rs. mn.)
Turnover (US$
million)
No. of Contracts
Traded
Turnover (Rs.mn.)
Turnover (US$
million)
No. of Contracts
Traded
Turnover (Rs. mn.)
Turnover (US$
million)
2003-04 56,886,776 21,306,492 491,046 382,258 124,520 2,870 57,269,034 21,431,012 493,916
2004-05 77,017,185 25,470,526 582,183 531,719 161,120 3,683 77,548,904 25,631,646 585,866
2005-06 157,619,271 48,242,504 1,081,428 103 60 1.34 157,619,374 48,242,564 1,081,429
2006-07 216,883,573 73,562,714 1,687,605 1,781,670 590,060 13,537 218,665,243 74,152,774 1,701,142
2007-08 425,013,200 130,904,779 3,275,076 7,453,371 2,423,080 60,622 432,466,571 133,327,859 3,335,698
Apr-08 33,729,824 7,664,307 150,428 166,607 40,630 797 33,896,431 7,704,937 151,225
May-08 33,840,055 7,979,084 156,606 179,060 45,580 895 34,019,115 8,024,664 157,501
Jun-08 51,601,129 10,840,643 212,770 59,962 13,600 267 51,661,091 10,854,243 213,037
Jul-08 60,797,360 11,601,740 227,708 37,802 7,660 150 60,835,162 11,609,400 227,859
Aug-08 46,893,543 9,574,448 187,919 16,753 3,730 73 46,910,296 9,578,178 187,992
Sep-08 62,111,566 11,978,724 235,107 17,502 3,710 73 62,129,068 11,982,434 235,180
Oct-08 63,134,828 9,416,462 184,818 11,706 1,830 36 63,146,534 9,418,292 184,854
Nov-08 58,145,378 7,453,561 146,292 3387 490 10 58,148,765 7,454,051 146,301
Dec-08 64,793,766 8,291,663 162,741 2131 300 6 64,795,897 8,291,963 162,747
Jan-09 63,502,665 7,781,184 152,722 844 120 2 63,503,509 7,781,304 152,724
Feb-09 55,744,576 7,123,703 139,818 454 60 1 55,745,030 7,123,763 139,819
Mar-09 63,095,807 10,399,305 204,108 294 40 1 63,096,101 10,399,345 204,109
2008-09 657,390,497 110,104,822 2,161,037 496,502 117,750 2,311 657,886,999 110,222,572 2,163,348
Apr-09 56,210,317 11,433,625 238,847 113 20 0.42 56,210,430 11,433,645 238,848
May-09 48,285,515 12,272,524 256,372 393 80 1.67 48,285,908 12,272,604 256,374
Jun-09 52,408,197 15,319,804 320,029 5 0 0.00 52,408,202 15,319,804 320,029
April 09 - June 09
156,904,029 39,025,953 815,249 511 100 2.09 156,904,540 39,026,053 815,251
Note: For conversion of data in USD mn, the exchange rate of last day of March of the fi nancial year is taken for the full fi nancial year For data for April-June09, exchange rate of last day of June’09 is taken for conversion to USD mn.
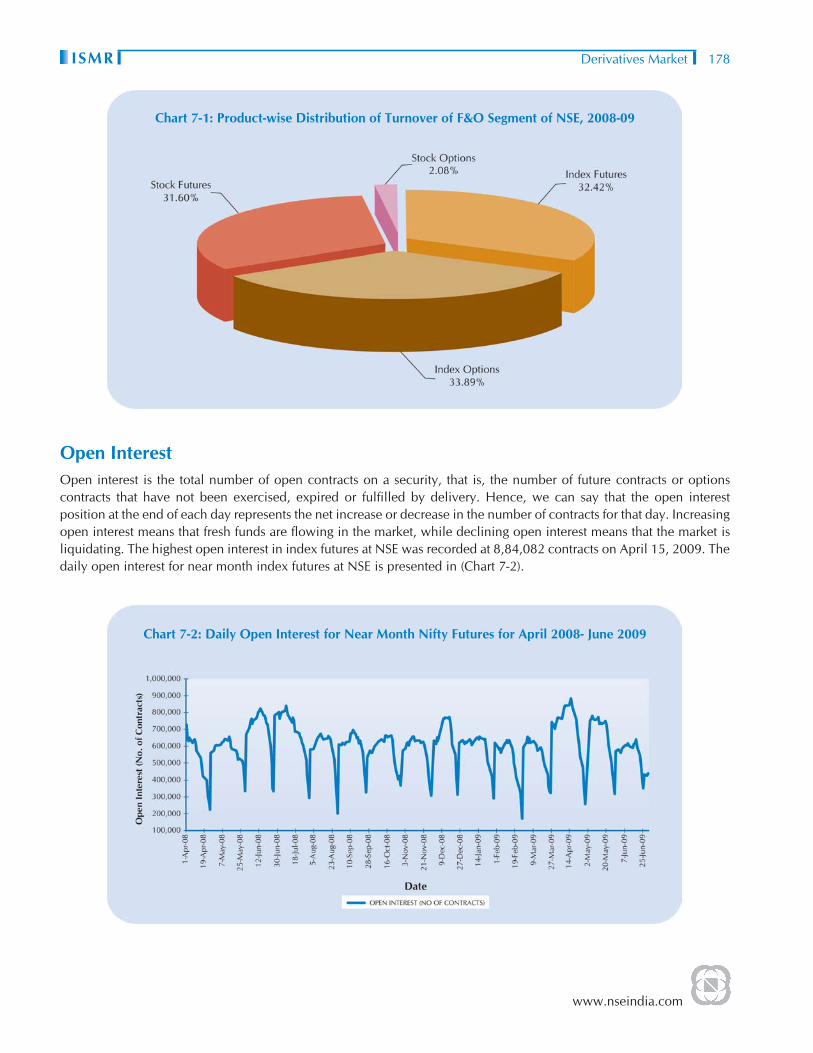
Looking at the product-wise turnover on the NSE (Table 7-6 and Chart 7-1), it is seen that stock futures which accounted for the highest percentage turnover among the various products (58%) in 2007-08, saw its share fall to 32% in 2008-09. On the other hand, the share of Index options increased dramatically from 10.4% in 2007-08 to 34% in 2008-09. The share of Index futures’ turnover in total turnover was 32% and that of stock options was 2% in 2008-09. Thus, it is seen that index options were more popular that stock futures during 2008-09. This trend continued in the fi rst quarter of 2009-10.
www.nseindia.com
Derivatives MarketISMR 178
Chart 7-1: Product-wise Distribution of Turnover of F&O Segment of NSE, 2008-09
Open InterestOpen interest is the total number of open contracts on a security, that is, the number of future contracts or options contracts that have not been exercised, expired or fulfi lled by delivery. Hence, we can say that the open interest position at the end of each day represents the net increase or decrease in the number of contracts for that day. Increasing open interest means that fresh funds are fl owing in the market, while declining open interest means that the market is liquidating. The highest open interest in index futures at NSE was recorded at 8,84,082 contracts on April 15, 2009. The daily open interest for near month index futures at NSE is presented in (Chart 7-2).
Chart 7-2: Daily Open Interest for Near Month Nifty Futures for April 2008- June 2009

www.nseindia.com
Derivatives Market ISMR179
Tabl
e 7-
6: P
rodu
ct w
ise
turn
over
on
the
deri
vativ
es s
egm
ent o
f NSE
Year
Inde
x Fu
ture
sSt
ock
Futu
res
Inde
x O
ptio
nsSt
ock
Opt
ions
Tota
lA
vera
ge
Dai
ly
Turn
-ov
er (R
s.
mn.
)
No.
of
cont
ract
sTu
rnov
er
(Rs.
mn.
)%
sh
are
in
tota
l tu
rn-
over
No.
of
cont
ract
sTu
rnov
er
(Rs.
mn.
)%
sh
are
in
tota
l tu
rn-
over
No.
of
cont
ract
sN
otio
nal
Turn
over
(R
s.m
n.)
%
shar
e in
to
tal
turn
-ov
er
No.
of
cont
ract
sN
otio
nal
Turn
over
(Rs.
mn)
%
shar
e in
to
tal
turn
-ov
er
No.
of c
on-
trac
tsTu
rnov
er
(Rs.
mn)
2004
-05
21,
635,
449
7,7
21,4
70
30
47,
043,
066
14,8
40,5
60
58
3,2
93,5
58
1,2
19,4
30
5
5,0
45,1
12
1,68
8,36
0 7
7
7,01
7,18
5 2
5,46
9,82
0 10
1,07
0
2005
-06
58,
537,
886
15,1
37,5
50
31
80,
905,
493
27,9
16,9
70
58
12,
935,
116
3,3
84,6
90
7
5,2
40,7
76
1,80
2,53
0 4
15
7,61
9,27
1 4
8,24
1,74
0 19
2,20
0
2006
-07
81,
487,
424
25,3
95,7
40
35
104,
955,
401
38,3
09,6
70
52
25,
157,
438
7,9
19,0
60
11
5,2
83,3
10
1,93
7,95
0 3
21
6,88
3,57
3 7
3,56
2,42
0 29
5,43
0
2007
-08
156,
598,
579
38,2
06,6
73
29
203,
587,
952
75,4
85,6
32
58
55,
366,
038
13,6
21,1
09
10
9,4
60,6
31
3,59
1,36
6 3
42
5,01
3,20
0 13
0,90
4,77
9 52
1,53
3
2008
-09
210,
428,
103
35,7
01,1
14
32
221,
577,
980
34,7
96,4
21
32
212,
088,
444
37,3
15,0
18
34
13,2
95,9
70
2,29
2,26
8 2
65
7,39
0,49
7 11
0,10
4,82
2 45
3,10
6
Apr
-08
12,
063,
172
2,8
01,0
03
37
15,
601,
531
3,3
69,0
09
44
5,3
65,2
31
1,3
35,6
49
17
699
,890
1
58,6
47
2
33,
729,
824
7,6
64,3
07
383,
215
May
-08
11,
161,
427
2,6
76,4
07
34
16,
693,
260
3,8
01,6
07
48
5,0
78,9
60
1,2
90,6
65
16
906
,408
2
10,4
05
3
33,
840,
055
7,9
79,0
83
398,
954
Jun-
08 1
7,94
1,87
0 3
,779
,390
3
5 1
9,15
4,94
6 3
,759
,867
3
5 1
3,56
4,43
6 3
,087
,086
2
8 9
39,8
77
214
,299
2
5
1,60
1,12
9 1
0,84
0,64
3 51
6,22
1
Jul-0
8 2
0,42
3,13
9 3
,953
,800
3
4 2
2,23
2,22
7 3
,826
,008
3
3 1
6,88
9,70
4 3
,572
,086
3
1 1
,252
,290
2
49,8
47
2
60,
797,
360
11,
601,
740
504,
423
Aug
-08
14,
433,
984
3,0
04,4
89
31
17,
594,
216
3,2
40,1
09
34
13,
835,
642
3,1
21,0
17
33
1,0
29,7
01
208
,834
2
4
6,89
3,54
3 9
,574
,448
47
8,72
2
Sep-
08 1
9,33
2,34
3 3
,801
,978
3
2 2
0,07
6,13
8 3
,327
,285
2
8 2
1,39
8,43
0 4
,616
,227
3
9 1
,304
,655
2
33,2
34
2
62,
111,
566
11,
978,
724
570,
415
Oct
-08
21,
649,
445
3,2
49,6
17
35
19,
858,
409
2,3
92,6
39
25
20,
737,
381
3,6
45,0
96
39
889
,593
1
29,1
11
1
63,
134,
828
9,4
16,4
62
470,
823
Nov
-08
19,
471,
367
2,5
69,4
97
34
17,
949,
270
1,8
72,1
13
25
19,
920,
924
2,9
21,3
43
39
803
,817
9
0,60
8 1
5
8,14
5,37
8 7
,453
,561
41
4,08
7
Dec
-08
20,
007,
895
2,6
99,9
73
33
22,
262,
785
2,3
04,6
56
28
21,
158,
779
3,1
36,1
54
38
1,3
64,3
07
150
,880
2
6
4,79
3,76
6 8
,291
,663
39
4,84
1
Jan-
09 1
7,69
5,54
2 2
,341
,405
3
0 2
2,81
4,33
2 2
,158
,303
2
8 2
1,21
5,67
1 3
,092
,713
4
0 1
,777
,120
1
88,7
62
2
63,
502,
665
7,7
81,1
84
389,
059
Feb-
09 1
5,75
0,76
7 2
,056
,792
2
9 1
7,15
6,83
8 1
,851
,210
2
6 2
1,47
5,20
1 3
,055
,990
4
3 1
,361
,770
1
59,7
11
2
55,
744,
576
7,1
23,7
03
374,
932
Mar
-09
20,
497,
152
2,7
66,7
65
27
10,
184,
028
2,8
93,6
17
28
31,
448,
085
4,4
40,9
92
43
966
,542
2
97,9
31
3
63,
095,
807
10,
399,
305
519,
965
Apr
-09
18,
662,
382
3,0
17,6
41
26
9,8
58,6
42
3,5
63,8
31
31
26,
881,
970
4,5
37,8
82
40
807
,323
3
14,2
71
3
56,
210,
317
11,
433,
625
672,
566
May
-09
16,
617,
516
3,1
74,1
51
26
9,5
28,1
78
4,4
81,5
48
37
21,
495,
541
4,3
05,1
47
35
644
,280
3
11,6
79
3
48,
285,
515
12,
272,
524
613,
626
Jun-
09 1
6,20
7,95
9 3
,469
,341
2
3 1
1,12
7,64
9 5
,896
,575
3
8 2
4,18
9,64
2 5
,456
,433
3
6 8
82,9
47
497
,455
3
5
2,40
8,19
7 1
5,31
9,80
4 69
6,35
5
(Apr
-June
09)
51,
487,
857
9,6
61,1
34
25
30,
514,
469
13,9
41,9
54
36
72,
567,
153
14,2
99,4
61
37
2,3
34,5
50
1,12
3,40
5 3
15
6,90
4,02
9 3
9,02
5,95
3 66
1,45
7

www.nseindia.com
Derivatives MarketISMR 180
Implied Interest Rate
In the futures market, implied interest rate or cost of carry is often used inter-changeably. Cost of carry is more appropriately used for commodity futures, as by defi nition it means the total costs required to carry a commodity or any other good forward in time. The costs involved are storage cost, insurance cost, transportation cost and the fi nancing cost. In case of equity futures, the carry cost is the cost of fi nancing minus the dividend returns. Assuming zero dividends, the only relevant factor is the cost of fi nancing.
Implied interest rate is the percentage difference between the future value of an index and the spot value, annualized on the basis of the number of days before the expiry of the contract. Carry of cost or implied interest rate plays an important role in determining the price differential between the spot and the futures market. The degree of relative costliness of a future rate can be assessed by comparing the implied rate with the spot rate. Implied interest rate is also a measure of profi tability of an arbitrage position. Theoretically, if the futures price is less than the spot price plus cost of carry or if the futures price is greater than the spot price plus cost of carry, arbitrage opportunities exist.
The futures prices are available for different contracts at different points of time. (Chart 7-3) presents Nifty 50 futures close prices for the near month contracts, and the spot Nifty 50 close values from April 2008 to June 2009. The difference between the future and the spot price is called basis. As the time to expiration approaches, the basis reduces. Daily implied interest rate for Nifty 50 futures from April 2008 to June 2009 is presented in (Chart 7-4). The implied interest rate for near month Nifty 50 futures as on last trading of the month is presented in (Table 7-7).
Chart 7-3: Nifty Futures and Spot Price (April 2008-June 2009)

www.nseindia.com
Derivatives Market ISMR181
Chart 7-4: Implied Interest Rate for Near Month Nifty Futures(April 1, 2008 to June 30, 2008)
Table 7-7: Implied Interest Rate for Near Month Nifty Futures (April 2008 - June 2009)
Month Expiry Date of near month Contract
Closing Future Price Closing Spot Price Implied Interest Rate (%)
Apr-08 24-Apr-2008 5188.80 5165.90 5.57
May-08 29-May-2008 4850.10 4870.10 -5.56
Jun-08 26-Jun-2008 3972.75 4040.55 -19.92
Jul-08 31-Jul-2008 4332.05 4332.95 0.00
Aug-08 28-Aug-2008 4370.55 4360.00 3.27
Sep-08 25-Sep-2008 3927.35 3921.20 1.97
Oct-08 29-Oct-2008 2881.90 2885.60 -1.67
Nov-08 28-Nov-2008 2756.25 2755.10 0.00
Dec-08 24-Dec-2008 2965.40 2959.15 2.66
Jan-09 29-Jan-2009 2868.15 2874.80 -3.13
Feb-09 26-Feb-2009 2735.50 2763.65 -13.84
Mar-09 26-Mar-2009 3015.25 3020.95 -2.38
Apr-09 29-Apr-2009 3473.90 3473.95 0.00
May-09 28-May-2009 4453.50 4448.95 1.38
Jun-09 25-Jun-2009 4289.75 4291.10 -0.38
Note: (1) The implied interest rate is calculated on the last trading day of the month for Near Month Nifty Futures (2) Number of days in a year have been taken as 365Source: NSE.
Implied Volatility
Volatility is one of the important factors, which is taken into account while pricing options. It is a measure of the amount and the speed of price change. To estimate future volatility, a time series analysis of historical volatility may be carried
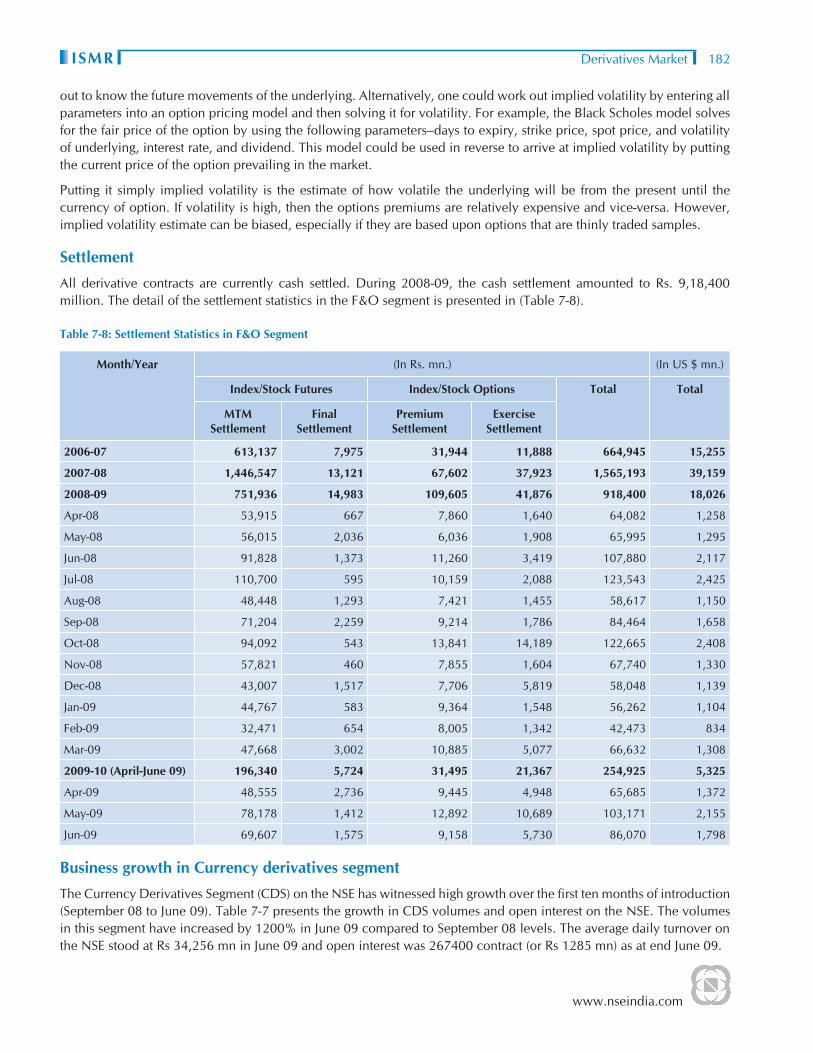
www.nseindia.com
Derivatives MarketISMR 182
out to know the future movements of the underlying. Alternatively, one could work out implied volatility by entering all parameters into an option pricing model and then solving it for volatility. For example, the Black Scholes model solves for the fair price of the option by using the following parameters–days to expiry, strike price, spot price, and volatility of underlying, interest rate, and dividend. This model could be used in reverse to arrive at implied volatility by putting the current price of the option prevailing in the market.
Putting it simply implied volatility is the estimate of how volatile the underlying will be from the present until the currency of option. If volatility is high, then the options premiums are relatively expensive and vice-versa. However, implied volatility estimate can be biased, especially if they are based upon options that are thinly traded samples.
Settlement
All derivative contracts are currently cash settled. During 2008-09, the cash settlement amounted to Rs. 9,18,400 million. The detail of the settlement statistics in the F&O segment is presented in (Table 7-8).
Table 7-8: Settlement Statistics in F&O Segment
Month/Year (In Rs. mn.) (In US $ mn.)
Index/Stock Futures Index/Stock Options Total Total
MTM Settlement
Final Settlement
Premium Settlement
Exercise Settlement
2006-07 613,137 7,975 31,944 11,888 664,945 15,255
2007-08 1,446,547 13,121 67,602 37,923 1,565,193 39,159
2008-09 751,936 14,983 109,605 41,876 918,400 18,026
Apr-08 53,915 667 7,860 1,640 64,082 1,258
May-08 56,015 2,036 6,036 1,908 65,995 1,295
Jun-08 91,828 1,373 11,260 3,419 107,880 2,117
Jul-08 110,700 595 10,159 2,088 123,543 2,425
Aug-08 48,448 1,293 7,421 1,455 58,617 1,150
Sep-08 71,204 2,259 9,214 1,786 84,464 1,658
Oct-08 94,092 543 13,841 14,189 122,665 2,408
Nov-08 57,821 460 7,855 1,604 67,740 1,330
Dec-08 43,007 1,517 7,706 5,819 58,048 1,139
Jan-09 44,767 583 9,364 1,548 56,262 1,104
Feb-09 32,471 654 8,005 1,342 42,473 834
Mar-09 47,668 3,002 10,885 5,077 66,632 1,308
2009-10 (April-June 09) 196,340 5,724 31,495 21,367 254,925 5,325
Apr-09 48,555 2,736 9,445 4,948 65,685 1,372
May-09 78,178 1,412 12,892 10,689 103,171 2,155
Jun-09 69,607 1,575 9,158 5,730 86,070 1,798
Business growth in Currency derivatives segment
The Currency Derivatives Segment (CDS) on the NSE has witnessed high growth over the fi rst ten months of introduction (September 08 to June 09). Table 7-7 presents the growth in CDS volumes and open interest on the NSE. The volumes in this segment have increased by 1200% in June 09 compared to September 08 levels. The average daily turnover on the NSE stood at Rs 34,256 mn in June 09 and open interest was 267400 contract (or Rs 1285 mn) as at end June 09.

www.nseindia.com
Derivatives Market ISMR183
Table: 7-9: Business Growth of Currency Futures
Month/ Year No. of Contracts Traded
Trading Value(Rs. mn)
Average Daily Trading Value
(Rs.mn)
Open Interest at the end of
No. of Contracts Trading Value(Rs. mn.)
* Sep-08 1,258,099 57,630 2,620 90,871 428
Oct 08 2,275,261 111,419 5,571 170,202 851
Nov 08 3,233,679 159,690 8,872 146,262 737
Dec 08 4,681,593 228,400 10,876 177,520 867
Jan 09 4,900,904 239,799 11,990 254,797 1,247
Feb 09 6,416,059 317,614 16,717 315,317 1,612
March 09 9,907,173 508,172 26,746 257,554 1,313
Aug-08-March 09 32,672,768 1,622,724 11,674 257,554 1,313
April 09 7,851,502 393,857 24,616 206,620 1,039
May 09 13,682,468 664,315 33,216 318,203 1,504
Jun 09 15,724,507 753,627 34,256 267,400 1,285
April-June 2009 37,258,477 1,811,798 31,238 267,400 1,285* Includes turnover details for August 29,2008- the fi rst day of trading of Currency futures at NSE.
Policy Debates2
Road Ahead for currency futures markets in India
Market statistics of the fi rst year of the launch of exchange traded currency futures reveal growing interest in the markets. However, these markets have not been able to evince the kind of activity that OTC markets are witnessing. Some of the limitations of these markets which have restricted its growth can be identifi ed as:
a. The positions limits for clients trading in this segment are USD 10 mn or 6% of open interest whichever is higher and for trading members it is USD 50 mn or 15% of open interest, whichever is higher, with the limit being USD 100 million or 15% of open interest for trading members who are banks. These limits are considered as a hindrance for larger transactions by market players.
b. To start with Foreign Institutional Investors (FIIs) have not been permitted to participate in the exchange traded currency markets. This has in effect restricted the liquidity that FIIs could have otherwise created. FIIs are already active in Dubai Gold and Commodity Exchange (DGCX). There is opportunity for business for domestic exchanges and intermediaries to be created in bringing this market onshore.
c. The offshore Non Deliverable Forward (NDF) market in the Indian Rupee has been witnessing increasing volumes. Deutsche Bank estimates average daily trading volume of USD 800 million during 2008-09 in the NDF markets for Indian rupee3. Most major foreign banks offer NDFs, but Indian banks are barred from doing so. These markets have evolved for the Indian Rupee, as for other emerging market currencies, following foreign exchange convertibility restrictions. It is serving as an avenue for non-domestic players, private companies and investors in India to hedge foreign currency exposure. This market also derives liquidity from non-residents wishing to speculate in the Indian rupee without exposure to the currency and from arbitrageurs who try to exploit the differentials in the prices in the onshore and offshore markets. Though foreign investors can now transact in the onshore Indian forward markets with greater fl exibility (following various measures listed
2 The views and approaches refl ected in the policy debates are not necessarily of the NSE.3 Reported in Asian Capital Markets Monitor of ADB, April, 2009.

www.nseindia.com
Derivatives MarketISMR 184
earlier in the paper), allowing them access to the exchange traded currency futures platform would further help in getting the volumes in the NDF market onshore and enhance the liquidity on the domestic exchanges.
Introduction of Credit derivatives
The discussion among the regulators on the introduction of credit derivative products in India dates back to 2003 when an internal “Working Group on introduction of Credit Derivatives in India” of the Reserve Bank of India (RBI) came out with its recommendations on the road map for launch of this product. The Group recognized the importance of credit derivatives for the banking sector in particular, as a means to diversify credit risk, improve earning and lower its risk profi le. It recommended that, to begin with, banks, fi nancial institutions, NBFCs, mutual funds, insurance companies and corporates may be allowed to introduce credit derivatives subject to compliance with certain risk management parameters, exposure norms, capital adequacy requirements etc. This was envisaged to be allowed for the purpose of managing credit risk and not to take positions with a trading intent. Further, banks were to be permitted to use only simple credit derivative structures like CDS and CLN involving single reference entities. It was proposed that non-resident entities cannot be parties to credit derivative transactions in the domestic market for the present.
However, the recommendations of the report were not carried forward and RBI, in May 2007 issued draft guidelines for introduction of CDS. The draft regulation proposed introduction of single entity CDS instruments allowing protection selling and buying to residential fi nancial entity. However, this too has not been carried forward since RBI is taking a very cautious approach to the whole issue particularly in the light of the sub-prime crisis.
RBI’s Committee on Financial Sector Assessment (CFSA), which submitted its report in May, 2009, on the issue of credit derivatives, noted as follows:
“The unbridled proliferation of complex credit derivatives and excessive risk transfer by adoption of the originate-to-distribute model is recognised as one of the root causes of the current fi nancial crisis. The recent credit turmoil has also underscored the importance of liquidity risk arising from off-balance sheet commitments, implicit or explicit, of the credit intermediaries. The Reserve Bank had put in place regulatory guidelines that were aligned with global best practices while tailoring them to meet country-specifi c requirements. While the development of markets for credit derivatives and asset securitization products could play a critical role in furthering economic growth, this requires to be pursued in a gradual manner by sequencing reforms and putting in place appropriate safeguards before introduction of such products.”
Thus, for the present, introduction of this product in India has been kept on hold.
Way forward
It is widely held that the US sub-prime crisis in the housing mortgage market has been aggravated partly because the mortgages had been repackaged and sold as collateralised debt obligations and other exotic derivative products to fi nancial institutions, pension funds and individuals. Thus, agents not directly involved in the sub-prime market have also been impacted as their asset quality has deteriorated. Notwithstanding this the basic logic and arguments in favour of derivatives of this kind, mainly that of effi ciently managing credit risk, continues to hold strong. There is a need to recognise that the main problems that arose out of the credit derivatives markets were primarily because of its OTC nature, which implied no or minimal regulatory oversight. India can benefi t from the lapses of the developed world in effectively controlling this market and develop exchange traded markets for this product rather than largely unregulated OTC markets. This will be adding another new product in the array of derivative products available to market participants, along with ensuring market discipline.
Related Documents