Electronic copy available at: http://ssrn.com/abstract=1727412 Dubravko Mihaljek dubravko.mihaljek@bis.org Frank Packer frank.packer@bis.org Derivatives in emerging markets 1 Turnover of derivatives has grown more rapidly in emerging markets than in developed countries. Foreign exchange derivatives are the most commonly traded of all risk categories, with increasingly frequent turnover in emerging market currencies and a growing share of cross-border transactions. As the global reach of the financial centres in emerging Asia has expanded, the offshore trading of many emerging market currency derivatives has risen as well. Growth in derivatives turnover is positively related to trade, financial activity and per capita income. JEL classification: F31, G15, G20, P45. This article represents a first attempt to review derivatives markets in emerging market economies (EMEs) on a comprehensive basis. We try to answer some basic questions: How big are the derivatives markets in EMEs? What are their structure and dynamics? Which derivatives are traded in EMEs, and who trades them? How does this all differ from mature markets? In which emerging market countries are derivatives most traded? Which factors might explain differences in the growth of derivatives markets across countries and time? The picture of derivatives markets in EMEs that one gets from the existing literature is highly fragmented. Most evidence is limited to individual countries, types of derivatives or specific episodes of market development. One reason for this fragmentation is the lack of a unified database; another is the lack of familiarity with existing data sources. This paper aims to start filling this gap. It combines data from the Triennial Central Bank Survey of OTC derivatives market activity with those on derivatives traded on emerging market exchanges. The Triennial survey provides a unique snapshot of OTC derivatives activities in emerging markets, at a level of granularity and multidimensionality that is unmatched. 2 In turn, data on exchange-traded derivatives, compiled by commercial providers and published on a regular basis in the BIS Quarterly Review, provide detailed information on standardised derivative contracts listed and traded on emerging market exchanges. 1 We are grateful to Claudio Borio, Stephen Cecchetti, Robert McCauley and Christian Upper for helpful comments and discussions, and to Branimir Grui ć, Emese Kuruc and Carlos Mallo for excellent research assistance. The views expressed in this article are those of the authors and do not necessarily reflect those of the BIS. 2 Detailed results of the FX part of the 2010 Triennial survey are available at www.bis.org/publ/rpfx10.htm. BIS Quarterly Review, December 2010 43

Welcome message from author
This document is posted to help you gain knowledge. Please leave a comment to let me know what you think about it! Share it to your friends and learn new things together.
Transcript

Electronic copy available at: http://ssrn.com/abstract=1727412
Dubravko Mihaljek
Frank Packer
Derivatives in emerging markets1
Turnover of derivatives has grown more rapidly in emerging markets than in developed countries. Foreign exchange derivatives are the most commonly traded of all risk categories, with increasingly frequent turnover in emerging market currencies and a growing share of cross-border transactions. As the global reach of the financial centres in emerging Asia has expanded, the offshore trading of many emerging market currency derivatives has risen as well. Growth in derivatives turnover is positively related to trade, financial activity and per capita income.
JEL classification: F31, G15, G20, P45.
This article represents a first attempt to review derivatives markets in emerging
market economies (EMEs) on a comprehensive basis. We try to answer some
basic questions: How big are the derivatives markets in EMEs? What are their
structure and dynamics? Which derivatives are traded in EMEs, and who
trades them? How does this all differ from mature markets? In which emerging
market countries are derivatives most traded? Which factors might explain
differences in the growth of derivatives markets across countries and time?
The picture of derivatives markets in EMEs that one gets from the existing
literature is highly fragmented. Most evidence is limited to individual countries,
types of derivatives or specific episodes of market development. One reason
for this fragmentation is the lack of a unified database; another is the lack of
familiarity with existing data sources. This paper aims to start filling this gap. It
combines data from the Triennial Central Bank Survey of OTC derivatives
market activity with those on derivatives traded on emerging market
exchanges. The Triennial survey provides a unique snapshot of OTC
derivatives activities in emerging markets, at a level of granularity and
multidimensionality that is unmatched.2 In turn, data on exchange-traded
derivatives, compiled by commercial providers and published on a regular
basis in the BIS Quarterly Review, provide detailed information on standardised
derivative contracts listed and traded on emerging market exchanges.
1 We are grateful to Claudio Borio, Stephen Cecchetti, Robert McCauley and Christian Upper
for helpful comments and discussions, and to Branimir Gruić, Emese Kuruc and Carlos Mallo for excellent research assistance. The views expressed in this article are those of the authors and do not necessarily reflect those of the BIS.
2 Detailed results of the FX part of the 2010 Triennial survey are available at www.bis.org/publ/rpfx10.htm.
BIS Quarterly Review, December 2010 43

Electronic copy available at: http://ssrn.com/abstract=1727412
Together, these two data sources enable us to start mapping the world of
derivatives in emerging markets.
Our main findings are as follows. First, daily turnover in derivatives
markets in EMEs has expanded four times over the past decade, to over 6% of
emerging market GDP. Second, derivatives in emerging markets are traded in
almost equal proportions over the counter and on exchanges. Third, unlike in
advanced economies, FX derivatives are still the most traded derivatives in
EMEs (50% of total turnover), while interest rate derivatives remain
underdeveloped. Fourth, the FX derivatives turnover in emerging markets is
becoming increasingly global, with a growing share of transactions being done
cross-border, and transactions in emerging market currencies increasingly
taking place offshore. Fifth, the largest derivatives markets in EMEs are located
in Korea, Brazil and the two Asian financial centres of Hong Kong SAR and
Singapore. And sixth, trade, financial activity and per capita GDP are positively
related to the growth of derivatives markets in EMEs.
The remainder of this article is organised as follows. The first section
looks at the size, structure and growth of derivatives markets at an aggregate
emerging market level. The second section focuses on OTC derivatives,
comparing the markets in EMEs and advanced economies. The third section
further disaggregates the data on derivatives at the regional and country levels.
The fourth section attempts to identify factors underpinning the growth in FX
derivatives turnover. The final section concludes.
The size and structure of derivatives markets in EMEs
Derivatives markets in EMEs remain small compared to those in advanced
economies. Average daily turnover of derivatives in 33 EMEs for which data
are available was $1.2 trillion in April 2010 (6.2% of those economies’ GDP),
compared to $13.8 trillion (36% of GDP) in advanced economies.3 Though
small, derivatives markets in EMEs have expanded rapidly: average daily
turnover has increased by 300% since 2001, and by 25% over the past three
years, despite the crisis in 2008–09 (Graph 1, left-hand panel). This was higher
than the growth of turnover in advanced economies (250% since 2001, and
22% since 2007).
Rapid growth of turnover …
OTC derivatives are relatively more important in emerging markets than in
advanced economies. In EMEs, derivatives are traded in almost equal
proportions over the counter and on exchanges (Graph 1, centre and right-
hand panels). By comparison, in advanced economies almost two thirds of
derivatives are traded on exchanges (right-hand panel) and 38% over the
counter (centre panel). Furthermore, the relative size of the exchange-traded
… in both OTC and exchange-traded markets
3 In this paper we focus on derivatives traded in emerging market countries rather than
derivatives in emerging market risk traded worldwide. One exception is OTC foreign exchange derivatives in emerging market currencies (see below). The aggregate figures in this section cover foreign exchange and interest rate derivatives (both OTC and exchange-traded) and exchange-traded equity-linked derivatives. Commodity derivatives and credit default swaps are not considered in this article. For details on the methodology and changes in coverage in the 2010 Triennial Survey, see King and Mallo (this issue)
44 BIS Quarterly Review, December 2010

Electronic copy available at: http://ssrn.com/abstract=1727412
Derivatives turnover in advanced and emerging markets1 Daily average turnover in April, in billions of US dollars
Derivatives turnover in emerging markets OTC derivatives2 Exchange-traded derivatives2
0
2,000
4,000
6,000
8,000
Advancedeconomies
Emergingmarket
economies
FX derivativesIR derivatives
derivatives market is distorted by two special cases with well developed
derivatives exchanges, Brazil and Korea, which together account for nearly
90% of all emerging market turnover of exchange-traded derivatives.
Derivatives in EMEs are used mainly to hedge or speculate on exchange
rate and, to a lesser extent, equity market risk. FX derivatives account for 50%
of total turnover in emerging markets, equity-linked derivatives for 30% and
interest rate derivatives for the rest. By contrast, derivatives in advanced
economies are used by and large to trade interest rate risk (77% of total
turnover), with FX derivatives and in particular equity-linked derivatives being
less important. These differences reflect above all the depth and liquidity of
bond and money markets in developed countries, and the relatively limited
concern with exchange rate risk in advanced compared to emerging market
economies.
The sections that follow further disaggregate these data. We first take a
look at OTC derivatives at the aggregate emerging market level, and then at
derivatives markets in individual emerging market countries.
OTC derivatives markets
Over-the-counter derivatives represent the most developed segment of the
derivatives market in EMEs. The average daily turnover of OTC derivatives in
April 2010 was $625 billion, or roughly 3% of EMEs’ (annual) GDP.4 The OTC
market in EMEs is dominated by FX derivatives, which account for nearly 90%
of total turnover, versus 50% in advanced economies. Despite these
4 By comparison, the average daily turnover of OTC derivatives in advanced economies was
$5.3 trillion (13% of their GDP).
0
300
600
900
1,200
1998 2001 2004 2007 2010
Exchange-traded derivativesOTC derivatives
Equity-linked derivatives
0
2,000
4,000
6,000
8,000
Advancedeconomies
Emergingmarket
economies
1 OTC derivatives are adjusted for local inter-dealer double-counting (ie “net-gross” basis). OTC derivatives comprise FX derivatives and interest rate derivatives; exchange-traded derivatives comprise FX derivatives, interest rate derivatives and equity-linked derivatives. OTC FX derivatives comprise outright forwards, FX swaps, currency swaps, currency options and other FX products. OTC interest rate derivatives comprise forward rate agreements, interest rate swaps, interest rate options and other interest rate products. Exchange-traded derivatives comprise futures and options. 2 In April 2010.
Source: Triennial Central Bank Survey. Graph 1
FX derivatives most important in EMEs
BIS Quarterly Review, December 2010 45

differences, trading of OTC derivatives in EMEs has converged towards
advanced economy patterns in terms of instruments, counterparties and
currencies being traded.
OTC foreign exchange derivatives
The turnover of OTC foreign exchange derivatives in EMEs – $535 billion per
day in April 2010 (Table 1) – increased 24% between 2007 and 2010. This
represents a slowdown compared to the previous three-year period, when
turnover almost doubled, but was much faster than the growth in advanced
economies (just 5.6%). No doubt the recent financial crisis has taken some of
the shine off the use of OTC foreign currency derivatives in advanced
economies, particularly FX swap markets, where growth over the entire three-
year period was only 0.3%. At the same time, the financial crisis had a
relatively small impact on FX derivatives markets in emerging market
economies.
Geographical distribution of OTC foreign exchange derivatives turnover1 Daily averages in April
In billions of US dollars Percentage share2
2004 2007 2010 2010
Total emerging market economies 222 430 535 100 Total advanced economies 1,546 2,546 2,689 503
Asia 184 354 442 83 Hong Kong SAR 70 143 194 36
Singapore 91 153 175 33
China … 1 11 2
India 3 24 14 3
Korea 10 18 25 5
Other 9 16 22 4
Latin America 7 14 21 4 Brazil 1 1 5 1
Mexico 5 11 12 2
Other 1 3 4 1
Central and eastern Europe 19 43 50 9 Poland 5 7 6 1
Russia 6 16 19 4
Turkey 2 3 11 2
Other 6 17 13 2
Other emerging market economies 12 19 22 4 South Africa 8 11 10 2
Other 4 8 12 2
1 Outright forwards, FX swaps, currency swaps, currency options and other FX products. The category “other FX products” covers highly leveraged transactions and/or trades whose notional amount is variable and where a decomposition into individual plain vanilla components was impractical or impossible. Adjusted for local inter-dealer double-counting (ie “net-gross” basis). 2 As a percentage of total emerging market economies.
Source: Triennial Central Bank Survey. Table 1
Higher turnover of FX derivatives despite the crisis
46 BIS Quarterly Review, December 2010

Foreign exchange derivatives turnover by instrument, counterparty and location1
Daily averages in April, in billions of US dollars and percentages
Emerging market economies Advanced economies
2004 2007 2010 % share 2010 % share
OTC FX derivatives2 159 299 380 100 2,110 100
Outright forwards3 21 47 73 19 402 19
FX swaps3 125 231 277 73 1,488 71
Currency swaps 3 4 7 2 36 2
Currency options and others4 10 18 24 6 184 9
With reporting dealers 91 184 221 58 809 38
With other financial institutions 44 70 115 30 1,029 49
With non-financial customers 20 45 44 12 271 13
Local 61 108 127 33 700 33
Cross-border 94 191 254 67 1,410 67
Memo: Spot transactions3 119 188 203 100 1,287 100
Local 52 84 84 42 484 38
Cross-border 67 104 119 58 803 62
Derivatives/spot ratio5 1.3 1.6 1.9 1.6 1 Adjusted for local and cross-border inter-dealer double-counting (ie “net-net” basis). 2 Due to incomplete reporting, components do not always add up to totals. 3 Previously classified as part of the so-called traditional FX market. 4 The category “other FX products” covers highly leveraged transactions and/or trades whose notional amount is variable and where a decomposition into individual plain vanilla components was impractical or impossible. 5 Ratio of foreign exchange derivatives to spot transactions.
Source: Triennial Central Bank Survey. Table 2
In terms of FX instruments, the OTC markets in EMEs have already
converged to the advanced economies’ pattern. In both groups of countries, FX
swaps comprise the lion’s share of turnover (over 70%), followed by outright
forwards (19%), options and currency swaps (Table 2). The relative size of FX
spot and derivatives markets has also converged. The ratio of FX derivatives to
spot transactions increased in EMEs to 1.9 in 2010 (Table 2), continuing the
steady rise evident since 1998. Meanwhile, the ratio of derivatives to spot
transactions in advanced economies declined to 1.6 in 2010.5
Instruments similar to advanced economies
Turning to the question of who is trading derivatives in emerging markets,
we see that trades with other financial institutions – such as pension funds and
hedge funds – increased the most, to 30% of total turnover in 2010 (Table 2).
At the same time, the shares of trade with other reporting dealers (usually
commercial and investment banks) and non-financial customers declined to
58% and 12%, respectively. The shift towards trading with financial customers
represents the resumption of a trend that started in 1998, when the share of
this counterparty type was as low as 15%. The trend is present across all
foreign exchange instruments, especially the three largest categories.
Shift towards trading with financial customers …
5 The fact that the ratio of FX derivatives to spot transactions in developed countries fell below
that in emerging markets probably reflects the degree to which FX swap markets were dislocated in developed countries and became illiquid during the 2007–09 crisis (Baba and Packer (2009), CGFS (2010)). Given that strains in FX swap markets first became apparent in advanced economies, the shift towards spot transactions was more evident there.
BIS Quarterly Review, December 2010 47

Increased dealing with other financial institutions (to nearly 50% of total
turnover) can also be seen in developed countries.
Factors underpinning the shift towards trading with financial customers
include the increasingly active pursuit of carry trades and other short-term
investment strategies. Indeed, many high interest rate currencies commonly
identified as carry trade targets, such as the Australian dollar, the Indian rupee
and the Korean won, experienced particularly strong growth over the past three
years. In addition to these factors, noted already by the analysts of earlier
Triennial surveys (Galati and Melvin (2004), Galati and Heath (2007)), high-
frequency trading, which is more prevalent in financial centres such as
Singapore, also appears to have contributed to the FX turnover growth (King
and Rime (2010)).
Convergence towards developed country patterns is also evident in the
shift towards cross-border transactions (Table 2). Counterparties to FX
derivatives trades are increasingly from different reporting jurisdictions: the
share of cross-border transactions grew to 67% in 2010 from 59% in 2004. This
is the same as the share of cross-border transactions in advanced economies.
OTC interest rate derivatives
The interest rate derivatives markets in EMEs are much smaller than the FX
markets, with total daily turnover of $90 billion in April 2010 (Table 3). In sharp
OTC interest rate derivatives turnover in emerging markets1 Daily averages in April
In billions of US dollars Percentage share2
2004 2007 2010 2010
Total emerging market economies3 31 98 90 100 Total advanced economies3 1,301 2,075 2,564 2,849
Asia3 23 86 73 81 Hong Kong SAR 11 17 18 21
Singapore 9 57 35 38
Korea 1 5 11 12
Other 2 5 9 10
Latin America3 2 3 9 10 Brazil 1 0 7 8
Mexico 1 3 1 2
Central and eastern Europe3 2 4 2 2 Poland 1 3 2 2
Other emerging market economies3 3 5 6 7
With reporting dealers4 12 43 39 61
With other financial institutions 9 20 22 34
With non-financial customers 1 3 3 5
1 Forward rate agreements, interest rate swaps, interest rate options and other interest rate products. 2 As a percentage of total emerging market economies; percentage share for the breakdown by counterparty is calculated using the total ($64 billion) adjusted for local and cross-border inter-dealer double-counting (ie “net-net” basis). 3 Adjusted for local inter-dealer double-counting (ie “net-gross” basis). 4 Adjusted for local and cross-border inter-dealer double-counting (ie “net-net” basis).
Source: Triennial Central Bank Survey. Table 3
Interest rate derivatives turnover is smaller …
More derivatives traded cross-border
… possibly driven by carry trades
48 BIS Quarterly Review, December 2010

contrast to the FX derivatives market, turnover of interest rate derivatives
decreased by 8% since 2007. Meanwhile, in advanced economies interest rate
derivatives turnover increased by 24%. Note, however, that the decrease in
turnover in emerging markets represents one exceptional case rather than a
trend – a major dealer, which accounted for 40–50% of interest rate derivatives
trading in emerging Asia in 2007, shifted its trading desk out of the region
during the crisis. Net of trades by that desk, turnover of interest rate derivatives
in emerging markets nearly tripled, which compares with growth in the previous
three-year period.
The overall activity in interest rate derivatives in EMEs nevertheless
remains extremely low relative to that in advanced economies: emerging
market turnover is less than 4% of the global total, versus 15% for FX
derivatives turnover. This asymmetry – also noted by Saxena and Villar (2008)
– probably reflects the lagging development and liquidity of emerging market
bond and money markets relative to those in developed countries.
… as local money and bond markets lag behind FX markets
The relative immaturity of interest rate derivatives markets in EMEs is also
apparent in the degree to which trading still takes place with reporting dealers
(61% of total turnover; Table 3). By contrast, in advanced economies there has
been a long-standing shift of OTC derivatives trading – similar to FX derivatives
– away from reporting dealers, which constituted over 60% of turnover in 2001,
but only 43% in 2010.
Currency composition of OTC derivatives in emerging markets
According to the 2010 Triennial, the US dollar remains the pre-eminent global
currency in OTC derivatives markets of EMEs. In the FX derivatives markets,
the dollar was one of the currencies in more than 95% of transactions in 2010
(Table 4). This fraction was virtually unchanged from the 2007 survey, thus
confirming the dollar’s ongoing status as the leading currency for international
financial transactions, paralleling its continued leading role in critical areas of
international trade and finance (Goldberg (2010)). Even for the currencies of
central and eastern European countries, which have strong economic linkages
with the euro area, the dollar is the cross-currency for FX derivatives
transactions more frequently than the euro.6 It is also striking that the
dominance of the US dollar is much greater in emerging market venues than
elsewhere – worldwide, 85% of the transactions are dollar-denominated.
US dollar still the currency of choice for EMEs …
Another interesting development is that emerging market currencies
gained share in EMEs’ FX derivatives trading. The percentage of transactions
in EMEs involving emerging market currencies on one side increased to 60% in
2010 from 55% in 2007 (out of a potential 200%).7 By contrast, the turnover of
… but EME currencies gain market share in FX derivatives …
6 According to the 2010 Triennial, OTC turnover in FX derivatives on the Hungarian forint-dollar,
Polish zloty-dollar and Czech koruna-dollar currency pairs was higher than that on the forint-euro, zloty-euro and koruna-euro pairs, by about 260%, 150% and 30%, respectively. See BIS (2010a, p 57), for a discussion of the dollar’s resilience as a means of exchange during the crisis, with a focus on forward trading of the forint and zloty.
7 This percentage is smaller for transactions in Hong Kong and Singapore than in other emerging markets, where trading in developed country currency pairs is less common.
BIS Quarterly Review, December 2010 49

OTC foreign exchange derivatives turnover by currency1
Daily averages in April, percentage shares
2004 2007 2010
US dollar 95.5 95.2 94.7
Euro 19.3 15.1 15.8
Japanese yen 16.6 14.0 9.7
Australian dollar 7.5 5.7 8.0
Pound sterling 7.9 6.7 4.3
Swiss franc 1.5 2.4 1.2
Hong Kong dollar 12.4 17.3 15.9
Korean won 6.3 6.2 8.3
Singapore dollar 4.9 6.2 6.7
Chinese renminbi 0.4 1.6 4.8
Indian rupee 2.0 4.5 4.4
Russian rouble 1.1 2.0 2.6
Mexican peso 1.9 2.7 1.8
South African rand 3.1 2.2 1.6
Brazilian real 0.7 0.2 1.0
Polish zloty 1.7 1.2 0.9
Emerging market currencies 43.5 55.0 60.4 1 Outright forwards, FX swaps, currency swaps, currency options and other FX products. Because two currencies are involved in each transaction, the sum of the percentage shares of individual currencies totals 200% instead of 100%. Because not all of the currencies are listed in the table, the total of the listed percentage shares is less than 200%. Adjusted for local and cross-border inter-dealer double-counting (ie “net-net” basis).
Source: Triennial Central Bank Survey. Table 4
global reserve currencies other than the US dollar – such as the euro, yen,
pound sterling and Swiss franc – generally declined in relative terms in 2010. In
particular, the share of the Swiss franc halved, probably reflecting the
unwinding of derivatives positions which had hedged Swiss franc loans made in
emerging Europe before the crisis. The Australian dollar was an exception
among advanced economy currencies, as its share in total turnover in EMEs
increased to around 8%, which is quite similar to its share in advanced
economies. This undoubtedly reflected Australia’s position as a major supplier
of commodity exports to much of emerging Asia.
Within interest rate derivatives turnover, the US dollar also plays an
important, though not quite as dominant, role, constituting nearly 20% of all
turnover in emerging markets. However, the dollar’s share is much higher than
that of currencies of other major advanced economies – for instance, the share
of euro interest rate derivatives turnover stands at just 8%. Interest rate
derivatives in emerging markets are distinguished by the outsized growth of
turnover in the Korean won, which in 2010 constituted more than one quarter of
all turnover of interest rate derivatives in emerging markets.
… and interest rate derivatives trade
50 BIS Quarterly Review, December 2010

Where have derivatives markets grown the most?
Four emerging market economies stand out in terms of the size and maturity of
their derivatives markets: Korea, Brazil and the two Asian financial centres of
Hong Kong and Singapore. Brazil and Korea are exceptional in terms of the
size of their exchange-traded derivatives markets, and Hong Kong and
Singapore in terms of their OTC derivatives markets (Graph 2, left-hand panel).
In addition, no less than 10 EMEs now have total daily derivatives turnover of
around $10 billion or more (right-hand panel).
Brazil is outstanding in terms of the turnover of interest rate and FX
derivatives traded on its exchanges. The former doubled between 2007 and
2010, and the latter increased by 45%. Market in exchange-traded derivatives
in Brazil dwarfs that of OTC derivatives: average daily turnover of exchange-
traded FX derivatives in April 2010 was $31 billion, versus $5 billion in OTC
markets, and that of interest rate derivatives as much as $126 billion, versus
$7 billion in OTC instruments.
High turnover of interest rate derivatives in Brazil …
The other major centre for exchange-traded derivatives is Korea, with
$2 billion daily turnover in FX and $8 billion in interest rate derivatives in April
2010. Elsewhere, the FX derivatives turnover on exchanges in Mexico and
Russia has doubled since 2007, while in India turnover of FX derivatives
surged to $4 billion per day in April 2010, within just a year or so of their
launching on the local exchange.
Several EMEs, above all Korea, also have very large turnover of equity-
linked derivatives. With $270 billion daily turnover of these derivatives in April
2010, the Korea Exchange was second globally only to the United States’ CME
Group – and trailing closely behind it. Significant trading of equity-linked
derivatives also takes place on exchanges in Brazil, Hong Kong, India and
Singapore ($12–16 billion daily in April 2010), as well as in China, Israel and
Derivatives turnover in emerging markets in 20101 Daily average turnover in April, in billions of US dollars
0
100
200
300
KR HK SG BR
0
20
40
60
IN RU CN ZA IL MX TR TW PL TH
Exchange-traded derivativesOTC derivatives
BR = Brazil; CN = China; HK = Hong Kong SAR; IL = Israel; IN = India; KR = Korea; MX = Mexico; PL = Poland; RU = Russia; SG = Singapore; TH = Thailand; TR = Turkey; TW = Chinese Taipei; ZA = South Africa.
1 OTC derivatives are adjusted for local inter-dealer double-counting (ie “net-gross” basis). OTC derivatives comprise FX derivatives and interest rate derivatives; exchange-traded derivatives comprise FX derivatives, interest rate derivatives and equity-linked derivatives. OTC FX derivatives comprise outright forwards, FX swaps, currency swaps, currency options and other FX products. OTC interest rate derivatives comprise forward rate agreements, interest rate swaps, interest rate options and other interest rate products. Exchange-traded derivatives comprise futures and options.
Source: 2010 Triennial Central Bank Survey. Graph 2
… and of equity-linked derivatives in Korea
BIS Quarterly Review, December 2010 51
Russia ($3–9 billion daily). Although still increasing, growth in turnover of
equity-linked derivatives has slowed considerably since 2007, reflecting the
general decline in stock market activity after the crisis. In particular, income
losses due to the crisis seem to have affected previously widespread margin
trading by households on several Asian exchanges.
Trading of OTC derivatives is highly concentrated in Hong Kong and
Singapore. The two financial centres together accounted for 69% of all OTC
foreign exchange and 59% of all interest rate OTC derivatives turnover in
EMEs in April 2010. Hong Kong increased its share in FX turnover between
2007 and 2010 (to 36% of the EME total), while Singapore’s share decreased
(to 33%). In trading of interest rate derivatives, Singapore maintained its
dominant position (39% of the EME total).
OTC derivatives traded most in Hong Kong and Singapore
Outside those two financial centres, trading of OTC derivatives has made
notable strides in several countries. China, Brazil and Turkey have seen
remarkable growth in FX derivatives – in China, turnover has risen by a factor
of 10 since 2007, albeit from a very low base (Table 1). Trading in OTC interest
rate derivatives has also surged in Brazil and Korea – in Brazil, from
$100 million per day in April 2007 to $7 billion per day in April 2010 (Table 3).
Compared with the mid-2000s, when only a few countries had average daily
turnover of OTC derivatives around $1 billion, in 2010 every emerging market
region had at least one country with more than $10 billion in daily turnover. In
Asia, these were China, Chinese Taipei, India and Korea; in Latin America,
Mexico; and elsewhere, Russia, Turkey and South Africa. Strong growth of
international trade over the past decade, the rapid spread of financial
globalisation and regulatory reforms in individual emerging market countries
have all contributed to these developments.
Other EMEs expand derivatives trade …
The recent crisis has dented the growth of OTC derivatives markets
mainly in central and eastern Europe, which was seriously affected by the
contraction of cross-border financing during the crisis. The Baltic states,
Hungary and Poland experienced decreases in FX derivatives turnover ranging
from 15 to 30% between 2007 and 2010. As demand for major currencies in
both onshore cash markets and short-term credit markets surged in October
2008, banks in these countries had major difficulties exchanging euros and
Swiss francs for domestic currency in foreign currency swap markets. This
prompted several central banks to step in as counterparties in swap
transactions and to lend euros to local banks. Since mid-2009, local FX swap
markets have gradually recovered. That said, with the exception of Poland they
are not likely to return to pre-crisis levels of activity in the near term, given the
ongoing contraction of foreign currency lending.8
… except in central and eastern Europe
Regarding the amounts outstanding of OTC derivatives, emerging Asia
was clearly ahead of other regions in terms of FX derivatives, but not in terms
Asia and South Africa top in amounts outstanding
8 India was the only emerging market outside of central and eastern Europe to experience a
decrease in OTC turnover over the past three years (of 40%); however, this development reflects the shift in FX derivatives trading to an organised exchange rather than any crisis-related developments.
52 BIS Quarterly Review, December 2010
of interest rate derivatives.9 The total notional amount outstanding of OTC
foreign exchange derivatives by banks headquartered in Asia at the end of
June 2010 was $1.7 trillion, compared to $150–280 billion by banks from other
regions. At the same time, the total notional amount outstanding of OTC
interest rate derivatives in emerging Asia was $1.8 trillion, and in all other
EMEs as much as $1.7 trillion. The latter is largely due to South African banks,
reflecting the country’s well developed and mature financial system. The
amounts outstanding of interest rate derivative contracts at end-June 2010 in
Latin America ($120 billion) and central and eastern Europe ($70 billion) were
a fraction of these figures. This might reflect the importance of major
international banks operating subsidiaries in these two regions, which report
their derivatives positions in the country of their headquarters.
Trends in the global hubs and offshore trading
As noted earlier, emerging markets include global financial centres where other
currencies are commonly traded. While the role of the Singapore and Hong
Kong dollars is significant in Asian markets, much more noticeable is the
degree to which the two centres serve as a trading platform for other
currencies.10
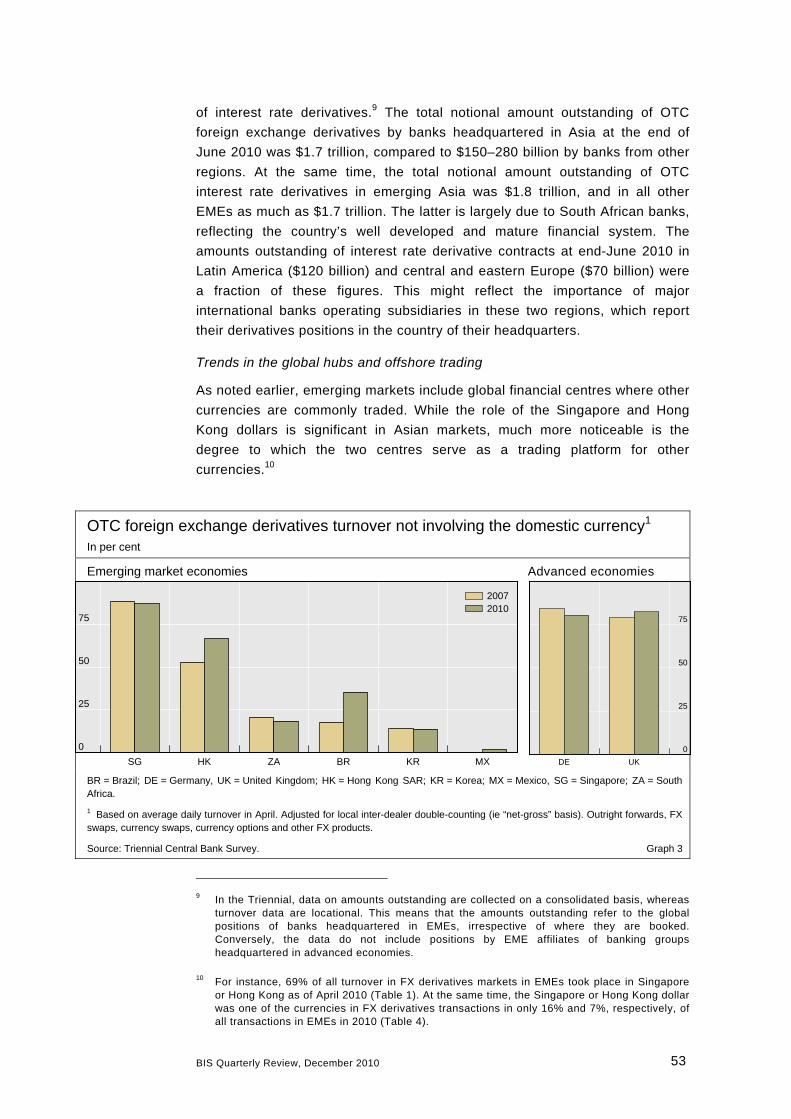
OTC foreign exchange derivatives turnover not involving the domestic currency1 In per cent
Emerging market economies Advanced economies
0
25
50
75
SG HK ZA BR KR MX
20072010
0
25
50
75
DE UK
BR = Brazil; DE = Germany, UK = United Kingdom; HK = Hong Kong SAR; KR = Korea; MX = Mexico, SG = Singapore; ZA = South Africa.
1 Based on average daily turnover in April. Adjusted for local inter-dealer double-counting (ie “net-gross” basis). Outright forwards, FX swaps, currency swaps, currency options and other FX products.
Source: Triennial Central Bank Survey. Graph 3
9 In the Triennial, data on amounts outstanding are collected on a consolidated basis, whereas
turnover data are locational. This means that the amounts outstanding refer to the global positions of banks headquartered in EMEs, irrespective of where they are booked. Conversely, the data do not include positions by EME affiliates of banking groups headquartered in advanced economies.
10 For instance, 69% of all turnover in FX derivatives markets in EMEs took place in Singapore or Hong Kong as of April 2010 (Table 1). At the same time, the Singapore or Hong Kong dollar was one of the currencies in FX derivatives transactions in only 16% and 7%, respectively, of all transactions in EMEs in 2010 (Table 4).
BIS Quarterly Review, December 2010 53

OTC foreign exchange derivatives turnover by currency offshore ratio1 Daily averages in April 2010, in per cent
Total2, 3 Outright forwards
FX swaps Currency swaps
Currency options
Asia
Chinese renminbi 71.0 90.8 8.3 … …
Indian rupee 59.7* 76.0 16.4 55.6 79.1
Indonesian rupiah 81.3* 94.7 29.3 22.5 99.5
Korean won 56.8* 90.7 11.2 53.5 98.6
Malaysian ringgit 69.4* 91.1 29.7 17.9 84.9
Philippine peso 55.8* 90.0 14.3 1.8 23.2
Thai baht 34.5 23.4 39.6 6.1 6.4
Latin America
Brazilian real 90.8 90.8 81.1 13.0 99.0
Chilean peso 58.9* 65.2 12.8 86.1 95.2
Mexican peso 96.0* 95.6 96.2 76.6 98.1
Central and eastern Europe
Hungarian forint 91.8* 88.0 91.5 … 99.3
Polish zloty 94.7* 92.0 94.9 98.7 97.1
Russian rouble 62.6* 93.5 54.4 … 99.7
Turkish lira 94.8* 87.3 98.3 95.7 88.8
Other emerging market economies
Israeli new shekel 78.0* 83.0 80.7 64.6 59.1
South African rand 86.5 86.7 86.4 98.1 86.0
Total emerging market currencies3 77.2* 86.7* 71.1 76.7* 91.5* Total emerging market currencies in April 20073 75.5 83.3 72.0 63.2 87.0
An asterisk indicates higher observations compared to 2007. Comparison was made only for the total figures.
1 This ratio defines turnover in any given currency outside the home market as a percentage of the total turnover in the same currency. Adjusted for local and cross-border inter-dealer double-counting (ie “net-net” basis). 2 Total of the listed instruments. 3 Since the turnover data for the home market are not available in some economies for some segments, percentages for the total currency offshore ratio for those economies are an upper-bound estimate, since the calculation assumes that the total turnover for that segment is traded outside the home economy.
Source: 2010 Triennial Central Bank Survey. Table 5
Graph 3 illustrates the degree to which trading in currencies other than the
home currency occurs in a few financial centres, and how that has changed
since the last survey. As expected, Hong Kong and Singapore score highly,
with 66% and 87% of FX derivatives turnover in those jurisdictions occurring in
currency pairs that do not include the Hong Kong dollar or the Singapore dollar,
respectively. The elevated numbers are comparable to those of the United
Kingdom and Germany. In Hong Kong, trading in currencies other than the
Hong Kong dollar has increased by 14 percentage points over the last three
years.
Derivatives turnover in EME hubs increasingly global
A very different set of issues is raised by the trading of emerging market
currency derivatives “offshore”, or outside the jurisdiction of the monetary
authority. Such trade is often the result of foreign exchange or capital controls
Offshore trading of EME currencies widespread …
54 BIS Quarterly Review, December 2010

in the home jurisdiction.11 In fact, a very large share of trading in EME
currency derivatives takes place at such locations. (Offshore locations for
trading in emerging market currencies tend to be the global financial centres
identified above). Table 5 documents the degree to which trading in the FX
derivatives of certain emerging market currencies takes place offshore. For
instance, more than 90% of trading in the Brazilian real, the Mexican peso, the
Hungarian forint, the Polish zloty and the Turkish lira takes place outside the
home market. Offshore trading is particularly pronounced in FX options and
outright forward contracts, where around 90% of all trading takes place abroad.
Offshore trading of emerging market currencies appears to have increased
in both absolute and relative terms since the 2007 Triennial. For instance, the
share of all FX derivatives transactions in emerging markets in which neither
side of the currency pair is within the jurisdiction of the monetary authority has
risen to 77%. In each of the categories of outright forwards, currency swaps
and FX options, the share of FX derivatives transactions in emerging markets
taking place offshore has grown by 3–5 percentage points. Currencies for
which the offshore ratio has increased by more than 20% over the past three
years include the Indian rupee, the Chilean peso, the Colombian peso and the
Russian rouble.
… and growing in importance
Explaining FX derivatives turnover
As noted above, OTC FX derivatives represent the most important derivatives
market in EMEs, so it is natural to ask which factors help explain differences in
turnover in this market across countries and time. This section reports the
results of a preliminary statistical analysis of this question. We look at simple
bivariate correlations of FX derivatives turnover with some structural economic
factors that are generally associated with the growth of derivatives
markets.12 The aim is to identify potential drivers of turnover as a first step in a
more rigorous econometric analysis. One tentative finding is that variables
such as trade, financial openness and the growth of bond and equity markets
seem more promising in explaining FX derivatives turnover than the volatility of
exchange rates or the level of interest rates. In addition, there might be a
threshold level of per capita GDP above which the development of FX
derivatives markets takes off.
Which factors drive growth of FX derivatives …
The panel dataset we use covers 30 EMEs over six Triennial surveys
conducted since 1995. Hong Kong and Singapore are excluded as outliers. The
dependent variable is daily turnover of OTC FX derivatives (outright forwards,
FX swaps, currency swaps, options and other FX derivatives) measured in US
dollars, in country i (i = 1,…,30) at Triennial survey year t (t = 1995,…, 2010).
… in a panel dataset of EMEs?
11 For a further discussion of the impact of foreign exchange controls on derivatives turnover,
see Tsuyuguchi and Wooldridge (2008).
12 For stylised facts on the development of OTC derivatives markets, see Schinasi et al (2000), and for emerging markets, Saxena and Villar (2008). Potential drivers of FX turnover are discussed by, among others, Galati and Heath (2007) and King and Rime (2010).
BIS Quarterly Review, December 2010 55
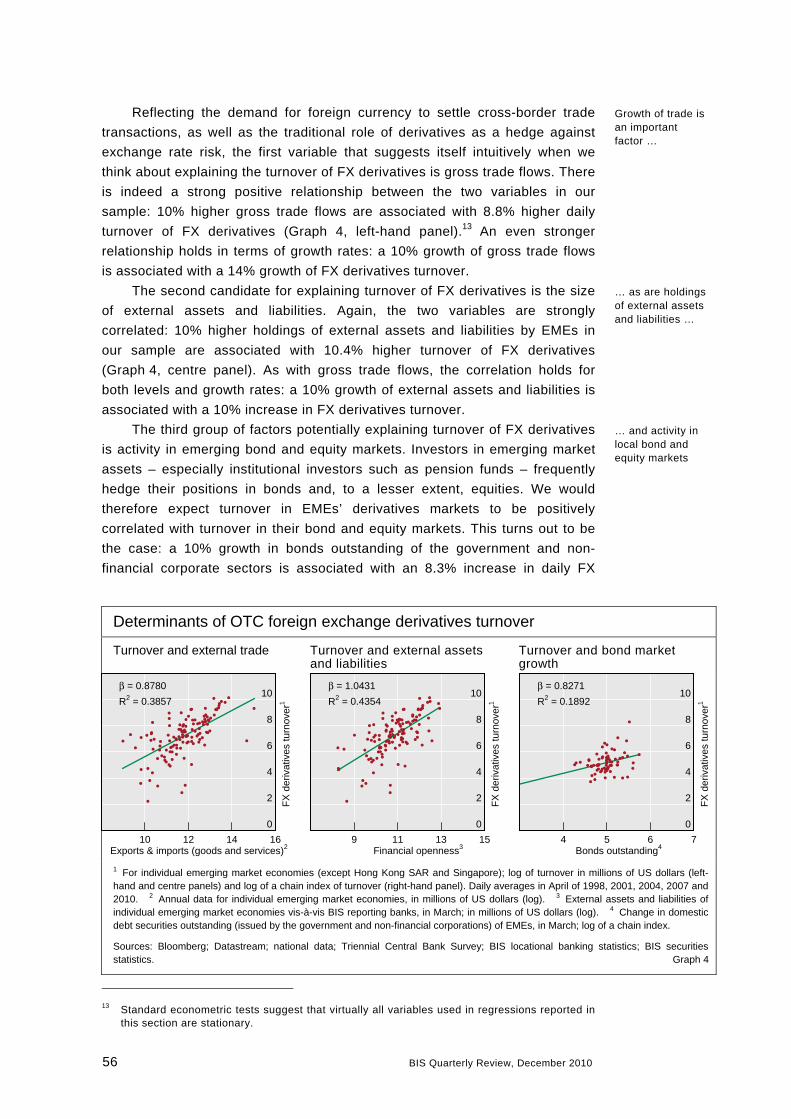
Reflecting the demand for foreign currency to settle cross-border trade
transactions, as well as the traditional role of derivatives as a hedge against
exchange rate risk, the first variable that suggests itself intuitively when we
think about explaining the turnover of FX derivatives is gross trade flows. There
is indeed a strong positive relationship between the two variables in our
sample: 10% higher gross trade flows are associated with 8.8% higher daily
turnover of FX derivatives (Graph 4, left-hand panel).13 An even stronger
relationship holds in terms of growth rates: a 10% growth of gross trade flows
is associated with a 14% growth of FX derivatives turnover.
The second candidate for explaining turnover of FX derivatives is the size
of external assets and liabilities. Again, the two variables are strongly
correlated: 10% higher holdings of external assets and liabilities by EMEs in
our sample are associated with 10.4% higher turnover of FX derivatives
(Graph 4, centre panel). As with gross trade flows, the correlation holds for
both levels and growth rates: a 10% growth of external assets and liabilities is
associated with a 10% increase in FX derivatives turnover.
The third group of factors potentially explaining turnover of FX derivatives
is activity in emerging bond and equity markets. Investors in emerging market
assets – especially institutional investors such as pension funds – frequently
hedge their positions in bonds and, to a lesser extent, equities. We would
therefore expect turnover in EMEs’ derivatives markets to be positively
correlated with turnover in their bond and equity markets. This turns out to be
the case: a 10% growth in bonds outstanding of the government and non-
financial corporate sectors is associated with an 8.3% increase in daily FX
13 Standard econometric tests suggest that virtually all variables used in regressions reported in
this section are stationary.
Determinants of OTC foreign exchange derivatives turnover
Turnover and external trade Turnover and external assets and liabilities
Turnover and bond market growth
0
2
4
6
8
10
10 12 14 16Exports & imports (goods and services)2
FX
der
ivat
ives
turn
over
1
β = 0.8780
R2 = 0.3857
0
2
4
6
8
10
9 11 13 15Financial openness3
FX
der
ivat
ives
turn
over
1
β = 1.0431
R2 = 0.4354
0
2
4
6
8
10
4 5 6 7Bonds outstanding4
FX
der
ivat
ives
turn
over
1
β = 0.8271
R2 = 0.1892
1 For individual emerging market economies (except Hong Kong SAR and Singapore); log of turnover in millions of US dollars (left-hand and centre panels) and log of a chain index of turnover (right-hand panel). Daily averages in April of 1998, 2001, 2004, 2007 and 2010. 2 Annual data for individual emerging market economies, in millions of US dollars (log). 3 External assets and liabilities of individual emerging market economies vis-à-vis BIS reporting banks, in March; in millions of US dollars (log). 4 Change in domestic debt securities outstanding (issued by the government and non-financial corporations) of EMEs, in March; log of a chain index.
Sources: Bloomberg; Datastream; national data; Triennial Central Bank Survey; BIS locational banking statistics; BIS securities statistics. Graph 4
Growth of trade is an important factor …
… as are holdings of external assets and liabilities …
… and activity in local bond and equity markets
56 BIS Quarterly Review, December 2010

derivatives turnover (Graph 4, right-hand panel).14 Similarly, a 10% increase in
equity market turnover is associated with a 3% increase in FX derivatives
turnover.
The statistical relationship of FX derivatives turnover with other potential
determinants identified in the literature is much weaker in our sample. For
instance, the correlation between exchange rate volatility (measured by the
standard deviation of monthly changes in the nominal effective exchange rate
of individual EMEs) and FX derivatives turnover is positive but statistically
insignificant. In particular, greater volatility of emerging market exchange rates
in the latest crisis period has not been associated with increased turnover of
FX derivatives. There is also a positive but weak relationship between growth
of FX derivatives turnover and the level of domestic interest rates across the
main FX instruments – outright forwards and FX swaps.15
Exchange rates and interest rates are less important
On a more structural level, turnover of FX derivatives is statistically highly
correlated with per capita income. While even lower-income countries such as
India have started to develop dynamic derivatives markets, it is only at a fairly
high level of per capita income that such markets begin to take off. In a sample
covering both advanced and emerging market economies, the vast majority of
countries with daily turnover of FX derivatives of $10 billion or more have per
capita income above $30,000 (measured at PPP exchange rates). In the
emerging markets, this level of per capita income is found, for instance, in
Israel and Korea, which have, unsurprisingly, some of the most developed
derivatives markets among EMEs. These results are tentative and should be
interpreted with caution; nonetheless, they are indicative of some of the
structural reasons for the observed gap in the development of derivatives
markets between advanced economies and EMEs.
Derivatives markets take off at higher income levels
Conclusion
The growth of derivatives turnover in emerging markets remains more rapid
than in advanced economies. The largest emerging market derivatives markets
are now located in Korea, Brazil and the two Asian financial centres of Hong
Kong and Singapore. About half of the derivatives turnover in emerging
markets occurs over the counter, compared to one third in advanced
economies. FX derivatives are by far the most commonly traded. Growth of FX
derivatives turnover appears to be positively related to trade, financial activity
and per capita GDP.
Derivatives turnover in emerging markets is becoming more and more
global. Not only is an increasing share of emerging market transactions cross-
border as opposed to domestic, but the two large financial centres of emerging
14 We use growth of amounts outstanding because turnover data are generally not available for
bond markets. Note that there can be some reverse causality between FX derivatives turnover and financial market activity, especially foreign non-financial corporate issuance in local bond markets in EMEs.
15 The level of interest rates is a potential determinant of FX derivatives turnover because carry trades and other leveraged investment strategies exploit interest rate differentials and exchange rate trends in emerging vis-à-vis advanced market economies.
BIS Quarterly Review, December 2010 57

58 BIS Quarterly Review, December 2010
Asia continue to grow in importance as home to an increasingly large share of
OTC derivatives trades not involving the local currency.
References
Baba, N and F Packer (2009): “From turmoil to crisis: dislocations in the FX
swap market before and after the failure of Lehman Brothers”, BIS Working Papers, no 285, July.
Bank for International Settlements (2010a): 80th Annual Report, June.
——— (2010b): Triennial Central Bank Survey of Foreign Exchange and Derivatives Market Activity in April 2010 – preliminary results, September.
——— (2010c): Triennial Central Bank Survey: report on global foreign
exchange market activity in 2010, December, pp 71–83.
Committee on the Global Financial System (2010): “The functioning and
resilience of cross-border funding markets”, CGFS Publications, no 37, March.
Galati, G and A Heath (2007): “What drives the growth in FX activity?
Interpreting the 2007 triennial survey”, BIS Quarterly Review, December.
Galati, G and M Melvin (2004): “Explaining the surge in FX turnover”, BIS Quarterly Review, December.
Goldberg, L (2010): “Is the international role of the dollar changing?”, Current Issues in Economics and Finance, January.
King, M and C Mallo (2010): “A user’s guide to the Triennial Central Bank
Survey of foreign exchange market activity”, BIS Quarterly Review, this issue.
King, M and C Rime (2010): “The $4 trillion question: what explains FX growth
since the 2007 survey?”, BIS Quarterly Review, this issue.
Saxena, S and A Villar (2008): “Hedging instruments in emerging market
economies”, BIS Papers, no 44.
Schinasi, G, S Craig, B Drees and C Kramer (2000): “Modern banking and OTC
derivatives markets”, IMF Occasional Papers, no 203.
Tsuyuguchi, Y and P Wooldridge (2008): “The evolution of trading activity in
Asian foreign exchange markets”, BIS Working Papers, no 252, May.
Related Documents


