Deregulation of Rab and Rab Effector Genes in Bladder Cancer Joel R. Ho 1,2 , Elodie Chapeaublanc 1,2 , Lisa Kirkwood 3 , Remy Nicolle 1,2,4 , Simone Benhamou 5,6 , Thierry Lebret 7 , Yves Allory 8,9 , Jennifer Southgate 3 , Franc ¸ois Radvanyi 1,2 , Bruno Goud 1,2 * 1 Institut Curie, Centre de Recherche, Paris, France, 2 CNRS, UMR 144, Paris, France, 3 Jack Birch Unit of Molecular Carcinogenesis, Department of Biology, University of York, York, United Kingdom, 4 Universite ´ d’Evry, iSSB, Evry, France, 5 CNRS, UMR 8200, Institut de Cance ´ rologie Gustave Roussy, Villejuif, France, 6 INSERM, U946, Paris, France, 7 De ´partement d’Urologie, Ho ˆ pital Foch, Suresnes, France, 8 AP-HP, Groupe Hospitalier Henri Mondor, Plateforme de Ressources Biologiques, De ´partement de Pathologie, Cre ´teil, France, 9 INSERM, Unite ´ 955, Cre ´teil, France Abstract Growing evidence indicates that Rab GTPases, key regulators of intracellular transport in eukaryotic cells, play an important role in cancer. We analysed the deregulation at the transcriptional level of the genes encoding Rab proteins and Rab- interacting proteins in bladder cancer pathogenesis, distinguishing between the two main progression pathways so far identified in bladder cancer: the Ta pathway characterized by a high frequency of FGFR3 mutation and the carcinoma in situ pathway where no or infrequent FGFR3 mutations have been identified. A systematic literature search identified 61 genes encoding Rab proteins and 223 genes encoding Rab-interacting proteins. Transcriptomic data were obtained for normal urothelium samples and for two independent bladder cancer data sets corresponding to 152 and 75 tumors. Gene deregulation was analysed with the SAM (significant analysis of microarray) test or the binomial test. Overall, 30 genes were down-regulated, and 13 were up-regulated in the tumor samples. Five of these deregulated genes (LEPRE1, MICAL2, RAB23, STXBP1, SYTL1) were specifically deregulated in FGFR3-non-mutated muscle-invasive tumors. No gene encoding a Rab or Rab-interacting protein was found to be specifically deregulated in FGFR3-mutated tumors. Cluster analysis showed that the RAB27 gene cluster (comprising the genes encoding RAB27 and its interacting partners) was deregulated and that this deregulation was associated with both pathways of bladder cancer pathogenesis. Finally, we found that the expression of KIF20A and ZWINT was associated with that of proliferation markers and that the expression of MLPH, MYO5B, RAB11A, RAB11FIP1, RAB20 and SYTL2 was associated with that of urothelial cell differentiation markers. This systematic analysis of Rab and Rab effector gene deregulation in bladder cancer, taking relevant tumor subgroups into account, provides insight into the possible roles of Rab proteins and their effectors in bladder cancer pathogenesis. This approach is applicable to other group of genes and types of cancer. Citation: Ho JR, Chapeaublanc E, Kirkwood L, Nicolle R, Benhamou S, et al. (2012) Deregulation of Rab and Rab Effector Genes in Bladder Cancer. PLoS ONE 7(6): e39469. doi:10.1371/journal.pone.0039469 Editor: Wanjin Hong, Institute of Molecular and Cell Biology, Singapore Received January 27, 2012; Accepted May 21, 2012; Published June 19, 2012 Copyright: ß 2012 Ho et al. This is an open-access article distributed under the terms of the Creative Commons Attribution License, which permits unrestricted use, distribution, and reproduction in any medium, provided the original author and source are credited. Funding: The work was supported by grants from the Centre national de la recherche scientifique (CNRS) and the Institut Curie. The Molecular Oncology team is supported by La Ligue Nationale Contre le Cancer (‘‘Equipe labellise ´e’’). The funders had no role in study design, data collection and analysis, decision to publish, or preparation of the manuscript. Competing Interests: The authors have declared that no competing interests exist. * E-mail: [email protected] Introduction Intracellular trafficking is an essential process in eukaryotic cells. It relies on vesicular or tubular transport carriers that shuttle between cell compartments facilitating the constant exchange of proteins and lipids. Many studies have highlighted its complexity and led to the identification of a large number of proteins involved in the different steps of intracellular transport, i.e. the formation of transport carriers from donor membranes, their movement along cytoskeletal tracks and their tethering/fusion with target mem- branes. Small GTPases of the Rab family have emerged as key regulators of these different steps. As with other GTPases, Rab proteins cycle between an inactive GDP (guanosine diphosphate)- bound form and an active GTP (guanosine triphosphate)-bound form. The active GTP-bound form of the Rab is membrane- bound whereas hydrolysis of the GTP to GDP results in its dissociation into the cytosol. These two cycles are controlled by a complex regulatory network of proteins that includes guanine nucleotide exchange factors (GEFs), GTPase activating proteins (GAPs) and guanine nucleotide dissociation inhibitors (GDI). In their active form Rab GTPases interact with a diverse range of effector proteins, such as molecular motors, lipid kinases, tethering factors and scaffolding proteins (see [1] for review). Recent studies have found a role for a number of Rab proteins in human cancers. Several expression studies have suggested that they could play both an activating and an inhibiting role in tumor progression. RAB1A is overexpressed in tongue squamous cell carcinoma [2]. RAB3A is expressed in insulinoma, but not in normal pancreatic islet cells [3]. RAB11A and RAB20 expression is increased during skin carcinogenesis [4] and in exocrine pancre- atic adenocarcinomas [5], respectively. By contrast, RAB37 is down-regulated in metastatic tumors of lung cancer [6]. Both RAB5A and RAB7 were shown to be up-regulated in autonomous thyroid adenomas, such an up-regulation being correlated with an accelerated thyroglobulin endocytosis and hormone production [7]. PLoS ONE | www.plosone.org 1 June 2012 | Volume 7 | Issue 6 | e39469

Welcome message from author
This document is posted to help you gain knowledge. Please leave a comment to let me know what you think about it! Share it to your friends and learn new things together.
Transcript
Deregulation of Rab and Rab Effector Genes in BladderCancerJoel R. Ho1,2, Elodie Chapeaublanc1,2, Lisa Kirkwood3, Remy Nicolle1,2,4, Simone Benhamou5,6,
Thierry Lebret7, Yves Allory8,9, Jennifer Southgate3, Francois Radvanyi1,2, Bruno Goud1,2*
1 Institut Curie, Centre de Recherche, Paris, France, 2 CNRS, UMR 144, Paris, France, 3 Jack Birch Unit of Molecular Carcinogenesis, Department of Biology, University of
York, York, United Kingdom, 4 Universite d’Evry, iSSB, Evry, France, 5 CNRS, UMR 8200, Institut de Cancerologie Gustave Roussy, Villejuif, France, 6 INSERM, U946, Paris,
France, 7 Departement d’Urologie, Hopital Foch, Suresnes, France, 8 AP-HP, Groupe Hospitalier Henri Mondor, Plateforme de Ressources Biologiques, Departement de
Pathologie, Creteil, France, 9 INSERM, Unite 955, Creteil, France
Abstract
Growing evidence indicates that Rab GTPases, key regulators of intracellular transport in eukaryotic cells, play an importantrole in cancer. We analysed the deregulation at the transcriptional level of the genes encoding Rab proteins and Rab-interacting proteins in bladder cancer pathogenesis, distinguishing between the two main progression pathways so faridentified in bladder cancer: the Ta pathway characterized by a high frequency of FGFR3 mutation and the carcinoma in situpathway where no or infrequent FGFR3 mutations have been identified. A systematic literature search identified 61 genesencoding Rab proteins and 223 genes encoding Rab-interacting proteins. Transcriptomic data were obtained for normalurothelium samples and for two independent bladder cancer data sets corresponding to 152 and 75 tumors. Genederegulation was analysed with the SAM (significant analysis of microarray) test or the binomial test. Overall, 30 genes weredown-regulated, and 13 were up-regulated in the tumor samples. Five of these deregulated genes (LEPRE1, MICAL2, RAB23,STXBP1, SYTL1) were specifically deregulated in FGFR3-non-mutated muscle-invasive tumors. No gene encoding a Rab orRab-interacting protein was found to be specifically deregulated in FGFR3-mutated tumors. Cluster analysis showed that theRAB27 gene cluster (comprising the genes encoding RAB27 and its interacting partners) was deregulated and that thisderegulation was associated with both pathways of bladder cancer pathogenesis. Finally, we found that the expression ofKIF20A and ZWINT was associated with that of proliferation markers and that the expression of MLPH, MYO5B, RAB11A,RAB11FIP1, RAB20 and SYTL2 was associated with that of urothelial cell differentiation markers. This systematic analysis ofRab and Rab effector gene deregulation in bladder cancer, taking relevant tumor subgroups into account, provides insightinto the possible roles of Rab proteins and their effectors in bladder cancer pathogenesis. This approach is applicable toother group of genes and types of cancer.
Citation: Ho JR, Chapeaublanc E, Kirkwood L, Nicolle R, Benhamou S, et al. (2012) Deregulation of Rab and Rab Effector Genes in Bladder Cancer. PLoS ONE 7(6):e39469. doi:10.1371/journal.pone.0039469
Editor: Wanjin Hong, Institute of Molecular and Cell Biology, Singapore
Received January 27, 2012; Accepted May 21, 2012; Published June 19, 2012
Copyright: � 2012 Ho et al. This is an open-access article distributed under the terms of the Creative Commons Attribution License, which permits unrestricteduse, distribution, and reproduction in any medium, provided the original author and source are credited.
Funding: The work was supported by grants from the Centre national de la recherche scientifique (CNRS) and the Institut Curie. The Molecular Oncology team issupported by La Ligue Nationale Contre le Cancer (‘‘Equipe labellisee’’). The funders had no role in study design, data collection and analysis, decision to publish,or preparation of the manuscript.
Competing Interests: The authors have declared that no competing interests exist.
* E-mail: [email protected]
Introduction
Intracellular trafficking is an essential process in eukaryotic cells.
It relies on vesicular or tubular transport carriers that shuttle
between cell compartments facilitating the constant exchange of
proteins and lipids. Many studies have highlighted its complexity
and led to the identification of a large number of proteins involved
in the different steps of intracellular transport, i.e. the formation of
transport carriers from donor membranes, their movement along
cytoskeletal tracks and their tethering/fusion with target mem-
branes. Small GTPases of the Rab family have emerged as key
regulators of these different steps. As with other GTPases, Rab
proteins cycle between an inactive GDP (guanosine diphosphate)-
bound form and an active GTP (guanosine triphosphate)-bound
form. The active GTP-bound form of the Rab is membrane-
bound whereas hydrolysis of the GTP to GDP results in its
dissociation into the cytosol. These two cycles are controlled by a
complex regulatory network of proteins that includes guanine
nucleotide exchange factors (GEFs), GTPase activating proteins
(GAPs) and guanine nucleotide dissociation inhibitors (GDI). In
their active form Rab GTPases interact with a diverse range of
effector proteins, such as molecular motors, lipid kinases, tethering
factors and scaffolding proteins (see [1] for review).
Recent studies have found a role for a number of Rab proteins
in human cancers. Several expression studies have suggested that
they could play both an activating and an inhibiting role in tumor
progression. RAB1A is overexpressed in tongue squamous cell
carcinoma [2]. RAB3A is expressed in insulinoma, but not in
normal pancreatic islet cells [3]. RAB11A and RAB20 expression is
increased during skin carcinogenesis [4] and in exocrine pancre-
atic adenocarcinomas [5], respectively. By contrast, RAB37 is
down-regulated in metastatic tumors of lung cancer [6]. Both
RAB5A and RAB7 were shown to be up-regulated in autonomous
thyroid adenomas, such an up-regulation being correlated with an
accelerated thyroglobulin endocytosis and hormone production
[7].
PLoS ONE | www.plosone.org 1 June 2012 | Volume 7 | Issue 6 | e39469
Several functional studies have confirmed the role of Rab
proteins in cancer progression. RAB5A, overexpressed in hepa-
tocellular carcinomas, seems to be determinant for liver cancer
progression, as suggested by the finding that a dominant negative
form of RAB5A attenuates EGF-mediated signalling and cell
migration of a human hepatoma cell line [8]. Other results have
shown that RAB23, amplified and overexpressed in diffuse-type
gastric cancer, acts as an invasion mediator gene [9]. RAB25 plays
a role in the development of both ovarian and breast cancers
[10,11]. However, an opposite role of RAB25 has also been
documented, i.e. as a tumor suppressor gene for colon cancer [12].
In addition, some proteins involved in Rab cycle regulation have
also been implicated in carcinogenesis. For example RIN1, coding
for a RAB5 GEF, was shown to be a breast tumor suppressor gene
[13], whereas TBC1D3B, coding for a RAB5 GAP, was shown to
be an oncogene amplified in prostate cancer [14].
Urinary bladder cancer is the fourth most common cancer in
both European and American men. In women, it is the ninth most
common cancer in the USA and the 14th most common cancer in
Europe [15,16]. According to the stage, at first presentation, about
50% of bladder carcinoma are Ta tumors which are generally of
low grade (Ta tumors are papillary tumors that do not invade
beyond the basement membrane), 20% are T1 tumors (tumors
which invade beyond the basement membrane but not the
underlying muscularis propria) and 30% are muscle-invasive
tumors (T2–4). Carcinoma in situ (Cis) consisting of flat, high-grade
lesions not invading beyond the basement membrane are rarely
found in isolation. Instead, Cis is predominantly encountered with
other urothelial tumors. Clinical and molecular evidence suggest
that bladder tumors arise and progress along two main pathways:
the ‘‘Ta’’ pathway and the ‘‘carcinoma in situ’’ pathway. Ta
tumors display a high recurrence rate (60%, [17]), but have a low
probability (5–10%) of progressing to T1 tumors and then to
muscle-invasive tumors (T2–4). By contrast, Cis often progress (in
about 50% of cases), to T1 tumors and then to muscle-invasive
tumors ([18] for review). The Ta pathway is characterized by a
high frequency of activating mutations of the FGFR3 gene
(encoding the tyrosine kinase fibroblast growth factor receptor
3). FGFR3 mutations are present in 70–75% of Ta tumors and
absent from Cis. Their relatively low frequency in T1 (20%) and
T2–4 tumors (10–15%) is consistent with the high rate of Cis
progression and the low rate of Ta progression [19–24].
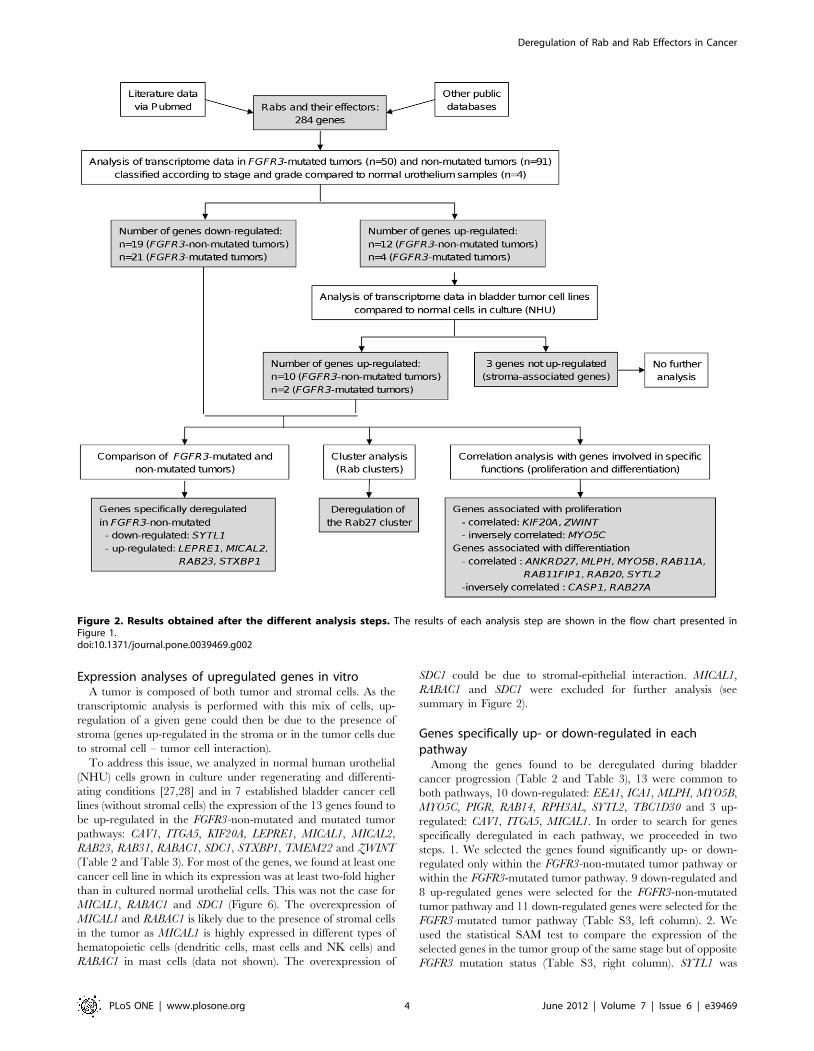
Figure 1. Flow chart of the different analysis steps. The first step is the identification through public data bases and expert knowledge of thegenes of interest to study, here the Rabs and their effectors. The second step consists of selecting subgroups of tumors and analysing the expressionof the different genes selected in the first step in these subgroups compared to the normal urothelium. The subgrouping here has been done takinginto account the FGFR3 mutation status, the stage and the grade, separating the tumors into two pathways. A comparison of the expressionobserved in bladder cancer cell lines and in cultured normal human urothelial cells allowed discarding of genes for which the expression could bepossibly due to the presence of stroma (in comparison to normal cells, upregulation in bladder tumors but not in bladder tumor cell lines). Differenttypes of analysis were then performed on the selected deregulated genes: 1) a comparison of the expression in FGFR3-mutated tumors and FGFR3-non-mutated tumors allowed the identification of genes specifically deregulated in one of the two pathways of bladder cancer pathogenesis; 2) bygrouping genes into cluster of genes (here the Rab clusters), we identified clusters with deregulated expression; 3) by analysing the possiblecorrelation between the expression of the deregulated genes and the expression of proliferation or differentiation marker genes, we identified thederegulated genes associated with proliferation or differentiation.doi:10.1371/journal.pone.0039469.g001
Deregulation of Rab and Rab Effectors in Cancer
PLoS ONE | www.plosone.org 2 June 2012 | Volume 7 | Issue 6 | e39469
The goal of this work was to perform a systematic study to
identify Rab proteins and Rab-interacting proteins whose expres-
sion is deregulated during the Ta and Cis pathways of bladder
tumor pathogenesis at the transcriptomic level.
Results
For this study, we applied the strategy presented in Figure 1
(flow chart). Briefly: 1. an exhaustive list of genes coding for Rab
and Rab-interacting was established from public databases, 2.
deregulated genes (up- or down-regulated compared to normal
urothelium) in each of the two pathways (the FGFR3-mutated
tumor pathway and the FGFR3-non-mutated tumor pathway)
were identified from two transcriptome datasets, 3. deregulated
genes possibly because of tumor stroma or tumor – stroma
interactions were identified and then omitted from further analysis
(analysis of transcriptome data in bladder tumor cell lines
compared to normal cells in culture (NHU)), 4. for each
deregulated gene, a specific association either with the FGFR3-
mutated tumor group or the non-mutated tumor group was
investigated as well as an association with a differentiation or
proliferation phenotype. Additionally, we investigated for each
Rab cluster (consisting of a given Rab protein and its interacting
partners) whether it could be associated with bladder cancer
pathogenesis.
The results obtained at each step of the analyses are
summarized in Figure 2.
Definition of the list of genes to be analysedThe first part of this work consisted of establishing a list of genes
coding for Rab proteins and Rab-interacting proteins, including
activating GEF and inactivating GAP proteins (Figure 3). 61
human RAB genes were found. The list of Rab-interacting proteins
was established by a literature search to gather papers that have
reported the identification and/or the characterization of proteins
that directly interact with Rab GTPases, using different approach-
es (two-hybrid assays, GST-pull down, coimmunoprecipitation,
etc.). This list comprised 217 proteins: 23 GEFs, 20 GAPs and 174
effector proteins. We added to this list two genes coding for the
two GDI (GDP Dissociation Inhibitor) proteins (GDI1 and 2) that
are common to all Rab GTPases. We also included four genes
coding for proteins involved in post-translational modification and
membrane association of all newly-synthesized Rabs: CHM and
CHML coding for Rab escort proteins (REP) and the two isoforms
of the Rab geranylgeranyl transferase (RABGGT A and B). This
made a total of 284 Rabs and Rab-interacting proteins (Figure 2).
The list of genes analysed in this study and the list of papers in
which they were originally described are shown in Table 1 and
Table S1. Figure 4 illustrates the cluster of proteins shown to
interact with RAB27A/B (as an example) and Figure S1 illustrates
all Rab clusters analysed; Rab proteins are in yellow, GEFs in
green, GAPs in light red and effector proteins in blue.
Model of bladder cancer pathogenesis used in this studyTwo main progression pathways have been so far identified in
bladder cancer, the Ta pathway characterized by a high frequency
of FGFR3 mutation and the carcinoma in situ (Cis) pathway where
no or infrequent FGFR3 mutations have been identified. In this
study we therefore considered two pathways: the FGFR3-mutated
tumor pathway and the FGFR3-non-mutated tumor pathway
(Figure 5). The FGFR3-mutated tumor pathway comprised the
TaG1 and TaG2 FGFR3-mutated tumors, the T1 FGFR3-mutated
tumors and the muscle-invasive FGFR3-mutated tumors (T2–4
tumors). We analysed two sets of bladder tumors (n = 152 in the
first data set and n = 75 in the second data set). The number of
FGFR3-mutated TaG3 was too small to identify them as a separate
group (2 tumors in the first data set and 1 tumor in the second data
set), but they could not either be included in the TaG1/TaG2
group due to their different clinical and molecular characteristics
so they were not considered in the analysis. The FGFR3-non-
mutated tumor pathway comprised the TaG3 FGFR3-non-
mutated tumors, the T1 FGFR3-non-mutated tumors and the
muscle-invasive FGFR3-non-mutated tumors. Transcriptomic data
from Cis tumors were not available in our series. We used FGFR3-
non-mutated TaG3 tumors instead of Cis. These tumors share
several properties with Cis as they progress to an invasive stage
[25] with a high probability (45%, [26]). In addition, both lesions
are microscopically very similar at individual cell examination.
TaG1/TaG2 tumors not mutated for FGFR3 (9 samples in the first
set of data, 2 samples in the second set of data) were not
considered in the analysis as they do not fit in the Cis pathway:
indeed these tumors are of low grade and they rarely progress to
T1 and then to muscle-invasive tumors [26].
Identification of up- or down- regulated genesIn order to identify genes up- or down-regulated during bladder
cancer progression, the two pathways of the ‘‘FGFR3 model’’ were
analyzed separately. We used the three groups, TaG3, T1, and
T2–4, previously defined for the FGFR3-non-mutated pathway
and the three groups, TaG1G2, T1, and T2–4 for the FGFR-
mutated tumor pathway (Figure 5). For each tumor group, the
expression of the Rab and Rab-interacting protein genes listed in
Table S1 was compared to their expression in the normal
urothelium (obtained without stroma) group using the statistical
SAM test. The results were filtered with the following thresholds:
Fold Change (FC) .1.5 for up-regulation (and ,0.667 ( = 1/1.5)
for down-regulation) and qValue ,5%. We first analysed a
collection of samples containing 4 normal urothelium and 141
tumor samples (see Material and Methods) using the Affymetrix
HG U133 Plus 2.0 DNA microarrays. 269 of the 284 genes listed
in Table S1 were present in these microarrays. For the FGFR3-
non-mutated tumor pathway, 19 genes were found to be down-
regulated and 12 genes up-regulated (Table 2); for the FGFR-
mutated tumor pathway, 21 genes were found to be down-
regulated and 4 genes up-regulated (Table 3) (summary in
Figure 2).
We then analysed a second set of tumors to verify the results
obtained. This set, collected independently from the first set, was
analysed with the Affymetrix HG U95A/U95Av2 DNA micro-
arrays and contained 5 normal urothelium and 72 tumor samples
(see Material and Methods). Only 165 of the 284 genes listed in
Table S1 (58 %) were present in these microarrays. Among the 31
genes found to be up- or down-regulated in the FGFR3-non-
mutated tumor pathway (Table 2), 17 were present on the
Affymetrix HG U95A/U95Av2 DNA microarrays: CASP1, CAV1,
CD2AP, EEA1, ICA1, ITGA5, MICAL2, PIGR, RAB11A, RAB14,
RAB31, RAB4A, RABAC1, STXBP1, TBC1D30, TBC1D4 and
ZWINT. Among the 25 genes found to be up- or down-regulated
in the FGFR3-mutated tumor pathway (Table 3), 14 were present
on the Affymetrix U95A/U95Av2 DNA microarrays: CAV1,
EEA1, ICA1, ITGA5, PIGR, RAB11FIP2, RAB14, RAB27A,
RAB27B, RAB9A, RABGAP1L, SDC1, TBC1D30 and UNC13B.
For these genes, 56 % of the results obtained with the first set of
data were validated with the second set of data with at least one
threshold passed: FC.1.5 (or ,0.667) and/or qValue ,5%
(Table S2). The other results were not significant. Of note, no
discordant result between the two sets of data was found.
Deregulation of Rab and Rab Effectors in Cancer
PLoS ONE | www.plosone.org 3 June 2012 | Volume 7 | Issue 6 | e39469
Expression analyses of upregulated genes in vitroA tumor is composed of both tumor and stromal cells. As the
transcriptomic analysis is performed with this mix of cells, up-
regulation of a given gene could then be due to the presence of
stroma (genes up-regulated in the stroma or in the tumor cells due
to stromal cell – tumor cell interaction).
To address this issue, we analyzed in normal human urothelial
(NHU) cells grown in culture under regenerating and differenti-
ating conditions [27,28] and in 7 established bladder cancer cell
lines (without stromal cells) the expression of the 13 genes found to
be up-regulated in the FGFR3-non-mutated and mutated tumor
pathways: CAV1, ITGA5, KIF20A, LEPRE1, MICAL1, MICAL2,
RAB23, RAB31, RABAC1, SDC1, STXBP1, TMEM22 and ZWINT
(Table 2 and Table 3). For most of the genes, we found at least one
cancer cell line in which its expression was at least two-fold higher
than in cultured normal urothelial cells. This was not the case for
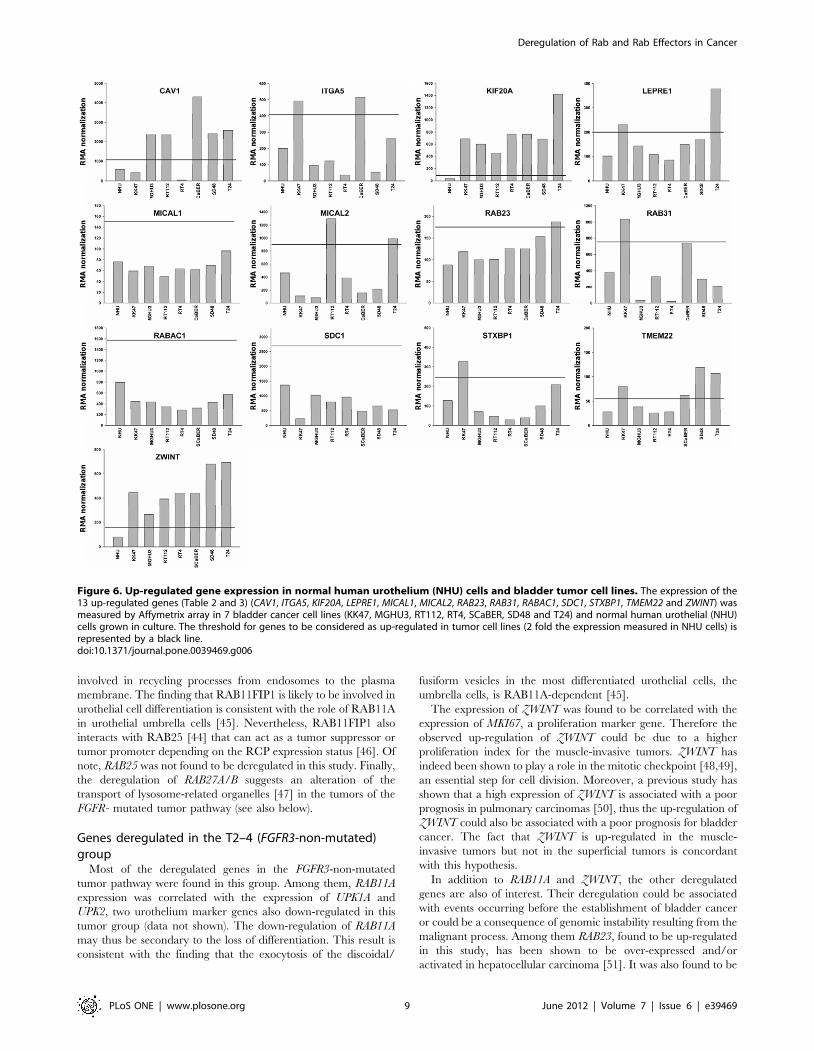
MICAL1, RABAC1 and SDC1 (Figure 6). The overexpression of
MICAL1 and RABAC1 is likely due to the presence of stromal cells
in the tumor as MICAL1 is highly expressed in different types of
hematopoietic cells (dendritic cells, mast cells and NK cells) and
RABAC1 in mast cells (data not shown). The overexpression of
SDC1 could be due to stromal-epithelial interaction. MICAL1,
RABAC1 and SDC1 were excluded for further analysis (see
summary in Figure 2).
Genes specifically up- or down-regulated in eachpathway
Among the genes found to be deregulated during bladder
cancer progression (Table 2 and Table 3), 13 were common to
both pathways, 10 down-regulated: EEA1, ICA1, MLPH, MYO5B,
MYO5C, PIGR, RAB14, RPH3AL, SYTL2, TBC1D30 and 3 up-
regulated: CAV1, ITGA5, MICAL1. In order to search for genes
specifically deregulated in each pathway, we proceeded in two
steps. 1. We selected the genes found significantly up- or down-
regulated only within the FGFR3-non-mutated tumor pathway or
within the FGFR3-mutated tumor pathway. 9 down-regulated and
8 up-regulated genes were selected for the FGFR3-non-mutated
tumor pathway and 11 down-regulated genes were selected for the
FGFR3-mutated tumor pathway (Table S3, left column). 2. We
used the statistical SAM test to compare the expression of the
selected genes in the tumor group of the same stage but of opposite
FGFR3 mutation status (Table S3, right column). SYTL1 was
Figure 2. Results obtained after the different analysis steps. The results of each analysis step are shown in the flow chart presented inFigure 1.doi:10.1371/journal.pone.0039469.g002
Deregulation of Rab and Rab Effectors in Cancer
PLoS ONE | www.plosone.org 4 June 2012 | Volume 7 | Issue 6 | e39469
significantly down-regulated in the T2–4 (FGFR3-non-mutated)
tumor group whereas LEPRE1, MICAL2, RAB23 and STXBP1
were significantly up-regulated in the same tumor group (Table 4
and Figure 7; see summary in Figure 2). No gene was found to be
specifically deregulated for the FGFR3-mutated tumors.
Analysis by clusters of genesIn the previous part of this study, we used the statistical SAM
test to analyse separately the expression of each gene during
bladder cancer progression. To investigate whether a Rab cluster
(consisting of a given Rab protein and its interacting partners, see
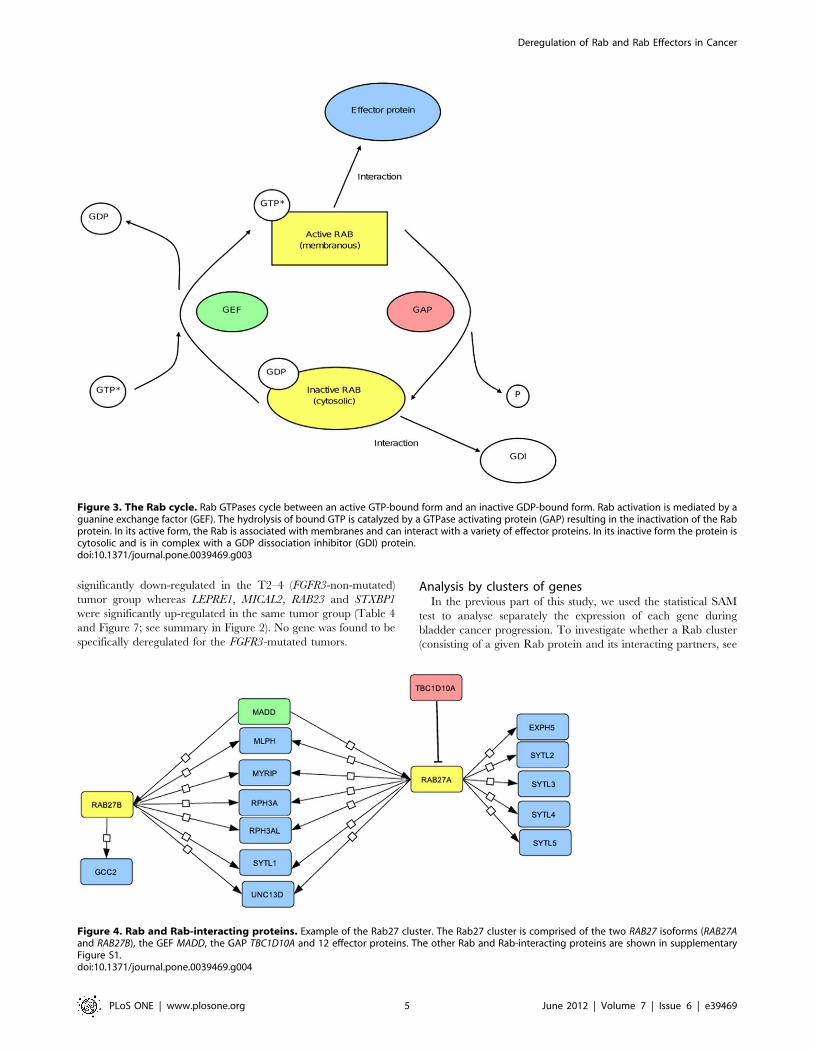
Figure 3. The Rab cycle. Rab GTPases cycle between an active GTP-bound form and an inactive GDP-bound form. Rab activation is mediated by aguanine exchange factor (GEF). The hydrolysis of bound GTP is catalyzed by a GTPase activating protein (GAP) resulting in the inactivation of the Rabprotein. In its active form, the Rab is associated with membranes and can interact with a variety of effector proteins. In its inactive form the protein iscytosolic and is in complex with a GDP dissociation inhibitor (GDI) protein.doi:10.1371/journal.pone.0039469.g003
Figure 4. Rab and Rab-interacting proteins. Example of the Rab27 cluster. The Rab27 cluster is comprised of the two RAB27 isoforms (RAB27Aand RAB27B), the GEF MADD, the GAP TBC1D10A and 12 effector proteins. The other Rab and Rab-interacting proteins are shown in supplementaryFigure S1.doi:10.1371/journal.pone.0039469.g004
Deregulation of Rab and Rab Effectors in Cancer
PLoS ONE | www.plosone.org 5 June 2012 | Volume 7 | Issue 6 | e39469

Figure 4 and Figure S1) could be specifically associated with
bladder cancer progression, we used the statistical binomial test to
determine whether the percentage of genes deregulated within a
given Rab cluster was significantly greater than the percentage
obtained by analyzing all the Rab and Rab-interacting protein
genes. This test was applied for each Rab cluster within each
tumor group and the results were filtered with the threshold
pValue ,1%. Interestingly, the Rab27 cluster passed this
threshold for the T2–4 tumor groups of both the FGFR3-non-
mutated and mutated tumor pathways (Table 5 and Table S4; see
summary in Figure 2). In addition to RAB27A and RAB27B, the
genes down-regulated in this cluster comprise GCC2, MLPH,
RPH3AL, SYTL1 and SYTL2.
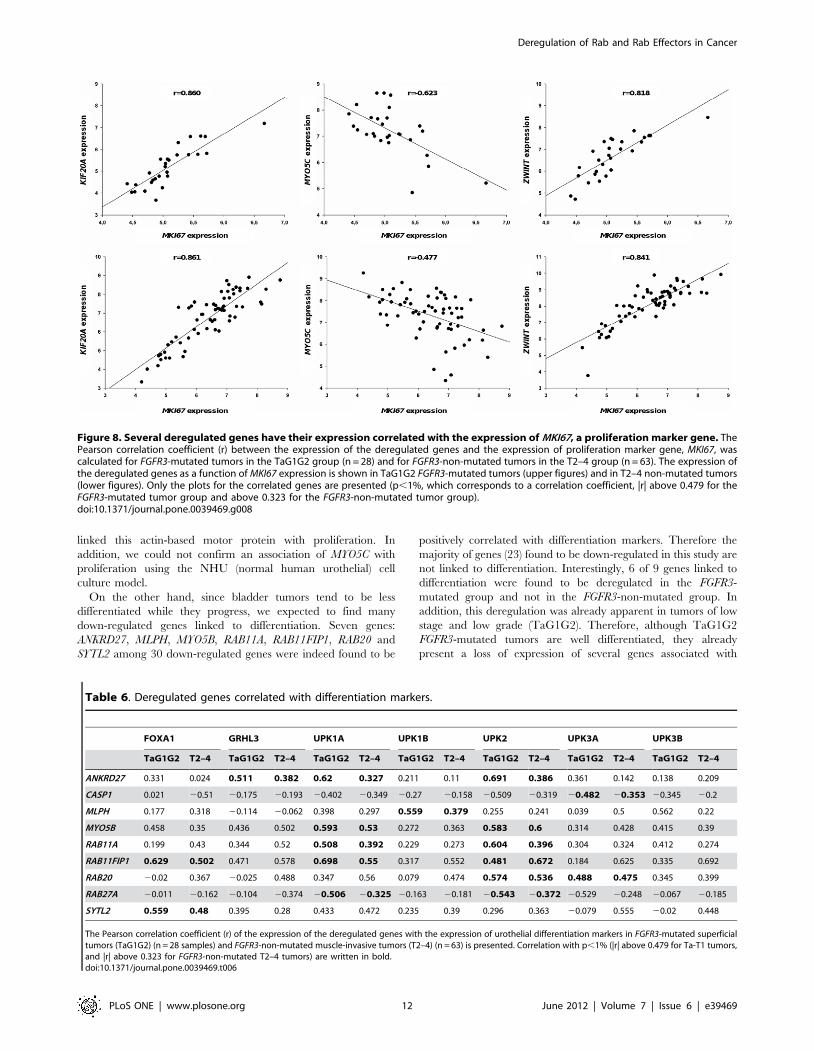
Genes associated with proliferationIn order to evaluate a possible association of the deregulated
genes listed in Table 2 and Table 3 with cell proliferation, we
calculated a Pearson correlation between their expression and that
of the proliferation marker gene: MKI67 [29]. For this analysis,
among the 6 groups constituted for this study, we worked with the
two homogenous tumor groups with the higher number of
samples: the Ta G1/G2 (FGFR3-mutated) tumor group (28
samples) and the stage T2–4 (FGFR3-non-mutated) tumor group
(63 samples). We first noticed, as expected, that the expression of
MKI67 was significantly higher in the T2–4 (FGFR3 non-mutated)
group than in the Ta G1/G2 (FGFR3-mutated) group (about 3
fold; Student test, p = 8.8E-10). We chose to filter the Pearson
correlation values with the threshold: |r| .0.479 (pVal ,1%) for
the Ta G1/G2 (FGFR3-mutated) tumor group and |r| .0.323
(pVal ,1%) for the T2–4 (FGFR3-non-mutated) tumor group.
The expression of a gene was considered to be correlated with the
expression of MKI67 if the pValue ,1% with both tumor groups.
The expression of KIF20A and ZWINT were correlated, whereas
the expression of MYO5C was inversely correlated, with the
expression of MKI67 (Figure 8 and Table S5; see summary in
Figure 2).
Genes associated with differentiationThe same analysis was performed to evaluate the association of
deregulated genes with the differentiation process of urothelial
cells. The uroplakin genes UPK1A, UPK1B, UPK2, UPK3A and
UPK3B, encoding for urothelium-specific markers [30–33] and the
two genes GRHL3 [34] and FOXA1 [28], encoding for transcrip-
tion factors, were used as markers of urothelial differentiation. We
used the same two tumor groups as above. The results of the
Pearson correlation were filtered with the same thresholds as
above and we considered that the expression of a gene is
correlated with the expression of another gene if the pValue was
less than 1% for both tumor groups. The results are shown in
Table 6 and Table S6. Seven genes were found to be correlated
with at least one urothelial differentiation marker: ANKRD27,
MLPH, MYO5B, RAB11A, RAB11FIP1, RAB20 and SYTL2. Two
genes were found to be inversely correlated with at least one
urothelial differentiation marker: CASP1 and RAB27A (see
summary in Figure 2).
Gene expression in NHU cells in cultureNormal human urothelial cells (NHU cells) can grow in culture
for a finite number of passages until they enter into senescence.
Before senescence, differentiation can be induced by growing them
in specific media. Here NHU cells, after passage, were either
grown in non-differentiating conditions (control) or in differenti-
ating conditions (in the presence of an EGFR (epidermal growth
factor receptor) inhibitor and an activator of PPARcaamm(peroxisome proliferator-activated receptor gamma)) [28]. In
control conditions, cells reach confluency and become contact-
Table 1. Number of isoforms, GEFs, GAPs and effectorproteins analysed for each Rab protein.
Isoform GEF GAP Effector
RAB1 2 8 1 18
RAB2 2 0 3 6
RAB3 4 3 3 23
RAB4 2 0 2 19
RAB5 3 7 5 28
RAB6 3 0 2 24
RAB7 2 1 1 14
RAB8 2 2 2 22
RAB9 2 0 0 9
RAB10 1 1 3 9
RAB11 2 0 3 29
RAB12 1 0 0 1
RAB13 1 0 0 10
RAB14 1 0 1 5
RAB15 1 0 0 6
RAB17 1 0 1 1
RAB18 1 0 0 0
RAB19 1 0 0 3
RAB20 1 0 0 1
RAB21 1 2 1 0
RAB22 1 1 2 5
RAB23 1 0 1 0
RAB24 1 0 0 2
RAB25 1 0 0 7
RAB26 1 0 0 1
RAB27 2 1 1 12
RAB28 1 0 0 0
RAB30 1 0 0 3
RAB31* 1 1 0 3
RAB32 1 0 0 2
RAB33 2 0 0 8
RAB34 1 0 1 2
RAB35 1 3 1 5
RAB36 1 0 1 6
RAB37 1 0 0 2
RAB38 1 0 0 1
RAB39 2 0 1 3
RAB40 3 0 0 2
RAB41 1 0 1 3
RAB42 1 0 0 0
RAB43 1 0 1 0
RAB44 1 0 0 0
*RAB31 = RAB22B.Some GEFs, GAPs and effector proteins are common to several Rab proteins(see Table S1 for details). GDI1, GDI2, CHM, CHML, RABGGTA/B, common to allRab proteins were assessed but are not included in the count presented in thisTable.doi:10.1371/journal.pone.0039469.t001
Deregulation of Rab and Rab Effectors in Cancer
PLoS ONE | www.plosone.org 6 June 2012 | Volume 7 | Issue 6 | e39469
inhibited, whereas in differentiating conditions they also stop
growing but begin to express markers of urothelial terminal
differentiation, such as the uroplakins (UPKs).
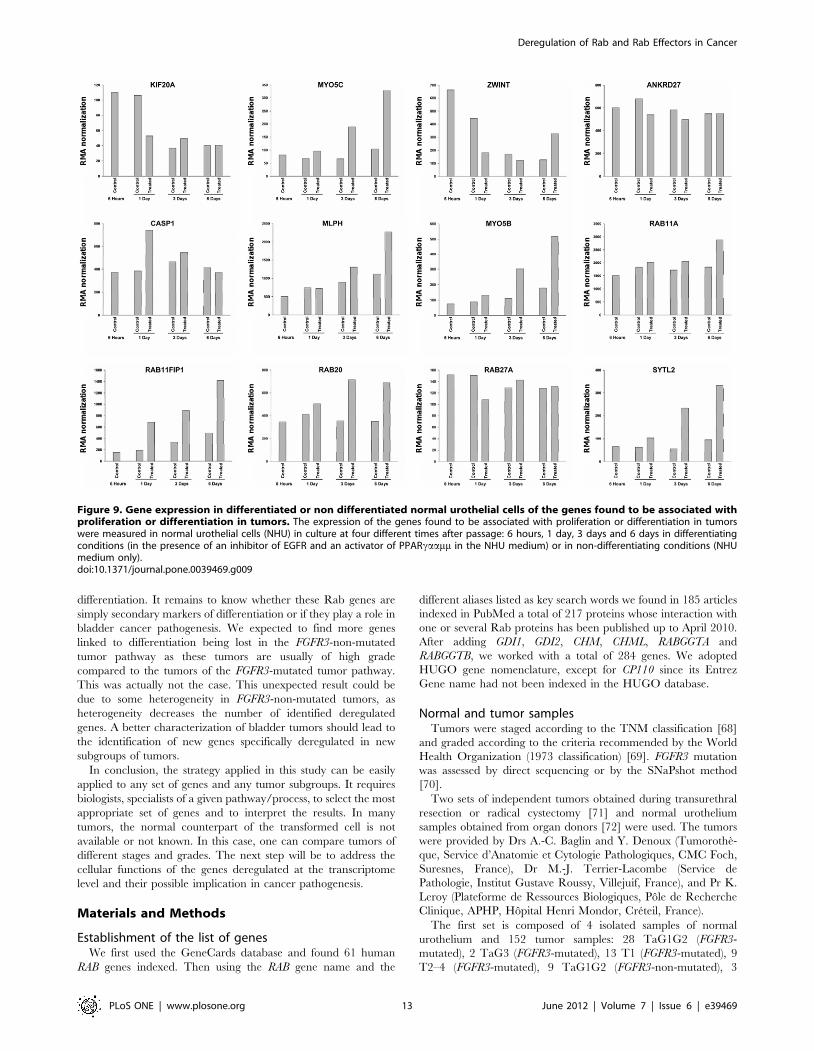
We used Affymetrix data of NHU cells in different conditions to
look at the expression of the genes previously found to be
associated in tumors with proliferation or differentiation markers.
The NHU expression data were obtained at different times after
passage: 6 hours, 1 day, 3 days and 6 days, with or without
differentiating medium. As shown in Figure 9, the expression of
KIF20A and ZWINT decreased in cultures treated with the
differentiating medium, as well as in control cultures upon
reaching confluence, indicating a link of these two genes with
proliferation. In this model, MYO5C was not linked with
proliferation, as observed in tumor expression data, but with
differentiation (increased expression in the differentiating medium
but not in the control medium). Among the 7 genes positively
correlated with differentiation markers in the tumors, 6 were
indeed induced by the differentiating medium (MLPH, MYO5B,
RAB11A, RAB11FIP1, RAB20 and SYTL2) but not ANKDR27.
Neither of the two genes inversely correlated with differentiation
(CASP1 and RAB27A) were down-regulated upon differentiation in
NHU cells.
Discussion
Growing evidence indicates that Rab proteins and their
effectors are involved in cancer progression, both as inhibitory
and promoting factors. However, to our knowledge no systematic
study has addressed their deregulation during cancer progression.
In this study, we have identified several genes coding for Rabs and
Rab-interacting proteins whose expression is deregulated during
bladder cancer pathogenesis.
Pertinence of the two pathways modelBased on clinical and molecular evidence, two progression
pathways have been described in bladder cancer, the Ta pathway
presenting high frequency of FGFR3 mutation and the Cis
pathway with no or low rate of FGFR3 mutation. In this study,
a simple method, i.e. the presence or absence of FGFR3 mutation,
was used to separate the tumors within the two pathways. This led
to discard the TaG3 FGFR3-mutated tumors (4% of FGFR3-
mutated cases in the first data set) and the TaG1, G2 FGFR3-non-
mutated tumors (9% of FGFR3-non-mutated cases in the first data
set), as in these two subgroups the FGFR3 mutation was likely not
the correct parameter for classifying a tumor in one of the two
pathways (see paragraph on ‘‘Model of bladder cancer pathogen-
esis used in this study’’ in the Results section). Beside FGFR3
mutation, two other molecular markers can be used to distinguish
the two pathways of bladder tumor progression: the Cis signature
[35] and the MRES (multiple regional epigenetic silencing)
phenotype [36]. The classifications obtained by using the three
different methods (Cis signature, MRES phenotype and FGFR3
mutations), although presenting an important overlap, display
some differences ([36] and data not shown). A better character-
ization of the FGFR3 signaling pathway, as well as a better
knowledge of the mechanism involved in the MRES phenotype
and a detailed analysis of the precursor lesions will lead to a better
definition of the two pathways of bladder tumor progression and
possibly to the definition of additional pathways. It will be
important to apply again the analyses described in this study once
the different pathways will have been better characterized.
Because of more homogeneous subgroups, this could lead to the
identification of additional genes involved in particular subgroups
of tumors.
Globally, more genes were found to be down-regulated (30)
than up-regulated (13) (p = 2.16.1025, binomial test). Interestingly,
more genes were found to be up-regulated in the FGFR3-non-
mutated tumor pathway (12 genes) as compared to the FGFR3-
mutated tumor pathway (4 genes). This suggests the existence of
two different mechanisms for tumor progression along the two
pathways. LEPRE1, MICAL2, RAB23 and STXBP1 were specifi-
cally up-regulated in the muscle-invasive FGFR3-non-mutated
tumors as compared to both normal urothelium and muscle-
invasive FGFR3-mutated tumors, suggesting that these genes play
an active role in tumor progression along the FGFR3-non-mutated
tumor pathway. By contrast, SYTL1 was specifically down-
regulated in the muscle-invasive FGFR3-non mutated tumors.
Thus SYTL1 could play a role as an inhibitor of tumor progression
along this pathway. Alternatively SYTL1 could be lost because it is
not essential in these tumors, but is maintained in the FGFR3-
mutated tumors where it is essential. Overall, these results suggest
that even at the muscle-invasive stage, the tumors of the two
pathways should be distinguishable.
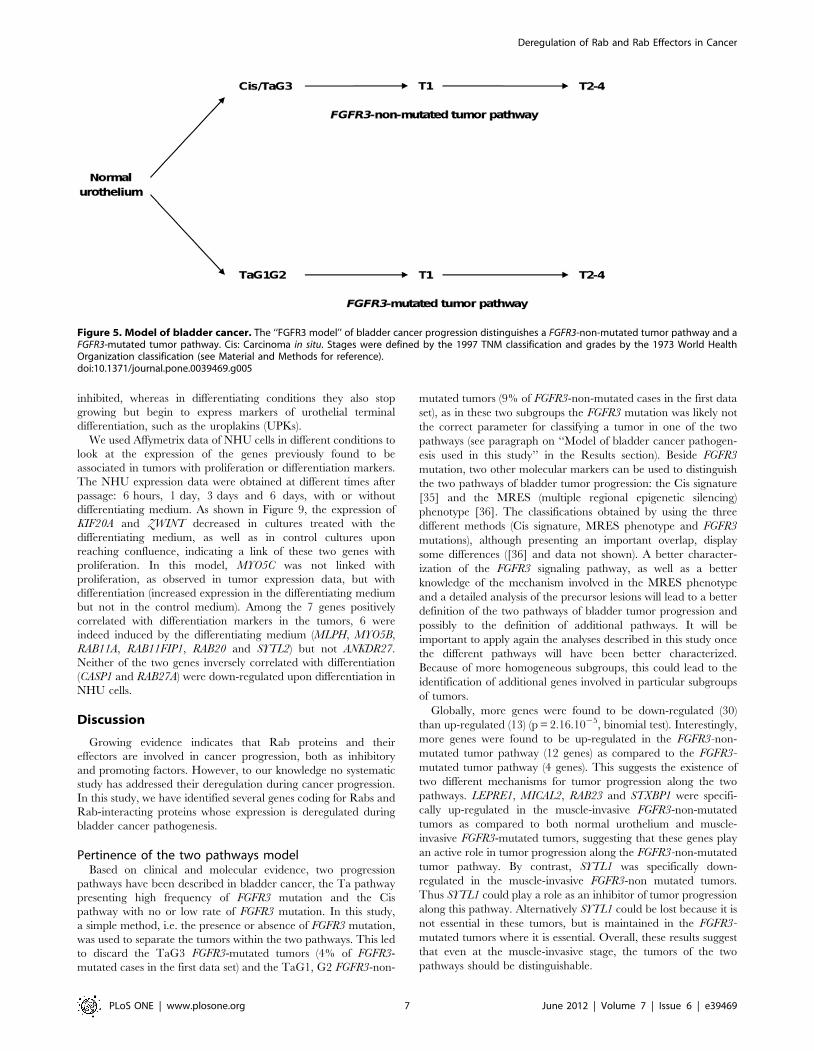
Figure 5. Model of bladder cancer. The ‘‘FGFR3 model’’ of bladder cancer progression distinguishes a FGFR3-non-mutated tumor pathway and aFGFR3-mutated tumor pathway. Cis: Carcinoma in situ. Stages were defined by the 1997 TNM classification and grades by the 1973 World HealthOrganization classification (see Material and Methods for reference).doi:10.1371/journal.pone.0039469.g005
Deregulation of Rab and Rab Effectors in Cancer
PLoS ONE | www.plosone.org 7 June 2012 | Volume 7 | Issue 6 | e39469

Concerning MICAL2, which codes for a RAB1 effector [37], this
gene has been previously shown to be up-regulated in prostate
cancer and to be necessary for prostate cancer cell viability [38].
LEPRE1 encodes for an enzyme member of the collagen prolyl
hydroxylase family. These enzymes are localized to the ER, and
their activity is required for proper collagen synthesis and
assembly. We indeed found a correlation between the expression
of LEPRE1 and the expression of COL1A1 and COL1A2 (data not
shown). The last gene, STXBP1, encodes for a RAB3 effector and
regulates exocytosis in neurons and neuroendocrine cells through
modulation of vesicle docking and membrane fusion [39]. This
suggests a possible neuroendocrine differentiation in the FGFR3-
non-mutated tumor pathway that would not be present in the
FGFR3-mutated tumor pathway.
Genes deregulated in the TaG1G2 (FGFR3-mutated)group
Most of the deregulated genes in the FGFR3-mutated tumor
pathway were found in this group. ANKRD27, RAB20 and
RAB11FIP1 were correlated with UPK1A, UPK2, UPK3A, FOXA1
and GRHL3 (Table 6), suggesting that they are associated with
urothelial cell differentiation. Even if the tumors of low grade
(Ta)G1G2 still appeared well differentiated, we nevertheless
observed a down-regulation of UPK1A, UPK3A and GRHL3 (not
UPK2 and FOXA1, data not shown). ANKRD27 encodes for a
RAB21 GEF [40], a Rab involved in the early endocytic pathway
[41]. ANKRD27 also interacts with VAMP7 [42], RAB32 and
RAB38 [43]. Less is known about RAB20 function, a Golgi-
associated Rab overexpressed in exocrine pancreatic carcinoma
[5]. RAB11FIP1 (also named RCP) is a RAB11A effector [44]
Table 2. Deregulated genes during bladder cancerpathogenesis in the FGFR3-non-mutated tumor pathway.
TaG3/normal T1/normal T2-4/normal
FCq-value(%) FC
q-value(%) FC
q-value(%)
1 CASP1 0.242 18.02 0.256 2.06 0.435 9.06
2 CD2AP 0.751 56.59 0.849 44.28 0.632 3.68
3 EEA1 0.495 12.50 0.688 11.55 0.604 2.68
4 GCC2 0.621 3.12 0.751 30.32 0.610 3.04
5 ICA1 0.695 46.67 0.618 3.35 0.435 1.31
6 MLPH 0.164 7.16 0.271 1.15 0.222 2.16
7 MYO5B 0.847 79.95 0.611 23.10 0.395 4.34
8 MYO5C 0.263 46.67 0.502 5.51 0.340 3.04
9 PIGR 0.195 23.76 0.305 4.46 0.246 1.76
10 RAB11A 0.859 76.84 0.678 17.40 0.498 1.41
11 RAB14 0.746 77.98 0.631 1.50 0.591 1.31
12 RAB38 0.157 6.89 0.277 1.15 0.405 21.73
13 RAB4A 0.693 19.62 0.764 27.99 0.541 3.68
14 RPH3AL 0.566 26.01 0.575 4.46 0.486 1.41
15 SYTL1 0.746 67.80 0.498 19.07 0.339 2.68
16 SYTL2 0.296 3.01 0.239 0.48 0.190 0.91
17 TBC1D30 0.410 10.31 0.506 3.35 0.413 3.68
18 TBC1D4 0.617 15.50 0.437 3.35 0.559 10.76
19 TRAPPC1 0.545 12.50 0.527 4.46 0.634 12.73
20 CAV1 4.566 40.49 4.912 0 10.843 0
21 ITGA5 1.808 26.01 1.874 0.60 2.848 0
22 KIF20A 4.050 53.97 4.024 4.46 3.700 5.43
23 LEPRE1 1.230 62.12 1.629 0.77 2.183 0
24 MICAL1 1.244 59.20 1.237 50.76 1.783 4.34
25 MICAL2 1.224 64.43 1.478 7.55 2.139 2.16
26 RAB23 0.892 79.95 1.483 33.03 2.674 2.68
27 RAB31 1.027 76.84 1.124 62.36 2.801 2.68
28 RABAC1 1.096 76.84 1.197 53.64 1.861 4.34
29 STXBP1 0.866 79.95 1.608 35.78 3.444 2.16
30 TMEM22 1.810 31.25 1.646 21.05 2.399 3.04
31 ZWINT 3.206 49.74 3.494 3.35 3.379 3.68
From line 1 to line 19, genes are down-regulated. From line 20 to line 31, genesare up-regulated. The results in bold passed the thresholds: FC,0.667 (fordown-regulation) or .1.5 (for up-regulation) and q-value ,5%.FC: Fold Change.Number of FGFR3-non-mutated tumor samples: 3 TaG3, 25 T1, 63 T2–4.Number of normal urothelial samples: 4.doi:10.1371/journal.pone.0039469.t002
Table 3. Deregulated genes during bladder cancerpathogenesis in the FGFR3-mutated tumor pathway.
TaG1G2/normal T1/normal T2–4/normal
FCq-value(%) FC
q-value(%) FC
q-value(%)
1 ANKRD27 0.648 1.64 0.769 32.48 0.790 38.11
2 EEA1 0.574 0 0.691 4.55 0.748 23.80
3 GNAL 0.699 0.30 0.661 2.35 0.745 23.80
4 ICA1 0.833 26.37 0.666 2.88 0.570 10.45
5 MLPH 0.332 0.77 0.302 2.35 0.230 0.76
6 MYO5B 0.611 4.35 0.552 8.65 0.492 12.88
7 MYO5C 0.312 0.36 0.289 1.13 0.374 12.88
8 PIGR 0.216 0 0.265 4.55 0.274 5.46
9 RAB11FIP1 0.539 0.60 0.561 10.72 0.505 8.38
10 RAB11FIP2 0.572 3.25 0.578 8.65 0.521 1.63
11 RAB14 0.587 0.30 0.536 2.35 0.593 1.69
12 RAB20 0.513 0.60 0.484 4.55 0.435 5.46
13 RAB27A 0.542 0.30 0.664 40.85 1.126 70.25
14 RAB27B 0.486 0 0.653 17.18 0.469 1.16
15 RAB8B 0.583 0.77 0.766 62.91 0.647 23.80
16 RAB9A 0.617 0.36 0.582 2.88 0.591 4.45
17 RABGAP1L 0.619 4.35 0.641 40.85 1.156 70.25
18 RPH3AL 0.696 1.64 0.540 7.07 0.496 1.63
19 SYTL2 0.303 0.19 0.273 0.31 0.264 1.69
20 TBC1D30 0.459 0.19 0.492 1.34 0.427 1.63
21 UNC13B 0.572 0.77 0.615 7.07 0.502 1.63
22 CAV1 2.603 2.51 3.681 5.82 4.715 3.39
23 ITGA5 1.570 0.36 1.826 2.88 2.068 10.45
24 MICAL1 1.726 1.64 1.478 12.27 1.487 43.39
25 SDC1 1.621 3.25 1.387 22.11 1.525 43.39
From line 1 to line 21, genes are down-regulated. From line 22 to line 25, genesare up-regulated. The results in bold passed the thresholds: FC,0.667 (fordown-regulation) or .1.5 (for up-regulation) and q-value ,5%.FC: Fold Change.Number of FGFR3-mutated tumor samples: 28 TaG1G2, 13 T1, 9 T2–4.Number of normal urothelial samples: 4.doi:10.1371/journal.pone.0039469.t003
Deregulation of Rab and Rab Effectors in Cancer
PLoS ONE | www.plosone.org 8 June 2012 | Volume 7 | Issue 6 | e39469
involved in recycling processes from endosomes to the plasma
membrane. The finding that RAB11FIP1 is likely to be involved in
urothelial cell differentiation is consistent with the role of RAB11A
in urothelial umbrella cells [45]. Nevertheless, RAB11FIP1 also
interacts with RAB25 [44] that can act as a tumor suppressor or
tumor promoter depending on the RCP expression status [46]. Of
note, RAB25 was not found to be deregulated in this study. Finally,
the deregulation of RAB27A/B suggests an alteration of the
transport of lysosome-related organelles [47] in the tumors of the
FGFR- mutated tumor pathway (see also below).
Genes deregulated in the T2–4 (FGFR3-non-mutated)group
Most of the deregulated genes in the FGFR3-non-mutated
tumor pathway were found in this group. Among them, RAB11A
expression was correlated with the expression of UPK1A and
UPK2, two urothelium marker genes also down-regulated in this
tumor group (data not shown). The down-regulation of RAB11A
may thus be secondary to the loss of differentiation. This result is
consistent with the finding that the exocytosis of the discoidal/
fusiform vesicles in the most differentiated urothelial cells, the
umbrella cells, is RAB11A-dependent [45].
The expression of ZWINT was found to be correlated with the
expression of MKI67, a proliferation marker gene. Therefore the
observed up-regulation of ZWINT could be due to a higher
proliferation index for the muscle-invasive tumors. ZWINT has
indeed been shown to play a role in the mitotic checkpoint [48,49],
an essential step for cell division. Moreover, a previous study has
shown that a high expression of ZWINT is associated with a poor
prognosis in pulmonary carcinomas [50], thus the up-regulation of
ZWINT could also be associated with a poor prognosis for bladder
cancer. The fact that ZWINT is up-regulated in the muscle-
invasive tumors but not in the superficial tumors is concordant
with this hypothesis.
In addition to RAB11A and ZWINT, the other deregulated
genes are also of interest. Their deregulation could be associated
with events occurring before the establishment of bladder cancer
or could be a consequence of genomic instability resulting from the
malignant process. Among them RAB23, found to be up-regulated
in this study, has been shown to be over-expressed and/or
activated in hepatocellular carcinoma [51]. It was also found to be
Figure 6. Up-regulated gene expression in normal human urothelium (NHU) cells and bladder tumor cell lines. The expression of the13 up-regulated genes (Table 2 and 3) (CAV1, ITGA5, KIF20A, LEPRE1, MICAL1, MICAL2, RAB23, RAB31, RABAC1, SDC1, STXBP1, TMEM22 and ZWINT) wasmeasured by Affymetrix array in 7 bladder cancer cell lines (KK47, MGHU3, RT112, RT4, SCaBER, SD48 and T24) and normal human urothelial (NHU)cells grown in culture. The threshold for genes to be considered as up-regulated in tumor cell lines (2 fold the expression measured in NHU cells) isrepresented by a black line.doi:10.1371/journal.pone.0039469.g006
Deregulation of Rab and Rab Effectors in Cancer
PLoS ONE | www.plosone.org 9 June 2012 | Volume 7 | Issue 6 | e39469
up-regulated in mucosa of atrophic gastritis and intestinal
metaplasia [52] and it is required for the invasion of diffuse-type
gastric cancer [9]. One RAB23 function is to antagonize sonic
hedgehog (Shh)-mediated signalling during mouse development
[53], a pathway implicated in urothelial cell proliferation in mice
[54]. Of note, RAB23 is highly expressed in muscle therefore, the
up-regulation observed could be due to this stromal expression.
Nevertheless it is also overexpressed in bladder cancer cell lines
compared with normal urothelial cells grown in culture.
The down-regulation of RAB4A, encoding for a Rab that
regulates fast recycling from early endosomes, and that of CD2AP,
coding for a RAB4A effector involved in actin cytoskeleton
regulation [55], points towards a general deregulation of the
recycling pathway in T2–4 (FGFR3-non-mutated) tumors. The
alteration of the fast recycling process was not found in the
TaG1G2 (FGFR3-mutated) tumors. In these tumors RAB4A
expression was not altered. The only RAB4A effector encoding
gene whose expression was altered is RAB11FIP1, which is likely to
be involved in urothelial cell differentiation (see above).
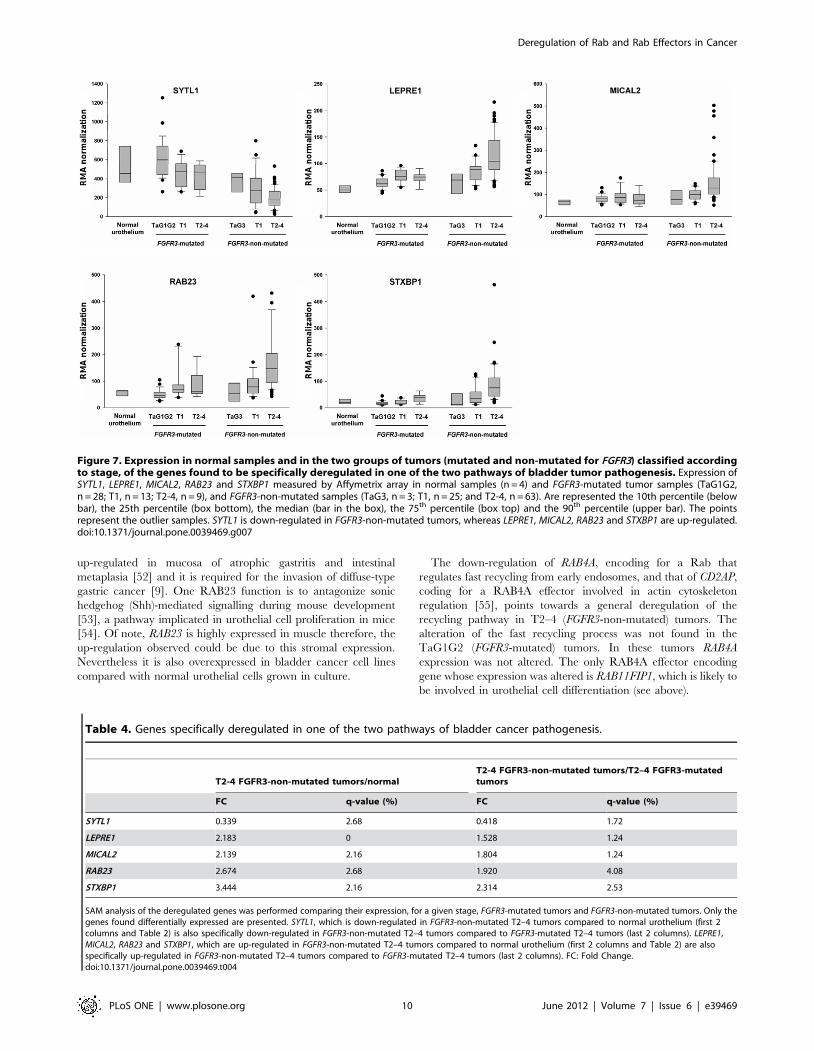
Figure 7. Expression in normal samples and in the two groups of tumors (mutated and non-mutated for FGFR3) classified accordingto stage, of the genes found to be specifically deregulated in one of the two pathways of bladder tumor pathogenesis. Expression ofSYTL1, LEPRE1, MICAL2, RAB23 and STXBP1 measured by Affymetrix array in normal samples (n = 4) and FGFR3-mutated tumor samples (TaG1G2,n = 28; T1, n = 13; T2-4, n = 9), and FGFR3-non-mutated samples (TaG3, n = 3; T1, n = 25; and T2-4, n = 63). Are represented the 10th percentile (belowbar), the 25th percentile (box bottom), the median (bar in the box), the 75th percentile (box top) and the 90th percentile (upper bar). The pointsrepresent the outlier samples. SYTL1 is down-regulated in FGFR3-non-mutated tumors, whereas LEPRE1, MICAL2, RAB23 and STXBP1 are up-regulated.doi:10.1371/journal.pone.0039469.g007
Table 4. Genes specifically deregulated in one of the two pathways of bladder cancer pathogenesis.
T2-4 FGFR3-non-mutated tumors/normalT2-4 FGFR3-non-mutated tumors/T2–4 FGFR3-mutatedtumors
FC q-value (%) FC q-value (%)
SYTL1 0.339 2.68 0.418 1.72
LEPRE1 2.183 0 1.528 1.24
MICAL2 2.139 2.16 1.804 1.24
RAB23 2.674 2.68 1.920 4.08
STXBP1 3.444 2.16 2.314 2.53
SAM analysis of the deregulated genes was performed comparing their expression, for a given stage, FGFR3-mutated tumors and FGFR3-non-mutated tumors. Only thegenes found differentially expressed are presented. SYTL1, which is down-regulated in FGFR3-non-mutated T2–4 tumors compared to normal urothelium (first 2columns and Table 2) is also specifically down-regulated in FGFR3-non-mutated T2–4 tumors compared to FGFR3-mutated T2–4 tumors (last 2 columns). LEPRE1,MICAL2, RAB23 and STXBP1, which are up-regulated in FGFR3-non-mutated T2–4 tumors compared to normal urothelium (first 2 columns and Table 2) are alsospecifically up-regulated in FGFR3-non-mutated T2–4 tumors compared to FGFR3-mutated T2–4 tumors (last 2 columns). FC: Fold Change.doi:10.1371/journal.pone.0039469.t004
Deregulation of Rab and Rab Effectors in Cancer
PLoS ONE | www.plosone.org 10 June 2012 | Volume 7 | Issue 6 | e39469
The possible role of the deregulation of intracellular trafficking
of surface receptors in bladder cancer progression is supported by
the finding that RAB31 is up-regulated. RAB31 regulates EGFR
trafficking in A431 cells [56]. Interestingly, EGFR is overexpressed
in urothelial tumors [57]. Of note, high expression of RAB31 is
associated with a worse outcome in patients with breast cancer
[58].
Genes deregulated in both Ta G1G2 (FGFR3-mutated)and T2–4 (FGFR3-non-mutated) groups
Amongst this group of genes, ITGA5 (up-regulated) encodes for
the alpha 5 subunit of the alpha-5/beta-1 integrin that associates
with RAB25 to promote invasive migration of ovarian carcinoma
cells [59]. ITGA5 is down-regulated in transformed plasma cells
compared to normal plasma cells [60] and in highly invasive
potential breast cancer cell lines [61]. Another study indicates, on
the contrary, that ITGA5 might be essential for breast cancer
metastatic capacity [62]. We found an increase of ITGA5 in
tumors independently of the stage (stage Ta or stage T2–4) or of
the pathway of bladder cancer progression. This suggests a role
other than migration/invasion for ITGA5 since Ta tumors do not
have a high invasive potential.
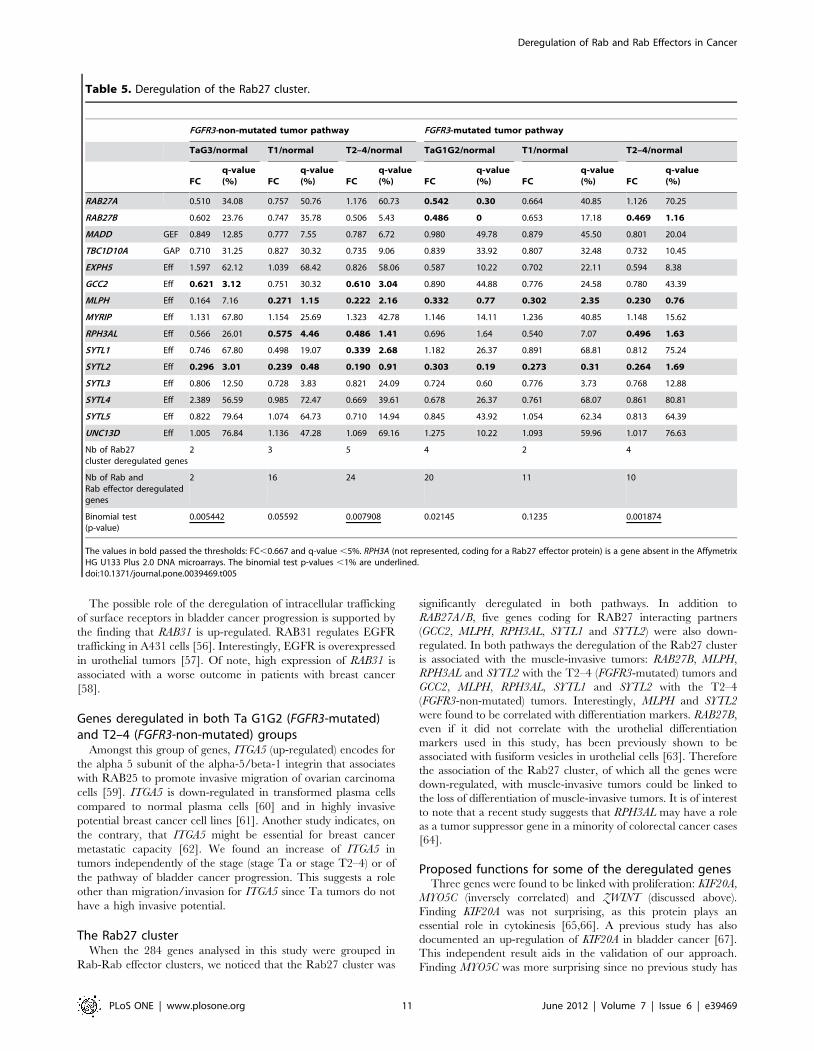
The Rab27 clusterWhen the 284 genes analysed in this study were grouped in
Rab-Rab effector clusters, we noticed that the Rab27 cluster was
significantly deregulated in both pathways. In addition to
RAB27A/B, five genes coding for RAB27 interacting partners
(GCC2, MLPH, RPH3AL, SYTL1 and SYTL2) were also down-
regulated. In both pathways the deregulation of the Rab27 cluster
is associated with the muscle-invasive tumors: RAB27B, MLPH,
RPH3AL and SYTL2 with the T2–4 (FGFR3-mutated) tumors and
GCC2, MLPH, RPH3AL, SYTL1 and SYTL2 with the T2–4
(FGFR3-non-mutated) tumors. Interestingly, MLPH and SYTL2
were found to be correlated with differentiation markers. RAB27B,
even if it did not correlate with the urothelial differentiation
markers used in this study, has been previously shown to be
associated with fusiform vesicles in urothelial cells [63]. Therefore
the association of the Rab27 cluster, of which all the genes were
down-regulated, with muscle-invasive tumors could be linked to
the loss of differentiation of muscle-invasive tumors. It is of interest
to note that a recent study suggests that RPH3AL may have a role
as a tumor suppressor gene in a minority of colorectal cancer cases
[64].
Proposed functions for some of the deregulated genesThree genes were found to be linked with proliferation: KIF20A,
MYO5C (inversely correlated) and ZWINT (discussed above).
Finding KIF20A was not surprising, as this protein plays an
essential role in cytokinesis [65,66]. A previous study has also
documented an up-regulation of KIF20A in bladder cancer [67].
This independent result aids in the validation of our approach.
Finding MYO5C was more surprising since no previous study has
Table 5. Deregulation of the Rab27 cluster.
FGFR3-non-mutated tumor pathway FGFR3-mutated tumor pathway
TaG3/normal T1/normal T2–4/normal TaG1G2/normal T1/normal T2–4/normal
FCq-value(%) FC
q-value(%) FC
q-value(%) FC
q-value(%) FC
q-value(%) FC
q-value(%)
RAB27A 0.510 34.08 0.757 50.76 1.176 60.73 0.542 0.30 0.664 40.85 1.126 70.25
RAB27B 0.602 23.76 0.747 35.78 0.506 5.43 0.486 0 0.653 17.18 0.469 1.16
MADD GEF 0.849 12.85 0.777 7.55 0.787 6.72 0.980 49.78 0.879 45.50 0.801 20.04
TBC1D10A GAP 0.710 31.25 0.827 30.32 0.735 9.06 0.839 33.92 0.807 32.48 0.732 10.45
EXPH5 Eff 1.597 62.12 1.039 68.42 0.826 58.06 0.587 10.22 0.702 22.11 0.594 8.38
GCC2 Eff 0.621 3.12 0.751 30.32 0.610 3.04 0.890 44.88 0.776 24.58 0.780 43.39
MLPH Eff 0.164 7.16 0.271 1.15 0.222 2.16 0.332 0.77 0.302 2.35 0.230 0.76
MYRIP Eff 1.131 67.80 1.154 25.69 1.323 42.78 1.146 14.11 1.236 40.85 1.148 15.62
RPH3AL Eff 0.566 26.01 0.575 4.46 0.486 1.41 0.696 1.64 0.540 7.07 0.496 1.63
SYTL1 Eff 0.746 67.80 0.498 19.07 0.339 2.68 1.182 26.37 0.891 68.81 0.812 75.24
SYTL2 Eff 0.296 3.01 0.239 0.48 0.190 0.91 0.303 0.19 0.273 0.31 0.264 1.69
SYTL3 Eff 0.806 12.50 0.728 3.83 0.821 24.09 0.724 0.60 0.776 3.73 0.768 12.88
SYTL4 Eff 2.389 56.59 0.985 72.47 0.669 39.61 0.678 26.37 0.761 68.07 0.861 80.81
SYTL5 Eff 0.822 79.64 1.074 64.73 0.710 14.94 0.845 43.92 1.054 62.34 0.813 64.39
UNC13D Eff 1.005 76.84 1.136 47.28 1.069 69.16 1.275 10.22 1.093 59.96 1.017 76.63
Nb of Rab27cluster deregulated genes
2 3 5 4 2 4
Nb of Rab andRab effector deregulatedgenes
2 16 24 20 11 10
Binomial test(p-value)
0.005442 0.05592 0.007908 0.02145 0.1235 0.001874
The values in bold passed the thresholds: FC,0.667 and q-value ,5%. RPH3A (not represented, coding for a Rab27 effector protein) is a gene absent in the AffymetrixHG U133 Plus 2.0 DNA microarrays. The binomial test p-values ,1% are underlined.doi:10.1371/journal.pone.0039469.t005
Deregulation of Rab and Rab Effectors in Cancer
PLoS ONE | www.plosone.org 11 June 2012 | Volume 7 | Issue 6 | e39469
linked this actin-based motor protein with proliferation. In
addition, we could not confirm an association of MYO5C with
proliferation using the NHU (normal human urothelial) cell
culture model.
On the other hand, since bladder tumors tend to be less
differentiated while they progress, we expected to find many
down-regulated genes linked to differentiation. Seven genes:
ANKRD27, MLPH, MYO5B, RAB11A, RAB11FIP1, RAB20 and
SYTL2 among 30 down-regulated genes were indeed found to be
positively correlated with differentiation markers. Therefore the
majority of genes (23) found to be down-regulated in this study are
not linked to differentiation. Interestingly, 6 of 9 genes linked to
differentiation were found to be deregulated in the FGFR3-
mutated group and not in the FGFR3-non-mutated group. In
addition, this deregulation was already apparent in tumors of low
stage and low grade (TaG1G2). Therefore, although TaG1G2
FGFR3-mutated tumors are well differentiated, they already
present a loss of expression of several genes associated with
Figure 8. Several deregulated genes have their expression correlated with the expression of MKI67, a proliferation marker gene. ThePearson correlation coefficient (r) between the expression of the deregulated genes and the expression of proliferation marker gene, MKI67, wascalculated for FGFR3-mutated tumors in the TaG1G2 group (n = 28) and for FGFR3-non-mutated tumors in the T2–4 group (n = 63). The expression ofthe deregulated genes as a function of MKI67 expression is shown in TaG1G2 FGFR3-mutated tumors (upper figures) and in T2–4 non-mutated tumors(lower figures). Only the plots for the correlated genes are presented (p,1%, which corresponds to a correlation coefficient, |r| above 0.479 for theFGFR3-mutated tumor group and above 0.323 for the FGFR3-non-mutated tumor group).doi:10.1371/journal.pone.0039469.g008
Table 6. Deregulated genes correlated with differentiation markers.
FOXA1 GRHL3 UPK1A UPK1B UPK2 UPK3A UPK3B
TaG1G2 T2–4 TaG1G2 T2–4 TaG1G2 T2–4 TaG1G2 T2–4 TaG1G2 T2–4 TaG1G2 T2–4 TaG1G2 T2–4
ANKRD27 0.331 0.024 0.511 0.382 0.62 0.327 0.211 0.11 0.691 0.386 0.361 0.142 0.138 0.209
CASP1 0.021 20.51 20.175 20.193 20.402 20.349 20.27 20.158 20.509 20.319 20.482 20.353 20.345 20.2
MLPH 0.177 0.318 20.114 20.062 0.398 0.297 0.559 0.379 0.255 0.241 0.039 0.5 0.562 0.22
MYO5B 0.458 0.35 0.436 0.502 0.593 0.53 0.272 0.363 0.583 0.6 0.314 0.428 0.415 0.39
RAB11A 0.199 0.43 0.344 0.52 0.508 0.392 0.229 0.273 0.604 0.396 0.304 0.324 0.412 0.274
RAB11FIP1 0.629 0.502 0.471 0.578 0.698 0.55 0.317 0.552 0.481 0.672 0.184 0.625 0.335 0.692
RAB20 20.02 0.367 20.025 0.488 0.347 0.56 0.079 0.474 0.574 0.536 0.488 0.475 0.345 0.399
RAB27A 20.011 20.162 20.104 20.374 20.506 20.325 20.163 20.181 20.543 20.372 20.529 20.248 20.067 20.185
SYTL2 0.559 0.48 0.395 0.28 0.433 0.472 0.235 0.39 0.296 0.363 20.079 0.555 20.02 0.448
The Pearson correlation coefficient (r) of the expression of the deregulated genes with the expression of urothelial differentiation markers in FGFR3-mutated superficialtumors (TaG1G2) (n = 28 samples) and FGFR3-non-mutated muscle-invasive tumors (T2–4) (n = 63) is presented. Correlation with p,1% (|r| above 0.479 for Ta-T1 tumors,and |r| above 0.323 for FGFR3-non-mutated T2–4 tumors) are written in bold.doi:10.1371/journal.pone.0039469.t006
Deregulation of Rab and Rab Effectors in Cancer
PLoS ONE | www.plosone.org 12 June 2012 | Volume 7 | Issue 6 | e39469
differentiation. It remains to know whether these Rab genes are
simply secondary markers of differentiation or if they play a role in
bladder cancer pathogenesis. We expected to find more genes
linked to differentiation being lost in the FGFR3-non-mutated
tumor pathway as these tumors are usually of high grade
compared to the tumors of the FGFR3-mutated tumor pathway.
This was actually not the case. This unexpected result could be
due to some heterogeneity in FGFR3-non-mutated tumors, as
heterogeneity decreases the number of identified deregulated
genes. A better characterization of bladder tumors should lead to
the identification of new genes specifically deregulated in new
subgroups of tumors.
In conclusion, the strategy applied in this study can be easily
applied to any set of genes and any tumor subgroups. It requires
biologists, specialists of a given pathway/process, to select the most
appropriate set of genes and to interpret the results. In many
tumors, the normal counterpart of the transformed cell is not
available or not known. In this case, one can compare tumors of
different stages and grades. The next step will be to address the
cellular functions of the genes deregulated at the transcriptome
level and their possible implication in cancer pathogenesis.
Materials and Methods
Establishment of the list of genesWe first used the GeneCards database and found 61 human
RAB genes indexed. Then using the RAB gene name and the
different aliases listed as key search words we found in 185 articles
indexed in PubMed a total of 217 proteins whose interaction with
one or several Rab proteins has been published up to April 2010.
After adding GDI1, GDI2, CHM, CHML, RABGGTA and
RABGGTB, we worked with a total of 284 genes. We adopted
HUGO gene nomenclature, except for CP110 since its Entrez
Gene name had not been indexed in the HUGO database.
Normal and tumor samplesTumors were staged according to the TNM classification [68]
and graded according to the criteria recommended by the World
Health Organization (1973 classification) [69]. FGFR3 mutation
was assessed by direct sequencing or by the SNaPshot method
[70].
Two sets of independent tumors obtained during transurethral
resection or radical cystectomy [71] and normal urothelium
samples obtained from organ donors [72] were used. The tumors
were provided by Drs A.-C. Baglin and Y. Denoux (Tumorothe-
que, Service d’Anatomie et Cytologie Pathologiques, CMC Foch,
Suresnes, France), Dr M.-J. Terrier-Lacombe (Service de
Pathologie, Institut Gustave Roussy, Villejuif, France), and Pr K.
Leroy (Plateforme de Ressources Biologiques, Pole de Recherche
Clinique, APHP, Hopital Henri Mondor, Creteil, France).
The first set is composed of 4 isolated samples of normal
urothelium and 152 tumor samples: 28 TaG1G2 (FGFR3-
mutated), 2 TaG3 (FGFR3-mutated), 13 T1 (FGFR3-mutated), 9
T2–4 (FGFR3-mutated), 9 TaG1G2 (FGFR3-non-mutated), 3
Figure 9. Gene expression in differentiated or non differentiated normal urothelial cells of the genes found to be associated withproliferation or differentiation in tumors. The expression of the genes found to be associated with proliferation or differentiation in tumorswere measured in normal urothelial cells (NHU) in culture at four different times after passage: 6 hours, 1 day, 3 days and 6 days in differentiatingconditions (in the presence of an inhibitor of EGFR and an activator of PPARcaamm in the NHU medium) or in non-differentiating conditions (NHUmedium only).doi:10.1371/journal.pone.0039469.g009
Deregulation of Rab and Rab Effectors in Cancer
PLoS ONE | www.plosone.org 13 June 2012 | Volume 7 | Issue 6 | e39469

TaG3 (FGFR3-non-mutated), 25 T1 (FGFR3-non-mutated) and 63
T2–4 (FGFR3-non-mutated). These samples were analyzed with
Affymetrix HG U133 Plus 2.0 DNA microarrays. 269 of the 284
genes listed were found in these microarrays when using
BrainArray Annotation ENTREZGENE [73]. F8A1, CCZ1,
GMCL1, RAB13, RAB19, RAB41, RAB43, RAB44, RAB6C, RAB7B,
RAB9B, REP15, RPH3A, TBC1D3B and YWHAQ were absent.
The second set is composed of 5 isolated samples of normal
urothelium and 75 tumor samples: 18 TaG1G2 (FGFR3-mutated),
1 TaG3 (FGFR3-mutated), 5 T1 (FGFR3-mutated), 7 T2–4
(FGFR3-mutated), 3 TaG3 (FGFR3-non-mutated), 2 TaG1G2
(FGFR3-non-mutated), 7 T1 (FGFR3-non-mutated) and 32 T2–4
(FGFR3-non-mutated). These samples were analyzed with Affy-
metrix HG U95A/U95Av2 DNA microarrays. 165 of the 284
genes listed were present in custom chip definition of BrainArray
ENTREZGENE.
We worked with 7 bladder cancer cell lines: KK47, MGHU3,
RT112, RT4, SCaBER, SD48 and T24, and normal human
urothelial (NHU) cells grown in culture following previous
protocols [27,28]. These cell lines were analyzed with Affymetrix
Human exon 1.0stV2 microarrays. 281 of the 284 genes listed
were present in remapped chip definition: CCZ1, F8A1 and
RAB7B were absent. RT4, RT112 and T24 were obtained from
DSMZ (Braunschweig, Germany), SCaBER from ATCC (Rock-
ville, MD), KK47 and SD48 from the laboratory of D. Chopin
(Hopital Henri Mondor, Creteil, France) and MGHU3 from the
laboratory of Y. Fradet (University of Laval, Quebec, Canada). To
verify the identity of the various cell lines used, we analyzed the
genomic alterations with comparative genomic hybridization
(CGH) arrays and FGFR3, TP53, HRAS, and KRAS mutations
with the SNaPshot technique (for FGFR3) or classical sequencing
for the other genes. CGH array profiles were found to be similar to
published CGH profiles and/or consistent with previously
reported genomic alterations, and mutations were found to be
identical to the reported mutations (data not shown).
The NHU cell cultures used for the last part of the results were
established and maintained in culture as described [27] and were
induced to differentiate by treatment with an EGFR (epidermal
growth factor receptor) inhibitor and an activator of PPARc(peroxisome proliferator-activated receptor gamma) [28,74].
Differentiated and untreated cultures were analyzed with Affyme-
trix HG U133 Plus 2.0 DNA microarrays.
RNA was prepared from the normal and tumor samples and
cancer cell lines with the cesium chloride procedure [75].
All patients provided written informed consent and the study
was approved by the ethics committees of the different hospitals
(Comite de Protection des Personnes de l’hopital Henri Mondor,
Comite de Protection des Personnes de Boulogne – Ambroise Pare
and Comite de Protection des Personnes de Bicetre). All analyses
were performed on the basis of anonymized patient data.
Affymetrix microarray dataWe used the Human Genome U95A, U95Av2, U133Plus2.0
and Human Exon 1.0st V2 arrays (Affymetrix). Details of the
methods for RNA amplification, cDNA probe labeling and
hybridization steps can be obtained from the Affymetrix web site.
All gene expression data were normalized and summarized using
RMA (Robust Multi-array Averaging) algorithm [76] with custom
chip definition developed by Microarray Lab, BrainArray [73].
BrainArray annotation ENTREGENE (version 12, available at
http://brainarray.mbni.med.umich.edu/Brainarray/Database/
CustomCDF/CDF_download.asp#v12) providing one remapped
probe set per gene according to National Center for Biotechnology
Information (NCBI) Homo sapiens ENTREGENE build 36.1 was
used. One log2-transformed signal value per gene was obtained.
The all normalized microarray data sets are available online at
http://microarrays.curie.fr/publications/UMR144/RabBladder/
(login: rabbld; password: 248ba64). Concerning the deposition in
ArrayExpress, we do not expect to receive the accession numbers
immediately and will notify PLoS ONE when we will receive
them.
Data were generated by using R language environment (version
2.12.0, available at http://www.r-project.org/) and bioconductor
packages (available at http://www.bioconductor.org/).
Method of analysisWe used the statistical SAM (Significance Analysis of Micro-
arrays) test [77], adapted for Excel, to compare the transcriptional
levels of the genes between two different groups. We used Log2
(data) and the following parameters: Two class unpaired; Analysis
type (Standard (genes)); T test statistic; No median center the
array; Number of permutations: 100; Automatic estimate for s0
factor for denominator; Imputation Engine: K-Nearest Neigh-
bours Imputer; Number of Neighbours: 10; Random number
seed: 1234567.
We used Microsoft Office Excel 2003 to calculate the Pearson
correlation. Log2(data) was used. The significance (two-tailed
probability) of the Pearson correlation was calculated using the p-
Value calculator of danielsoper.com (http://www.danielsoper.
com/statcalc/calc44.aspx).
The binomial test on R (binom.test) was used with the
parameter: alternative = c(‘‘greater’’).
The Student test pValue was calculated with the following Excel
parameters: two tails and different variance hypothesis.
Supporting Information
Figure S1 Rab clusters. A Rab cluster is defined as a Rab and
its interacting proteins: the GEFs (guanine nucleotide exchange
factors), the GAPs (GTPase activating proteins) and the effector
proteins. Rab proteins are in yellow, GEFs in green, GAPs in light
red and effector proteins in blue.
(PDF)
Table S1 List of papers in which the Rab partners wereoriginally described.
(XLS)
Table S2 Genes deregulated during bladder cancerpathogenesis: second set of data. Second set of data.
Affymetrix HG U95A/U95Av2 DNA microarrays. Genes down-
or up-regulated in the tumor samples. Left: FGFR3-non-mutated
tumor groups. Right: FGFR3-mutated tumor groups. The results
shown to pass the thresholds: FC.1.5 (or ,0.667) and qValue
,5% with the first set of data are in red (or green) or highlighted
in red (or green). The highlighted values in red or green pass the
thresholds FC.1.5 or FC ,0.667 or qValue ,5% with the
second set of data also. The results highlighted in yellow pass the
thresholds: FC.1.5 (or ,0.667) and qValue ,5% only with the
second set of data.
(PDF)
Table S3 Genes deregulated only in FGFR-non-mutated(A) and mutated tumors (B). Genes up- (or down)-regulated
that pass the thresholds: FC.1.5 (or ,0.667) and qValue ,5%
only for the FGFR3-non-mutated (A) or FGFR3-mutated (B) tumor
pathway. Left column: comparison with the normal urothelium
samples. Right column: comparison with the tumor samples of
same stage with the opposite FGFR3 mutation status. The results
Deregulation of Rab and Rab Effectors in Cancer
PLoS ONE | www.plosone.org 14 June 2012 | Volume 7 | Issue 6 | e39469
that pass the above thresholds are highlighted (red for up-
regulation and green for down-regulation).
(PDF)
Table S4 Genes significantly up- or down-regulated ineach Rab cluster for each tumor group of the twopathways. ‘‘D’’ (green) corresponds to a gene significantly down-
regulated in the tumor samples, ‘‘U’’ (red) corresponds to a gene
significantly up-regulated in the tumor samples. ‘‘% All genes’’
corresponds to the total number of genes up- or down-regulated
within each tumor group. A binomial test was applied for each
Rab cluster within each tumor group. The binomial test pValues
,1% are highlighted in orange. ‘‘Absent’’ corresponds to a gene
absent in the Affymetrix HG U133 Plus 2.0 DNA microarrays.
(XLS)
Table S5 Pearson correlation (r) (and pValue) betweenthe expression of MKI67 and the expression of geneslisted in left column. Pearson correlation (r) (and pValue)
between the expression of MKI67 and the expression of genes
listed in left column in 28 Ta G1G2 (FGFR3-mutated) tumor
samples and 63 T2-4 (FGFR3-non-mutated) tumor samples. Are
highlighted (in green or red) when |r| .0.479 for the Ta G1G2
(FGFR3-mutated) group (28 samples) and |r| .0.323 for the T2–4
(FGFR3-non-mutated) group (63 samples).
(PDF)
Table S6 Pearson correlation (r) (and pValue) betweenthe expression of different urothelial differentiationmarkers genes and the expression of genes listed in leftcolumn. Pearson correlation (r) (and pValue) between the
expression of FOXA1, GRHL3, UPK1A/B, UPK2, UPK3A/B and
the expression of genes listed in left column in 28 Ta G1/G2
(FGFR3-mutated) tumor samples and 63 T2–4 (FGFR3-non-
mutated) tumor samples. Are highlighted (red corresponds to a
correlation, green corresponds to an inverse correlation) when the
two correlation values pass the thresholds: |r| .0.479 (pValue
,1%) for the Ta G1G2 (FGFR3-mutated) group (28 samples) and
|r| .0.323 (pValue ,1%) for the T2–4 (FGFR3-non-mutated)
group (63 samples).
(XLS)
Acknowledgments
We thank Nicolas Stransky, Celine Vallot, Isabelle Bernard-Pierrot,
Sandra Rebouissou, Sabine Bardin and Andrew Lindsay for helpful
suggestions during this work. We thank Christophe Battail, Nicolas Servant
and Georges Lucotte for their help with bioinformatic data. We thank
members of the bladder cancer CIT (« carte d’identite des tumeurs »)
consortium (Pascale Maille, Henri Mondor hospital, Pathology Depart-
ment; Dimitri Vordos, Henri Mondor hospital, Urology Department;
Mathilde Sibony, Tenon hospital, Pathology Department; Agnes La-
planche, IGR, INSERM; Yves Denoux, Foch hospital, Pathology
Department; Yann Neuzillet, Foch hospital, Urology Department;
Aurelien de Reynies, La Ligue Nationale Contre Le Cancer) for their
constant support. The transcriptomic data used in this study were obtained
through a collaboration with the Ligue Nationale Contre le Cancer (‘‘Carte
d’identite des tumeurs’’ program) for the first set of samples, and with
AstraZeneca (Stransky et al. 2006 and unpublished results) for the second
set of samples.
Author Contributions
Conceived and designed the experiments: BG FR JS. Performed the
experiments: JH LK. Analyzed the data: JH EC RN. Contributed
reagents/materials/analysis tools: YA TL SB. Wrote the paper: JH BG FR.
References
1. Stenmark H (2009) Rab GTPases as coordinators of vesicle traffic. Nat Rev Mol
Cell Biol 10(8): 513–25.
2. Shimada K, Uzawa K, Kato M, Endo Y, Shiiba M, et al. (2005) Aberrant
expression of RAB1A in human tongue cancer. Br J Cancer 92(10): 1915–21.
3. Lankat-Buttgereit B, Fehmann HC, Hering BJ, Bretzel RG, Goke B (1994)
Expression of the ras-related rab3a gene in human insulinomas and normal
human pancreatic islets. Pancreas 9(4): 434–8.
4. Gebhardt C, Breitenbach U, Richter KH, Furstenberger G, Mauch C, et al.
(2005) c-Fos-dependent induction of the small ras-related GTPase Rab11a in
skin carcinogenesis. Am J Pathol. 167(1): 243–53.
5. Amillet JM, Ferbus D, Real FX, Antony C, Muleris M, et al. (2006)
Characterization of human Rab20 overexpressed in exocrine pancreatic
carcinoma. Hum Pathol. 37(3): 256–63.
6. Wu CY, Tseng RC, Hsu HS, Wang YC, Hsu MT (2009) Frequent down-
regulation of hRAB37 in metastatic tumor by genetic and epigenetic
mechanisms in lung cancer. Lung Cancer 63(3): 360–7.
7. Croizet-Berger K, Daumerie C, Couvreur M, Courtoy PJ, van den Hove MF
(2002) The endocytic catalysts, Rab5a and Rab7, are tandem regulators of
thyroid hormone production. Proc Natl Acad Sci USA 99(12): 8277–82.
8. Fukui K, Tamura S, Wada A, Kamada Y, Igura T, et al. (2007) Expression of
Rab5a in hepatocellular carcinoma: Possible involvement in epidermal growth
factor signaling. Hepatol Res. 37(11): 957–65.
9. Hou Q, Wu YH, Grabsch H, Zhu Y, Leong SH, et al. (2008) Integrative
genomics identifies RAB23 as an invasion mediator gene in diffuse-type gastric
cancer. Cancer Res. 68(12): 4623–30.
10. Cheng KW, Lahad JP, Kuo WL, Lapuk A, Yamada K, et al. (2004) The RAB25
small GTPase determines aggressiveness of ovarian and breast cancers. Nat
Med. 10(11): 1251–6.
11. Agarwal R, Jurisica I, Mills GB, Cheng KW (2009) The emerging role of the
RAB25 small GTPase in cancer. Traffic 10(11): 1561–8.
12. Goldenring JR, and Nam KT (2011) Rab25 as a tumour suppressor in colon
carcinogenesis. Br J Cancer 104(1): 33–6.
13. Milstein M, Mooser CK, Hu H, Fejzo M, Slamon D, et al. (2007) RIN1 is a
breast tumor suppressor gene. Cancer Res. 67(24): 11510–6.
14. Pei L, Peng Y, Yang Y, Ling XB, Van Eyndhoven WG, et al. (2002) PRC17, a
novel oncogene encoding a Rab GTPase-activating protein, is amplified in
prostate cancer. Cancer Res. 62(19): 5420–4.
15. Ferlay J, Parkin DM, Steliarova-Foucher E (2010) Estimates of cancer incidence
and mortality in Europe in 2008. Eur J Cancer 46(4): 765–81.
16. Jemal A, Siegel R, Xu J, Ward E (2010) Cancer statistics, 2010. CA Cancer J
Clin. 60(5): 277–300.
17. Jacobs BL, Lee CT, Montie JE (2010) Bladder cancer in 2010: how far have we
come? CA Cancer J Clin. 60(4): 244–72.
18. Knowles MA (2008) Molecular pathogenesis of bladder cancer. Int J Clin Oncol.
13(4): 287–97.
19. Cappellen D, De Oliveira C, Ricol D, de Medina S, Bourdin J, et al. (1999)
Frequent activating mutations of FGFR3 in human bladder and cervix
carcinomas. Nat Genet. 23(1):18–20.
20. Billerey C, Chopin D, Aubriot-Lorton MH, Ricol D, Gil Diez de Medina S, et
al. (2001) Frequent FGFR3 mutations in papillary non-invasive bladder (pTa)
tumors. Am J Pathol. 158(6): 1955–9.
21. van Rhijn BW, Vis AN, van der Kwast TH, Kirkels WJ, Radvanyi F, et al.
(2003) Molecular grading of urothelial cell carcinoma with fibroblast growth
factor receptor 3 and MIB-1 is superior to pathologic grade for the prediction of
clinical outcome. J Clin Oncol. 21(10): 1912–21.
22. Kimura T, Suzuki H, Ohashi T, Asano K, Kiyota H, et al. (2001) The incidence
of thanatophoric dysplasia mutations in FGFR3 gene is higher in low-grade or
superficial bladder carcinomas. Cancer 92(10): 2555–61.
23. Zieger K, Dyrskjøt L, Wiuf C, Jensen JL, Andersen CL, et al. (2005) Role of
activating fibroblast growth factor receptor 3 mutations in the development of
bladder tumors. Clin Cancer Res. 11(21): 7709–19.
24. Tomlinson DC, Baldo O, Harnden P, Knowles MA (2007) FGFR3 protein
expression and its relationship to mutation status and prognostic variables in
bladder cancer. J Pathol. 213(1): 91–8.
25. Luis NM, Lopez-Knowles E, Real FX (2007) Molecular biology of bladder
cancer. Clin Transl Oncol. 9(1): 5–12.
26. Heney NM, Ahmed S, Flanagan MJ, Frable W, Corder MP, et al. (1983)
Superficial bladder cancer: progression and recurrence. J Urol. 130(6): 1083–6.
27. Southgate J, Hutton KA, Thomas DF, Trejdosiewicz LK (1994) Normal human
urothelial cells in vitro: proliferation and induction of stratification. Lab Invest.
71(4): 583–94.
28. Varley CL, Bacon EJ, Holder JC, Southgate J (2009) FOXA1 and IRF-1
intermediary transcriptional regulators of PPARgamma-induced urothelial
cytodifferentiation. Cell Death Differ. 16(1): 103–14.
29. Gerdes J, Li L, Schlueter C, Duchrow M, Wohlenberg C, et al. (1991)
Immunobiochemical and molecular biologic characterization of the cell
proliferation-associated nuclear antigen that is defined by monoclonal antibody
Ki-67. Am J Pathol. 138(4): 867–73.
Deregulation of Rab and Rab Effectors in Cancer
PLoS ONE | www.plosone.org 15 June 2012 | Volume 7 | Issue 6 | e39469
30. Lobban ED, Smith BA, Hall GD, Harnden P, Roberts P, et al. (1998) Uroplakin
gene expression by normal and neoplastic human urothelium. Am J Pathol.153(6): 1957–67.
31. Olsburgh J, Weeks R, Selby P, Southgate J (2002) Human uroplakin lb gene
structure and promoter analysis. Biochim Biophys Acta. 1576(1–2): 163–70.32. Deng FM, Liang FX, Tu L, Resing KA, Hu P, et al. (2002) Uroplakin IIIb, a
urothelial differentiation marker, dimerizes with uroplakin Ib as an early step ofurothelial plaque assembly. J Cell Biol. 159(4): 685–94.
33. Olsburgh J, Harnden P, Weeks R, Smith B, Joyce A, et al. (2003) Uroplakin gene
expression in normal human tissues and locally advanced bladder cancer. JPathol. 199(1): 41–9.
34. Yu Z, Mannik J, Soto A, Lin KK, Andersen B (2009) The epidermaldifferentiation-associated Grainyhead gene Get1/Grhl3 also regulates urothelial
differentiation. EMBO J. 28(13): 1890–903.35. Dyrskjøt L, Kruhøffer M, Thykjaer T, Marcussen N, Jensen JL, et al. (2004)
Gene expression in the urinary bladder: a common carcinoma in situ gene
expression signature exists disregarding histopathological classification. CancerRes. 64(11): 4040–8.
36. Vallot C, Stransky N, Bernard-Pierrot I, Herault A, Zucman-Rossi J, et al.(2011) A novel epigenetic phenotype associated with the most aggressive
pathway of bladder tumor progression. J Natl Cancer Inst. 103(1):47–60.
37. Fischer J, Weide T, Barnekow A (2005) The MICAL proteins and rab1: apossible link to the cytoskeleton? Biochem Biophys Res Commun. 328(2): 415–
23.38. Ashida S, Furihata M, Katagiri T, Tamura K, Anazawa Y, et al. (2006)
Expression of novel molecules, MICAL2-PV (MICAL2 prostate cancervariants), increases with high Gleason score and prostate cancer progression.
Clin Cancer Res. 12(9): 2767–73.
39. Graham ME, Handley MT, Barclay JW, Ciufo LF, Barrow SL, et al. (2008) Again-of-function mutant of Munc18-1 stimulates secretory granule recruitment
and exocytosis and reveals a direct interaction of Munc18-1 with Rab3. BiochemJ. 409(2): 407–16.
40. Zhang X, He X, Fu XY, Chang Z (2006) Varp is a Rab21 guanine nucleotide
exchange factor and regulates endosome dynamics. J Cell Sci. 119(Pt 6): 1053–62.
41. Simpson JC, Griffiths G, Wessling-Resnick M, Fransen JA, Bennett H, et al.(2004) A role for the small GTPase Rab21 in the early endocytic pathway. J Cell
Sci. 117(Pt 26): 6297–311.42. Burgo A, Sotirakis E, Simmler MC, Verraes A, Chamot C, et al. (2009) Role of
Varp, a Rab21 exchange factor and TI-VAMP/VAMP7 partner, in neurite
growth. EMBO Rep. 10(10): 1117–24.43. Tamura K, Ohbayashi N, Maruta Y, Kanno E, Itoh T, et al. (2009) Varp is a
novel Rab32/38-binding protein that regulates Tyrp1 trafficking in melanocytes.Mol Biol Cell. 20(12): 2900–8.
44. Hales CM, Griner R, Hobdy-Henderson KC, Dorn MC, Hardy D, et al. (2001)
Identification and characterization of a family of Rab11-interacting proteins. JBiol Chem. 276(42): 39067–75.
45. Khandelwal P, Ruiz WG, Balestreire-Hawryluk E, Weisz OA, Goldenring JR, etal. (2008) Rab11a-dependent exocytosis of discoidal/fusiform vesicles in bladder
umbrella cells. Proc Natl Acad Sci U S A 105(41): 15773–8.46. Tang BL (2010) Is Rab25 a tumor promoter or suppressor–context dependency
on RCP status? Tumour Biol. 31(4): 359–61.
47. Izumi T (2007) Physiological roles of Rab27 effectors in regulated exocytosis.Endocr J. 54(5): 649–57.
48. Starr DA, Saffery R, Li Z, Simpson AE, Simpson AE, et al. (2000) HZwint-1, anovel human kinetochore component that interacts with HZW10. J Cell Sci.
113(Pt 11): 1939–50.
49. Famulski JK, Vos L, Sun X, Chan G (2008) Stable hZW10 kinetochoreresidency, mediated by hZwint-1 interaction, is essential for the mitotic
checkpoint. J Cell Biol. 180(3): 507–20.50. Endoh H, Tomida S, Yatabe Y, Konishi H, Osada H, et al. (2004) Prognostic
model of pulmonary adenocarcinoma by expression profiling of eight genes as
determined by quantitative real-time reverse transcriptase polymerase chainreaction. J Clin Oncol. 22(5): 811–9.
51. Liu YJ, Wang Q, Li W, Huang XH, Zhen MC, et al. (2007) Rab23 is a potentialbiological target for treating hepatocellular carcinoma. World J Gastroenterol.
13(7): 1010–7.52. Kim KR, Oh SY, Park UC, Wang JH, Lee JD, et al. (2007) [Gene expression
profiling using oligonucleotide microarray in atrophic gastritis and intestinal
metaplasia]. Korean J Gastroenterol. 49(4): 209–24.53. Wang Y, Ng EL, Tang BL (2006) Rab23: what exactly does it traffic? Traffic
7(6): 746–50.54. Shin K, Lee J, Guo N, Kim J, Lim A, et al. (2011) Hedgehog/Wnt feedback
supports regenerative proliferation of epithelial stem cells in bladder. Nature
472(7341): 110–4.
55. Cormont M, Meton I, Mari M, Monzo P, Keslair F, et al. (2003) CD2AP/CMS
regulates endosome morphology and traffic to the degradative pathway through
its interaction with Rab4 and c-Cbl. Traffic 4(2): 97–112.
56. Ng EL, Ng JJ, Liang F, Tang BL (2009) Rab22B is expressed in the CNS
astroglia lineage and plays a role in epidermal growth factor receptor trafficking
in A431 cells. J Cell Physiol. 221(3): 716–28.
57. Bellmunt J, Hussain M, Dinney CP (2003) Novel approaches with targeted
therapies in bladder cancer. Therapy of bladder cancer by blockade of the
epidermal growth factor receptor family. Crit Rev Oncol Hematol. 46 Suppl:
S85–104.
58. Kotzsch M, Sieuwerts AM, Grosser M, Meye A, Fuessel S, et al. (2008)
Urokinase receptor splice variant uPAR-del4/5-associated gene expression in
breast cancer: identification of rab31 as an independent prognostic factor. Breast
Cancer Res Treat. 111(2): 229–40.
59. Caswell PT, Spence HJ, Parsons M, White DP, Clark K, et al. (2007) Rab25
associates with alpha5beta1 integrin to promote invasive migration in 3D
microenvironments. Dev Cell. 13(4): 496–510.
60. Andrade VC, Vettore AL, Panepucci RA, Almeida MS, Yamamoto M, et al.
(2010) Number of expressed cancer/testis antigens identifies focal adhesion
pathway genes as possible targets for multiple myeloma therapy. Leuk
Lymphoma 51(8): 1543–9.
61. Fang Z, Yao W, Xiong Y, Zhang J, Liu L, et al. (2010) Functional elucidation
and methylation-mediated downregulation of ITGA5 gene in breast cancer cell
line MDA-MB-468. J Cell Biochem. 110(5): 1130–41.
62. Valastyan S, Chang A, Benaich N, Reinhardt F, Weinberg RA (2010)
Concurrent suppression of integrin alpha5, radixin, and RhoA phenocopies
the effects of miR-31 on metastasis. Cancer Res. 70(12): 5147–54.
63. Chen Y, Guo X, Deng FM, Liang FX, Sun W, et al. (2003) Rab27b is associated
with fusiform vesicles and may be involved in targeting uroplakins to urothelial
apical membranes. Proc Natl Acad Sci U S A 100(24): 14012–7.
64. Goi T, Takeuchi K, Katayama K, Hirose K, Yamaguchi A (2002) Mutations of
rabphillin-3A-like gene in colorectal cancers. Oncol Rep. 9(6): 1189–92.
65. Fontijn RD, Goud B, Echard A, Jollivet F, van Marle J, et al. (2001) The human
kinesin-like protein RB6K is under tight cell cycle control and is essential for
cytokinesis. Mol Cell Biol. 21(8): 2944–55.
66. Neef R, Gruneberg U, Barr FA (2005) Assay and functional properties of
Rabkinesin-6/Rab6-KIFL/MKlp2 in cytokinesis. Methods Enzymol. 403: 618–
28.
67. Lu Y, Liu P, Wen W, Grubbs CJ, Townsend RR, et al. (2010) Cross-species
comparison of orthologous gene expression in human bladder cancer and
carcinogen-induced rodent models. Am J Transl Res. 3(1): 8–27.
68. Sobin LH and Fleming ID (1997) TNM Classification of Malignant Tumors,
fifth edition. Union Internationale Contre le Cancer and the American Joint
Committee on Cancer. Cancer 1997; 80(9):1803–4.
69. Mostofi FK, Sobin LH, Torloni H (1973) International Histological Clasification
of Tumors, No 10: Histological Typing of Urinary Bladder Tumors World
Health Organization, Geneva, 1973.
70. van Oers JM, Lurkin I, van Exsel AJ, Nijsen Y, van Rhijn BW, et al. (2005) A
simple and fast method for the simultaneous detection of nine fibroblast growth
factor receptor 3 mutations in bladder cancer and voided urine. Clin Cancer
Res. 11(21): 7743–8.
71. Stransky N, Vallot C, Reyal F, Bernard-Pierrot I, de Medina SG, et al. (2006)
Regional copy number-independent deregulation of transcription in cancer. Nat
Genet. 38(12): 1386–96.
72. Diez de Medina SG, Chopin D, El Marjou A, Delouvee A, LaRochelle WJ, et al.
(1997) Decreased expression of keratinocyte growth factor receptor in a subset of
human transitional cell bladder carcinomas. Oncogene 14(3): 323–30.
73. Dai M, Wang P, Boyd AD, Kostov G, Athey B, et al. (2005) Evolving gene/
transcript definitions significantly alter the interpretation of GeneChip data.
Nucleic Acids Res. 33(20): e175.
74. Varley CL, Stahlschmidt J, Lee WC, Holder J, Diggle C, et al. (2004) Role of
PPARgamma and EGFR signalling in the urothelial terminal differentiation
programme. J Cell Sci. 117(Pt 10): 2029–36.
75. Chirgwin JM, Przybyla AE, MacDonald RJ, Rutter WJ (1979) Isolation of
biologically active ribonucleic acid from sources enriched in ribonuclease.
Biochemistry 18(24): 5294–9.
76. Bolstad BM, Irizarry RA, Astrand M, Speed TP (2003) A comparison of
normalization methods for high density oligonucleotide array data based on
variance and bias. Bioinformatics 19(2): 185–93.
77. Tusher VG, Tibshirani R, Chu G (2001) Significance analysis of microarrays
applied to the ionizing radiation response. Proc Natl Acad Sci USA 98(9): 5116–
21.
Deregulation of Rab and Rab Effectors in Cancer
PLoS ONE | www.plosone.org 16 June 2012 | Volume 7 | Issue 6 | e39469
Related Documents