Research Article Depletion of the Third Complement Component Ameliorates Age- Dependent Oxidative Stress and Positively Modulates Autophagic Activity in Aged Retinas in a Mouse Model Dorota Rogińska, 1 Miłosz P. Kawa, 1 Ewa Pius-Sadowska, 1 Renata Lejkowska, 1 Karolina Łuczkowska, 1 Barbara Wiszniewska, 2 Kai Kaarniranta, 3,4 Jussi J. Paterno, 3,4 Christian A. Schmidt, 5 Bogusław Machaliński, 1 and Anna Machalińska 2,6 1 Department of General Pathology, Pomeranian Medical University, Al. Powstancow Wlkp. 72, 70-111 Szczecin, Poland 2 Department of Histology and Embryology, Pomeranian Medical University, Al. Powstancow Wlkp. 72, 70-111 Szczecin, Poland 3 Department of Ophthalmology, Institute of Clinical Medicine, University of Eastern Finland, 70211 Kuopio, Finland 4 Department of Ophthalmology, Kuopio University Hospital, 70211 Kuopio, Finland 5 Clinic for Internal Medicine C, University of Greifswald, 17475 Greifswald, Germany 6 Department of Ophthalmology, Pomeranian Medical University, Al. Powstancow Wlkp. 72, 70-111 Szczecin, Poland Correspondence should be addressed to Anna Machalińska; [email protected] Received 25 April 2017; Revised 28 June 2017; Accepted 9 July 2017; Published 8 August 2017 Academic Editor: Kota V. Ramana Copyright © 2017 Dorota Rogińska et al. This is an open access article distributed under the Creative Commons Attribution License, which permits unrestricted use, distribution, and reproduction in any medium, provided the original work is properly cited. The aim of the study was to investigate the influence of complement component C3 global depletion on the biological structure and function of the aged retina. In vivo morphology (OCT), electrophysiological function (ERG), and the expression of selected oxidative stress-, apoptosis-, and autophagy-related proteins were assessed in retinas of 12-month-old C3-deficient and WT mice. Moreover, global gene expression in retinas was analyzed by RNA arrays. We found that the absence of active C3 was associated with (1) alleviation of the age-dependent decrease in retinal thickness and gradual deterioration of retinal bioelectrical function, (2) significantly higher levels of antioxidant enzymes (catalase and glutathione reductase) and the antiapoptotic survivin and Mcl-1/Bak dimer, (3) lower expression of the cellular oxidative stress marker—4HNE—and decreased activity of proapoptotic caspase-3, (4) ameliorated retinal autophagic activity with localization of ubiquitinated protein conjugates commonly along the retinal pigment epithelium (RPE) layer, and (5) significantly increased expression of several gene sets associated with maintenance of the physiological functions of the neural retina. Our findings shed light on mechanisms of age-related retinal alterations by identifying C3 as a potential therapeutic target for retinal aging. 1. Introduction Age-related deterioration of the retina seriously constrains the vision quality of a growing number of elderly people worldwide. Recently, the dysregulation of inflammatory and immune pathways has become increasingly accepted as key fundamental mechanisms of age-related retinal alterations [1]. It is widely accepted that age-related retinal cell injury caused by accumulative oxidative stress (OS) represents an initial determinant for various age-related retinal malfunc- tions. Lipofuscin, the aging-associated pigmented material, which accumulates in the cells of the retinal pigment epithe- lium (RPE) with age together with the accumulation of basal laminar deposits, and drusen in Bruch’s membrane have been proposed to be mainly responsible for the increase in Hindawi Oxidative Medicine and Cellular Longevity Volume 2017, Article ID 5306790, 17 pages https://doi.org/10.1155/2017/5306790

Welcome message from author
This document is posted to help you gain knowledge. Please leave a comment to let me know what you think about it! Share it to your friends and learn new things together.
Transcript
Research ArticleDepletion of the Third Complement Component Ameliorates Age-Dependent Oxidative Stress and Positively Modulates AutophagicActivity in Aged Retinas in a Mouse Model
Dorota Rogińska,1 Miłosz P. Kawa,1 Ewa Pius-Sadowska,1 Renata Lejkowska,1
Karolina Łuczkowska,1 Barbara Wiszniewska,2 Kai Kaarniranta,3,4 Jussi J. Paterno,3,4
Christian A. Schmidt,5 Bogusław Machaliński,1 and Anna Machalińska2,6
1Department of General Pathology, Pomeranian Medical University, Al. Powstancow Wlkp. 72, 70-111 Szczecin, Poland2Department of Histology and Embryology, Pomeranian Medical University, Al. Powstancow Wlkp. 72, 70-111 Szczecin, Poland3Department of Ophthalmology, Institute of Clinical Medicine, University of Eastern Finland, 70211 Kuopio, Finland4Department of Ophthalmology, Kuopio University Hospital, 70211 Kuopio, Finland5Clinic for Internal Medicine C, University of Greifswald, 17475 Greifswald, Germany6Department of Ophthalmology, Pomeranian Medical University, Al. Powstancow Wlkp. 72, 70-111 Szczecin, Poland
Correspondence should be addressed to Anna Machalińska; [email protected]
Received 25 April 2017; Revised 28 June 2017; Accepted 9 July 2017; Published 8 August 2017
Academic Editor: Kota V. Ramana
Copyright © 2017 Dorota Rogińska et al. This is an open access article distributed under the Creative Commons AttributionLicense, which permits unrestricted use, distribution, and reproduction in any medium, provided the original work isproperly cited.
The aim of the study was to investigate the influence of complement component C3 global depletion on the biologicalstructure and function of the aged retina. In vivo morphology (OCT), electrophysiological function (ERG), and theexpression of selected oxidative stress-, apoptosis-, and autophagy-related proteins were assessed in retinas of 12-month-oldC3-deficient and WT mice. Moreover, global gene expression in retinas was analyzed by RNA arrays. We found that theabsence of active C3 was associated with (1) alleviation of the age-dependent decrease in retinal thickness and gradualdeterioration of retinal bioelectrical function, (2) significantly higher levels of antioxidant enzymes (catalase and glutathionereductase) and the antiapoptotic survivin and Mcl-1/Bak dimer, (3) lower expression of the cellular oxidative stressmarker—4HNE—and decreased activity of proapoptotic caspase-3, (4) ameliorated retinal autophagic activity withlocalization of ubiquitinated protein conjugates commonly along the retinal pigment epithelium (RPE) layer, and (5)significantly increased expression of several gene sets associated with maintenance of the physiological functions of theneural retina. Our findings shed light on mechanisms of age-related retinal alterations by identifying C3 as a potentialtherapeutic target for retinal aging.
1. Introduction
Age-related deterioration of the retina seriously constrainsthe vision quality of a growing number of elderly peopleworldwide. Recently, the dysregulation of inflammatoryand immune pathways has become increasingly acceptedas key fundamental mechanisms of age-related retinalalterations [1].
It is widely accepted that age-related retinal cell injurycaused by accumulative oxidative stress (OS) represents aninitial determinant for various age-related retinal malfunc-tions. Lipofuscin, the aging-associated pigmented material,which accumulates in the cells of the retinal pigment epithe-lium (RPE) with age together with the accumulation of basallaminar deposits, and drusen in Bruch’s membrane havebeen proposed to be mainly responsible for the increase in
HindawiOxidative Medicine and Cellular LongevityVolume 2017, Article ID 5306790, 17 pageshttps://doi.org/10.1155/2017/5306790
local oxidative stress in the retina [2]. Oxidative stress-relatedcellular products develop as a consequence of autophagy dys-regulation in RPE cells. A large amount of evidence indicatesthat autophagy declines with age and that this progressivereduction may have a causative role in the development ofage-related retinal alterations [3]. Impaired autophagy inthe RPE leads to cell transcytosis and exocytosis and earlysigns of retinal degeneration [4]. Abnormal autophagic andubiquitin-proteasome pathway (UPP) cleansing has beendocumented in aged RPE cells and in retinas from AMDpatients [3–5].
Insufficient degradation of toxic proteins and oxidativelipids triggers an immune response in the affected tissues.In the elderly, the combination of increased production ofreactive oxygen species (ROS) and decreased antioxidantfunctions, accompanied by an upregulation of several inflam-matory genes, such as those encoding interleukin- (IL-) 1β,IL-6, IL-8, and tumor necrosis factor (TNF), leads to abidirectional attack, both from the altered redox status andfrom the dysregulated immune responses [6]. Compellingevidence suggests that the complement system (CS) plays acritical role in regulating inflammatory and immunologicalprocesses in aged retinas. In humans, it was found that C3gene expression is upregulated with aging [7]. Likewise, agedCD59-deficient animals exhibit increased expression ofseveral activators of the alternative CS pathway (C3, CFB,and CFD), particularly in the RPE-choroid layer [8]. Thus,dysregulation of the complement system has been implicatedin the pathogenesis of age-related retinal disorders, for exam-ple, AMD. Consequently, chronic and repetitive nonlethalRPE injuries, together with an oxidative environment andautophagy dysregulation, appear to be important factors forthe development of age-related retinal changes.
Although there is a significant body of research on themechanisms of retinal aging, the complex pathways betweenoxidative stress, initial cellular damage, locally triggeredinflammation, autophagy, and UPP conditions are not yetapparent. Therefore, the aims of this study were twofold:(1) to investigate the effect of C3 depletion on oxidativemetabolism, apoptosis, and autophagic and proteasomalcleansing in aged retinal tissue in vivo and (2) to investigatethe effect of C3 deficiency on global gene expression inaging retinal tissue.
2. Materials and Methods
2.1. Animals. Pathogen-free 12-week-old mature C3-deficient (C3−/−) female mice (strain: B6;129S4-C3tm1Crr/J; Jackson Laboratory, Bar Harbor, ME, USA) and age-matched WT C57BL/6 mice (Polish Academy of Sciences,Wroclaw, Poland) were purchased and maintained understandard conditions with a 12-hour day (160-lux)-night cycleand with ad libitum feeding. These C3−/− mice produce nodetectable C3 protein and no complement activity. Wild-type age- and gender-matched C57BL/6 littermates wereused as the C3-positive controls. Each mouse strain wasdivided into two groups, and one group was maintained toan older age of 12 months. These animals were then used inthe indicated experiments. All animal procedures were
performed according to the regulations in the ARVOStatement for the Use of Animals in Ophthalmic and VisionResearch and were approved by the local ethics committee.We followed the methods of Machalińska et al. [9].
2.2. Electroretinography. Scotopic and photopic ERGs wererecorded from 3- and 12-month-old C3-deficient and WTmice (n = 10 mice, for each group of animals). Followingovernight dark adaptation, the mice were anesthetized byan intraperitoneal injection of ketamine (40mg/kg) andxylazine (4mg/kg) (both from Biowet, Puławy, Poland).Then, the cornea was anesthetized (Alcaine; Alcon, FortWorth, TX, USA), and the pupils were dilated with 1% atro-pine (Polfa Warszawa, Poland). Retinal responses wererecorded with gold ring contact electrodes (LKC Technolo-gies, Gaithersburg, MD, USA). Needle electrodes were placedunder the scalp between the eyes and in the tail as the refer-ence and ground leads, respectively. ERGs were differentiallyamplified (0.05–1500Hz), averaged, and stored using anLKC UTAS BigShot system. ERGs were recorded inresponse to strobe flash stimuli presented in the LKCGanzfeld bowl using a protocol similar to that used forhuman testing. To assess rod photoreceptor function, astrobe white-flash stimulus was presented to the dark-adapted dilated eye with a low flash intensity (24 dB atten-uation), and 8 responses recorded at intervals of 8 s werecomputer-averaged. Mixed rod and cone responses wereobtained by stimulation with white flashes of maximumintensity equal to approximately 1.6 cd∗s/m2 (standardflash, SF; 0 dB attenuation). The retinal responses weremeasured twice with a 28 s interstimulus interval and aver-aged. To evaluate the function of the cone photoreceptors,the animals were light-adapted for 10min under a whitebackground (32 cd/m2). Next, a strobe white-flash stimuluswas presented to the dilated eye in the Ganzfeld bowlusing the maximum flash intensity (0 dB attenuation),and responses to 8 flashes with an interstimulus intervalof 1 s were recorded and averaged. The amplitude of theb-wave was measured from the a-wave trough to the peakof the b-wave or, if an a-wave was not present, from theprestimulus baseline to the peak of the b-wave. To demon-strate changes in the retinal bioelectrical response overtime, the data for each individual 1-year-old mouse werecalculated as a percentage value in reference to the b-waveamplitude measurements obtained from 3-month-old mice(which was considered 100%).
2.3. SD-OCT Imaging. Spectral domain optical coherencetomography was performed in 12-week-old and 12-month-old C3-deficient and WT mice (n = 10 mice, for both groupsof animals). For the imaging procedures, the mice were anes-thetized by intraperitoneal injection of ketamine (40mg/kg)and xylazine (4mg/kg). The pupils were dilated with 1%atropine. Artificial tears were used throughout the procedureto maintain corneal clarity. Images were obtained using theEnvisu R2200-HR SD-OCT device (Bioptigen Inc., Durham,NC, USA) with the reference arm placed at approximately1197mm. SD-OCT images of a specific region of each eyewere obtained using the optic disc as a landmark.
2 Oxidative Medicine and Cellular Longevity

Rectangular scans (1.5mm× 1.5mm, 1280 A-scans/B-scan× 150 B-scans) were obtained first while centering onthe optic nerve and then with the nerve displaced eithertemporally/nasally or superiorly/inferiorly. For quantitativeanalysis, the distance between the first high reflective layer(i.e., the vitreoretinal interface) and the retinal pigment epi-thelium was measured using InVivoVue software. If the opticnerve was placed temporally/nasally, three B-scans (at thelevel of the nerve, 450μm up and down from the nerve) wereadded with one measurement performed 750μm away fromthe optic disc, on each side. When the optic nerve was placedsuperiorly/inferiorly, one B-scan was placed 750μm awayfrom the optic disc with 3 measurements (at the level of thenerve, 450μm to the left and right of the nerve) for both posi-tions. The mean value of all measurements was consideredthe total retinal thickness. To demonstrate changes in thetotal thickness of the retina over time, the data are presentedas a percentage value calculated for each individual 1-year-old mouse in reference to measurements obtained from3-month-old mice (which was considered 100%).
2.4. Tissue Collection. At the end of the experiment, 12-month-old C3-deficient and WT mice were sacrificed bycervical dislocation under anesthesia. The eyes were enucle-ated and divided for different assessments. For histologicaland immunofluorescence analyses, the tissue was fixed inDavidson’s solution, embedded in paraffin, and cut into5μm thick sections (n = 3 eyes in each group of animals).For Affymetrix Gene Chip Microarray, Western blot, andLuminex analyses, total RNA and protein were isolated usingthe PARIS Kit (Thermo Fisher Scientific, Waltham, MA,USA) following the manufacturer’s instructions (n = 14 eyesin each group of animals).
2.5. Histological and Immunofluorescence Analyses. For crosssections, the tissue was routinely stained with hematoxylinand eosin (Sigma-Aldrich, Saint Louis, MO, USA). Forimmunofluorescence analysis, sections were deparaffinizedin xylene (2× 15min) followed by hydration in solutionswith decreasing ethanol concentrations (100, 95, 80, 75, and50%). In the first stage of ubiquitin detection, slides werequenched with 0.1M glycine in TBS for 10 minutes. After30 minutes of blocking in IHC blocking solution (Bethyl Lab-oratories Inc., Montgomery, TX, USA), the sections wereincubated with the primary antibody, rabbit anti-ubiquitin(1 : 200) (Dako Corporation, Carpinteria, CA, USA, cat.number Z0458), at 4°C overnight. On the next day, the sec-ondary antibody, goat anti-rabbit-Alexa Fluor-488 (1 : 500),was applied followed by DAPI (dilution 1 : 10000) for nuclearstaining. For the negative control sections, incubationwith theprimary antibody was omitted and the sections were stainedonly with the secondary antibody and DAPI solution. ForC3 staining, Tyramide Signal Amplification (TSA) (ThermoFisher Scientific, Waltham, MA, USA, cat. number T20925)protocol was applied, according to the manufacturer’sinstructions. Briefly, after 45 minutes of quenching with 3%H2O2 in PBS and 30 minutes of blocking in 1% BSA, thesections were incubated with the primary antibody, rabbitanti-C3 (1 : 100) (Bioss Antibodies Inc., Woburn, MA, USA,
cat. number bs-2934R), at 4°C overnight. On the next day,the secondary antibody, goat anti-rabbit-HRP (1 : 100), wasapplied. Fluorescence detection and signal amplification wereachieved by staining the sections with Tyramide-Alexa Fluor594 in amplification buffer/0.0015% H2O2 for 6 minutes, atroom temperature. DAPI was used for counterstain(1 : 10000). The sections from 12-month-old C3-deficientanimals served as a staining control. After Mowiol mounting(Calbiochem, San Diego, CA, USA), all sections weresubjected to fluorescence microscopy analysis (Carl ZeissMicroImaging, Oberkochen, Germany).
2.6. Western Blot and Densitometry Analyses. Equal amountsof proteins (20μg/well) were loaded and separated by 4–20%sodium dodecyl sulfate polyacrylamide gel electrophoresis(SDS-PAGE, mini-PROTEAN II electrophoresis system,Bio-Rad, Hercules, CA, USA) and then transferred to a0.2μm polyvinylidene fluoride (PVDF) membrane (Bio-Rad, Hercules, CA, USA). After blocking with 3% BSA inTBST, the membrane was probed with a primary antibodyas follows: rabbit anti-catalase (1 : 750) (Abcam, Cambridge,UK, cat. number ab16731), rabbit anti-glutathione reduc-tase (GSR) (1 : 1000) (Abcam, cat number ab16801),mouse anti-4HNE (1 : 1000) (Abcam, cat. numberab48506), rabbit anti-LC3B (1 : 375) (Abcam, cat. numberab48394), mouse anti-p62 (1 : 500) (Abcam, cat numberab56416), rabbit anti-ubiquitin (1 : 1000) (DakoCorporation,Carpinteria, CA, USA, cat. number Z0458), or mouse anti-β-actin (1 : 1200) (Santa Cruz Biotechnology, Dallas, TE, USA,cat. number sc-47778), and incubated overnight at 4°C.Immunoreactive bands were detected using a horseradishperoxidase-conjugated goat anti-rabbit and goat anti-mousesecondary antibody. Chemiluminescence detection was per-formed using the ECL Select Detection Kit (GE Healthcare,formerly Amersham Life Sciences, Little Chalfont, UK), andthe bands were subsequently visualized using a UVP camera(GelDoc-It Imaging System; Bio-Rad, Hercules, CA, USA).Equal loading in the lanes was evaluated by stripping the blotsfor 2 h at 37°C and then overnight at room temperature (IgGElution Buffer; Thermo Fisher Scientific, Waltham, MA,USA). Reprobing was then performed in an analogousmanner with a mouse anti-β-actin as described above. TheBand Analysis tool available in the ImageLab software version4.1 was used to determine the background-subtracted densityof the bands. The relative protein expression levels of 4HNE(4-hydroksy-2,3-nonenal), catalase, GSR, p62, and ubiquitinwere quantified in comparison to those of β-actin. TheLC3B relative protein expression level was calculated by esti-mation of the density of two bands, LC3B-I and LC3B-II,and presented as the LC3B-II/LC3B-I ratio.
2.7. Luminex Assay. Survivin, Mcl-1/Bak dimer, and activecaspase-3 concentrations were quantified in C3-deficientand WT mouse retina homogenates by multiplex fluorescentbead-based immunoassays (Luminex Corporation, Austin,TX, USA) using commercial Bio-Plex Pro™ RBM ApoptosisMultiplex Assays, Panel 3 Analytes (Bio-Rad, Hercules, CA,USA). After adding blocking buffer to all wells of the plate,30μL of each standard control and sample was added to
3Oxidative Medicine and Cellular Longevity
the plate together with the multiplex antibody capture beadsolution, and the plate was incubated with agitation for 1 hrat room temperature. Subsequently, each well was washed 3times with 100μL assay buffer using a hand-held magnet.Next, 40μL of detection antibody cocktail was pipetted intoeach well, and the plate was sealed and incubated at roomtemperature for 1 hr on a shaker. After this step, 20μLstreptavidin-phycoerythrin mixture was added to the platewhich was incubated with agitation for 30 minutes in thedark. Finally, after washing, the microspheres in each wellwere resuspended in 100μL assay buffer and shaken at roomtemperature for 30 sec. The plate was then read and analyzedon the Luminex analyzer, and the analyte concentrationswere determined from five different standard curves show-ing the MFI (median fluorescence intensity) versus proteinconcentration. To standardize the final concentrationvalues, the obtained data were normalized to the totalprotein concentration.
2.8. Affymetrix GeneChip Microarray and Data Analysis.Total RNA isolated from four retinas obtained from 12-month-old C3-deficient and WT mice were pooled to gener-ate two samples for the subsequent experimental procedures.A sense-strand cDNA generated from the total RNA usingan Ambion WT Expression Kit (Thermo Fisher Scientific,Waltham, MA, USA) was subjected to fragmentation andlabeling using the GeneChip WT Terminal Labeling Kit(Affymetrix, Santa Clara, CA) and then hybridized ontoan Affymetrix Mouse Gene 2.1 ST Array Strip. Hybridizationand subsequent fluidics and scanning steps were performedwith an Affymetrix GeneAtlas™ System. The preliminaryanalysis of the scanned chips was performed using Affyme-trix GeneAtlas Operating Software. The quality of the geneexpression data was checked according to the quality controlcriteria provided by the software. The obtained CEL fileswere imported into the downstream data analysis software.All analyses were performed using BioConductor softwarebased on the statistical R programming language. For back-ground correction, normalization, and summation of rawdata, the Robust Multiarray Averaging (RMA) algorithmimplemented in the “affy” package of BioConductor wasapplied. Biological annotation was obtained from the Bio-Conductor “oligo” package in which the annotated dataframe object was merged with the normalized data set, lead-ing to a complete gene data table. The selection criteria ofsignificantly changed gene expression were based on anexpression fold difference higher than |2|.
2.9. DAVID. Functional annotation clustering of differentiallyexpressed genes was performed using DAVID (Database forAnnotation, Visualization, and Integrated Discovery) [10].Gene symbols for up- or downregulated genes from each ofthe compared groups were loaded into DAVID using the“RDAVIDWebService” BioConductor package. Functionalannotation chats generated by DAVID with overrepre-sented gene annotations are shown as bubble plots fromthe BACA BioConductor package (https://cran.r-project.org/web/packages/BACA/BACA.pdf). Bubble plots weregenerated with the following criteria: p value < 0.5, adjusted
method=Benjamini, and minimal number of genes pergroup= 5. Groups of genes fulfilling the mentioned criteriaare presented in a graph in which the bubble size indicatesthe number of genes represented in the corresponding anno-tation and the condition of these genes in terms of theirdown- and upregulation.
2.10. Gene Set Enrichment Analysis (GSEA). GSEA is a com-putational method that is used for testing a priori-definedgene sets (GO terms, pathways) for their association withone of the two compared biological groups. The methodutilizes the Kolmogorov-Smirnov (K-S) statistical test toidentify significantly enriched or depleted groups of genes[11]. GSEA analysis has been conducted using the GSEAJava Desktop Application from the Broad Institute(http://software.broadinstitute.org/gsea/index.jsp). Normal-ized data from all genes were transformed into an appro-priate format and imported into the application. Then, apredefined gene set database was selected from the Molec-ular Signatures Database (MsigDB) [12]. Genes belongingto the selected set were ranked according to the differencein their expression level using the signal-to-noise ratio with1000 permutations. By walking down the ranked list of genes,the enrichment score (ES) was calculated for each selectedgene set. This procedure was performed using a sum statisticwhen a gene was present in the gene set, and the calculationwas decreased when it was not [12]. Enrichment scores werenormalized by their gene set size, and false-positive findingswere corrected by FDR. Significant gene sets were consid-ered to be those with an adjusted nominal p value < 0.01 andFRD q value < 25%.
2.11. Statistical Methods. The significance of the differencesbetween experimental groups was assessed by the Mann–Whitney U test. p < 0 05 was considered statistically signifi-cant. The data are presented as the mean± standard deviation(SD). Benjamini and Hochberg multiple testing correctionwas applied to correct for false-positive results in themicroarray analysis.
3. Results
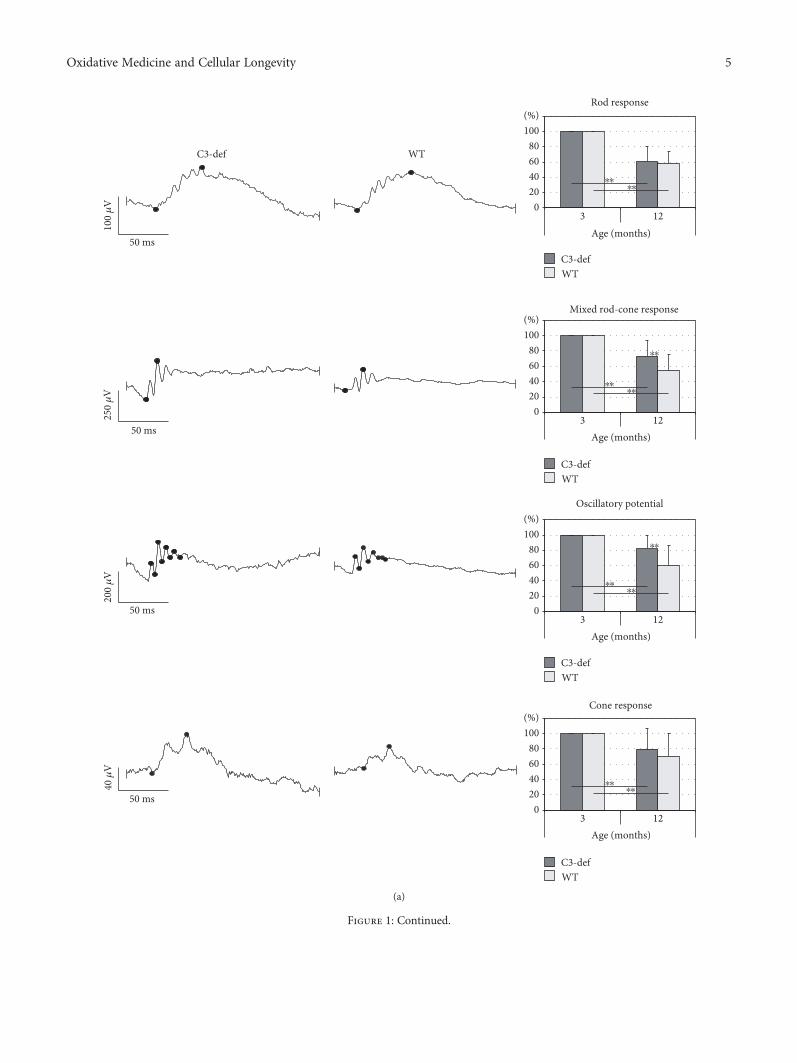
3.1. Functional and Morphological Evaluation of AgedRetinas from C3−/− and WT Mice. To assess whether com-plement component C3 deficiency influenced the physiolog-ical function of aged retinas, we examined the retinalbioelectrical response in 3- and 12-month-old C3-deficient(C3−/−) and control (wild type (WT)) mice. The results aresummarized in Figure 1(a). The ERG recordings, under bothscotopic and photopic conditions, in C3−/− and WT mice at12 months of age, were significantly lower (p < 0 01) thanthose observed in 3-month-old gender-matched animals.When comparing bioelectrical responses of the 12-month-old C3-deficient and WTmice, we found considerable differ-ences in b-wave amplitudes between the groups of animals.In C3−/− mice, the mixed rod-cone response was signifi-cantly higher (p < 0 01) compared with that of the age-matched controls (72.81± 21.13% versus 54.78± 20.11%,resp., in reference to b-wave amplitude measurements
4 Oxidative Medicine and Cellular Longevity
C3-def
100 �휇
V
50 ms
250 �휇
V20
0 �휇
V40
�휇V
50 ms
50 ms
50 ms
WT
Rod response
10080604020
03
⁎⁎⁎⁎
C3-defWT
12
Age (months)
(%)
(%)Mixed rod-cone response
10080604020
0
(%)Oscillatory potential
Cone response
10080604020
0
(%)100
80604020
0
C3-defWT
C3-defWT
C3-defWT
3 12Age (months)
3 12Age (months)
3 12Age (months)
⁎⁎⁎⁎
⁎⁎
⁎⁎⁎⁎
⁎⁎
⁎⁎⁎⁎
(a)
Figure 1: Continued.
5Oxidative Medicine and Cellular Longevity
C3-def
3 m
onth
s old
12 m
onth
s old
WT20 �휇m
20 �휇m 20 �휇m
20 �휇m
(b)
(%)
100
98
96
94
92
90
Changes in retinal thickness
3 12
Age (months)
⁎⁎
⁎⁎
⁎⁎
C3-defWT
(c)
20 �휇m 20 �휇m
C3-def WT
(d)
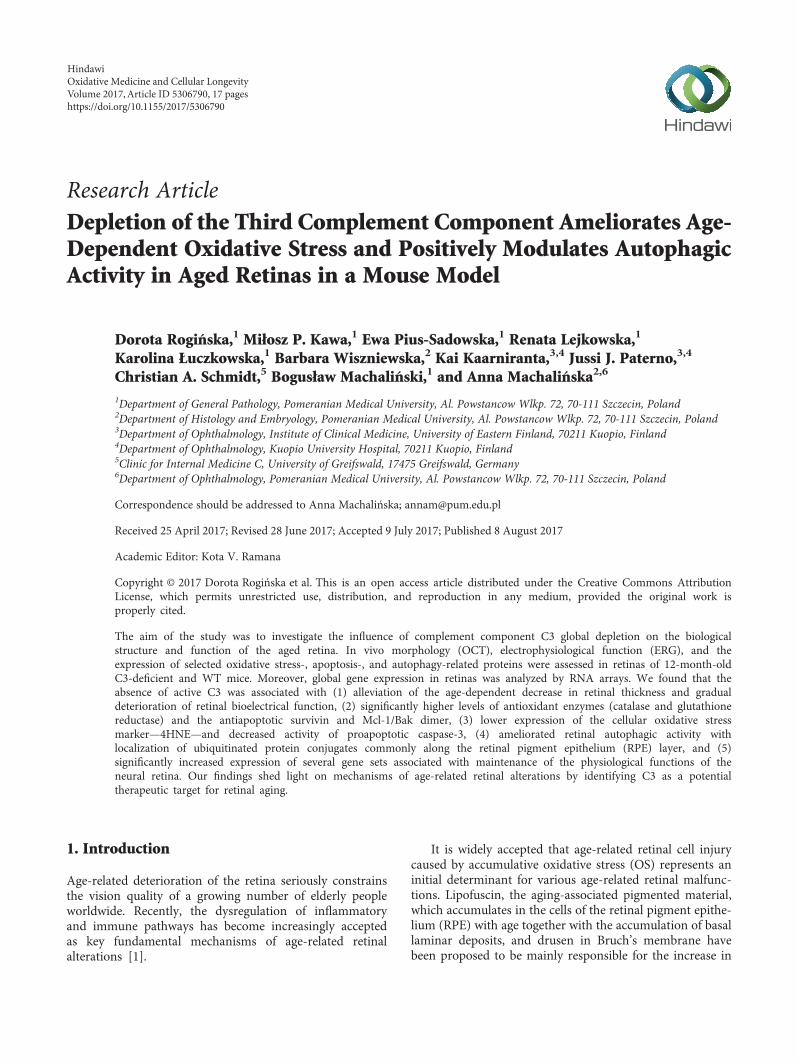
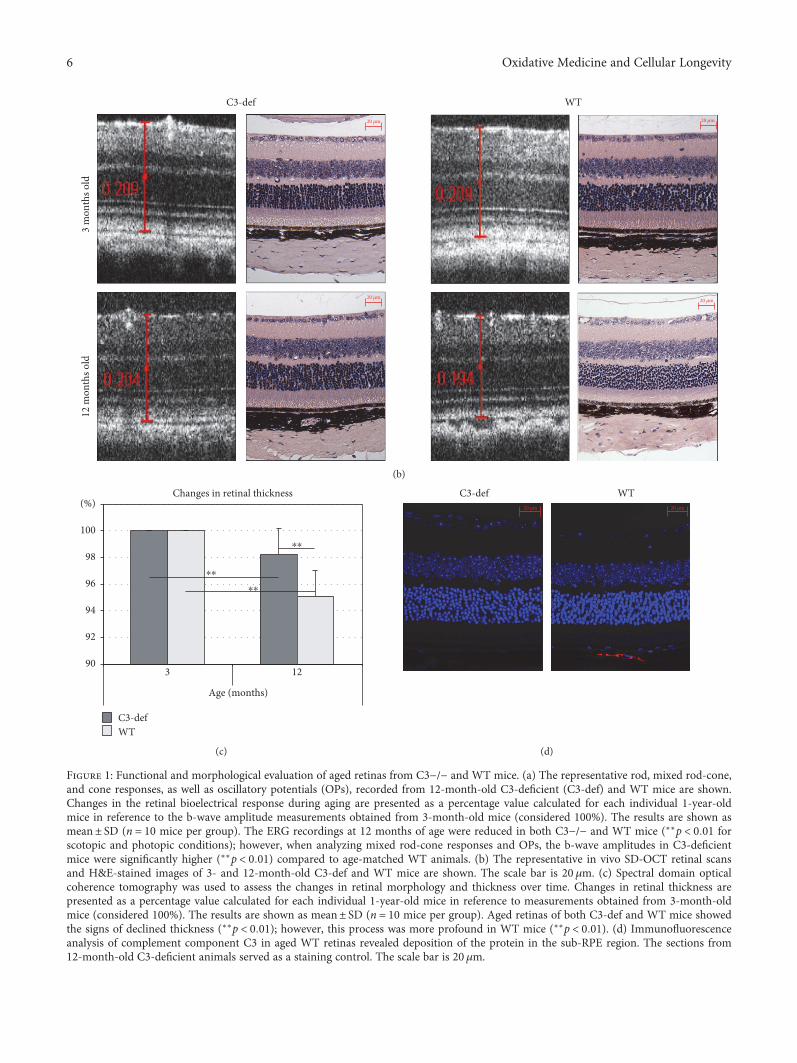
Figure 1: Functional and morphological evaluation of aged retinas from C3−/− and WT mice. (a) The representative rod, mixed rod-cone,and cone responses, as well as oscillatory potentials (OPs), recorded from 12-month-old C3-deficient (C3-def) and WT mice are shown.Changes in the retinal bioelectrical response during aging are presented as a percentage value calculated for each individual 1-year-oldmice in reference to the b-wave amplitude measurements obtained from 3-month-old mice (considered 100%). The results are shown asmean± SD (n = 10 mice per group). The ERG recordings at 12 months of age were reduced in both C3−/− and WT mice (∗∗p < 0 01 forscotopic and photopic conditions); however, when analyzing mixed rod-cone responses and OPs, the b-wave amplitudes in C3-deficientmice were significantly higher (∗∗p < 0 01) compared to age-matched WT animals. (b) The representative in vivo SD-OCT retinal scansand H&E-stained images of 3- and 12-month-old C3-def and WT mice are shown. The scale bar is 20 μm. (c) Spectral domain opticalcoherence tomography was used to assess the changes in retinal morphology and thickness over time. Changes in retinal thickness arepresented as a percentage value calculated for each individual 1-year-old mice in reference to measurements obtained from 3-month-oldmice (considered 100%). The results are shown as mean± SD (n = 10 mice per group). Aged retinas of both C3-def and WT mice showedthe signs of declined thickness (∗∗p < 0 01); however, this process was more profound in WT mice (∗∗p < 0 01). (d) Immunofluorescenceanalysis of complement component C3 in aged WT retinas revealed deposition of the protein in the sub-RPE region. The sections from12-month-old C3-deficient animals served as a staining control. The scale bar is 20μm.
6 Oxidative Medicine and Cellular Longevity
obtained from 3-month-old gender-matched mice, mean± SD, n = 10 mice per group). Similarly, the oscillatorypotentials, which are thought to reflect the bioactivity ini-tiated by amacrine cells in the inner retina, were consider-ably higher in C3−/− than in WT mice (81.54± 17.54%and 59.63± 26.04%, resp., p < 0 01). The differences ofrod- and cone-driven response between C3−/− and WTanimals at 12 months of age were not statistically signifi-cant. These results may suggest that C3 deficiency affectsthe function of photoreceptors.
Consequently, to evaluate age-related changes in retinalmorphology and thickness, we performed spectral domainoptical coherence tomography (SD-OCT) in 12-month-oldC3-deficient and WT mice. The results are summarized inFigures 1(b) and 1(c). In both C3−/− and WT mice, the ret-inas at 12 months of age were thinner than those in thesame mice at 3 months of age. When comparing the retinalthickness of the 12-month-old mice in both groups, theretinas of C3-deficient mice were found to be significantly(p < 0 01) thicker than those of the age-matched WT con-trols. These data provide evidence that the aged retinas ofboth C3−/− and WT mice exhibit age-related signs ofreduced thickness; however, this process was significantlyslower in C3-deficient mice.
To examine complement activation in aged WT mouseretinas, the immunofluorescence analysis of component C3was applied. The sections from 12-month-old C3-deficientanimals served as a staining control. We found depositionsof C3 protein in the sub-RPE region (Figure 1(d)). This resultsuggests that complement activation may play a role in theprocess of natural retinal aging.
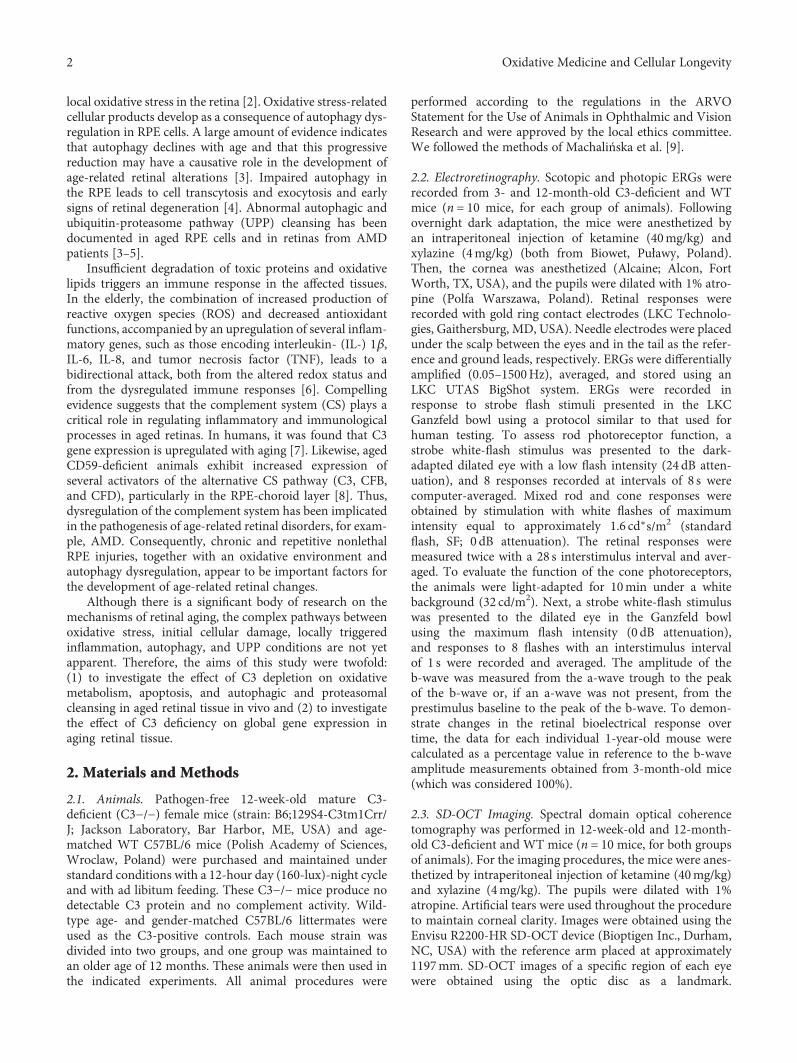
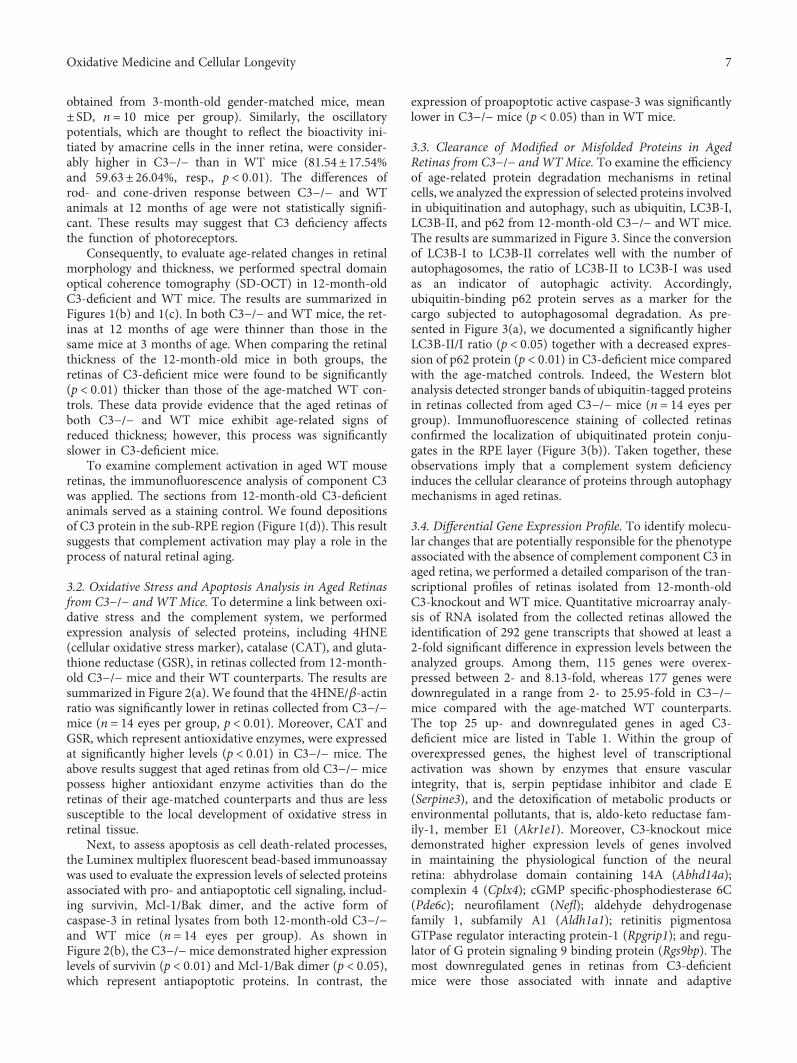
3.2. Oxidative Stress and Apoptosis Analysis in Aged Retinasfrom C3−/− and WT Mice. To determine a link between oxi-dative stress and the complement system, we performedexpression analysis of selected proteins, including 4HNE(cellular oxidative stress marker), catalase (CAT), and gluta-thione reductase (GSR), in retinas collected from 12-month-old C3−/− mice and their WT counterparts. The results aresummarized in Figure 2(a). We found that the 4HNE/β-actinratio was significantly lower in retinas collected from C3−/−mice (n = 14 eyes per group, p < 0 01). Moreover, CAT andGSR, which represent antioxidative enzymes, were expressedat significantly higher levels (p < 0 01) in C3−/− mice. Theabove results suggest that aged retinas from old C3−/− micepossess higher antioxidant enzyme activities than do theretinas of their age-matched counterparts and thus are lesssusceptible to the local development of oxidative stress inretinal tissue.
Next, to assess apoptosis as cell death-related processes,the Luminex multiplex fluorescent bead-based immunoassaywas used to evaluate the expression levels of selected proteinsassociated with pro- and antiapoptotic cell signaling, includ-ing survivin, Mcl-1/Bak dimer, and the active form ofcaspase-3 in retinal lysates from both 12-month-old C3−/−and WT mice (n = 14 eyes per group). As shown inFigure 2(b), the C3−/−mice demonstrated higher expressionlevels of survivin (p < 0 01) and Mcl-1/Bak dimer (p < 0 05),which represent antiapoptotic proteins. In contrast, the
expression of proapoptotic active caspase-3 was significantlylower in C3−/− mice (p < 0 05) than in WT mice.
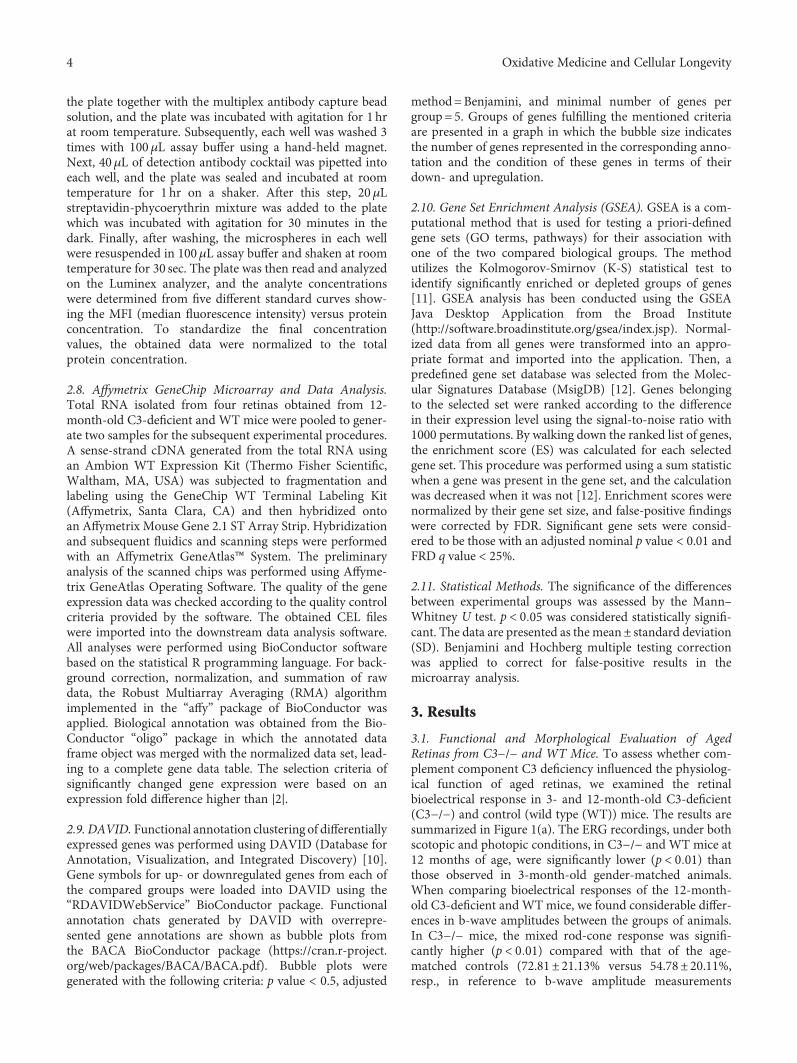
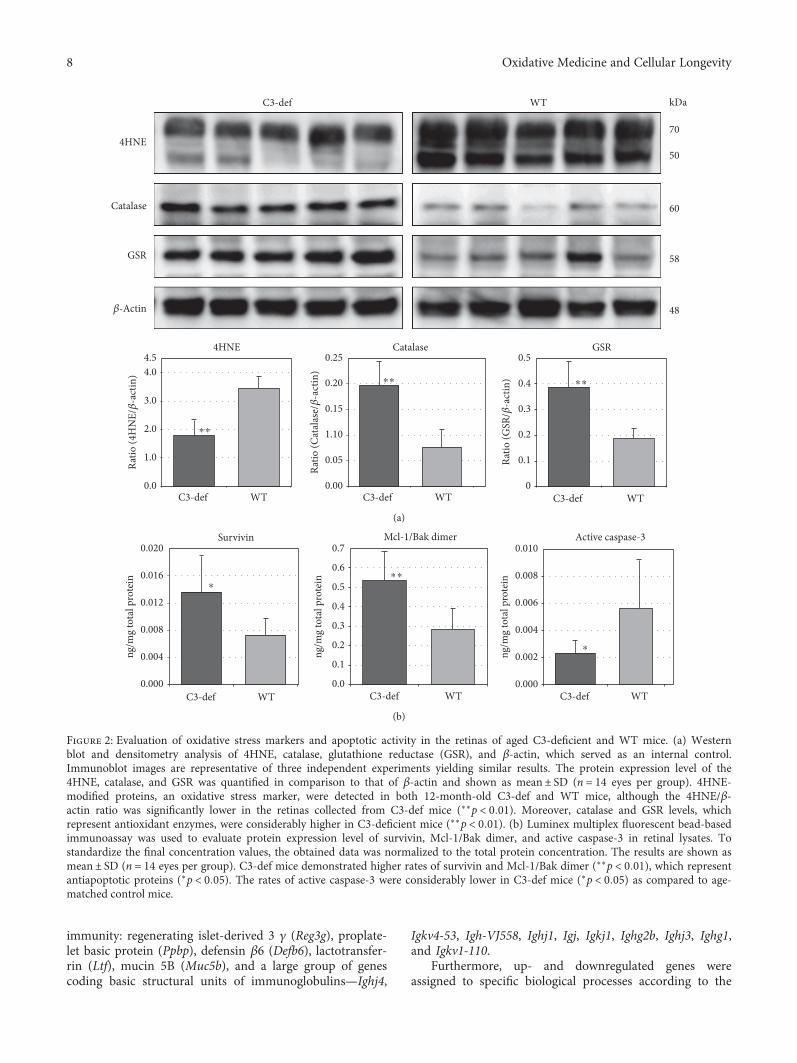
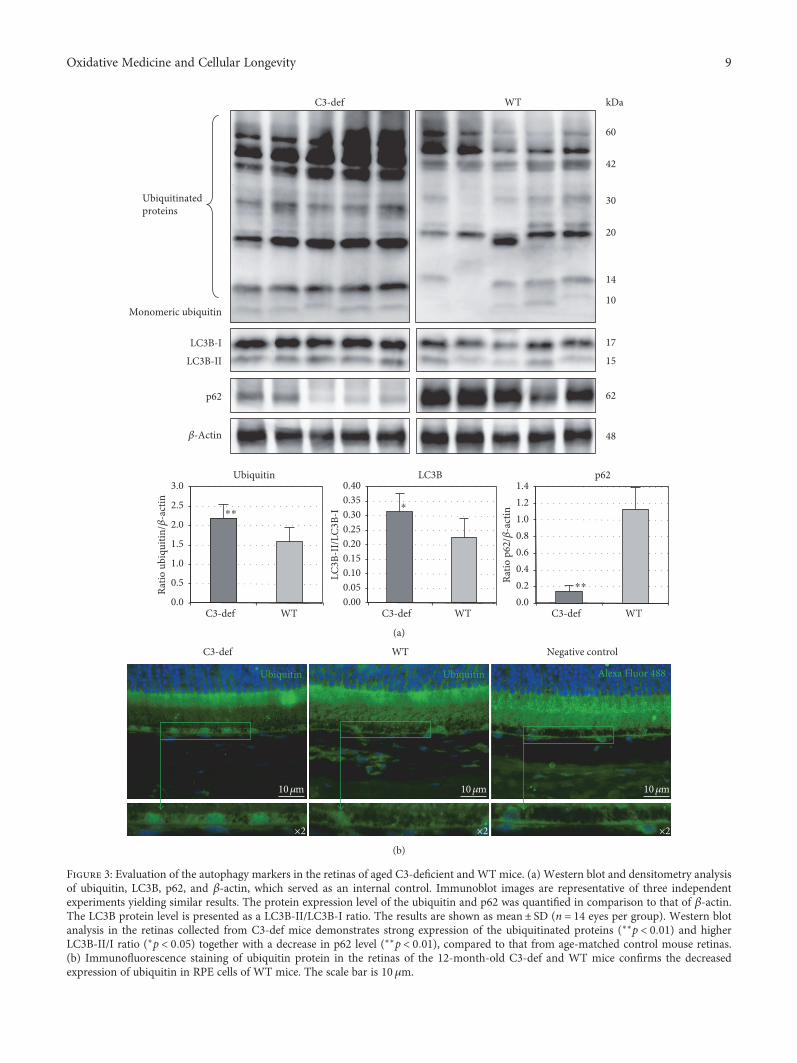
3.3. Clearance of Modified or Misfolded Proteins in AgedRetinas from C3−/− and WT Mice. To examine the efficiencyof age-related protein degradation mechanisms in retinalcells, we analyzed the expression of selected proteins involvedin ubiquitination and autophagy, such as ubiquitin, LC3B-I,LC3B-II, and p62 from 12-month-old C3−/− and WT mice.The results are summarized in Figure 3. Since the conversionof LC3B-I to LC3B-II correlates well with the number ofautophagosomes, the ratio of LC3B-II to LC3B-I was usedas an indicator of autophagic activity. Accordingly,ubiquitin-binding p62 protein serves as a marker for thecargo subjected to autophagosomal degradation. As pre-sented in Figure 3(a), we documented a significantly higherLC3B-II/I ratio (p < 0 05) together with a decreased expres-sion of p62 protein (p < 0 01) in C3-deficient mice comparedwith the age-matched controls. Indeed, the Western blotanalysis detected stronger bands of ubiquitin-tagged proteinsin retinas collected from aged C3−/− mice (n = 14 eyes pergroup). Immunofluorescence staining of collected retinasconfirmed the localization of ubiquitinated protein conju-gates in the RPE layer (Figure 3(b)). Taken together, theseobservations imply that a complement system deficiencyinduces the cellular clearance of proteins through autophagymechanisms in aged retinas.
3.4. Differential Gene Expression Profile. To identify molecu-lar changes that are potentially responsible for the phenotypeassociated with the absence of complement component C3 inaged retina, we performed a detailed comparison of the tran-scriptional profiles of retinas isolated from 12-month-oldC3-knockout and WT mice. Quantitative microarray analy-sis of RNA isolated from the collected retinas allowed theidentification of 292 gene transcripts that showed at least a2-fold significant difference in expression levels between theanalyzed groups. Among them, 115 genes were overex-pressed between 2- and 8.13-fold, whereas 177 genes weredownregulated in a range from 2- to 25.95-fold in C3−/−mice compared with the age-matched WT counterparts.The top 25 up- and downregulated genes in aged C3-deficient mice are listed in Table 1. Within the group ofoverexpressed genes, the highest level of transcriptionalactivation was shown by enzymes that ensure vascularintegrity, that is, serpin peptidase inhibitor and clade E(Serpine3), and the detoxification of metabolic products orenvironmental pollutants, that is, aldo-keto reductase fam-ily-1, member E1 (Akr1e1). Moreover, C3-knockout micedemonstrated higher expression levels of genes involvedin maintaining the physiological function of the neuralretina: abhydrolase domain containing 14A (Abhd14a);complexin 4 (Cplx4); cGMP specific-phosphodiesterase 6C(Pde6c); neurofilament (Nefl); aldehyde dehydrogenasefamily 1, subfamily A1 (Aldh1a1); retinitis pigmentosaGTPase regulator interacting protein-1 (Rpgrip1); and regu-lator of G protein signaling 9 binding protein (Rgs9bp). Themost downregulated genes in retinas from C3-deficientmice were those associated with innate and adaptive
7Oxidative Medicine and Cellular Longevity
immunity: regenerating islet-derived 3 γ (Reg3g), proplate-let basic protein (Ppbp), defensin β6 (Defb6), lactotransfer-rin (Ltf), mucin 5B (Muc5b), and a large group of genescoding basic structural units of immunoglobulins—Ighj4,
Igkv4-53, Igh-VJ558, Ighj1, Igj, Igkj1, Ighg2b, Ighj3, Ighg1,and Igkv1-110.
Furthermore, up- and downregulated genes wereassigned to specific biological processes according to the
C3-def
4HNE
Catalase
GSR
�훽-Actin
WT kDa
70
50
60
58
48
4HNE Catalase GSR4.5 0.25 0.5
0.4
0.3
0.2
0.1
0
0.20
0.15
1.10
0.05
0.00
4.0
3.0
Ratio
(4H
NE/�훽
-act
in)
Ratio
(Cat
alas
e/�훽
-act
in)
Ratio
(GSR
/�훽-a
ctin
)
2.0
1.0
0.0C3-def WT C3-def WT C3-def WT
⁎⁎
⁎⁎ ⁎⁎
(a)
Mcl-1/Bak dimer Active caspase-3Survivin0.020
0.016
0.012
0.008
0.004
0.000
0.010
0.008
0.006
0.004
0.002
0.000
0.7
0.6
0.5
0.4
0.3
0.2
0.1
0.0
ng/m
g to
tal p
rote
in
ng/m
g to
tal p
rote
in
ng/m
g to
tal p
rote
in
C3-def WT C3-def WT C3-def WT
⁎⁎⁎
⁎
(b)
Figure 2: Evaluation of oxidative stress markers and apoptotic activity in the retinas of aged C3-deficient and WT mice. (a) Westernblot and densitometry analysis of 4HNE, catalase, glutathione reductase (GSR), and β-actin, which served as an internal control.Immunoblot images are representative of three independent experiments yielding similar results. The protein expression level of the4HNE, catalase, and GSR was quantified in comparison to that of β-actin and shown as mean± SD (n = 14 eyes per group). 4HNE-modified proteins, an oxidative stress marker, were detected in both 12-month-old C3-def and WT mice, although the 4HNE/β-actin ratio was significantly lower in the retinas collected from C3-def mice (∗∗p < 0 01). Moreover, catalase and GSR levels, whichrepresent antioxidant enzymes, were considerably higher in C3-deficient mice (∗∗p < 0 01). (b) Luminex multiplex fluorescent bead-basedimmunoassay was used to evaluate protein expression level of survivin, Mcl-1/Bak dimer, and active caspase-3 in retinal lysates. Tostandardize the final concentration values, the obtained data was normalized to the total protein concentration. The results are shown asmean± SD (n = 14 eyes per group). C3-def mice demonstrated higher rates of survivin and Mcl-1/Bak dimer (∗∗p < 0 01), which representantiapoptotic proteins (∗p < 0 05). The rates of active caspase-3 were considerably lower in C3-def mice (∗p < 0 05) as compared to age-matched control mice.
8 Oxidative Medicine and Cellular Longevity
C3-def
Ubiquitinatedproteins
Monomeric ubiquitin
LC3B-I
LC3B-II
p62
Ubiquitin LC3B p62
C3-def WT C3-def WT C3-def WT
3.0
⁎⁎
0.40 1.41.21.00.80.60.40.20.0
0.350.300.250.20
LC3B
-II/
LC3B
-I
0.150.100.050.00
2.5
2.0
1.5
Ratio
ubi
quiti
n/�훽
-act
in
Ratio
p62
/�훽-a
ctin
1.0
0.5
0.0
�훽-Actin
WT kDa
60
42
30
20
14
10
17
15
62
48
⁎
⁎⁎
(a)
Ubiquitin Ubiquitin Alexa Fluor 488
C3-def WT
×2
Negative control
×2 ×2
10�휇m 10�휇m 10�휇m
(b)
Figure 3: Evaluation of the autophagy markers in the retinas of aged C3-deficient and WT mice. (a) Western blot and densitometry analysisof ubiquitin, LC3B, p62, and β-actin, which served as an internal control. Immunoblot images are representative of three independentexperiments yielding similar results. The protein expression level of the ubiquitin and p62 was quantified in comparison to that of β-actin.The LC3B protein level is presented as a LC3B-II/LC3B-I ratio. The results are shown as mean± SD (n = 14 eyes per group). Western blotanalysis in the retinas collected from C3-def mice demonstrates strong expression of the ubiquitinated proteins (∗∗p < 0 01) and higherLC3B-II/I ratio (∗p < 0 05) together with a decrease in p62 level (∗∗p < 0 01), compared to that from age-matched control mouse retinas.(b) Immunofluorescence staining of ubiquitin protein in the retinas of the 12-month-old C3-def and WT mice confirms the decreasedexpression of ubiquitin in RPE cells of WT mice. The scale bar is 10μm.
9Oxidative Medicine and Cellular Longevity

Table 1: List of top 25 up- and downregulated genes in 12-month-old C3-deficient mice. Genes are ranked according to the expression folddifference—the gene from the top of the list is the most upregulated and the gene from the bottom of the list is the most downregulated inC3-deficient mice compared to control animals.
Direction in C3-def Gene symbol Gene name Probe ID Entrez Gene ID Fold change
Up Serpine3Serpin peptidase inhibitor, clade E (nexin, plasminogen
inhibitor)17301155 319433 8.13
Up Akr1e1 Aldo-keto reductase family 1, member E1 17290301 56043 4.41
Up EdvEndogenous sequence related to the Duplan murine
retrovirus17548311 13623 4.28
Up Rpl29 Ribosomal protein 29 17521204 19944 4.23
Up Abhd14a Abhydrolase domain containing 14A 17530686 68644 4.02
Up GatcGlutamyl-tRNA (Gln) amidotransferase, subunit
C homolog17451721 384281 3.70
Up Cplx4 Complexin 4 17355086 225644 3.33
Up Uprt Uracil phosphoribosylotransferase (FUR1) homolog 17537003 331487 3.07
Up H2-T22 Histocompatibility 2, T region locus 22 17344593 15039 3.02
Up Mzt1 Mitotic spindle organizing protein 1 17309065 76789 3.01
Up Mpc1 Mitochondrial pyruvate carrier 1 17284037 55951 2.81
Up Adam4 A disintegrin and metallopeptidase domain 4 17282343 11498 2.78
Up Rab6b RAB6B, member RAS oncogene family 17520922 270192 2.75
Up Pcdhb18 Protocadherin beta 18 17349930 93889 2.67
Up Cdh12 Cadherin 12 17310550 215654 2.65
Up Fabp4 Fatty acid-binding protein 4, adipocyte 17404091 11770 2.59
Up Pde6c Phosphodiesterase 6C, cGMP specific, cone, alpha prime 17359118 110855 2.59
Up Fam213a Family with sequence similarity 213, member A 17305221 70564 2.59
Up Nefl Neurofilament, light peptide 17301582 18039 2.57
Up Akap6 A kinase (PRKA) anchor protein 6 17275436 238161 2.57
Up Aldh1a1 Aldehyde dehydrogenase family 1, subfamily A1 17358103 11668 2.55
Up Hdac1 Histone deacytelase 1 17430397 433759 2.55
Up Rpgrip1 Retinitis pigmentosa Gtpase regulator-interacting protein 1 17299715 77945 2.54
Up Rgs9bp Regulator of G protein signaling 9 binding protein 17489809 243923 2.50
Down Il1f9 Interleukin 1 family, member 9 17367652 215257 −5.53Down Igkv1-110 Immunoglobulin kappa variable 1-110 17459338 381777 −5.64Down Muc5b Mucin 5, subtype B, tracheobronchial 17485098 74180 −6.06Down Krt10 Keratin 10 17269064 16661 −6.11Down Krtdap Keratinocyte differentiation-associated protein 17476557 64661 −6.39Down Sprr2f Small proline-rich protein 2F 17399876 20760 −6.46Down Ighg1 Immunoglobulin heavy constant gamma 1 (G1m marker) 17284339 16017 −6.48Down Ighj3 Immunoglobulin heavy joining 3 17284356 777655 −7.50Down Ighg2b Immunoglobulin heavy constant gamma 2B 17284334 16016 −7.73Down Igkj1 Immunoglobulin kappa joining 1 17459415 110759 −8.18Down Defb6 Defensin beta 6 17499602 116746 −8.34Down Igj Immunoglobulin joining chain 17449447 16069 −8.53Down Cryba4 Crystalline, beta A4 17451195 12959 −8.55Down Ltf Lactotransferrin 17522555 17002 −8.70Down Cnfn Cornifelin 17487919 72383 −8.97Down Ighj1 Immunoglobulin heavy joining 1 17284360 777648 −10.53Down Klk13 Kallikrein-related peptidase 13 17477191 626834 −10.71Down Lgsn Lengsin, lens protein with glutamate synthetase domain 17211533 266744 −11.56Down Lce1c Late cornified envelope 1C 17399899 73719 −12.31Down Igh-VJ558 Immunoglobulin heavy chain (J558 family) 17284314 16061 −13.62
10 Oxidative Medicine and Cellular Longevity
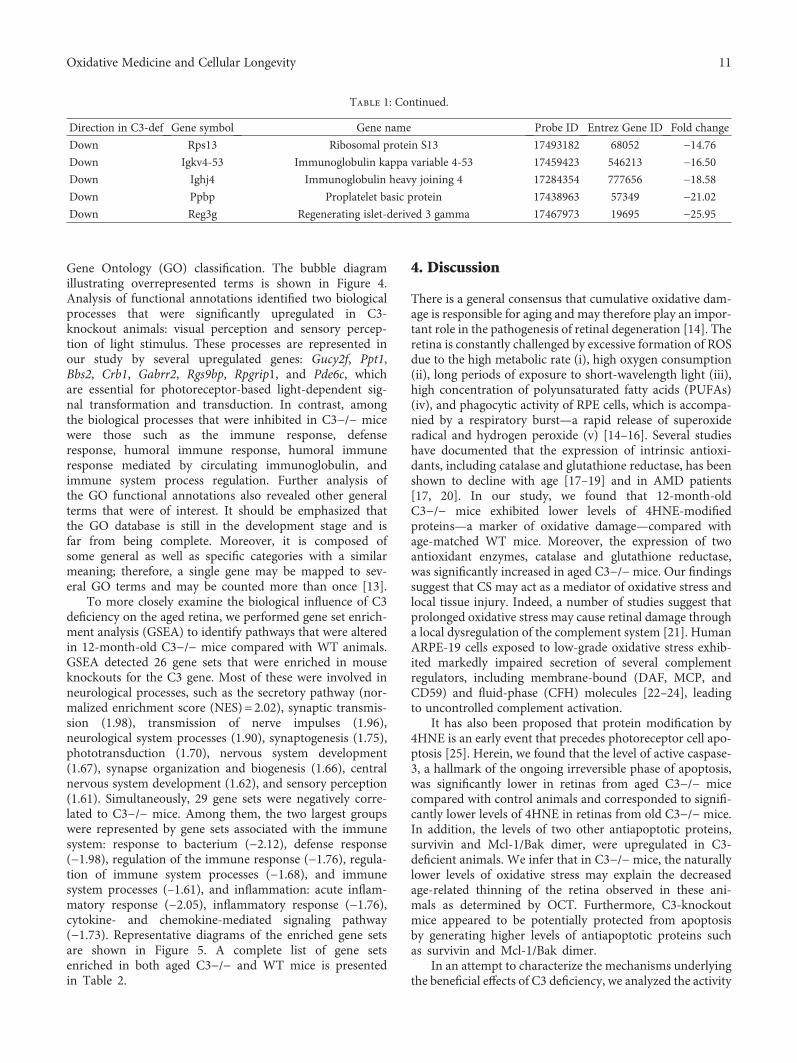
Gene Ontology (GO) classification. The bubble diagramillustrating overrepresented terms is shown in Figure 4.Analysis of functional annotations identified two biologicalprocesses that were significantly upregulated in C3-knockout animals: visual perception and sensory percep-tion of light stimulus. These processes are represented inour study by several upregulated genes: Gucy2f, Ppt1,Bbs2, Crb1, Gabrr2, Rgs9bp, Rpgrip1, and Pde6c, whichare essential for photoreceptor-based light-dependent sig-nal transformation and transduction. In contrast, amongthe biological processes that were inhibited in C3−/− micewere those such as the immune response, defenseresponse, humoral immune response, humoral immuneresponse mediated by circulating immunoglobulin, andimmune system process regulation. Further analysis ofthe GO functional annotations also revealed other generalterms that were of interest. It should be emphasized thatthe GO database is still in the development stage and isfar from being complete. Moreover, it is composed ofsome general as well as specific categories with a similarmeaning; therefore, a single gene may be mapped to sev-eral GO terms and may be counted more than once [13].
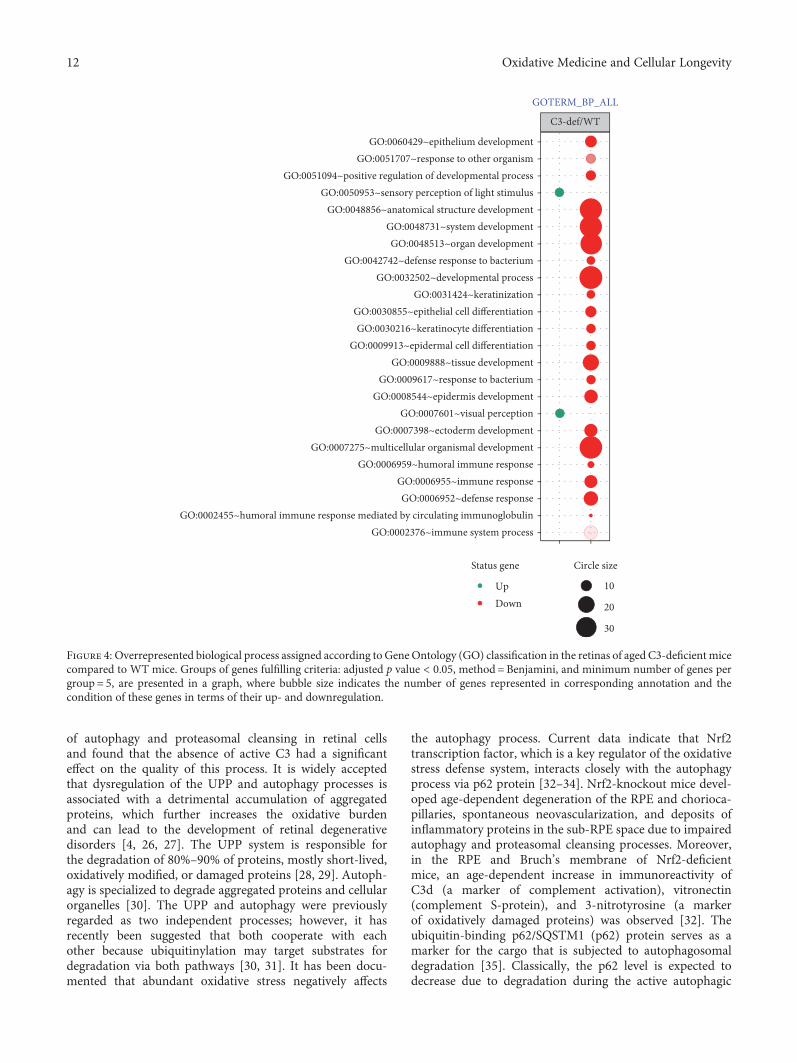
To more closely examine the biological influence of C3deficiency on the aged retina, we performed gene set enrich-ment analysis (GSEA) to identify pathways that were alteredin 12-month-old C3−/− mice compared with WT animals.GSEA detected 26 gene sets that were enriched in mouseknockouts for the C3 gene. Most of these were involved inneurological processes, such as the secretory pathway (nor-malized enrichment score (NES) = 2.02), synaptic transmis-sion (1.98), transmission of nerve impulses (1.96),neurological system processes (1.90), synaptogenesis (1.75),phototransduction (1.70), nervous system development(1.67), synapse organization and biogenesis (1.66), centralnervous system development (1.62), and sensory perception(1.61). Simultaneously, 29 gene sets were negatively corre-lated to C3−/− mice. Among them, the two largest groupswere represented by gene sets associated with the immunesystem: response to bacterium (−2.12), defense response(−1.98), regulation of the immune response (−1.76), regula-tion of immune system processes (−1.68), and immunesystem processes (–1.61), and inflammation: acute inflam-matory response (−2.05), inflammatory response (−1.76),cytokine- and chemokine-mediated signaling pathway(−1.73). Representative diagrams of the enriched gene setsare shown in Figure 5. A complete list of gene setsenriched in both aged C3−/− and WT mice is presentedin Table 2.
4. Discussion
There is a general consensus that cumulative oxidative dam-age is responsible for aging and may therefore play an impor-tant role in the pathogenesis of retinal degeneration [14]. Theretina is constantly challenged by excessive formation of ROSdue to the high metabolic rate (i), high oxygen consumption(ii), long periods of exposure to short-wavelength light (iii),high concentration of polyunsaturated fatty acids (PUFAs)(iv), and phagocytic activity of RPE cells, which is accompa-nied by a respiratory burst—a rapid release of superoxideradical and hydrogen peroxide (v) [14–16]. Several studieshave documented that the expression of intrinsic antioxi-dants, including catalase and glutathione reductase, has beenshown to decline with age [17–19] and in AMD patients[17, 20]. In our study, we found that 12-month-oldC3−/− mice exhibited lower levels of 4HNE-modifiedproteins—a marker of oxidative damage—compared withage-matched WT mice. Moreover, the expression of twoantioxidant enzymes, catalase and glutathione reductase,was significantly increased in aged C3−/−mice. Our findingssuggest that CS may act as a mediator of oxidative stress andlocal tissue injury. Indeed, a number of studies suggest thatprolonged oxidative stress may cause retinal damage througha local dysregulation of the complement system [21]. HumanARPE-19 cells exposed to low-grade oxidative stress exhib-ited markedly impaired secretion of several complementregulators, including membrane-bound (DAF, MCP, andCD59) and fluid-phase (CFH) molecules [22–24], leadingto uncontrolled complement activation.
It has also been proposed that protein modification by4HNE is an early event that precedes photoreceptor cell apo-ptosis [25]. Herein, we found that the level of active caspase-3, a hallmark of the ongoing irreversible phase of apoptosis,was significantly lower in retinas from aged C3−/− micecompared with control animals and corresponded to signifi-cantly lower levels of 4HNE in retinas from old C3−/− mice.In addition, the levels of two other antiapoptotic proteins,survivin and Mcl-1/Bak dimer, were upregulated in C3-deficient animals. We infer that in C3−/−mice, the naturallylower levels of oxidative stress may explain the decreasedage-related thinning of the retina observed in these ani-mals as determined by OCT. Furthermore, C3-knockoutmice appeared to be potentially protected from apoptosisby generating higher levels of antiapoptotic proteins suchas survivin and Mcl-1/Bak dimer.
In an attempt to characterize the mechanisms underlyingthe beneficial effects of C3 deficiency, we analyzed the activity
Table 1: Continued.
Direction in C3-def Gene symbol Gene name Probe ID Entrez Gene ID Fold change
Down Rps13 Ribosomal protein S13 17493182 68052 −14.76Down Igkv4-53 Immunoglobulin kappa variable 4-53 17459423 546213 −16.50Down Ighj4 Immunoglobulin heavy joining 4 17284354 777656 −18.58Down Ppbp Proplatelet basic protein 17438963 57349 −21.02Down Reg3g Regenerating islet-derived 3 gamma 17467973 19695 −25.95
11Oxidative Medicine and Cellular Longevity
of autophagy and proteasomal cleansing in retinal cellsand found that the absence of active C3 had a significanteffect on the quality of this process. It is widely acceptedthat dysregulation of the UPP and autophagy processes isassociated with a detrimental accumulation of aggregatedproteins, which further increases the oxidative burdenand can lead to the development of retinal degenerativedisorders [4, 26, 27]. The UPP system is responsible forthe degradation of 80%–90% of proteins, mostly short-lived,oxidatively modified, or damaged proteins [28, 29]. Autoph-agy is specialized to degrade aggregated proteins and cellularorganelles [30]. The UPP and autophagy were previouslyregarded as two independent processes; however, it hasrecently been suggested that both cooperate with eachother because ubiquitinylation may target substrates fordegradation via both pathways [30, 31]. It has been docu-mented that abundant oxidative stress negatively affects
the autophagy process. Current data indicate that Nrf2transcription factor, which is a key regulator of the oxidativestress defense system, interacts closely with the autophagyprocess via p62 protein [32–34]. Nrf2-knockout mice devel-oped age-dependent degeneration of the RPE and chorioca-pillaries, spontaneous neovascularization, and deposits ofinflammatory proteins in the sub-RPE space due to impairedautophagy and proteasomal cleansing processes. Moreover,in the RPE and Bruch’s membrane of Nrf2-deficientmice, an age-dependent increase in immunoreactivity ofC3d (a marker of complement activation), vitronectin(complement S-protein), and 3-nitrotyrosine (a markerof oxidatively damaged proteins) was observed [32]. Theubiquitin-binding p62/SQSTM1 (p62) protein serves as amarker for the cargo that is subjected to autophagosomaldegradation [35]. Classically, the p62 level is expected todecrease due to degradation during the active autophagic
C3-def/WT
GO:0002376~immune system processGO:0002455~humoral immune response mediated by circulating immunoglobulin
GO:0006952~defense responseGO:0006955~immune response
GO:0006959~humoral immune responseGO:0007275~multicellular organismal development
GO:0007398~ectoderm developmentGO:0007601~visual perception
GO:0008544~epidermis developmentGO:0009617~response to bacterium
GO:0009888~tissue developmentGO:0009913~epidermal cell differentiation
GO:0030216~keratinocyte differentiationGO:0030855~epithelial cell differentiation
GO:0031424~keratinizationGO:0032502~developmental process
GO:0042742~defense response to bacteriumGO:0048513~organ development
GO:0048731~system developmentGO:0048856~anatomical structure development
GO:0050953~sensory perception of light stimulusGO:0051094~positive regulation of developmental process
GO:0051707~response to other organismGO:0060429~epithelium development
Status gene
UpDown
Circle size
10
20
30
GOTERM_BP_ALL
Figure 4: Overrepresented biological process assigned according to GeneOntology (GO) classification in the retinas of aged C3-deficient micecompared to WT mice. Groups of genes fulfilling criteria: adjusted p value < 0.05, method =Benjamini, and minimum number of genes pergroup = 5, are presented in a graph, where bubble size indicates the number of genes represented in corresponding annotation and thecondition of these genes in terms of their up- and downregulation.
12 Oxidative Medicine and Cellular Longevity
process, and the increased expression of p62 indicatesimpaired autophagosomal degradation [36]. Indeed, retinasamples from AMD patients showed an accumulation ofp62 [37]. Another protein that is crucial for autophagy,LC3B-I, is found in preautophagosomal structures andconverted to the LC3B-II form during the autophagosomematuration process. Finally, the mature autophagosomesare degraded by lysosomal hydrolytic enzymes [38]. Ourgroup demonstrated a reduced expression of p62 and anelevated expression of the LC3B-II/LC3B-I ratio in retinasfrom aged C3−/− compared with WT mice. This resultmay indicate the good quality of the ongoing process ofautophagosome formation in C3−/− mice and the suc-cessful packaging of waste material for autophagic degra-dation. The use of anti-ubiquitin antibody to monitor thelocalization of ubiquitin-positive cells further confirmedthe Western blotting results. The ubiquitinated proteinaggregate signal was higher in aged C3−/− retinal samplesthan in the WT controls and was mainly localized in theRPE layer. This finding reveals that C3 deficiencyincreases the amount of aggregate-prone proteins thatundergo autophagy cleansing. Overall, our results indicatethat CS suppression might facilitate the intracellularautophagic flux, as evidenced by the low levels of p62together with high LC3B-II in the aged retinas.
Our findings support the notion that the ameliorativeeffects of C3 deficiency result from the compensatory abilityto modulate the expression of several genes and proteins,which are components of signal transduction pathways thatare important for retinal cell survival and function. Likewise,we were able to detect profound changes in the global geneexpression profile using a comprehensive RNA microarray.Within the group of overexpressed genes in aged C3−/− ani-mals, the highest levels of transcriptional activation wereshown by Serpine3 (8.13-fold), Akr1e1 (4.41-fold), Cplx4(3.33-fold), Pde6c (2.59-fold), Rpgrip (2.54-fold), and Rgs9bp(2.50-fold). The Serpine3 gene encodes an extracellular
protein that belongs to the protease inhibitor family withactivity toward thrombin, trypsin, and urokinase. It pro-motes neurite extension by inhibiting thrombin, and it pos-sesses antiangiogenic properties [39]. Akr1e1 is a memberof the aldo-keto reductase family, which has cytoprotectiveeffects against oxidative stress [40, 41]. Complexin 4 (Cplx4)is expressed mainly in photoreceptor and bipolar cell synap-ses [42]. Members of this protein family are responsible forthe regulation of vesicle fusion and transmitter release, thusacting as a mediator of visual signal transmission [43]. Pde6cand Rgs9bp are both associated with normal phototransduc-tion processes in cones and rods, respectively [44]. Retinitispigmentosa-GTPase regulator-interacting protein (Rpgrip)has an important role in photoreceptor connecting cilia,helping to maintain correct photoreceptor function [45].Based on the Gene Ontology classification of the biologicalprocesses, we identified two pathways that were significantlyupregulated in aged C3-knockout mice: visual perceptionand sensory perception of light stimulus. Moreover, in addi-tion to the results obtained using the GO database, GSEAdetected 26 gene sets that were enriched in mice lackingthe C3 gene, some of which were involved in neurologicalprocesses such as the secretory pathway, synaptic transmis-sion, transmission of nerve impulses, neurological systemprocesses, synaptogenesis, phototransduction, nervous sys-tem development, synapse organization and biogenesis, cen-tral nervous system development, and sensory perception.Of note, complement C3 naturally mediates immune-related activities, but it also facilitates other processes suchas synapse elimination in the developing visual system ofyoung mice [46]. However, in the aged brain, C3 contributesto region-specific synapse and neuron loss [47].
Furthermore, since component C3 plays a potent role inthe host defense system, the most downregulated genes inaged C3-deficient mice were those associated with innateand adaptive immunity. These results are consistent withprevious reports that C3-deficient subjects are more
0.500.55
0.450.400.350.300.250.20
0.100.050.00
0.15
Enric
hmen
t sco
re (E
S)
Enrichment plot: secretory pathway Enrichment plot: phototransduction Enrichment plot: neurological system process
C3-def
C3-def
WT
WT C3-def
0.00.10.20.30.40.50.6
Enric
hmen
t sco
re (E
S)
Enric
hmen
t sco
re (E
S)
WT WTC3-def
0.400.350.300.250.200.150.10
0.000.05
‒0.05
C3-def WT C3-def WT
0.00
Enric
hmen
t sco
re (E
S)
Enrichment plot:
‒0.1‒0.2
‒0.4
‒0.6‒0.7
‒0.5
‒0.3
morphogenesis of an epithelium
Enric
hmen
t sco
re (E
S)
Enrichment plot: immune response
‒0.05‒0.10‒0.15‒0.20‒0.25‒0.30‒0.35‒0.40
Enric
hmen
t sco
re (E
S)
Enrichment plot: inflammatory response
‒0.40
0.00‒0.05‒0.10‒0.15‒0.20‒0.25‒0.30‒0.35
0.05
Figure 5: Gene set enrichment analysis (GSEA) of the retinas from aged C3-deficient mice compared to WT mice. Diagrams representselected gene sets enriched in C3-deficient mice (secretory pathway, phototransduction, and neurological system process) and WT controlanimals (morphogenesis of an epithelium, immune response, and inflammatory response).
13Oxidative Medicine and Cellular Longevity
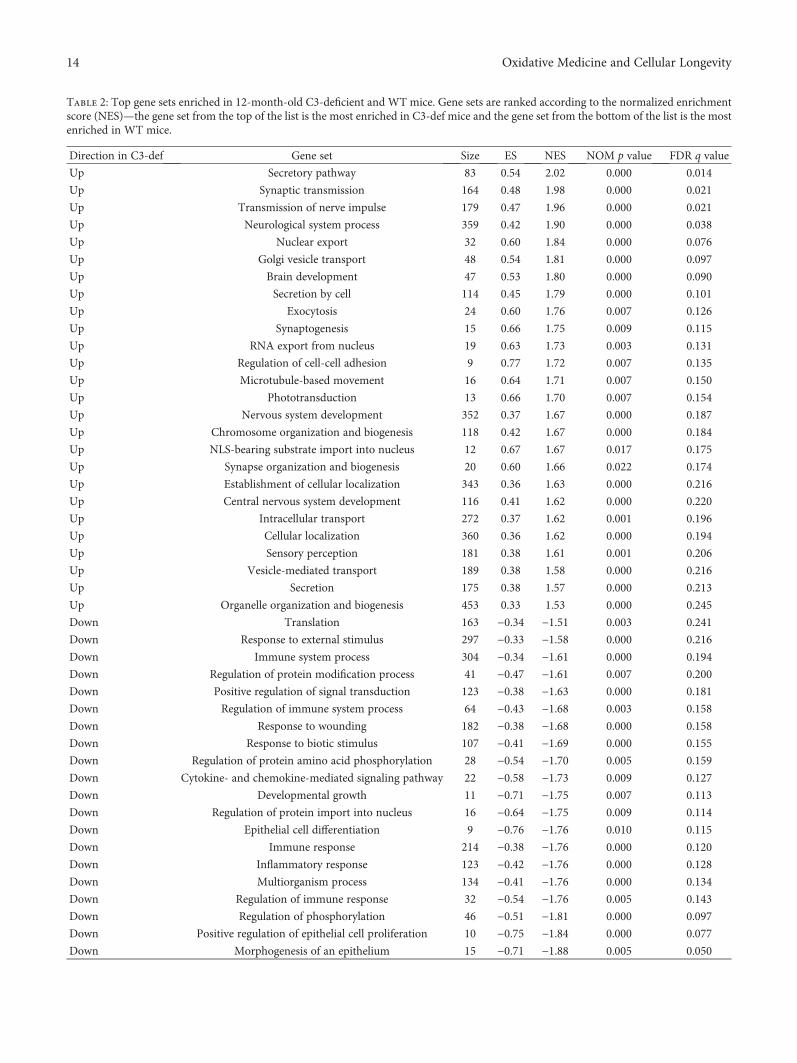
Table 2: Top gene sets enriched in 12-month-old C3-deficient and WT mice. Gene sets are ranked according to the normalized enrichmentscore (NES)—the gene set from the top of the list is the most enriched in C3-def mice and the gene set from the bottom of the list is the mostenriched in WT mice.
Direction in C3-def Gene set Size ES NES NOM p value FDR q value
Up Secretory pathway 83 0.54 2.02 0.000 0.014
Up Synaptic transmission 164 0.48 1.98 0.000 0.021
Up Transmission of nerve impulse 179 0.47 1.96 0.000 0.021
Up Neurological system process 359 0.42 1.90 0.000 0.038
Up Nuclear export 32 0.60 1.84 0.000 0.076
Up Golgi vesicle transport 48 0.54 1.81 0.000 0.097
Up Brain development 47 0.53 1.80 0.000 0.090
Up Secretion by cell 114 0.45 1.79 0.000 0.101
Up Exocytosis 24 0.60 1.76 0.007 0.126
Up Synaptogenesis 15 0.66 1.75 0.009 0.115
Up RNA export from nucleus 19 0.63 1.73 0.003 0.131
Up Regulation of cell-cell adhesion 9 0.77 1.72 0.007 0.135
Up Microtubule-based movement 16 0.64 1.71 0.007 0.150
Up Phototransduction 13 0.66 1.70 0.007 0.154
Up Nervous system development 352 0.37 1.67 0.000 0.187
Up Chromosome organization and biogenesis 118 0.42 1.67 0.000 0.184
Up NLS-bearing substrate import into nucleus 12 0.67 1.67 0.017 0.175
Up Synapse organization and biogenesis 20 0.60 1.66 0.022 0.174
Up Establishment of cellular localization 343 0.36 1.63 0.000 0.216
Up Central nervous system development 116 0.41 1.62 0.000 0.220
Up Intracellular transport 272 0.37 1.62 0.001 0.196
Up Cellular localization 360 0.36 1.62 0.000 0.194
Up Sensory perception 181 0.38 1.61 0.001 0.206
Up Vesicle-mediated transport 189 0.38 1.58 0.000 0.216
Up Secretion 175 0.38 1.57 0.000 0.213
Up Organelle organization and biogenesis 453 0.33 1.53 0.000 0.245
Down Translation 163 −0.34 −1.51 0.003 0.241
Down Response to external stimulus 297 −0.33 −1.58 0.000 0.216
Down Immune system process 304 −0.34 −1.61 0.000 0.194
Down Regulation of protein modification process 41 −0.47 −1.61 0.007 0.200
Down Positive regulation of signal transduction 123 −0.38 −1.63 0.000 0.181
Down Regulation of immune system process 64 −0.43 −1.68 0.003 0.158
Down Response to wounding 182 −0.38 −1.68 0.000 0.158
Down Response to biotic stimulus 107 −0.41 −1.69 0.000 0.155
Down Regulation of protein amino acid phosphorylation 28 −0.54 −1.70 0.005 0.159
Down Cytokine- and chemokine-mediated signaling pathway 22 −0.58 −1.73 0.009 0.127
Down Developmental growth 11 −0.71 −1.75 0.007 0.113
Down Regulation of protein import into nucleus 16 −0.64 −1.75 0.009 0.114
Down Epithelial cell differentiation 9 −0.76 −1.76 0.010 0.115
Down Immune response 214 −0.38 −1.76 0.000 0.120
Down Inflammatory response 123 −0.42 −1.76 0.000 0.128
Down Multiorganism process 134 −0.41 −1.76 0.000 0.134
Down Regulation of immune response 32 −0.54 −1.76 0.005 0.143
Down Regulation of phosphorylation 46 −0.51 −1.81 0.000 0.097
Down Positive regulation of epithelial cell proliferation 10 −0.75 −1.84 0.000 0.077
Down Morphogenesis of an epithelium 15 −0.71 −1.88 0.005 0.050
14 Oxidative Medicine and Cellular Longevity
susceptible to microbial infections [48]. According to the GOclassification, biological processes that were mostly inhibitedin aged C3−/−mice included the humoral immune response,immune response, defense response, humoral immuneresponse mediated by circulating immunoglobulin, andimmune system process. Simultaneously, GSEA allowed usto identify 29 gene sets that were negatively correlated to agedC3-deficient mice. Among them, the largest two groups arerepresented by gene sets associated with inflammation: acuteinflammatory response, inflammatory response, cytokine-and chemokine-mediated signaling pathway, and theimmune system: response to bacterium, defense response,regulation of immune response, regulation of immune sys-tem process, and immune system process. Importantly,annotations involved in epithelial development and epithelialcell differentiation were significantly upregulated in WTmice, probably due to active mechanisms for countering thenegative effects of oxidative stress on the RPE cells.
5. Conclusions
In summary, our study was designed to investigate the influ-ence of complement component C3 global depletion on thebiological structure and function of the aged retina. Agingis a significant risk factor for retinal degenerative diseases,and our collective data implicate C3 as potentially playing arole in the process of retinal degeneration. Importantly, theabsence of active C3 resulted in decreased proapoptoticcaspase-3 activity; elevated levels of antioxidant enzymes(catalase and glutathione reductase), autophagy-related ubiq-uitin, and cytosolic fraction of LC3B-II; and increasedexpression of several gene sets associated with maintainingphysiological functions of the neural retina. All these changespotentially suggest that C3 inhibition may be protectiveagainst retinal degeneration. Our findings shed light onmechanisms of age-related retinal alterations identifying C3as a potential therapeutic target for retinal aging. In particu-lar, targeting the complement system may be promising forfuture therapeutic strategies in AMD disorders. Nevertheless,our observations were obtained in a model of systemic genet-ically depleted C3 in the whole organism and not selectivelyin ocular tissues. Therefore, further investigations shouldfocus on targeted inhibition of C3 in the retina in various
disease models to better understand the biological effectsof C3 deficiency.
Conflicts of Interest
The authors declare that there is no conflict of interestregarding the publication of this article.
Acknowledgments
The authors are grateful to Mrs. Anne Seppänen for herexpert technical assistance. This work was supported by theNational Science Center Grant no. 2012/06/M/NZ4/00133(to Bogusław Machaliński).
References
[1] M.Chen andH.Xu, “Parainflammation, chronic inflammation,and age-related macular degeneration,” Journal of LeukocyteBiology, vol. 98, no. 5, pp. 713–725, 2015.
[2] I. Bhutto and G. Lutty, “Understanding age-related maculardegeneration (AMD): relationships between the photorecep-tor/retinal pigment epithelium/Bruch’s membrane/chorioca-pillaris complex,” Molecular Aspects of Medicine, vol. 33,no. 4, pp. 295–317, 2012.
[3] K. Kaarniranta, P. Tokarz, A. Koskela, J. Paterno, and J. Blasiak,“Autophagy regulates death of retinal pigment epithelium cellsin age-related macular degeneration,” Cell Biology and Toxicol-ogy, vol. 33, no. 2, pp. 113–128, 2017.
[4] K. Kaarniranta, D. Sinha, J. Blasiak et al., “Autophagy andheterophagy dysregulation leads to retinal pigment epithe-lium dysfunction and development of age-related maculardegeneration,” Autophagy, vol. 9, no. 7, pp. 973–984, 2013.
[5] N. Golestaneh, Y. Chu, Y. Y. Xiao, G. L. Stoleru, and A. C.Theos, “Dysfunctional autophagy in RPE, a contributing factorin age-related macular degeneration,” Cell Death & Disease,vol. 8, no. 1, article e2537, 2017.
[6] H. Y. Chung, M. Cesari, S. Anton et al., “Molecular inflamma-tion: underpinnings of aging and age-related diseases,” AgeingResearch Reviews, vol. 8, no. 1, pp. 18–30, 2009.
[7] D. H. Cribbs, N. C. Berchtold, V. Perreau et al., “Extensiveinnate immune gene activation accompanies brain aging,increasing vulnerability to cognitive decline and neurodegen-eration: a microarray study,” Journal of Neuroinflammation,vol. 9, p. 179, 2012.
Table 2: Continued.
Direction in C3-def Gene set Size ES NES NOM p value FDR q value
Down Response to other organisms 72 −0.50 −1.94 0.000 0.023
Down Tissue development 133 −0.47 −1.97 0.000 0.016
Down Defense response 239 −0.43 −1.98 0.000 0.015
Down Detection of biotic stimulus 10 −0.83 −2.04 0.000 0.010
Down Acute inflammatory response 11 −0.85 −2.05 0.000 0.009
Down Keratinocyte differentiation 14 −0.77 −2.08 0.000 0.005
Down Response to bacterium 28 −0.67 −2.12 0.000 0.001
Down Ectoderm development 76 −0.58 −2.23 0.000 0.001
Down Epidermis development 67 −0.62 −2.37 0.000 0.000
15Oxidative Medicine and Cellular Longevity
[8] P. Herrmann, J. A. Cowing, E. Cristante et al., “Cd59a defi-ciency in mice leads to preferential innate immune activationin the retinal pigment epithelium-choroid with age,” Neurobi-ology of Aging, vol. 36, no. 9, pp. 2637–2648, 2015.
[9] A. Machalińska, M. Kawa, E. Pius-Sadowska et al., “Long-termneuroprotective effects of NT-4-engineered mesenchymalstem cells injected intravitreally in a mouse model of acuteretinal injury,” Investigative Ophthalmology & Visual Science,vol. 54, no. 13, pp. 8292–8305, 2013.
[10] W. Huang da, B. T. Sherman, and R. A. Lempicki, “Systematicand integrative analysis of large gene lists using DAVIDbioinformatics resources,” Nature Protocols, vol. 4, no. 1,pp. 44–57, 2009.
[11] A. Liberzon, C. Birger, H. Thorvaldsdottir, M. Ghandi, J. P.Mesirov, and P. Tamayo, “The molecular signatures database(MSigDB) hallmark gene set collection,” Cell Systems, vol. 1,no. 6, pp. 417–425, 2015.
[12] A. Subramanian, P. Tamayo, V. K. Mootha et al., “Gene setenrichment analysis: a knowledge-based approach for inter-preting genome-wide expression profiles,” Proceedings of theNational Academy of Sciences, vol. 102, no. 43, pp. 15545–15550, 2005.
[13] M. Trejter, A. Hochol, M. Tyczewska et al., “Sex-related geneexpression profiles in the adrenal cortex in the mature rat:microarray analysis with emphasis on genes involved in ste-roidogenesis,” International Journal of Molecular Medicine,vol. 35, no. 3, pp. 702–714, 2015.
[14] S. Beatty, H. H. Koh, D. Henson, and M. Boulton, “The role ofoxidative stress in the pathogenesis of age-related maculardegeneration,” Survey of Ophthalmology, vol. 45, no. 2,pp. 115–134, 2000.
[15] P. Tokarz, A. Kauppinen, K. Kaarniranta, and J. Blasiak, “Oxi-dative DNA damage and proteostasis in age-related maculardegeneration,” Journal of Biochemical and PharmalogicalResearch, vol. 1, no. 2, pp. 106–113, 2013.
[16] J. Blasiak,G. Petrovski, Z. Vereb,A. Facsko, andK.Kaarniranta,“Oxidative stress, hypoxia, and autophagy in the neovascularprocesses of age-related macular degeneration,” BioMedResearch International, vol. 2014, Article ID 768026, 7 pages,2014.
[17] S. M. Cohen, K. L. Olin, W. J. Feuer, L. Hjelmeland, C. L. Keen,and L. S. Morse, “Low glutathione reductase and peroxidaseactivity in age-related macular degeneration,” The British Jour-nal of Ophthalmology, vol. 78, no. 10, pp. 791–794, 1994.
[18] J. Cejkova, M. Vejrazka, J. Platenik, and S. Stipek, “Age-relatedchanges in superoxide dismutase, glutathione peroxidase, cat-alase and xanthine oxidoreductase/xanthine oxidase activitiesin the rabbit cornea,” Experimental Gerontology, vol. 39,no. 10, pp. 1537–1543, 2004.
[19] W. G. Robison Jr., T. Kuwabara, and J. G. Bieri, “Deficienciesof vitamins E and A in the rat. Retinal damage and lipofuscinaccumulation,” Investigative Ophthalmology & Visual Science,vol. 19, no. 9, pp. 1030–1037, 1980.
[20] P. Zafrilla, M. Losada, A. Perez, G. Caravaca, and J. Mulero,“Biomarkers of oxidative stress in patients with wet age relatedmacular degeneration,” The Journal of Nutrition, Health &Aging, vol. 17, no. 3, pp. 219–222, 2013.
[21] L. V. Johnson, S. Ozaki, M. K. Staples, P. A. Erickson, and D.H. Anderson, “A potential role for immune complex patho-genesis in drusen formation,” Experimental Eye Research,vol. 70, no. 4, pp. 441–449, 2000.
[22] J. M. Thurman, B. Renner, K. Kunchithapautham et al., “Oxi-dative stress renders retinal pigment epithelial cells susceptibleto complement-mediated injury,” Journal of Biological Chem-istry, vol. 284, no. 25, pp. 16939–16947, 2009.
[23] M. C. Marazita, A. Dugour, M. D. Marquioni-Ramella, J. M.Figueroa, and A. M. Suburo, “Oxidative stress-induced prema-ture senescence dysregulates VEGF and CFH expression inretinal pigment epithelial cells: implications for age-relatedmacular degeneration,” Redox Biology, vol. 7, pp. 78–87, 2016.
[24] M. Chen, J. V. Forrester, and H. Xu, “Synthesis of complementfactor H by retinal pigment epithelial cells is down-regulatedby oxidized photoreceptor outer segments,” Experimental EyeResearch, vol. 84, no. 4, pp. 635–645, 2007.
[25] M.Tanito,M.H.Elliott,Y.Kotake, andR.E.Anderson, “Proteinmodifications by 4-hydroxynonenal and 4-hydroxyhexenal inlight-exposed rat retina,” Investigative Ophthalmology&VisualScience, vol. 46, no. 10, pp. 3859–3868, 2005.
[26] S. K. Mitter, C. Song, X. Qi et al., “Dysregulated autophagy inthe RPE is associated with increased susceptibility to oxidativestress and AMD,” Autophagy, vol. 10, no. 11, pp. 1989–2005,2014.
[27] A. L. Wang, T. J. Lukas, M. Yuan, N. Du, M. O. Tso, and A. H.Neufeld, “Autophagy, exosomes and drusen formation in age-related macular degeneration,” Autophagy, vol. 5, no. 4,pp. 563-564, 2009.
[28] A. Varshavsky, “The ubiquitin system,” Trends in BiochemicalSciences, vol. 22, no. 10, pp. 383–387, 1997.
[29] T. Jung and T. Grune, “The proteasome and its role in the deg-radation of oxidized proteins,” IUBMB Life, vol. 60, no. 11,pp. 743–752, 2008.
[30] N. Nedelsky, P. K. Todd, and J. P. Taylor, “Autophagy and theubiquitin-proteasome system: collaborators in neuroprotec-tion,” Biochimica et Biophysica Acta, vol. 1782, no. 12,pp. 691–699, 2008.
[31] V. I. Korolchuk, A. Mansilla, F. M. Menzies, and D. C.Rubinsztein, “Autophagy inhibition compromises degradationof ubiquitin-proteasome pathway substrates,” Molecular Cell,vol. 33, no. 4, pp. 517–527, 2009.
[32] Z. Zhao, Y. Chen, J. Wang et al., “Age-related retinopathyin NRF2-deficient mice,” PLoS One, vol. 6, no. 4, articlee19456, 2011.
[33] I. Johansson, V. T. Monsen, K. Pettersen et al., “The marine n-3 PUFA DHA evokes cytoprotection against oxidative stressand protein misfolding by inducing autophagy and NFE2L2in human retinal pigment epithelial cells,” Autophagy,vol. 11, no. 9, pp. 1636–1651, 2015.
[34] L. Wang, K. B. Ebrahimi, M. Chyn, M. Cano, and J. T. Handa,“Biology of p62/sequestosome-1 in age-related macular degen-eration (AMD),” Advances in Experimental Medicine andBiology, vol. 854, pp. 17–22, 2016.
[35] S. Pankiv, T. H. Clausen, T. Lamark et al., “p62/SQSTM1 bindsdirectly to Atg8/LC3 to facilitate degradation of ubiquitinatedprotein aggregates by autophagy,” The Journal of BiologicalChemistry, vol. 282, no. 33, pp. 24131–24145, 2007.
[36] D. J. Klionsky, K. Abdelmohsen, A. Abe et al., “Guidelines forthe use and interpretation of assays for monitoring autophagy(3rd edition),” Autophagy, vol. 12, no. 1, pp. 1–222, 2016.
[37] J. Viiri, M. Amadio, N. Marchesi et al., “Autophagy activationclears ELAVL1/HuR-mediated accumulation of SQSTM1/p62during proteasomal inhibition in human retinal pigment epi-thelial cells,” PLoS One, vol. 8, no. 7, article e69563, 2013.
16 Oxidative Medicine and Cellular Longevity

[38] N. Mizushima, “Autophagy: process and function,” Genes &Development, vol. 21, no. 22, pp. 2861–2873, 2007.
[39] S. Selbonne, D. Francois, W. Raoul et al., “Protease nexin-1regulates retinal vascular development,” Cellular and Molecu-lar Life Sciences, vol. 72, no. 20, pp. 3999–4011, 2015.
[40] D. Li and E. M. Ellis, “Aldo-keto reductase 7A5 (AKR7A5)attenuates oxidative stress and reactive aldehyde toxicity inV79-4 cells,” Toxicology in Vitro, vol. 28, no. 4, pp. 707–714, 2014.
[41] G. Jia, R. Takahashi, Z. Zhang,Y. Tsuji, andH. Sone, “Aldo-ketoreductase 1 family B7 is the gene induced in response to oxida-tive stress in the livers of Long-Evans Cinnamon rats,” Interna-tional Journal of Oncology, vol. 29, no. 4, pp. 829–838, 2006.
[42] K. Reim, H. Regus-Leidig, J. Ammermuller et al., “Aberrantfunction and structure of retinal ribbon synapses in theabsence of complexin 3 and complexin 4,” Journal of CellScience, vol. 122, Part 9, pp. 1352–1361, 2009.
[43] N. Brose, “For better or for worse: complexins regulate SNAREfunction and vesicle fusion,” Traffic, vol. 9, no. 9, pp. 1403–1413, 2008.
[44] A. Stockman, H. E. Smithson, A. R. Webster et al., “The loss ofthe PDE6 deactivating enzyme, RGS9, results in precociouslight adaptation at low light levels,” Journal of Vision, vol. 8,no. 1, pp. 1–10, 2008.
[45] H. Patil, M. R. Guruju, K. I. Cho et al., “Structural and func-tional plasticity of subcellular tethering, targeting and process-ing of RPGRIP1 by RPGR isoforms,” Biology Open, vol. 1,no. 2, pp. 140–160, 2012.
[46] B. Stevens, N. J. Allen, L. E. Vazquez et al., “The classical com-plement cascade mediates CNS synapse elimination,” Cell,vol. 131, no. 6, pp. 1164–1178, 2007.
[47] Q. Shi, K. J. Colodner, S. B. Matousek et al., “ComplementC3-deficient mice fail to display age-related hippocampaldecline,” Journal of Neuroscience, vol. 35, no. 38, pp. 13029–13042, 2015.
[48] J. Bode, P. Dutow, K. Sommer et al., “A new role of the comple-ment system: C3 provides protection in a mouse model of lunginfection with intracellular Chlamydia psittaci,” PLoS One,vol. 7, no. 11, article e50327, 2012.
17Oxidative Medicine and Cellular Longevity

Submit your manuscripts athttps://www.hindawi.com
Stem CellsInternational
Hindawi Publishing Corporationhttp://www.hindawi.com Volume 2014
Hindawi Publishing Corporationhttp://www.hindawi.com Volume 2014
MEDIATORSINFLAMMATION
of
Hindawi Publishing Corporationhttp://www.hindawi.com Volume 2014
Behavioural Neurology
EndocrinologyInternational Journal of
Hindawi Publishing Corporationhttp://www.hindawi.com Volume 2014
Hindawi Publishing Corporationhttp://www.hindawi.com Volume 2014
Disease Markers
Hindawi Publishing Corporationhttp://www.hindawi.com Volume 2014
BioMed Research International
OncologyJournal of
Hindawi Publishing Corporationhttp://www.hindawi.com Volume 2014
Hindawi Publishing Corporationhttp://www.hindawi.com Volume 2014
Oxidative Medicine and Cellular Longevity
Hindawi Publishing Corporationhttp://www.hindawi.com Volume 2014
PPAR Research
The Scientific World JournalHindawi Publishing Corporation http://www.hindawi.com Volume 2014
Immunology ResearchHindawi Publishing Corporationhttp://www.hindawi.com Volume 2014
Journal of
ObesityJournal of
Hindawi Publishing Corporationhttp://www.hindawi.com Volume 2014
Hindawi Publishing Corporationhttp://www.hindawi.com Volume 2014
Computational and Mathematical Methods in Medicine
OphthalmologyJournal of
Hindawi Publishing Corporationhttp://www.hindawi.com Volume 2014
Diabetes ResearchJournal of
Hindawi Publishing Corporationhttp://www.hindawi.com Volume 2014
Hindawi Publishing Corporationhttp://www.hindawi.com Volume 2014
Research and TreatmentAIDS
Hindawi Publishing Corporationhttp://www.hindawi.com Volume 2014
Gastroenterology Research and Practice
Hindawi Publishing Corporationhttp://www.hindawi.com Volume 2014
Parkinson’s Disease
Evidence-Based Complementary and Alternative Medicine
Volume 2014Hindawi Publishing Corporationhttp://www.hindawi.com
Related Documents