Dependence of Volumetric Parameters of Hot-Mix Asphalts on Testing Methods Filippo Giammaria Pratico 1 ; Rosolino Vaiana 2 ; and Antonino Moro 3 Abstract: Assessing the volumetrics of hot-mix asphalts (HMAs) is an important aspect of quality-control and quality-assurance procedures. The economic value of HMAs is usually assessed in terms of their mix bulk specific gravity (G mb ), air-void content, voids in mineral aggregate, and voids filled with asphalt. However, the results for specific gravity can vary with the coring process and method used in the experimental measurements. In light of these concerns, this study focused on the assessment of the dependence of the measured volumetrics of HMA-wearing courses on the testing and coring procedures. A wide range of methods for the measurement of specific gravities and surface texture was con- sidered. Analyses showed that the coring process, measurement methodology, and core diameter can all substantially affect the results of HMA volumetrics measurements; the effects of the selection of the testing technique are not negligible and can be critical. At the same time, results demonstrate that there is potential for reducing the cost and duration of massive coring processes, as well as other negative impacts (e.g., road- surface defects and environmental diseconomies). DOI: 10.1061/(ASCE)MT.1943-5533.0000802. © 2014 American Society of Civil Engineers. Author keywords: Hot-mix asphalt; Specific gravity; Coring; Air-void content; Voids in mineral aggregate; Voids filled with asphalt; Permeable friction course. Introduction Pavement-specific gravities are the basis for the assessment of hot- mix asphalt (HMA) volumetrics, and test methods used for in-place quality assurance (QA) typically rely on the results of testing con- ducted on pavement cores (Masad et al. 2002; Mohammad et al. 2005; Cocurullo et al. 2008; Alvarez et al. 2009; Oliveira et al. 2009). Air-void (AV or V a ) content can be derived from P b (the asphalt-binder content by weight of mix), G mb (the bulk specific gravity of the compacted mixture), G b (asphalt-binder specific gravity), and G se (the effective specific gravity of the aggregate). Consequently, AV can be derived from G mb and G mm (the maxi- mum theoretical specific gravity of the HMA mixture). The Super- pave AV requirements are limited to dense-graded HMAs. The void space between the aggregate particles in a compacted pavement is referred to as the voids in mineral aggregate (VMA) and this has to be sufficiently high to facilitate the presence of both adequate effective asphalt-binder (the fraction of asphalt binder not absorbed into the aggregate particles) and adequate AV content (Anderson and Bahia 1997; Chadbourn et al. 2000). The VMA can be derived from G mb , P b , and G sb (the bulk specific gravity of the aggregate), and is often related to HMA durability (Chadbourn et al. 2000), which latter is in-turn related to the effective asphalt binder and to the corresponding concept of asphalt-film thickness (Kandhal and Mallick 1998). Following McLeod (1956, 1959) and the Asphalt Institute (1994), Superpave recommends a minimum VMA that depends on the nominal maxi- mum particle size (NMAS) of the aggregate (from 11 for NMAS ¼ 37.5 mm to 15 for NMAS ¼ 9.5 mm). The portion of the VMA that contain asphalt binder is known as voids filled with asphalt (VFA) and refers to the effective asphalt content. The VFA can be derived from VMA and AV (VFA is inversely related to AV). The purpose of specifying a minimum VFA (from 65 to 70 according to Superpave requirements; the higher the traffic, the lower the minimum VFA) in light traffic situations is to prevent the formation of less durable HMA as a result of thin films of asphalt binder on the aggregate particles. By contrast, because low AV contents can be critical to permanent deformation, a maximum VFA (from 75 for high traffic levels to 80 for low traffic levels) helps prevent the use of mixes that are susceptible to rutting in heavy traffic situations. For open mixes, the reference values for AV (12–23), VMA (24–33), and VFA (30–50) can be found elsewhere (Fletcher and Theron 2011; Mallick et al. 2000; Cooley et al. 2000; Kline and Putman 2011). Despite Superpave requirements, which refer to laboratory properties, the ranges of permissible values of in-lab and on-site AV, VMA, and VFA are wide. The specific gravity of a HMA can be measured with a variety of methods (Praticò and Moro 2012): the parafilm (FILM) method [ASTM D1188 (ASTM 2013)], the vacuum-sealing method [ASTM D6752/AASHTO T331 (ASTM 2011, AASHTO 2008)], the paraffin method [BU N40/73-AASHTO T275A (CNR BU 2007, AASHTO 2007)], the saturated surface dry method [SSD; AASHTO T166/ASTM D2726/EN 12697-6:2012 (AASHTO 2012, ASTM 2012, EN 2012)], and the dimensional method [DIM; AASHTO T269-97:2007/EN 12697-6:2012 (AASHTO 2007, EN 2012)]. A majority of tests require coring the existing pavement followed by laboratory testing. Further, these abovementioned standards and the corresponding contract specifications usually do not specify the influences of thickness and diameter on results and thresholds, and thus there have been several calls for further 1 DIMET-DIIES, Dept. of Engineeringof Information, Infrastructures, and Sustainable Energy, Mediterranea Univ. of Reggio Calabria, 89100 Reggio Calabria, Italy (corresponding author). E-mail: [email protected] 2 DiPiTer, Dept. of Territorial Planning, Univ. of Calabria, 87036 Cosenza, Italy. E-mail: [email protected] 3 DIMET-DIIES, Dept. of Engineering of Information, Infrastructures, and Sustainable Energy, Mediterranea Univ. of Reggio Calabria, 89100 Reggio Calabria, Italy. E-mail: [email protected] Note. This manuscript was submitted on May 31, 2012; approved on February 13, 2013; published online on February 15, 2013. Discussion per- iod open until June 1, 2014; separate discussions must be submitted for individual papers. This paper is part of the Journal of Materials in Civil Engineering, Vol. 26, No. 1, January 1, 2014. © ASCE, ISSN 0899-1561/ 2014/1-45-53/$25.00. JOURNAL OF MATERIALS IN CIVIL ENGINEERING © ASCE / JANUARY 2014 / 45 J. Mater. Civ. Eng. 2014.26:45-53.

Welcome message from author
This document is posted to help you gain knowledge. Please leave a comment to let me know what you think about it! Share it to your friends and learn new things together.
Transcript

Dependence of Volumetric Parameters of Hot-MixAsphalts on Testing Methods
Filippo Giammaria Pratico1; Rosolino Vaiana2; and Antonino Moro3
Abstract: Assessing the volumetrics of hot-mix asphalts (HMAs) is an important aspect of quality-control and quality-assurance procedures.The economic value of HMAs is usually assessed in terms of their mix bulk specific gravity (Gmb), air-void content, voids in mineral aggregate,and voids filled with asphalt. However, the results for specific gravity can vary with the coring process and method used in the experimentalmeasurements. In light of these concerns, this study focused on the assessment of the dependence of the measured volumetrics of HMA-wearingcourses on the testing and coring procedures. A wide range of methods for the measurement of specific gravities and surface texture was con-sidered. Analyses showed that the coring process, measurement methodology, and core diameter can all substantially affect the results of HMAvolumetrics measurements; the effects of the selection of the testing technique are not negligible and can be critical. At the same time, resultsdemonstrate that there is potential for reducing the cost and duration of massive coring processes, as well as other negative impacts (e.g., road-surface defects and environmental diseconomies).DOI: 10.1061/(ASCE)MT.1943-5533.0000802.© 2014 American Society of Civil Engineers.
Author keywords: Hot-mix asphalt; Specific gravity; Coring; Air-void content; Voids in mineral aggregate; Voids filled with asphalt;Permeable friction course.
Introduction
Pavement-specific gravities are the basis for the assessment of hot-mix asphalt (HMA) volumetrics, and test methods used for in-placequality assurance (QA) typically rely on the results of testing con-ducted on pavement cores (Masad et al. 2002; Mohammad et al.2005; Cocurullo et al. 2008; Alvarez et al. 2009; Oliveira et al.2009). Air-void (AV or Va) content can be derived from Pb (theasphalt-binder content by weight of mix), Gmb (the bulk specificgravity of the compacted mixture), Gb (asphalt-binder specificgravity), and Gse (the effective specific gravity of the aggregate).Consequently, AV can be derived from Gmb and Gmm (the maxi-mum theoretical specific gravity of the HMA mixture). The Super-pave AV requirements are limited to dense-graded HMAs.
The void space between the aggregate particles in a compactedpavement is referred to as the voids in mineral aggregate (VMA)and this has to be sufficiently high to facilitate the presence of bothadequate effective asphalt-binder (the fraction of asphalt bindernot absorbed into the aggregate particles) and adequate AV content(Anderson and Bahia 1997; Chadbourn et al. 2000).
The VMA can be derived from Gmb, Pb, and Gsb (the bulkspecific gravity of the aggregate), and is often related to HMAdurability (Chadbourn et al. 2000), which latter is in-turn relatedto the effective asphalt binder and to the corresponding concept
of asphalt-film thickness (Kandhal and Mallick 1998). FollowingMcLeod (1956, 1959) and the Asphalt Institute (1994), Superpaverecommends a minimum VMA that depends on the nominal maxi-mum particle size (NMAS) of the aggregate (from 11 for NMAS ¼37.5 mm to 15 for NMAS ¼ 9.5 mm).
The portion of the VMA that contain asphalt binder is known asvoids filled with asphalt (VFA) and refers to the effective asphaltcontent. The VFA can be derived from VMA and AV (VFA isinversely related to AV). The purpose of specifying a minimumVFA (from 65 to 70 according to Superpave requirements; thehigher the traffic, the lower the minimum VFA) in light trafficsituations is to prevent the formation of less durable HMA as aresult of thin films of asphalt binder on the aggregate particles.By contrast, because low AV contents can be critical to permanentdeformation, a maximum VFA (from 75 for high traffic levels to80 for low traffic levels) helps prevent the use of mixes that aresusceptible to rutting in heavy traffic situations.
For open mixes, the reference values for AV (12–23), VMA(24–33), and VFA (30–50) can be found elsewhere (Fletcher andTheron 2011; Mallick et al. 2000; Cooley et al. 2000; Kline andPutman 2011). Despite Superpave requirements, which refer tolaboratory properties, the ranges of permissible values of in-lab andon-site AV, VMA, and VFA are wide.
The specific gravity of a HMA can be measured with a varietyof methods (Praticò and Moro 2012): the parafilm (FILM) method[ASTM D1188 (ASTM 2013)], the vacuum-sealing method[ASTM D6752/AASHTO T331 (ASTM 2011, AASHTO 2008)],the paraffin method [BU N40/73-AASHTO T275A (CNR BU2007, AASHTO 2007)], the saturated surface dry method [SSD;AASHTO T166/ASTM D2726/EN 12697-6:2012 (AASHTO2012, ASTM 2012, EN 2012)], and the dimensional method[DIM; AASHTO T269-97:2007/EN 12697-6:2012 (AASHTO2007, EN 2012)].
A majority of tests require coring the existing pavementfollowed by laboratory testing. Further, these abovementionedstandards and the corresponding contract specifications usuallydo not specify the influences of thickness and diameter on resultsand thresholds, and thus there have been several calls for further
1DIMET-DIIES, Dept. of Engineeringof Information, Infrastructures, andSustainable Energy, Mediterranea Univ. of Reggio Calabria, 89100 ReggioCalabria, Italy (corresponding author). E-mail: [email protected]
2DiPiTer, Dept. of Territorial Planning, Univ. of Calabria, 87036Cosenza, Italy. E-mail: [email protected]
3DIMET-DIIES, Dept. of Engineering of Information, Infrastructures,and Sustainable Energy, Mediterranea Univ. of Reggio Calabria, 89100Reggio Calabria, Italy. E-mail: [email protected]
Note. This manuscript was submitted on May 31, 2012; approved onFebruary 13, 2013; published online on February 15, 2013. Discussion per-iod open until June 1, 2014; separate discussions must be submitted forindividual papers. This paper is part of the Journal of Materials in CivilEngineering, Vol. 26, No. 1, January 1, 2014. © ASCE, ISSN 0899-1561/2014/1-45-53/$25.00.
JOURNAL OF MATERIALS IN CIVIL ENGINEERING © ASCE / JANUARY 2014 / 45
J. Mater. Civ. Eng. 2014.26:45-53.
research into both QA/quality control (QC) and the acceptance andverification testing of HMAs (Hand and Epps 2000; Jackson andCzor 2003; Sholar et al. 2005; Alvarez et al. 2010; Gedafaet al. 2012; Praticò et al. 2011). For core diameter and thickness,the following specifications are current: (1) ASTM D6752-09(ASTM 2011): diameter 100–150 mm, thickness at least one-and-a-half times the maximum size of the aggregate, diameter at leastfour times the maximum size of the aggregate; (2) BU N40-1973:diameter greater than 10–23 cm (as a function of NMAS);(3) AASHTO T331 (AASHTO 2008): diameter greater than fourtimes the maximum aggregate size (MAS); (4) EN 12697-6:AASHTO 2012: thickness ≥20 mm and ≥2 MAS; (5) ASTMD7063/D7063M-11 (ASTM 2011): diameter >4 MAS and thick-ness: >1.5 MAS. In light of these specifications, the dependenceof the volumetrics of HMA-wearing courses on testing and coringprocedures needs to be assessed.
The rest of this paper is organized as follows. The second sec-tion specifies the research objectives and scope. The third sectionpresents the experiments and results. The fourth section describesthe architecture of the proposed model. The fifth section describesthe application of the model and the analyses performed. The sixthsection discusses conclusions and future research directions.
Research Objectives and Scope
The measurements (i.e., coring process and method) used to deter-mine the specific gravity, which is the basis of the derivation ofHMA volumetrics, can influence the results.
In light of these concerns, this study assessed the dependence ofthe volumetrics of HMA-wearing courses on testing and coringprocedures.
In more detail, the research objectives and scope of this studywere as follows:• Assess the dependence of the volumetrics of HMA-wearing
courses on testing and coring procedures.• Test and apply a wide range of methods for the measurement of
specific gravities, which is the basis of the derivation of HMAvolumetrics.
• Test the use of cores of different diameters for the same HMA.• Account for the effects of mix type and evaluating traditional
and innovative HMAs.• Analyze both directly (in terms of alterations to the original mi-
crotexture and macrotexture) and indirectly (in terms of specificgravity) the modifications resulting from coring procedures.
• Propose a relationship between the results of the various testingmethods and core diameters.
Experiments
Design of Experiments
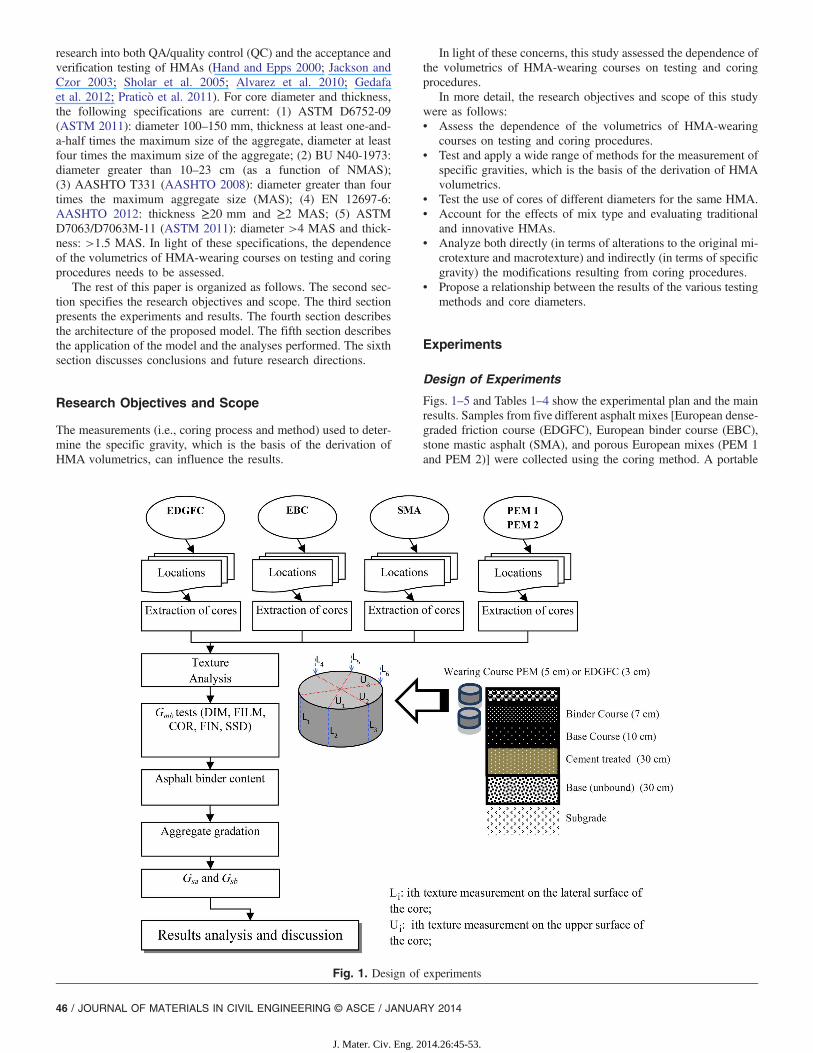
Figs. 1–5 and Tables 1–4 show the experimental plan and the mainresults. Samples from five different asphalt mixes [European dense-graded friction course (EDGFC), European binder course (EBC),stone mastic asphalt (SMA), and porous European mixes (PEM 1and PEM 2)] were collected using the coring method. A portable
Fig. 1. Design of experiments
46 / JOURNAL OF MATERIALS IN CIVIL ENGINEERING © ASCE / JANUARY 2014
J. Mater. Civ. Eng. 2014.26:45-53.
drilling equipment was used. The drilling unit was equipped with awater supply to cool the core barrel during drilling operations.Cores were dried and their surface texture was analyzed.
The road-surface texture was analyzed in terms of its intrinsicproperties (surface geometry), which affect extrinsic texture prop-erties (friction, noise emission, vibration, sheet flow-water phe-nomena; Boscaino and Praticò 2001; Boscaino et al. 2009).
In the pursuit of gathering information on test-induced altera-tions at different scales (microtexture and macrotexture), the fol-lowing two sets of intrinsic indicators were investigated (Table 1):• Aggregate descriptors (Rt, RMS, MPDaipcr, MPDiso, ETDi),
which are independent of texture wavelength [Boscaino andPraticò 2001; ISO 13473-1 (ISO 1997)]; and
• Space-frequency or spectral descriptors [LTλ, ISO TS 13473-4(ISO/CD (2008)], which were obtained by treating the pavementprofile as the superposition of many elementary components(harmonics), each pertaining to a single texture wavelength(Fourier analysis).For each core, nine texture profiles were identified: three on the
upper surface of the core (U), and six on the lateral surface alongthe generatrices of the core (L).
Profiles were surveyed with a laser profilometer based on cono-scopic holography (Vaiana 2002; Table 1). From each profile, sixintrinsic indicators were derived (Table 1).
Afterward, the specific gravity of each core was determined withfive different methods (Table 2 and Fig. 1). Cores with diametersin the range 50–150 mm (i.e., partly outside the ASTM range) andwith a thickness of 5 cm (i.e., fulfilling ASTM requirements) wereconsidered. For each mix, a subset of cores was submitted todisruptive tests:• Asphalt-binder content (EN 12697-1:2012 EN 2012);• Aggregate gradation [EN 12697-2:2007 (EN 2007)].
After gradation testing, the aggregates were tested for theirapparent and bulk specific gravity (Gsa and Gsb) according toMissouri DOT TM81 (MoDOT 2008) and BU N63/78 (CNRBU 2007).
Results
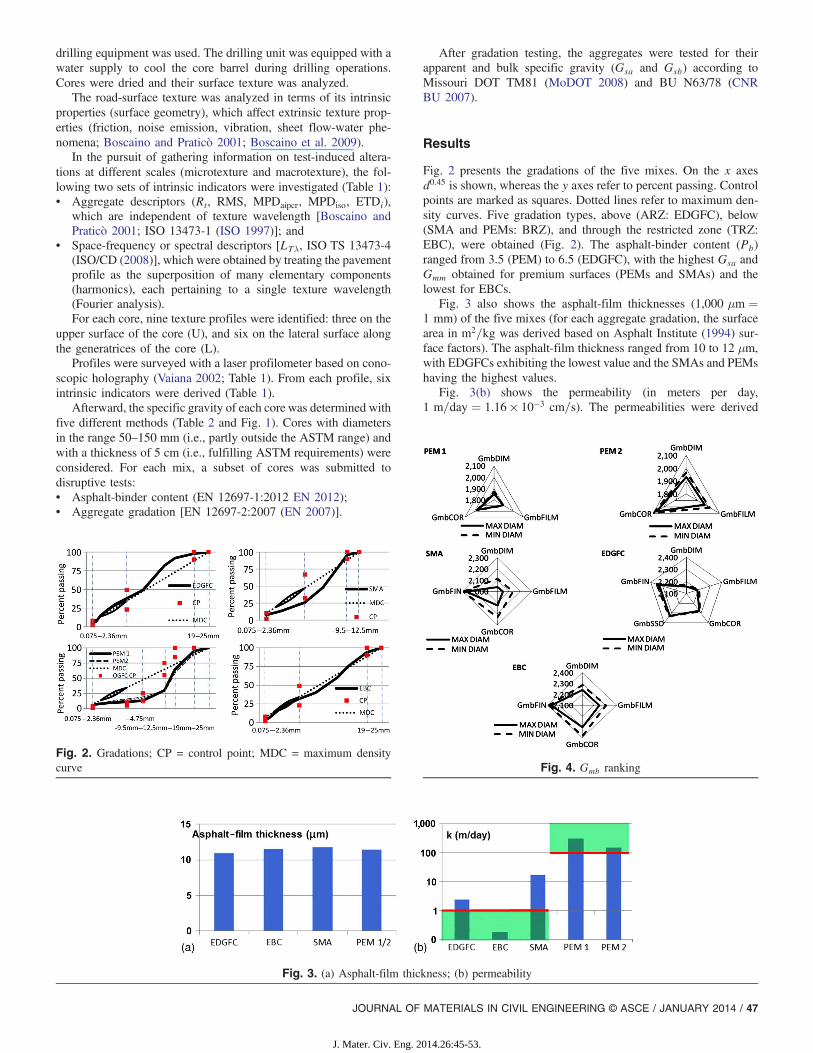
Fig. 2 presents the gradations of the five mixes. On the x axesd0.45 is shown, whereas the y axes refer to percent passing. Controlpoints are marked as squares. Dotted lines refer to maximum den-sity curves. Five gradation types, above (ARZ: EDGFC), below(SMA and PEMs: BRZ), and through the restricted zone (TRZ:EBC), were obtained (Fig. 2). The asphalt-binder content (Pb)ranged from 3.5 (PEM) to 6.5 (EDGFC), with the highest Gsa andGmm obtained for premium surfaces (PEMs and SMAs) and thelowest for EBCs.
Fig. 3 also shows the asphalt-film thicknesses (1,000 μm ¼1 mm) of the five mixes (for each aggregate gradation, the surfacearea in m2=kg was derived based on Asphalt Institute (1994) sur-face factors). The asphalt-film thickness ranged from 10 to 12 μm,with EDGFCs exhibiting the lowest value and the SMAs and PEMshaving the highest values.
Fig. 3(b) shows the permeability (in meters per day,1 m=day ¼ 1.16 × 10⁻³ cm=s). The permeabilities were derived
Fig. 3. (a) Asphalt-film thickness; (b) permeability
Fig. 4. Gmb rankingFig. 2. Gradations; CP = control point; MDC = maximum densitycurve
JOURNAL OF MATERIALS IN CIVIL ENGINEERING © ASCE / JANUARY 2014 / 47
J. Mater. Civ. Eng. 2014.26:45-53.

with previously established methods (Brown et al. 2004; Praticòand Moro 2006, 2007). Dense friction courses (DGFC, SMA)are required to have the least possible permeability. The highestallowable permeability (measured according to ASTM PS129) isusually assumed to be 1.08 m=day (Brown et al. 2004).
By contrast, binder courses currently have two new functionsin construction and rehabilitation projects, namely, (1) a temporary
wearing course and (2) an impermeable layer beneath porousasphalt concrete with a given transverse slope to permit the waterto flow toward ditches. These new functions result in (im)per-meability requirements similar to those for traditional wearingcourses. Based on these considerations, in Fig. 3(b) the thresholdis assumed to be 1.08 m=day for SMAs, EDGFCs, and EBCs,which corresponds to an effective porosity of 9.6% and anAVCOR of 9.9–10.4% (Brown et al. 2004; Praticò and Moro 2006).
By contrast, PEMs have to guarantee a minimum outflow time,which corresponds to a permeability of approximately 100 m=day(Kline and Putman 2011), as in Fig. 3(a), and therefore to aneffective porosity greater than approximately 16.8% and AV >17.4% (Praticò and Moro 2007). These results demonstrate thatfor the mixes under examination, the permeabilities of PEMs andEBCs are satisfactory.
The specific gravities (GmbCOR, GmbDIM, GmbFILM, and GmbSSD)range from 1.8 to 2.4, depending on the mix type (PEMs, SMA,EDGFC, EBC), the method used (COR, DIM, FILM, SSD), and thediameter of the core (MAXDIAM, MIN DIAM; Table 3 and Fig. 4).The SSD method was used only in the case of EDGFC (Fig. 4). Thefollowing two main observations can be derived (Fig. 4):• For a given method, the cores with the lowest diameter are
always denser than those with the highest diameter;• For a given diameter and type of mix, the ordering of the
Gmb − Gmm values obtained with the different methods isalways as follows: Gmm > GmbFIN > GmbSSD > GmbCOR >GmbFILM > GmbDIM (where Gmm is the maximum theoreticalspecific gravity, Table 2).Further, the lateral surface of a given core is always smoother
than the bottom and upper surfaces of the same core.
Fig. 5. (a) Spectral analysis; (b) virtual versus actual cutting
Table 2. Plan of Experiments
Parameter Value
Number of mixes 5Nominal diameter (mm) 50–150Height (mm) 50
Methods GmbDIM GmbFILM GmbCOR GmbFIN GmbSSD
Gmb range 1.839–2.400NMAS (mm) 9.5–19Pb 3.5–6.5Gsa 2.719–2.933Compaction In-site
Note: COR = vacuum-sealing method [ASTM D6752/AASHTO T331(ASTM 2011, AASHTO 2008)]; DIM = dimensional method[AASHTO T269-97:2007/EN 12697-6:2012 (AASHTO 2007, AASHTO2012)]; FILM = parafilm method [ASTM D1188 (ASTM 2013)];FIN = paraffin method [BU N40/73-AASHTO T275A (CNR BU 2007,AASHTO 2007)]; Gmb = bulk specific gravity of the compacted mixture;Gsa = apparent specific gravity of the aggregate;Gsb = bulk specific gravityof the aggregate; Pb = asphalt content by weight; SSD = saturated surfacedry method [AASHTO T166/ASTM D2726/EN 12697-6:2012 (AASHTO2012, ASTM 2012, AASHTO 2012)].
Table 1. Surveyed Texture Indicators
Symbol Description
Rt The separation of the highest peak and the lowest valley within the five samples in the profile
RMS ≈ σ ≈ ½Σðz − zmeanÞ2PðzÞ�0.5 Standard root-mean-square roughness; PðzÞ is the probability density function
MPDaipcr, MPDiso Mean profile depth, measured according to the AIPCR algorithm or the ISO algorithm
ETDa Estimated texture depth and mean profile depth, according to the ith method, where i denotes ISO or AIPCR
LTU; LTL; ΔLT ¼ LTU − LTLb Texture level, for a given wavelength, on the upper surface (TU); texture level, for a given wavelength,
on the lateral surface (TL); incremental texture level (Δ)
Note: ZðkÞ = discrete Fourier transform; λ ¼ wavelength [λ ∈ ð5=0.10 mmÞ]; Device characteristics [ISO 13473-3; ISO (2002)]—Mobility: stationary, slow;texture wavelength range: range covered BD class 0.20=50 mm; pavement contact: contactless devices; principle of operation: laser profilometer; objectivefocal length: 100 mm; maximum vertical measuring range: 35 mm; vertical resolution BD for class 0.003=0.03 mm: 0.012 mm; stand-off distance: 90 mm;minimum horizontal resolution Δx (sampling interval) BD for class 0.05=1 mm∶0.01 mm; angle coverage: 170°.aETD ¼ 0.2þ 0.8 · MPD.bck ¼ 2=Nf½realZðkþ 1Þ�2 þ ½imagZðkþ 1Þ�2g0.5; ~h ¼ 10−6 m; LTðλkÞ ¼ ln c2K= ~h
2; ZðkÞ ¼ PNn¼1 zðnÞ expf½−iðk − 1Þ2πðn − 1Þ�=Ng; λi ¼ 21=3λi−1 .
48 / JOURNAL OF MATERIALS IN CIVIL ENGINEERING © ASCE / JANUARY 2014
J. Mater. Civ. Eng. 2014.26:45-53.
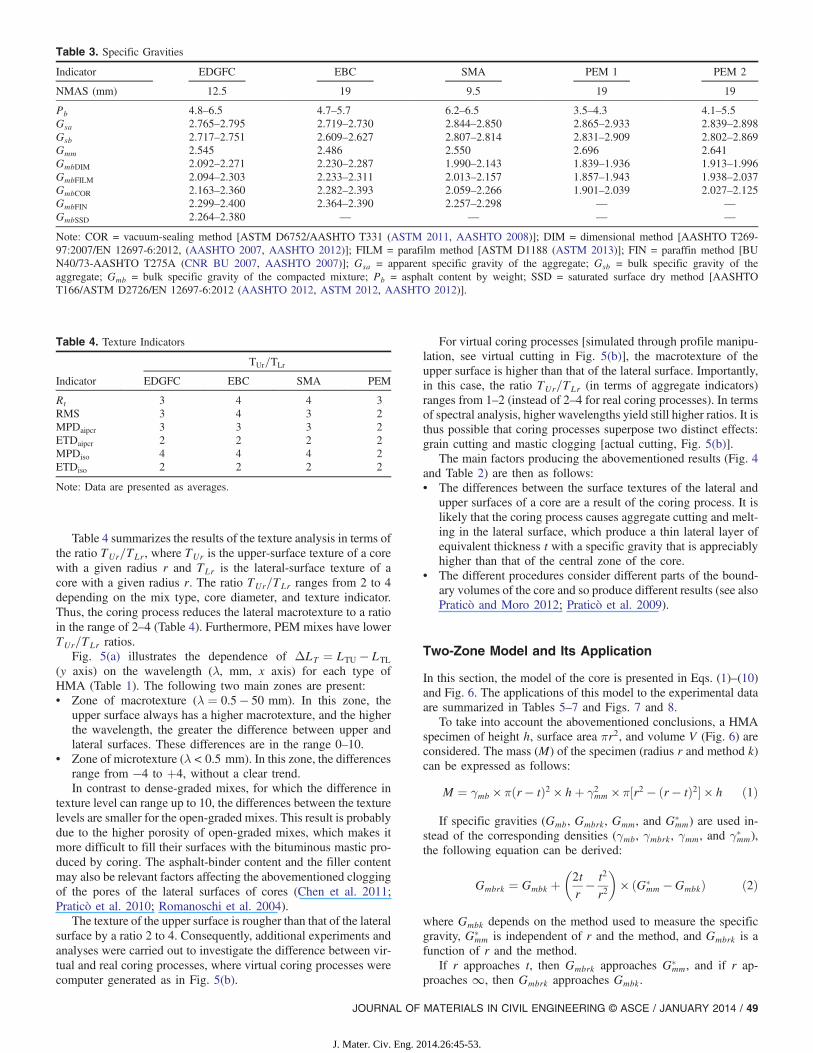
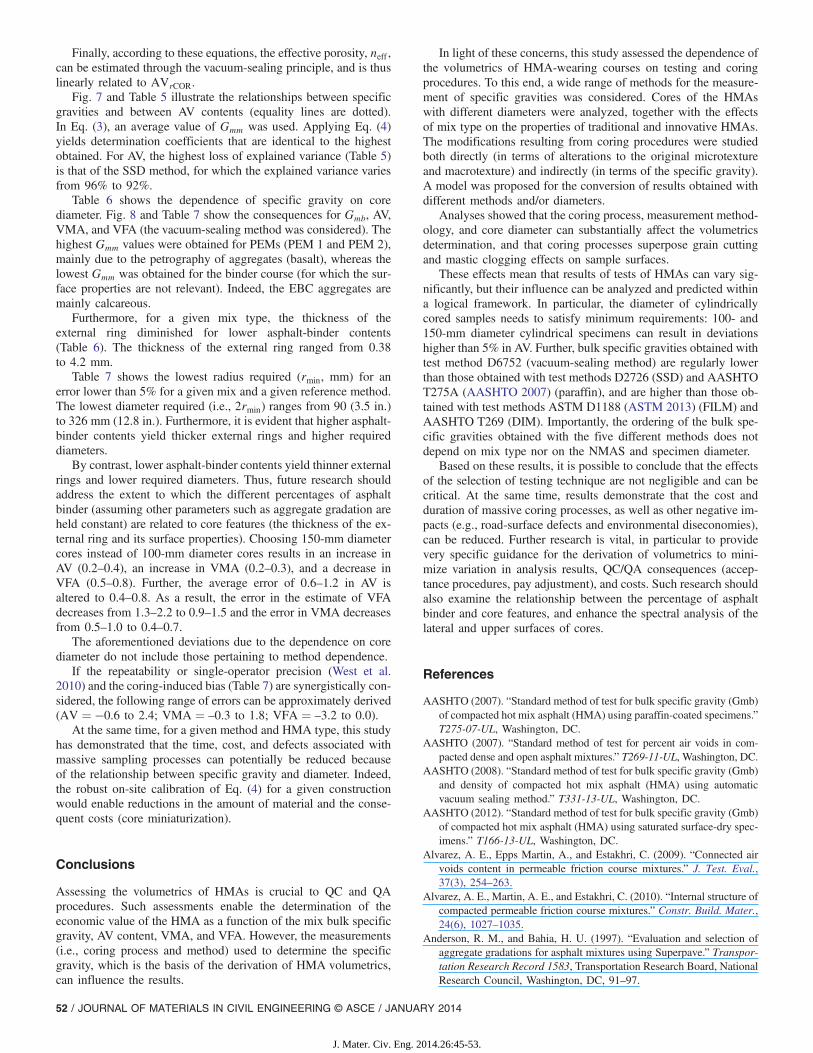
Table 4 summarizes the results of the texture analysis in terms ofthe ratio TUr=TLr, where TUr is the upper-surface texture of a corewith a given radius r and TLr is the lateral-surface texture of acore with a given radius r. The ratio TUr=TLr ranges from 2 to 4depending on the mix type, core diameter, and texture indicator.Thus, the coring process reduces the lateral macrotexture to a ratioin the range of 2–4 (Table 4). Furthermore, PEM mixes have lowerTUr=TLr ratios.
Fig. 5(a) illustrates the dependence of ΔLT ¼ LTU − LTL(y axis) on the wavelength (λ, mm, x axis) for each type ofHMA (Table 1). The following two main zones are present:• Zone of macrotexture (λ ¼ 0.5 − 50 mm). In this zone, the
upper surface always has a higher macrotexture, and the higherthe wavelength, the greater the difference between upper andlateral surfaces. These differences are in the range 0–10.
• Zone of microtexture (λ < 0.5 mm). In this zone, the differencesrange from −4 to þ4, without a clear trend.In contrast to dense-graded mixes, for which the difference in
texture level can range up to 10, the differences between the texturelevels are smaller for the open-graded mixes. This result is probablydue to the higher porosity of open-graded mixes, which makes itmore difficult to fill their surfaces with the bituminous mastic pro-duced by coring. The asphalt-binder content and the filler contentmay also be relevant factors affecting the abovementioned cloggingof the pores of the lateral surfaces of cores (Chen et al. 2011;Praticò et al. 2010; Romanoschi et al. 2004).
The texture of the upper surface is rougher than that of the lateralsurface by a ratio 2 to 4. Consequently, additional experiments andanalyses were carried out to investigate the difference between vir-tual and real coring processes, where virtual coring processes werecomputer generated as in Fig. 5(b).
For virtual coring processes [simulated through profile manipu-lation, see virtual cutting in Fig. 5(b)], the macrotexture of theupper surface is higher than that of the lateral surface. Importantly,in this case, the ratio TUr=TLr (in terms of aggregate indicators)ranges from 1–2 (instead of 2–4 for real coring processes). In termsof spectral analysis, higher wavelengths yield still higher ratios. It isthus possible that coring processes superpose two distinct effects:grain cutting and mastic clogging [actual cutting, Fig. 5(b)].
The main factors producing the abovementioned results (Fig. 4and Table 2) are then as follows:• The differences between the surface textures of the lateral and
upper surfaces of a core are a result of the coring process. It islikely that the coring process causes aggregate cutting and melt-ing in the lateral surface, which produce a thin lateral layer ofequivalent thickness t with a specific gravity that is appreciablyhigher than that of the central zone of the core.
• The different procedures consider different parts of the bound-ary volumes of the core and so produce different results (see alsoPraticò and Moro 2012; Praticò et al. 2009).
Two-Zone Model and Its Application
In this section, the model of the core is presented in Eqs. (1)–(10)and Fig. 6. The applications of this model to the experimental dataare summarized in Tables 5–7 and Figs. 7 and 8.
To take into account the abovementioned conclusions, a HMAspecimen of height h, surface area πr2, and volume V (Fig. 6) areconsidered. The mass (M) of the specimen (radius r and method k)can be expressed as follows:
M ¼ γmb × πðr − tÞ2 × hþ γ2mm × π½r2 − ðr − tÞ2� × h ð1Þ
If specific gravities (Gmb, Gmbrk, Gmm, and G�mm) are used in-
stead of the corresponding densities (γmb, γmbrk, γmm, and γ�mm),the following equation can be derived:
Gmbrk ¼ Gmbk þ�2tr− t2
r2
�× ðG�
mm − GmbkÞ ð2Þ
where Gmbk depends on the method used to measure the specificgravity, G�
mm is independent of r and the method, and Gmbrk is afunction of r and the method.
If r approaches t, then Gmbrk approaches G�mm, and if r ap-
proaches ∞, then Gmbrk approaches Gmbk.
Table 4. Texture Indicators
Indicator
TUr=TLr
EDGFC EBC SMA PEM
Rt 3 4 4 3RMS 3 4 3 2MPDaipcr 3 3 3 2ETDaipcr 2 2 2 2MPDiso 4 4 4 2ETDiso 2 2 2 2
Note: Data are presented as averages.
Table 3. Specific Gravities
Indicator EDGFC EBC SMA PEM 1 PEM 2
NMAS (mm) 12.5 19 9.5 19 19
Pb 4.8–6.5 4.7–5.7 6.2–6.5 3.5–4.3 4.1–5.5Gsa 2.765–2.795 2.719–2.730 2.844–2.850 2.865–2.933 2.839–2.898Gsb 2.717–2.751 2.609–2.627 2.807–2.814 2.831–2.909 2.802–2.869Gmm 2.545 2.486 2.550 2.696 2.641GmbDIM 2.092–2.271 2.230–2.287 1.990–2.143 1.839–1.936 1.913–1.996GmbFILM 2.094–2.303 2.233–2.311 2.013–2.157 1.857–1.943 1.938–2.037GmbCOR 2.163–2.360 2.282–2.393 2.059–2.266 1.901–2.039 2.027–2.125GmbFIN 2.299–2.400 2.364–2.390 2.257–2.298 — —GmbSSD 2.264–2.380 — — — —
Note: COR = vacuum-sealing method [ASTM D6752/AASHTO T331 (ASTM 2011, AASHTO 2008)]; DIM = dimensional method [AASHTO T269-97:2007/EN 12697-6:2012, (AASHTO 2007, AASHTO 2012)]; FILM = parafilm method [ASTM D1188 (ASTM 2013)]; FIN = paraffin method [BUN40/73-AASHTO T275A (CNR BU 2007, AASHTO 2007)]; Gsa = apparent specific gravity of the aggregate; Gsb = bulk specific gravity of theaggregate; Gmb = bulk specific gravity of the compacted mixture; Pb = asphalt content by weight; SSD = saturated surface dry method [AASHTOT166/ASTM D2726/EN 12697-6:2012 (AASHTO 2012, ASTM 2012, AASHTO 2012)].
JOURNAL OF MATERIALS IN CIVIL ENGINEERING © ASCE / JANUARY 2014 / 49
J. Mater. Civ. Eng. 2014.26:45-53.

A previous study (Praticò and Moro 2011) demonstrated that forhigh radii, measurements performed with different methods on thesame mix type converge toward Gmm (the maximum theoreticalspecific gravity of the mix). Thus, the following equation can beused for the range (0, Gmm):
Gmbk ¼ a ×Gmbj þ ð1 − aÞGmm ð3Þ
This relationship is the theoretical basis for the analysis ofthe consequences of the selections of method and core dimen-sions on the results for the quality characteristics (AV, VMA,and VFA).
For the AV content, for a given radius r and method k, thefollowing relationship is obtained:
AVrk
100¼ 1 − G−1
mm ×
�Gmbk þ
�2tr− t2
r2
�× ðG�
mm − GmbkÞ�
ð4Þ
It follows that if r approaches ∞, then it is possible to obtainthe well-known relationship AV versus Gmb and Gmm, whereas ifG�
mm ≈ Gmm and r approaches t, then AV approaches zero.As mentioned earlier, AVrk depends on the method, core diam-
eter, and mix type; AVk depends on the method (and on the mixtype); Gmm does not depend on the method used but does dependon the mix type; and Gmbrk depends on the method and on themix type.
From the aforementioned equations, the following relationshipbetween two estimates of AV (e.g., AVrCOR versus AVrDIM) canbe derived:
AVrCOR ¼ 100þ AVrDIM ×
�GmbrCOR
GmbrDIM
�− 100 ×GmbrCOR
GmbrDIMð5Þ
Finally, it is possible to write
AVrCOR ¼ α × AVrDIM þ β ð6ÞIt follows that if r approaches t, then AVrCOR approaches
AVrDIM, whereas if r approaches ∞, then AVCOR approachesAVDIM × ðGmbCOR=GmbDIMÞ þ ½100 − ð100 ×GmbCOR=GmbDIMÞ�.
Because 100 − ð100 × GmbCOR=GmbDIMÞ ≅ 0 the followingapproximate algorithm can be proposed:
AVrCOR ¼ α × AVrDIM ð7ÞOverall, if different radii are analyzed together, it follows that,
AVj ¼ αjk × AVk ð8Þ
For the VMA, it follows from its definition that for a 2r diametercore and a method k, VMArk can be obtained with the followingrelationship:
VMArk
100¼ 1 − ð1 − PbÞ ×Gmbrk
Gsbð9Þ
where Gsb is the bulk specific gravity of the aggregate.It follows that if r approaches t, then Gmbrk approaches
G�mm ≅ Gmm, AVapproaches 0, and VMA=100 → Vb=Vmb ≅ 1 −
½ð1 − PbÞGmm=Gsb� (minimum VMA). Similarly, if r approaches∞, then Gmbrk approaches Gmbk, AVrk approaches AVk, andVMArk approaches VMAk.
For the VFA, the following result can be obtained:
VFArk
100¼ Vbe
Vbe þ VVrk¼ VMA − Va
VMAð10Þ
It follows that if r approaches t, then VFA=100 → 1, whereas ifr approaches ∞, then VFArk approaches VFAk.
Fig. 6. HMA specimen
Table 5. Influence of Method on Results for Specific Gravity and Air-VoidContent
GmbDIMa Best ρ2 ρ2 with Eq. (3)
Coefficient ain Eq. (3)
Interceptin Eq. (3) Gmm
GmbFILM 0.985 0.985 0.951 0.126 2.588GmbCOR 0.968 0.968 0.813 0.483GmbSSD 0.898 0.898 0.643 0.923GmbFIN 0.918 0.918 0.600 1.034
AVDIMb Best ρ2
ρ2 with Eq. (8)(intercept ¼ 0)
Coefficient αjkin Eq. (8) Gmm
AVFILM 0.993 0.992 0.954 2.588AVCOR 0.985 0.962 0.824AVSSD 0.962 0.922 0.612AVFIN 0.942 0.918 0.555
Note: Also see Fig. 6.aIndependent variable.bIndependent variable.
Table 6. Core-Diameter Influence
MIX Gmm Pb t (mm) GmbDIM GmbFILM GmbCOR GmbSSD GmbFIN
PEM 1 2.696 3.8 0.381 1.845 1.877 1.959 — —PEM 2 2.641 4.8 2.523 1.883 1.924 2.026 — —EDGFC 2.545 5.2 2.520 2.128 2.167 2.256 2.312 2.322EBC 2.486 5.3 4.115 2.200 2.215 2.294 — 2.351SMA 2.550 6.4 2.561 2.013 2.031 2.120 — 2.242
Note: The t value and each Gmb value were determined as a result of aminimization.
50 / JOURNAL OF MATERIALS IN CIVIL ENGINEERING © ASCE / JANUARY 2014
J. Mater. Civ. Eng. 2014.26:45-53.

Table 7. Effects of Core Diameter on the Resulting Volumetric Parameters
MIX
AVCORrmin(mm)
AVCOR150AVCOR100
AVCORAVCOR100
AVCORAVCOR150
VMACORrmin(mm)
VMACOR150VMACOR100
VMACORVMACOR100
VMACORVMACOR150
VFACORrmin(mm)
VFACOR150VFACOR100
VFACORVFACOR100
VFACORVFACOR150
PEM 2 100 0.38 1.16 0.78 64 0.34 1.03 0.69 98 −0.45 −1.34 −0.89EDGFC 100 0.19 0.57 0.38 45 0.16 0.50 0.33 60 −0.48 −1.43 −0.95EBC 163 0.21 0.62 0.42 66 0.18 0.56 0.38 83 −0.75 −2.24 −1.49SMA 102 0.28 0.85 0.57 49 0.24 0.72 0.48 72 −0.51 −1.53 −1.01Note: PEM 1 results are not reported because of the proximity of 2r to 2 NMAS. AVCOR = air-void content, theoretically infinite diameter; AVCOR150: air-voidcontent, diameter = 150 mm, method = COR (vacuum sealing); rmin = lowest radius needed to have an error lower than 5% for a given mix and a givenreference method.
Fig. 7. Comparison among different Gmb’s
Fig. 8. Gmb, AV, VMA, VFA dependence on core radius r (COR method)
JOURNAL OF MATERIALS IN CIVIL ENGINEERING © ASCE / JANUARY 2014 / 51
J. Mater. Civ. Eng. 2014.26:45-53.
Finally, according to these equations, the effective porosity, neff ,can be estimated through the vacuum-sealing principle, and is thuslinearly related to AVrCOR.
Fig. 7 and Table 5 illustrate the relationships between specificgravities and between AV contents (equality lines are dotted).In Eq. (3), an average value of Gmm was used. Applying Eq. (4)yields determination coefficients that are identical to the highestobtained. For AV, the highest loss of explained variance (Table 5)is that of the SSD method, for which the explained variance variesfrom 96% to 92%.
Table 6 shows the dependence of specific gravity on corediameter. Fig. 8 and Table 7 show the consequences for Gmb, AV,VMA, and VFA (the vacuum-sealing method was considered). Thehighest Gmm values were obtained for PEMs (PEM 1 and PEM 2),mainly due to the petrography of aggregates (basalt), whereas thelowest Gmm was obtained for the binder course (for which the sur-face properties are not relevant). Indeed, the EBC aggregates aremainly calcareous.
Furthermore, for a given mix type, the thickness of theexternal ring diminished for lower asphalt-binder contents(Table 6). The thickness of the external ring ranged from 0.38to 4.2 mm.
Table 7 shows the lowest radius required (rmin, mm) for anerror lower than 5% for a given mix and a given reference method.The lowest diameter required (i.e., 2rmin) ranges from 90 (3.5 in.)to 326 mm (12.8 in.). Furthermore, it is evident that higher asphalt-binder contents yield thicker external rings and higher requireddiameters.
By contrast, lower asphalt-binder contents yield thinner externalrings and lower required diameters. Thus, future research shouldaddress the extent to which the different percentages of asphaltbinder (assuming other parameters such as aggregate gradation areheld constant) are related to core features (the thickness of the ex-ternal ring and its surface properties). Choosing 150-mm diametercores instead of 100-mm diameter cores results in an increase inAV (0.2–0.4), an increase in VMA (0.2–0.3), and a decrease inVFA (0.5–0.8). Further, the average error of 0.6–1.2 in AV isaltered to 0.4–0.8. As a result, the error in the estimate of VFAdecreases from 1.3–2.2 to 0.9–1.5 and the error in VMA decreasesfrom 0.5–1.0 to 0.4–0.7.
The aforementioned deviations due to the dependence on corediameter do not include those pertaining to method dependence.
If the repeatability or single-operator precision (West et al.2010) and the coring-induced bias (Table 7) are synergistically con-sidered, the following range of errors can be approximately derived(AV ¼ −0.6 to 2.4; VMA ¼ –0.3 to 1.8; VFA ¼ –3.2 to 0.0).
At the same time, for a given method and HMA type, this studyhas demonstrated that the time, cost, and defects associated withmassive sampling processes can potentially be reduced becauseof the relationship between specific gravity and diameter. Indeed,the robust on-site calibration of Eq. (4) for a given constructionwould enable reductions in the amount of material and the conse-quent costs (core miniaturization).
Conclusions
Assessing the volumetrics of HMAs is crucial to QC and QAprocedures. Such assessments enable the determination of theeconomic value of the HMA as a function of the mix bulk specificgravity, AV content, VMA, and VFA. However, the measurements(i.e., coring process and method) used to determine the specificgravity, which is the basis of the derivation of HMA volumetrics,can influence the results.
In light of these concerns, this study assessed the dependence ofthe volumetrics of HMA-wearing courses on testing and coringprocedures. To this end, a wide range of methods for the measure-ment of specific gravities was considered. Cores of the HMAswith different diameters were analyzed, together with the effectsof mix type on the properties of traditional and innovative HMAs.The modifications resulting from coring procedures were studiedboth directly (in terms of alterations to the original microtextureand macrotexture) and indirectly (in terms of the specific gravity).A model was proposed for the conversion of results obtained withdifferent methods and/or diameters.
Analyses showed that the coring process, measurement method-ology, and core diameter can substantially affect the volumetricsdetermination, and that coring processes superpose grain cuttingand mastic clogging effects on sample surfaces.
These effects mean that results of tests of HMAs can vary sig-nificantly, but their influence can be analyzed and predicted withina logical framework. In particular, the diameter of cylindricallycored samples needs to satisfy minimum requirements: 100- and150-mm diameter cylindrical specimens can result in deviationshigher than 5% in AV. Further, bulk specific gravities obtained withtest method D6752 (vacuum-sealing method) are regularly lowerthan those obtained with test methods D2726 (SSD) and AASHTOT275A (AASHTO 2007) (paraffin), and are higher than those ob-tained with test methods ASTM D1188 (ASTM 2013) (FILM) andAASHTO T269 (DIM). Importantly, the ordering of the bulk spe-cific gravities obtained with the five different methods does notdepend on mix type nor on the NMAS and specimen diameter.
Based on these results, it is possible to conclude that the effectsof the selection of testing technique are not negligible and can becritical. At the same time, results demonstrate that the cost andduration of massive coring processes, as well as other negative im-pacts (e.g., road-surface defects and environmental diseconomies),can be reduced. Further research is vital, in particular to providevery specific guidance for the derivation of volumetrics to mini-mize variation in analysis results, QC/QA consequences (accep-tance procedures, pay adjustment), and costs. Such research shouldalso examine the relationship between the percentage of asphaltbinder and core features, and enhance the spectral analysis of thelateral and upper surfaces of cores.
References
AASHTO (2007). “Standard method of test for bulk specific gravity (Gmb)of compacted hot mix asphalt (HMA) using paraffin-coated specimens.”T275-07-UL, Washington, DC.
AASHTO (2007). “Standard method of test for percent air voids in com-pacted dense and open asphalt mixtures.” T269-11-UL, Washington, DC.
AASHTO (2008). “Standard method of test for bulk specific gravity (Gmb)and density of compacted hot mix asphalt (HMA) using automaticvacuum sealing method.” T331-13-UL, Washington, DC.
AASHTO (2012). “Standard method of test for bulk specific gravity (Gmb)of compacted hot mix asphalt (HMA) using saturated surface-dry spec-imens.” T166-13-UL, Washington, DC.
Alvarez, A. E., Epps Martin, A., and Estakhri, C. (2009). “Connected airvoids content in permeable friction course mixtures.” J. Test. Eval.,37(3), 254–263.
Alvarez, A. E., Martin, A. E., and Estakhri, C. (2010). “Internal structure ofcompacted permeable friction course mixtures.” Constr. Build. Mater.,24(6), 1027–1035.
Anderson, R. M., and Bahia, H. U. (1997). “Evaluation and selection ofaggregate gradations for asphalt mixtures using Superpave.” Transpor-tation Research Record 1583, Transportation Research Board, NationalResearch Council, Washington, DC, 91–97.
52 / JOURNAL OF MATERIALS IN CIVIL ENGINEERING © ASCE / JANUARY 2014
J. Mater. Civ. Eng. 2014.26:45-53.
Asphalt Institute (1994). “Mix design methods for asphalt concrete andother hot-mix types.” 6th Ed., Lexicon, Kentucky.
ASTM (2011). “Standard test method for bulk specific gravity and densityof compacted bituminous mixtures using automatic vacuum sealingmethod.” D6752/D6752M-11, West Conshohocken, PA.
ASTM. (2011). “Standard test method for effective porosity and effectiveair voids of compacted bituminous paving mixture samples.” D7063/D7063M-11, West Conshohocken, PA.
ASTM (2012). “Standard test method for bulk specific gravity and densityof non-absorptive compacted bituminous mixtures.” D2726/D2726M-13, West Conshohocken, PA.
ASTM (2013). “Standard test method for bulk specific gravity and densityof compacted bituminous mixtures using coated samples.”D1188-07e1,West Conshohocken, PA.
Boscaino, G., Celauro, B., Celauro, C., and Amadore, A. (2009).“Evaluation of the laboratory prediction of surface properties ofbituminous mixtures.” Constr. Build. Mater., 23(2), 943–952.
Boscaino, G., and Praticò, F. G. (2001). “Classification et inventaire desindicateurs de la texture superficielle des revetements des chausses.”Bull. Lab. Ponts Chaussees, 234, 17–34, 123, 125, 127.
Brown, E. R., Hainin, M. R., Cooley, A., and Hurley, G. (2004). “Relation-ship of air voids, lift thickness, and permeability in hot mix asphaltpavements.” NCHRP Rep. 531, Transportation Research Board,Washington, DC.
Chadbourn, B. A., Skok, E. L., Newcomb, D. E., Crow, B. L., andSpindler, S. (2000). “The effect of voids in mineral aggregate (VMA)on hot-mix asphalt pavements.” Final Rep. 2000–13, Minnesota Dept.of Transportation, St. Paul, MN.
Chen, M., Lin, J., and Wu, S. (2011). “Potential of recycled fine aggregatespowder as filler in asphalt mixture.” Constr. Build. Mater., 25(10),3909–3914.
Cocurullo, A., Airey, G. D., Collop, A. C., and Sangiorgi, C. (2008).“Indirect tensile versus two-point bending fatigue testing.” Transport,161(4), 207–220.
Cooley, L. A., Brown, E. R., and Watson, D. E. (2000). “Evaluation ofOGFC mixtures containing cellulose fibers.” NCAT Rep. No. 00-05,National Center for Asphalt Technology, Auburn Univ, Auburn, AL.
CNR BU (2007). “Determinazionedellamassavolumicadeigranuli di unaggregato.” 63/78.
CNR BU (2007). “Determinazione del peso di volume di miscele diaggregatilapidei con bitume o catrame.” 40/73.
EN (2012). “Bituminous mixtures—Test methods for hot mix asphalt—Part 1: Soluble binder content.” 12697-1.
EN (2012). “Bituminous mixtures—Test methods for hot mix asphalt—Part 6: Determination of bulk density of bituminous specimens.”12697-6.
EN (2007). “Bituminous mixtures—Test method for hot mix asphalt—Part 2: Determination of particle size distribution.” 12697-2:2002+A1.
Fletcher, E., and Theron, A. J. (2011). “Performance of open gradedporous asphalt in New Zealand.” Research Rep. No. 455, New ZealandTransport Agency, Wellington, New Zealand.
Gedafa, D., Hossain, M., Ingram, L., and Kreider, R. (2012).“Performance-related specifications for PCC pavements in Kansas.”J. Mater. Civil Eng., 24(4), 479–487.
Hand, A., and Epps, A. (2000). “Effects of test variability on mixturevolumetrics and mix design verification.” J. Assoc. Asphalt PavingTechnol., 69, 635–674.
ISO. (1997). “Characterization of pavement texture by use of surface pro-files. Part 1: Determination of mean profile depth.” 13473-1, Geneva,Switzerland.
ISO. (2002). “Characterization of pavement texture by use of surfaceprofiles. Part 3: Specifications and classification of profilometers.”13473-3, Geneva, Switzerland.
ISO/CD. (2008). “Characterization of pavement texture by use of surfaceprofiles. Part 4: Spectral analysis of texture profiles.” TS 13473-4,Geneva, Switzerland.
Jackson, N. M., and Czor, L. J. (2003). “100-mm-Diameter mold used withSuperpave gyratory compactor.” J. Mater. Civil Eng., 10.1061/(ASCE)0899-1561(2003)15:1(60), 60–66.
Kandhal, P. S., and Mallick, R. B. (1998). “Open graded asphaltfriction course: State of practice.” Transportation Research CircularE-C005, Transportation Research Board, National Research Council,Washington, DC.
Kline, L. C., and Putman, B. J. (2011). “Comparison of open gradedfriction course (OGFC) mix design procedures in the United States.”Proc., of the TRB 2011 Annual Meeting, Transportation ResearchBoard, Washington, DC.
Mallick, R. B., Kandhal, P. S., Cooley, L. A., and Watson, D. E. (2000).“Design, construction, and performance of new-generation open-gradedfriction courses.” NCAT Rep. No. 2000-01, National Center for AsphaltTechnology, Auburn, AL.
Masad, E., Jandhyala, V. K., Dasgupta, N., Somadevan, N., andShashidhar, N. (2002). “Characterization of air void distribution in as-phalt mixes using X-ray computed tomography.” J. Mater. Civil Eng.,10.1061/(ASCE)0899-1561(2002)14:2(122), 122–129.
McLeod, N. W. (1956). “Relationships between density, bitumen content,and voids properties of compacted bituminous paving mixtures.”Highw. Res. Board, Proc. Annu. Meet., Highway Research Board,Washington, DC, 35.
McLeod, N. W. (1959). “Voids requirements for dense-graded bituminouspaving mixtures.” Special Technical Publication 252, ASTM, WestConshohocken, PA.
MoDOT (2008). “Specific gravity and absorption of aggregate using auto-matic vacuum sealing method.” TM 81, Jefferson City, MO.
Mohammad, L. N., Herath, A., Wu, Z., and Cooper, S. (2005). “A com-parative study of factors influencing the permeability of hot-mix asphaltmixtures.” AAPT Electronic J., 74E.
Oliveira, J. R. M., Sangiorgi, C., Fattorini, G., and Zoorob, S. E. (2009).“Investigating the fatigue performance of grouted macadams.”Proc. Inst. Civ. Eng. Transp., 162(2), 115–123.
Praticò, F. G., Casciano, A., and Tramontana, D. (2011). “Pavement life-cycle cost and asphalt binder quality: Theoretical and experimental in-vestigation.” J. Constr. Eng. Manage., 10.1061/(ASCE)CO.1943-7862.0000264, 99–107.
Praticò, F. G., and Moro, A. (2006). “Hot mix asphalts drainability andpermeability: A theoretical and experimental investigation on four dif-ferent devices.” Proc., of ICAP 10th Int. Conf. on Asphalt Pavements,International Society for Asphalt Pavements, Lino Lakes, MN.
Praticò, F. G., and Moro, A. (2007). “Permeability and volumetrics ofporous asphalt concrete: A theoretical and experimental investigation.”Road Mater. Pavement Des., 8(4), 799–817.
Praticò, F. G., and Moro, A. (2011). “In-lab and on-site measurementsof hot mix asphalt density: Convergence and divergence hypotheses.”Constr. Build. Mater., 25(2), 1065–1071.
Praticò, F. G., and Moro, A. (2012). “Measurement of air void contentin hot mix asphalts: Method and core diameter dependence.” Constr.Build. Mater., 26(1), 344–349.
Praticò, F. G., Moro, A., and Ammendola, R. (2009). “Modeling HMAbulk specific gravities: A theoretical and experimental investigation.”Int. J. Pavement Res. Technol., 2(3), 115–122.
Praticò, F. G., Moro, A., and Ammendola, R. (2010). “Potential of fireextinguisher powder as a filler in bituminous mixes.” J. Hazard. Mater.,173(1–3), 605–613.
Romanoschi, S. A., Hossain, M., Gisi, A., and Heitzman, M. (2004).“Accelerated pavement testing evaluation of the structural contributionof full-depth reclamation material stabilized with foamed asphalt.”Transportation Research Record 1896, Transportation Research Board,Washington, DC, 199–207.
Sholar, G. A., Page, G. C., Musselman, J. A., Upshaw, P. B., and Moseley,H. L. (2005). “Investigation of the CoreLok for maximum, aggregate,and bulk specific gravity tests.” Transport Research Record 1907,Transportation Research Board, Washington, DC, 135–144.
Vaiana, R. (2002). “La tecnologia laser nella caratterizzazione delle micro emacro tessitura dei rivestimenti stradali.” Strade and Autostrade, 5, 14–21.
West, R., et al. (2010). “A review of aggregate and asphalt mixture specificgravity measurements and their impacts on asphalt mix design proper-ties and mix acceptance.” FHWA-HIF-11-033, Office of PavementTechnology, Washington, DC.
JOURNAL OF MATERIALS IN CIVIL ENGINEERING © ASCE / JANUARY 2014 / 53
J. Mater. Civ. Eng. 2014.26:45-53.
Related Documents