FORMULATION OF PLANNING AND LAND-USE POLICIES FOR DISASTER MANAGEMENT IN CHITTAGONG METROPOLITAN AREA . OF BANGLADESH. UNCRD-BUET JOINT RESEARCH THESIS SUBMmED TO THE DEPARTMENT OF URBAN AND REGIONAL PLANNING IN PARTIAL FULFILMENT OF THE REQUIREMENTS FOR THE DEGREE OF MASTER OF URBAN AND REGIONAL - PLANNING (MURP) .- - ---- ._- I[ 1\\ 1111111111111111111111111111111 , #90299# L-..-- ~._... __ ... RESEARCH STUDENT: A.K.M. REZAUL KARIM DEPARTMENT OF URBAN AND REGIONAL PLANNING, BANGLADESH. UNIVERSITY OF ENGINEERING AND TECHNOLOGY (BUET), DHAKA-IOOO, BANGLADESH July, 1996

Welcome message from author
This document is posted to help you gain knowledge. Please leave a comment to let me know what you think about it! Share it to your friends and learn new things together.
Transcript

FORMULATION OF PLANNING AND LAND-USE POLICIES FORDISASTER MANAGEMENT IN CHITTAGONG METROPOLITAN AREA. OF BANGLADESH.
UNCRD-BUET JOINT RESEARCH
THESIS SUBMmED TO THE DEPARTMENT OF URBAN AND REGIONAL PLANNING IN PARTIALFULFILMENT OF THE REQUIREMENTS FOR THE DEGREE OF MASTER OF URBAN AND REGIONAL- PLANNING (MURP)
.- ----- ._-
I[ 1\\ 1111111111111111111111111111111, #90299#L-..-- ~._...__...
RESEARCH STUDENT: A.K.M. REZAUL KARIM
DEPARTMENT OF URBAN AND REGIONAL PLANNING, BANGLADESH.UNIVERSITY OF ENGINEERING AND TECHNOLOGY (BUET),DHAKA-IOOO, BANGLADESH
July, 1996
TIlESIS ACCEYfANCE FORM
FORMULATION OF PLANNING AND LAND-USE POLICIES FORDISASTER MANAGEMENT IN CHITIAGONG METROPOLITANAREA OF BANGLADESH.
BYA.K.M. REZAUL KARIM
Thesis Approved as to the style and Content by
(Dr. Mohammad A. Mohit)Associate ProfessorDepartment of Urban and Regional PlanningBUET, Dhaka.Chairman of the Committee (Supervisor)
{prof. Dr. MirHead,Departm nt ofBUET, Dhaka.Member
Urban and Regional Planning
Jt).,rw,,"" bDr. SarwarJalvinAssociate Professor,Department of Urban and Regional PlanningBUET, Dhaka.Member
-~_ .. -., -Dr. S.J. KhanFormer, Environmental Planner,UNCRD, Nagoya, Japan.Member (External)
DEPARTMENT OF URBAN AND REGIONAL PLANNING,BANGLADESHUNIVERSITY OF ENGINEERING AND TECHNOLOGY (BUET),DHAKA-IOOO, BANGLADESH.
~.~ ....~
IN MEMORY OFTHOSE PEOPLE - WHO LOST THEIR LIVES DURING THE CYCLONE ANDSTORM SURGE OF 29 APRIL 1991 ••••••••••••••••••••.••••••••

AB~CT
Bangladesh is one of the most disaster prone countries of the world. The Bayof Bengal is an ideal breeding ground for tropical cyclones which frequentlyhit the coastal areas of the country with severe disaster impacts. During aperiod of 100 years (I822c 1991) about 35 cyc lones were recorded in thecountry. Among these, the 1991 cyclone was most severe and it affected theChittagong coastal area along with the metropolitan area of the city causingunprecedented damage to life and property. The city alone suffered a loss ofUS$500 million and 1.0 million (57%) city population out of a total of 1.5million was affected.Disaster management is practiced at the national, regional and local levelsin Bangladesh. The existing system does not directly incorporate themetropolitan or city areas where OM almost remain a national responsibilityand local government has little initiative or involvement.The present study has attempted to delineate the vulnerable areas of the citybased on its land use and previous cyclone and storm surge data and suggestplanning and land use policies for disaster mitigation in the city. On thebasis of previous studies, reconnaissance survey, field visit and discussionwith local people, three vulnerable areas - high risk area (HRA), risk area(RA) and low lying areas (LLA), have been identified in the city. The land-usesurvey at the city shows that, around 29.30% of the total city area exist inthe HRA, 9.15% in the RA and 10.05% in the LLA. The city land use categoriesvulnerable to disaster in different risk areas include unplanned residential,planned residential, industrial, commercial, agricultural, unclassified areaetc.A questionnaire survey in the vulnerable area reveals that, most of therespondents are aware of disaster vulnerability of the respective areas butthey do not want to leave the same because of economic and culturalattachments. However, they are of opinion that structural measures on the partof government may reduce vulnerability of the area. It was gathered from aninterview with different utility and service agencies that, most of thedevelopment agencies have no specific plan or policy regarding disastermitigation in the city. Moreover the recent ly prepared Ch ittagong Metropo 1itanDevelopment Plan (1995), does not provide adequate policy guidelines for themitigation of natural disasters in the metropolitan area. Besides this, theChittagong Development Authority (CDA) does not exercise any policy measure,to mitigate natural disaster regarding the approval of the new developmentactivities in the city area.Land use planning and control are key factors for the orderly and safe growthof human settlements. This policy instrument can be used to control landdevelopment in vulnerable areas of the city. Thus, the study recommends someland use policies for adoption in the HRAs, RAs and LLAs of the city area.
ACKNOWLEDGEMENT
All praises belong to Allah, the most merciful, most kind andgenerous to man and his actions.
I feel immense pleasure to acknowledge my gratitude andindebtedness to Dr. Mohammad A. Mohi t, Associate Professor,Department of Urban and Regional Planning, BUET, under whosecareful supervision, constant guidance and inspiration theresearch work has been completed. I would' like to take theprivilege of expressing my deep gratitude and profound regardsto Prof. Dr. Mir' Shahidul Islam, Head, Department of Urban andRegional Planning, BUET, for encouragement, affectionate feelingsand valuable suggestions on different occasions.
I am also indebted to the Director, UNCRD for furnishing me theresearch fellowship regarding the execution of the research. Iwould like to express my indebtedness to the Vice Chancellor,Bangladesh University of Engineering and Technology, Dhaka, forallowing me the opportunity to conduct this research work.
I wish to especially thank Dr. S. I. Khan, former EnvironmentalPlanner, UNCRD, Nagoya, Japan, for initial guidance anddiscussion regarding the research work. I am also grateful to allthe teachers of URP department for their valuable suggestions atdifferent stages of this research work.
Finally, I would like to express my deep gratitude andindebtedness to my beloved parents and other family members fortheir continuous inspiration and encouragement regarding thecompletion of this research work.
ii
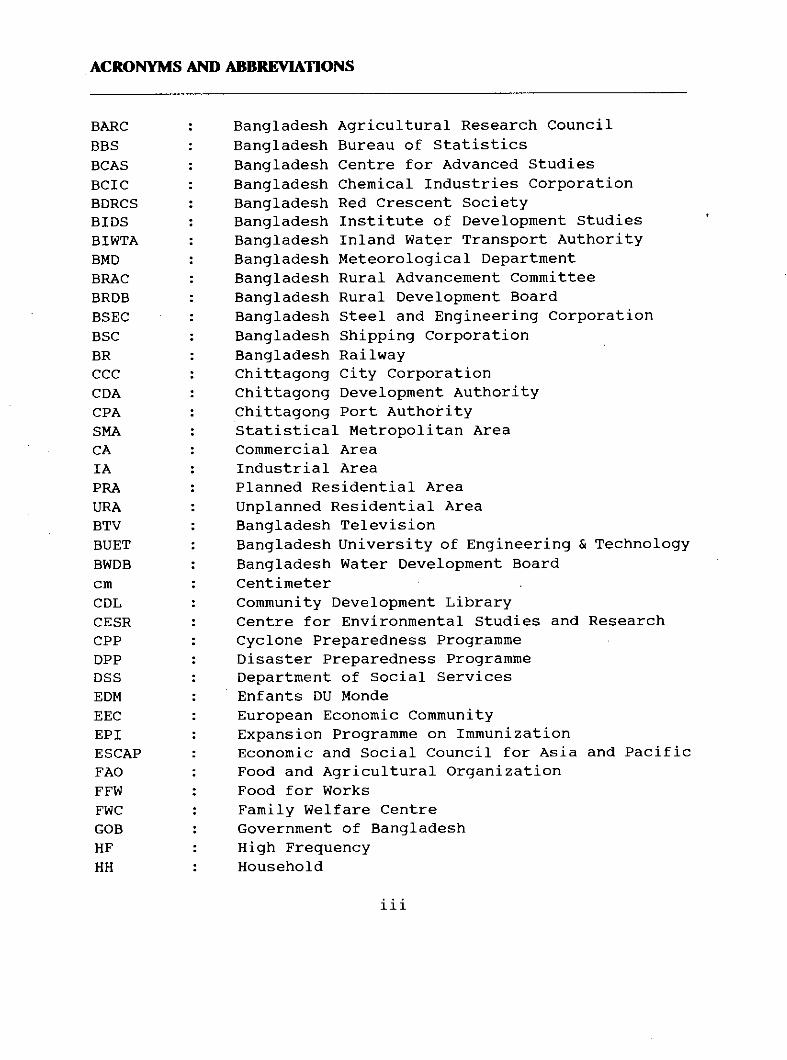
ACRONYMS AND ABBREVIATIONS
BARCBBSBCASBCICBDRCSBIDSBIWTABMDBRACBRDBBSECBSCBRCCCCDACPASMA
CAIAPRAURABTVBUETBWDBcmCDLCESRCPPDPPDSSEDMEECEPIESCAPFAOFFWFWCGOBHFHH
Bangladesh Agricultural Research CouncilBangladesh Bureau of statisticsBangladesh Centre for Advanced studiesBangladesh Chemical Industries CorporationBangladesh Red Crescent SocietyBangladesh Institute of Development StudiesBangladesh Inland Water Transport AuthorityBangladesh Meteorological DepartmentBangladesh Rural Advancement CommitteeBangladesh Rural Development BoardBangladesh Steel and Engineering CorporationBangladesh Shipping CorporationBangladesh RailwayChittagong city Corporationchittagong Development Authoritychittagong Port AuthorityStatistical Metropolitan AreaCommercial AreaIndustrial AreaPlanned Residential AreaUnplanned Residential AreaBangladesh TelevisionBangladesh University of Engineering & TechnologyBangladesh Water Development Boardcentimetercommunity Development LibraryCentre for Environmental Studies and ResearchCyclone Preparedness ProgrammeDisaster Preparedness ProgrammeDepartment of social ServicesEnfants DU MondeEuropean Economic CommunityExpansion Programme on ImmunizationEconomic and Social Council for Asia and PacificFood and Agricultural OrganizationFood for WorksFamily Welfare CentreGovernment of BangladeshHigh FrequencyHousehold
iii

HQHRAlABIDAIEBinkmKPHLGEDLLAMCSPmmmmphMRA
MSLNGOO&MPHCPWDRARCCRHDSDCSDRSWCsq.ft/sftsq.kmsq.mTPUNCRDUNDPUNDROUNEPUNESCO
UAUPURCVHFWBWMO
HeadquarterHigh Risk AreaInstitute of Architects, BangladeshInternational Development AssociationInstitution of Engineers, BangladeshinchkilometerKilometer Per HourL~cal Government Engineering DepartmentLow Lying AreaMultipurpose Cyclone Shelter Programmemetremillimetermile per hourModerate Risk AreaMean Sea LevelNon-Government Organizationoperation and MaintenancePrimary Health CarePublic Works DepartmentRisk areaReinforced Cement ConcreteRoads and High Ways DepartmentStorm Warning CentreSwiss Disaster ReliefStorm Warning CentreSquare footSquare kilometerSquare metreThana Parishadunited Nations Centre for Regional DevelopmentUnited Nations Development Programmeunited Nations Disaster Relief Coordinatorunited Nations Environment Programmeunited Nations Educational, Scientific & CulturalOrganizationUnclassified AreaUnion ParishadUniversities Research Centrevery High FrequencyWorld BankWorld Meteorological Organization
iv
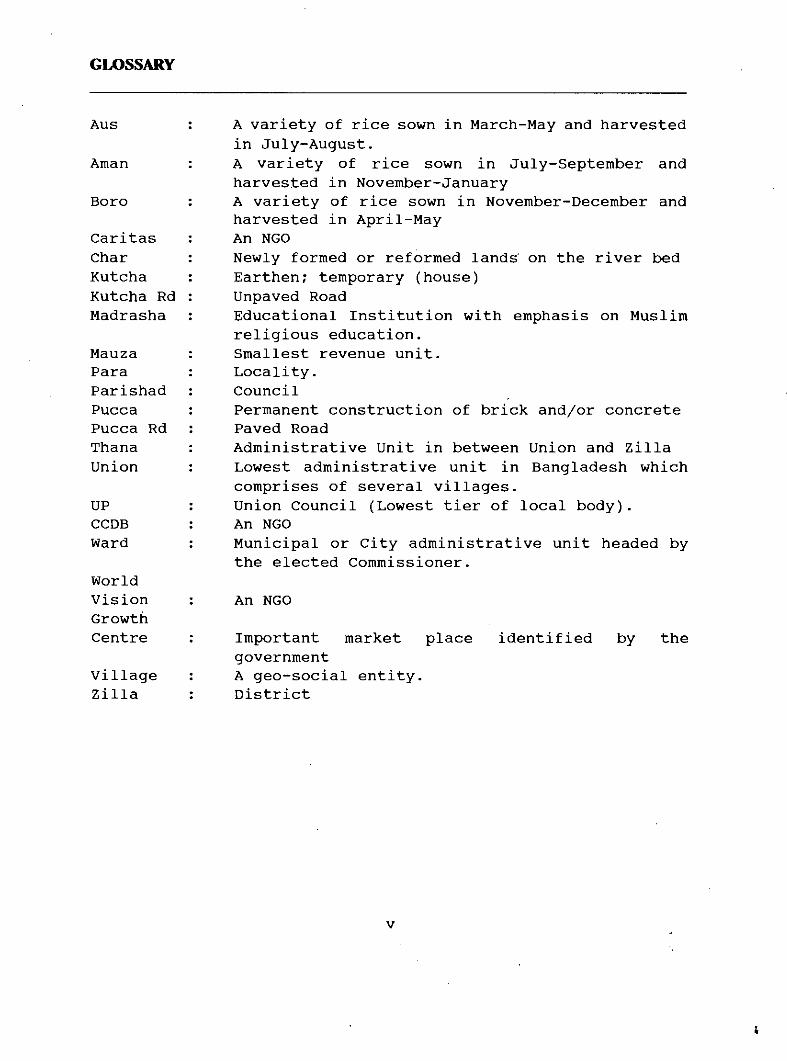
GLOSSARY
Aus
Aman
Boro
CaritasCharKutchaKutcha RdMadrasha
MauzaParaParishadPuccaPucca RdThanaUnion
UPCCDBWard
A variety of rice sown in March-May and harvestedin July-August.A variety of rice sown in July-September andharvested in November-JanuaryA variety of rice sown in November-December andharvested in April-MayAn NGONewly formed or reformed lands' on the river bedEarthen; temporary (house)Unpaved RoadEducational Institution with emphasis on Muslimreligious education.Smallest revenue unit.Locality.CouncilPermanent construction of brick and/or concretePaved RoadAdministrative Unit in between Union and ZillaLowest administrative unit in Bangladesh whichcomprises of several villages.Union Council (Lowest tier of local body).An NGOMunicipal or City administrative unit headed bythe elected Commissioner.
WorldVisionGrowthCentre
Villagezilla
An NGO
Important market placegovernmentA geo-social entity.District
v
identified by the
I
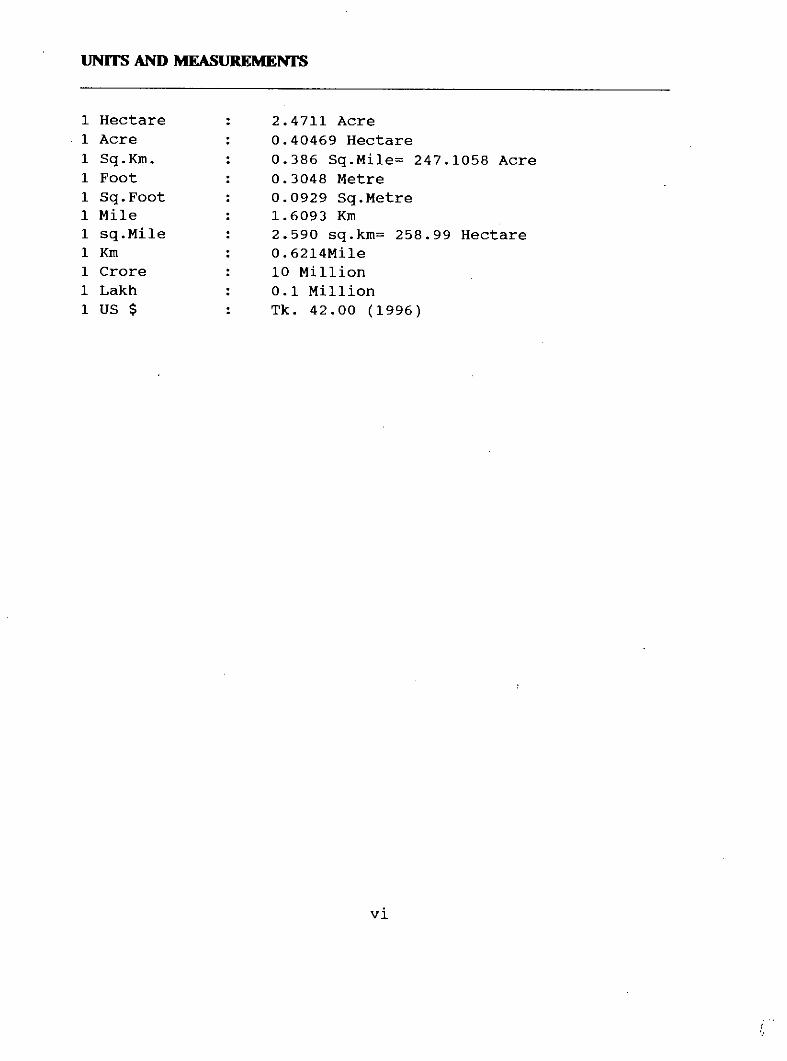
UNITS AND MEASUREMENTS
1 Hectare1 Acre1 Sq.Km.1 Foot1 Sq.Foot1 Mile1 sq.Mi1e1 Km1 Crore1 Lakh1 US $
2.4711 Acre0.40469 Hectare0.386 Sq.Mile= 247.1058 Acre0.3048 Metre0.0929 Sq.Metre1.6093 Km2.590 sq.km= 258.99 Hectare0.6214Mile10 Million0.1 MillionTk. 42.00 (1996)
vi
,"
CONTENTS
ABSTRACTACKNOWLEDGEMENTACRONYMS AND ABBREVIATIONSGLOSSARYUNITS AND MEASUREMENTSCONTENTSLIST OF TABLESLIST OF FIGURES
CHAPfERONEINTReDUCflON
Page No.
iiiiiiivv
viiviii
xi
1.11.21.2.11.2.21.2.31.2.41.2.5
1.31.41:51.5.11.5.21.5.31.5.4
1.5.51.5.61.5.7
1.5.8
1.5.91. 5 .101.61.7
Background of the Study ~Cyclones in the Bay of BengalPrevious Cyclonic Storms (1822-1991)Vulnerable areas to Cyclone DisasterMonthly Distribution of cyclonesThe Great cyclone of 1991Damages Inflected by the 1991 Cyclonein the CityRationale of the StudyObjectives of the ResearchMethodology of the StudyLiterature SurveyData CollectionLand-use InvestigationIdentification of the Affected Areasin the 1991 CyclonePreparation of MapsIdentification of the Risk AreasHousehold Survey in the VulnerableArea (HRA and RA)Interview of the Utility Service andcity Development Agency OfficialsTerminologies UsedExisting Planning Principles in the cityLimitations of the Study.Organization of the Research
vii
131123262636
404141414242
424343
43
4444464748
CHAPfERlWOPHYSICAL AND SOCIQ-ECONOMIC PROnLE OF THE sruDY AREA
2.12.22.2.12.2.22.2.32.2.42.32.3.12.3.22.3.3
2.3.42.3.52.3.62.3.72.3.82.3.9
2.3.102.4.
IntroductionPhysical and Administrative ProfileAdministrative unitsLocational CharacterPhysical FeaturesSoil and TopographySocio-economic ProfileSettlement PatternGeneral Life style of the PeoplePopulation and Attributes
population DensityPopulation Distribution by Sex and AgeFamily Size and TypeReligionLiteracyoccupation and Income
Vegetation in the Study AreaMajor Economic ActivitiesNature of Local MarketsNature of Housing StockWater Bodies and their UseNature of Agricultural Practice inthe Study AreaDrinking Water and SanitationSummary.
505555575861636364656669727274747576798082
838486
CHAPfER THREEDISASTER MANAGEMENT IN BANGLADESH
3.1 Introduction 873.2 Concept of Disaster 873.3 Concept of Disaster Management 893.4 Different Phases of Disaster Management 903.5 Disaster Management in Bangladesh 993.6 Disaster Management in the 1961
Chittagong Master Plan 1003.7 Disaster Management in Chittagong
Structure Plan-1994 1013.8 Summary 104
viii
CHAYfER FOUREXlSI1NG LAND-USE PATTERN AND DlSASfER VULNERABILI1Y OF TIlEsruDY AREA
4.14.24.34.44.54.64.74.84.94.104.11
Introduction.Land Level and Level of Surge InundationDelineation of the Vulnerable Areas in the cityLand-use PatternMajor Public Establishments in the Study AreaCommercial and Business ActivitiesSocial Infrastructure in the Study AreaPhysical Infrastructure in the Study AreaLand-use Vulnerable to Storm Surgeutility and Services in the Study AreaSummary
105106108127137140143143145149155
CHAYfER FIVECOMMUNI1Y RESPONSE TO DlSASfER VULNERABILI1YAND ITS MANAGEMENT
5.15.2
5.3
5.4
IntroductionReactions of the Disaster AffectedPeople in the Vulnerable AreaReactions of the utility Agencies andcity Development Authorities about DM MeasuresSummary
156
156
172176
CHAYfERSIXLAND USE PLANNING AND DISASfER MmGAll0N
6.16.26.36.4
6.4.1
IntroductionLand-use PlanningLand-use ComponentsLand Use Policies and Mitigationof Disaster LossAdministration of Land Policies
Decentralized AdministrationCentralized Authority
viii
177177179
179179179180
6.4.2
6.4.3.
6.4.4
6.4.5
6.5.
Legal ControlZoning ControlLand-use Macro ZoningLand-use Micro-zoningSubdivision RegulationConstruction or Location PermitOpen Space ControlBuilding CodesLand Readjustment
Fiscal and Financial IncentivesTaxationNon-Profit Imitated Dividend CompaniesGovernment Guarantee on Development BondsInsurance and Mortgage Policies
Direct Government ActionPublic AcquisitionExpropriation and Pre-emptionPurchase of Development RightsFinancing Public Land Acquisition
Public Land DevelopmentSecondary Centres and New Towns.Provision of Infrastructure and Housing
Summary
181181181182182183183184184185185187188188189189190191191192192193195
CHAPTER SEVENCONCLUSIONS AND RECOMMENDATIONS
7.17.27.3
APPENDICES
IntroductionConclusionsPolicy Recommendations
196196201
Appendix - IAppendix - IIAppendix - III:
BibliographySample Survey QuestionnaireSupplementary Tables
ix
216218221
usr OF TABLES
Table 1.1
Table 1.2
Table 1.3
Table 1.4
Table 1.5
Table 1.6
Table 1.7
Table 1.8
Table 1.9
Tab. 1.10
Table 2.1
Table 2.2
Table 2.4
Table 2.5
Table 2.6
Table 2.7
Table 2.8
Table 2.9
Page No.
Loss of Human Life by Tropical CycloneDisasters in the Bay of Bengal
Previous Cyclones and storm Surges(1822-1991) with Maximum Wind Speed,Surge Height and Death Toll.
Damages and Loss of Lives and Livestockin 1960 Cyclone
List of Recent Cyclones Showing LandfallAreas
Monthly Distribution of TropicalCyclones in the Bay of Bengal
Death Toll in Some Cyclones in Bangladesh.
Comparison of Damage due toCyclones of 1970 and 1991.
Estimated Damage and Loss of Chittagongcity due to Cyclone of 29 April 1991.
Cyclone Damage to National Economy
Damage to the Agriculture Sector
Growth and Distribution of NationalUrban Population Growth
Characteristics of the Existing Population
Percentage of Different ReligionsGroups in the City
Households in Dwelling unitsby Main Source of Income
Population 10 Years and Overby Main Activity
Working People Engaged in DifferentActivities
Material of Roof of Main House
Existing Condition of Dwelling in theCity Area
5
13
19
22
26
28
36
37
38
39
65
66
74
75
75
79
80
82
..,:!P~-'.1>"0,
••• •••~ ~

Tab. 2.10
Table 4.1
Table 4.1A
x
Drinking Water and sanitary Conditionin the Study Area.
Types of Land with Different Land Level.
Chittagong City Corporation (CCC)Wardwise Damage Report (Damage ReportDated June 30,1991).
84
106
122
Table 4.2
Table 4.3
Table 5.1
Table 5.2
Table 5.3
Table 5.4
Table 5.5
Table 5.6
Different Land-use Categories (ShowingRisk and Risk Free Areas)in the City. 130
Percentage of Individual Land-use inDifferent Risk Areas 131
Sources of Cyclone Warnings Received bythe Different Groups of People in theHRA. 157
Sources of Cyclone Warnings Received bythe Different Groups of People in the RA. 157
Response of Different Groups of People WhoStayed in Their Houses During Cyclone inthe HRA. 158
Response of Different Groups of People WhoStayed in Their Houses During Cyclone inthe RA. 159
Experience of Different Groups of Peoplein the HRA about Their Way of SurvivalFrom the Surge inundation. 159
Experience of Different Groups of Peoplein the HRA about Their Way of SurvivalFrom the Surge Inundation. . 160
Table 5.7
Table 5.8
Table 5.9
Table 5.10
Experience of Afected People in the HRAabout Level of Surge Inundation InsideTheirHouses During 1991 CycloneExperience of Afected People in the RAabout Level of Surge Inundation InsideTheir Houses During 1991 Cyclone
Reponse of Different Groups of People inthe HRA about Damage Caused by the 1991Cyclone
Reponse of Different Groups of People inthe RA about Damage Caused by the 1991Cyclone
xi
161
162
162
~.,
Table 5.11
Table 5.12
Table 5.13
Table 5.14
Table 5.15
Opinion of Different Groups of People inthe HRA Regarding Vulnerability of theArea.
Opinion of Different Groups of People inthe RA Regarding Vulnerability of theArea.
opinion of Different Groups of People inthe HRA about their Future Settlement inthe Area.
Opinion of Different Groups of People inthe RA about their Future Settlement inthe Area.
Response of Different Groups of People inthe HRA about the Reasons Which Enabledthem to stay in the Vulnerable Area.
164
164
165
166
167
Table 5.16 Response of Different Groups of People inthe RA about the Reasons Which Enabled themto stay in the Vulnerable Area. 168
Table 5.17
Table 5.18
Table 5.19
Table 5.20
Opinion of Different Groups of People inthe HRA about Disasters Impact ReductionMeasures.
Opinion of Different Groups of People inthe RA about Disasters Impact ReductionMeasures.
Suggestions of Different Groups of Peoplein the HRA regarding Disasters Preventionand Mitigation Measures in the VulnerableArea.Suggestions of Different Groups of Peoplein the RA regarding Disasters Preventionand Mitigation Measures in the VulnerableArea.
xii
169
170
171
171
L1Sf OF nGURES
Figure 1.1Figure 1.2Figure 1.3
Figure 1.4
,Figure 1.5
Figure 1.6Figure 1.7
Figure 1.8Figure 1.9
Page No.Areas Affected by Cyclone 2Affected Area Under April Cyclone of 1991 4Contours of Land Elevation in theCoastal Region of Bangladesh 6Diagrammatic Conception of a Cyclonic stormand Swelling of Sea Surface in Deep Sea. 8picture of Eye of the Storm Taken from theSatellite 10cyclone Tracts of the country 12Delineation of Risk Zone (After SwissDisaster Relief in Bangladesh, 1987) 24Delineation of Risk Zone (After MCSP, 1992) 25Occurrence of 35 Major Cyclonesin Bangladesh 27
Figure 2.10
Figure 2.3Figure 2.4
Figure 3.1Figure 3.2Figure 3.3
Figure 2.11Figure 2.12Figure 2.13Figure 2.14 85
889697
73
77
78
81
71
566267
6870
53
54
51Headquarters of Bangladeshin the Context ofDistrict
Growth Pattern of the study AreaAdministrative units Under ChittagongCity AreaContour Map of Bangladesh.population Density in the city Areapopulation Density in the Chittagong SMApopulation Distribution by Age and SexDifferent Age Groups and DisasterVulnerabilityDifferent Religious Groups in thestudy AreaExisting Industrial Areas in the cityExisting Commercial Areas in the CityDwelling with Roof MaterialDrinking Water and Sanitary Facilityin the CityMain Phasee and Activities in DMActivities During Different Phases of DMPeripherial Expansion Areas
study AreaChittagong
Divisional2.12.2
Figure 2.5Figure 2.6Figure 2.7Figure 2.8Figure 2.9
FigureFigure
xiii
Figure 3.4 Models of Government Administrationfor Risk Reduction
103
Figure 4.1Figure 4.2Figure 4.3Figure 4.4Figure 4.5
Figure 4.6
Figure 4.7
Elevation Difference of Chittagong cityInundated Areas - 1991 CycloneFlooded Areas of Monsoon PeriodsAffected city Wards in the 1991 CycloneDelineation of Risk Zones in ChittagongCity for 10 years Return Period.Delineation of Risk Zones in,ChittagongCity For 20 years Return per+od.Delineation of Risk zones in ChittagongCity for 50 years Return Period.
107109110113
114
115
117
Development Zones 120
in ChittagongPeriod.
150151153154155
146147148
144
142
139141
121
118
128132134138
the city.chittagong
Existing Commercial Areas in the CityLocations of Hat/Bazar and ShoppingCentres in the CityLocations of Recreational Facilities inthe CityLocation 9f Prima~y Schools and cycloneShelters ln the CltyMajor Road Nework in the CityRailway Owned Land in the CityBanglades~ Water gevelopment BoardProJects ln the CltyElectric Supply in the city AreaWater Supply in the cityGas supply in the City AreaGarbage Disposal in the City
Existing Land-use Pattern ofcityThe Urban AreaLocation of Squatter Settlements in CityExisting Industrial Areas in the CityLocation of Major Public Buildingsin the city
Delineation of Risk ZonesCity for 100 years ReturnSpecial Control Zones- NoDelineation of Risk Areas in
Figure 4.19
Figure 4.16Figure 4.17
Figure 4.23Figure 4.24Figure 4.25Figure 4.26
Figure 4.20Figure 4.21Figure 4.22
Figure 4.18
Figure 4.12Figure 4.13Figure 4.14Figure 4.15
Figure 'I.9Figure 4.10Figure 4.11
Figure 4.8
xiv
(,
-••....
. .'. ,.. .•.~- '.- ~:-- ....,. .,..-'
.-- ~".---- -. - -,>0.- -
i ,.... '.
.( --_ .c ..~_. '- - ....""C_ 'n 4 ~
, . ,.ot ...., .
. '.
CHAPTER ONE
IIiTIODUCTIOIL

CHAPTER ONE
INTRODUcnON
1.1 Background or the Study
Rapid urbanization and the increase of population in thehazardous areas are matters of growing concern. Concentration ofpopulation and human activities contribute to heavier loss oflife and mounting costs of disaster damage, particularly in lowincome slum and squatter settlements in the urban areas ofdeveloping countries like Bangladesh.
Disaster management in Metropolitan areas is almost absent inBangladesh. Conventional metropolitan or urban planing so farpracticed in the country is not well focussed to mitigate thecommon natural disasters. About 100 urban centres exist alongthe coastal areas of Bangladesh and almost all the urban centresare vulnerable to cyclone and storm surges. The port city ofChittagong which is an important industrial and business centreof the country was hit by severe cyclones and storm surges in1985 and 1991 along with the coastal areas and offshore islands.The 1991 cyclone was unprecedented because of its wind speed (235km./hr.) which surpassed all previous records and damages tolives and properties were wide spread and colossal. During thecyclone the height of the storm surge was estimated to be about8-10 meters. Massive damages were inflicted to the variousproductive and economic assets including 1017 human deaths in thecity. The industrial sector which mostly exists in the citysuffered heavily with a damage of about 388 million us dollars.This includes chittagong Export Processing Zone (CEPZ), publicand private sector industries of the city. Almost 1.076 millionpeople were affected out of a total of 1.5 million people livingwithin the city boundary of Chittagong covering an area of about160 sq. km. Moreover 75,495 houses were totally destroyed leaving2,17,300 households affected by the cyclone and storm surge.During the disaster the crop damage of around 2368.84 hectaresoccurred in the city area. Besides this, out of 20 severecyclones which crossed the Bangladesh coast after 1876, 13 ofthese cyclones hit the Chittagong coastal area causing greatdamage to life and property (Table 1.4).
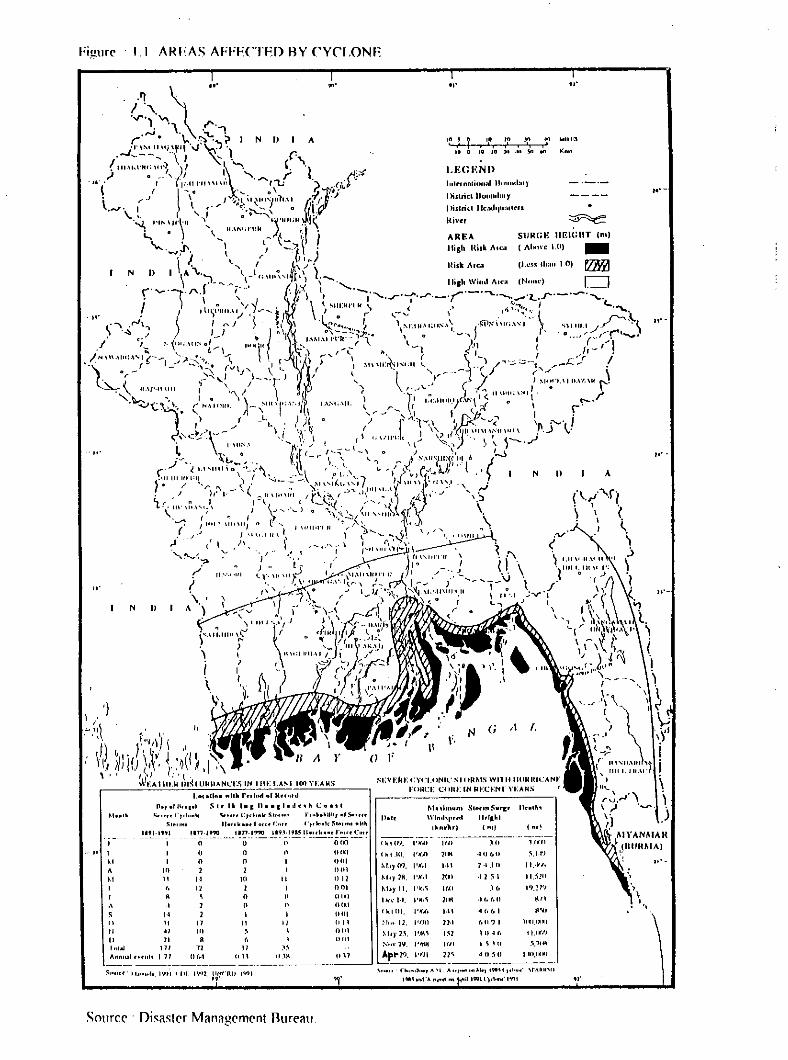
1.1 AHFAS AFFECTED HV CVCI .ONE
,,'-
,.' -
,.' -
,,'
I>N
f.
~.I,rJ
1,rHl
I••,.'
G
',0 J~ J:: ,~In.'0 I'D t, .MI '>0 ""
2.1.111 11..\(1. 11'-
.Il ~I IUll1
.11, I').!").11. I,ll '">l1,{,1 ""loll') I 111),(~.1
llJ.lf, 11,01'.'1
1 \ 111 .~.Jltl
411 HI 11l1.U_'
,'He,1I
StnrmSIlrr:''lfr •.hl( ...,
".
l.EG I.:NI>
l(JI
WI
".1.11
21-1
I~l
lUI
".HI
M.,I" •••",WI ••d'I, •• <I
(."""<1
1'••.•'j'l{,(,
1'lm
I'JiIl
I'K~1
I'K.I
I'X',l
1'l(,~
:-.:"v 2\1. I'llm 101
Apl"2'1. l~~" _
I 10.1 V).
'''I.ln.:-r,.ym,M"y 21\,
I\by 11,
110."'1.1.
(kllll,
Sl-:n:lu: CYCLtlNW Sl ORI\I.'i WIlII IItiHlllCANrnIHCI-; ClIIU: IN RtTHfl" n:AIlS
tin
I>
I.••ull •••"hll r.Il,'"' "I H.""d110,.111",01 Stt'. l_llI,.,I.d •• h c ••o.t
So •••• l-"I"ftw So•••• t:,,~,.k~'O"ft' 1', "hhUII, 01 s...".S'Mm. Ir.,,~••• l 0'<' c".. '"1''''.'<Sl"' ••••• .,,,
IItl.'''1 1I1J.19?O un.19?O 1'9.'.:I~ ~'~~~~E~'CU'!I 0 0 () omI (l 0 n tH~1I 0 0 I Otll
10 1 2 , IlIll" I-I 10 II OilI, 11 2 I 001II ~ 0 II n ,,)I 2 0 n tlill
l-I 2 I I tlUIII 11 n II 11 OilII .II III :; , (llilII 11 II (, I UIl1
1",.01 17/ 12 J1 ~~"n .•,~' ••• ,,', 11/ U(.1 CI~l 0.111
,-- 10 1
"A",,.,S
~"'." n ••• ,' •••, A 'I, 'A ")'_"" ~lo,t9ll\t I.' ••••. \rA~~'"
19II~ •••1.J. ••••••• '"' t~;.111911),1 •.,,' "f)l
Source Disaster Management Rureau
3
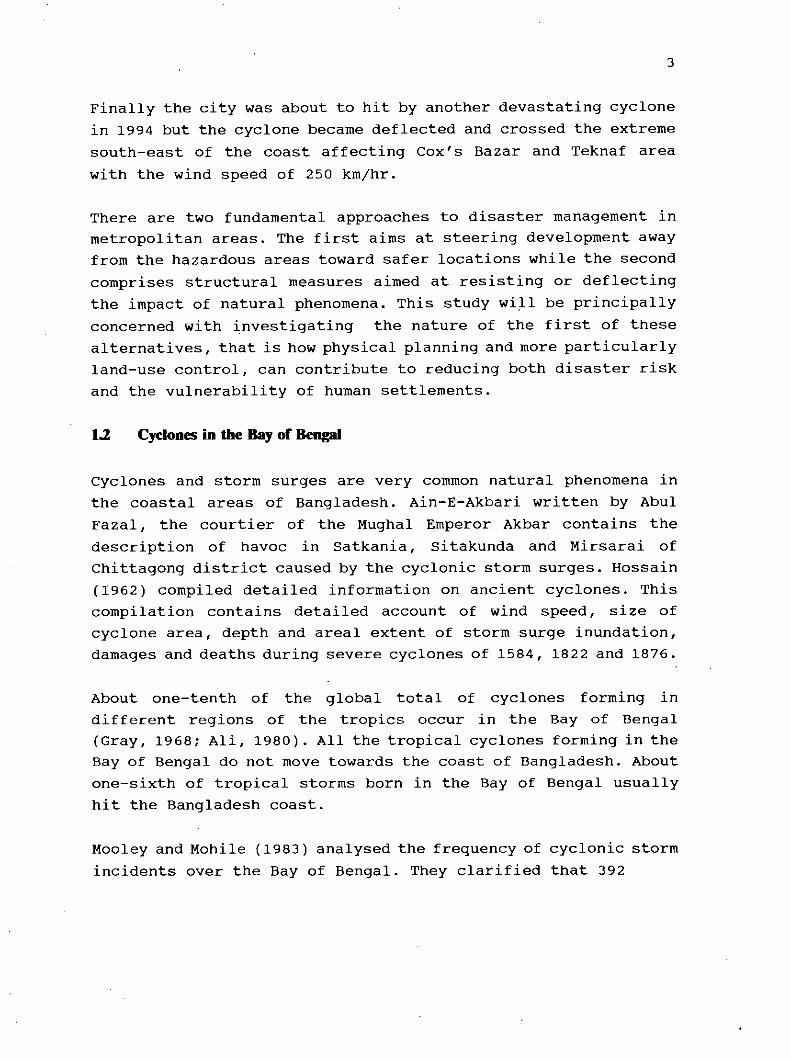
Finally the city was about to hit by another devastating cyclonein 1994 but the cyclone became deflected and crossed the extremesouth-east of the coast affecting Cox's Bazar and Teknaf areawith the wind speed of 250 kmjhr.
There are two fundamental approaches to disaster management inmetropolitan areas. The first aims at steering development awayfrom the hazardous areas toward safer locations while the secondcomprises structural measures aimed at resisting or deflectingthe impact of natural phenomena. This study will be principallyconcerned with investigating the nature of the first of thesealternatives, that is how physical planning and more particularlyland-use control, can contribute to reducing both disaster riskand the vulnerability of human settlements.
1.2 Cyclones in the Bay of Bengal
cyclones and storm surges are very common natural phenomena inthe coastal areas of Bangladesh. Ain-E-Akbari written by AbulFazal, the courtier of the Mughal Emperor Akbar contains thedescription of havoc in Satkania, sitakunda and Mirsarai ofChittagong district caused by the cyclonic storm surges. Hossain(1962) compiled detailed information on ancient cyclones. Thiscompilation contains detailed account of wind speed, size ofcyclone area, depth and areal extent of storm surge inundation,damages and deaths during severe cyclones of 1584, 1822 and 1876.
About one-tenth of the global total of cyclones forming indifferent regions of the tropics occur in the Bay of Bengal(Gray, 1968; Ali, 1980). All the tropical cyclones forming in theBay of Bengal do not move towards the coast of Bangladesh. Aboutone-sixth of tropical storms born in the Bay of Bengal usuallyhit the Bangladesh coast.
Mooley and Mohile (1983) analysed the frequency of cyclonic stormincidents over the Bay of Bengal. They clarified that 392
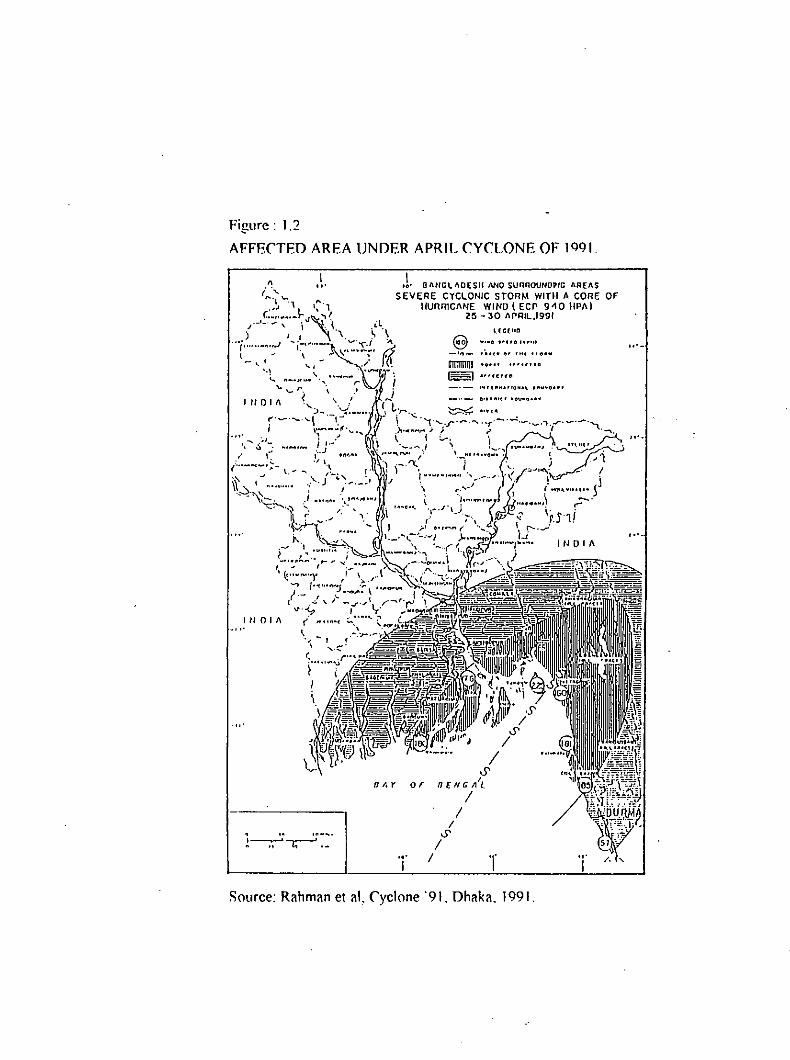
Figure: 1.2
AFFECTED AREA UNDER APRIL CYCLONE OF 1991 .
.1. BMIGL/\OESIi lIND SUllRQUNO"G AREASSEVERE CYCLONIC STORM WITH A conE or
HURmCANE WINO (ECr 9-10 IIPI\)2!5 - 30 h1"'RIL,199/
I..'
I tl 0 I f\
• to , •••••••
l--;;-' l;--' ._
nAY or
T
l(c("n8 "'_0 ,- •• " •••••,_4 ••_ , •••••••• "" •••••••
urnnmn •••••• •• •• C"D1--) '''reH''
' ••• f •••• r"'u~ •••••••0•••O'••••,e. '0"""''''
T
,,'-
/,".
P".
Source: Rahman et al. Cyclone '91. Dhaka. 1991.
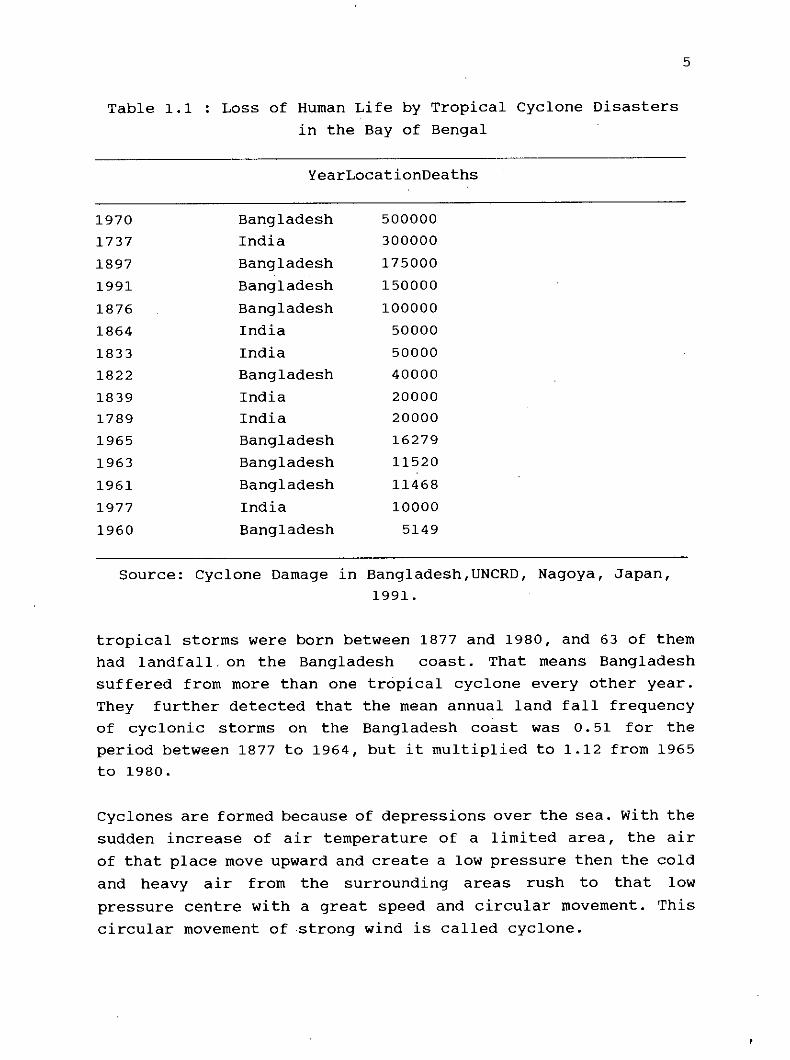
Table 1.1 Loss of Human Life by Tropical Cyclone Disastersin the Bay of Bengal
YearLocationDeaths
5
1970 Bangladesh 5000001737 India 3000001897 Bangladesh 1750001991 Bangladesh 1500001876 Bangladesh 1000001864 India 500001833 India 500001822 Bangladesh 400001839 India 200001789 India 200001965 Bangladesh 162791963 Bangladesh 115201961 Bangladesh 114681977 India 100001960 Bangladesh 5149
Source: Cyclone Damage in Bangladesh,UNCRD, Nagoya, Japan,1991.
tropical storms were born between 1877 and 1980, and 63 of themhad landfall _on the Bangladesh coast. That means Bangladeshsuffered from more than one tropical cyclone every other year.They further detected that the mean annual land fall frequencyof cyclonic storms on the Bangladesh coast was 0.51 for theperiod between 1877 to 1964, but it multiplied to 1.12 from 1965to 1980.
cyclones are formed because of depressions over the sea. with thesudden increase of air temperature of a limited area, the airof that place move upward and create a low pressure then the coldand heavy air from the surrounding areas rush to that lowpressure centre with a great speed and circular movement. Thiscircular movement of -strong wind is called cyclone.
Figure . 1.~
CONTOURS OF LAND ELEVATION IN THE COASTAL REGION OF BANGLADESH ANDDEPTH CONTOUR OF THE BENGAL CONTINENTAL SHELF
,,'
ItlOlA
,.'
-_.-- -
-II", .
..__ f.: ~
..,,- '>'\. '; \100,",U'J\ '-:', •.••.•.•, ~O:' ::II" ~Z"
_____~L __L...:•...__,._~ ~~. ~•. . L. . L
,,'
,,'
S()lIrce MCSP, Dr~ft Fin~l Report. V()!ume IV. 1992.
7
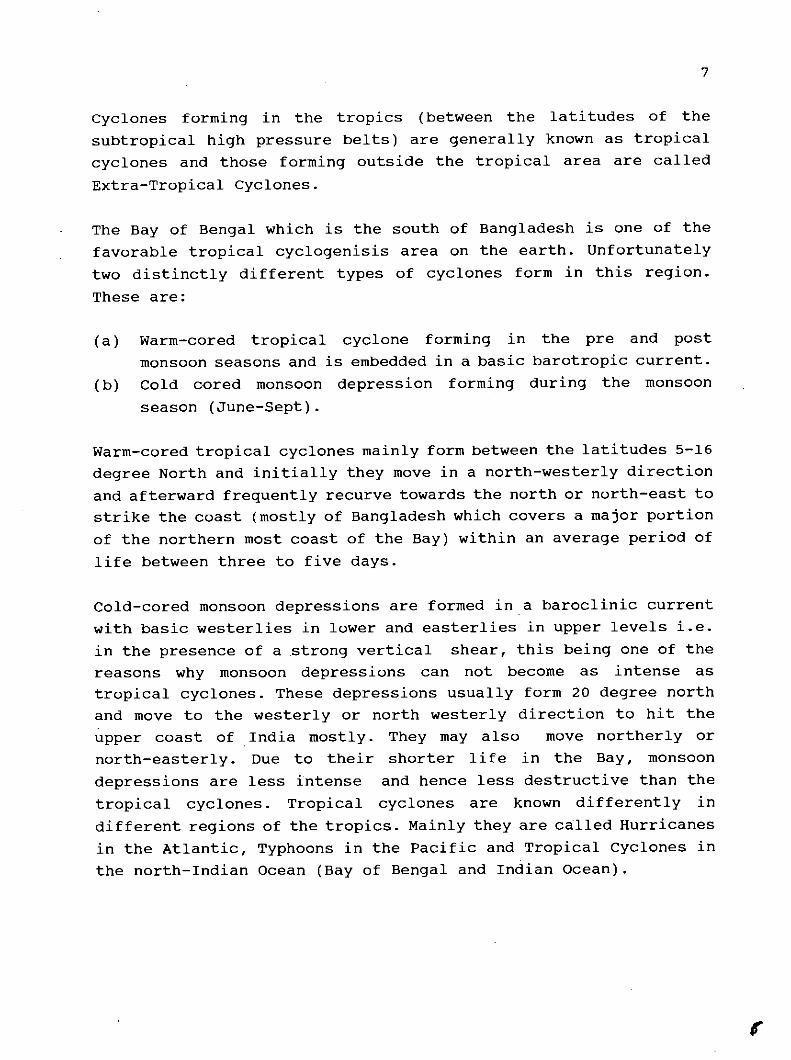
cyclones forming in the tropics (between the latitudes of thesubtropical high pressure belts) are generally known as tropicalcyclones and those forming outside the tropical area are calledExtra-Tropical Cyclones.
The Bay of Bengal which is the south of Bangladesh is one of thefavorable tropical cyclogenisis area on the earth. Unfortunatelytwo distinctly different types of cyclones form in this region.These are:
(a) Warm-cored tropical cyclone forming in the pre and postmonsoon seasons and is embedded in a basic barotropic current.
(b) Cold cored monsoon depression forming during the monsoonseason (June-Sept).
Warm-cored tropical cyclones mainly form between the latitudes 5-16degree North and initially they move in a north-westerly directionand afterward frequently recurve towards the north or north-east tostrike the coast (mostly of Bangladesh which covers a major portionof the northern most coast of the Bay) within an average period oflife between three to five days.
Cold-cored monsoon depressions are formed in a baroclinic currentwith basic westerlies in lower and easterlies in upper levels i.e.in the presence of a strong vertical shear, this being one of thereasons why monsoon depressions can not become as intense astropical cyclones. These depressions usually form 20 degree northand move to the westerly or north westerly direction to hit theupper coast of .India mostly. They may also move northerly ornorth-easterly. Due to their shorter life in the Bay, monsoondepressions are less intense and hence less destructive than thetropical cyclones. Tropical cyclones are known differently indifferent regions of the tropics. Mainly they are called Hurricanesin the Atlantic, Typhoons in the Pacific and Tropical cyclones inthe north-Indian Ocean (Bay of Bengal and Indian Ocean).
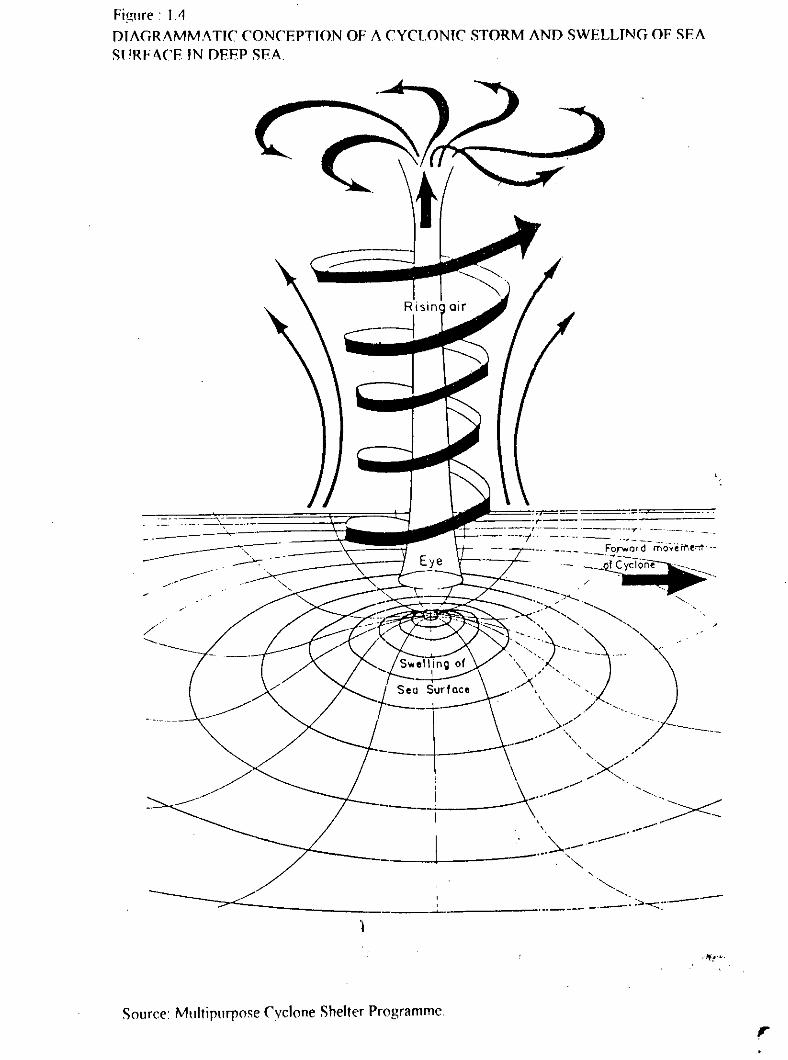
Figllfe . I."DIAGRAMMATIC CONCEPTION OF A CYCLONIC STORM AND SWELLING OF SEASURFACE IN OEEP SEA.
- """'-.'-.....-;> z_______ ' .... ._: ;;;;.-=::::: .. _---~
Source: Multipurpose Cyclone Shelter Programme ,

9
Tropical cyclones are shorter lived than hurricanes and typhoons.The average life period of tropical cyclone is 9 days in theAtlantic, and about a week in the Pacific.
Hence cyclones in the Bay of Bengal are likely to be less intensethan those in the Pacific and in the Atlantic. Moreover, tropicalcyclones are less frequent in the Bay compared to some othertropical regions of the earth.
Formation: Tropical cyclones generally form between the latitudes5-16 degree north near the Andaman Nikkobar islands in the Bayof Bengal just before monsoon (May) and end of the monsoon(October-November).
Duration : The cyclone may cross the coastal area after one weekof its formation, or it may cross within one or two days.Sometimes it stays at a place for one or two days. A maturecyclone usually move at a speed of 16-25 km. hr.
Eye of the cyclone: The area at the centre where the wind speedis zero or very little is called the eye of the cyclone. Thediameter of the 'eye' varies from 15 miles to 40 miles.
Classification: Cyclones are presently classified according totheir intensity and the following nomenclature is in use(Ohiduzzaman, 1993):
(a) Depression: Wind upto 62 km/hour(b) Cyclonic Storm: wind from 63-87 km(hour(c) Severe Cyclonic Storm: wind 88-118 km/hour(d) Severe Cyclonic Storm of Hurricane intensity: Wind
above 118 km/hour
The intensityNational Storm
or severity of cyclone is determined byWarning Centre from the number of isobars.
the
. ,\"
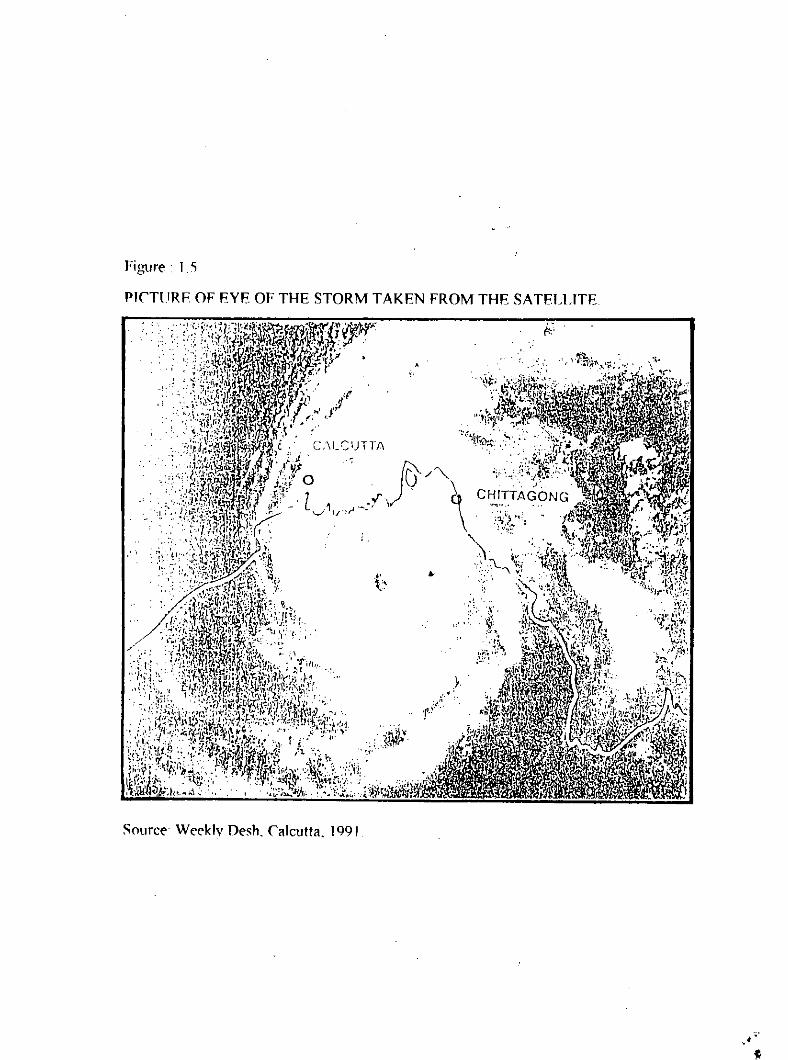
Figure' 1 ~
PWTURF OF EYE OF THE STORM TAKEN FROM THE SATELLITE
." "
Source Weeklv Desh. Calcutta. 1991
".'

11
Tidal Surge or Sea Surge: The anti-clockwise circulation of windaround the centre of cyclone makes a steep pressure gradientresulting into a difference in water level from the centre to theouter periphery of the cyclone and in the centre itself somewater is pulled up due to the suction of wind from upwardconsequently upon the lowest pressure of air in that region. Thissudden swelling of water is known as sea-surge. This is why thearea over which the centre of the eye of the cyclone passes isinundated with a great height of water.
Storm Wave: The strong wind while blowing over the surface ofwater creates waves and that is known as the storm wave. Thestorm wave moves along the direction of the wind and approachthe coast and die out after dashing against the coast line.
Storm Tide: The storm wind of the cyclone while blowing in somedirection for a long time, drifts some water towards thedirection in which cyclone is moving. This drilling of watergenerates a current on the surface of the sea and this is knownas the storm -tide.
1.2.1 Prerious Cyclonic Storms in Chittagong (1822-1991) :
The coastal belt and the offshore islands of Bangladeshfrequently suffer from gentle to severe cyclonic storms and stormsurges. During 1891-1985 about 174 severe cyclonic storms wererecorded (Ahmed 1991). Some of them are shown.in Table 1.2 withmaximum speed and death toll.
Several very destructive storms have visited Chittagong in thelast 174 years. On the 3rd June 1795 a severe gale blew from 70' Clock in the evening till past midnight. Heavy rain followedthe Collector's kachari totally unroofed, and only five brick-built houses survived in the whole town. Two years later, inNovember 1797, a furious hurricane passed over the district. Twovessels lying at anchor in the port were sunk, and almost everyhut was

oU -~----" oU____, N_~ll
('IO.0-
oOl
III_Nm
I a ~II
___ ~ __ II .. --~~oll
'"~oIII
llJ ~o --.m -aJ
---=-z-~---s
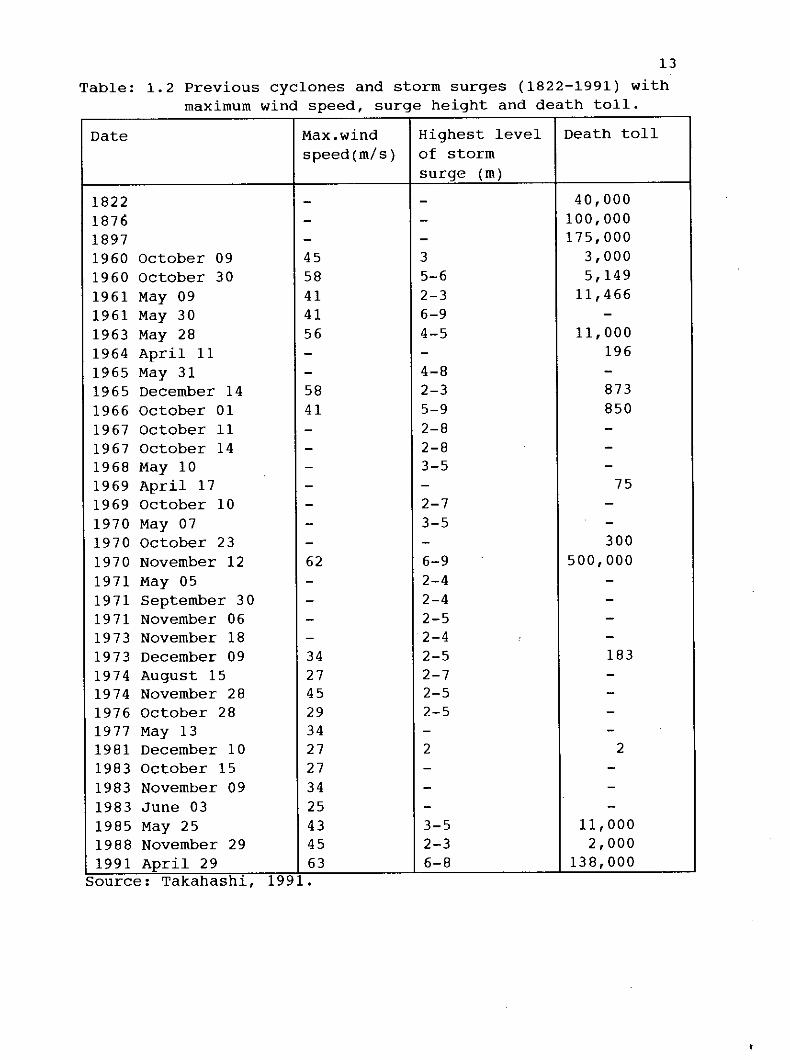
13Table: 1.2 Previous cyclones and storm surges (1822-1991) with
maximum wind speed, surge height and death toll.
Date Max.wind Highest level Death tollspeed(m/s) of storm
surge (m)1822 - - 40,0001876 - - 100,0001897 - - 175,0001960 October 09 45 3 3,0001960 October 30 58 5-6 5,1491961 May 09 41 2-3 11,4661961 May 30 41 6-9 -1963 May 28 56 4-5 11,0001964 April 11 - - 1961965 May 31 - 4-8 -1965 December 14 58 2-3 8731966 October 01 41 5-9 8501967 October 11 - 2-8 -1967 October 14 - 2-8 -1968 May 10 - 3-5 -1969 April 17 - - 751969 October 10 - 2-7 -1970 May 07 - 3-5 -1970 October 23 - - 3001970 November 12 62 6-9 500,0001971 May 05 - 2-4 -1971 September 30 - 2-4 -1971 November 06 - 2-5 -1973 November 18 - 1.2_4 , -1973 December 09 34 2-5 1831974 August 15 27 2-7 -1974 November 28 45 2-5 -1976 October 28 29 2-5 -1977 May 13 34 - -1981 December 10 27 2 21983 October 15 27 - -1983 November 09 34 - -1983 June 03 25 - -1985 May 25 43 3-5 11,0001988 November 29 45 2-3 2,0001991 April 29 63 6-8 138,000
Source: Takahashl, 1991.
14
levelled to the ground. It was a full moon in the evening of the31st October, and there was an abnormally high tide, which floodedall the low lands along the coast. From 10 p.m. of the same nightto 3 a.m. next day a violent northerly wind blew, which broughtdown the water of the Meghna in unusual volume. After a shortinterval of calm, the wind veered round, and blowing furiously fromthe south and west impelled the storm-wave with extraordinary forceinto the converging waters of the estuary. The storm wave, like theordinary tidal wave, was retarded on the shallows at the entranceof the river. It accumulated there, and finally overpowered themass of fresh water brought down by the Meghna, which had beenunable to find an exit seaward during the last six or seven hours.It then rushed forward as a salt-water bore up the Sandwip channeland as a fresh-water bore up the Sandwip channel and as a fresh-water bore up the other channels, till the vast mass of watergradually advancing north wards, flooded the whole area of theislands to a depth varying from 10 to 45 feet. Fortunately theinundation did not last long and subsided even more quickly than itrose; for, beginning at about 11 p.m. the water continued to riseuntil about 4 p.m. when it began to subside and the greaterportion of the flood water had off before 8 a.m. on the 1stNovember.
Cyclone of 1876:There was a severe cyclone in the Bay of Bengal on the night of the31st October 1876. But it was not the wind which proved sodestructive, though that was terrible enough. It was the storm-wave, sweeping along to a height from 10 to 20 feet, according todifferent localities; in some places, where it met with anyresistance, mounting even higher than that. In the evening theweather was somewhat windy and hazy, and had been unusually hot,the people retired to rest apprehending nothing. Before 11 0' Clockthe wind suddenly freshened, and about midnight there arose a cryof 'the water is on us', a great wave several feet high burst overthe country. It was followed by another wave, and again by a thirdall these waves rushing rapidly onwards, the
15
air and wind being chilly cold. The people were thus caught upbefore they had time even to climb on to their roof, and werelifted to the surface of the surging flood, together with thebeams and thatches of their cottages. But the homesteads aresurrounded by palm trees, bamboos and a large thorny species. Thepeople were then borne by the water on to the tops and branchesof these trees. These who were thus stopped were saved, those whowere not, must have been swept away and were lost. The bodies ofthe lost were carried to considerable distances, where theycould not be identified.
In Chittagong the disaster was aggravated by the fact that theinundation, which swept over the sea-board was salt water, sothat the food of the people was damaged and the water-supplycontaminated. The inundation extended inland to a distance offrom 3 to 6 miles except where the mouths of rivers and creeksafforded the storm-wave an easy entrance and there the floodpassed much further up and spread over the country for miles.Itis estimated that in the few hours during which the country wassubmerged, 12,000 persons were drowned in the Chittagong districtalone, and 14,788 are said to have perished in the choleraepidemic which followed. This outbreak took place almostimmediately after the subsidence of the water, extended over thewhole area of the inundation, and was of a remarkably fataltype. A storm of wind and rain, the ghost as it was called, ofthe cyclone, aggravated the distress of the people, and itseemed as if the survivors of the storm wave would perish bypestilence.
Cyclone of 1897Another disastrous cyclone was that of the 24th October 1897,which will long be remembered as one of the most terrible onrecord in Chittagong. This cyclone does not seem to havecommenced, as cyclonic storms usually do, within the Bay, buthave crossed from the east into the Andaman Sea where it firstbecame manifest on the 20th October to the south of Tavoy. Duringthe 22nd and 23rd it advanced well into the centre of the Bay,"

16
the coast stations giving but little indication of its presence,and on the 23rd it recurred, its centre finally crossing theChittagong coast on the evening of Sunday the 24th. At 11 a.m.on that day a telegram was received form Calcutta that the centreof the cyclone would pass across the face of the Sundarbans. By4 p.m. the barometer had fallen from 29.745 to 29.370, and thewind stood at north-east. At 5 p.m. it backed to north-east andthe squalls became very severe, with heavy rain at 6 p.m. thebarometer was at 29.020, and the wind veered to north, blowingwith increased nero, its velocity, being estimated at 80 milesan hour. From 6 p.m. until 10 p.m. when the barometer stood at28.750 (the lowest reading observed), the wind remained betweennorth-east and north . There was then a .lu11 for about sevenminutes, and after that it blew with redoubled violence from thenorth-west, and the barometer began to rise; the wind graduallywent round to west, then to the south-west, from which quarterit was blowing at about 1.30 a.m. when the storm ended. Duringthis short time between 8 and 9 inches of rain fell.
The cyclone reached its maximum intensity at about mid-night,when a series of storm-waves swept over the island of Kutubdiaand the villages on the main land near the coast, drowningthousands of men and cattle, sweeping away homesteads anddestroying the standing crops. The centre of the cyclone appearsto have travelled up the valley of the Karnaphuli, wreckingRangamati, the headquarters of the Chittagong Hill Tracts,wherehouses and bazars were swept clean away. Its main force was feltin a strip of 225 square miles, extending from about 4 milesabove Chittagong town on the north to point some 4 miles belowCox's Bazar on the south, a distance of some 70 miles. In thenorth and south of this strip little damage was done, but withinit the force of the cyclone was very great. In the southernportion of this tract lies the delta of the Matamuhuri and herethe cyclone was of extraordinary violence,while the storm waveswhich accompanied it one after another were more disastrous thanthe cyclone itself. The low lying portion of this delta and ofthe islands which line off
" ,
17
it were completely swept away and in many villages half theinhabitants were drowned. The survivors found their houseslevelled to the ground, their crops entirely destroyed, a greatpart of their cattle drowned, and themselves left without anystores of food or clothing. The dukes along the sea-board werewashed away; at Chittagong itself the ships waved severely; andserious damage was done to public buildings both there andthroughout the district.
The loss of life by surge inundation alone was estimated at14,000 and was even greater in Chakaria thana and the Maldiaoutpost than in the more exposed island of kutubdia, owing to thefact that the storm wave rushed up the great estuaries of theMatamuhari and was thus particularly fatal to the inhabitantsof these parts, who dwelt on the of tidal khals. It must beremembered, moreover, that the greatest and severest part of thestorm took place during the dark hours of the night, whichresulted in much greater loss of life than could be expectedotherwise.The loss of property was appalling. The largest treeswere uprooted, almost all kutcha buildings were levelled to theground and the rice crop in the tracts chiefly affected wascompletely destroyed. The houses were blown off and of all thatwas contained in the dwelling houses was carried away by water.The village sites were obliterated and only the stumps of brokenfruit trees, and, here and there, the remnants of the posts ofhouses, remained to show that a village had ever existed there.The villagers, themselves were found clothed in rags picked upin the jungle, eating the half ripened rice from their fields anddrinking brackish water. The country was covered with thecorpses of men and animals, and the water supply was polluted.Cholera broke out to with appalling intensity. In Kutubdia alone,it was estimated that 11 per cent of the population perishedduring the epidemic. The total mortality due to cholera was18,000 and it was not before two years that the people couldrecover form this terrible calamity.
p
18
Cyclone of 1960From the 9th of October 1960 the sky was cloudy. It starteddrizzling from midnight between 9th and 10th October. Raincontinued the whole day with increasing velocity of wind.A severecyclonic storm centered at 06.00 hrs. EPST, about 120 milessouth of Noakha1i moved in a northerly direction. It reached thecoastal area at 18.00 hrs.form the south-east, After about twohours, it changed its direction from north. to south. Itcontinued to blow with full force up to 23.00 hrs. abating instrength gradually; thereafter at about midnight it wascompletely calm. The cyclone was accompanied by heavy rain anda tidal bore in the low lying 'chars' of Noakhali and mainlandareas of both Chittagong and Noakhali bordering the sea. The lossof human life and cattle was in thousands. It was before peoplecould hardly recover from this disaster that a heavier and morecatastrophic blow fell on them on the 31st October of the sameyear.
From the morning of the 30th October the atmosphere appearedextremely foggy and the sky cloudy. There were occasional lightshowers during the day and these continued throughout the nighttoo. In the morning of the 31st October the sky was clear andthere was beautiful sunshine all round but the atmosphere wasstill unusually calm. At about 10.00 hrs. the whole atmospherewas covered with dense fog and heavy dark clouds began to coverthe sky. At 11.00 hrs., a report came form the MeteorologicalDepartment as follows:
"Serious cyclonic storm from Northern Bay of Bengalstarted at 6 a.m. of 31st October, about 300 milessouth-west of Chittagong, moving north-east at 60miles per hour passing over the districts ofChittagong, Tippera, Noakhali, Bakerganj and Faridpur.Storms are accompanied by tidal bore".
From about 14.00 hrs. a north-east wind began to blow increasingits velocity by and by At 16.00 hrs. a heavy cyclone touchedTaknaf and gradually hit Chittagong at 18.00 hrs., sweeping awaydust and driving people from the roads. After an hour's unequal

19
struggle the thatched huts could no longer stand out and wereblown off, exposing the inmates.to the biting wind of a cold darknight.On Sunday, the north-east wind fell but within a few minutes itstarted from the opposite direction. A deep reddish cloudappeared on the horizon in the south-east corner of the sky. Itrolled along the horizon to the west then to the north and thento the east thus covering the entire horizon within a matter ofminutes. All on a sudden the tidal bore, about 30 feet high,swept in from the Bay of Bengal, inundating the entire coastalarea from Maheskhali to Mirsarai in the chittagong district aswell as the offshore islands of Chittagong and Noakhalidistricts.
The following morning revealed the wretched condition of theentire district. Except the pucca buildings, almost all thekutcha houses had been completely land down by the cyclone andthen washed away by tidal bore. Big trees were uprooted and thebark and leaves of the few big trees that were still standinglooked burnt and black. The young rice plants looked as if theyhad been mown to the ground with a giant scythe.
Table 1.3: Damages and Loss of Lives and Livestock in the1960 cyclone.
Damage and loss By ciclone of 10th Bt cicloneOct, 960 o 3 st.Oct, 18%
1- Human casualties 99 9,5372. lal Cattle lost -- 27,793b Buffaloes lost -- 1,288
c Shee~, goats lost -- 29,078d Poul ry lost -- 24,144
3. Houses damaged 62,725 5,68,1614. Damage to crops i. 94 000 acre fullrii.568,000 acre par ly5. Fishermen affected -- 11,497
l~l Boats lost -- 687Fishing nets lost -- 1,193
•'"......

20
The entire communication system was paralysed for the time being,the headquarters of Chittagong were completely cut off form therest of the world for a couple of days. Anwara and Banshkhalithanas on the left bank of Karnaphuly estuary were practicallyunapproachable, civil administration was momentarily bewildered.The Army was called in and from the following morning salvageoperations started under the supervision of the Army personnelin Halishahar and Patenga areas. Relief measures were also takenup simultaneously throughout the affected area. The extent ofdamage and loss as estimated by the authorities is presented inTable 1.3.
Cyclone of May 1963
Cyclone may hit East Pakistan. Deep depression in the Bay ofBengal. This was the cryptic weather forecast issued by theMeteorological office at Patenga on the night of the 27th May,1963. It was further ascertained that the depression was locatedabout 375 miles south of Chittagong at 12 noon on that day andit was moving slowly towards the north-east. The Patenga officesaid that it could not exactly ascertain the behavior of thedepression; if it changed course, it would bypass Chittagongtowards Burma; if not, it would hit Chittagong, Noakhali, Barisaland other coastal districts.
On the 28th, Tuesday, gusty winds kept blowing and there wereintermittent showers; ominous clouds were floating fast from thesouth and south-west and hanging on the horizon to the north andto the east. The District authorities took all possible steps toalert the people against the apprehended cyclone. The weatherforecast was communicated to all the distant thanas and theoffshore islands by means of telephone, telegram and radiogramand in the town proper and the suburbs publicity vans movedthroughout the day announcing the hourly weather forecast and thesignals to be hoisted. People did not take the announcementsvery seriously as there had never been any cyclone in the monthof May within living memory.
21
But in the evening the tempo of the wind increased and the skybecame heavily overcast with dark clouds and the people ingeneral grew panicky. Meanwhile, Danger Signal No.4 was hoistedfor Chittagong port and all the coastal areas were repeatedlyalerted.
Cox's Bazar was the first place to face the fury of the cyclonicstorm in the evening and tele-communication with Chittagong wascut off by 7 p.m. when E.P.R. wireless tried to establishcontact. Gusts of wind reached Chittagong at about 11 p.m. andgained the velocity of about 100 miles per hour by aboutmidnight. Then it seemed that nature's forces were unlashed.Rotating winds which reached the velocity of 150 miles per hourthundering like a horde of wild elephants run amuck, lashed andwhipped the city and the coastal areas and offshore islands.Houses and huts were smashed and blown away as if these werematch boxes; trees were uprooted, telegraph and telephone polesand light-posts were twisted; ships lying at anchor were cut. Itlasted for six hours and it was only at about 5 a.m. at dawnthat the storm showed sign of abatement. Most of thecommunications between the capital and the devastated port citywere also functioning form about 10 in the morning. Offshoreislands of Sandwip, Kutubdia, Hatiya and Maheshkhali were badlyaffected.
Till the afternoon of the 29th, Patenga was under 5 feet ofwater. There was no water supply and electricity in the townsince the midnight of the 18th, telephone and telegraphcommunications was snapped and the air-link was cut off. TheGovernment sanctioned Tk. 2 lakh for immediate relief to theaffected people. The official figures of casualties, losses anddamages were as follows:
l.2.
3.
4.
Human casualties(al Cattle lost(bl Goats and Sheep lost(cl Poultry lost(al Houses damaged completely(b) Houses damaged partlyBoats destroyed
9,63632,61749,88480 percent376,032224,6504,787

Table 1.4 List of recent cyclones showing landfall areas.
22
Date Landfall Area Max. wind Surge height Estim-Speed ted
centr-knots kph ft m al
press-ure rob
01 Nov-1876 Noakhali 93 136 10-45 - -
11 Oct 1960 Chittagong 87 160 15 4.5 -31 Oct 1960 Chitta gong 104 193 20 6.1 -- May 1961 Chittagong 87 160 8-10 2.4-3.0 -
-May, 1961 Chitta gong (near 87 16016-15 1.8-4.5 -
Feni)-May, 1963 Chittagong/Cox's 113 209 8-12 2.4-3.7 -
Bazar-May, 1965 Chittagong/Baris 87 160 12 3.7 -
al Coast-Nov. 1965 Chitta gong 87 160 8-12 2.4-3.0 -15 Dec.1965 Cox's Bazar 114 210 8-10 2.4-3.0 -
01 Nov.1966 Chitta gong 65 120 20-22 6.1-6.7 -
-Oct. 1970 Khulna/Barisal 88 163 Moderate -
-Nov. 1970 Chitta gong 121 224 10-33 3.0-10 --Nov. 1974 Cox's Bazarl 88 163 9-17 2.7-5.2 -
Chitta gong-Dec. 1981 Khulna 65 120 7-15 2.1-4.6 989
-Oct. 1983 Chitta gong 50 93 - - 995
-Nov. 1983 Cox's Bazar 73 136 5 1.5 986
-May. 1985 Chittagong 83 154 15 4.6 982
-Nov. 1988 Khulna 87 160 2-14.5 0.6-4.4 983
-Dec. 1990 Cox's Bazar - 115 5-7 1.5-2.1Coast
29 Apr.1991 Chittagong - 225 12-22 3.7'-6.7 940Source: BMD, 1991
j
.' .

23
Cyclone of December, 1965
The last cyclone on record was as unusual as it wasunprecedented. The Meteorological office at Patenga detected acyclonic storm located in the Bay of Bengal on the night of the12th December, which was stated to have rapidly moved west wardsinto. the West Central Bay. It was located ,within one degreelatitude, 14 North longitude and 78 degree East latitude, 400miles east of Madras and over 500 miles away form Chittagong. Itwas likely to intensify and move west or north-west. There was,thus, the least apprehension of any danger to East Pakistan fromthis storm. The depression after hovering about for two days, atlast, changed its direction and was heading for the Chittagongcoast. In the evening of the 14th December, the Meteorologicaloffice announced, for the first time, that the cyclone would hitCox's Bazar and the offshore islands around mid-night and dangersignal no. 10 was hoisted at Cox's Bazar and along the coast.
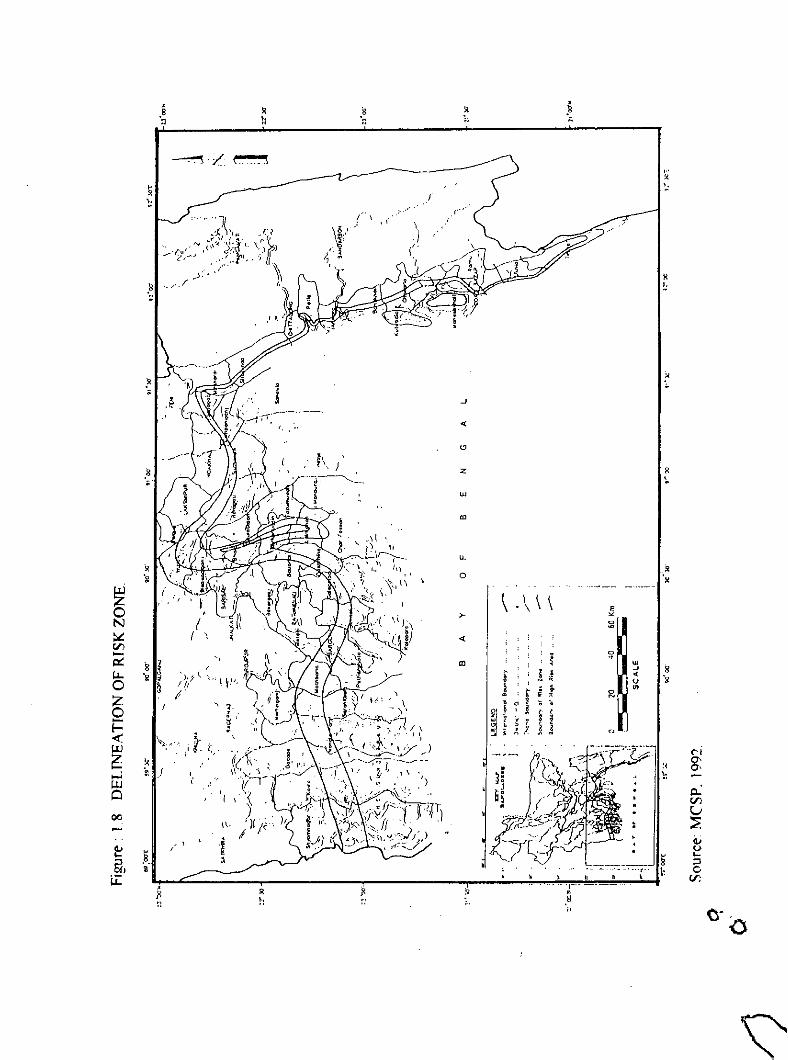
1.2.2 Vulnerable Areas to Cydone Disaster:
From the spatial analysis it has been found that Chittagong ,Cox's Bazar and Teknaf are most cyclone prone areas inBangladesh. More than 50 per cent of the recorded cyclones havehit this area.
The cyclone of 29 April 1991 attacked the eastern coast directlywith a huge rise of storm surge in the Naaf river and theMoheskhali, Kutubdia and Sandwip Channels. The storm surgecompletely submerged the islands of Sonadia, Moheskhali,Matarbari, Ujintia, Koriardia, Kutubdia and Sandwip. It alsoseverely affected the western parts of Cox's Bazar, Charkaria,Banskhali, Anowara, Chittagong city and sitakunda area includingthe islands of Hatiya and Monpura, and the mainland chars of Feniand Noakhali districts. Heavy damage was also reported from thePatuakhali, Bhola and Barguna districts after the 1991 cyclonedisaster.

,;.~ .., ,k
\I,z+
~f,
/'f'-oJ"l',le
~.
-'<{
<:J
•Z
W~al
'."
•....00
li-
0-,-'. ,0 -..c:IJ 1.1 ~ '"\
<IJe "0
~>-
'"
,
Of)
~
<=
0
<{
0 '"
N
~~
~
al , .E,VJ
i " 't.
-~~ ,
.<;i ,\L
~l . ,~
0 ~
;, ! 1 i....
Z ~
,<IJ-
0
'"'"
!=
v,<-
i:S
<r
~
11 '"'".~
...J
'JVJ
~
ilJ
Cl
u....
•....
, :J. t CVJ
<IJ'1
....611 .' ,
,~ •
,,,"$,
.'",..,"
8-,WJ•o~
o-,
"•",i
\ .\ \ \
;.,
J
<
w
z
o
<Xl
m
>-
<
.~
~N
\::£
'" -,-S
l:C " 'JoJ {, ,.~ "j ~I0 ~
" , ,.Z ,0~-
Jf-
\.- i.:"...:~ • ,.• !..J I
~00
26
1.Z.3 Montbly Distribution of Cyclones in the Bay of Bengal:
Around 35 severe cyclonic storms have been recorded in thecoastal areas of Bangladesh in the period between 1868 to 1985.The recurrence of cyclone distribution of 35 cyclones in a month-wise calendar year is presented graphically. (Figure-1.9). Thetime analysis shows that the months of May and October are themost cyclone prone months of the year although cyclones haveoccurred from March through June and from september throughDecember.
From the following table it is found that severe cyclonesoccurred mostly during pre (April-May) and post (October-November) monsoon periods and they were the ones which causemaximum destruction. The monthly distribution of tropical cyclonein the Bay of Bengal is shown in Table 1.5.Table 1.5 : Monthly distribution of tropical cyclone in Bay of
Bengal
Anantha Kr1shna & Rao 1964 as quoted B. Chowdhury
J F M A M J J A S 0 N D TOTALModerate tropical cyclone (a) 3 - 2 11 10 30 31 24 1 3 33 17 214
severe tropical cyclone (b) 1 1 2 7 18 4 7 1 8 19 23 9 100
Tropical cyclone (atb) 4 1 4 18 28 34 38 25 9 42 56 26 314Source:
MHK, 1977.1.2.4 The Great Cyclone of 1991 :The April cyclone of 1991 can be termed as the most devastatingnatural disaster in the history of the country. On the basis ofhigh wind velocity and damages caused to different sectors of theeconomy, the cyclone that crossed the Bangladesh coast during thenight of 29 April 1991 can be called as a historical event in thecontext of world meteorology (Sen, 1991). The 'great cyclone' hada dimension more than two times the size of Bangladesh(Chowdhury, 1992). It is clear that direct damage was more
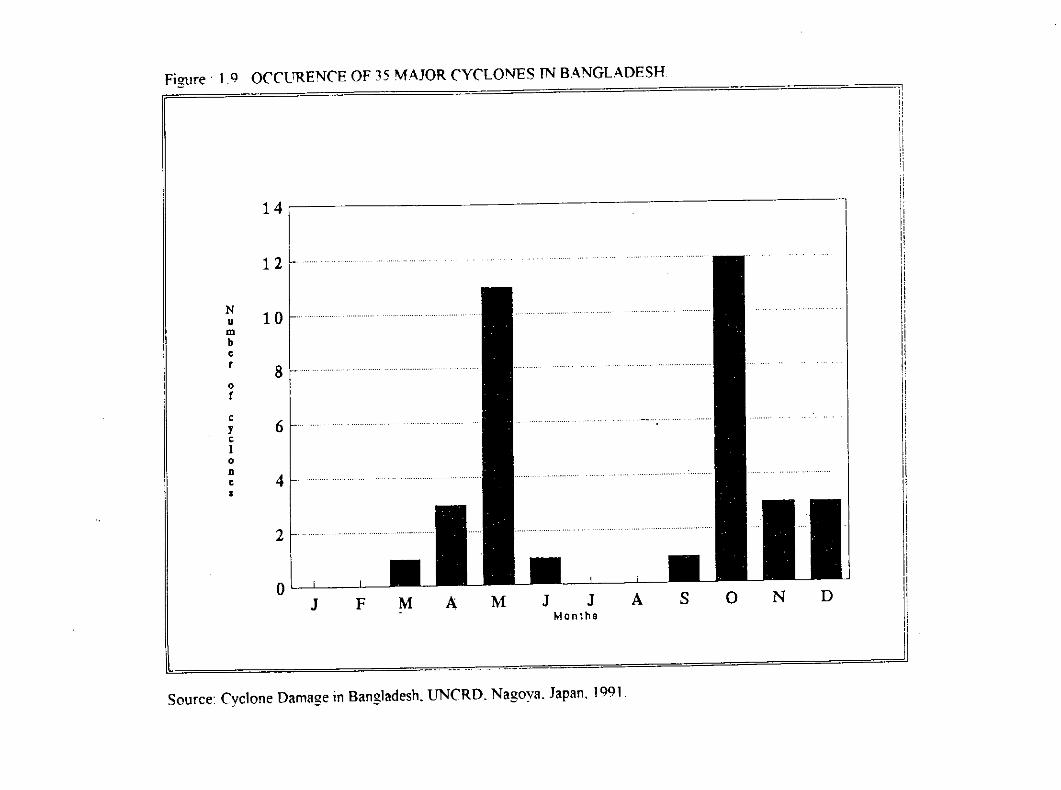
Figure.]9 OCCVRENCE OF 35 MAJOR CYCLONES TNBANGLADESH
14
I
IiJ
DNosAJMontha
M J
12, - IiI
N 10umbe Ir 8 i0 Irc
6,-_ ..
yc
II0D
4 Ie•
2
o[ J F l\l A
Source: Cyclone Damage in Bangladesh. UNCRD. Nagoya. Japan. 1991.

28
serious in 1991 than in 1970 cyclone. The total affectedpopulation of 1991 is 2.3 times as much as that of 1970. Thetotal numbers of damaged houses and educational institutions of1991 were 4.1 times and 2.7 times as many as those of 1970respectively (Matsuda, 1991). The severity of 1991 cyclone withrespect to that of 1970 by the extent of damages, losses of livesand properties along with meteorological data are presented andcompared in Table 1.7.
Table 1.6: Death Toll in Some Cyclones in Bangladesh.
Year Death1822 40,0001876 100,0001897 175,0001960 5,491961 11,4681963 11,5201965 19,2791970 500,0001985 11,0691991 138,000
Source: Ahmad, (1991).The maximum wind speed recorded at 1338 hours on 29 April wasabout 240 kilometers per hour and the maximum surge height duringthe cyclone was estimated to be 8-10 meters (Chowdhury, 1991) .Thecyclone was detected as a depression on the 23rd April first inthe satellite picture taken at the Space Research and Remotesensing Organization (SPARRSO) of Bangladesh. It turned into acyclonic storms on 25 April and moved slightly north westwardand then northward. From 28 April it started moving in a northeasterly direction and crossed the Bangladesh coast north ofChittagong port during the night of 29 April.

PATENGA ATRPORT ROAD AFTER THE DTSASTROlTS CYCLONE
GR ANOM A RESTOE THE RET ,OVEO nm J) TO MOlIR N HTS OEA TH
~,".~-'"
\Ir
. -- ..
. ..."
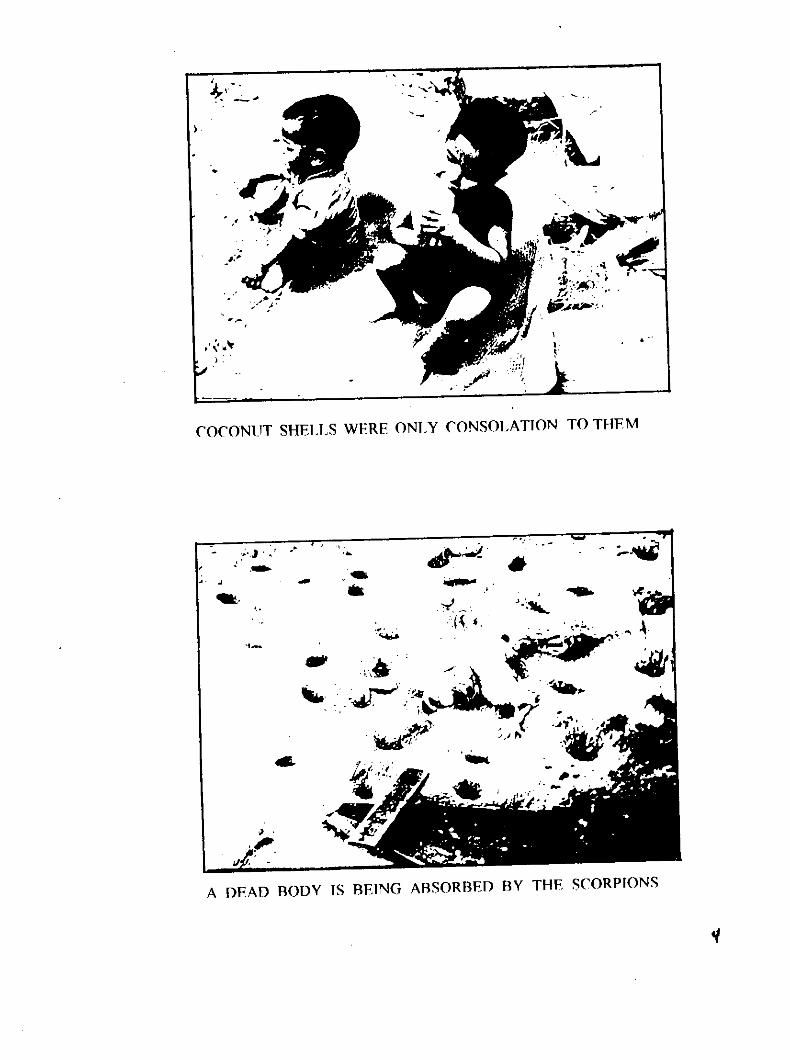
COCONUT SHELLS WERE ONLY CONSOLATION TO THEM
:;",1' ..' ~•., .- -,..' .
••) .
.,J. •
A DEAD BODY IS BEING ARSORBED BY THE SCORPIONS
l
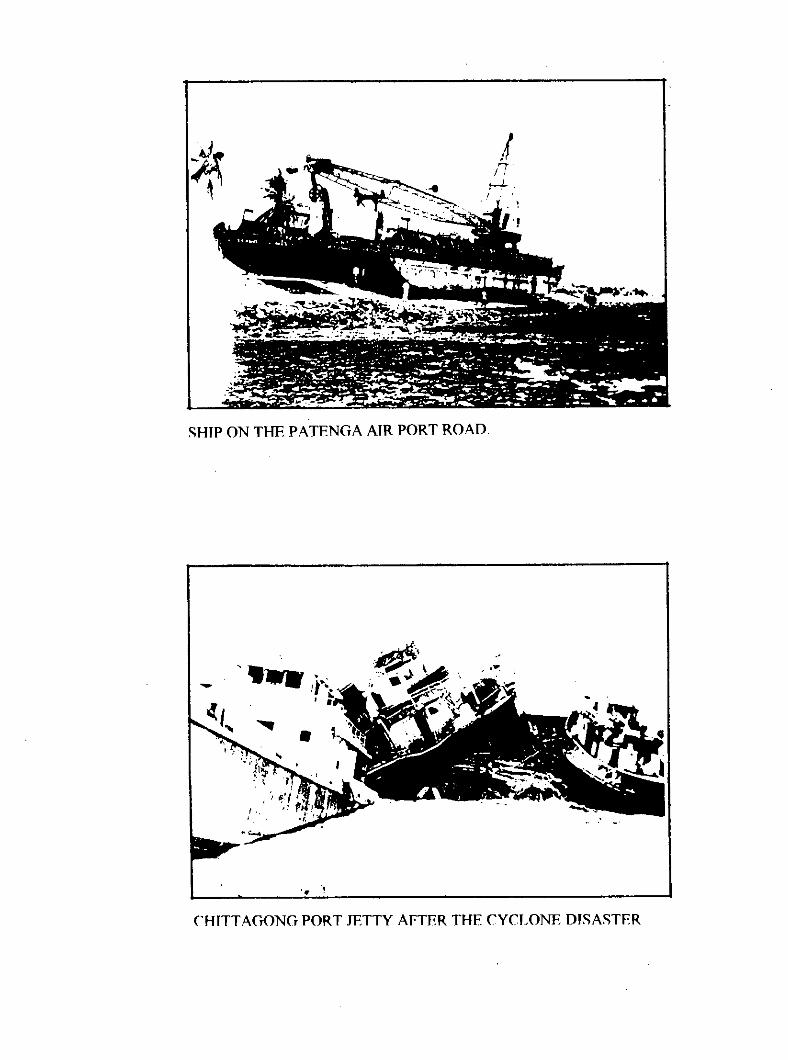
SHIP ON THE PATENGA AIR PORT ROAD
'~ .~
CHITTAGONG PORT JETTY AFTER THE CYCLONE DISASTER
~- ----."
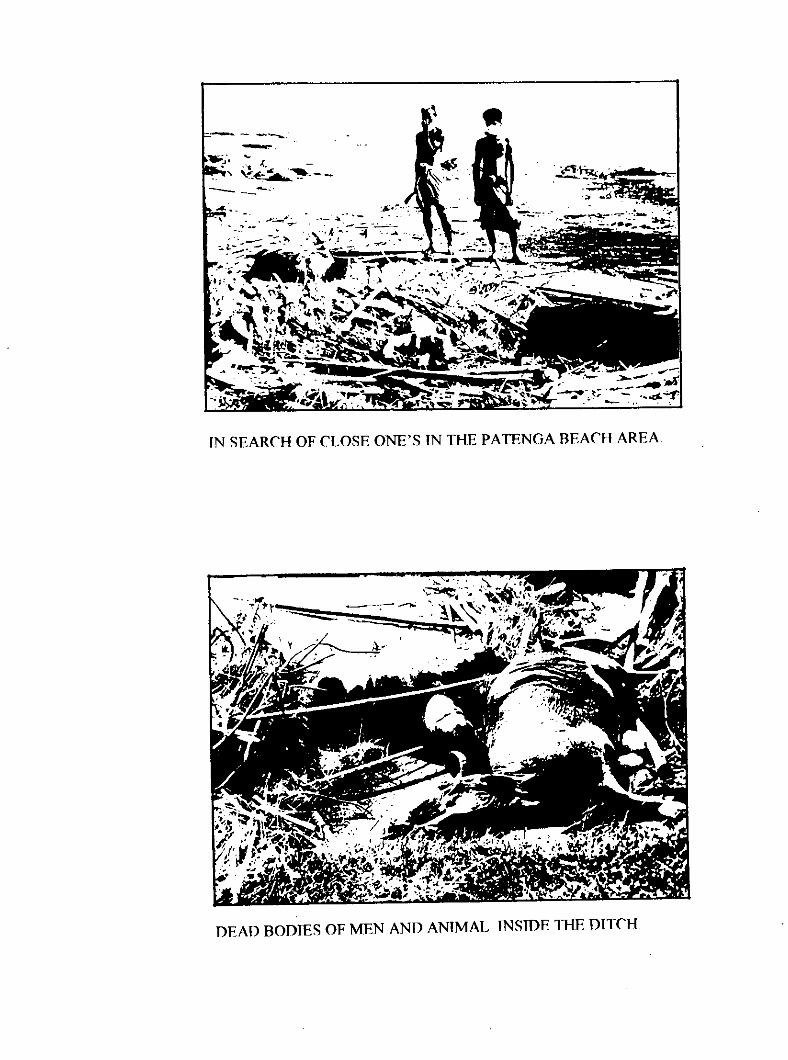
IN SEARCH OF CLOSE ONE'S IN THE PATENGA BEACH AREA
DEAD BODIES OF MEN AND ANIMAL INSIDE THE DITCH
.'i:
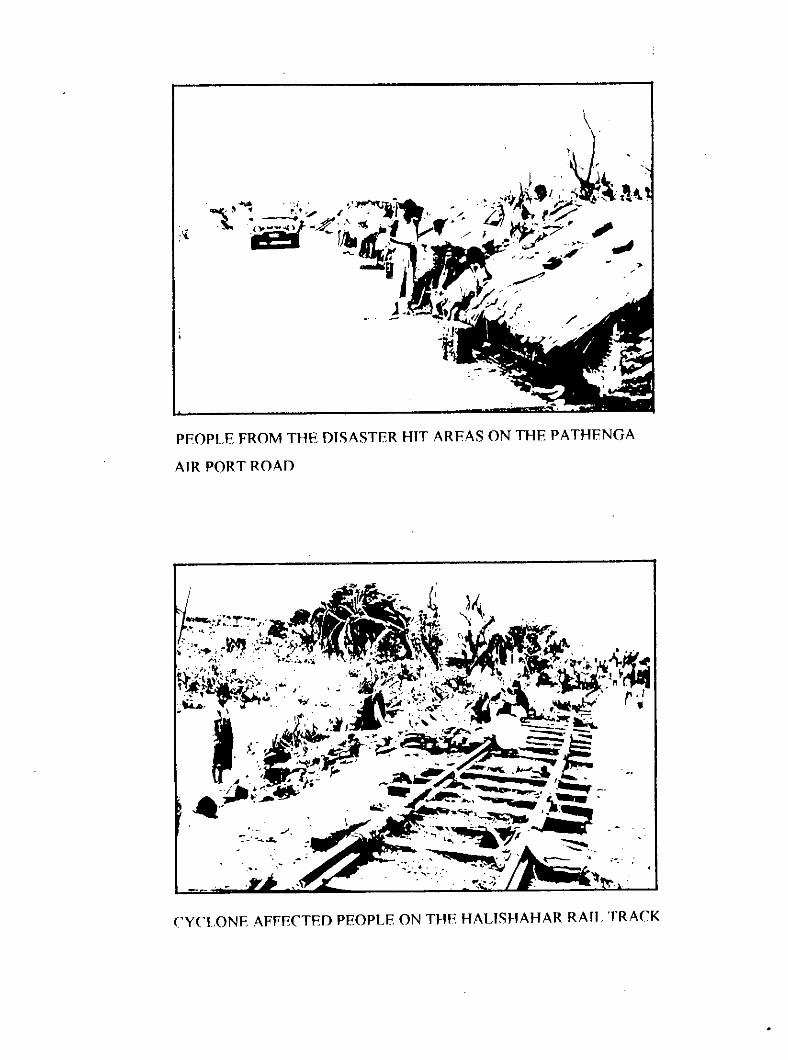
PFOPLE FROM THE DTSASTER HIT ARFAS ON THF PATHENGA
AIR PORT ROAD
('Y(,LONF AFFECTED PEOPLE ON THE HAUSHAHAR RAIL TRA('K

-----;i!
'" F- i
.~r".,'.
";",
';i
-,
' .•" .
AFFECTED MIDDLE SPAN OF THE "KARNAPHlIU BRIDGE"
"
'-.
"~ .~. , \,
THE DETACHED PART OF THE BRIDGE TN THE RIVER

I. •
~l1"1111'11111111111111
" II 'II •1111111111111 , Ii''i1 J i 11111111111111 11 \
CYCLONE AFFECTED RCCELECTRIC POLES IN THE CITY AREA.
" .
CHITTAGONG PORT AREA AFTER THE 1991 DEVASTATION
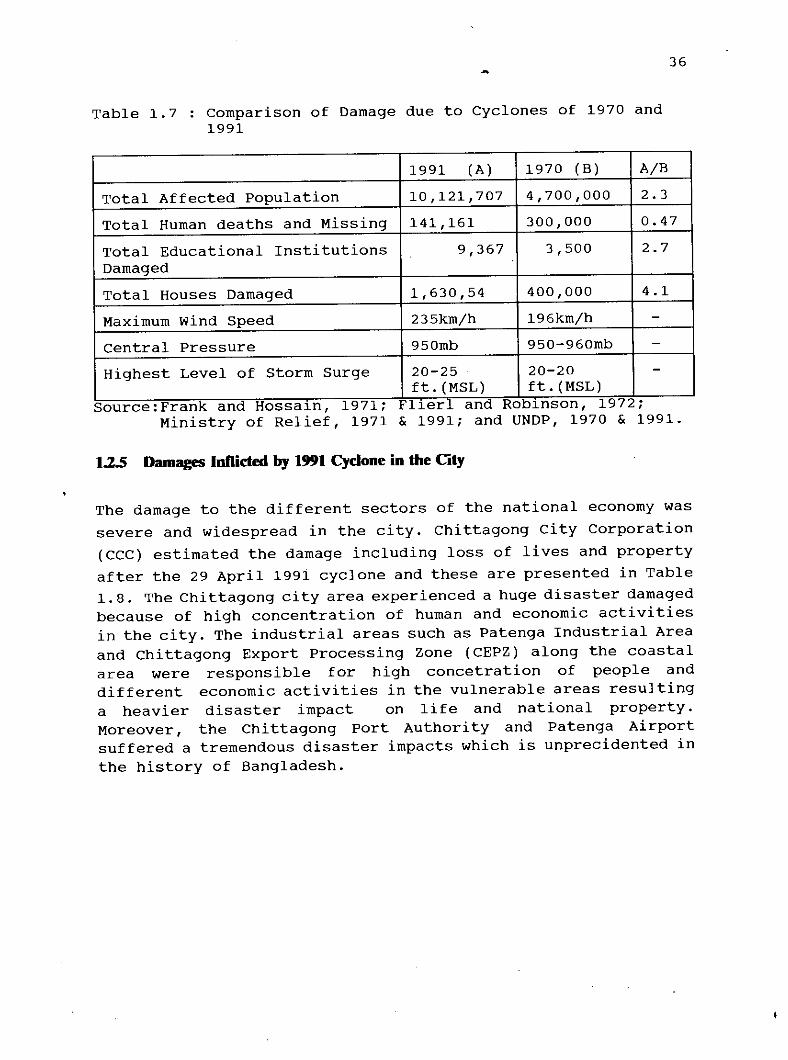
Table 1.7 comparison of Damage due to Cyclones of 1970 and1991
36
1991 (A) 1970 (B) A/BTotal Affected population 10,121,707 4,700,000 2.3
Total Human deaths and Missing 141,161 300,000 0.47
Total Educational Institutions 9,367 3,500 2.7DamagedTotal Houses Damaged 1,630,54 400,000 4.1Maximum Wind Speed 235km/h 196km/h -
Central Pressure 950mb 950-960mb -
Highest Level of storm Surge 20-25 20-20 -ft. (MSL) ft. (MSL)
Source:Frank and Hossaln, 1971; Fllerl and Roblnson, 1972;Ministry of Relief, 1971 & 1991; and UNDP, 1970 & 1991.
1.2.5 Damages loRicted by 1991 Cyclone in the City
The damage to the different sectors of the national economy wassevere and widespread in the city. Chittagong city Corporation(CCC) estimated the damage including loss of lives and propertyafter the 29 April 199i cyclone and these are presented in Table1.8. The Chittagong city area exper ienced a huge disaster damagedbecause of high concentration of human and economic activitiesin the city. The industrial areas such as Patenga Industrial Areaand chittagong Export Processing Zone (CEPZ) along the coastalarea were responsible for high concetration of people anddifferent economic activities in the vulnerable areas resultinga heavier disaster impact on life and national property.Moreover, the Chittagong Port Authority and Patenga Airportsuffered a tremendous disaster impacts which is unprecidented inthe history of Bangladesh.
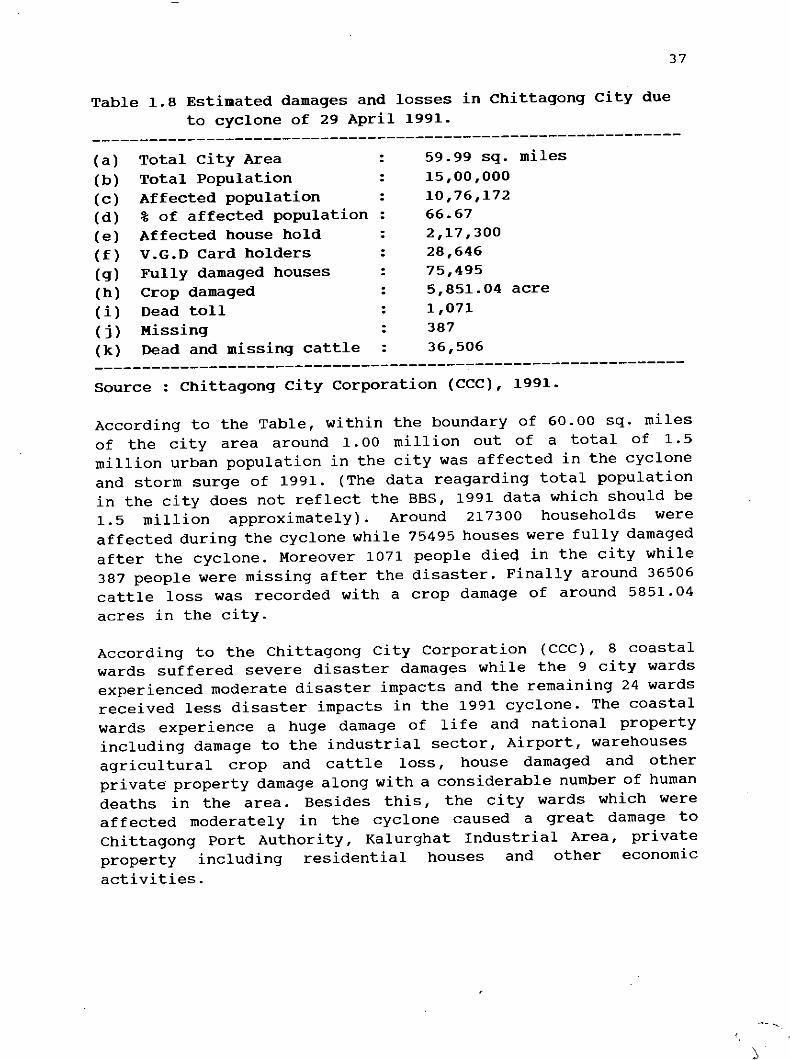
37
Table 1.8 Estimated damages and losses in Chittagong city dueto cyclone of 29 April 1991.
--------------------------------------------------------------(a) Total city Area(b) Total population :(c) Affected population :(d) % of affected population :(e) Affected house hold :(f) V.G.D Card holders :(g) Fully damaged houses :(h) Crop damaged :(i) Dead toll :(j) Missing :(k) Dead and missing cattle :
59.99 sq. miles15,00,00010,76,17266.672,17,30028,64675,4955,851.04 acre1,07138736,506
--------------------------------------------------------------Source: Chittagong city corporation (CCC), 1991.
According to the Table, within the boundary of 60.00 sq. milesof the city area around 1.00 million out of a total of 1.5million urban population in the city was affected in the cycloneand storm surge of 1991. (The data reagarding total populationin the city does not reflect the BBS, 1991 data which should be1.5 million approximately). Around 217300 households wereaffected during the cyclone while 75495 houses were fully damagedafter the cyclone. Moreover 1071 people died in the city while387 people were missing after the disaster. Finally around 36506cattle loss was recorded with a crop damage of around 5851.04acres in the city.
According to the Chittagong city Corporation (CCC), 8 coastalwards suffered severe disaster damages while the 9 city wardsexperienced moderate disaster impacts and the remaining 24 wardsreceived less disaster impacts in the 1991 cyclone. The coastalwards experience a huge damage of life and national propertyincluding damage to the industrial sector, Airport, warehousesagricul tural crop and cattle loss, house damaged and otherprivate property damage along with a considerable number of humandeaths in the area. Besides this, the city wards which wereaffected moderately in the cyclone caused a great damage toChittagong Port Authority, Kalurghat Industrial Area, privateproperty including residential houses and other economicactivities.
38
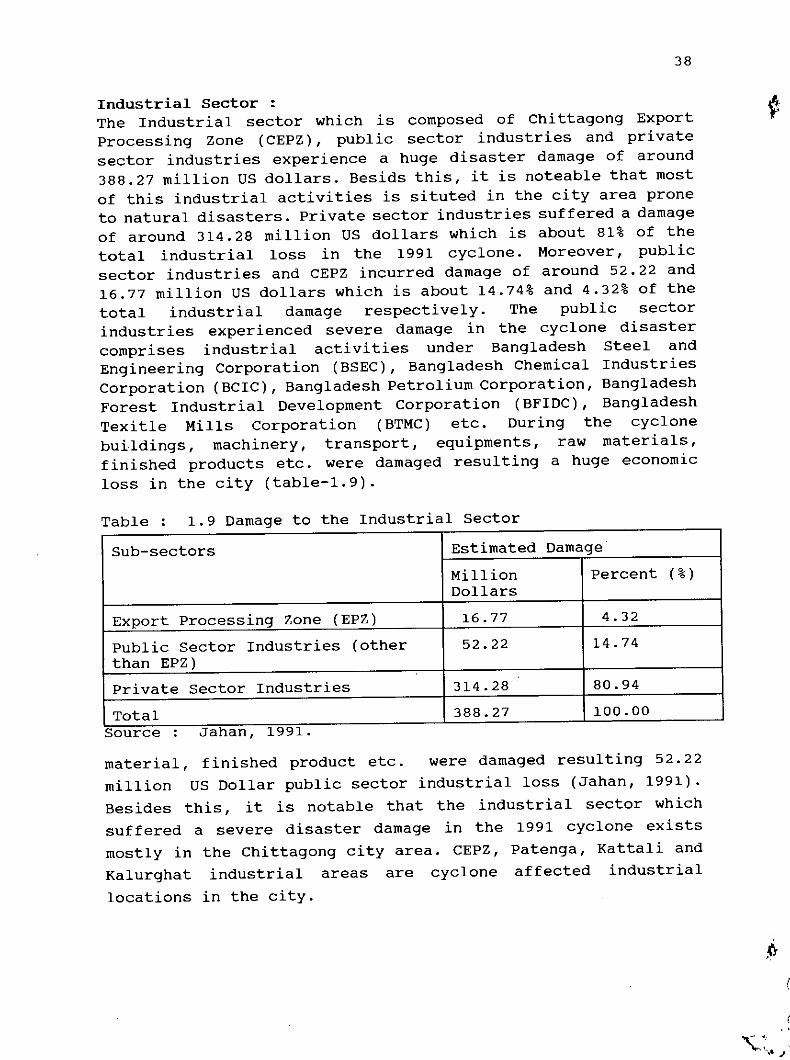
Industrial Sector :The Industrial sector which is composed of Chittagong Exportprocessing Zone (CEPZ), public sector industries and privatesector industries experience a huge disaster damage of around388.27 million US dollars. Besids this, it is noteable that mostof this industrial activities is situted in the city area proneto natural disasters. Private sector industries suffered a damageof around 314.28 million US dollars which is about 81% of thetotal industrial loss in the 1991 cyclone. Moreover, publicsector industries and CEPZ incurred damage of around 52.22 and16.77 million US dollars which is about 14.74% and 4.32% of thetotal industrial damage respectively. The public sectorindustries experienced severe damage in the cyclone disastercomprises industrial activities under Bangladesh Steel andEngineering Corporation (BSEC), Bangladesh Chemical IndustriesCorporation (BCIC), Bangladesh Petrolium Corporation, BangladeshForest Industrial Development corporation (BFIDC), BangladeshTexitle Mills Corporation (BTMC) etc. During the cyclonebuildings, machinery, transport, equipments, raw materials,finished products etc. were damaged resulting a huge economicloss in the city (table-1.9).
Table: 1.9 Damage to the Industrial Sector
Sub-sectors Estimated DamageMillion Percent (%)Dollars
Export Processing Zone (EPZ) 16.77 4.32
Public Sector Industries (other 52.22 14.74than EPZ)Private Sector Industries 314.28 80.94
Total 388.27 100.00Source: Jahan, 1991.material, finished product etc. were damaged resulting 52.22million US Dollar public sector industrial loss (Jahan, 1991).Besides this, it is notable that the industrial sector whichsuffered a severe disaster damage in the 1991 cyclone existsmostly in the chittagong city area. CEPZ, Patenga, Kattali andKalurghat industrial areas are cyclone affected industriallocations in the city.

39
Physical Infrastructure :
On the other hand, the physical infrastructure sector whichcompose of Railways, Chittagong Port Authority, Inland WaterTransport Authority and Post and Telecommunication sector mainlysuffered a disaster damage of around 360 million US dollars inthe 1991 cyclone and storm surge. Bangladesh Railways incurreda damage of 28.20 million us dollars which is around 7.85% of thetotal damage in this sector while Chittagong Port Authoritysuffered around 41.91 million, Inland Water Transport Authority52 million and Post and Telecommunication subsectors experienced128.42 million us dollar loss in the cyclone disaster which isaround 11.64%, 14.45% and 35.67% of the total damage in thesector (table-1.10). In the Post and Telecommunication subsectormicrowave tower antena, feeder cables I Radio and Telephone tower,UHF links, trunklines etc. were badly affected.
Table: 1.10 Damage to the physical infrastructure
Infrastructure Estimated DamageMillion PercentDollars (%)
Rural infrastructure 107.00 29.73Railways 28.20 7.85Chittagong Port Authority 41.91 11.64Inland Water Transport Authority 52.05 14.45Post and Telecommunication 128.42 35.67Others 2.43 6.07Total 360.01 100.00
Source: Jahan, 1991.
40
1.3 Rationale of the Study
Disaster management practiced in Bangladesh is mostly orientedto emergency responses and is responsive in nature, which doesnot include land-use and planning policies in the overall DMsystem for the prevention and mitigation of natural disasters.Besides this, DM at national, regional and local level in thecountry includes different district and thana/union counciladministrations under the central government control. But themetropolitan cities and other urban centres/towns of the countrydo not come under the existing DM system. As a consequence,Chittagong Metropolitan city experienced a huge disaster damagesin the 1991 cyclone and storm surge due to the lack of necessaryDM measures in the city. Moreover, existing DM measures practicedin the country with special emphasis to warning disseminationsystem, preparedness measures, cyclone shelter programmes,embankments, resque operations, relief and rehabilitations,afforestation etc. have proved to be ineffective in the 1991cyclone due to illiteracy, poverty and lack of awareness amongthe people of the vulnerable areas.
Therefore, DM through land-use policies can be an effective toolfor the prevention and mitigation of disaster impacts in themetropolitan city of chittagong which is prone to frequentnatural disasters like cyclones and storm surges. The land-useand planning policies formulated for the DM in the Chittagongmetropolitan city would provide adequate policy guidelines forthe other vulnerable cities, towns and urban areas in reducingdisaster vulnerability of around 100 urban centres situated alongthe coastal region which suffer frequent disaster severe damagesalmost every year in Bangladesh.

41
1.4 Objectives of the Research
The following are the objectives of the research
a. To identify the metropolitan areas affected by thecyclone and storm surge on 29 April 1991.
b. To investigate into the land-use pattern of the studyarea.
c. To delineate the city areas vulnerable to cyclonedisaster.
d. To formulate planning and land-use policies for disastermanagement in the metropolitan city of Chittagong.
1.5 Methodology of the Research
A proper methodology is always necessary for the successfulcompletion of a research work. It is helpful regarding theorganisation of the experiences, observations, examinations andanalysis of found data and information and their logicalinterpretation in a systematic process to achieve the ultimategoal and the objectives of the research. The following activitiesare proposed for the successful implementation of the researchwork:
1.5.1 literature Survey :
An extensive survey of all the available and relevant literaturewas made to analyze the findings and recommendations of differentjournals, research publications and study reports related withthis research topic. At the same time this tool of literaturesurvey has been used to collect secondary data and informationalso.
42
1.5.z Data Collection :
Secondary data and information have been collected from thelatest census report (1991) as well as various government andnon-government organizations such as chittagong city Corporation(CCC) , Chittagong Development Authori ty (CDA) , SPARRSO,Bangladesh Meteorological Department (BMD) , Chittagong WASA,Bakhrabad Gas Systems Ltd. and concerned non-governmentorganizations (NGO). Besides this, some relevant data andinformation was collected from the UNCHS/UNDP assisted chittagongStructure Plan Project and its research publications.
1.5.3 Land-use investigation in the Study Area :
A detailed land-use survey was carried out to investigate intothe land-use pattern of the study area. Study of 1961 ChittagongMaster Plan as well as the SPARRSO land-use map (1989) forchittagong city area has been incorporated in this research whichhelped providing a lot of information regarding the study area.Depending upon the purpose of the research, different land usesof 10 categories have been incorporated in the investigation .These are planned residential, unplanned residential, commercial,industrial, cultivated land, hilly area, tied area, unclassifiedarea, mixed area and others.
I.5A Identification or the atreded area in the 1991 cyclone:
The metropolitan areas affected by 1991 cyclone has beenidentified by comparing land level (in the city area) withmaximum surge inundation level during the cyclone ..The affectedareas has been categorized into two categories such as severelyaffected, and less affected based on the depth of inundationcaused by the cyclonic storm. Moreover to justify the identifiedaffected ares as well as to acquire practical knowledge about theaffected areas of the 1991 cyclone and storm surge, a detailedinvestigation of the urban land was carried out in the studyarea.

43
ISS Preparation of Maps :
A detailed land-use survey was carried out in the study area toidentify the recent changes in land-use pattern and to preparean upto-date land-use map for the city area. On the basis of thissurvey, a latest land-use map has been prepared along with othermaps showing major public establishments, primary schools/cycloneshelters, hat/bazar and shopping centres, and major road networkin the city.
105.6 Identification of the risk anas :
The risk areas regarding cyclone and storm surge disaster hasbeen identified on the basis of data and information availablefrom previous cyclones and storm surges (especially the 1991cyclone) with special emphesis on the existing land used patternin the city. Moreover by comparing the highest surge height withthe city land level map, the risk areas of the city wereidentified and delineated on the basis of damage to life andproperty. The identification of the risk areas has been madeunder two categories - high risk area (HRA) and risk area (RA).Thus the areas affected by cyclone with storm surge of more than1.00 meter height has been classified as HRA and the areassuffered by cyclone with storm surge up to 1.00 meter height hasbeen designated as RA. Besides this the north-eastern fringe areabeside the Karnaphuli river has been delineated as low lying area(LLA) owing to its low land level which is prone to tidal floodson different occasions. It is also significant that specialemphasis has been given on the existing land use patternregarding the delineation of the HRA, RA and LLA along with thelevel of storm surge inundation in the city.
105.7 Housebold Survey in the Vulnerable Area (liRA and RA):
A questionnaire survey was carried out among the people of thevulnerable area to record their reactions about the disasterrisks and their preparations for the future disasters. The surveyincludes population of different walks of life such as,
(

44
fishermen , agricultural farmers, businessmen, industrial workers,government employees and community leaders(including schoolteachers and religious leaders etc.) of the same area. A totalof 200 questionnaire survey were conducted in the different partsof the vulnerable area severely affected by the 1991 cyclone andstorm surge out of which 100 survey were administered in the HRAand the remaining 100 were carried out in the RA of the city. Toget a real picture of the natural disaster (occurred in 1991)after such a long time, the questionnaire survey was conductedamong the disaster hit people of the area who did not leave thehouses during the cyclone (and personally experienced the naturaldisaster) and ultimately could managed to survive on the fatefulnight of 29th April 1991. In view of including the right personsin the interview, especially who suffered the natural disaster,the researcher made detailed discussion explaining the aim of thesurvey almost in every spot and picked persons randomly for theinterview. Moreover the researcher depended on the people'sopinion from the surrounding areas regarding the inclusion of theproper persons in the interview.
1.5.8 Interview of tbe Utility Service and City DeYdopment Agency Officials:Officials of different utility services and city developmentagencies were interviewed to collect information about naturaldisasters and their impacts on public agencies and theirpotential in the mitigation of natural disasters in the city.These agencies are - CWASA, T&T, Power development Board (PDB),Bakhrabad Gas systems Ltd., Chittagong city Corporation (CCC),and Chittagong development Authority (CDA).
1.5.9 Terminologies Used :Cyclone is a common natura) phenomena in this region and it isalready well accepted and recognized by every quarters of peoplethat we have to find out ways and means to fight the naturaldisaster to live with it having minimum disaster impact on livesand property. This can be achieved through an appropriatedisaster management plan to discourage the concentration of
45
people in the high risk areas, and directing development awayfrom the hazardous areas to the safer locations.During the last two decades the international community hasbecome increasingly alarmed by/disasters, which have tended tobe more destructive as they affect over large concentrations ofpopulation. While the response of the international community hasbeen focussed primarily on relief action, it is now realized thatthe actual and potential consequences of disasters are becomingso serious and increasingly global in scale, that much greateremphasis will henceforth have to be given to planning andprevention.
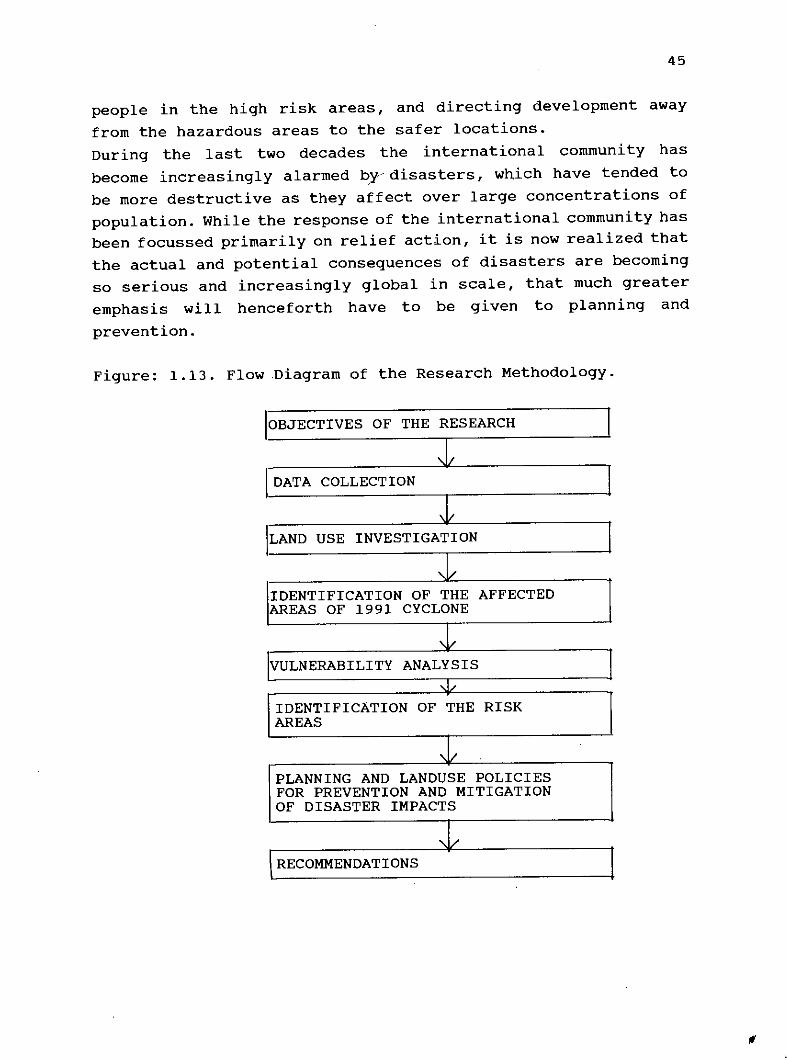
Figure: 1.13. Flow.Diagram of the Research Methodology.
IOBJECTIVES OF THE RESEARCH
I DATA COLLECTION
ILAND USE INVESTIGATION
IDENTIFICATION OF THE AFFECTEDAREAS OF 1991 CYCLONE
VULNERABILITY ANALYSIS
IDENTIFICATION OF THE RISKAREAS
PLANNING AND LANDUSE POLICIESFOR PREVENTION AND MITIGATIONOF DISASTER IMPACTS
RECOMMENDATIONS

46
Natural disasters are a formidable obstacle to economic andsocial development. Moreover, in terms of percentage of grossnational product, the losses caused by disasters in somedisaster-prone developing countries more than wipe out any realeconomic growth. There has thus been a growing awareness byGovernment of the need to focus more attention on disasterpreparedness and prevention, and a recognition of the fact thatdisaster prevention and pre-disaster planning should be anintegral part of the national development policy.
In a disaster-prone developing country like Bangladesh, land-useplanning and control for disaster prevention and mitigation mayact as a spur to comprehensive land-use planning, specially wherenatural disasters have become a permanent development problembecause of their intensity and frequency. Land-use planning andcontrol are principally aimed at reducing the risk of disasterby reducing the damage probability through the application ofmeasures to steer development away form the areas exposed tosevere natural disasters (UNDRO, 1977).
1.5.10 Existing Planning principles in the City :
The existing planning principles practiced by the concerneddevelopment agencies are not oriented towards prevention andmitigation of natural disasters in the metropolitan city ofChittagong. The city area experienced severe damage to life andnational property during previous cyclones which occur almostevery year in Bangladesh. In spite of this circumstances thereexist no pOlicy guide line or zoning regulation for disasterprevention and mitigation in the city. As a result of whichdevelopment activities are being carried out without anyforesightedness along with the massive development activitythroughout the whole vulnerable area of the city. This types ofunplanned development in the risk areas of the city contributeto the heavier loss of life and property due to high urbanconcentration with related activities.
47
1.6 Limitationsof the Study
The following are the limitations of the research which areconsidered as constraints on the way to completion of the studyand these can be explained as follows:
(a) In absence of adequate land-use and zoning regulations forthe future development of the port city, low lyingagricultural land in the vulnerable areas of the city isundergoing rapid development activity in a haphazardmanner. So it is really difficult to assess the disastervulnerability of the city land regarding future naturaldisasters putting special emphasis on potential disasterdamage of existing urban land-use. Therefore, for thedelineation of risk and high risk areas, surge height hasbeen taken into account as the main guiding factor alongwith existing land use of the vulnerable land.
(b) Information regarding 1991 cyclone in the study area hasbeen collected through personal interviews among the peoplewho experienced the natural disaster. still there arechances, that the information collected after four years ofthe occurrence of the cyclone and storm surge may have somedistortions or can be biased to some extent. As aconsequence, the risk areas may fluctuate depending uponthe nature of information received through interviews.
(c) since the complete data regarding previous cyclones(excepting 1991 cyclone) over Chittagong city area are notavailable, the 1991 cyclone has been considered as the mostdevastating one which furnishes adequate informationregarding the natural disaster to facilitate the properimplementation of the research work.
•
48
1.7 Organization or the Study
This study is structured into seven chapters. The first chapterpresent background of the study, history of the tropical cyclonein the Bay of Bengal, 1991 cyclone and its effects, the rationaleof the study, objectives, methodology and limitations of thestudy.
The second chapter of the study presents information about theregional setting of the study area along with its physical andadministrative setting and socio-economic profile of the peopleliving in the area.
The third chapter includes the definitions of the disaster anddisaster management, descriptions about how disaster managementis done, disaster management in Bangladesh, disaster managementin 1961 Chittagong master plan and disaster management in therecently prepared structure plan for Chittagong.
The fourth chapter of the study deals with existing land-use anddisaster vulnerability of the study area which includes landlevel and level of inundation due to surge, delineation of thevulnerable areas in the city, land-use pattern of the study area,major public establishments in the study area, socialinfrastructure in the study area, physical infra-structure inthe study area, land use vulnerable to storm surge and utilityand services in the study area.
The fifth chapter of the study deals with community response todisaster vulnerability and its management, presents experienceand suggestions of the disaster affected people as well asopinion of the utility service and city development agencyofficials about disaster vulnerability of the risk areas (HRA andRA), potential disaster mitigation measures and publicinitiatives for the prevention and mitigation of disaster impactsin the city area.

49
The sixth chapter of the study is concerned with the concept ofland-use planning, land use components and the mitigation ofnatural disasters through land-use planning policies.
The final and the seventh chapter has been designed to putforward some policy recommendations regarding the prevention andmitigation of natural disasters through planning and land-usepolicies in the metropolitan city of Chittagong.
. .~o _,_ >;_ "o~""
- • :-f/Jfr ~ __
.Cl~' 2-(-- :~~,....'" .. ....~-~...•_.J t • . .
., _.\ r ..•• ~ .T1. .•• -
. \o'.(.~~ i -"~.•• , I _ .- .•"0 .•..~....• .•.. '......•-- -
'" - ,,) 0.. -. ~.
i ' 0 ••• "
,. . .. .• •, .
{• J:.-. '- --.
h _' •••
_.---....
- - - ". >\. - .
--.
CHAPTER TWO
PHYSICALliD SOCII-ECIIIMII:PBIFllE IF THESTIDY AIEl

CIIAI'TER 'tWO
PHYSICAL AND SOCIo-ECONOMIC PROFILE OF THE SfUDY AREA
2.1 Intnlduction
The 'Port City' and the major industrial centre which is alreadybeen declared as the 'Commercial Capital' of Bangladesh ispopularly known as the holy land of 'Baro Awlia' (twelve saints)at the same time. Under the jurisdiction of Chittagong CityCorporation the city contains around 160 sq. kilometers of urbanarea which accommodates 41 city wards within her boundary.Besides these, the study area is composed of 6 thanas. These are-Bandar, Pahartali, Kotowali, Double Mooring," Panchlaish andChandgaon thanas. A detailed discussion regarding the city wardsand thanas has been made under the heading of Administrativeunits (2.1.1). The most significant character of the city is herbeautiful landscape which is composed of three natural features-the Bay of Bengal, the huge hilly terrain and the Karnaphuliriver. The Bay of Bengal is on the west, the hilly terrain islocated at the north west and the Karnaphuli river which isrunning from east towards south east, finally meets the Bay ofBengal at the southern end of the metropolitan city. Thesenatural features and their exceptional blending with the totalcity environment has contributed the overall growth of the urbanarea as the second important metropolitan city of the country.Moreover, for the richness of the natural beauties, the city wasonce known as the "Queen of the East" to the people of the west(EPI publication, CCC, 1989).
The city plays an important role in the national perspectivebecause of her contribution in the field of port, and shipping,trade and commerce, industries etc. Presently a major portion ofthe countries port activities and import/export functions arebeing operated through this port. As a consequence, differentbusiness and trade activities have been developed as linkactivities in the city, where people from different walks of lifeare engaged. As the city is growing and the people from differentparts of the country are migrating in the city for occupation orbetter earning opportunities, these activities and related trades
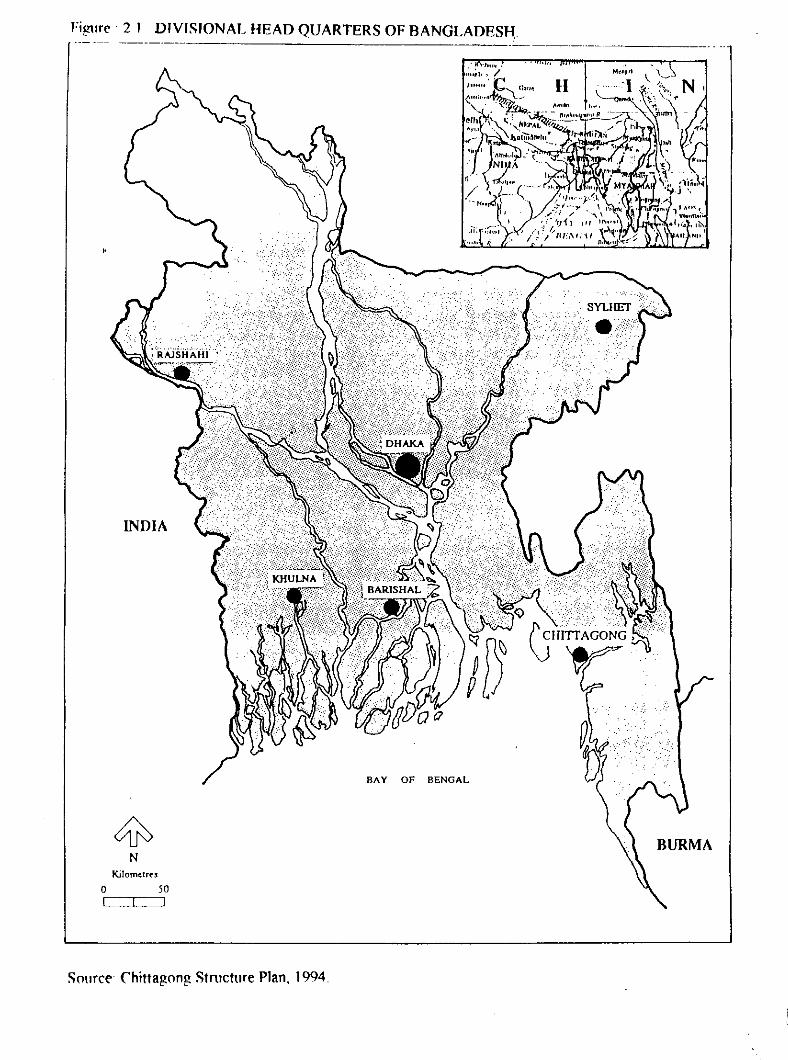
Fi!-'1lre. 2 I DIVISIONAL HEAD QUARTERS OF BANGLADESH:---_ .._.__._-----------------------------_. __ .._-------
INDIA
NKilometre,
o 50L_c::J
Source Chittagong Stmcture Plan. 1994.
BA Y OF BENGAL
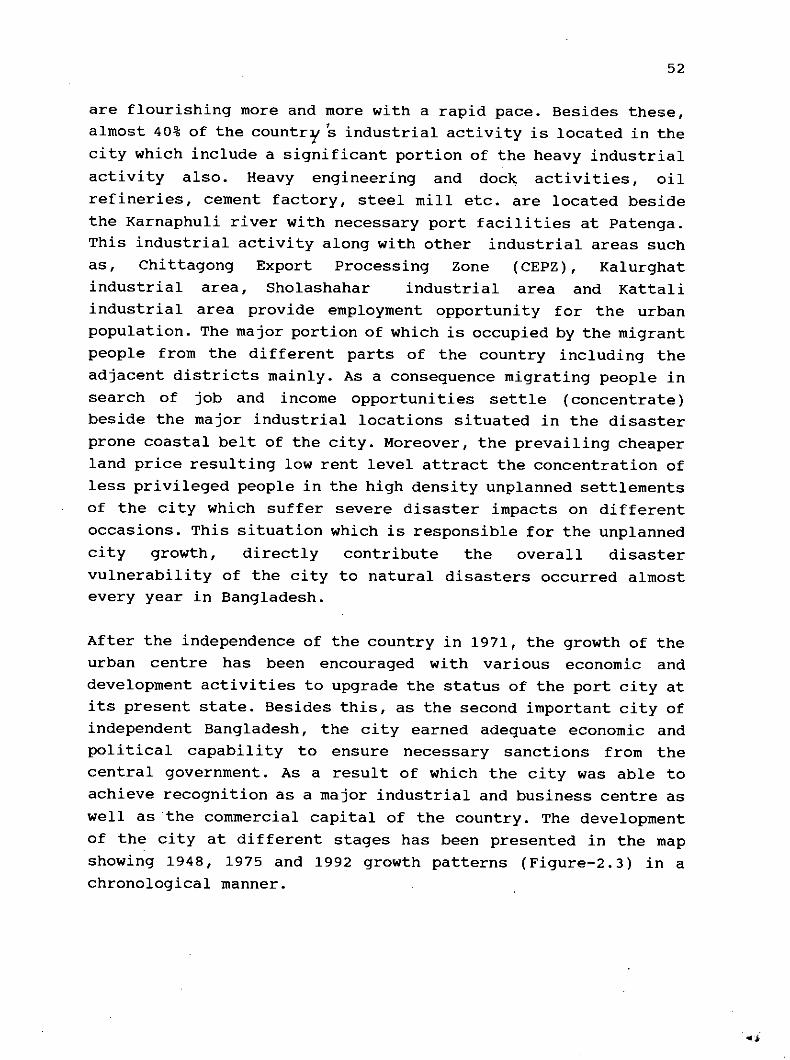
52
are flourishing more and more with a rapid pace. Besides these,almost 40% of the country's industrial activity is located in thecity which include a significant portion of the heavy industrialactivity also. Heavy engineering and dock activities, oilrefineries, cement factory, steel mill etc. are located besidethe Karnaphuli river with necessary port facilities at Patenga.This industrial activity along with other industrial areas suchas, Chittagong Export Processing Zone (CEPZ), Kalurghatindustrial area, Sholashahar industrial area and Kattaliindustrial area provide employment opportunity for the urbanpopulation. The major portion of which is occupied by the migrantpeople from the different parts of the country including theadjacent districts mainly. As a consequence migrating people insearch of job and income opportunities settle (concentrate)beside the major industrial locations situated in the disasterprone coastal belt of the city. Moreover, the prevailing cheaperland price resulting low rent level attract the concentration ofless privileged people in the high density unplanned settlementsof the city which suffer severe disaster impacts on differentoccasions. This situation which is responsible for the unplannedcity growth, directly contribute the overall disastervulnerability of the city to natural disasters occurred almostevery year in Bangladesh.
After the independence of the country in 1971, the growth of theurban centre has been encouraged with various economic anddevelopment activities to upgrade the status of the port city atits present state. Besides this, as the second important city ofindependent Bangladesh, the city earned adequate economic andpolitical capability to ensure necessary sanctions from thecentral government. As a result of which the city was able toachieve recognition as a major industrial and business centre aswell as the commercial capital of the country. The developmentof the city at different stages has been presented in the mapshowing 1948, 1975 and 1992 growth patterns (Figure-2.3) in achronological manner.
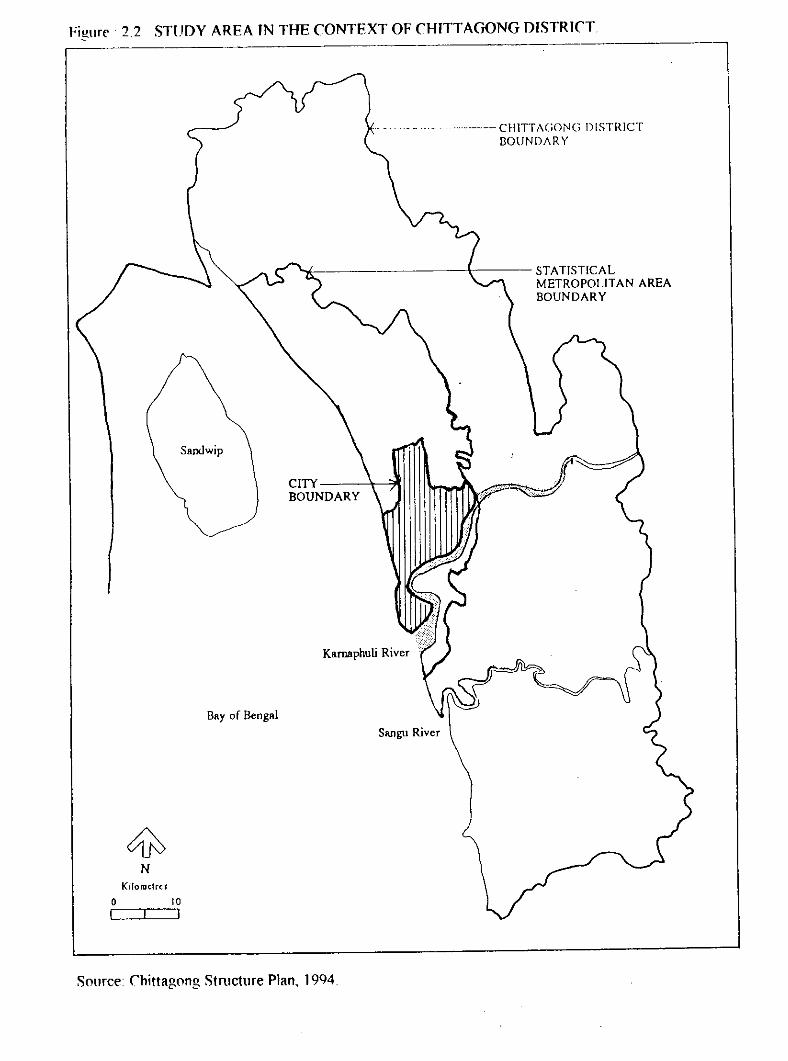
Figur{'.2.2 STUDY AREA TNTHE CONTEXT OF CHITTAGONG DISTRICT
........ _ __._- CHlTTAGON(; DISTRICTBOUNDARY
Kamaphuli River
o 10I I
STATISTICALMETROPOLITAN AREABOUNDARY
CITYBOUNDARY
Sandwip
Kilomelres
Bay of Bengal
Sourc{' Chittagong Stmcture Plan, 1994.

<t:IJJ0:: .t<t: 0-.
>- 0-
@ r<t:Cl
Vl U
~
~~.-c:
~ 1-.-<i>
0.<:0 -:lZ <t:0:: <" -IJJ c
'"f: •• E0..
<t: 00.. 'i•. ..._-iiI' ...• Q)
~
G" >'"
ICl
,j bll0 CIfI1lAGONG REGION c
I 00:: , bll
" SCMf"' 1:100,000 ;,\"-- '"to:M :E•... ,
C-U
I OJ
'" !., u -~.... ) :l51, I 0 \Jii: Vl
55
After the independence of the country, the study area was hit by4 major cyclone disasters in 1974, 1983, 1985 and 1991 (BMD,1991). Among these cyclonic storms, the 1991 cyclone was thesevere most which surpassed all previous records regarding windspeed and storm surge inundation.
The city area experienced a huge disaster damage in the 1991cyclone and storm surge. out of around 1.5 million people in thecity area 1071 were killed while 10,76,172 people became severelyaffected by the natural disaster. A total of 75,495 houses werefully damaged leaving 2,17,300 households affected by the cyclonein the city. Besides this, according to Chittagong cityCorporation (CCC), out of a total of 41 wards in the city, 8wards (19.51%) were affected severely, 9 (21.95%) wards wereaffected moderately and the remaining 24 (58.54%) wards were lessaffected in the 1991 cyclone. The city wards affected severelyby the cyclone exist beside the coastal area. These are - Wardno 34. uttar Kattali, 35. Dekshin Kattali, 36. uttar Halishahar,37. uttar - Madhya Halishahar, 38. Dekshin - Madhya Halishahar,39. Dekshin Halishahar, 40. uttar Patenga and 41. DekshinPatenga. Also the moderately affected wards identified by CCC are- ward No.8. Patherghata, 9. Firingee Bazar, 25. Dekshin Agrabad,27. Chandgaon, 28. Mohra, 29 . Purba Sholashahar, 30. PurbaBakalia, 31. Pashchim Bakalia and 32. Dekshin Bakalia. Theremaining city wards which are mostly located in the central partof the city were almost safe during the 1991 cyclone and stormsurge (Figure-4.4)
2.Z Physical and AdministratiYe Profile
2.Z.1 AdministratiYe Units:The study area is composed of 41 city Wards under Chittagong cityCorporation (CCC). These are - 1. Bagmoniram, 2. Chawk Bazar, 3.Jamal Khan, 4. Enayet Bazar, 5. Dewan Bazar, 6. Anderkilla, 7.Alkaran, 8. Patherghata, 9. Firingee Bazar, 10. Boxirhat, 11.Sulak Bahar, 12. Paschim Sholashahr, 13. Dekshin Pahartali, 14.Jalalabad, 15. Lalkhan Bazar, 16.Purba Madarbari, 17. PaschimMadarbari, 18. uttar Pathantooli, 19. Pathantooli, 20.

Figllrt" 2.4 ADMINISTRATIVE UNITS UNDER CHITTAGONG CITY AREA.
ze
~' •••PI.' NIIMf,FJ; AN/) N.'\Mi
}' \.,." ...n '.t •••• r""hl," P.h,I."14 lIlI" ••••,.hodl' Cotl.,\,. "',U',lIJ111 P•••••••••11 C••••d.oo.11 Mo•••10 Porbo S•.• I&,•••• ,)l P.,bo8••~1,.II P••• ,. Ra~~I,.)) Il..\.\il Ji.~.,1••
." R"'r"'14 II" ••K,IIII,.1\ l)o~.~••~.,,,h:\"0 01t •• 1I.1" •••••,/ 1111 •• M •.•,.,.I'"1i,~.~",..-...-'lJo I••.~•••M.,t\J.Il.I ••~••••1'1 0 •.\, ••• llolo,h ••• , •••••••.••, II"., roo •• ,.
II 1:...••••• 1'••• ',.
I ('",i ••,.•" ••1 ('.~.~ (\0",!o 1•••• 1 Kh ••• &: •• ", &.UI~ 0,.., •• B.UIo A.doei~.l"J 11.1\., ••_ rl,h ••••u9 Fili,."u BUI'
II') 9"1;''''II S.I •• "'".,il p_". noh,hll ••I~ Dd.\i.",,,,,.1014 hl.r.hodI~ l.l~\••'''-n"I" '.,b.M•.•.•.•.•.,I' 1'•••.•••M•..•" •••••,U II" •• 1'••••• '",,1,III ",,,,,, •• .,11}rl fj •.•••,I." •••
210
14
34
.•..---"' .••,
---•.••..•.. / ..•-
/~~~
~/-
"I'~--\I \ \
'\ I \ \ 0' 1/,_~ )/ II •.••.• _ •.. .-_ •..••.! 27 / / ., ~ / \.J-"l~- \ I I (
/ '12 / ;,-rJ
\ I '.\ 22 \. n \ I -.1' )
' : \ r",<'_~- l I~\ \.. ~ \ - I\ \, ,- ~ i 29 / I~ _--J-----, __\' /-- --_ .J' _----,/ \ .I. •••J •••••••••••••••'., ••••.•- •••••••<o,J--< I ,...•.....1. J:.,.. I I
\ ',2-3' \ l 2 /~ \ ..• " 15 I 1 L.••
• 1 21', )-'.... \ ',I-, ~- .••••• I......_,-r- .....----/
\\\\ l
\ ...•••.• >,.)
!, ...•~ ' ......•I - _ .•••-~
~
0
3~
,.<
//
on ,.-
w
m
o
Kilometre!.
o I 11__ L_:::J
SOllrct" Chitlngong City CorporHtion, 1992.

57
Goshaildanga, 21. Saraipara, 22. uttar Pahartali, 23. Pahartali,24. uttar Agrabad, 25. Dekshin Agrabad, 26. Panchlaish, 27.Chandgaon, 28. Mohra, 29. Purba Sholoshahar, 30. Purba Bakalia,31. Paschim Bakalia, 32. Dekshin Bakalia, 33. Rampur, 34. uttarKattali, 35. Dekshin Kattali, 36. uttar Halishahar, 37. uttar-Madhya Halishahar, 38. Dekshin-Madhya Halishahr, 39. DekshinHalishahar, 40. uttar Patenga and 41 Dekshin Patenga wards asshown in the ChittagongCity Ward map (figure - 2.4). Theadministration of the wards are run by the respective wardcommissioners directly elected by people's vote. These electedrepresentatives are solely responsible for the developmentactivities within the individual ward boundary by Chittagongcity corporation. The city Corporation is headed by the 'Mayor'who is directly elected by city people. Other than this, thereare 6 thanas within the boundary of chittagong city corporation.These are - Bandar, Kotwali, Pahartali, Panchlaish, chandgaon,and Doublemooring thana, which are under direct control of thedistrict administration headed by Deputy commissioners (DC). TheMayor has a little official control over thana and districtadministration although he is the people's representative toensure better services to the city people. Consequently, thereis no defined margin between the local government and centralgovernment responsibilities in the city. As a result of whichlocal administration is often dominated by the central governmentdecisions regarding major development issues in chittagong city.
Z.2.Z Locatiooal Character.
Chittagong is located in the extreme south east of the countrybetween 20°-35' and 22°-59' North latitude and.910-27' and 92°-22'East longitude. The city is situated on the Northern bank ofKarnaphuli river having a central location in the district mapbordering the Bay of Bengal on the West. The study area ispartially located on the high risk area of the country as shownin figure 1.7 and 1.8. The northern part of the city is composedof huge hilly terrain and is free from the risk of storm surgeinundation.
58
2.Z.3 Physical Features:
The city area is surrounded by the hilly terrain on the north,the Karnaphuli river on the south- east and the Bay Bengal on thewest. The western part of the city is coastal area which isaround 3.0 m high from the mean sea level (MSL) and is prone tonatural disasters such as clones and storm surges. The Easternpart of the city consists of low laying agricultural land andexperiences seasonal flood due to the close proximity to theKarnaphuli river. This area is around 2.0 m high from mean sealevel (MSL). The remaining north-western part of the city iscomposed of hilly terrain which is around 15 m high from the meansea level (MSL). So because of the safe location and adequateheight from the mean sea level, the hilly area is free from therisk of natural disasters and storm surge inundation.
Climatic Character:
The study area is situated in the tropical zone and as such itis subject to tropical climate. But this situation with a sea tothe west and ranges of hills to the north-west has neutralizedthe extremes of the climatic changes to a considerable extent.It forms a belt of country narrow compared with its breadth,lying along the coast backed by hilly region to the north thusmaking an arrangement favorable for free play of land and seabreezes. The movement of the air from a comparatively cool regiontowards the highly heated plains causes a uniformity oftemperature more marked than in other parts of the region andanother feature of these sea winds is the excess of moisturecarried in land which gives rise, upto some distance from thecoast, to heavy dew and occasional fogs. The position of thedistrict on the coast line of the north east angle of the Bay ofBengal also helps to get the heavy rains as 'the moist winds ofthe south- west monsoon converges in this direction. Chittagongis remarkable for uniform temperature, high humidity and heavyrainfall from May to October. The climate is thus moist, warm andequable; vegetation is luxuriant and the country is greenthroughout the years.

59
Seasons:
As a rule January and February months are cold and dry. March,April and May are hot, but have some wet days and there areoccasional storms from the north-west varied by breezes from thesouth and south - east. June July and August are almost entirelywet, while September is wet and steamy with a hot sun. From Juneto September is the monsoon season. The monsoon season generallycomes with a cyclone and ends with a cyclone. October has 7 or8 wet days. While November usually has 3/4 stormy days, butotherwise the weather is fine and dry and a north east wind ~blows. December is cold and fine.
Temperature:
The average maximum temperature is lowest in December andJanuary, when it is about 43.78°C and highest in April, when itis 49.33°C, giving a variation 5.55°C. The variation in minimumtemperature, however, is nearly double as great, rising from33.55°C in January to 42.22°C in June, i.e., about 12.22°C. Thesmaller variation in day temperature is due to the moderatinginfluence of the sea breezes, in consequence of which thetemperature near the coast is not much higher than at sea. FromNovember to February the temperature is 5.55°C to 8.3 3°C lowerthan during the monsoon season when the mean temperature variesfrom 46.44°C to 45.72°C during these months the sky is almostcloudless, but owing to the proximity of the sea humiditycontinues high. The daily range of temperature, as given by thedifference between the average maximum and average minimumtemperatures, month by month varies from 10.28°C to 12.78°C inthe cold weather months, and it falls as low as 5.29°C in July.During the monsoon months it is never more than 5.83°C. But itincreases rapidly after October and reaches its maximum inFebruary. The highest temperature recorded at Chittagong since1870 is 56.110C in 1888 and lowest 25.00°C in 1878 giving a totalrange of 31.11oC.
60
Humidity:
The humidity is lowest in January and February, after which thereis a steady and slow increase till May., with the commencementof the monsoon in June, there is a heavy increase of humidity,but because of the heavy rainfall in July, humidity does notreach its maximum till September when there is 91 per cent of thesaturation. During the whole monsoon it varies from 80 to 90 percent.
Wind:
In October the wind blows most frequently form the north, andduring the next four months there is a steady, slow change ofdirection; the wind blowing from the west. In March the windblows usually from the north during the night and from the southduring the day, but as the month advances the southerly windgradually increases until it prevails entirely. During themonsoon months, the wind blows from the south-east and the airsteadily becomes more charged with moisture till September,which is the dampest month in the whole year.
Rainfall:
Because of the differences of elevation and the increasing heightof the hills towards the east and north-east, the rainfall variesconsiderably from place to place, usually diminishing towards thenorth. Thus the annual normal rainfall is 2592.83 mm atchittagong. In Chittagong 264.67 mm falls in May, 533.1 mm inJune, 597.66 mm in July, 518.67 mm falls in May, 533.15 mm inJune, 592.58 mm in July, 518.67 mm in August, 180.09 mm inSeptember and 180.09 mm in October; from December to April it islighter than in other districts. In June, the rain fall becomesmuch heavier, and there is a further increase in July after whichthe amount diminishes rapidly.
"
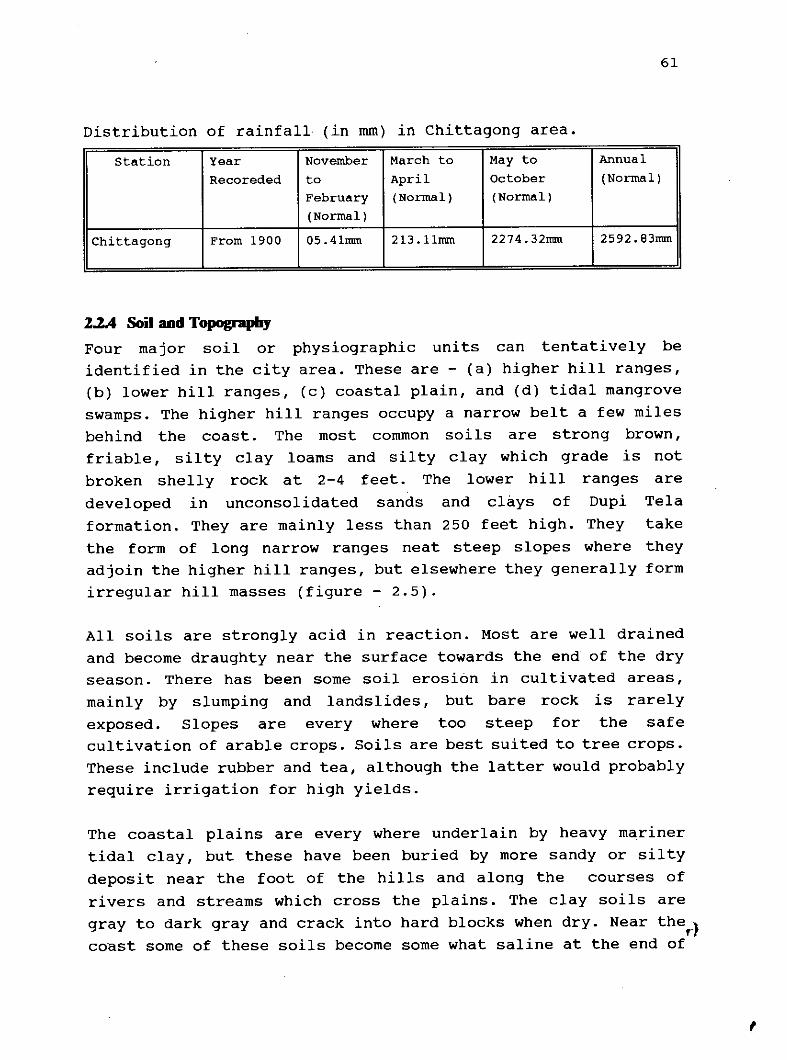
61
Distribution of rainfall (in nun) in Chitta gong area.Station Year November March to May to Annual
Recoreded to April October (Normal)February (Normal) (Normal)(Normal)
Chittagong From 1900 05.41mm 213 .11mm 2274.32mm 2592.83mm
2.zA Soil and Topography
Four major sailor physiographic units can tentatively beidentified in the city area. These are - (a) higher hill ranges,(b) lower hill ranges, (c) coastal plain, and (d) tidal mangroveswamps. The higher hill ranges occupy a narrow belt a few milesbehind the coast. The most common soils are strong brown,friable, silty clay loams and silty clay which grade is notbroken shelly rock at 2-4 feet. The lower hill ranges aredeveloped in unconsolidated sands and clays of Dupi Telaformation. They are mainly less than 250 feet high. They takethe form of long narrow ranges neat steep slopes where theyadjoin the higher hill ranges, but elsewhere they generally formirregular hill masses (figure - 2.5).
All soils are strongly acid in reaction. Most are well drainedand become draughty near the surface towards the end of the dryseason. There has been some soil erosion in cultivated areas,mainly by slumping and landslides, but bare rock is rarelyexposed. Slopes are every where too steep for the safecultivation of arable crops. Soils are best suited to tree crops.These include rubber and tea, although the latter would probablyrequire irrigation for high yields.
The coastal plains are every where underlain by heavy marinertidal clay, but these have been buried by more sandy or siltydeposit near the foot of the hills and along the courses ofrivers and streams which cross the plains. The clay soils aregray to dark gray and crack into hard blocks when dry. Near theftcoast some of these soils become some what saline at the end of
,

Fil;lIfr ' 2 5
trWIA
•0",,.!•,
BENGALo FU A ,
".
".
".
ft' Ranoladrsh in MapsSoufe,. '"
63
the dry season, but the monsoon rains clear the salts so thatcrops can be grown. These soils are used for the transplanted'aus' and 'aman' paddy and are grazed by livestock in the dryseason (Gazetteer).
In the city area there are a good number of hillocks scatteredwith irregular valleys at different levels. The northern part ofthe city is specially notable in this regard. Some importantpublic and private buildings are located on the hill tops. Thevalleys are plains in between the hillocks are mainly occupiedby slum developments and the rest of the places are being usedas commercial or agricultural activities in the city.
2.3 Soc:io-Ec:ooomic Profile
2.3.1 Settlement Pattern:The port city which is one of the major industrial centre of thecountry reflects its individual urban character in the existingsettlement pattern of the city. The settlement pattern in thecity area is mostly urban in character with urban utility andservice facilities, excepting some peri-urban settlements. Theperi-urban settlements are all composed of structures mainlybuilt of permanent or semi-permanent building material and thetemporary structures are rarely seen in the central city area.The central part of the city composed of multi-storied and highrise structures which occupy various public and privateactivities within them.
The traditional rural settlement pattern which ischaracterized by a number of houses grouped around a courtyardor 'uthan' forming a cluster and a number of clusters aretypically arranged around a pond or along a river with adjacentagricultural land as a source of livelihood for inhabitants, isalmost rarely observed in the city area. There are some ruralsettlements situated in the fringe areas of the city such asKattali, Halishahar, Patenga, Chandgaon, Mohra, Bakalia areundergoing transformation due to the rapid urbanization processin the city.
64
There are some planned settlements in the city which are almostcentrally located and are dominated by huge unplanned settlementsthroughout the whole city. Besides these, there are squattersettlements haphazardly located allover the city mainly closeto the work places and occupy cheaper land or khas land. Mostof the unplanned settlements including these squatter settlementsalong the coastal belt are vulnerable to cyclones and stormsurges and contribute to the heavier disaster loss during variousnatural events.
2.32 General Life Style of the People:
The metropolitan city of Chittagong is significant for business,commerce and industrial activities which playa very vital rolein shaping the general life style of the people living in theChittagong city area. The major part of the city populationengaged in various employment and .trade are migrated from thedifferent parts of the country. Majority of the daily labourers,rickshaw pullers, household workers, hawkers etc. are also theresults of rural to urban migration in the city from thedifferent parts of the country, mainly the adjacent districtssuch as Noakhali, Barisal, Comilla etc. are significant in thisregard. The local people are usually engaged in various business,trade and commercial activities including employment in publicor private sector agencies. other than this, local people livingin the fringe areas and coastal areas are partially involved inagricultural activities along with urban activities likebusiness, employment etc. Also there are some fishermencommunities at the north-western part of the city, theinhabitants of which are mostly Hindus and are engaged in fishingand fish selling activities. Besides this, the central part ofthe city including the old city area are mostly inhabited by thelocal people, where as the peripheral fringe areas growing at arapid pace are being noticed to accommodate new urban populationin the city.
\,., ..'
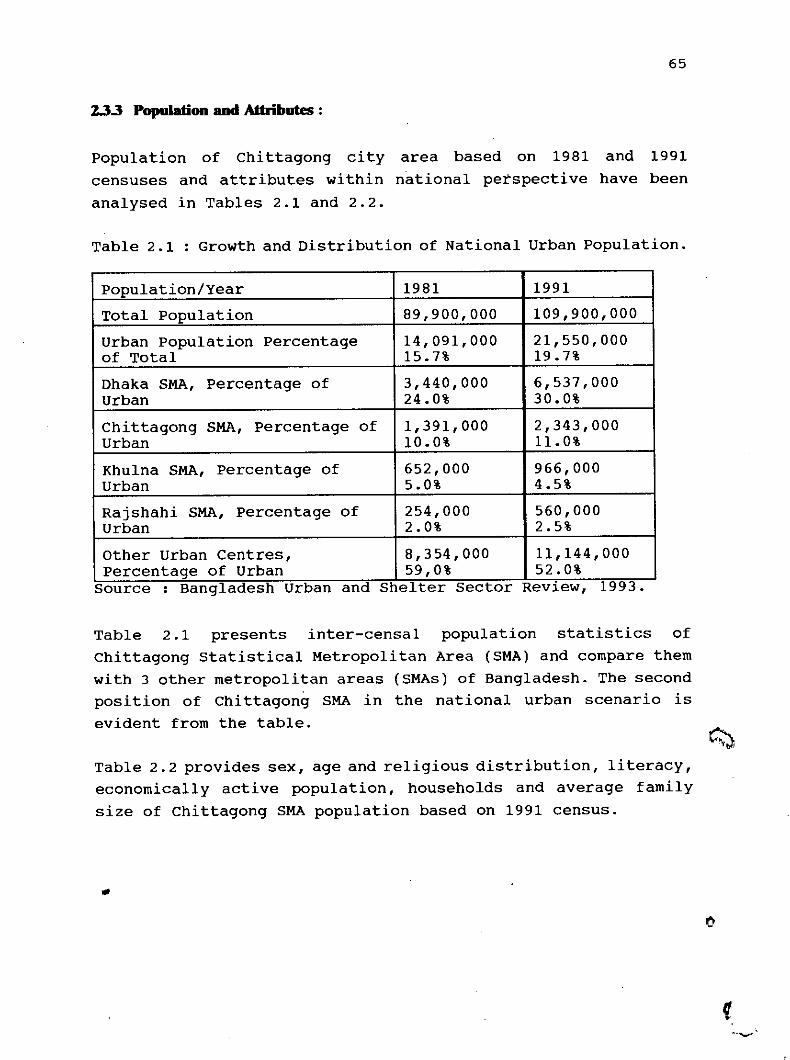
65
2.3.3 Population and Attributes :
Population of Chittagong city area based on 1981 and 1991censuses and attributes within national perspective have beenanalysed in Tables 2.1 and 2.2.
Table 2.1 : Growth and Distribution of National Urban Population.
population/Year 1981 1991Total population 89,900,000 109,900,000Urban population Percentage 14,091,000 21,550,000of Total 15.7% 19.7%Dhaka SMA, percentage of 3,440,000 6,537,000Urban 24.0% 30.0%Chittagong SMA, percentage of 1,391,000 2,343,000Urban 10.0% 11.0%Khulna SMA, percentage of 652,000 966,000Urban 5.0% 4.5%Rajshahi SMA, percentage of 254,000 560,000Urban 2.0% 2.5%Other Urban Centres, 8,354,000 11,144,000percentage of Urban 59,0% 52.0%
Source: Bangladesh Urban and Shelter Sector Revlew, 1993.
Table 2.1 presents inter-censal population statistics ofchittagong statistical Metropolitan Area (SMA) and compare themwith 3 other metropolitan areas (SMAs) of Bangladesh. The secondposition of chittagong SMA in the national urban scenario isevident from the table.
Table 2.2 provides sex, age and religious distribution, literacy,economically active population, households and average familysize of Chittagong SMA population based on 1991 census .
••
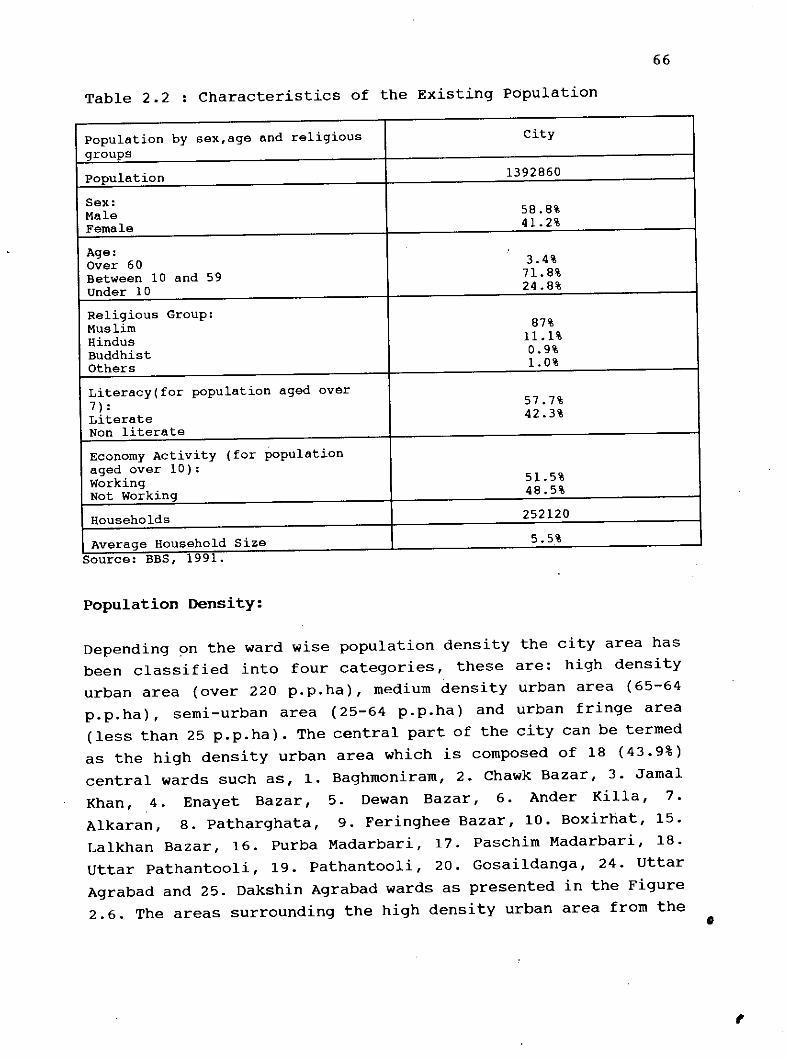
Table 2.2 Characteristics of the Existing population
66
population by sex, age and religious Citygroupspopulation 1392860
Sex:Male 58.8%Female 41.2%
Age:Over 60 3.4%Between 10 and 59 71.8%Under 10 24.8%
Religious Group:Muslim 87%Hindus 11.1%Buddhist 0.9%Others 1.0%
Literacy(for population aged over7): 57.7%Literate 42.3%Non literateEconomy Activity (for populationaged over 10) :Working 51. 5%Not working 48.5%
Households 252120
Average Household Size 5.5%Source: BBS, 1991.
population Density:
Depending on the ward wise population density the city area hasbeen classified into four categories, these are: high densityurban area (over 220 p.p.ha), medium density urban area (65-64p.p.ha), semi-urban area (25-64 p.p.ha) and urban fringe area(less than 25 p.p.ha). The central part of the city can be termedas the high density urban area which is composed of 18 (43.9%)central wards such as, 1. Baghmoniram, 2. Chawk Bazar, 3. JamalKhan, 4. Enayet Bazar, 5. Dewan Bazar, 6. Ander Killa, 7.Alkaran, 8. patharghata, 9. Feringhee Bazar, 10. Boxirhat, 15.Lalkhan Bazar, 16. Purba Madarbari, 17. Paschim Madarbari, 18.uttar Pathantooli, 19. Pathantooli, 20. Gosaildanga, 24. uttarAgrabad and 25. Dakshin Agrabad wards as presented in the Figure2.6. The areas surrounding the high density urban area from the
,

Figllr{' . 2 (, POPI TI.ATlON OENSfTY fN THE CfTY AREA.
WAp.n NUMBER ANI;> HAM:
]1 1) •••• 1'"••7J '.11101 P.hn,hTl P'",l''',. lInl! ••••JI.hod,~ c...I~11..••.~u.,•.116 PUt'!.;I.21 ChlldllO'n Mo",2Q P•••••S•..•'.uhh,:on P.,'" Fh•••I••JI P••.•,. a-'..Ii.n 0,..1';.8"',1"~~ R.",~••,;lA 1I11uK.n.1I)~ 0.-.,.;. Konlh:\1\ V,," 'hh'~'~1131 lIllu M..-1',. 1l.li,h.1lYl I~,,'t. MI<I~", 'hlu~"11)" IN ••~,. II.1ilhh,ill) till", r"~'J''I r;.•~,~,. r"t.~.
Densities are expressed in persons p,er hcaarc:\nd :\re based i)n the 1"411Pr'\publi'~n Cen~u.'re$ulu
I fl"' ••••. lir""'2 ~r.~I•.•{\aUt~ h,ulKlIa/lI E••po' r.•.•ul~ Chll £\0111'6 AlokI.llb1 Al"'n~ P.'.l!'llhll9 Firi ••••• e DUI'
11) D".uh,11 S.l.~ Rroluo,;1 Putkill Sh,.I•••• 1IarI:' Dt •.•• i. r.hrr.li14 '.I.r.t.dI~ ul.~uRu••I'" Porb. Ma.b,tolll11 rudi ••Mad.''''-,iIf: Un" PI'."'",..!,1<1 Pathnh ••.•l1]0 (i..,uiltluI'
lIigh Densily Urban(Over 220 p.p.h.)
Medium Density Urhan(~5-219p.p.h)
Semi urban(25-64 p.p.h,)
llrban fringe(LeS<lh,n 25 p.p.h,)
39
I . .•...•
l "G) .....'.. 'l,...:...:..:3.:" ' .. ' .
14
37
40 ..: '.. ', .'/:.' : .
/ .-.~:-:.'~~':::. ' ..... , G.: ...' . '.' .::.... .. ' '.
2I
0:~or,.I ... : .
. /~f<b..:..~~.;~L' , .•. '!..::J. .,.-' \.' ....
. .. . .. .
N
o
m
7.
m
,.
KilomctresoI
SOllre{' f'hittagong Stmctllr{' Plan. 1994.
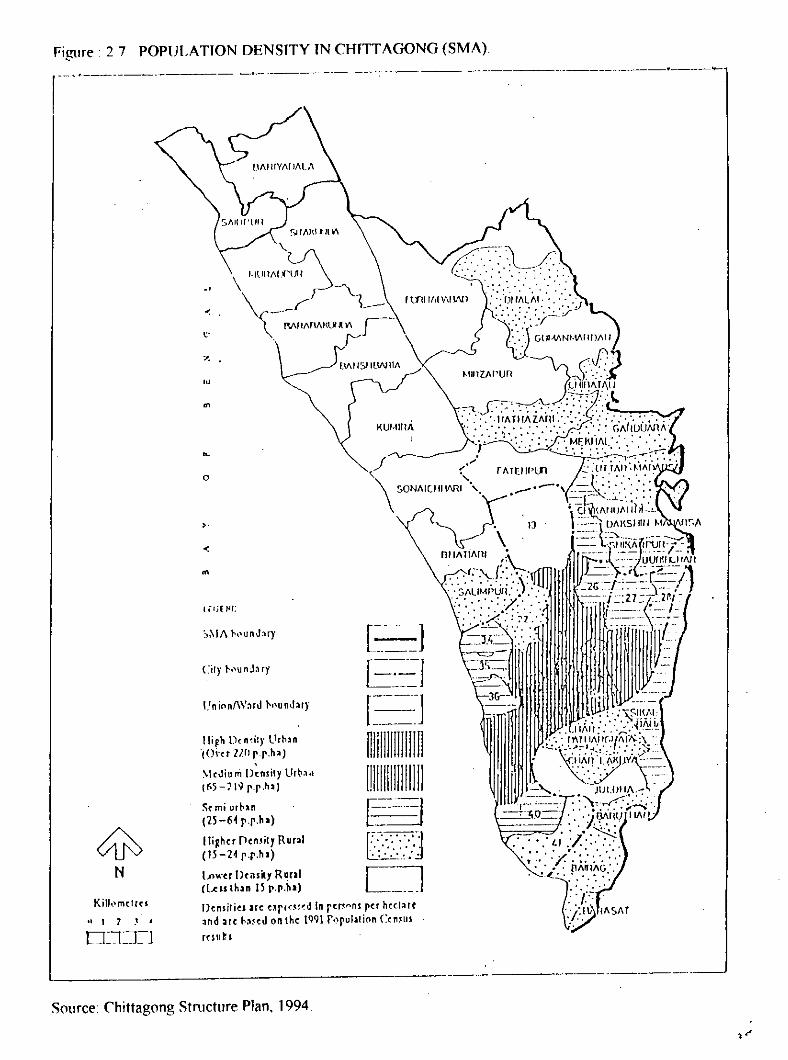
Filo'l,re. 2 7 POPULATION DENSITY IN CHITTAGONG (SMA)
[:=:1E.~j[==-J_._--
mllllllllilm[111111111111111
aC--."~J'.' " ... ';" .. ,.'..... :,: " .
r==J
t iI.if ~1:
- ,
'"
~-
o
S(' mi urt-~n(15-M r.r.h,)lIiRhcr [)cn~ily Rural(Il-l~ r.r.b)
l..ower Dt'ilSlY Runl(Lu. ,h,. 15r.r.h'l
,\1c\l;um Dcnsily lIr!):lol(~5-) 19r.r.ho)
,.
i)cnsilics are c~r(l::w~dIn rCJ1 •..•n1 per hccl:Hf:'IndHe t-:\~ct.l on the lQQl r"rulafion Ccn,uJr('Sllts
lli~hDc n~il)'llrll.1nWi." WI r.r.h'l
.1 I ] .1 I
O=-:LL]
r--"--------.--- -~._- ..---------.-. ---------------.----~
----------- - ._----_._-.
Source Chittagong Stnrcture Plan. 1994.
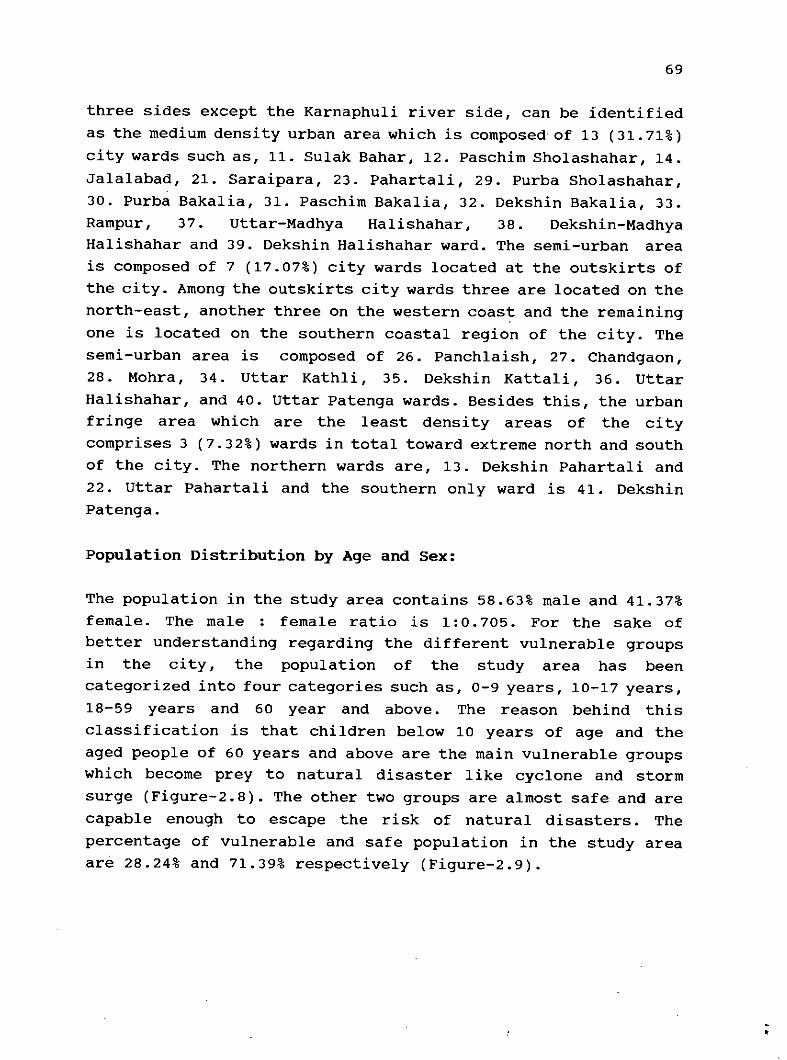
69
three sides except the Karnaphuli river side, can be identifiedas the medium density urban area which is composed of 13 (31.71%)city wards such as, 11. Sulak Bahar, 12. Paschim Sholashahar, 14.Jalalabad, 21. Saraipara, 23. Pahartali, 29. Purba Sholashahar,30. Purba Bakalia, 31. Paschim Bakalia, 32. Dekshin Bakalia, 33.Rampur, 37. uttar-Madhya Halishahar, 38. Dekshin-MadhyaHalishahar and 39. Dekshin Halishahar ward. The semi-urban areais composed of 7 (17.07%) city wards located at the outskirts ofthe city. Among the outskirts city wards three are located on thenorth-east, another three on the western coast and the remainingone is located on the southern coastal region of the city. Thesemi-urban area is composed of 26. Panchlaish, 27. Chandgaon,28. Mohra, 34. uttar Kathli, 35. Dekshin Kattali, 36. uttarHalishahar, and 40. uttar Patenga wards. Besides this, the urbanfringe area which are the least density areas of the citycomprises 3 (7.32%) wards in total toward extreme north and southof the city. The northern wards are, 13. Dekshin Pahartali and22. uttar Pahartali and the southern only ward is 41. DekshinPatenga.
Population Distribution by Age and Sex:
The population in the study area contains 58.63% male and 41.37%female. The male : female ratio is 1:0.705. For the sake ofbetter understanding regarding the different vulnerable groupsin the city, the population of the study area has beencategorized into four categories such as, 0-9 years, 10-17 years,18-59 years and 60 year and above. The reason behind thisclassification is that children below 10 years of age and theaged people of 60 years and above are the main vulnerable groupswhich become prey to natural disaster like cyclone and stormsurge (Figure-2.8). The other two groups are almost safe and arecapable enough to escape the risk of natural disasters. Thepercentage of vulnerable and safe population in the study areaare 28.24% and 71.39% respectively (Figure-2.9).
-•

Figure :2 X POPULATION DISTRIBUTION BY AGE AND SEX
21'55~.
12'75%
2'05 'I.
6'27'/.
6'54 '/.
6'38%
35 - 59
18-34
15 -17
10 -14
5 -9
o - 4
n3"/..
5'76%
2'40"1.
5'63'1.
5'98 %
5'96 '/,
VULNERABLE GROUP
13"96'/.
SAFE GROUPS
VULNERABLE GROUPS
25 20 15 10 5 0
MALE
~()lIrcc HBS, 1991
o 5 10 15 20 25
FEMALE
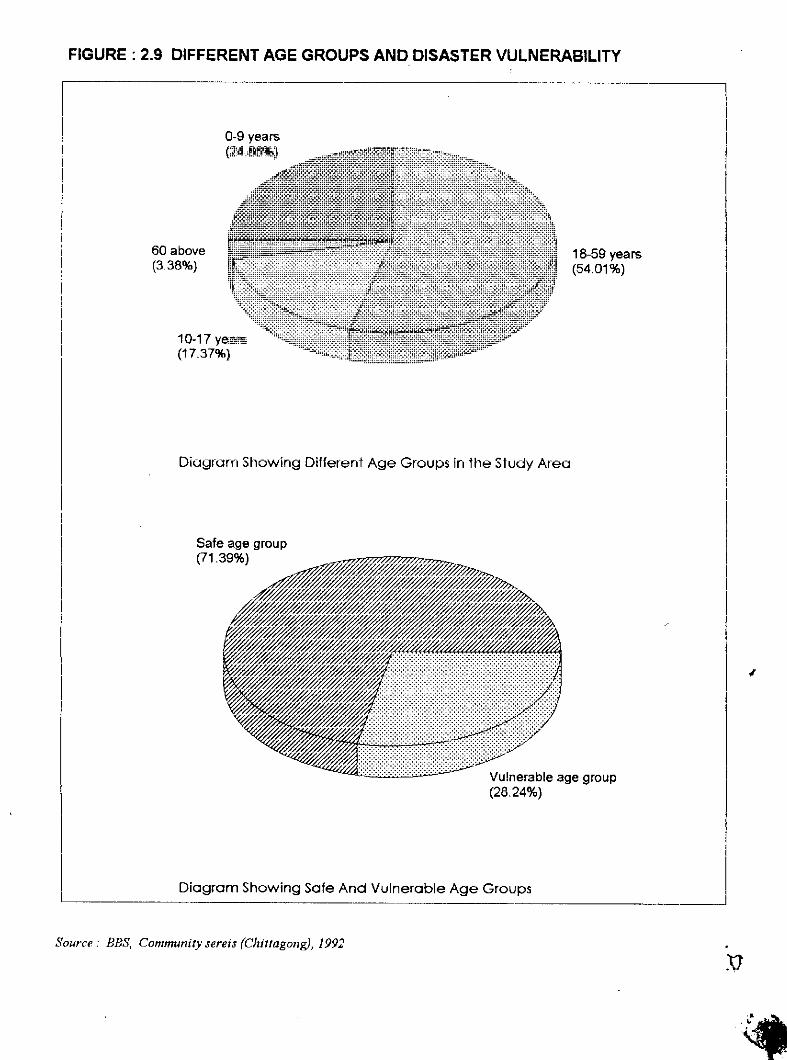
FIGURE: 2.9 DIFFERENT AGE GROUPS AND DISASTER VULNERABILITY
Diagram Showing Different Age Groups in the Study Area
~ D__io_g_ro_m_S_ho_w_i_ng_S_o_fe_A_n_d_Vu_ln__e_ro_b_le_A_ge_G_ro_u_p_s JSource: BBS, Community sereis (ChitlagongJ, 1992
.f.A..:,.

72
Family Size and Type:
According to the Community Series (Chittagong), 1992, there exist252,120 households which accommodate a total of 1392,860population in the city area. Therefore, on th~ basis of this datathe average family size in the city is around 5.50 (Table 2.2).The maximum number of households are situated in the ward number11. (Sulak Bahar) and the minimum number of households areaccommodated in the ward number 33 (Rampur) comprising 14,287 and447 households respectively. (
The type of family in the metropolitan city is mostly nucleatedamong the migrant population and this picture is somehowdifferent in case of local people in the central location of thecity or in the peripheral semi-urban areas. But the newgeneration locals are becoming more aware and getting inclinedto the higher education which encourage them to split and engagein the different occupations other than the old family occupationran by father or grand father.
Religion:
On the basis of BBS, 1991 data, the city is inhabited by 87%Muslim, 11.10% Hindu, 0.9% Buddhist and 1.0% other religiousgroups (Figure-2.10). Religious belief naturally play significantrole in moulding people's attitude, especially the illiterate andless educated people of a developing country like Bangladesh.Sometimes people do not respond to disaster management measurespositively because of religious reasons only. For example, thefemale members of muslim families maintain strict privacy and donot prefer to gather in a tight cyclone shelter (with otherunknown men) than taking shelter in a relatives house at a saferlocation. During visit to the study area the researcherinterviewed several female survivors of the 1991 cyclone andcame to know that they are still reluctant about taking refugein the cyclone shelters during the future great disaster periodseven because of the religious reasons mainly.
,\ .•_ ,,or.
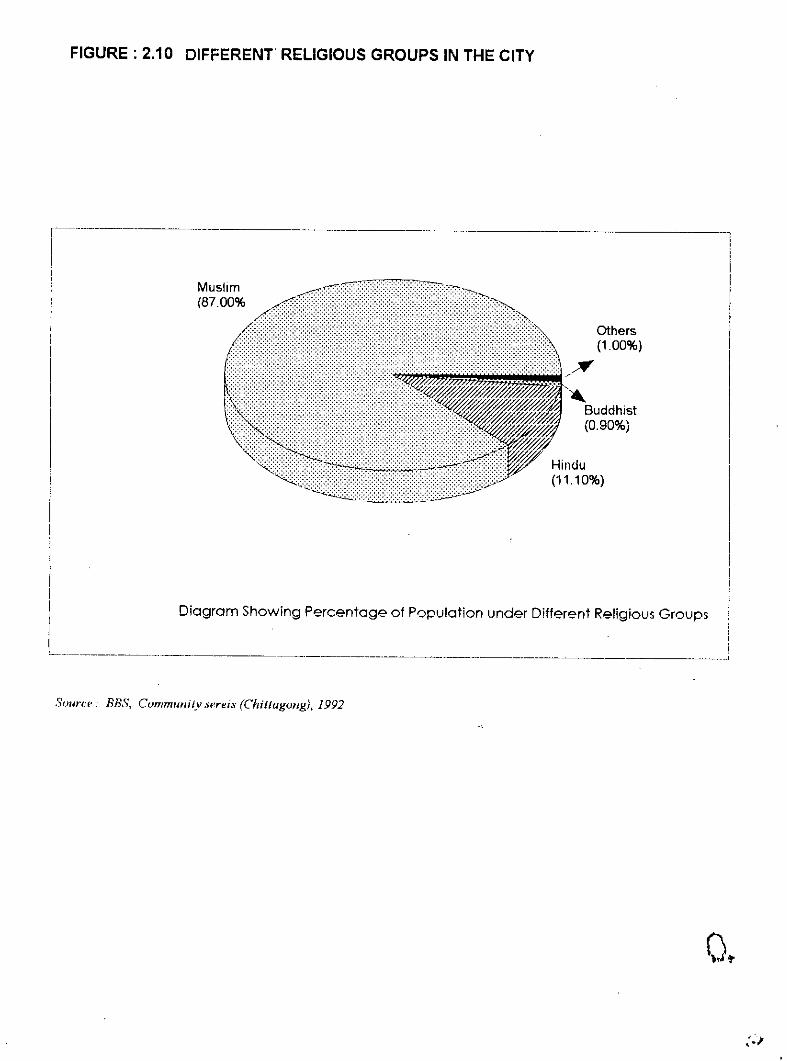
FIGURE: 2.10 DIFFERENT' RELIGIOUS GROUPS IN THE CITY
Diagram Showing Percentage of Population under Different Religious Groups
Others(1.00%)
. . ... ~/
Muslim
r~---.-----------Ii
II
II
I
III
III
IIIl__ ~ . ._ .. ~. ~_ .. ~' . ~
Source. BB,)', Cummunity sere is (ChillugUllg), 1992
Table 2.4
74
Percentage of Population Under Different ReligiousGroups in the city area.
Muslim Hindu Buddhist Others87.00% 11.10% 0.90% 1.00%
Source: BBS, 1991.
Literacy:
According to the Community series (Chittagong), 1992, the averageIiteracy rate in the city is around 57.56 per cent and theaverage male and female literacy rates have been found to bearound 62.63 per cent and 49.97 percent respectively. The highestliteracy rate (76.90 percent) has been observed in the wardnumber 2 (Chawk Bazar) and the lowest (27.10 per cent) in theward number 30 (Purba Bakalia) among the 41 wards in themetropolitan city of Chittagong. Besides this, the highest maleliteracy rate (81.50 percent) has been found in the ward number2 (Chawk Bazar) and the lowest (32.10 per cent) in the wardmember 30 (Purba Bakalia). Similarly the highest (71.50 per cent)and the lowest (21.20 per cent) female literacy rates have beenobserved in the ward number 3. (Jamal Khan) and ward number 30.(Purba Bakalia) respectively.
Occupation and Income:
Out of a total of 207683 households in the city area, 88439(42.58%) are engaged in employment, 46883 (22.57%) in business,19869 (9.56%) in transportation, 5263 (2.53%) in constructionwork, 5166 (2.49%) in agricultural activity, 4402 (2.11%) in non-agricultural works and the remaining 37662 (18.13%) householdsare involved in 'others' urban activities. The 'others' categoryinclude sources of income like-' Iive stock, forest, fishing,handloom etc.
From population data 10 years and above regarding main activity,it is evident that the picture is somehow different from thehousehold information related to income which shows a majorpercentage (25.92%) of the city population are engaged in

75
household works, 22.87% are not working/or looking for works,10.92% are engaged in the business, 6.93% in industrial activity,4.06% in transportation, 1.87% in services, 1.61% in theconstruction activity, 0.72% in the agricultural activity and therest 25.07% are engaged in 'others' urban activities in the city.The 'others' category in this case include 'Water electricity andgas' and 'other activity' (Table 2.6).
Table 2.5: Households in Dwelling units by Main Source ofIncome.
Total Main Source of IncomeHouse-holds Agri- Non- Busi- Cons- Tran- Emplo- others
cult- Agric- ness truc- sport ymenture. ulture tion
207683 24.9% 2.11% 22.57% 2.53% 9.56% 42.58% 18.13%Source : BBS, CommunJ.ty SerJ.es (ChJ.ttagong), 1992.Table 2.6: Population 10 years and over by Main Activity (in
percent) .
Not House Agri Indu- Cons- Tran- Busi- Serv otherwork- hold cul- stry truc- sport ness -ice sing work ture tion22.87 25.92 0.72 6.93 1.61 4.06 10.92 1.87 25.07
Source : BBS, CommunJ.ty SerJ.es (ChJ.ttagong), 1992.
2.3A Vegetation in the Study Area:
Previously Chittagong was known as the 'Queen of the East'because of her beautiful landscape covered by deep greenvegetation and hilly terrain Due to the favourable climaticconditions and proximity to the Bay of Bengal all types of plantsare seen in the city area. The development activity beingcarried out in the city in harmony with the rapid urban growth,has caused a tremendous effect on the natural landscape andvegetation of the study area. The hills are being cut, thevegetation is being cleared to develop new establishments andhousing settlements as a result of which the central city hasreceived a different characteristics compared to the rest of thecity areas.
76
The city area can be divided into four regions according to thenature of the vegetation such as, coastal region, central cityarea, hilly region and low lying fringe area. In the coastalregion of the city all kinds of trees and plants are found withthe clear dominance of coconut and other palm trees. The treesand plants in the coastal region include, mango, jack fruit, jam,banana, Baroi, peyara, coconut, date palm, betel nut,Krishnachura, Radhachura, Bamboo, Eucalyptus, Nim, Mahogany,Tula, Shegun, Shundari, Koroi and Luna trees. These luna treesare normally used for the afforestation in the coastal areas tominimize the effects of natural disasters. In the central partof the city all kinds of fruit trees including big trees such as,Krishnachura, Radhachura, shegun, Koroi, Mahogany, Shundari,Eucalyptus, Gamari, Tula, etc. are normally available. The hillyareas in the city are almost nacked without any plants and treesand some of these possess big wood supplying trees like Shal,Mahogany, Shundari, Tula, Gamari, Shegun, Koroi, Krishnachura,Radhachura, Eucalyptus occasionally with various fruit trees.Palm trees are rarely seen in the hilly areas. In the low lyingfringe area of the city, all kinds of domestic fruit trees arefound with clusters of bamboo plants at different locations.There are some locations where wood yielding valuable trees arealso seen. The special character of the vegetation in this lowlying areas of the city is high density of deep green vegetationalmost similar to the rural settlements in Bangladesh.
2.3.5 Major Economic Activities:
since Chittagong is the major port of the country, almost all theeconomic activities in the 'Port City' are related to the portactivities basically. The trade, commerce and industrialactivities flourishing in the city are also dependent on the portactivity to a great extent. The second important economicactivity can be identified as the industrial activity in the cityin terms of economic return and number of people involved in thissector. Around 40% of the countries total industrial activity issituated in the port city which includes a significant portionof the heavy industrial establishments also. These heavyindustrial activities are, Chittagong Dry dock, Chittagong steelMills, Chittagong Cement Clinker Factory, Eastern Refinery etc.
I
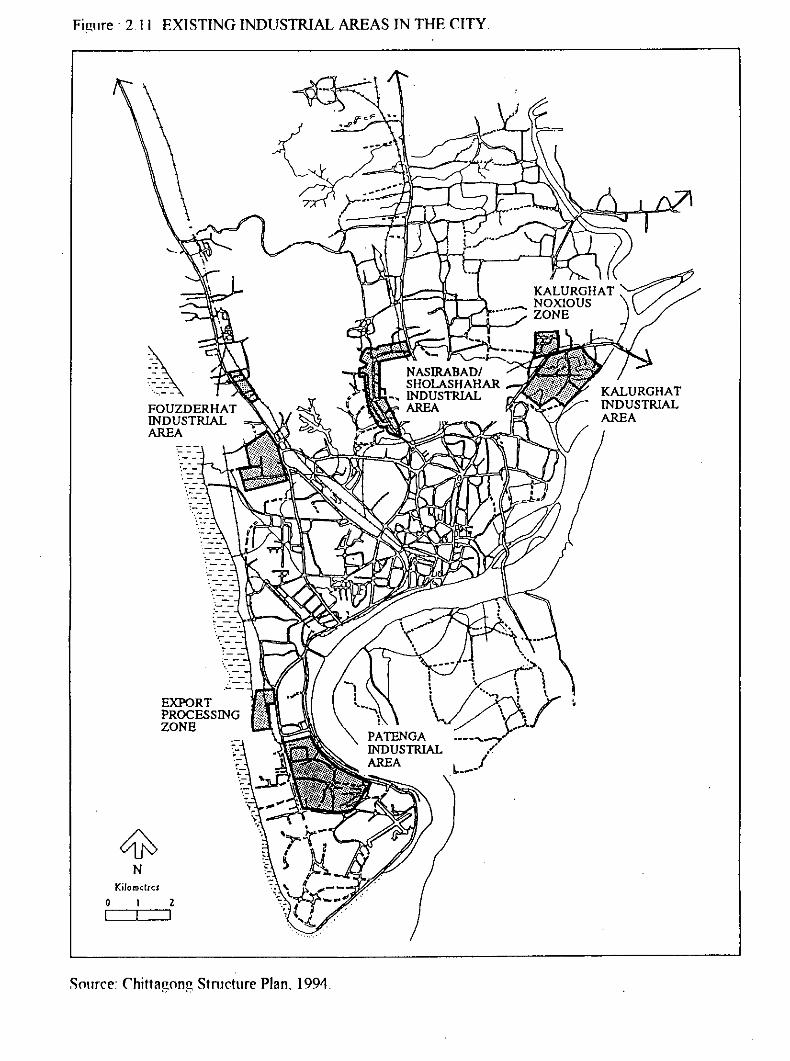
Fi~ure . 2. II EXISTING INDUSTRIAL AREAS IN THE CITY
\~,~~~
.~-
EXPORTPROCESSINGZONE
Kilometres
o 2I I
S(lllrce: Chitta~(ln~ Stmcture Plan, 199'1.
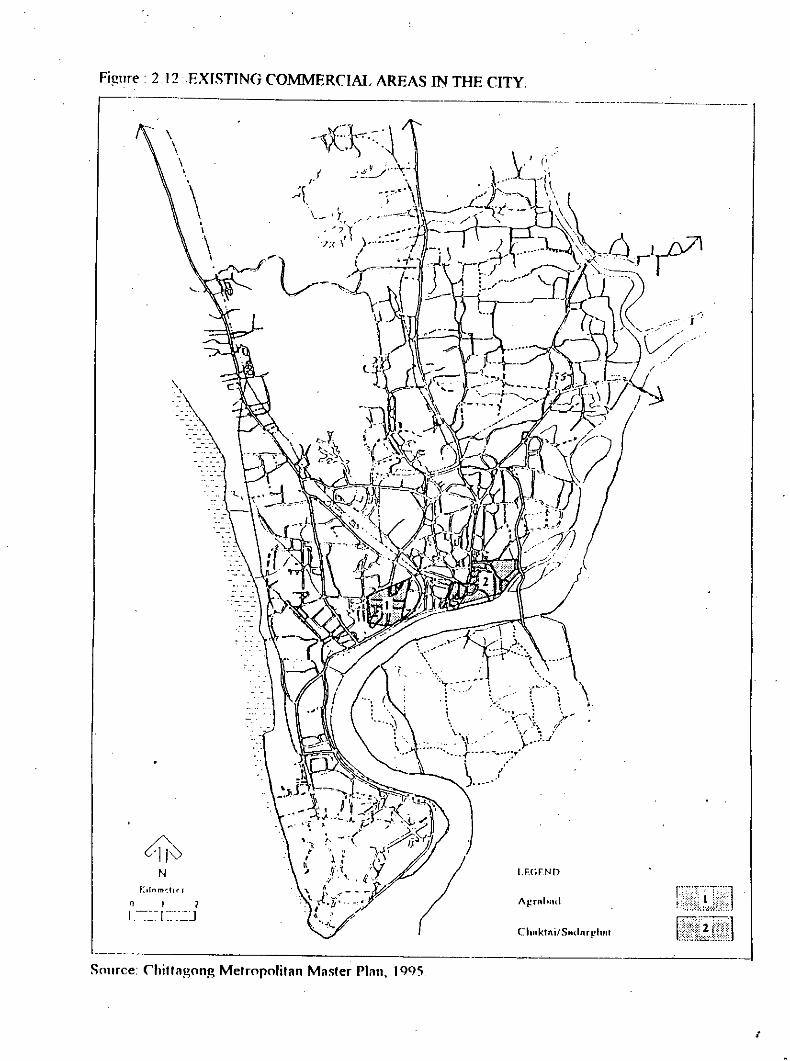
Figure. 2.12 EXISTING COMMERCIAL AREAS IN THE CITY.~~~-~--~~~~~~-- ----~--~ ._-~ ----_._ ..__ ._~-~--------_ .._-
I.HiEUlJ
CIIRktll if SAd"r !!hlll
f:1[om~'r( r
\,
Source: Chittagong Metropolitan Ma~ter Plall, 1<)<)5
,

, . 79
customers.
Out of the total working population in the study area, 21.33 percent are engaged in business, 13.54 per cent in the industrialactivity, 7.94 per cent in the transportation, 3.66 per cent inservice, 3.15 per cent in construction works, 1.40 per cent inagricultural activities and the remaining 48.96 percent in otherurban activities (Table 2.7).
Table 2.7: Working people engaged in Different Activities.
Agricu- Indust- Const- Trans- Busi- Service Otherslture. ry ruction port ness
1.40% 13.54% 3.15% 7.94% 21.33% 3.66% 48.96%.Source: BBS, Commun1ty ser1es (Ch1ttagong), 1992.
Besides this, a large number of people are engaged in wholesale,retail, manufacturing, community centres, hotels, personal andsocial activities in the metropolitan city of Chittagong. As thecity is expanding to accommodate the rapid urban growth,similarly the economic activities of diversified nature are beinggenerated to provide financial support to the increasing urbanpopulation as a whole.
2.3.6 Nature of Local Markets:
In the city area there exists a huge number of kitchen marketsand shopping centre of various nature. Chawk Bazar, RiazuddinBazar, Karnaphuli market, Kazir Dewry Bazar. Pahartoli Bazar,Dewanhat Bazar, Bahaddarhat Bazar Bibirhat kutcha Bazar, SteelMill Bazar etc. are the locations of important market places inthe Port city of Chittagong. These market places are significantfor daity necessities ranging from vegetable, fish, meat, groceryitems, seasonal fruits, stationery, clothing, garments etc.Besides these markets, a signif icant change has already beenobserved in the city for the last few years that, departmentalstores are being developed along the main roads and in theimportant locations of the city area which are run by educatedunemployed youths. All kinds of domestic essentials includingluxury items are available in the departmental stores wherehousewives and busy people on the way back from office are daily,.
.,
• .. I

80
other than this important market places, there are good numbersof small markets located haphazardly throughout the whole cityarea. These market places are in most of the cases, locatedbeside the main roads and the local agricultural products as wellas sea fish from the adjacent fisherman communities are sold ata cheaper price. These are unplanned developments beside theroads without any infrastructural facilities and in some cases,there are temporary structures of bamboo and thatch toaccommodate various vendor shops. Normally, these markets arekept open for whole day till night.
side by side with these markets, there are shopping centres andsuper markets at different important locations of the city suchas, New Market, Chittagong Shopping Centre, Chawk Super Market,Highway Plaza, Central Plaza, Apollo Shopping Centre, Shah Amanatcity Corporation Super Market etc. are run by various publicauthorities as well as private entrepreneurs.
2.3.7 Nature of Housing Stock :
Depending on the roof material used in the construction ofhouses, the city contains 68.66% (straw/bamboo 34.95% andTile/C.l. sheet 33.71%) of the temporary houses and 31.34% ofpermanent (cement) houses (Table 2.8). The roof materials usedin the construction of temporary houses are mainly - straw,bamboo, tile and C.l. sheet.
Table 2.8: Material of Roof of main house.
Total straw/ Ti1e/Cl Cement TemporaryBamboo Sheet (Permanent) Structure
214915 75117 7244!;) 67357 147562(100%) (34.95%) (33.71) (31.34%) (68.66%)
Source BBS, Communlty Serles (Chlttagong), 1992.

i,-,
FIGURE: 2.13 DWELLING WITH ROOF MATERIAL
'1
III
1I.
Cement(31.34%)
Diagram Showing Percentage of Roof Material of Dwelling Houses
!I!
IIIIi!"!I,
Diagram Showing Percentage of Permanent and Temporary Houses
._- .. ----_ ..__._-----------_._-_._-_._------_._--- -----------~,",'our,:,": JJHS, Community sereis (Chi/lagollg), 1~92
~,
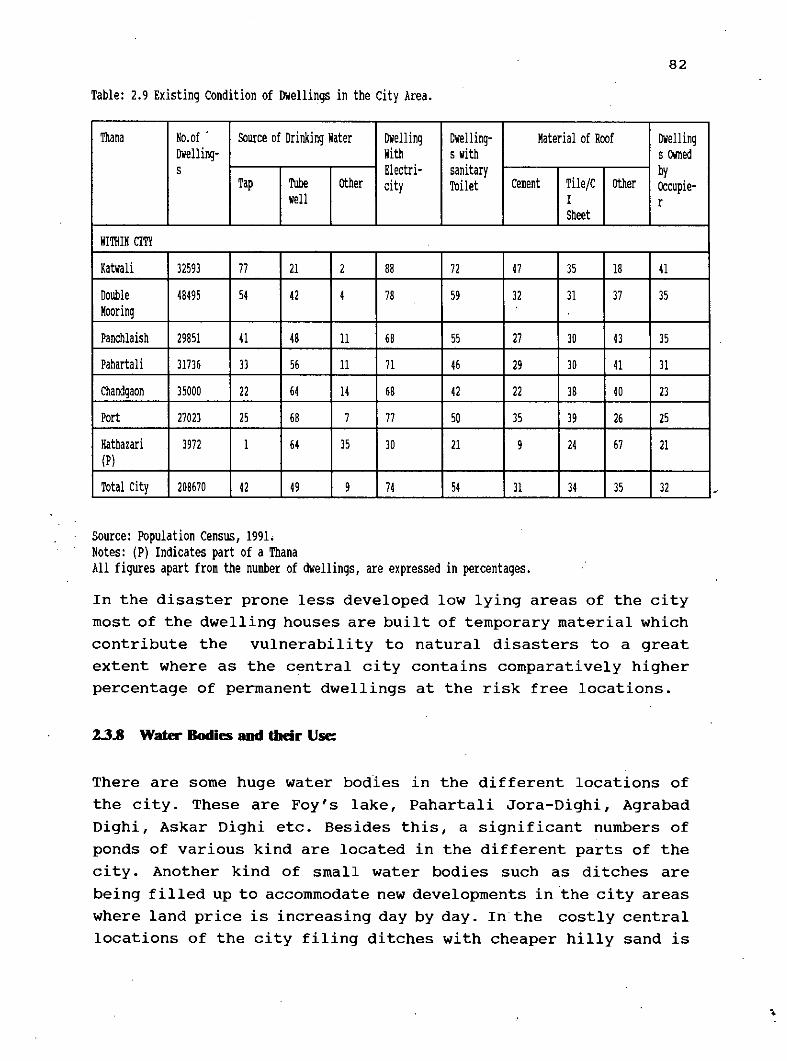
82
Table: 2.9 Existing Condition of Dwellings in the city Area.
Thana NO.of . Source of Drinking Water Dwelling Dwelling- Material of Roof DwellingDwelling- With s with s OiIJIeds Electri- sanitary by
Tap Tube other city Toilet Cement Tile/C other OCcupie-well I r
Sheet
WITHINCITY .
Katwali 32593 77 21 2 88 72 47 35 18 41Double 48495 54 42 4 78 59 J2 31 37 35Mooring
Panchlaish 29851 41 48 11 68 55 27 30 43 35Pahartali 31736 JJ 56 11 71 46 29 30 41 J1Chandgaon 35000 22 64 14 68 42 22 38 40 23Port 27023 25 68 7 77 50 35 39 26 25Hathazari 3972 1 64 35 30 21 9 24 67 21(P)
Total City 208670 42 49 9 74 54 J1 34 35 32
Source: Population Census, 1991.Notes: (P) Indicates part of a ThanaAll figures apart from the number of dwellings, are expressed in percentages.In the disaster prone less developed low lying areas of the citymost of the dwelling houses are built of temporary material whichcontribute the vulnerability to natural disasters to a greatextent where as the central city contains comparatively higherpercentage of permanent dwellings at the risk free locations.
2.3.8 Water Bodies and their Use:
There are some huge water bodies in the different locations ofthe city. These are Foy's lake, Pahartali Jora-Dighi, AgrabadDighi, Askar Dighi etc. Besides this, a significant numbers ofponds of various kind are located in the different parts of thecity. Another kind of small water bodies such as ditches arebeing filled up to accommodate new developments in the city areaswhere land price is increasing day by day. In the costly centrallocations of the city filing ditches with cheaper hilly sand is

83
a common practice to achieve better financial return. On theother hand, ponds and lakes in most of the cases are being usedas bathing and washing places for common people. And in somecases fish cultivation is being carried out in these waterbodies with the provision of angling facilities with tickets.Foy's lake is the important recreational spot in the city whichprovides necessary water supply for Bangladesh Railway staffhousing.
2.33 Nature of Agricultural Practice in the Study Area:
Most of the agricultural land is situated along the coastal beltand the other portion is located in the.north-eastern fringe areaof the city. The agricultural land exists along the coastal beltof the city is around 2.4-3. a meters high above the mean sealevel (MSL) and is prone to common natural disasters. On theother hand, the fertile agricultural land along the bank. ofKarnaphuli river is around 1.8-2.4 meters high above the mean sealevel (MSL) and the area experiences flash flood as a result ofheavy down pour during monsoon. Besides this, during high tidethis area remains under water for a particular period with theswelling of water in the Karnaphuli river. The agricultural landuse covers the major part of the city land use (which is 27.86%of city area) and 35.95% of the total agricultural land useexists in the high risk area (HRA) along the coastal belt of thecity. Other than this, The north eastern fringe area contains15.17% of the total agricultural land available in the city. withthe rapid growth of urban population in the city, cheaperagricultural land in the city area is being occupied by theunplanned developments mainly. The agricultural land exists in ~.the risk free areas are undergoing development activity at atremendous rate than those located in the fringe areas.
The agricultural land situated beside the coastal belt, whichcontains around 3953.76 acres of land is significant for thewinter crops (Robi crop), such as water' melons, tomatoes,potatoes, different kinds of vegetable, chilies, spices etc. Thesalinity and shortage of irrigation water has a direct influenceon the cropping pattern of this region. Other than the winter
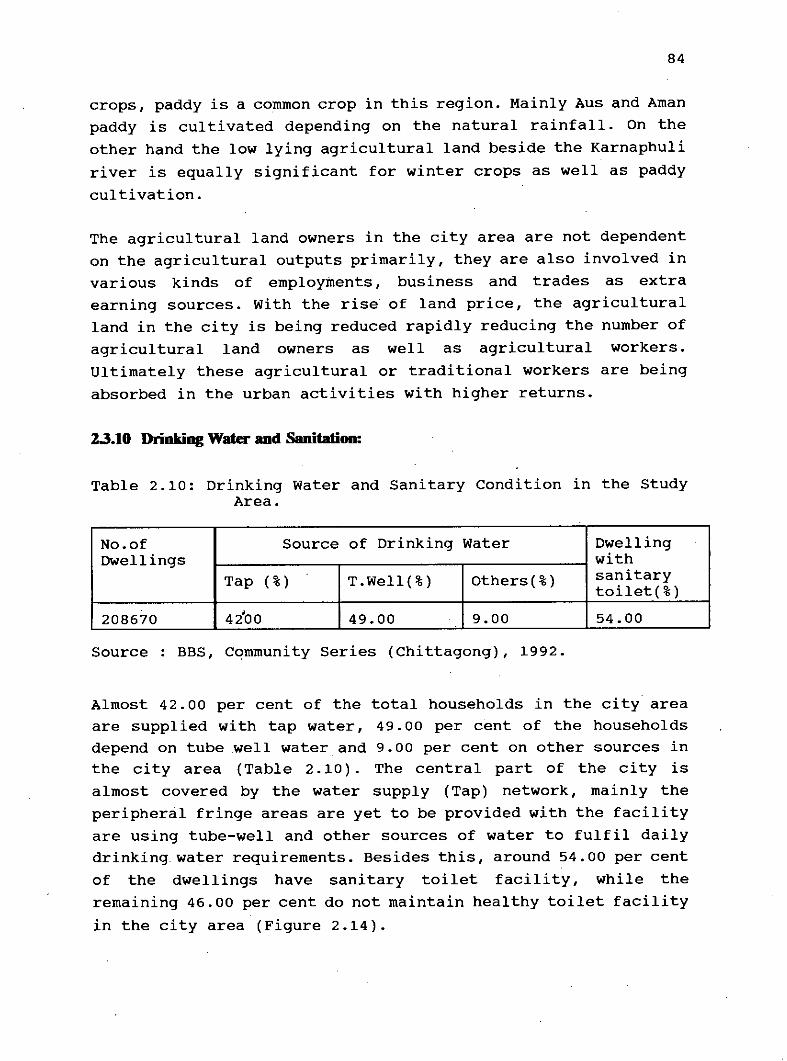
84
crops, paddy is a common crop in this region. Mainly Aus and Amanpaddy is cultivated depending on the natural rainfall. On theother hand the low lying agricultural land beside the Karnaphuliriver is equally significant for winter crops as well as paddycultivation.
The agricultural land owners in the city area are not dependenton the agricultural outputs primarily, they are also involved invarious kinds of employinents, business and trades as extraearning sources. with the rise of land price, the agriculturalland in the city is being reduced rapidly reducing the number ofagricultural land owners as well as agricultural workers.Ultimately these agricultural or traditional workers are beingabsorbed in the urban activities with higher returns.
2.3.10 Drinking Water and Sanitation:
Table 2.10: Drinking Water and Sanitary Condition in the StudyArea.
No.of Source of Drinking Water DwellingDwellings with
Tap (%) T.Well(%) Others(%) sanitarytoilet(%)
208670 42'00 49.00 9.00 54.00
Source BBS, community Series (Chittagong), 1992.
Almost 42.00 per cent of the total households in the city areaare supplied with tap water, 49.00 per cent of the householdsdepend on tube well water and 9.00 per cent on other sources inthe city area (Table 2.10). The central part of the city isalmost covered by the water supply (Tap) network, mainly theperipheral fringe areas are yet to be provided with the facilityare using tube-well and other sources of water to fulfil dailydrinking water requirements. Besides this, around 54.00 per centof the dwellings have sanitary toilet facility, while theremaining 46.00 per cent do not maintain healthy toilet facilityin the city area (Figure 2.14).
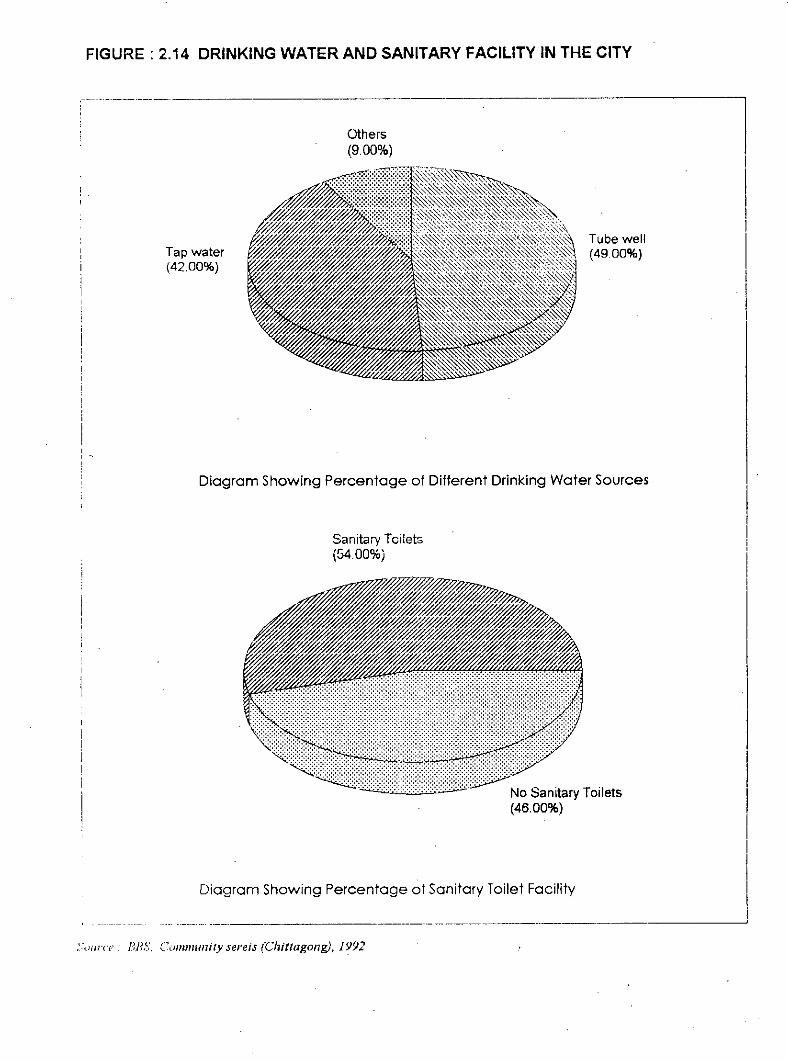
FIGURE: 2.14 DRINKING WATER AND SANITARY FACILITY IN THE CITY
---~,_._-_._.__._..--------------_._----------------
,, -,
Tap water(42.00%)
Tube well(4900%)
Diagram Showing Percentage of Different Drinking Water Sources
Sanitary Toilets(54.00%)
Diagram Showing Percentage of Sanitary Toilet Facility
"_ .•. _._--, .... _._-_._ .._-------_._--_ ..._--~._---~--_...._------------~
.:;~)ilr('e 13.88. Commullitysereis (Chittagong), 1?92
86
2A SummaryThe Port city which is an important industrial and businesscentre .of the country has recently been declared as the'Commercial Capital' is undergoing a rapid growth with theincrease of economic activities and urban facilities. since mostof the industrial activities are located in the disaster proneareas of the city, this encourage the concentration of urbanmigrants in the vulnerable areas. Moreover in absence of adequateplanning guide lines regarding the future development of thecoastal area, unplanned and haphazard development activities arebeing carried out which contribute to the vulnerability of thecoastal belt and adjacent areas in the city. During the 1991cyclone and storm surge this area suffered a severe disasterdamage which would increase gradually in the future disasters ofsimilar intensity if appropriate planning measures are notimposed for disaster prevention and mitigation in the city area.The following are the findings regarding the disastervulnerability of the study area:
There exists three industrial areas along the coastal disasterprone areas which contribute the concentration of urbanpopulation in the unplanned settlements beside the coast thusincreasing the vulnerability of the city area. The agriculturalland beside the coast and in the low lying area are beingoccupied and inhabited by low income working people with highestconcentration which contribute the natural disasters in the cityto a great extent.Lack of appropriate policy measures from the relevant planningauthority to control haphazard developments in the disaster hitareas has a direct effect on disaster impact. Most of theunplanned settlements in the coastal area are composed of semipermanent or temporary houses which suffered severe damages inthe 1991 cyclone and storm surge.
Failure of the coastal embankment was primarily responsible forthe higher disaster damage during 1991 cyclone in the city area.The absence of metropolitan disaster management policies in thecity has made the disaster situation further worse during thecyclone of 1991.
-.,.~--.••..--.~.~J:: -~_. "_ - oA ••-- _'e ...-
- -. >\- .
,- ... .• •, .
~t2Y~:~~'".•'" 2. . ...~~~...•_.J I . . .
., _.\ r .-.;'):; .. r
. .~ ...-,):- ....•..".--- ---~ ••.•...._, •.•.
CHAPTER THREE
IISISTER M.I.BEMEIT II BAIBUlDESH

CHAPfER TIIREE
DlSASfER MANAGEMENT IN BANGLADESH
3.1 Introduction
This chapter discusses the concept of disaster and disastermanagement in Bangladesh. However, to develop a clearunderstanding about different aspects of disaster management.which is essential for the study a detailed description regardingthe phases of disaster management has been presented in thischapter. Besides this the existing disaster management situationin Bangladesh as well as in the study area have been discussed.This include disaster management in Bangladesh disastermanagement in the 1961 Chittagong Master Plan and disastermanagement in the recently prepared Chittagong structure Plan -1994.
3.2 Conceptof Disaster
ora
ofby
tothatonly
A disaster is an event, natural or man-made, suddenprogressive, that seriously disrupts the functioning ofsociety, causing human, material, or environmental lossessuch severity that the affected community has to respondtaking exceptional measures. The disruption (includingessential services and means of livelihood) is on a scaleexceeds the ability of the affected society to cope usingits own resources (UNDP/GOB, 1994).
According to the above definition, disasters can be categorizedas natural (earthquake, cyclone, storm surge, drought,desertification, forest fire, landslides, river bank erosionetc.) and man-made (war, destruction of nature, environmentalpollution, deforestation etc.) phenomena. Disasters may occur allon a sudden (earthquake, cyclone etc.) or may continue for along period of time (drought war etc.) .disrupting the normalactivity of a society with a great damage to life, property andenvironment. The disaster effects are so severe that exceptionalmeasures are required to be undertaken by the community toreplace the losses. The disruptions to the services (including
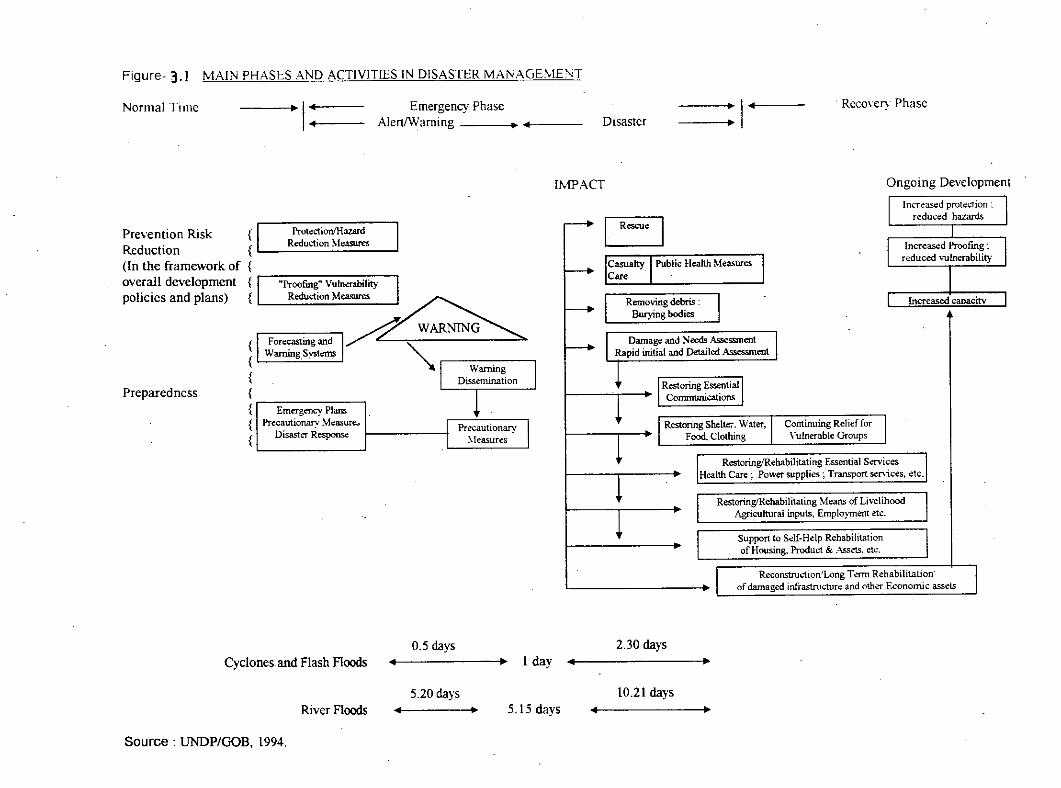
Figure- 3.1 MAIN PHASES AND ACTIVITIES IN DISASTER MANAGEME"<T
Normal Time .1-: -- Emergency PhaseAlertJ\Yarning •••• ---- Disaster
---~ •• I4.~---•
. Rcco\"cry Phase
I1\1PACT Ongoing Development
ProtectionIHazardReduction Measures
Increased protection:reduced hazards
Continuing Relief forVulnerable Groups
Restoring Sheltc. Water,Food. Clothing
Support to Self-Help Rehabilitationof Housing. Product & Assets, etc.
RestoringIRehabilitating Means of LivelihoodAgricuhural inputs, Employment etc.
RestoringIRehabilitating Essential ServicesHealth Care; Power supplies; Transport services, etc.
Restoring EssentialConmlUnications
Damage and Needs AssessmentRapid initial and Detailed Assessment
I~=alty IPublic Health Measure.; I1 Remomg debris I
Burymg bodies
B
Emergency PlansPrecautionary ~Ieasure.>
Disaster Response
{{
{-----=--{ I "Proofing" Vuln<eabitrt; I{ ReducttonMeasu= ~~
~{ Fo,,,:,,,,,,g and./' "'.Warnmg S,,-stems{ ..
{{{{{
Prevention RiskReduction(In the framework ofoverall developmentpolicies and plans)
Preparedness
Reconstruction'Long Term Rehabilitation"of damaged infrastructure and other Economic assds
0.5 daysCyclones and Flash Floods •• • I day
2.30 days.. ~
5.20 days 10.21 daysRiver Floods II •• 5.15 days
Source: UNDP/GOB, 1994.
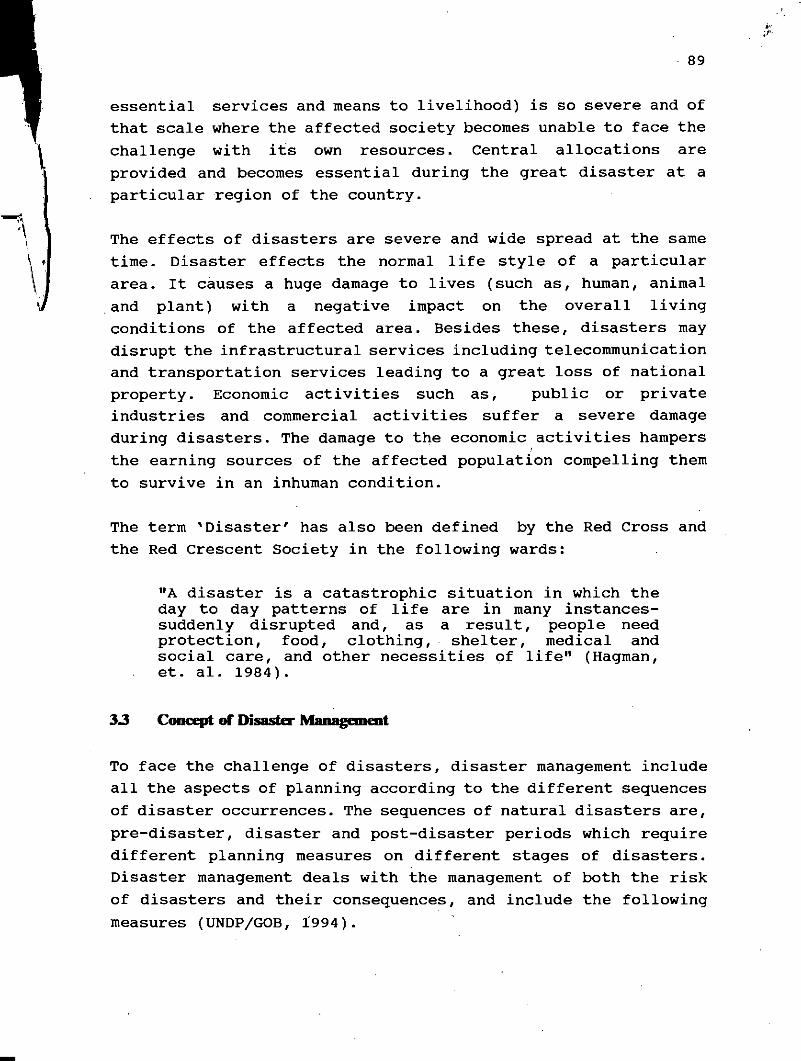
89
essential services and means to livelihood) is so severe and ofthat scale where the affected society becomes unable to face thechallenge with its own resources. Central allocations areprovided and becomes essential during the great disaster at aparticular region of the country.
The effects of disasters are severe and wide spread at the sametime. Disaster effects the normal life style of a particulararea. It causes a huge damage to lives (such as, human, animal.and plant) with a negative impact on the overall livingconditions of the affected area. Besides these, disasters maydisrupt the infrastructural services including telecommunicationand transportation services leading to a great loss of nationalproperty. Economic activities such as, public or privateindustries and commercial activities suffer a severe damageduring disasters. The damage to the economic activities hampersthe earning sources of the affected population compelling themto survive in an inhuman condition.
The term 'Disaster' has also been definedthe Red Crescent Society in the following
by the Red Cross andwards:
-
"A disaster is a catastrophic situation in which theday to day patterns of life are in many instances-suddenly disrupted and, as a result, people needprotection, food, clothing, shelter, medical andsocial care, and other necessities of life" (Hagman,et. a1. 1984).
3.3 Concept of Disaster Management
To face the challenge of disasters, disaster management includeall the aspects of planning according to the different sequencesof disaster occurrences. The sequences of natural disasters are,pre-disaster, disaster and post-disaster periods which requiredifferent planning measures on different stages of disasters.Disaster management deals with the management of both the riskof disasters and their consequences, and include the followingmeasures (UNDPjGOB, i994).
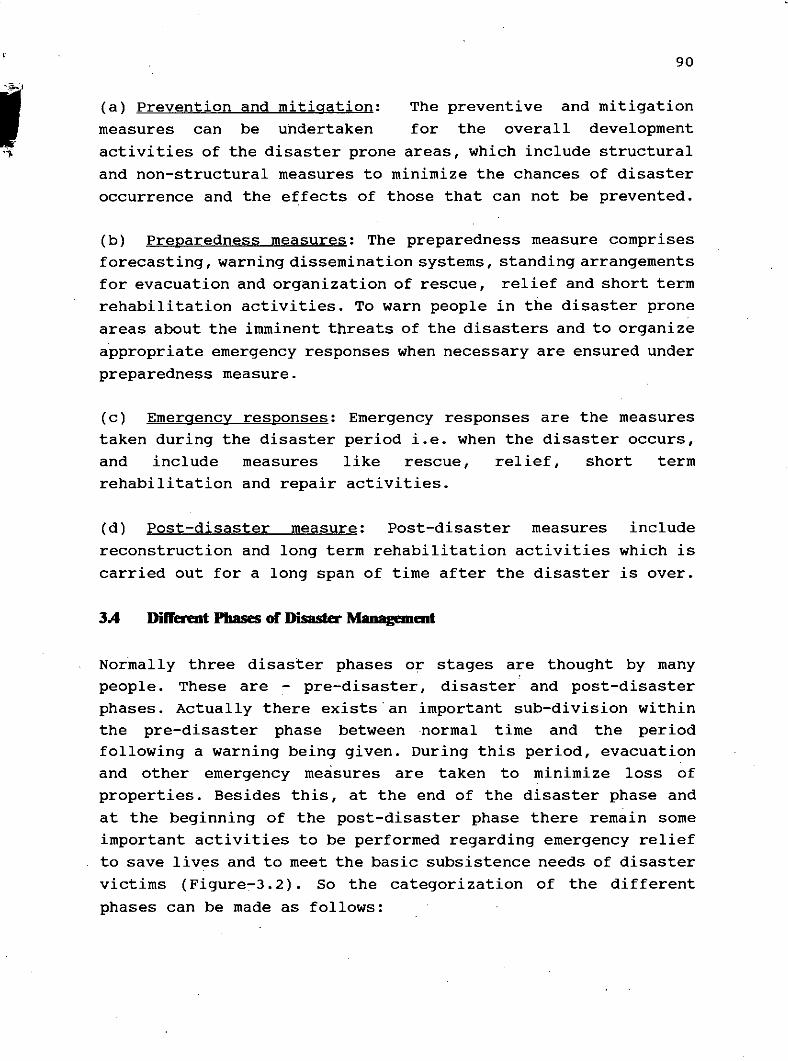
90
(a) Prevention and mitigation: The preventive and mitigationmeasures can be uhdertaken for the overall developmentactivities of the disaster prone areas, which include structuraland non-structural measures to minimize the chances of disasteroccurrence and the effects of those that can not be prevented.
(b) Preparedness measures: The preparedness measure comprisesforecasting, warning dissemination systems, standing arrangementsfor evacuation and organization of rescue, relief and short termrehabilitation activities. To warn people in the disaster proneareas about the imminent threats of the disasters and to organizeappropriate emergency responses when necessary are ensured underpreparedness measure.
(c) Emergency responses: Emergency responses are the measurestaken during the disaster period i.e. when the disaster occurs,and include measures like rescue, relief, short termrehabilitation and repair activities.
(d) Post-disaster measure: Post-disaster measuresreconstruction and long term rehabilitation activitiescarried out for a long span of time after the disaster
3A Dilfermt Phases or Disaster Management
includewhich isis over.
Normally three disaster phases or stages are thought by manypeople. These are - pre-disaster, disaster and post-disasterphases. Actually there exists"an important sub-division withinthe pre-disaster phase between normal time and the periodfollowing a warning being given. During this period, evacuationand other emergency measures are taken to minimize loss ofproperties. Besides this, at the end of the disaster phase andat the beginning of the post-disaster phase there remain someimportant activities to be performed regarding emergency reliefto save lives and to meet the basic subsistence needs of disastervictims (Figure-J. 2). So the categorization of the differentphases can be made as follows:

j 1. Normal time phase
91
2, Emergency phase(a) Alert or warning phase(b) Relief (or survival and basic need phase).
3. Recovery phase
Practically there is no sharp line in between the phases and someactivities overlap each other with the progressive rise and fallof the activities. For example, certain relief activities willcontinue, declining gradually, while recovery activities buildup. Similarly, the recovery phase gradually merges into normalongoing development.
In each of the three phases, the focus of the activities aretotally different which is therefore useful to conceptualize theprocess and to define who does what, when (UNDP/GOB, 1994). Theacti vities performed during different disaster phases can be'explained as follows: (Figure 3.3).
Normal Time Phase
Normal time is the period which is free form current emergencyor any kind of disaster threat immediately in the near future.Normally, long term measures are taken during this period withrespect to the previous disaster experiences to protect (preventor mitigate) the known disasters at some unknown time in thefuture.
During the normal or peace time the following measures are taken:
a. In the disaster prone areas preventive/mitigation measuresare taken to reduce the vulnerability and risks on a longterm, permanent basis.
b. Preparedness measures are taken to provide warnings timelyand contingency plans are established to organize thecapacity for emergency responses.

92
a. Prevention/mitigation : Disaster prevention and mitigationmeasures. are undertaken to reduce the negative impacts ofdisasters such as cyclones and storm surges, floods and otherpotentially damaging events. The measures may be aimed atreducing the probability or intensity of particular hazards, orthe vulnerability of the society and its assets to the impact ofthose that do occur.
i. Protection or hazard reduction: For the protection andhazard reduction in the disaster prone areas embankments,drainage channels, afforestation, and other structural orphysical measures can be undertaken to reduce the impactsof cyclones with storm surges, floods and impacts of othersimilar disasters.
ii Proofing or vulnerability Reduction: The following are thedifferent forms of proofing or vulnerability reductionmeasures can be adopted in the disaster risk areas:
- Land-use policies and zoning regulations can be applied todiscourage the concentration of population and economicactivities in the vulnerable areas through regulatory andincentive provisions. Care should be taken so that newdevelopments do not create new problems (risks) at thesame time. This can be termed as hazard avoidance measures.
- Improvements in the design and construction standards canbe applied to. new buildings and other structures andstrengthening existing ones to better withstand high winds,floods, earthquakes or other phenomena which are likely tooccur in the locality. This can be used as hazard resistantmeasure and. can be applied to the engineered. and non-engineered structures, and can be attempted throughregulations, incentives and/or training.
- Individual households and local communities can undertakevarious measures to reduce the likelihood of losses ofvaluable assets through improved storage arrangements and

93
they, can be encouraged through education and community,mobilization.
b. Disaster Preparedness: Disaster preparedness measures aretaken to ensure the readiness and ability of the society -Government, communities, various organizations and individualsto take precautionary measures in advance of an imminent disasterthreat, in cases where advance warnings are possible to organizetimely response in the event of disaster.
Preparedness measures include:i. Forecasting and warning dissemination systems for floods
and cyclones (with storm surges).
ii. Plans, procedures and resources for operational capabilityto ensure the timely action at all levels by communities,government, NGOs, and other organizations after the warningis issued following a disaster impact.
The operational capability includes arrangements for theevacuation of people, livestock and movable property from thedisaster prone areas and organization of other temporaryprecautionary measures to protect lives and property after thewarning is issued. This arrangements at all levels comprisesorganizing search and rescue, providing relief and emergencyrepairs to restore essential services when needed. Education,training and practice drills are also essential at al levels.
Warning system: Warning systems. are arrangements to rapidlydisseminate the information regarding an imminent disaster threatto officials, institutions and the population at large, in theareas at immediate risk. Normally warnings are made for cyclonesand floods. warning system involves links to the forecastingsystems. The organizational and decision-making processes todecide on the issuing of particular warnings, arrangements tobroadcast the warnings by radio and through other mass media; andarrangements for the local. dissemination of warnings andinstructions within the communities at risk.
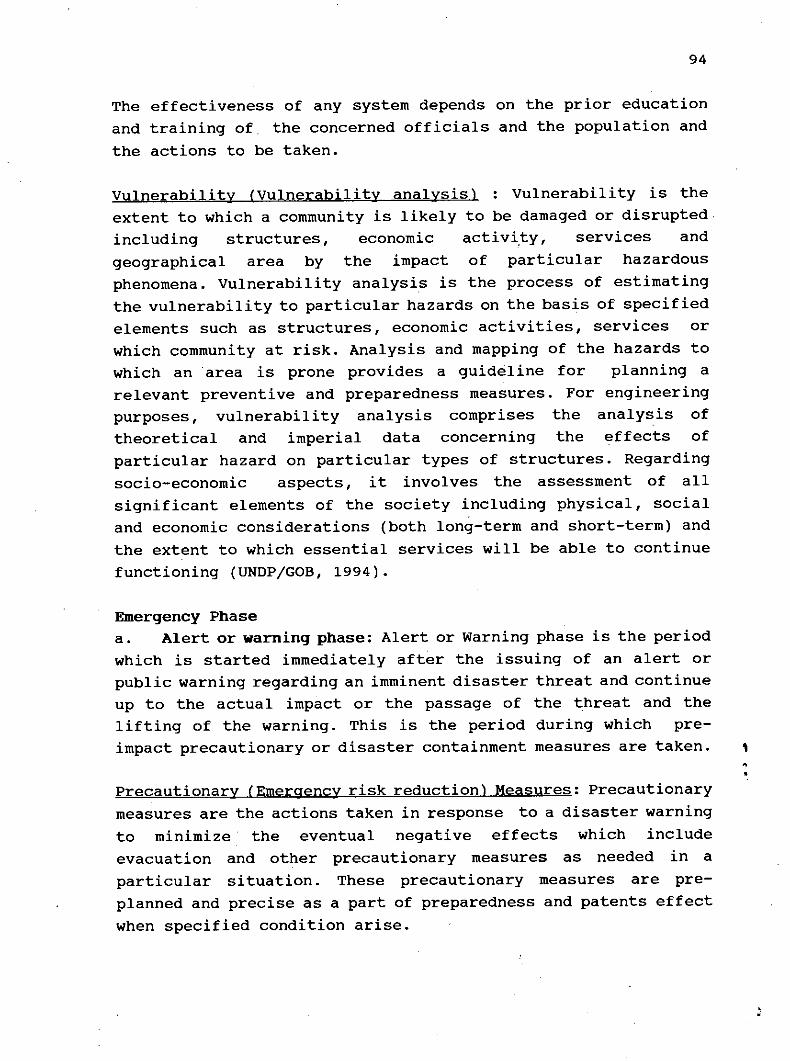
94
The effectiveness of any system depends on the prior educationand training of. the concerned officials and the population andthe actions to be taken.
Vulnerability (Vulnerability analysis) : Vulnerability is theextent to which a community is likely to be damaged or disruptedincluding structures, economic activ~ty, services andgeographical area by the impact of particular hazardousphenomena. Vulnerability analysis is the process of estimatingthe vulnerability to particular hazards on the basis of specifiedelements such as structures, economic activities, services orwhich community at risk. Analysis and mapping of the hazards towhich an area is prone provides a guideline for planning arelevant preventive and preparedness measures. For engineeringpurposes, vulnerability analysis comprises the analysis oftheoretical and imperial data concerning the effects ofparticular hazard on particular types of structures. Regardingsocio-economic aspects, it involves the assessment of allsignificant elements of the society including physical, socialand economic considerations (both long-term and short-term) andthe extent to which essential services will be able to continuefunctioning (UNDPjGOB, 1994).
Emergency Phasea. Alert or warning phase: Alert or Warning phase is the periodwhich is started immediately after the issuing of an alert orpublic warning regarding an imminent disaster threat and continueup to the actual impact or the passage of the threat and thelifting of the warning. This is the period during which pre-impact precautionary or disaster containment measures are taken. ,
Precautionary (Emergency risk reduction) Measures: Precautionarymeasures are the actions taken in response to a disaster warningto minimize the eventual negative effects which includeevacuation and other precautionary measures as needed in aparticular situation. These precautionary measures are pre-planned and precise as a part of preparedness and patents effectwhen specified condition arise.
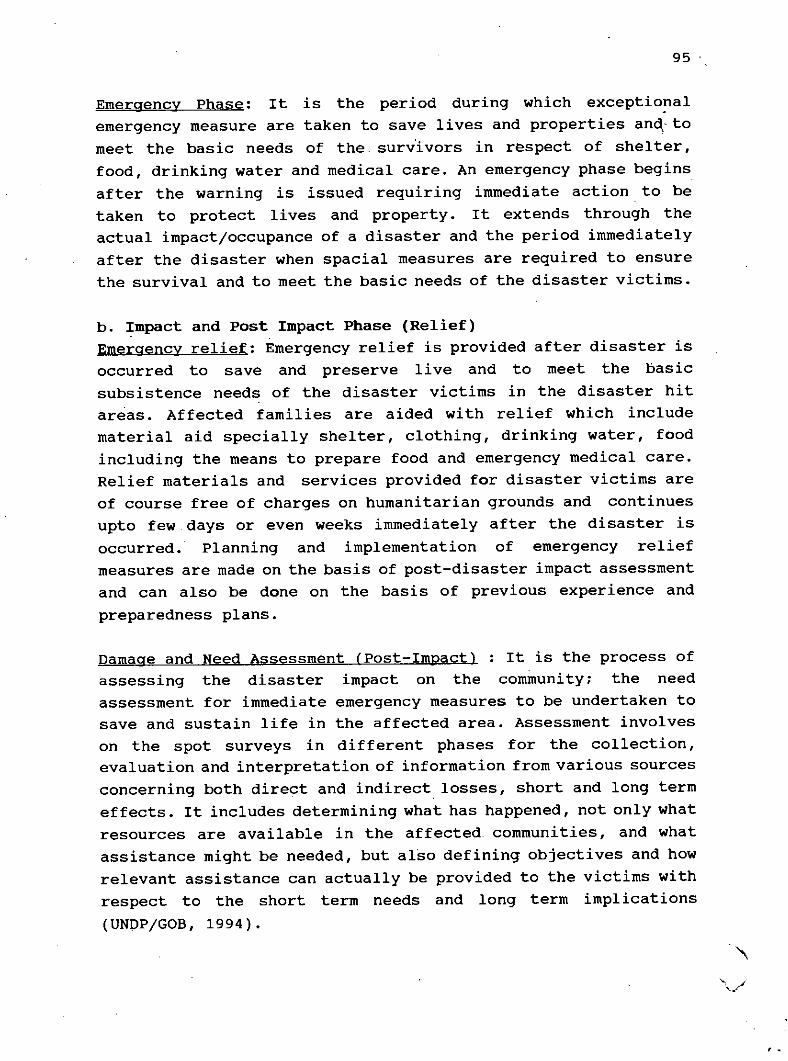
95
Emergency Phase: It is the period during which exceptionalemergency measure are taken to save lives and properties an~'tomeet the basic needs of the. surv'ivors in respect of shelter,food, drinking water and medical care. An emergency phase beginsafter the warning is issued requiring immediate action.to betaken to protect 1ives and property. It extends through theactual impact/occupance of a disaster and the period immediatelyafter the disaster when spacial measures are required to ensurethe survival and to meet the basic needs of the disaster victims.
b. Impact and Post Impact Phase (Relief)Emergency relief: Emergency relief is provided after disaster isoccurred to save and preserve live and to meet the basicsubsistence needs of the disaster victims in the disaster hitareas. Affected families are aided with relief which includematerial aid specially shelter, clothing, drinking water, foodincluding the means to prepare food and emergency medical care.Relief materials and services provided for disaster victims areof course free of charges on humanitarian grounds and continuesupto few days or even weeks immediately after the disaster isoccurred. Planning and implementation of emergency reliefmeasures are made on the basis of post-disaster impact assessmentand can also be done on the basis of previous experience andpreparedness plans.
Damage and Need Assessment (Post-Impact) : It is the process ofassessing the disaster impact on the community; the needassessment for immediate emergency measures to be undertaken tosave and sustain life in the affected area. Assessment involveson the spot surveys in different phases for the collection,evaluation and interpretation of information from various sourcesconcerning both direct and indirect losses, short and long termeffects. It includes determining what has happened, not only whatresources are available in the affected communi ties, and whatassistance might be needed, but also defining objectives and howrelevant assistance can actually be provided to the victims withrespect to the short term needs and long term implications(UNDP/GOB, 1994).
, .
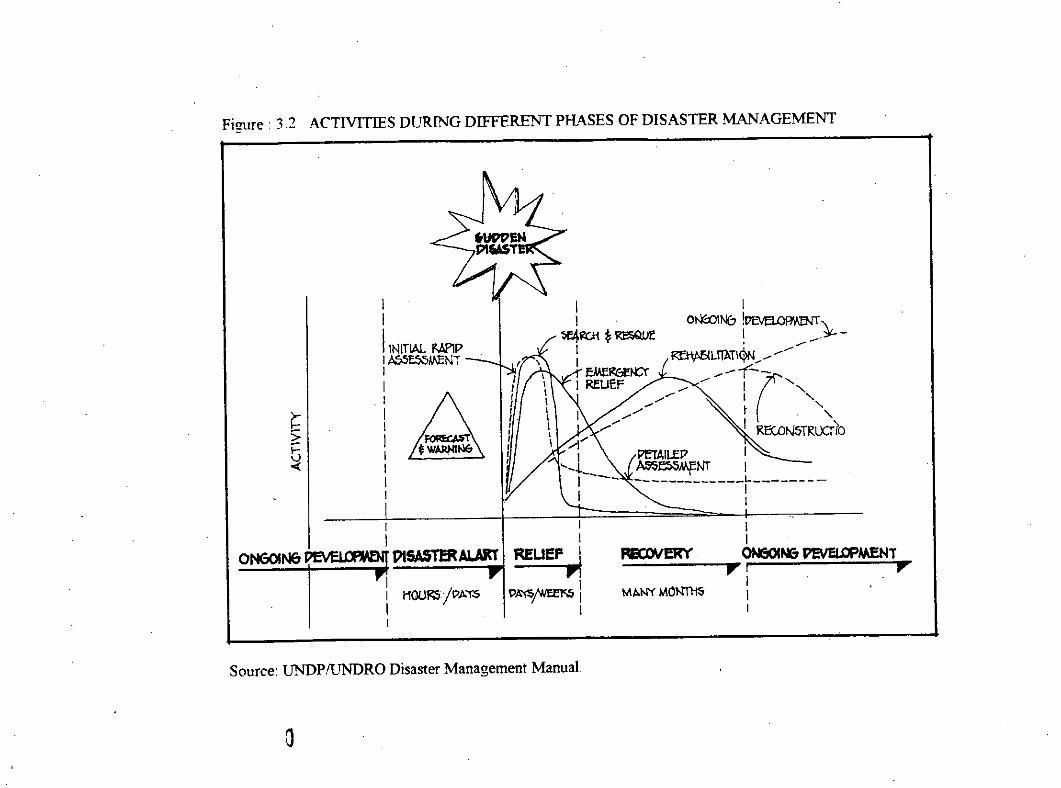
Fi!!ure • 3.2 ACTIVITIES DURING DIFFERENT PHASES OF DISASTER MANAGEMENT
MANY MONiliS
f~t:i..:
ONGOlN&
II
I INITIAL ooPI A::;.5l:5.:;W:NTII
iAI1I
IIP1SASTERAJ.AY\fI-II l100FSjPA'ISII
II
REUEF i,.PM.;~:
1
Iot¥:OlN6 !~).o.
I _.-, ~, ~ffl%(LnAnGN /-
II
PCCOVeRY 0Na0l1lk717EVELOPMENir I yI1I
Source. UNDPfUNDRO Disaster Management Manual
o
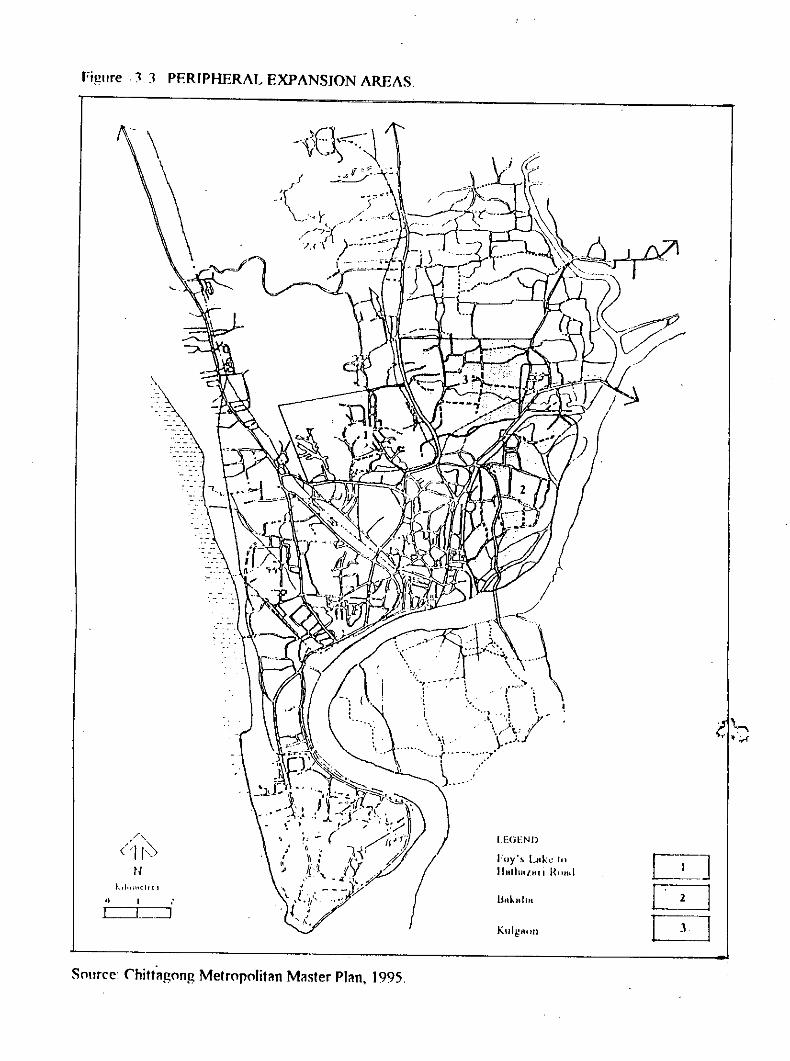
Fi!!lIfe . J 3 PERIPHERAL EXPANSION AREAS.
.5 \ •.••(" "';...f
~]I 2 IDJ
I.EGEND
I\UlgllOIl
roy's l...llk..: III1IltllUl/.ltli HOI\l1
\
II I •.
C=L.:::::J
Snllfce: \hi".~gnng Melropolil~n M~sler PI~n. 1995.

98
Damage assessment: It involves the preparation of specific andquantified estimate regarding the physical damage due to thedisaster and recommendations for repairs, reconstruction orreplacement of structures and equipments and the restoration ofeconomic activities including agriculture.
Recovery PhaseRecovery Phase is the period after the disaster is over, duringwhich measures are taken to resume normal life in the affectedarea (with means of livelihood) and to restore infrastructure,services and the economy in a way relevant to long term needs anddefined development objectives. Recovery measures comprises bothreconstruction and rehabilitation with certain relief (welfare)measures in the disaster" hit area in favor of certaindisadvantaged or vulnerable groups.
Short term rehabilitation and Repairs: These are the actionstaken to help basic services revenue functioning, to generateself help efforts regarding dwellings and community facilitiesamong the disaster victims, and to revive economic activitiesincluding agriculture in the affected area. The orientation ofrehabilitation measure is to make the effected population capableof resuming normal (more or less) patterns of life as it wasbefore the disaster.
Reconstruction and long term rehabilitation: This includespermanent reconstructions or replacement of severely affectedbuildings or physical structures, the full restoration of alservices and infrastructures and revitalization of economicactivities including agriculture. Reconstruction measures shouldbe carried out with respect to the long term development planstaking care for future disaster risks and possibilities to reducethose risks by the incorporation of appropriate mitigationmeasures. Damaged structures and services may not necessarily berestored in their previous forms and locations. Reconstructionmay include the replacement of any temporary arrangementestablished as a part of emergency response or short termrehabilitation (UNDPjGOB, 1994).
99
3.5 Disaster Management in Bangladesh
In Bangladesh disaster management is exercised at the national,regional and local levels. The organizational setups at thedifferent levels are for example, The Ministry for DisasterManagement and. Relief (MDMR), National Disaster ManagementCouncil (NDMC), Inter-Ministerial Disaster ManagementCoordination Committee (IMDMCC) etc. at the national level, theDistrict Disaster Management Committee (DDMC) at the regionallevel and the Thana Disaster Management Committee (TDMC) and theunion Disaster Management Committee (UDMC) at the local level.
The Ministry of Disaster Management and Relief (MDMR) plays animportant role as the main implementing agency of disastermanagement policies. Where as the National Disaster ManagementCouncil (NDMC) is responsible for formulation of the disastermanagement policy guide lines under the leadership of the PrimeMinister. There is also an Inter-Ministerial Disaster ManagementCoordination Committee (IMDMCC) which is responsible for theimplementation of NDMC policies on inter-ministerial basisincluding coordination of actions by all government agencies anddecisions on allocation of relief resources through its sub-committee. There are two line agencies under the supervision ofMDMR such as Disaster Management Bureau (DMB) and Directorate ofRelief and Rehabilitation (DRR), DMB is responsible for thepromotion of disaster prevention/ mitigation/ preparedness withinall agencies and levels of government through guidelines,organizing training and promoting the preparation of disastermanagement plan. DRR is responsible for, the management and.delivery of relief supplies and the provision of relatedservices. The Directorate of Relief and Rehabilitation (DRR) hasregional offices at the district level.
The District Disaster Management Committee (DDMC)which isresponsible for regional disaster management is composed ofelected representatives, district officials, BDRCS, NGOs and isheaded by the Deputy Commissioner (DC). The DDMC is responsiblefor the preparation of disaster action plans for dissemination
100
of warning and shelter facility, it prepares contingency plan forrescue and relief operations and a post-disaster rehabilitationplan. Moreover, it supervises the activities of the thanaDisaster Management Committee and ensures that, issues relatedto disaster management are considered in the district leveldevelopment planning.
Disaster management at the local level is carried out by theThana and Union Council administrations. The Thana DisasterManagement Committee (TDMC) is composed 'of elected localrepresentatives, thana officials, women's representatives, BDRCS,NGOs and is headed by the Thana Nirbahi Officer (TNO). The TDMCprepares disaster action plans for dissemination of warning andshelter facility, it also prepares contingency plan for rescueand relief operations with a post-disaster rehabilitation plan.Moreover, it is responsible for the supervision of the acti vitiesof Union Disaster Management Committee (UDMC) and ensures that,issues related to disaster management are considered in the thanalevel development planning. Similarly, the Union DisasterManagement Committee (UDMC) is composed of ward members,teacher's representatives, government workers, women'srepresentatives, BDRCS (CPP), NGOs and is headed by the UnionChairman. The UDMC is responsible for the preparation ofdisaster action plan for dissemination of warning and shelterfacility, it also prepares contingency plan for rescue and reliefoperations with a post-disaster rehabilitation plan.
3.6 Disaster Management in tile '1961 Chittagong Master Plan'
In the chittagong Master Plan of 1961 no special efforts havebeen given regarding disaster management in the city. Even highdensity of population has been encouraged in the potential riskareas with the provision of housing, industrial areas and otherimportant functions along the coastal belt of the city.
In the master plan proposal the high density activities putforward along the coastal belt such as, Patenga Housing, PatengaIndustrial area, New Mooring Housing, Halishahar Housing, Kattali
101
Housing and Faujdarhat Industrial area including the locationsof godowns and storage spaces in the same region would haveincreased the disaster vulnerability of the land if they wereimplemented duly. Moreover, there could have been set back spacesin between the proposed 'Coastal Bund' or coastal embankment andthe adjacent city land uses, to minimize the direct disastereffects on the densely populated land uses.
only a few structural measures that have been suggested in the1961 Chittagong Master Plan for the mitigation of cyclones andstorm surges in the city, proved to be ineffective during theprevious disaster events. These are - the Coastal Embankment, theProtective tree belt along the coast and Retaining Walls at thedifferent locations of the city bordering the Karnaphuli river.Retaining walls have been proposed at Patenga, Majhirghat andSadarghat bank of the Karnaphuli rivers.
Fortunately the master plan proposals have not yet been carriedout or implemented exactly as proposed by.the concerned planningagency. Changes and modifications have been made by the relatedplanning agency as a response to the problems generated from timeto time. As a consequence, the coastal area in the city stillremain undeveloped and composed of agricultural land mostly witha few haphazardly located unplanned settlements influenced by theexisting industrial locations. Therefore, This situation isalmost a positive indication towards disaster mitigation throughland use and planning polices reducing the disaster impacts inthe city area.
3.7. Disaster Management in Recently Prepared Cbittagoog StnlC:tun: Plan-19M
The recently prepared 'Draft structure Plan (1994) underChittagong Development Authority (CDA) with assistance form UNDPand UNCHS has identified five different potential peripheralexpansion areas in the city (Figure-3.3). Out of these fiveperipheral urban areas, new development has been discouraged inthe 'Coastal Plain adjacent to Dhaka Trunk Road' and 'CoastalPlain and patenga Peninsula' areas, whereas new urban development

102
has been encouraged in the remaining three locations of the city.Among the three locations of the city where development activityhas been encouraged, the north eastern part of the periphery isvulnerable to tidal floods owing to its low land level which isaround l.B-2.4m above the mean sea level (MSL) and was affectedin the April cyclone of 1991. Besides this, the other twolocations situated in the northern periphery are almost risk freeand have potential for future development.
According to the structure Plan, new development activity in thecoastal region of the city has been restricted with emphasis onthe following words: "It will discourage new urban developmentimmediately adjacent to the coast-either on the Patenga peninsulaor along the Dhaka Trunk Road to the north". The structure Planhas explained the reason behind the above mentioned point asfollows:
"Although a coastal embankment is being constructed toreplace the one breached in the last major cyclone(April 1991), overtopping of the new embankment willremain a possibility. Such overtopping could haveserious consequences for those living immediatelyadjacent to it. Further more, the part of the coastused for ship breaking' will not be protected by theembankment" (Chittagong structure Plan, 1994).
The structure plan provides a narrow strip of land in between theembankment (being constructed by Bangladesh Water DevelopmentBoard) and the potential development areas accepting the risk ofovertopping the embankment by surge water. But the chances offailure has not been considered what actually happened during1991 cyclone and storm surge and killed around 1071 people in thecity, who believed that the embankment would save them and didnot evacuate for safer places. The earthen embankment replacingthe previous one with narrow setback strip of agricultural land(that has been termed as "Good Quality Agricultural Land" in theStructure Plan map) and coastal afforestation would not provideenough safeguard against future natural disasters in the coastalarea. Moreover, adequate policy guide lines regarding theexisting development in the affected areas of 1991 Cyclone andStorm surge is absent in the draft structure plan. Also there
.J

Figllfe. J.1 MODELS OF GOVERNMENT ADMINISTRATION FOR RISK REDUCTION.
MODEL 1
PIO.Ois..1ster Planningwithin Chicf
Minisler's Office
Mini$lryof Waler
Resources
Minj~I'y ofOiSdSlcrPlanning
MiniSlry 01
Urban Planning& Public .Works
Ministry 01U.ban Pl."lnninglJ Puhlic Wmks
Minislry of
Aglicultulo
MODEL 2
Ministry ofAglicullUlO
Ministry 01tft.llh
Minislry ofU~ahh
OtherMinistries
O,herMinistfics
MODEl 3
M,ni~,lry t.1ini5l1Y of Minislty of Ministry ci Dlher01 Wale' Urban Planning Ag,icullurc Hcallh Minislricsnesoll/cos & Public Works
OiSilSlcI Disaster QiS;:\slCf DisaslerPI ,Ill ling Planning Planning Planning
Uni, Unil Unit Unil
MODEl 4
Disaslc' nesponse Council
Ministry01 WalerResources
SOllfce: lTNDRO, 1991.
Ministry ofUrban Planni"t1
Ministry 01Agriculture
Key:
Minislry 01Health
Pre-DisasterPlanning
OtherMinl3lrles
icvcrnmenlMi"i:;lr;es
104
could have been an identification of the risk areas in the citywith necessary policy guide lines to ensure proper developmentactivity in the risk area. Besides this, the delineation of therisk areas with appropriate development policies could helpdevelop awareness among people to discourage haphazard andunplanned development in the risk areas which ultimately couldcontribute in minimizing the disaster vulnerability of the-cityland.
3.8 Summary
Because of the cone shape of the Bay of Bengal near thechittagong Coast and Meghna Estuary as well as the geographicallocation of the country, Bangladesh experiences devastatingcyclone disasters almost every year. After the independence,there occurred 16 severe cyclonic storms (Takahashi, 1991) in thecountry which caused a tremendous damage to the national economy.Among these cyclone disasters the 1991 cyclone was the severemost which hit Chittagong coast with unprecedented impact.
Disaster management practiced at national, regional and locallevels in Bangladesh does not include metropolitan disastermanagement involving different metropolitan cities in thecountry. Presently disaster management is exercised at thenational, district and thana/union levels only. As a consequence,chittagong city suffered severe disaster impacts in the 'previousnatural disasters in absence of adequate disaster managementmeasures in the city.

--.~.., .c
..:~ ."~:
, - .) .. . . ..-,c?" .
- -,.,- '.
" . - .• •, .
'- - -.
i ' ."...),'-'-
CHAPTER FOUR
EXISTIIG lAID ..USE PAnERI .IDBISASTER IIIIERABlliTY OFTHESTUDY AREA
. ..•..~
CHAPfER FOUR
EXlSI1NG LAND USE PATIERN AND
DlSASfER VULNERABILfIY OF THE STUDY AREA.
4.1 IntroductionTo develop a clear understanding about the disaster vulnerabilityof the study area, a clear picture of the existing land level andthe level of surge inundation as well as the detailed inrormationregarding the present land use and the existing developmentpattern of the study area is equally important. The land-levelmap collected from the related published research (Hoque, 1991)presents necessary information about different land-levels in thecity area including the vulnerable areas which suffered stormsurge inundation during the previous natural disaster events,specially the 1991 cyclone and storm surge in the city. Thedelineation of the vulnerable areas have been carried out withrespect to the procedure put forward by JRC, (1991), where thehighest surge level has been compared with the different landlevels in the city above MSL to calculate the actual depth ofstorm surge inundation in the study area.
The city area along the coastal belt has been identified as RAand HRA on the basis of surge inundation upto 1.00 meter and morethan 1.00 meter respectively. Besides this, the north-easternfringe area has been delineated. as the low lying area whichexperiences seasonal floods owing to its low land level causedby the swelling of the Karnaphuli river located at a closeproximity to the same area.
A detailed land-use survey has also been carried out in the studyarea which provides adequate information regarding the existingland-use pattern (indicating the recent changes in the existingland use pattern), percentage of different land uses in the city(specially under vulnerable area) and present development trendin the city. Moreover" specific study about the major publicestablishments, social infrastructures physical infrastructures,utility and services, land uses vulnerable to storm surges etc.provides more information highlighting the disaster vulnerabilityof the study area in a precise way. The study about the existing
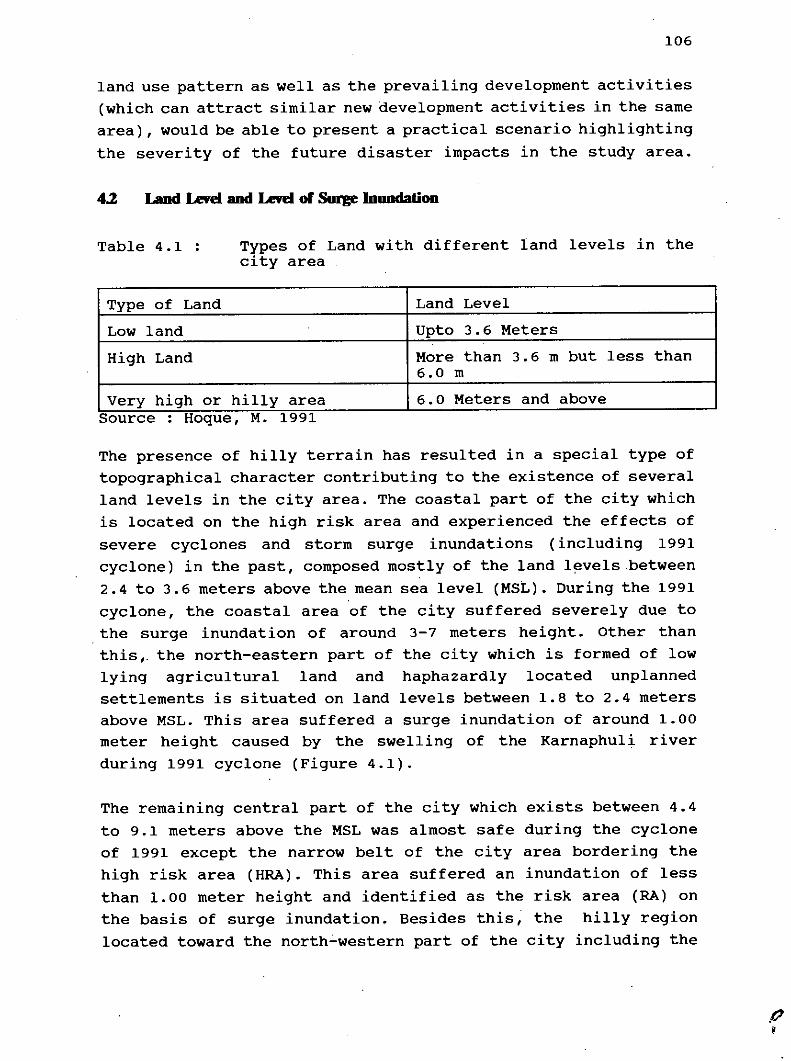
106
land use pattern as well as the prevailing development activities(which can attract similar new development activities in the samearea), would be able to present a practical scenario highlightingthe severity of the future disaster impacts in the study area.
4.Z Land I..eYeIand I..eYeIor Surge Inundation
Table 4.1 : Types of Land with different land levels in thecity area
Type of Land Land LevelLow land upto 3.6 MetersHigh Land More than 3.6 m but less than
6.0 mVery high or hilly area 6.0 Meters and above
Source : Hoque, M. 1991
The presence of hilly terrain has resulted in a special type oftopographical character contributing to the existence of severalland levels in the city area. The coastal part of the city whichis located on the high risk area and experienced the effects ofsevere cyclones and storm surge inundations (including 1991cyclone) in the past, composed mostly of the land l~velsbetween2.4 to 3.6 meters above the mean sea level (MSt). During the 1991cyclone, the coastal area of the city suffered severely due to.the surge inundation of around 3-7 meters height. Other thanthis,. the north-eastern part of the city which is formed of lowlying agricultural land and haphazardly located unplannedsettlements is situated on land levels between 1.8 to 2.4 metersabove MSL. This area suffered a surge inundation of around 1.00meter height caused by the swelling of the Karnaphuli riverduring 1991 cyclone (Figure 4.1).
The remaining central part of the city which exists between 4.4to 9.1 meters above the MSL was almost safe during the cycloneof 1991 except the narrow belt of the city area bordering thehigh risk area (HRA). This area suffered an inundation of lessthan 1.00 meter height and identified as the risk area (RA) onthe basis of surge inundation. Besides this, the hilly regionlocated toward the north-western part of the city including the
.d,
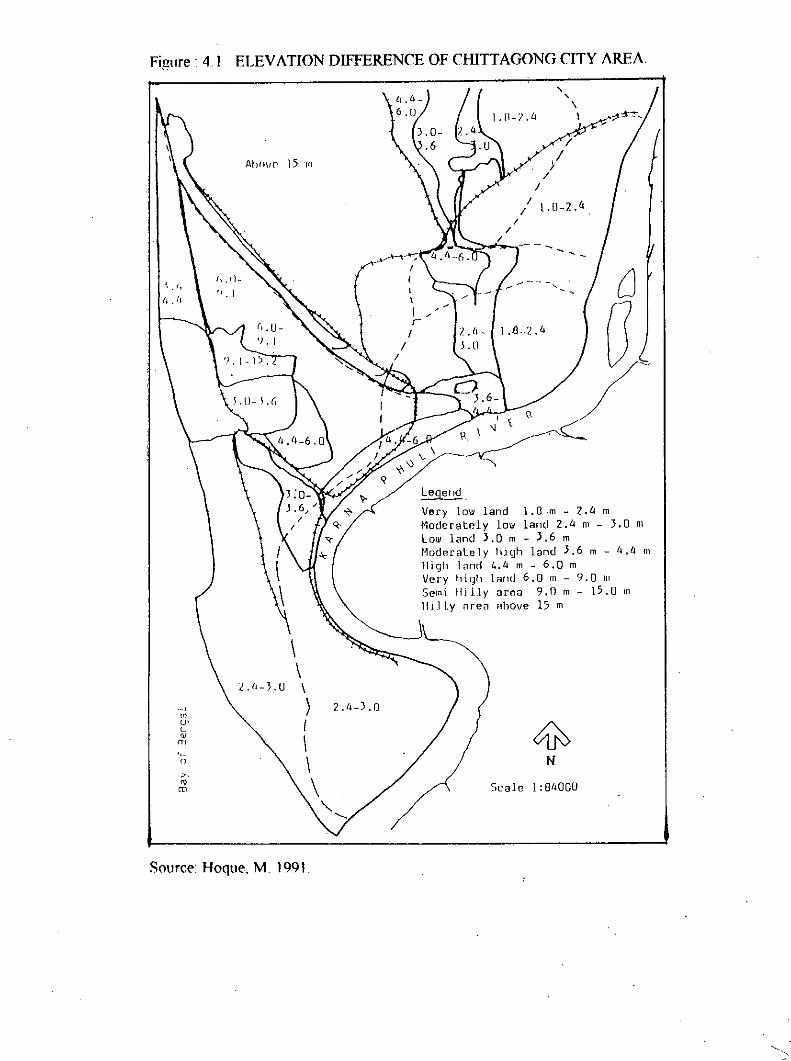
Figure. 4.\ ELEVATION DIFFERENCE OF CHITTAGONG CITY AREA
Scale I: 0400U
I. ll_J.lI
Legend.
Very low land 1.0.m - 2.4 mModerately low land 2.4 m - 3.0 mLow land 3.0 m - 3.6 mModerately Iliyh land J.6 m - 4.4 01High land 4.4 m - 6.0 mVery high land 6.0 rn - 9.0 III
Semi Hilly area 9.0 m - 15.0 rnlli.lly flrea ahove 15 m
_~..A-1-~III\Ir
II
I
Ahrlllp. 15 [fI
r, .0-'J. I
'}. I - 1 ::. •.
r, .1] .•
'l. I
',-n
.- ,onU'CIDm
" .r',
Source. Hoque. M. 1991.
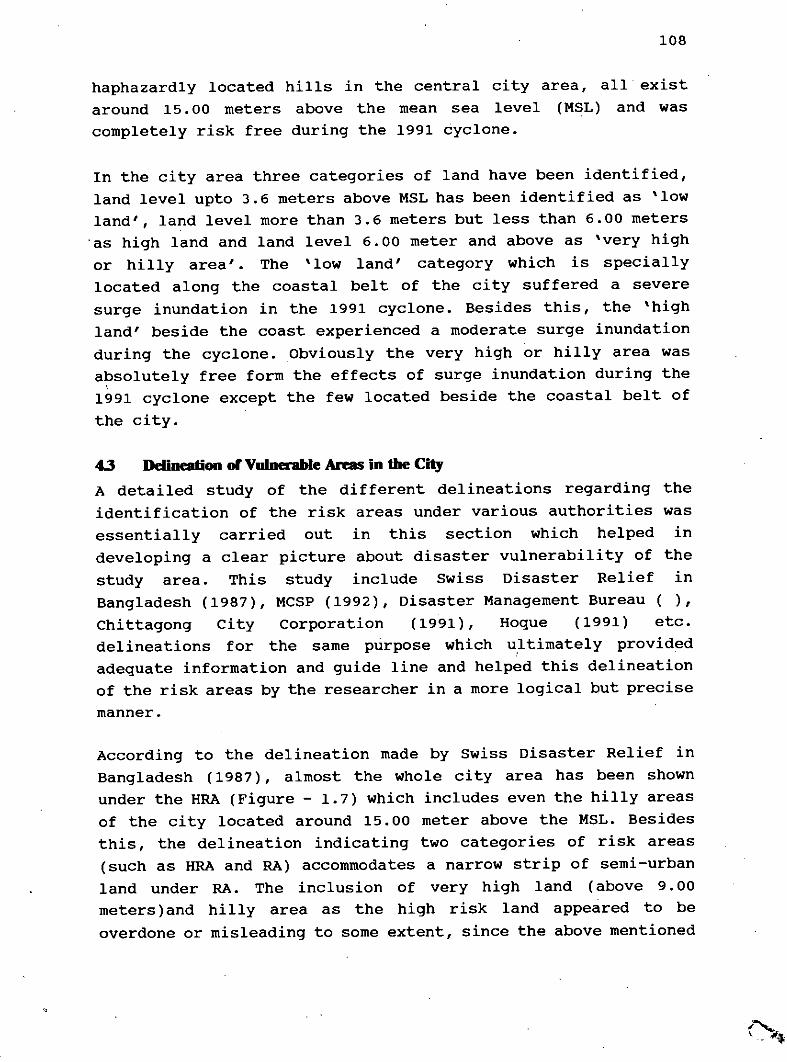
108
haphazardly located hills in the central city area, all existaround 15.00 meters above the mean sea level (MSL) and wascompletely risk free during the 1991 cyclone.
In the city area three categories of land have been identified,land level upto 3.6 meters above MSL has been identified as 'lowland', land level more than 3.6 meters but less than 6.00 meters.as high land and land level 6.00 meter and above as 'very highor hilly area'. The 'low land' category which is speciallylocated along the coastal belt of the city suffered a severesurge inundation in the 1991 cyclone. Besides this, the 'highland' beside the coast experienced a moderate surge inundationduring the cyclone. Obviously the very high or hilly area wasabsolutely free form the effects of surge inundation during the1991 cyclone except the few located beside the coastal belt ofthe city.
4.3 Delineation orVulnel'ableAreas in the CityA detailed study of the different delineations regarding theidentification of the risk areas under various authorities wasessentially carried out in this section which helped indeveloping a clear picture about disaster vulnerability of thestudy area. This study include Swiss Disaster Relief inBangladesh (1987), MCSP (1992), Disaster Management Bureau ( ),Chittagong City Corporation (1991), Hoque (1991) etc.delineations for the same purpose which ultimately providedadequate information and guide line and helped this delineationof the risk areas by the researcher in a more logical but precisemanner.
According to the delineation made by Swiss Disaster Relief inBangladesh (1987), almost the whole city area has been shownunder the HRA (Figure - 1.7) which includes even the hilly areasof the city located around 15.00 meter above the MSL. Besidesthis, the delineation indicating two categories of risk areas(such as HRA and RA) accommodates a narrow strip of semi-urbanland under RA. The inclusion of very high land (above 9.00meters)and hilly area as the high risk land appeared to beoverdone or misleading to some extent, since the above mentioned
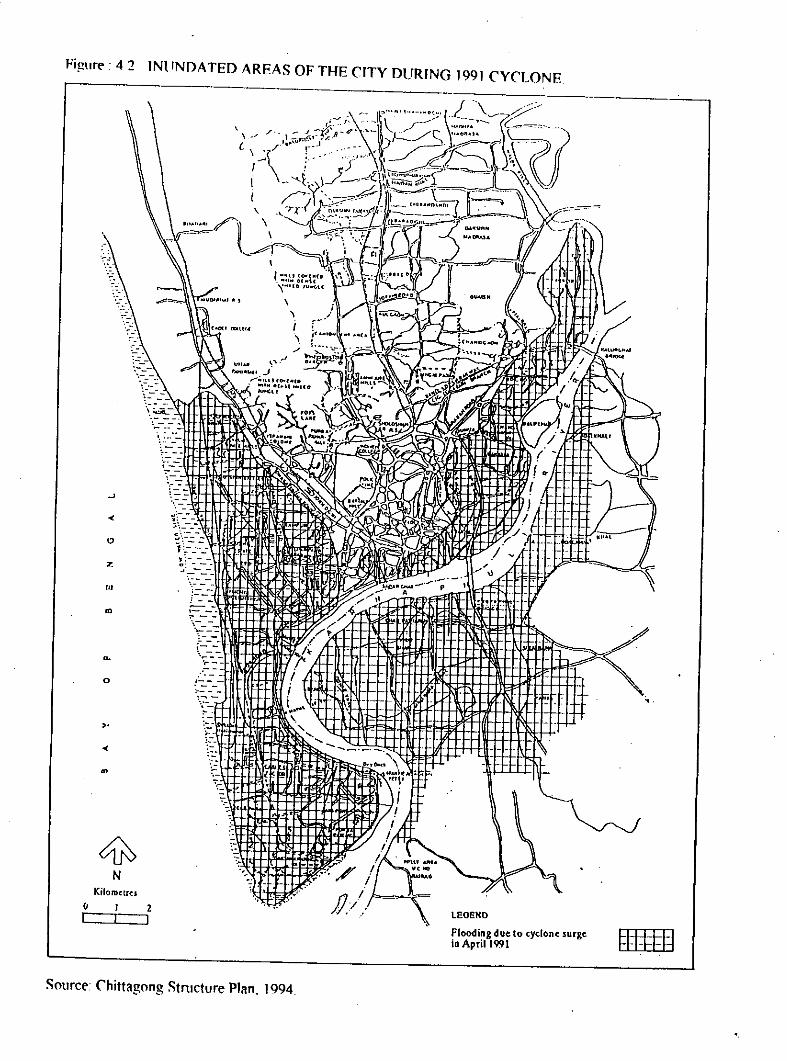
Fi!!ur(': 4 2 INliNOATED AREAS OF THE CITY DURING 1991 CYCLONE
I=I=l=I=mtlli:lli
LEOEND
Flooding due to cyclone surgeio April 1991
..'-; ' ..
~~~~..~:::
.-- -'
2I
"': ..-:"
w
",. -.--
/
<:
o
z
'"
o
<:
,.
KilomctresoI
Sourc(': Chiltagong Stnlctur(' Plan. 1994.
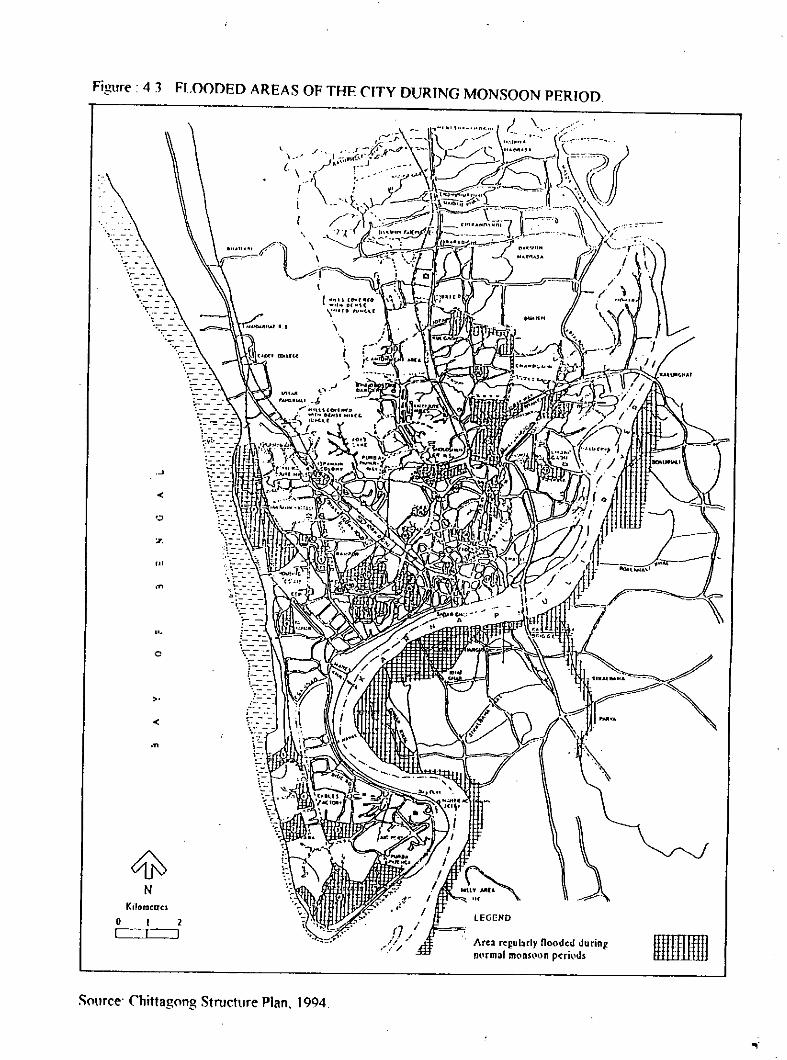
Figure. 4 3 FLOODED AREAS OF THE CITY DURING MONSOON PERIOD.
oI
<
'"
c
>"
<
"~
Kilorac[f(l
2I
LEGEND
Area regubrly nooded Juringnt1rmal m(lnS\ll)n peril..'Js
Source" Chittagong Structure Plan, 1994.
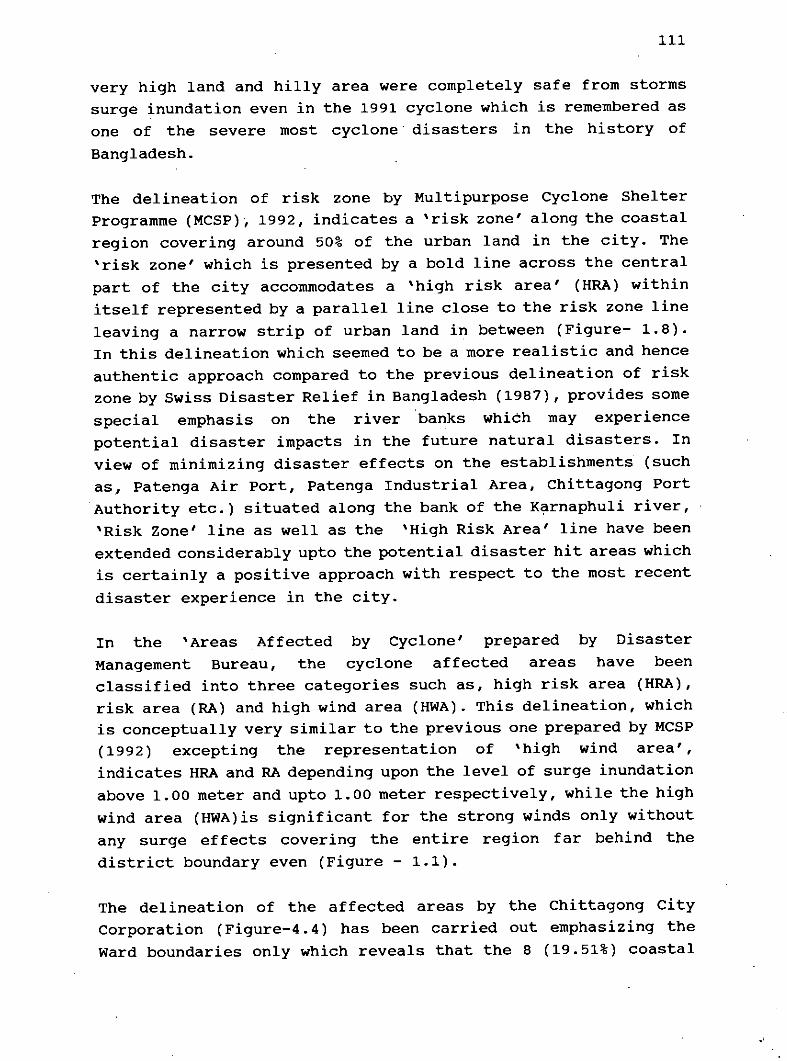
111
very high land and hilly area were completely safe from stormssurge inundation even in the 1991 cyclone which is remembered asone of the severe most cyclone. disasters in the history ofBangladesh.
The delineation of risk zone by Multipurpose Cyclone ShelterProgramme (MCSP), 1992, indicates a 'risk zone' along the coastalregion covering around 50% of the urban land in the city. The'risk zone' which is presented by a bold line across the centralpart of the city accommodates a 'high risk area' (HRA) withinitself represented by a parallel line close to the risk zone lineleaving a narrow strip of urban land in between (Figure- 1.8).In this delineation which seemed to be a more realistic and henceauthentic approach compared to the previous delineation of riskzone by Swiss Disaster Relief in Bangladesh (1987), provides somespecial emphasis on the river banks which may experiencepotential disaster impacts in the future natural disasters. Inview of minimizing disaster effects on the establishments (suchas, Patenga Air Port, Patenga Industrial Area, Chittagong PortAuthority etc.) situated along the bank of the K~rnaphuli river,'Risk Zone' line as well as the 'High Risk Area' line have beenextended considerably upto the potential disaster hit areas whichis certainly a positive approach with respect to the most recentdisaster experience in the city.
In the 'Areas Affected by Cyclone' prepared by DisasterManagement Bureau, the cyclone affected areas have beenclassified into three categories such as, high risk area (HRA),risk area (RA) and high wind area (HWA). This delineation, whichis conceptually very similar to the previous one prepared by MCSP(1992) excepting the representation of 'high wind area',indicates HRA and RA depending upon the level of surge inundationabove 1.00 meter and upto 1.00 meter respectively, while the highwind area (HWA)is significant for the strong winds only withoutany surge effects covering the entire region far behind thedistrict boundary even (Figure - 1.1).
The delineation of the affected areas by the Chittagong CityCorporation (Figure-4.4) has been carried out emphasizing theWard boundaries only which reveals that the 8 (19.51%) coastal

)1 ~"." ••••'n 't".;r.h"nh,i' 1'.hr:.h.,~ ,'" ••.•• " .\ •• <t)\ r:..•.~.~11 ,1,\,,'.> •••;.... I'•• , ~,.,,~1/ C\ •••11'''.~ M"h,.2!l r"ho Shl ••h.hl""1 r"I ••h•• "I,.,II P ••..••• n.h.,I,a~! Dt~.~,.fl.\,.li.o~, P,""r"'\01 11,1" Kallal.1:, I.••\,h,. K.1I>1,:Vl :r" •• l!.h.h.~u11 I)"" M.,l~" 1I.1;.h~~,:u- I••~\,. "h(n,.lhlu~.~1I.\'l t."",~"11.1,,~.hl~IJ 1111., r.".,.1\ L•.h~,"I',,~"~.
'.I.'AI~I.'tIlJMhJ-F •.••Nl)" •••M.'.
)
~
'I
'"/(/I
" /. '.V,IF./)
/Ilf)(lND,\R'I .
.. ',:I!")"
1I0lINl},\HYI/
..
,--
_ ~EVERELY AfFECTED~ MOIlERATELY "o LE~~ "
13
<
o
<
:z
1 hlJi "".• " omc~••.\ fI•••• ', ).,ul Khu, E •• ,., [lou!, Drw •• [~ur, A.,l ••,\,lla
1 ••••lko •••
• P.l\rr,hu
~
, Fill.s.r( DUll10 B,,~i';'I'11 5.l.\ h.h,
" Puc.; ••S\d ••~.h••I' ~\ •• ;. Plhrl.li
N I' J.I.I.l:oad
1' L.•IUnllara,
Kilometres I' Pit!>. "'hJ~rl'£nI' Plloc.i", M~,h,lo.",,,
0 2 " lInor PaI••• ,,,,,I,
I I I" r.lh".l""H','I. G,,'lil.l. "I"
Fi!!lIfe.4.4 AFFECTED CITY WARDS IN THE 1991 CYCLONE AND STORM S(fRGE

113wards (such as, Ward NO.34. uttar Kattali, 35. Dekshin Kattali,36. uttar Halishahar, 37. Uttar-Madhya Halishahar, 38. Dekshin -Madhya Halishahar, 39. Dekshin Halishahar, 40. Uttar Patenga and41. Dekshin Patenga) were severely affected during 1991 cycloneand storm surge. Another 9 (21.95%)wards which are mostly locatedin the north-eastern fringe area have been identified as themoderately affected area, these are - Ward no. 8. Patherghata,9. Firingee Bazar. 27. Chandgaon, 28. Mohra, 29. PurbaSholashahar, 30. Purba Bakalia, 31. Paschim Bakalia and 32.Dekshin Bakalia. The remaining city wards (58.53%) have beenshown as the less affected areas. These are, ward no. 1.Baghmoniram, 2. Chawk Bazar, 3. Jamal Khan, 4. Enayet Bazar, 5.Dewan Bazar, 6. Anderkilla, 7. Alkaran, 10. Boxirhat, 11. SulakBahar, 12. Paschim Sulak Bahar, 13. Dekshin Pahartali, 14.Jalalabad, 15. Lalkhan Bazar, 16. Purba Madarbari, 17. PaschimMadarbari, 18. Uttar Pathantooli, 19. Pathantooli, 20.Gosaildanga, 21. Saraipara, 22. Uttar Pahartali, 23. Pahartali,24. Uttar Agrabad, 26. Panchlaish and 33. Rampur.
Since the delineation of affected areas by the chittagong CityCorporation (CCC) has emphasized the ward boundaries asdemarcation lines so the identification of the affected areasbased on city wards only is some how exaggerated and misleadingat the same time. Besides this, the conceptual basis is almostin line with the above mentioned ideas regarding delineation ofthe risk areas by different international as well as localauthorities. The delineation of risk zones' in the city (Hoque,1991) for different return periods (such as, 10, 20, 50 and 100years) indicates the fact that, increase of land area underdisaster risk has got a direct relationship with the increasedtime span of the return period. Especially, for a larger returnperiod accumulation of a larger land mass under high risk area(HRA) is remarkable in all the cases in the delineation (upto100 years return period). The author delineated the risk zonesinto three categories such as, risk area (RA), moderate riskarea (MRA) and high risk area (HRA), where the risk and moderaterisk areas are fluctuating with the change in length of time spanof the. return period. Besides this, two high risk areas areidentified at the two different locations of the city where thelarger one exists beside the coastal belt and the another one issituated at the
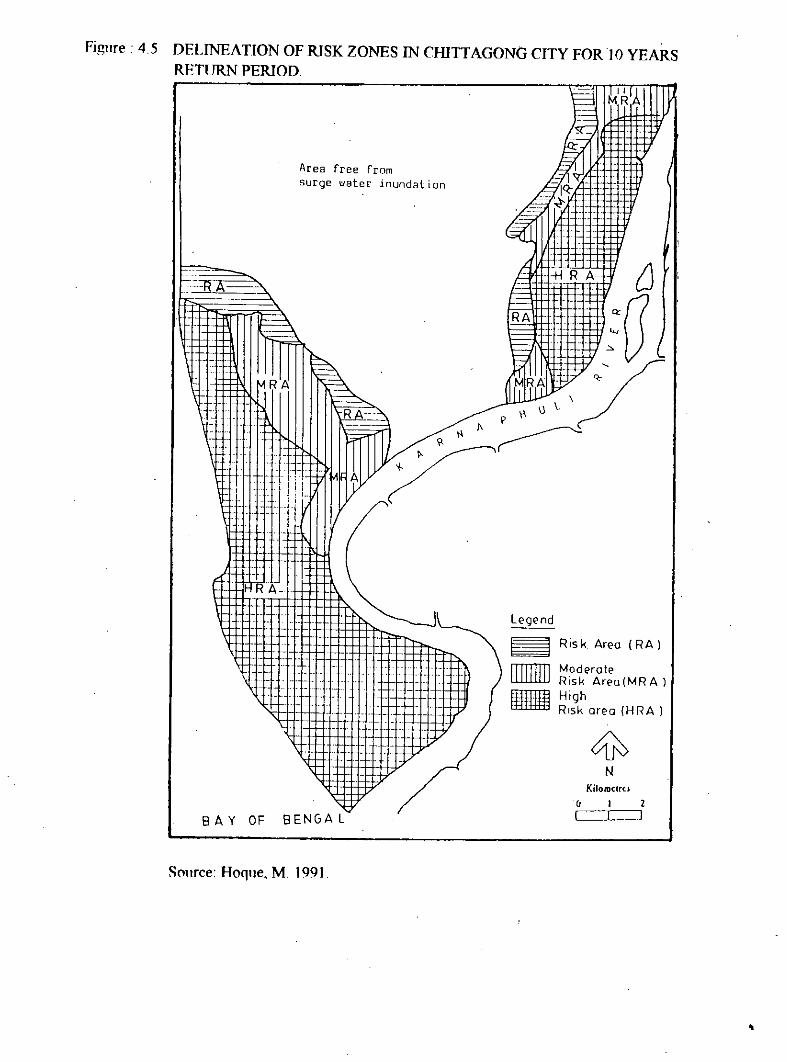
Figure.4.5 DELINEATION OF RISK ZONES IN CHITTAGONG CITY FOR 10 YEARSRETURN PERIOD.
.,- I
Area free fromsurge water inundation
- +J R A-
Legend
BAY OF BENGAL
Source. Hoque, M. 1991.
Ris k. Area (R A )
ModerateRisk Area(MRA)HighRISk area (H RA )
Kilomclru
" I 2C:=.c=J
•
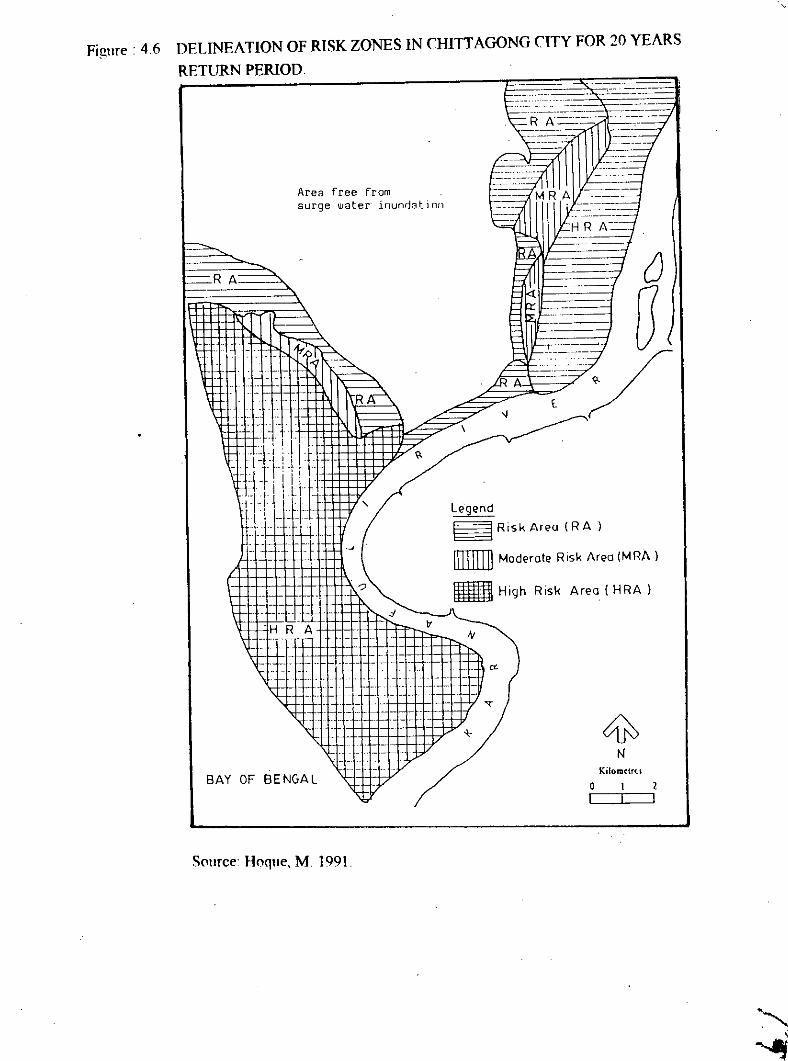
Fi!\lIfe : 4.6 DELINEATION OF RISK ZONES IN CHITTAGONG CITY FOR 20 YEARS
RETURN PERIOD------,
-RA
.-_.------_.-----~
Area free fromsurge water" inundatioil
Legend~RiskArea (RA)
ITIIIIIil Moderate Risk Area (MRA )
_ High Risk Area (HRA )
RA:
.H R A
BAY OF BENGA L
S('IlIfce: Hoque, M. 1991.
oI
KilolUctro
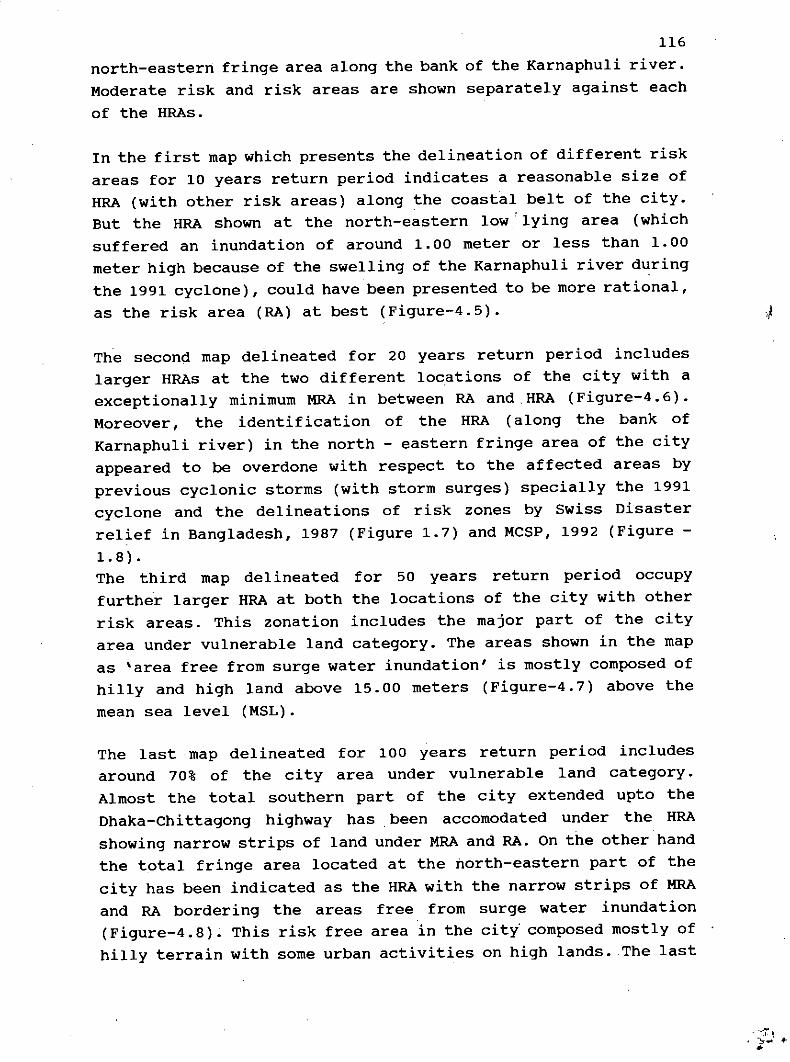
116north-eastern fringe area along the bank of the Karnaphuli river.Moderate risk and risk areas are shown separately against eachof the HRAs.
In the first map which presents the delineation of different riskareas for 10 years return period indicates a reasonable size ofHRA (with other risk areas) along the coastal belt of the city.But the HRA shown at the north-eastern low ,lying area (whichsuffered an inundation of around 1.00 meter or less than 1.00meter high because of the swelling of the Karnaphuli river duringthe 1991 cyclone), could have been presented to be more rational,as the risk area (RA) at best (Figure-4.5).
The second map delineated for 20 years return period includeslarger HRAs at the two different locations of the city with aexceptionally minimum MRA in between RA and.HRA (Figure-4.6).Moreover, the identif ication of the HRA (along the bank ofKarnaphuli river) in the north - eastern fringe area of the cityappeared to be overdone with respect to the affected areas byprevious cyclonic storms (with storm surges) specially the 1991cyclone and the delineations of risk zones by Swiss Disasterrelief in Bangladesh, 1987 (Figure 1.7) and MCSP, 1992 (Figure -1.8) .The third map delineated for 50 years return period occupyfurther larger HRA at both the locations of the city with otherrisk areas. This zonation includes the major part of the cityarea under vulnerable land category. The areas shown in the mapas 'area free from surge water inundation' is mostly composed ofhilly and high land above 15.00 meters (Figure-4.7) above themean sea level (MSL).
The last map delineated for 100 years return period includesaround 70% of the city area under vulnerable land category.Almost the total southern part of the city extended upto theDhaka-Chittagong highway has. been accomodated under the HRAshowing narrow strips of land under MRA and RA. On the other handthe total fringe area located at the north-eastern part of thecity has been indicated as the HRA with the narrow strips of MRAand RA bordering the areas free from surge water inundation(Figure-4.8). This risk free area in the city composed mostly ofhilly terrain with some urban activities on high lands. The last
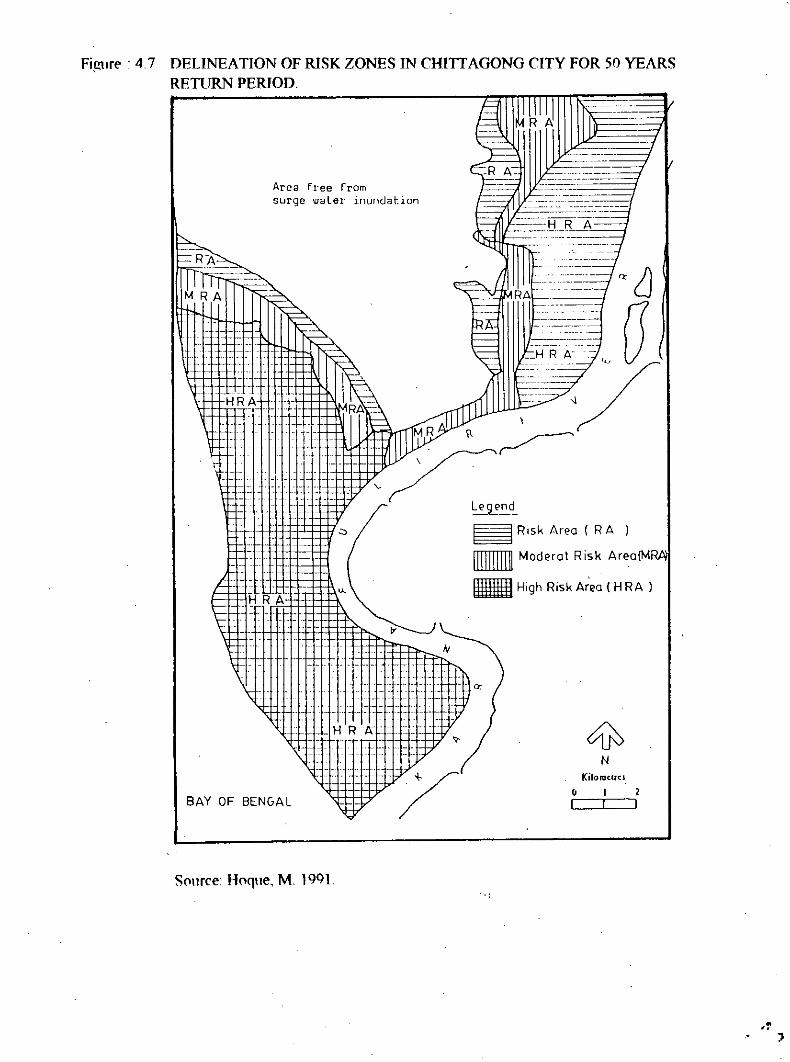
Figllft' : 4.7 DELINEATION OF RISK ZONES IN CHITTAGONG CITY FOR 50 YEARSRETURN PERIOD.
Area free fromsurge water inundation
HRA
.•l:.
H RA:'
~ RISk Area (RA
_ Maderal Risk Areo(M
_ High Risk A;ea (H RA )
BAY OF BENGA L
SOllfce: Hoque, M. 1991.
KiloroC:UCl
o 2I I
...,
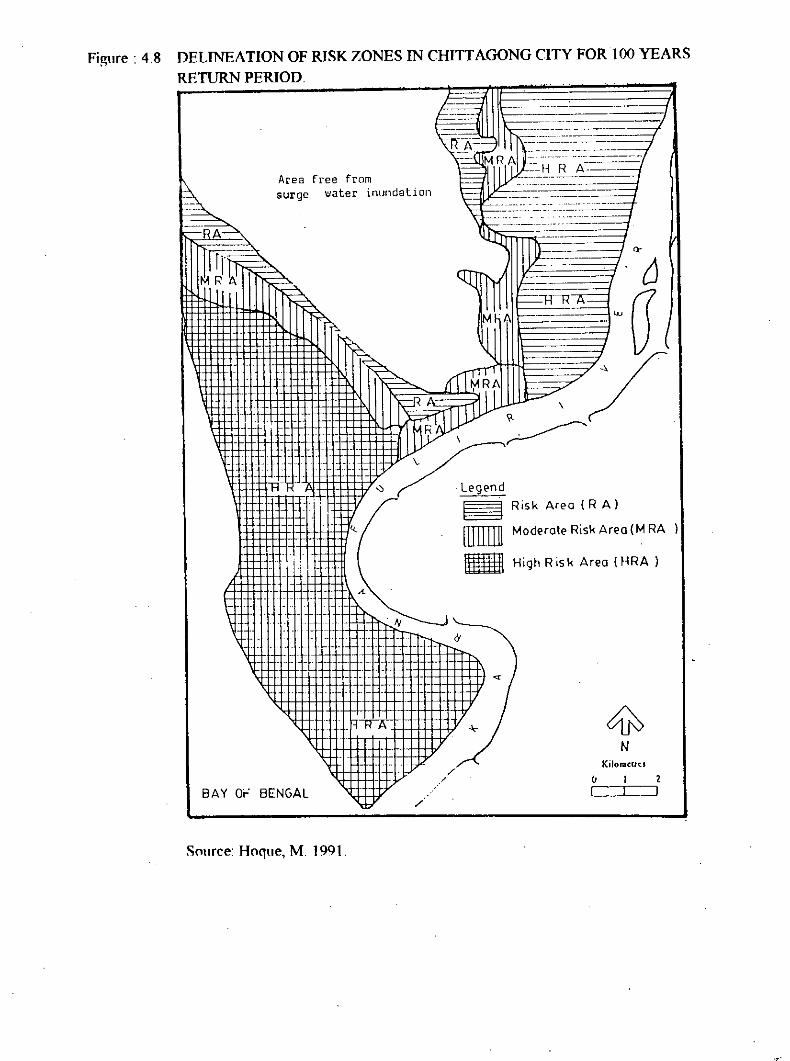
Figllfe : 4.8 DELINEATION OF RISK ZONES IN CHITT AGONG CITY FOR 100 YEARSRETURN PERIOD.
Area free fromsurge \:Jater inundation
:i'
-cj:"'--,a,~/
R --------\ ~~/::
~ Risk Area (R Al
[[[[[]I Moderate Risk Area(M RA
_ High Risk Area (HRA)
BAY Or: BENGAL
Source- Hoque, M. 1991.
/./
Kiromeuuo I 2I I:=J
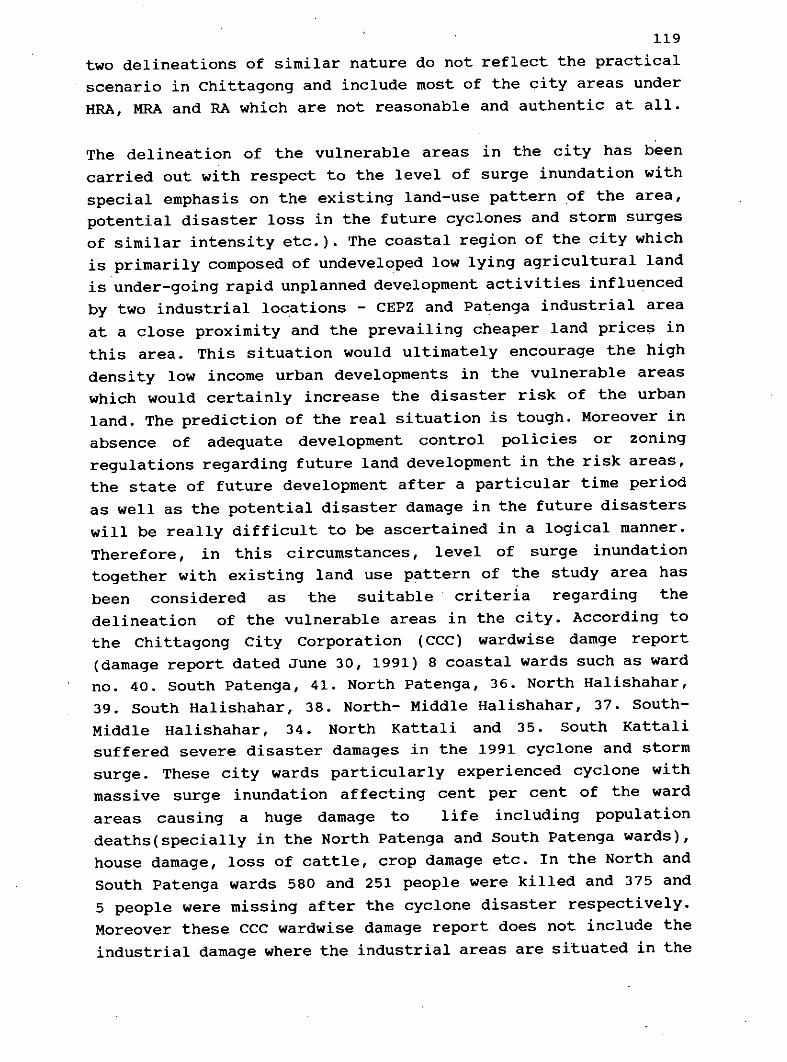
119two delineations of similar nature do not reflect the practicalscenario in chittagong and include most of the city areas underHRA, MRA and RA which are not reasonable and authentic at all.
The delineation of the vulnerable areas in the city has beencarried out with respect to the level of surge inundation withspecial emphasis on the existing land-use pattern of the area,potential disaster loss in the future cyclones and storm surgesof similar intensity etc.). The coastal region of the city whichis primarily composed of undeveloped low lying agricultural landis under-going rapid unplanned development activities influencedby two industrial locations - CEPZ and Patenga industrial areaat a close proximity and the prevailing cheaper land prices inthis area. This situation would ultimately encourage the highdensity low income urban developments in the vulnerable areaswhich would certainly increase the disaster risk of the urbanland. The prediction of the real situation is tough. Moreover inabsence of adequate development control policies or zoningregulations regarding future land development in the risk areas,the state of future development after a particular time periodas well as the potential disaster damage in the future disasterswill be really difficult to be ascertained in a logical manner.Therefore, in this circumstances, level of surge inundationtogether with existing land use pattern of the study area hasbeen considered as the suitable criteria regarding thedelineation of the vulnerable areas in the city. According tothe Chittagong city corporation (CCC) wardwise damge report(damage report dated June 30, 1991) 8 coastal wards such as wardno. 40. South Patenga, 41. North Patenga, 36. North Halishahar,39. South Halishahar, 38. North- Middle Halishahar, 37. South-Middle Halishahar, 34. North Kattali and 35. South Kattalisuffered severe disaster damages in the 1991 cyclone and stormsurge. These city wards particularly experienced cyclone withmassive surge inundation affecting cent per cent of the wardareas causing a huge damage to life including populationdeaths(specially in the North Patenga and South Patenga wards),house damage, loss of cattle, crop damage etc. In the North andSouth Patenga wards 580 and 251 people were killed and 375 and5 people were missing after the cyclone disaster respectively.Moreover these CCC wardwise damage report does not include theindustrial damage where the industrial areas are situated in the
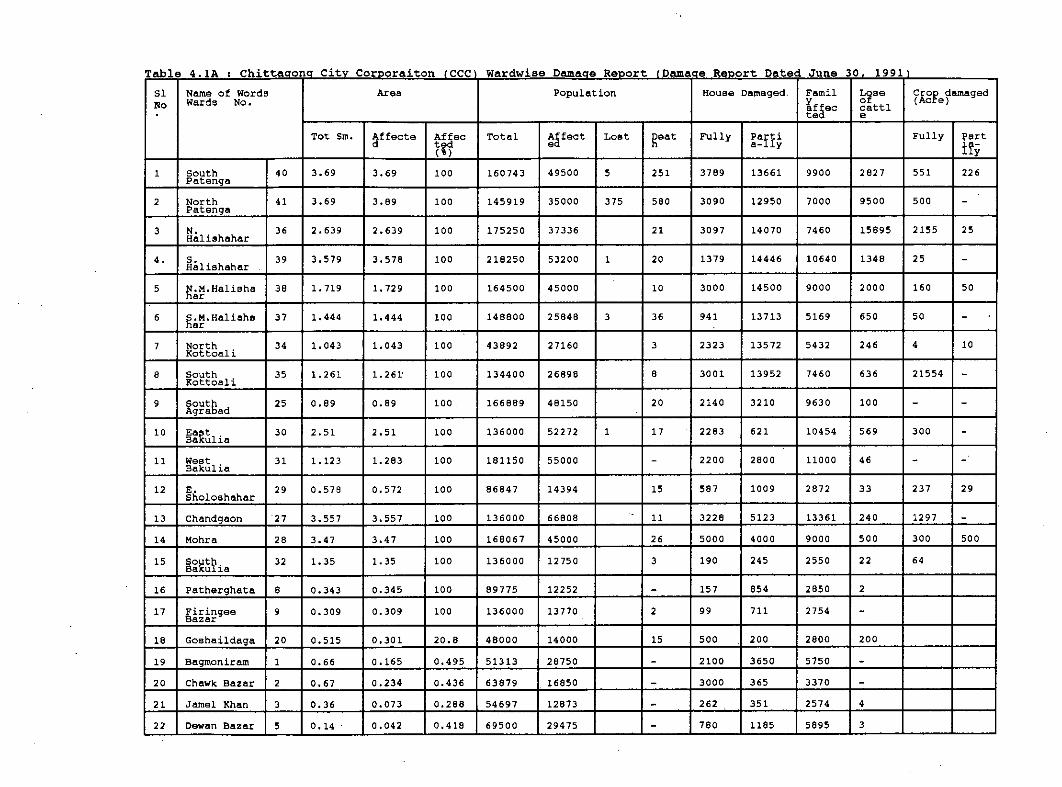
Table 4.1A I Chittaqonq City COrPoraiton (Cce) WardwiseDamaqe Report (Damaqe Report Dated June 30, 1991\SlNo
Name of WordaWards No.
Area Population House Damaged. Familhffected
~~8acattle
-Crop damaged(Ac~e)
1
2
3
4.
5
6
7
8
9
10
11
12
13
14
15
16
17
18
19
20
21
22
southpatengaNorthPatengaN.Haliahahar
~8liahaharN.M.HaliahaharS.M.HaliahaharNorthKottoaliSouthKottoaliSouthAgrabad
~:~~liaWestBakuliaE.SholoshaharchandgaonMohraSouthBskuliaPatherghataFiringaeBazarGoshaildagaBagmoniramChawk BazarJamel KhanDewan Bazar
40
41
36
39
38
37
34
35
25
30
31
29
27
28
32
8
9
20
1
2
3
5
Tot Sm.
3.69
3.69
2.639
3.579
1.719
1. 444
1.043
1.261
0.89
2.51
1. 123
0.578
3.5573.471.35
0.3430.309
0.5150.660.67
0.360.14
Affected
3.69
3.89
2.639
3.578
1.729
1.444
1.043
1.261'
0.89
2.51
1.283
0.572
3.5573.471. 35
0.3450.309
0,3010.1650.2340.0730.042
Affected(')100
100
100
100
100
100
100
100
100
100
100
100
100
100
100
100
100
20.8
0.4950.436
0.2880.418
Total
160743
145919
175250
218250
164500
148800
43892
134400
166889
136000
181150
86847
136000168067136000
89775136000
4800051313638795469769500
Affected
49500
35000
37336
53200
45000
25848
27160
26898
48150
52272
55000
14394
668084500012750
1225213770
1400028750168501287329475
Loat
5
375
1
3
1
geat
251
580
21
20
10
36
3
8
20
17
15
11
26
3
2
15
Fully
3789
3090
3097
1379
3000
941
2323
3001
2140
2283
2200
587
32285000190
157
99
500
21003000
262
780
Partia-lly
13661
12950
14070
14446
14500
13713
13572
13952
3210
621
2800
1009
51234000
245
854
711
200
3650365
351
1185
9900
7000
7460
10640
9000
5169
5432
7460
9630
10454
11000
2872
1336190002550
28502754
28005750337025745895
2827
9500
15895
1348
2000
650
246
636
100
569
46
33
240
500
22
2
200
4
3
Fully
551
500
2155
25
160
50
4
21554
300
237
1297300
64
~artu;;226
25
50
10
29
500
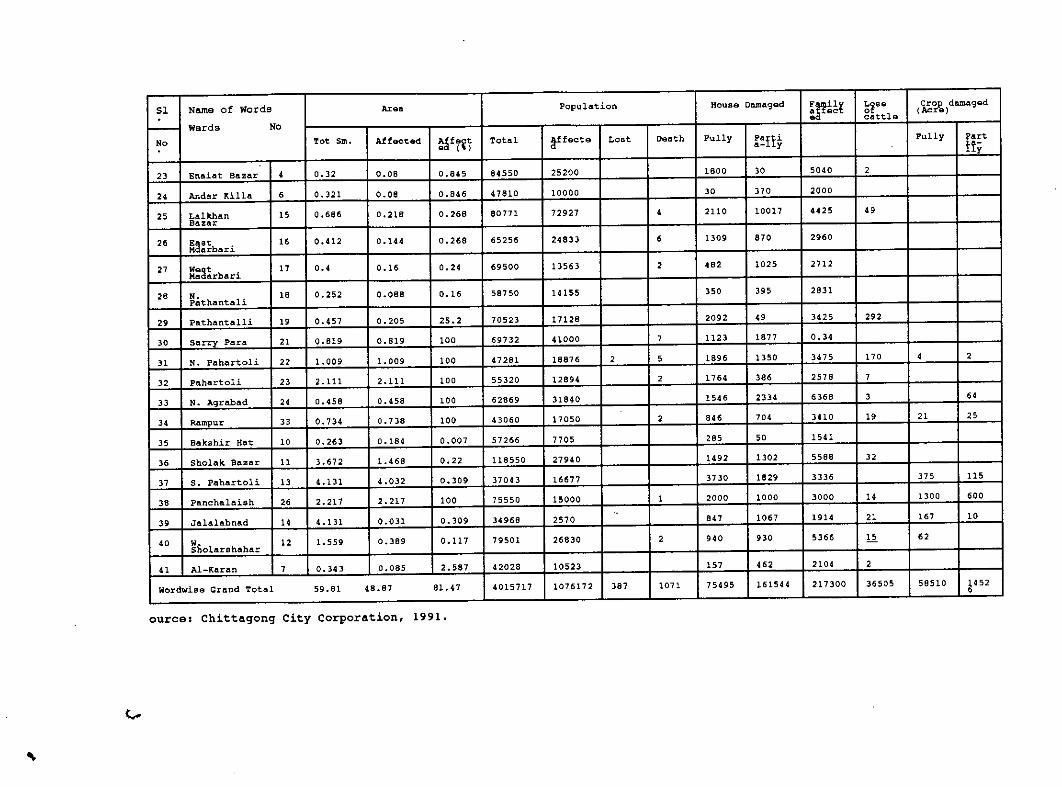
,(.,..
51 Name of Words Ar•• Population HOUDe Damaged F '1 ~~SQ Crop dam4ged:~c~ (Acre)
- Wards Nocattle
No Tot Sm. Affected :af.{t Total ~fect9 Lost Death Fully ~~n~ Fully fart. ( ) If,23 Enaiat Bazar • 0.32 O.OB 0.845 84550 25200 1600 30 5040 2
2. Andar !'tilla • 0.321 0.08 0.646 41810 10000 30 370 2000
25 Lalkhan 15 0.686 0.218 0.268 B0171 72927 4 2110 10017 4425 49Bazar
2. ~a:ibllri ,. 0.412 0.144 0.268 65256 24833 • 1309 870 2960
27 ~:a~rbllri17 0.' 0.16 0.24 69500 13563 2 482 1025 2712
28 ~athantali18 0.252 0.088 0.16 58750 14155 350 395 2831
29 Pathantalli " 0.457 0.205 25.2 70523 17128 2092 4' 3425 292
30 Sarry Para 21 0.B19 0.B19 100 69732 41000 7 1123 1677 0.34
31 N. Pahartoli 22 1.009 1.009 100 47281 18876 2 5 1896 1350 3475 170 4 2
32 Pahartoli 23 2.111 2.111 100 55320 12894 2 1764 38. 2578 7
33 N. Agrabad 24 0.458 0.458 100 62869 31840 1546 2334 6368 3 ••.
34 Rampur 33 0.734 0.738 100 43060 17050 2 84. 70. 3UO 19 21 25
35 Bakshir Hat 10 0.263 0.184 0.007 57266 7705 285 50 1541
3. Sholak Bazar 11 3.672 1.468 0.22 118550 27940 1492 1302 5588 32
37 S. Pahartoli 13 4.131 4.032 0.309 31043 16677 3730 1829 3336 375 115
38 Panchalaish 2. 2.211 2.211 100 75550 15000 1 2000 1000 3000 14 1300 .00
39 Jalalabnad 14 4.131 0.031 0.309 34968 2510 847 1067 1!H4 21 '.7 10
40~holarshahar
12 1.559 0.389 0.117 79501 26830 2 ••0 .30 5366 12 .2
41 Al-Karan 7 0.343 0.085 2.587 42028 10523 157 4.2 2104 2
Wordwise Grand Total 59.81 48.87 81.47 4015111 1076172 387 1011 75495 161544 217300 36505 58510 1452•ourC9S Chittaqonq City Corporation, 1991.
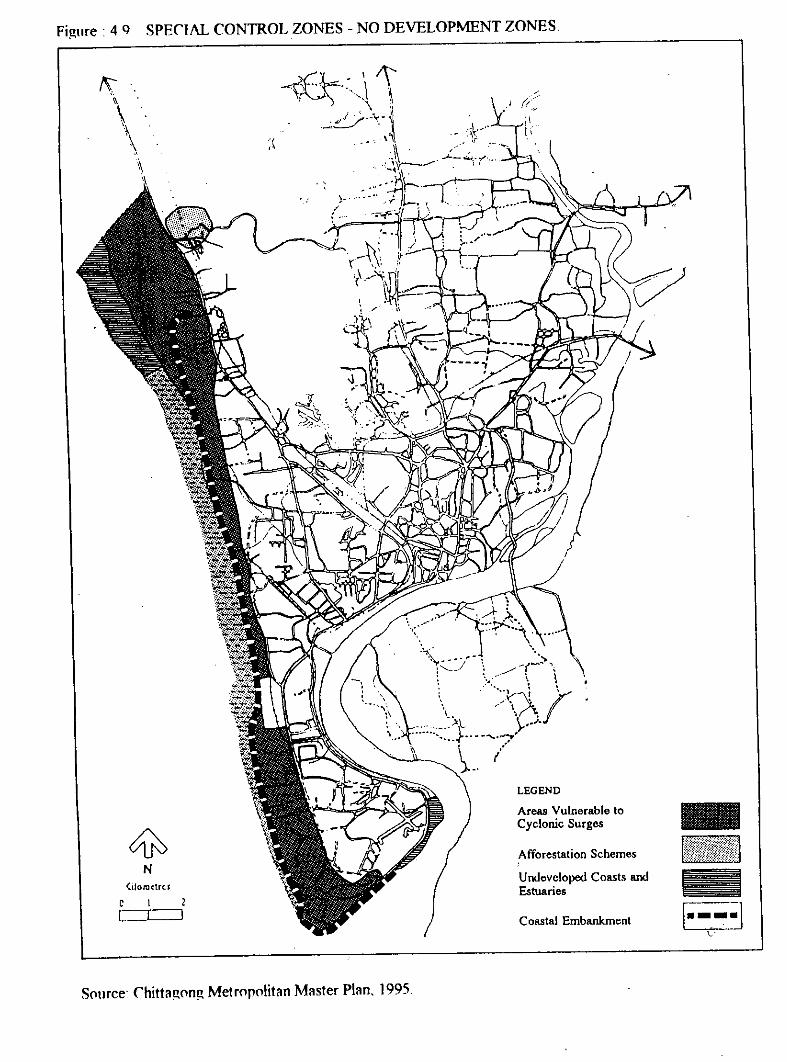
Figure: 49 SPECIAL CONTROL ZONES - NO DEVELOPMENT ZONES
(ilofl)<.trc.'
C 2L I
S(ltlfce' Chittag(lng Metrnp(l!itan Master Plan, 1995,
LEGEND
Areas Vulnerable toCyclonic Surges
Afforestation Schemes
Undeveloped Coasts andEstuaries
Coastal Embankment
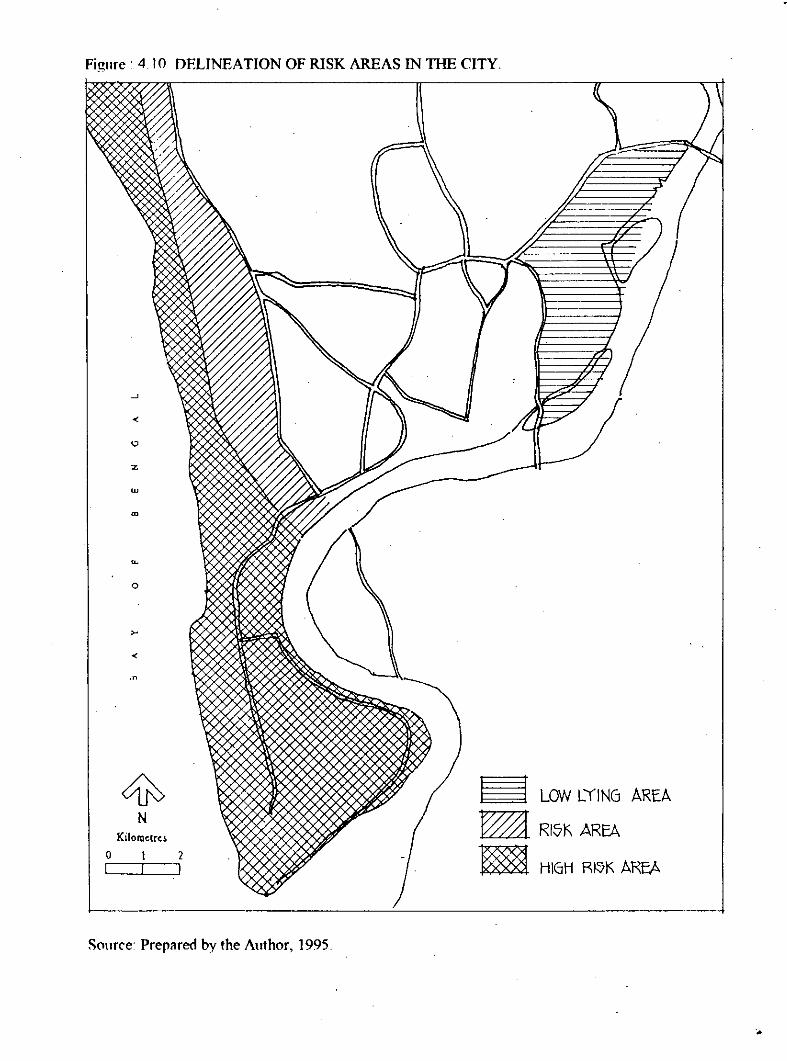
Figure: 4.10 DELINEATION OF RISK AREAS IN THE CITY
,--
~ LOW [YING AREA
~ RI~KAREA
~ HIGH RI:7K AREA
o
w
z
,n
Kilomettuo 2I I
Source: Prepared by the Author, 1995,
124severely" affected coastal wards. These industrial areas arePatenga Industrial Area, Chittagong Export Processing Zone(CEPZ) and Kattali Industrial Area which incurred a damage ofaround 388 million US dollars in the last cyclone (Jahan, 1991).Besides this, the Chittagong Port Authority, Patenga Airport,Bangladesh Air Force and Bangladesh Navy incurred anunprecedented damage to the national property. The nature of thedisaster impact which was totally different in the coastal areacompared to the other parts "ofthe city area, suffered 3-7 metreshigh surge inundation accompanied by violent wind during the 1991devastation. Therefore 19.06 sq. miles of the coastal areasuffered severe disaster impacts while 299942 people wereaffected, 384 people were lost or missing, 929 people werekilled, 20620 houses were fully damaged, 110864 houses werepartially damaged, 33102 cattle were lost and 21554 acres ofagricultural crop was fully damaged in the coastal wards of thecity. On the other hand, the industrial activities, Portactivity, Patenga Airport, warehouses, Post and Telecommunicationsector suffered a damaged of around 500 million US dollars in thecyclone. Other than this, the remaining part of the-"cityexperienced the impact of tremendous wind only except the north-eastern part which suffered a low level inundation owning to itslow land level situated beside the bank of the Karnaphuli river.The low line area which is occupied by agricultural activitymainly did not suffered severe damages except some crop damageincluding damaged to the semi-urban settlements in thesurrounding areas.The delineation of the risk areas based on the depth ofinundation also include different activities or land uses underthe high risk area (HRA) , risk area (RA) or low lying area (LLA)in terms of severity of disaster impacts in the 1991 cyclone andstorm surge. This activities which comprises industrial areas,unclassified areas (such as Airport, Sea port, scientific andTraining Institutions etc.) and warehouses incurred damaged tothe national property besides human deaths in the city.Therefore, the delineation of the vulnerable areas has been madeon the basis of damaged to the public or private property also(along with damage to life). The industrial activities along thecoastal belt of the city which suffered unprecedented damages inthe 1991 cyclone were accomodated in the high risk area (HRA) inconsideration to the future increased disaster damages in the
125same sector. Moreover, the unclassified areas(which includePatenga Airport, Chittagong Port and Scient'ific and TrainingInstitutions) experienced massive damages, were also accomodatedin the high risk area (HRA). On the other hand, one of thebiggest warehouses and the significant part of the KattaliIndustrial Area which is situated beside the coastal area andincurred a partial damage in the cyclone because of itscomparatively distant location from the coast line of the city,was accomodated in the risk area(RA). Besides this, the KalurghatIndustrial Area has been indentified in the low lying area (LLA)which suffered a partial damage in the cyclone with aconsiderable depth of inundation because of its situation in thelow lying area beside the bank of the Karnaphuli river.
The risk zone extends from the coast line (sea coast or riverbank) to an inland limit upto which surge water can reach. Thehigh risk area includes a strip of land within the risk zone. Itextends from the coast line upto a limit where the depth of stormsurge inundation may reach one meter. The one meter depthcriterion has been selected based upon the experience narratedby the survivors during the past storm surge inundation. It wasreported that an adult could force his/her way through water aslong as the depth of water remained below waist height. So adepth of one meter, which is near to the height of the waist ofan average adult, has been selected as the criterion fordelineation of high risk area (MCSP, 1994). The elevationdifference map of Chittagong city area (Hoque, 1991) has beentaken into account as a base map regarding the delineation ofvulnerable ares such as risk and high risk area in the city.During the 1991 cyclone (which is considered as the mostdevastating one in the history of the country), the maximum surgeheight recorded was 8-10 meters (JRC, 1991) above the mean sealevel (MSL).The level or' surge inundation has been determined by simplysubtracting the land elevation from the maximum surge height(elevation) at different locations of the coastal area. Comparingthe land levels of Chittagong city area and the maximum surgeheight during the previous cyclones, it is evident that, landlevel upto 9.10 meters (above MSL) situated within a distance ofone kilometer from the coast line experience a surge inundationof around 0.90 meters while the land level of 3.00 meters (above

126MSL) within the same distance suffer storm surge inundation ofaround 7.00 meters (above MSL). Similarly it is evident that,land levels of 9.10 meters and 2.4 meters (above MSL) situatedat a distance of 2 kilometers from the coast line experiencearound 0.4 meter and 7.10 meter high storm surge inundationrespectively. Land levels of 9.10 meters and 3.00 meters (aboveMSL) situated at a distance of 3 kilometers from the coast linesuffer no surge and 6.00 meters high surge inundationrespectively. Moreover land level of 3.6 meters (above MSL) ata distance of 4 kilometers, land level of 4.4 meters (above MSL)at a distance of 5 kilometers and land level upto 6.00 meters(above MSL) at a distance of 6 kilometers from the abovementioned coast line experience around 4.9 meters, 3.6 meters and1.5 meters high storm surge inundation respectively.
Besides this, on the basis .ofthis comparison a major part of thecity is supposed to experience surge inundation which cover thewhole southwester city area extended upto the Dhaka-Chittagonghighway. It also reveals from the study that a significant partof the city apparently come under HRA with more than 1.00 meterhigh surge inundation which ends in a narrow strip of landindicating RA bordering the Dhaka-Chittagong highway with lessthan 1.00 meter high surge inundation.
But due to the presence of coastal embankment as well as coastalrail truck and other physical barriers and obstructions along thecoastal belt, the impact of storm surge was reduced to a greatextent resulting a very different practical scenario during theprevious great disastrous cyclones including the 1991 cyclone andstorm surge disaster in the city.
To assess the justification of this information regarding thelevels of surge inundation at different parts of the disaster hitareas, the researcher visited the study area, especially thevulnerable areas of the city several times and interviewed thesurvivors of the 1991 cyclone from different locations toestablish bold margins demarcating the risk areas in thecity.It was informed that the coastal rail track linking Chittagongport and Dhaka-Chittagong rail line acted as the embankmentduring the 1991 cyclone disaster (after the coastal embankment)

127
to protect the eastern part of the rail track from the severestorm surge impacts. During the cyclone the western part of thecoastal rail track suffered a severe surge inundation of around3.0 - 7.6 meters while the eastern. part extended upto the 'PortConnecting Road' experienced a surge inundation of less than 1.00meter. Therefore, the total coastal region bordering the Portconnecting road has been delineated as the risk zone (RZ) thecoastal strip bordering the coastal rail line has been identifiedas the high risk area (HRA) and the remaining city area upto PortConnecting road as risk area (RA),(Figure-4.l0). To compare thevulnerable areas in the city, 'Chittagong city Corporation' riskarea map as well as 'delineation of risk zones' (Hoque, 1991) fordifferent return periods have been incorporated in this regard.Besides this a detailed land-use survey has also been includedin this delineation to provide adequate supporting informationregarding disaster vulnerability of the study area.
Regarding the delineation of the high risk and risk area in thecity. strong reference lines have been considered; these are forexample, the rail track linking Chittagong Port and the Portconnecting road respectively which played an important role inresisting the effects of surge in the adjacent settlements during1991 cyclone and storm surge.
4.4 Land Use PatternThe land use pattern of the city area is somehow remarkablebecause of the geographical location of the city and hertopography. The hilly terrain on the north, The Bay of Bengalon the west and the Karnaphuli river along the south - easternperiphery have a great influence on the land use pattern of thecity. The individual acti vities forming the total land usepattern of the city can be identified as, planned residential,unplanned residential, commercial, industrial, agricultural,hilly area, tide area, mixed use area and unclassified area(Figure-4.11 ).
The 'cultivated land' which occupies 27.86% of the urban land foragricultural purposes is situated beside the Karnaphuli river andalong the coastal belt of the city mainly (Table-4.2). These arelow lying agricultural land within the height of 2.80 meters
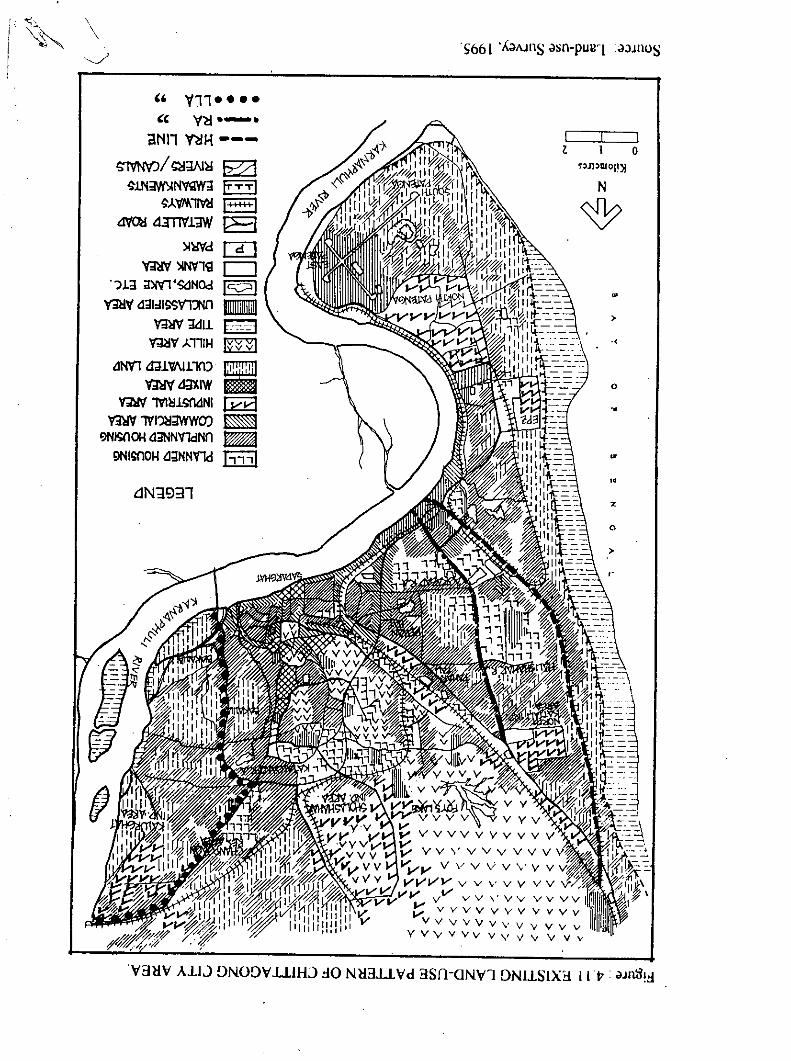
~-"
~'" \\
~
" V11 ••••" V~.-.aNl1~H ••_-
'i:MW/~;JAI~~~.lN;JVI';,lNWW;J ~
~..\.VN.1M1 )111111dVQl a:mv.L:lW EI
~WdmYm'>lNV1g D
.?.L3 ;J)N1'$dNOd lc:;::;:o IV?lJV d31:lI~Vl:ffila
V3W 3411 tcc.J~'I' ..\.111HI*,~~I
dNV1 d31'1A1.L11lJ aYmSIW _
nN 1'I'I~1~NI[i2i3'V3W 1V1~;lWWO'J ~
9NMOH d3NN'I1dNn _
9NISflOH a;INN'fleI ]",1£:IN];):!l
.5661 .A;)AJIlSdsn-pugcl :dJJIlOS
I I IZ I 0
1')Il)UlOH)I
N
~
~
>
.,
o
~
~
"z
o
>
: dJllll!.1
129
above the mean sea level (MSL) and 35.95% of the cultivated landwhich is situated along the coastal region of the cityexperienced a severe disaster impact in the 1991 cyclone. Around42.13% of this land use category remain vulnerable to naturaldisasters in the city (Table 4.3). Due to the rapid growth ofurban population causing tremendous rise in land price (in thecity) has directed new unplanned developments toward low lyingagricultural land.

130
Table 4.2 : Different land use categories (showingrisk and risk free area) in the city.
Source: Land Use survey, 1995.
Land-use HRA RA Vulner- Low Risk Total(Acres) (Acres) able lying free Area
area areas Area (Acres)(acres) (Acres) (Acres)
Planned 139.00 525.12 664.12 - 1297.33 1961.45Residential (0.35%) (1.33%) (1.68%) (3.29) (4.97%)
unplanned 2471.10 1235.55 3706.65 1420.88 5251. 09 10378.62Residential (6.26%) (3.13%) (9.38) (3.60%) (13.30%) (26.29%)
Commercial 185.33 247.11 432.44 123.55 432.44 988.43(0.46%) (0.62%) (1.09%) (0.31%) (1.09%) (2.50%)
Industrial 1266.44 370.66 1637.10 370.66 1235.55 3243.31(3.21%) (0.94%) (4.15%) (0.94%) (3.13%) (8.21%)
Cultivated 3953.76 679.55 4633.31 1668.00 4696.09 10996.40Land (10.01%) (1.72%) (11.74%) (4.22%) (11.89%) (27.86%)
Hilly Area" - - - - 5930.64 5930.64(15.02%) (15.02%)
Tide Area 2347.49 - 2347.49 247.11 12594.60-(5.95%) (5.95%) (0.62%) (6.57%)
Unclassi- 1019.33 308.89 1328.22 15.44 556.00 1899.66fied area (2.58%) (0.78%) (3.36%) (0.04%) (1.41%) (4.81%)
Mixed Area - - - - 556.00 555.99(1.41%) (1.41%)
Others 185.33 247.11 432.44 123.55 370.66 926.65(0.45%) (0.62%) (1.09%) (0.31%) (0.94%) (2.35%)
Total 11567.78 3613.99 15181.77 3969.19 20324.79 39475.75(29.30%) (9.15%) (38.46%) (10.05) (51.49%) (100.0%)

131
Table 4.3: Percentage of Individual Land-use in Different RiskAreas.
.
Landuse HRA RA Vulner- Low Riskable lying free TotalArea area Area Area
Planned 7.09 26.77 33.86 - 66.14 100.0Residential (1.20) (14.53) (4.37) (6.38)
Unplanned 23.81 11.90 35.71 13.69 50.59 100.0Residential (21.36) (34.19) (24.41) (35.80) (25.83)
Commercial 18.75 25.00 43.75 12.50 43.75 100.0(1.60) (6.84) (2.85) (3.11) (2.13 )
Industrial 39.05 11.43 50.48 11.43 38.09 100.0(10.95) (10.26) (10.78) (9.34) (6.08)
Cultivated 35.95 6.18 42.13 15.17 42.70 100.0Land (34.18) (18.80) (30.52) (42.02) (23.10)
.Hilly Area - - - - 100.0 100.0(29.18)
Tide Area 90.47 - 90.47 9.52 100.0-(20.29) (15.46) (6.22 )
Unclassi- 53.66 16.26 69.92 0.81 29.27 100.0fied area (8.81) (8.54) (8.75) (0.39) (2.73)
Mixed Area - - - - 100.0 100.0(2.73)
Others 20.00 26.67 46.67 13.33 40.00 100.0(1.60) (6.84) (2.85) (3.11) (1.82)
TOTAL: 100.0 100.0 100.0 100.0 100.0 100.0
Source: Land Use survey, 1995.Note : (figure) represents column percentage.
.;". :, ,-'
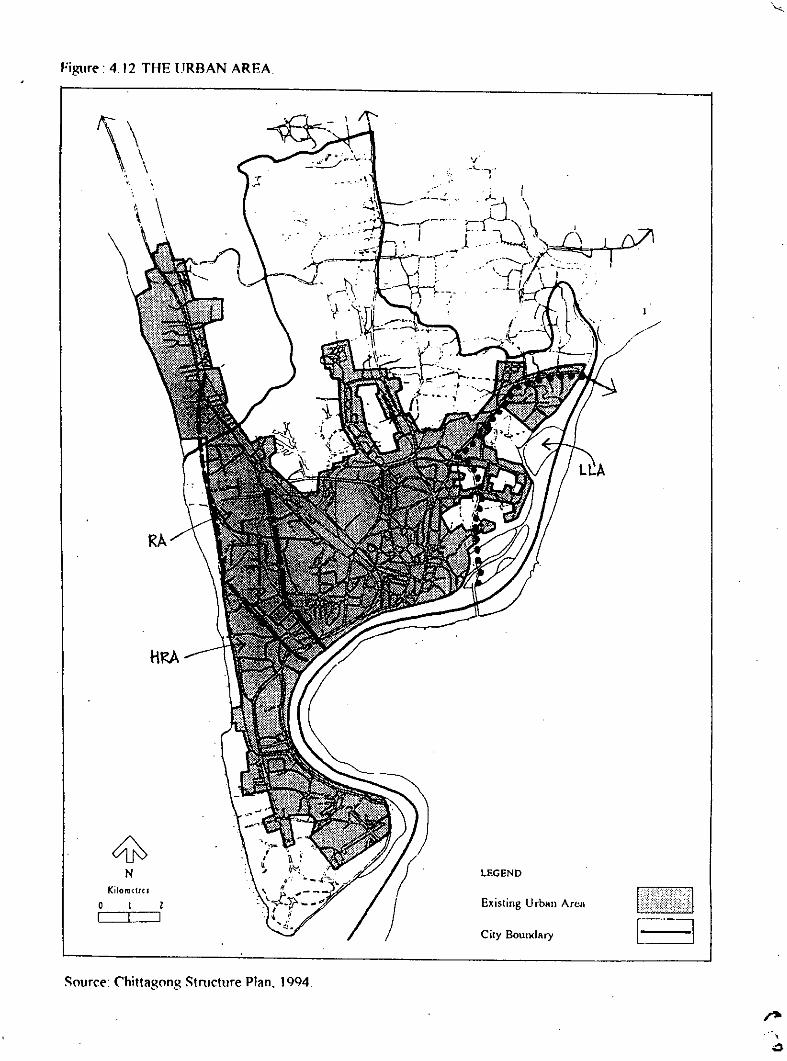
Figure: 4.12 THE URBAN AREA
\
RA
Kilonl(lru
oI
.-:-f!:,,>~~'~..-..."\'
LEGEND
Existing Urbltll Arcil
City Boundary
Source: Chitlagong Stn,cture Plan, 1994.
.,
133The 'unplanned residential' land use which contains 26.29% of thecity area is significant as the biggest unplanned developmenthaphazardly distributed throughout the whole city. A considerableportion i.e. 35.71% of this land use remain vulnerable to thenatural disasters (cyclones and storm surges) of which 23.81%is situated in the high risk area (HRA) and 11.90% in the riskarea (RA). This unplanned residential areas situated along therisk areas of the city experienced a huge loss of life andproperty during the 1991 cyclone and storm surge. The high riskarea which is 2.4-3.0 meters high above the mean sea level (MSL)encourages unplanned developments by low income people increasingdisaster vulnerability of the urban land because of theprevailing cheaper land price in this area(Figure-4.13).
The 'hilly area' occupies 15.02% of the land available in thecity. The north western part of the city is mostly hilly and ismore than 15.00 meters high above the mean sea level (MSL). Thishuge hilly terrain still remains unused except the locations ofsome unplanned housing developments and Foy's lake recreationalfacility in the whole region. Besides this, there exist a goodnumbers of hills within the central city area which are occupiedby various kinds of public and private developments. Thesedevelopments can be classified as public housing, Court building,government offices, hospitals, and private residentialbuildings. Some of these establishments for example, chittagongCourt Building, CRB, D.C.'s Hill, Chittagong Circuit House etc.are the significant structures and can be considered as theimportant land marks of the city.There are five industrial locations in the city, these arePatenga industrial area, chittagong Export Processing Zone(CEPZ), North Katta1i industrial area, Kalurghat industrial areaand sho1ashahar industrial area. The industrial activitycomprises 8.21% of the urban land in the city out of which 39.05%of the industrial activity is situated in the high risk area(HRA) and 11.43% in the risk area (RA), i.e. a total of 50.48%of the industrial land use remain vulnerable to natural disasterssuch as cyclones and storm surges. Another 11.43% of theindustrial activity under Kalurghat industrial area is locatedin the low lying areas (LLA) which is 1.8-2.4 meters high abovethe mean sea level (MSL) and was affected by flood due toswelling of tide water in the Karnaphuli river during the 1991

Fi~tllr: 4.11 lOCATION OF SQUATTER SETTLEMENTS IN THE CITY
'r.,'
HRA
e.e
KilQlUtlrCf
o I 2!:--:-.:J=-_:=J
...,-.,
--- HRA LINE.-. RA "•••• , LLA "
• $&OAn~R~t:.\'l~Mwr
Sourer Chitt~gollg Structure PI~n. 1994.
135
cyclone and storm surge. Sholashahar industrial area which islocated in or around the central part of the city is almost saferegarding the impacts of natural disasters. The three industrialareas - Patenga industrial area, Chittagong Export ProcessingZone (CEPZ) and North Kattali industrial area are located in thevulnerable area which contain around half of the total industrialland-use in the city.
Most of the 'tide area' is located along the coastal belt (5.95%)and the remaining part (0.62%) of this land-use is situatedbeside the eastern fringe of the city bordering the Karnaphuliriver. this land use occupy around 6.57% of the total urban landuse in the city. The wide range of tide area (90.47%) along thePatenga beach facilitate the recreational activities for theurban people in the city. On the other hand, the eastern tidearea (9.52%) along the bank of the Karnaphuli river is being usedas grazing field for domestic cattle.
The 'planned residential' areas located at the different partsof the city such as, Nasirabad Housing Society, PanchlaishResidential Area, Halishahar Housing Estate, ChandgaonResidential Area, Agrabad Residential Area etc. are provided bythe Chittagong Development Authority (CDA) mainly. Besides these,there are staff housing for various public agencies such asBangladesh Railway (BR), Chittagong Port Authority (CPA),Bangladesh police, Public Works Department (PWD), ChittagongDevelopment Authority (CDA), Bangladesh Chemical Industriescorporation (BCIC), Bangladesh Steel and Engineering Corporation(BSEC), including other small housing schemes for differentgovernment and semi-government departments. The total plannedresidential land use contains 4.97% of the urban land in the cityand 7.09% of this land use is situated in the high risk area(HRA)and 26.77% in the risk area (RA). In total.33.86% of theplanned residential land use which exists beside the coastal areais vulnerable to cyclones and storm surges and the remaining66.14% of this land use is almost safely located in the cityarea. In Chittagong a significant portion of this land-use isoccupied by Bangladesh Railway (BR) housing for officers andother employees.
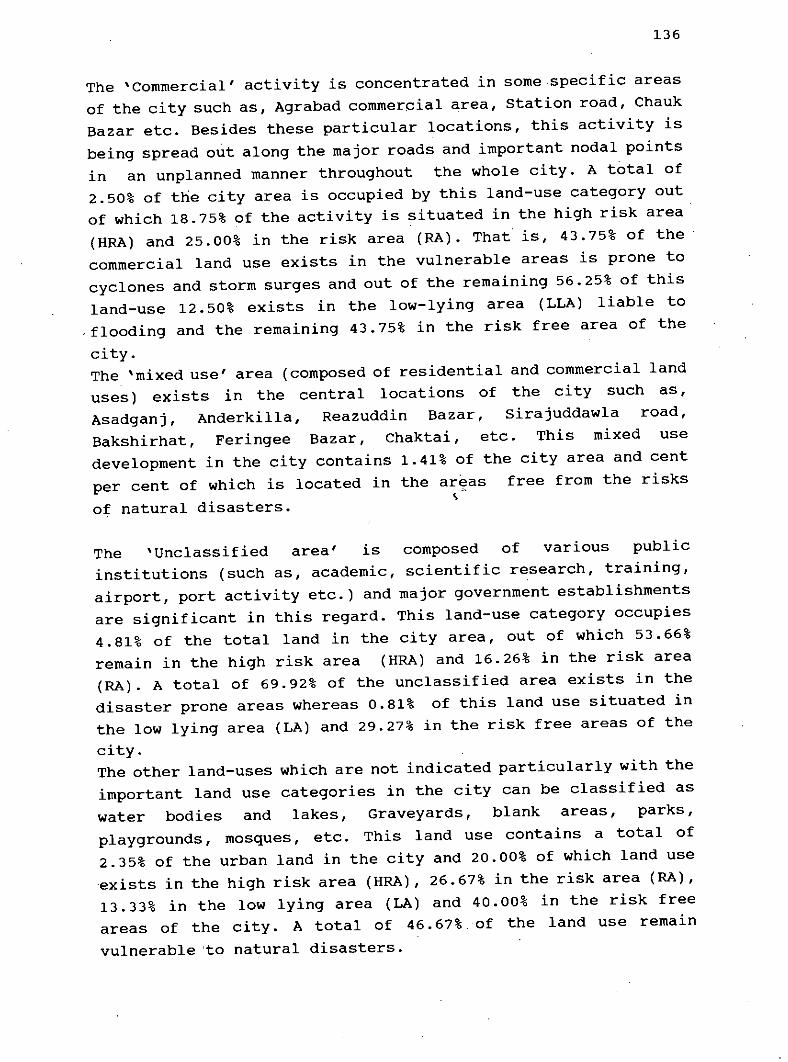
136
The 'Commercial' activity is concentrated in some specific areasof the city such as, Agrabad commercial area, station road, ChaukBazar etc. Besides these particular locations, this activity isbeing spread out along the major roads and important nodal pointsin an unplanned manner throughout the whole city. A total of2.50% of the city area is occupied by this land-use category outof which 18.75% of the activity is situated in the high risk area(HRA) and 25.00% in the risk area (RA). That" is, 43.75% of thecommercial land use exists in the vulnerable areas is prone tocyclones and storm surges and out of the remaining 56.25% of thisland-use 12.50% exists in the low-lying area (LLA) liable to
.flooding and the remaining 43.75% in the risk free area of thecity.The 'mixed use' area (composed of residential and commercial landuses) exists in the central locations of the city such as,Asadganj, Anderkilla, Reazuddin Bazar, sirajuddawla road,Bakshirhat, Feringee Bazar, Chaktai, etc. This mixed usedevelopment in the city contains 1.41% of the city area and centper cent of which is located in the ar~as free from the risks
\of natural disasters.
The 'Unclassified area' is composed of various publicinstitutions (such as, academic, scientific research, training,airport, port activity etc.) and major government establishmentsare significant in this regard. This land-use category occupies4.81% of the total land in the city area, out of which 53.66%remain in the high risk area (HRA) and 16.26% in the risk area(RA). A total of 69.92% of the unclassified area exists in thedisaster prone areas whereas 0.81% of this land use situated inthe low lying area (LA) and 29.27% in the risk free areas of thecity.The other land-uses which are not indicated particularly with theimportant land use categories in the city can be classified aswater bodies and lakes, Graveyards, blank areas, parks,playgrounds, mosques, etc. This land use contains a total of2.35% of the urban land in the city and 20.00% of which land useexists in the high risk area (HRA) , 26.67% in the risk area (RA),13.33% in the low lying area (LA) and 40.00% in the risk freeareas of the city. A total of 46.67% of the land use remainvulnerable 'to natural disasters.

137
4.S Major Public Establishments in the Study Area
Most of the public establishments located in the city includedifferent kinds of government offices, academic and scientificinstitutions, hospitals, court building, sea port, air port,warehouses, industrial activities, police stations, markets andshopping centers, railway stations, banks etc. The publicestablishments located in and around the central part of the citywere almost safe during the 1991 cyclone and storm surge whichcan be regarded as one of the severe most natural disasters inthe history of Bangladesh. But the public establishments situatedalong the coastal region of the port city, although they are afew in number experienced a heavy disaster damage during theApril cyclone of 1991. The public establishments located in thehigh risk and risk areas of the city include various types ofactivities such as, air port and port activities, public sectorheavy industries, oil refineries, steel mill, cement factory,dockyards, dry dock, warehouses and other offices andinstitutions; The industrial activities mainly belong todi(ferent sector corporations for example, Bangladesh steel andEngineering Corporation (BSEC), Bangladesh Chemical Industriescorporation (BCIC), Bangladesh Shipping corporation (BSC) etc.incurred a heavy loss of national property. Besides these,government warehouses and offices situated in the risk area arealso prone to natural disasters and suffered a severe damageduring 'the 1991 cyclone and storm surge. Another significantaspect regarding the location of the Patenga Airport and thePatenga industrial area is that, both the important and sensitivefunctions are located at a close proximity to the Bay of Bengal,within the height of only 2.4-3.0 meters above the mean sealevel (MSL). This situation has contributed the disastervulnerability of the land to a great extent. Moreover after thenatural disaster is over, when all the communication media aredisrupted, normally air ways play a vital role in the postdisaster relief and rehabilitation operations and for the samereason the airport could have been safely located in the citywhich is prone to frequent natural disasters like cyclones andstorm surges almost every year.
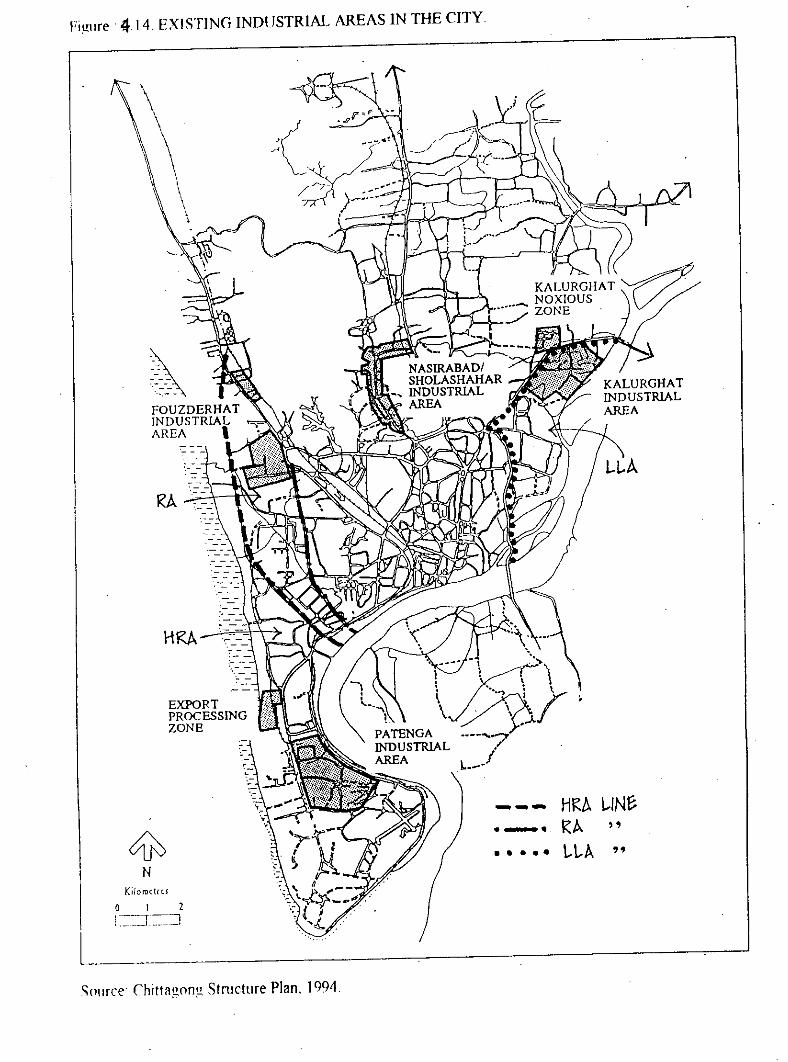
Fii!ure .414. EXISTING INDUSTRIAL AREAS IN THE CITY
EXPORTPROCESSINGZONE
\~.~~?\
RA
HRA
1 Kjlo~ctru
I r_:=i=:::J2L--.
".- -"
'.- -
- - - HRb. \...IN~._. RA "•••• , \...\...A "
Source ChittaWlOi! Stmcture Plan. 199'1.
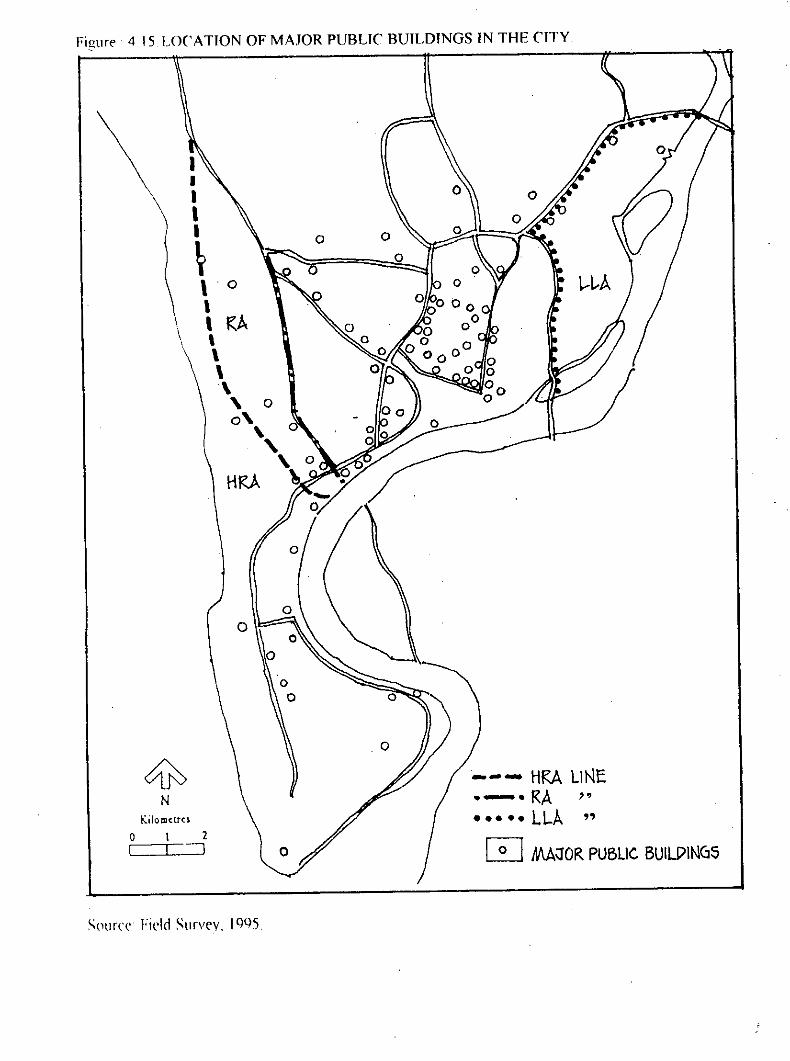
Figur<> 4 IS LOCATION OF MAJOR PUBLIC BUILDINGS IN THE CITY
--- HRA LINE.-. RA , •••••• LLA"
GJ MAJOR PUBLICBUIL~IN(j5
oo
III,I 0 0
~0
\ .0 l--\..A,\ ' RAI. \
\\\, 00',"" 0HRA \
2I --:J
Kilomcuc1
o
o
oI
S(1ur('~ Fi~ld Surv<>y. 1 ClCl5

140
Most of the public establishments are concentrated in the centralpart of the city with a. good numbers of establishmentsdistributed in the risk areas also. The huge investment publicestabl ishments (such as Patenga Airport, Chittagong port, Patengaindustrial area, CEPZ, Central storage department, Customs house,Port hospital etc.) situated in the high risk area (HRA) alongthe south-western coastal belt of the city are liable to massivedisaster damages because of the size and nature of activities.The establishments which are located in the central part of thecity composed of official activities mainly and are not prone tocyclones and storm surges like those located in the high riskarea (HRA) of the city. Besides this, the low lying area (LLA)situated at the north-eastern part of the city contains a fewnumbers of public establishments including some industrialactivities in the Kalurghat industrial area under public sectorcorporations(Figure-4.15, 4.16).
4.6 Commen:ialand BusinessActmties:
The commercial and business activities at Agrabad andChaktai/Sadarghat area were almost safe in the 1991 cyclonebecause of their location in the risk free areas of the city.Although Chaktai/Sadarghat business areas are closely locatedbeside the Karnaphuli river still no severe damages were recordedexcept few separate incidences during the past cyclone owing totheir central location and higher land level in the city area(figure- 4.16,4.17) .. Besides this, the shopping centres andhat/bazar are haphazardly located throughout the whole city whilemost of the shopping centres are concentrated in and around thecentral part of the city and were safe in the 1991 cyclonedisasters. On the other hand, a good numbers of hatjbazars whichare located in the vulnerable areas of the metropolitan citysuffered severe damages in the cyclone and storm surge affectinga large number of population engaged in small activities.

Figllre 4 16 EXISTING COMMERC'lAL AREAS IN THE CITY-----------------------_._-- ----_.--.--. -----------_._--._--
II I I1- _r~~_-__~J
I. El'i rtJl)
Ch"ktnil Sll(llH~h"l
_._-----_._----~---------- ----- - --- .._------------~---_._._----SOIIlCC Chillogong Mctrnpolitnn Mnsler Plo", 1995
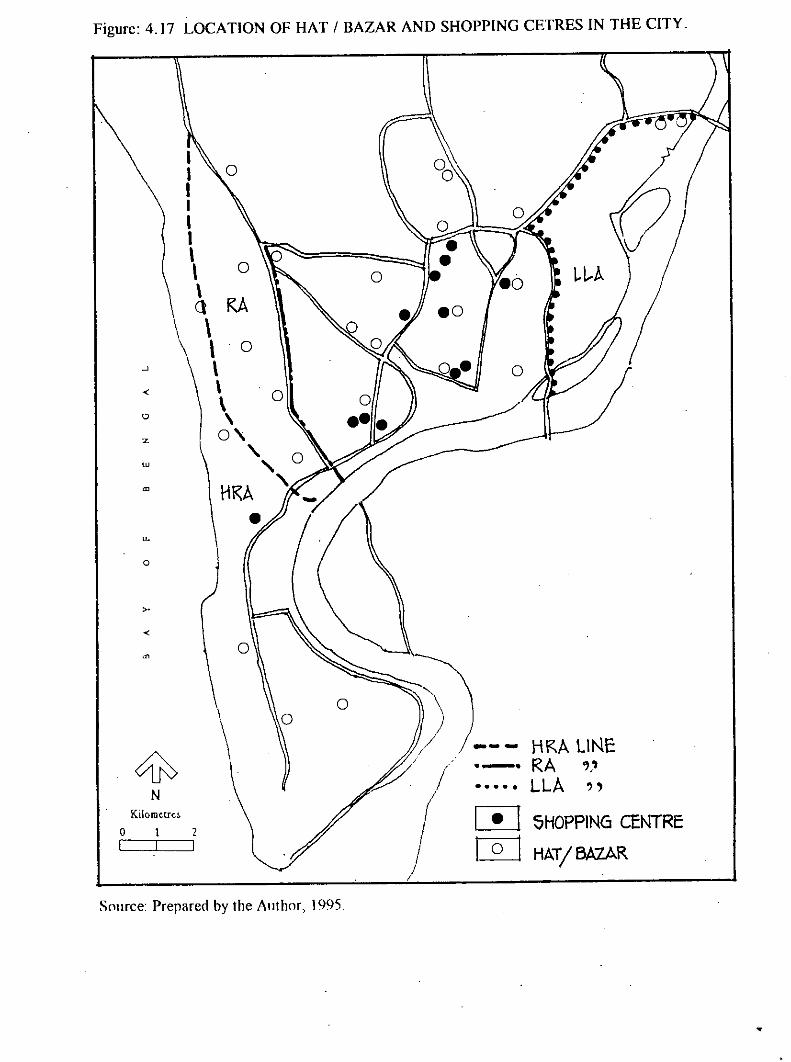
Figure: 4.17 LOCATION OF HAT I BAZAR AND SHOPPING CETRES IN THE CITY.
IIIIII,\ 0 0 l-l.-A,Cl RA\\ .0
-' \< \ 0\0 \z 0'
\. 0w "m HRA "•~
0
,.<
'"0
NKilorncrrc:>
o 2I I
\ oo
/--- HKA uNE._. RA ".'••••• LLA "
[!] SHOPPING CENTREm HAT/BAZAR
SOllfce: Prepared by the Author, 1995

143
4.7 Social Infrastructure in the Study Area
Primary schools, secondary schools and colleges are distributedthroughout the whole city as social infrastructures. Besidesthese, there are other kinds of educational institutions relatedwith the religious (Islamic) education side by side with theconventional education system in chittagong. These institutionsare known as 'Madrashas' and there are. a good numbers ofmadrashas along with schools and colleges. In the disaster proneareas there exist a good numbers of primary schools, secondaryschools and madrashas located in a haphazard manner and out ofwhich around 19 primary schools have already been converted tocyclone shelters after 1991 cyclone and storm surge in thecity(Figure-4.19). The cyclone shelters are mostly located in thehigh risk area (HRA) along the coastal belt and a few of theseare located in the north-eastern low-lying areas (LLA) prone totidal and flash floods inundation. Moreover, in most of the casesthese multi-purpose cyclone shelters failed to play the desiredrole in the community giving rise to unsocial activities and lackof maintenance as,a consequence.
4.8 Physical Infrastructures in the Study AreaAmong the physical infrastructures in the city the road network,rail way, bridges, coastal embankments etc. are remarkable. Theroad network in the city is not so developed to accommodate theincreasing traffic with the rapid growth of urban population inthe chittagong city area. Some times the road network seems tobe inefficient because of the problems occurred due toinsufficient lane numbers and irregular curvatures in the majorroad system guided by the hilly terrain. As a consequence,frequent road accidents and congestions are regular phenomena inthe city(Figure-4.20).
Kalurghat bridge was. the only bridge of its kind to linkchittagong-Cox's Bazar highway which is bypassed by a new steelbridge over Karnaphuli river named 'Shah Amanat' bridge. Thisbridge has contributed in lessening the distance betweenChittagong and Cox's Bazar to a great extent. This steel bridgewas affected severely during 1991 cyclone and was repairedimmediately. At present it is serving the purpose efficiently
.-
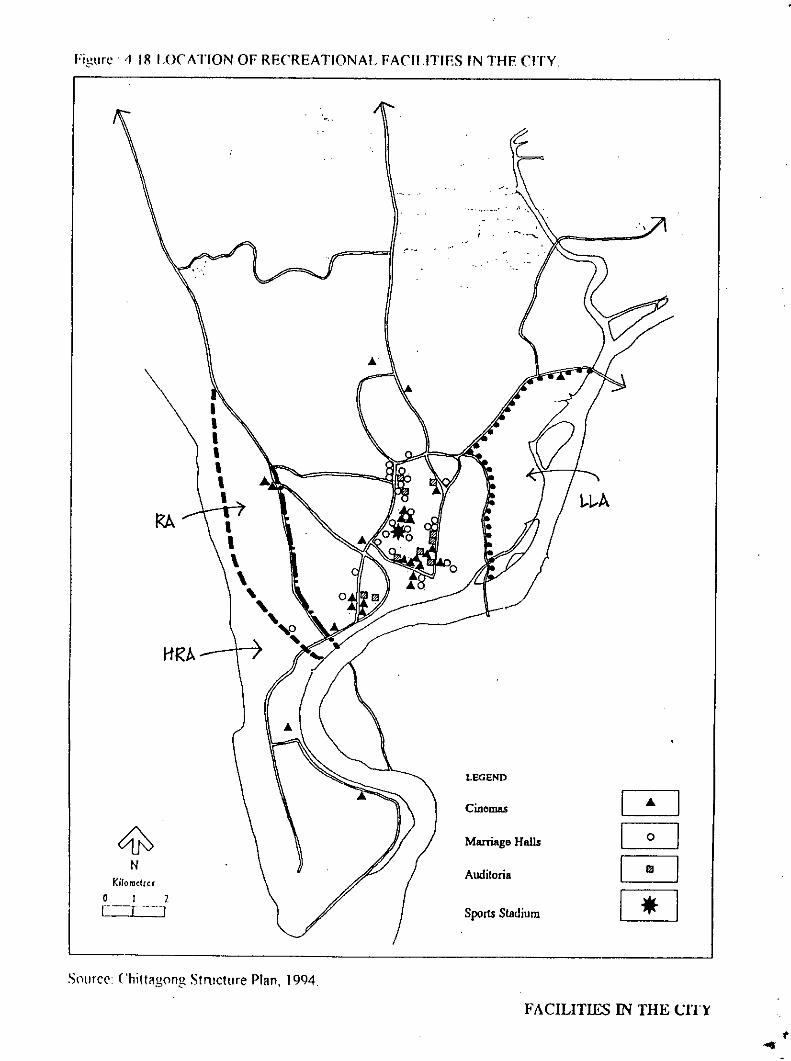
Fi~urc. '1 18 LOCATION OF RECREATIONAL FACILITIES IN THE CITY.
I-tRA
NKilol1ldrc{
o I ZL:-rn.JSource (,hitt~gong Structure PI~n, 1994.
LEGEND
Cinemas
Marriage Halls
Auditari.
Sports Stadium
A Io I
I fa Irn
FACILITIES IN THE ernt
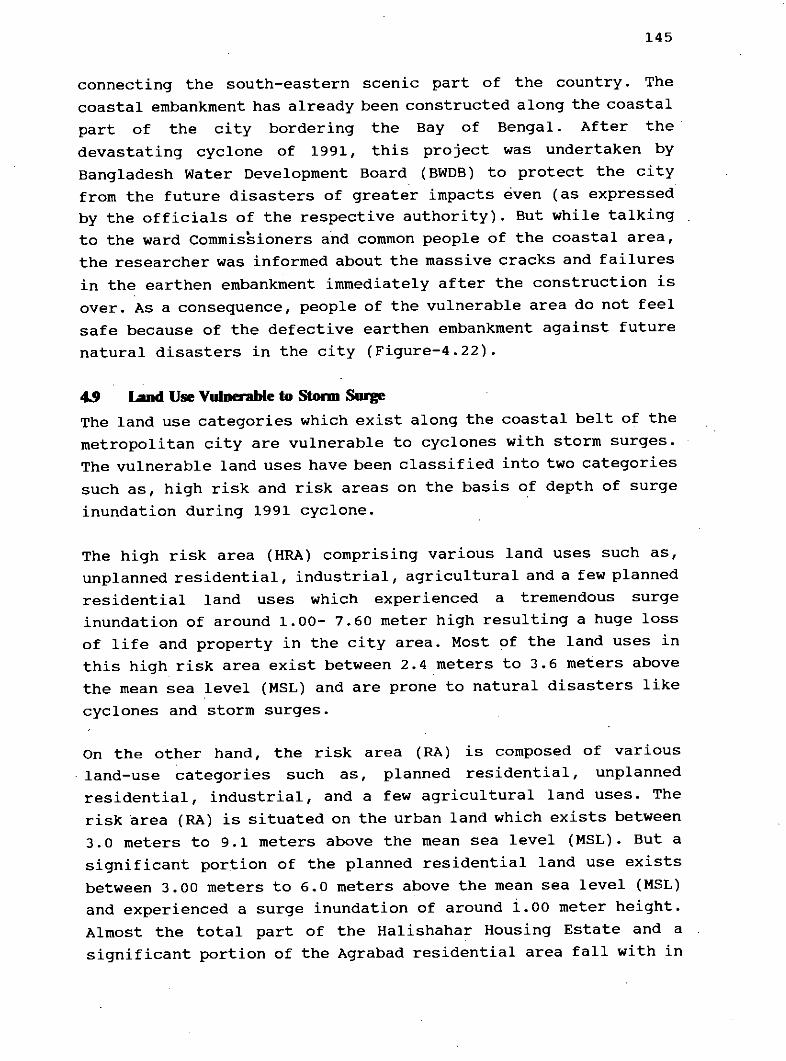
145
connecting the south-eastern scenic part of the country. Thecoastal embankment has already been constructed along the coastalpart of the city bordering the Bay of Bengal. After the.devastating cyclone of 1991, this project was undertaken byBangladesh Water Development Board (BWDB) to protect the cityfrom the future disasters of greater impacts even (as expressedby the officials of the respective authority). But while talkingto the ward Commissioners and common people of the coastal area,the researcher was informed about the massive cracks and failuresin the earthen embankment immediately after the construction isover. As a consequence, people of the vulnerable area do not feelsafe because of the defective earthen embankment against futurenatural disasters in the city (Figure-4.22).
4.9 Land Use Vulnerable to Storm SurgeThe land use categories which exist along the coastal belt of themetropolitan city are vulnerable to cyclones with storm surges.The vulnerable land uses have been classified into two categoriessuch as, high risk and risk areas on the basis of depth of surgeinundation during 1991 cyclone.
The high risk area (HRA) comprising various land uses such as,unplanned residential, industrial, agricu1 tural and a few plannedresidential land uses which experienced a tremendous surgeinundation of around 1.00- 7.60 meter high resulting a huge lossof life and property in the city area. Most of the land uses inthis high risk area exist between 2.4 meters to 3.6 meters abovethe mean sea level (MSL) and are prone to natural disasters likecyclones and storm surges.
On the other hand, the risk area (RA) is composed of variousland-use categories such as, planned residential, unplannedresidential, industrial, and a few agricultural land uses. Therisk area (RA) is situated on the urban land which exists between3.0 meters to 9.1 meters above the mean sea level (MSL). But asignificant portion of the planned residential land use existsbetween 3.00 meters to 6.0 meters above the mean sea level (MSL)and experienced a surge inundation of around i.oO meter height.Almost the total part of the Halishahar Housing Estate and asignificant portion of the Agrabad residential area fall with in
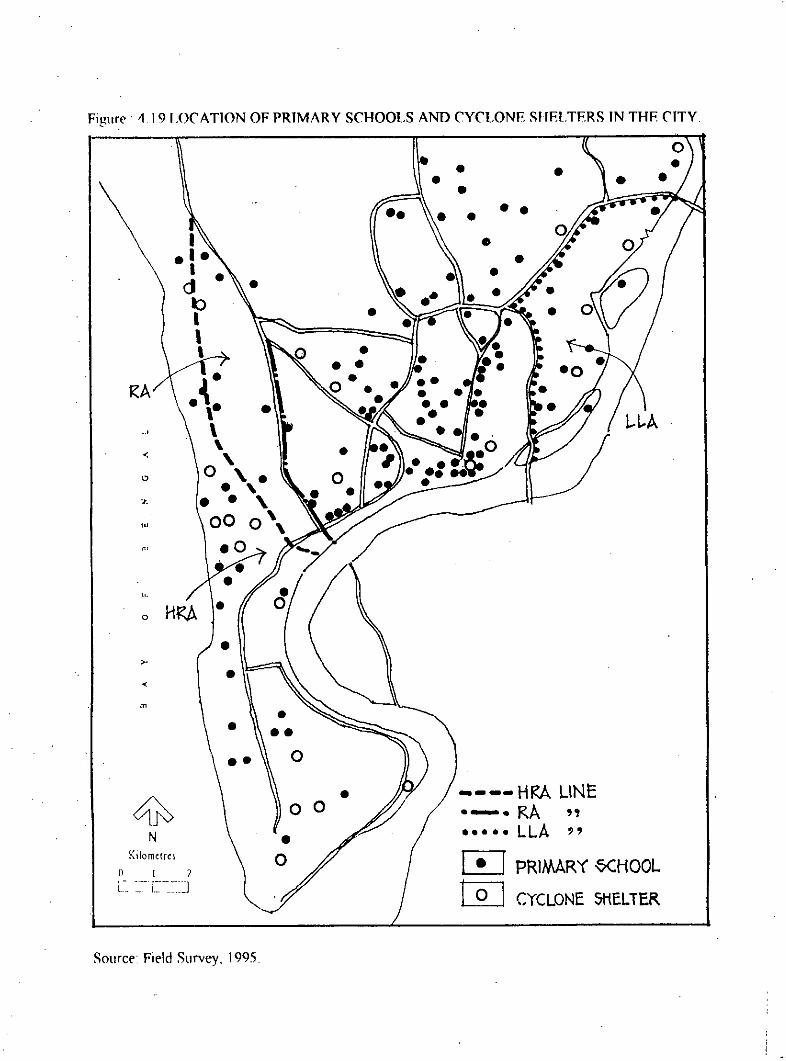
Figure . ~ 19 I,ocATION OF PRIMARY SCHOOLS AND CYCLONE SHELTERS IN THE CITY .
•• ••
---- HRA LINE.-. RA .,••••• LLA"
[!] PRIMARY OCHOOLill CYCLONE ~IiELTER
••
•
••• ••.- 0
•0 0
•0
I.1.I •dtoI,,
-'
",
<
'"
"
RA
Kilomc!ro
o I 1l.:. - [- :J
Source Field Survey, 1995.
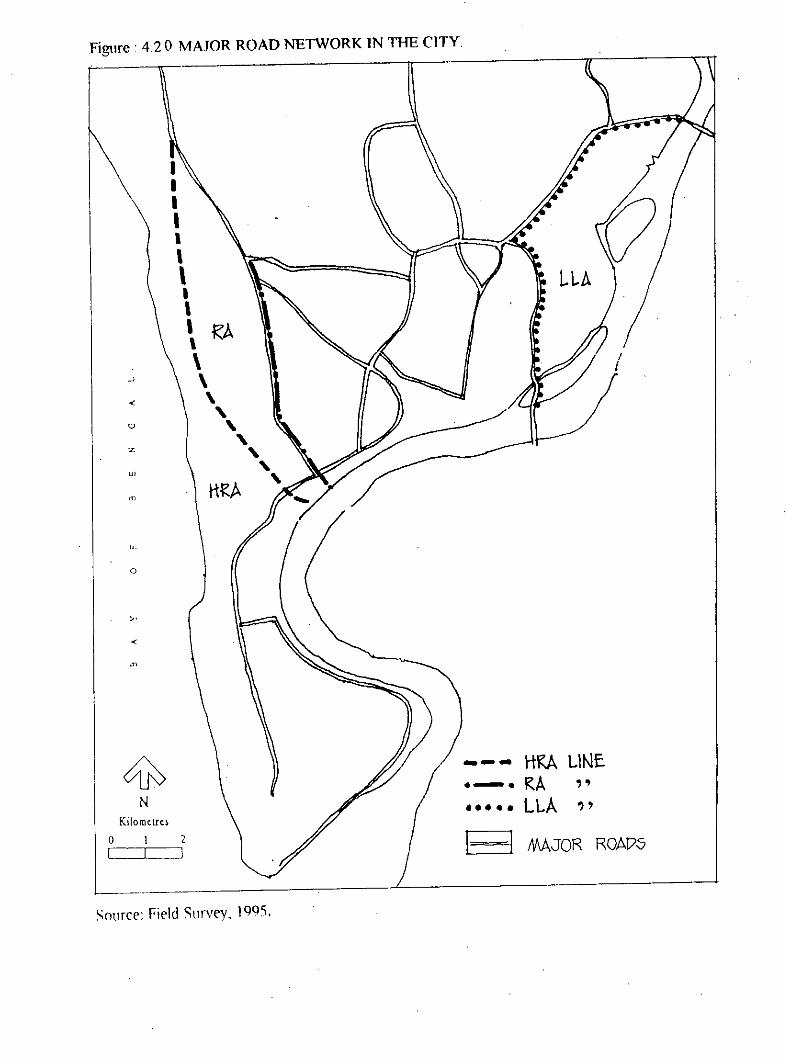
1 I MAJOR ROA\7~
--- HRA LINE.-. RA "••••• LLA ?'N
•n
o
".
,.
III,,,\ L\..AI,'RA\\
~ \" \,Q ,,z ,"'
,H~A ,
m
Kilometrc~o I 1C=-c=J
Figure. 4.20 MAJOR ROAD NETWORK TNTHE CITY
Sourer: I'irld Survry. 1995.
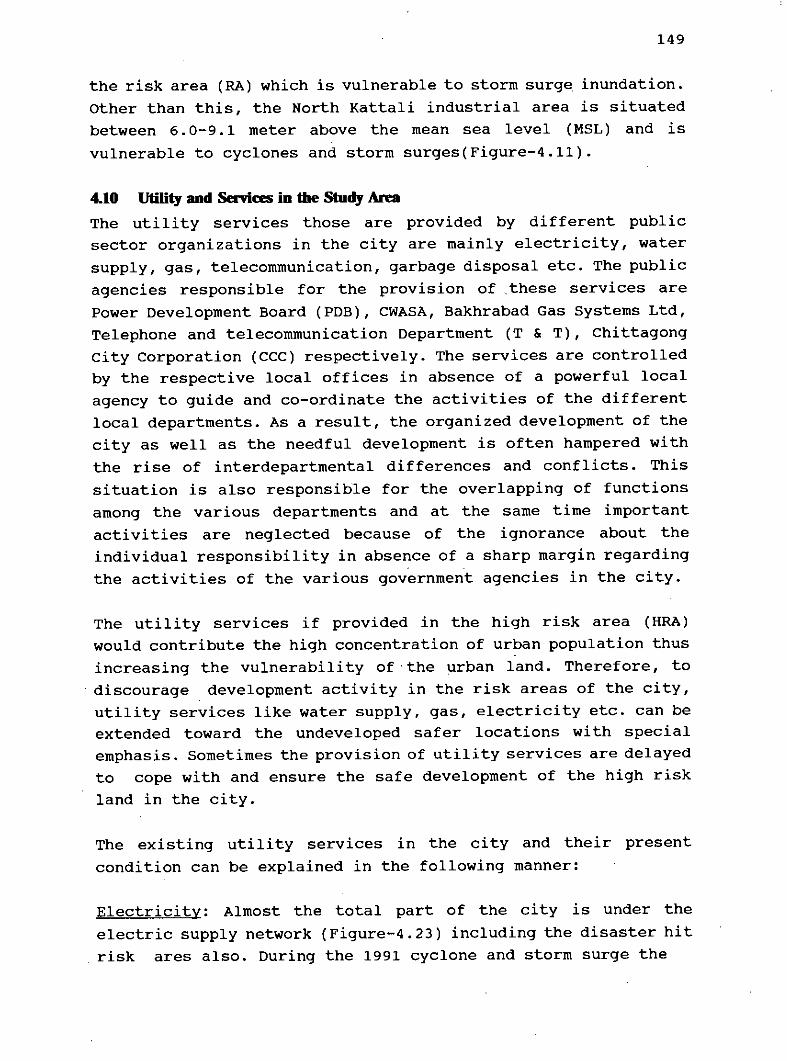
149
the risk area (RA) which is vulnerable to storm surge inundation.other than this, the North Kattali industrial area is situatedbetween 6.0-9.1 meter above the mean sea level (MSL) and isvulnerable to cyclones and storm surges(Figure-4.11).
4.10 Utility and Senices in the Study AreaThe utility services those are provided by different publicsector organizations in the city are mainly electricity, watersupply, gas, telecommunication, garbage disposal etc. The publicagencies responsible for the provision of ,these services arePower Development Board (PDB), CWASA, Bakhrabad Gas Systems Ltd,Telephone and telecommunication Department (T & T), chittagongcity Corporation (CCC) respectively. The services are controlledby the respective local offices in absence of a powerful localagency to guide and co-ordinate the activities of the differentlocal departments. As a result, the organized development of thecity as well as the needful development is often hampered withthe rise of interdepartmental differences and conflicts. Thissituation is also responsible for the overlapping of functionsamong the various departments and at the same time importantactivities are neglected because of the ignorance about theindividual responsibility in absence of a sharp margin regardingthe activities of the various government agencies in the city.
The utility services if provided in the high risk area (HRA)would contribute the high concentration of urban population thusincreasing the vulnerability of ,the urban land. Therefore, to
'discourage development activity in the risk areas of the city,utility services like water supply, gas, electricity etc. can beextended toward the undeveloped safer locations with specialemphasis. Sometimes the provision of utility services are delayedto cope with and ensure the safe development of the high riskland in the city.
The existing utility services in the city and their presentcondition can be explained in the following manner:
Electricity: Almost the total part of the city is under theelectric supply network (Figure-4.23) including the disaster hitrisk ares also. During the 1991 cyclone and storm surge the
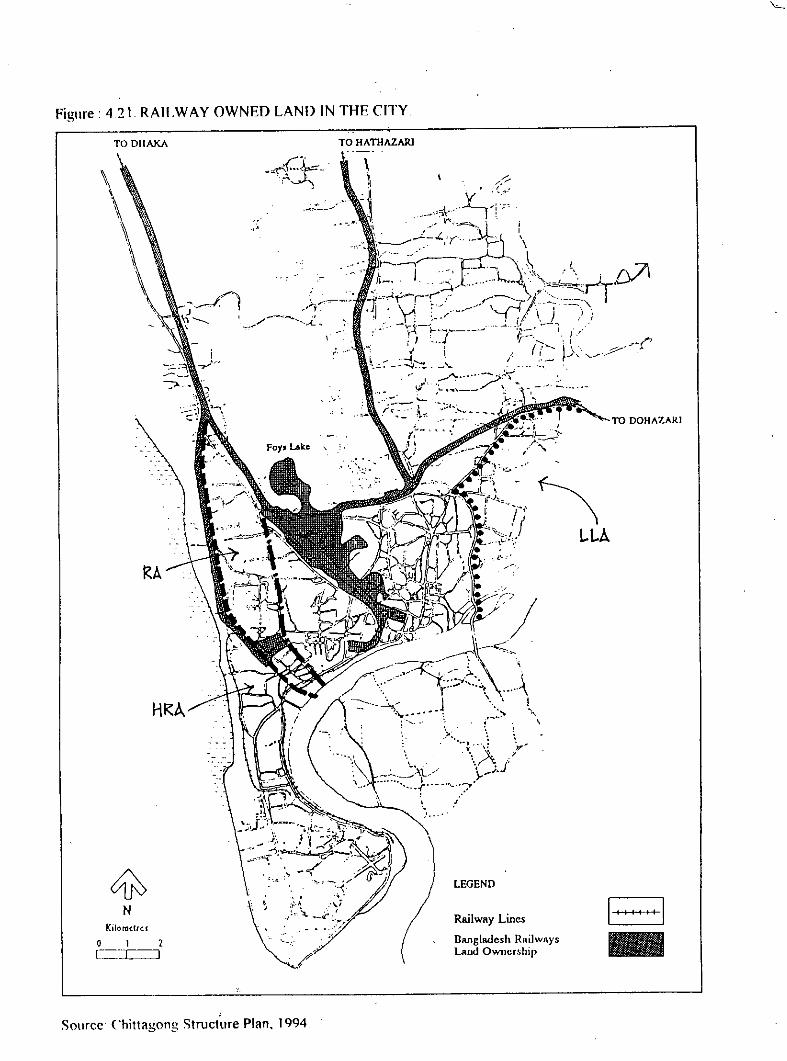
TO DOHAZARI
\ LLA
!,,,
Railway Lines
BlUlgladesh n ')Laud 0 Il~wayswnershlp
LEGEND
HRA
RA
Kilorodrc.s
~ I 2_::C=:J
_' i;;:~~~.r.~ ..
,,1
\,
Figure: 4.21 RAILWAYOWNE ._0 LAN!) INTO DIIAKA THE CITY.
Souree Ch ittaHonn S :'" ",. truettlre Plan, 1994
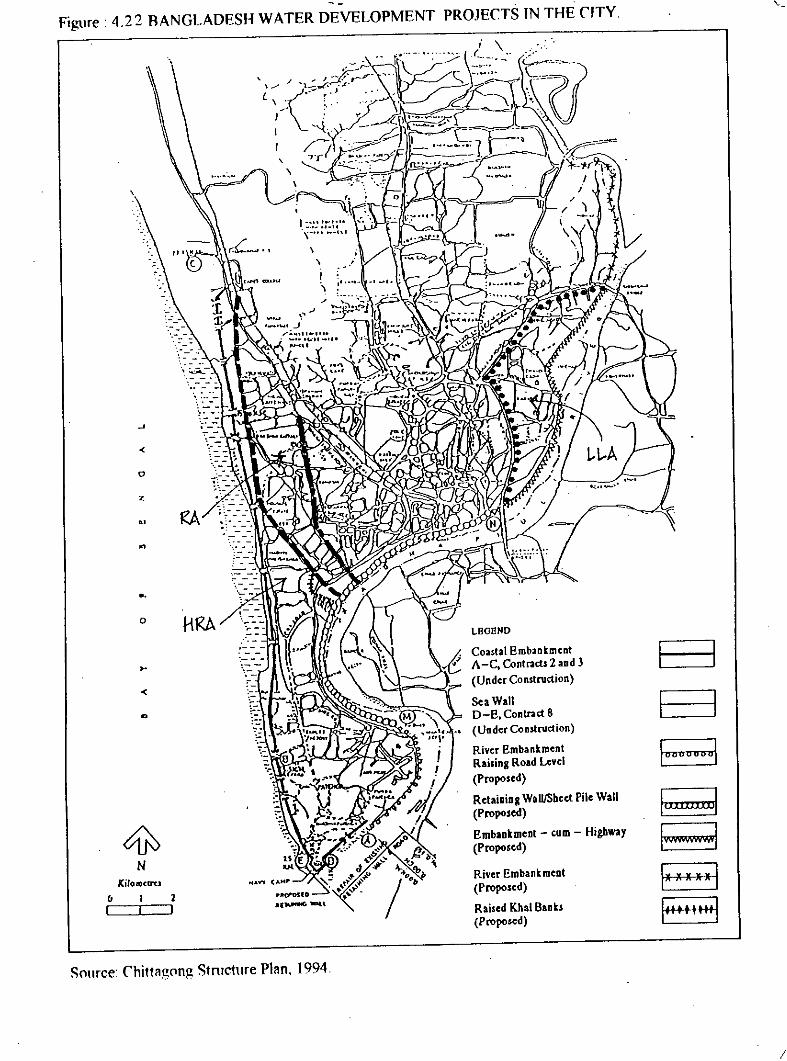
'-
River Embankment(Proposed)
Raised Khal Banks(Proposed)
LBGEND
Coastal EmbankmentA-C, Contracts 2 and 3(Unde, Construction)
Sea WanD-I!, Contract 8(Undcr Construction)
River EmbankmentRaising Road level(Proposed)
Retaining WalllSbeet Pile Wan(Proposed)
Embankment - cum - Highway(Proposed)
/
o.
<
z
o
-'
<
o
Ki.oroccns
o lI I
Figure. 4.22 BANGLADESH WATER DEVELOPMENT PROJECTS IN THE CITY
S()lIfce. C'hittagnng Stnrcture Plan, 1994
!
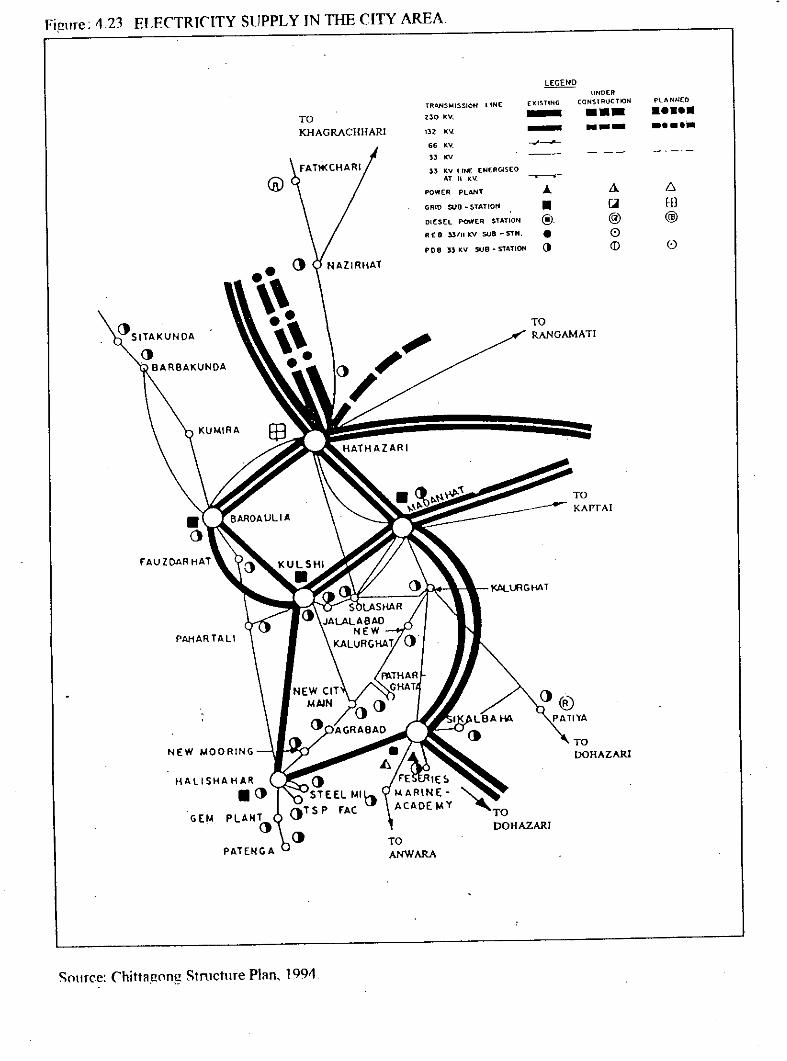
Figme; 1\23 ELECTRICITY SUPPLY TN THE CITY AREA
DOHAZARI
TOKHAGRACHIIARI
• () NAZIRHAT.~~ ..1~.•
PAHARTALI
NEW MOORING
HALlSHAHAA.()
GEM
Somce: Chittagong Stmctllre Plan, 1991\
TRANSMISSION UNE
Z30 KV,
132 l('l
66 KV.
" '"n KV LINE (N(RClS(OAT II KV.
POWER PLANT
GRIO SUB ~ STATION
DIESEL POWER STATION
R E 9 "'" I(V SUB - STN.
P08 "KV SUO. STATtOO
TOANWARA
LEGENDUNOER
[XISTING CONStRUCTION PLANNED- ._. •••••- --- •••••~
~.A- Ll ;:,
• L.j ED@ @ @
• 0() <D (,)
TORANGAMATI
TO---- KAPTAI
TODOHAZARJ

Figure. 4.22 BANGLADESH WATER DEVELOPMENT PROJECTS IN THE ('ITY
L
0 HRA LeGBND,-- - Ej0_- _ Coastal Embankment
). \?--- A-C, Contnd, 2 aDd 3
<.- (UDder COD,tructioD)
Sea Wall E:3'" D-E, Contrad 8
of' (UDder CODstrudioD)
River Embankment~Raising Road level
(Proposed)
RetaiDiDg WalllSbeet Pile Wan g~
(Proposed)
EmbaDkmeDt - eum - Higbway~
N(Proposed)
Kilol'lletresRiver Embankment
~0 2
(Proposed)
I I Raised Kbal BaDks 1""""1(Proposed)
Source Chitta gong Stmcture Plan, 1994
152electricity supply system in the city was severely affected andthe power supply in some parts of the city (including surgeinundated coastal region) was totally disrupted for a long spanof time. During the cyclone a great numbers of RCC electricpoles were badly damaged through out the whole city and weremostly broken down from the middle portion disconnecting thepower supply cables. The wooden and G.I. pipe poles have provedto be somehow effective and safe in this respect.
Water Supply: The Central part of the city is provided with Watersupply from CWASA with partial capability of supplying to theperipheral areas such as, Patenga, Kattali, Rampur and Bakalia.The Water treatment plant is located at Mohra, the deep tube-welland iron removal plat at Chandgaon and two reservoirs at ADC Hilland the other one at Batali Hill. Besides these, there are twobooster stations named Patenga Booster station and Dhaka TrunkRoad Booster station. The total water supply system was almostsafe in the 1991 cyclone, only the booster station functioningwere disrupted because of electric failure. The total watersupply network is underground with the adequate depth of coverand hence safe enough. Besides this, the exposed booster stationsare built on high land, protected by heavy construction are alsofree from the risks of natural disasters (Figure-4.24).
Gas Supply: The whole city area is provided with gas supplysystem through seven high pressure district regulator stationssituated at the western and northern peripheral locations of thecity. Three of these high pressure district regulator stationsare located at the coastal part of the city which are notvulnerable to natural disasters like cyclones and surges (asexpressed by the concerned officials). other than this, the gaspipeline remain under the ground with adequate depth of cover(around 5'-O"and is not prone to natural disasters. During the1991 cyclone this gas supply system in the city was uninterruptedand safe (Figure-4.25).Tele-Communication: The telecommunication system in the cityexperienced severe damages during the 1991 cyclone and stormsurge. The T & T tower at Nandankanan failed and the totaltelecommunication network in the city was disrupted. The failureof the T&T tower made the city disconnected with the remainingparts of the country. Besides this, the telecommunication

Figure. '1.2'1 W to.TER SUPPLY IN THE CITY AREA
". -.
~
.
....::----,-
HRA
NKilOlllctrel
o 2I I
".- -;- -".- -
".- ---<. LEGEND
FuJI Capability ofSupplying Water
Partial Capability
No Capability
Trunk Main
WardBoundary
L__ JL~[N 1
E::::j[._------]---~----_.
Source Chittagong Stmcture Plan. 199'1_
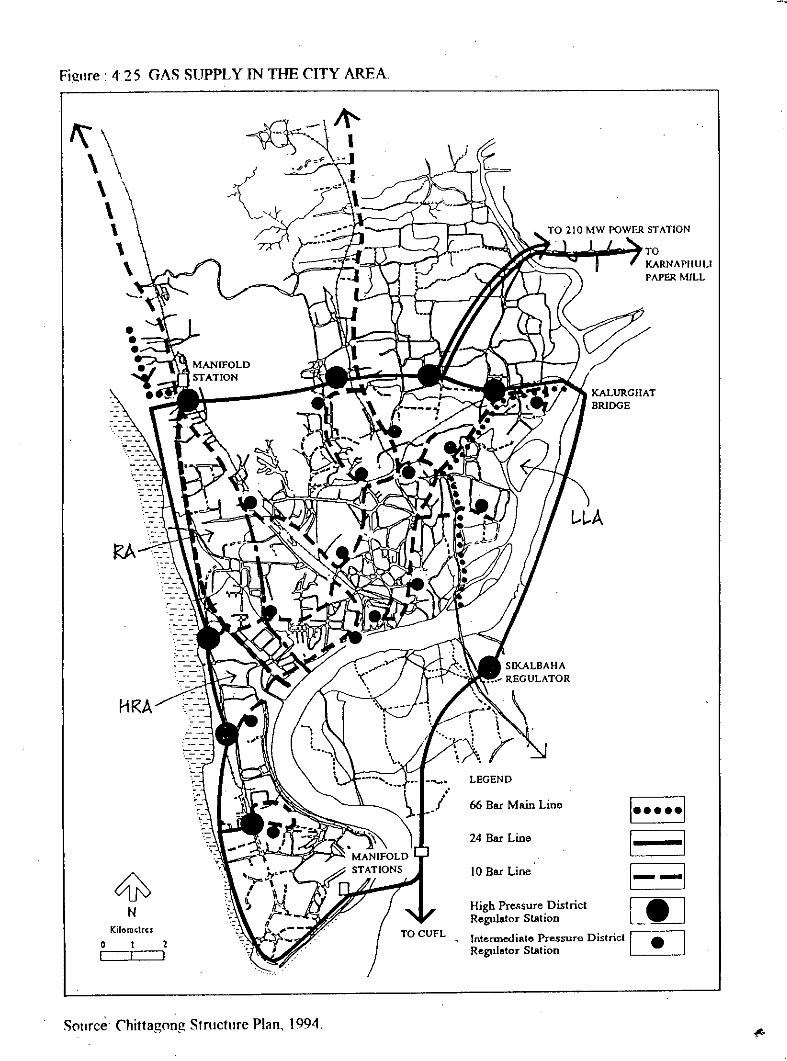
...•.~'
Fi~lre. 425 GAS SUPPLY IN THE CITY AREA.
TOKARNAPIIUUPAPER MILL
1 ••••• 1
I I1--1
~~~I=;:S;~~i~~strictl_LJIntermediate P.ressure District [.ttlRegulator Station ~ ~
LEGEND
24 Bar Line
10 Bar Line
66 Bar Main Line
TOCUFLKilortll;trCJo 2I I
':;-" .
HRA
•••
1\\\ \\\\,\
Source Chitta gong Stmcture Plan, 1994,
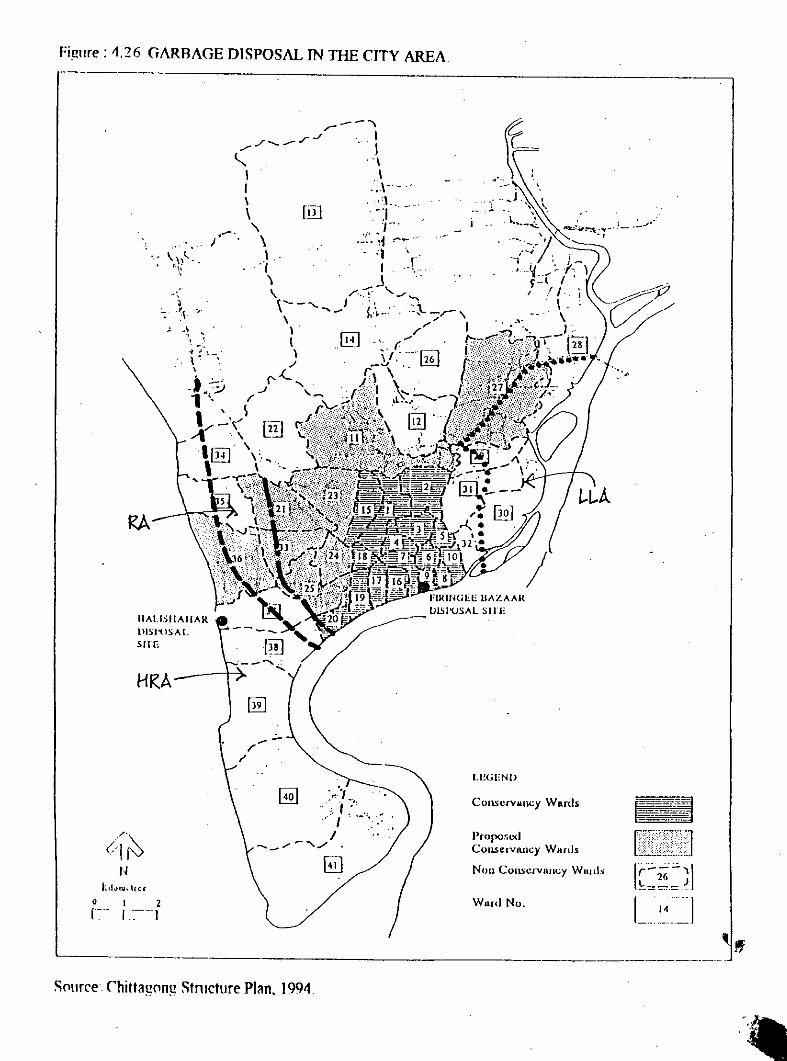
Fi!(ure: 11.26 GARBAGE DISPOSAL IN THE CITY AREA
Pi"opo~odCOllservuucy Wards
Non COllscrvnm:y WUllls
Conscrvu.ncy Wards
1.l!(;ENU
Ward No.
[ill >"/,', ,~'..'/ '--"-J
-.-0""'''-'''/ .
.. " ,,"
~\,'--I-~
--,"
'_'-:"'~.: ....HRA
IIAU.')IIAJlARlHSl'oSALSIrE
o I 2(~-.r:-')
Snurce rhillagnng Stnlcture Plan. 1994, -,.~
155
network, around 95% of which is underground with adequate depthof cover was safe and uninterrupted in the 1991 cyclone.
Garbage Disposal: Chittagong city Corporation (CCC) providessolid waste collection and disposal services among 16 city wardsout of total 41 wards in the city. The 'Wards under the CityCorporation services, are all centrally located and contain highconcentration of urban population (Figure-4.26). Besides this,another 8 wards have already been proposed as 'Conservancy Wards'to receive garbage disposal services from the CCC. These newly'proposed conservancy wards' are mostly centrally located withan increasing rate of population density. There are two dumpingsites in the city located in the ward no. 9 (Firingee Bazar) andward no.37 (Halishahar); the first one is on the bank ofKarnaphuli river and the second one is situated beside thecoastal embankment in the city.
4.11 SummlllJ'
The delineation of the risk areas have been carried out with anintention to establish bold margins for the 'high risk' and 'riskarea' in the city. Accordingly various physical features such asroads, rail roads, canals, topographical features etc. have beentaken into account in this delineation to harmonies the definedlevel of surge inundation for both the risk areas. Ultimately,the coastal rail track linking the Chittagong Port and the Dhaka-Chittagong rail line has been identified as the border line forthe HRA where as, the Port Connecting Road (connecting the Dhaka- Chittagong road and Patenga road) has been delineated as theextreme border line for the RA. The essence of this delineationwith respect to the prominent physical features in the city isthat it would certainly help developing awareness among thecommon people about the disaster vulnerability of the areas proneto frequent natural disasters. Besides this, it will helpensuring adequate simplicity and clarity regarding theactivities of planning and enforcing agencies on the way todisaster mitigation in the study area.
. -.I.__.•••.-•......
II .( -- .
~~~...-:.'e~. - ...11.-~',
i ,...... ' .
- .,..- '.
," .- .• •, .
CHAPTER FIVE
COMMONllY RESPONSE TO DISASTERVOIIIERABILIlY AID ITS MANAIEMENT
. .~ ...-):.- _ ..•..--",..,..._.
CHAPrER FIVE
COMMUNITY RESPONSE TO DISASTER VULNERABIUTY AND ITS MANAGEMENT
5.1 Introduction
In order to develop a clear understanding regarding peoplesresponse about disaster vulnerability of the risk areas and thepotential disaster mitigation measures which could be undertakento reduce the disaster impacts, different communities/groups havebeen incorporated in the questionnaire survey carried out in thevulnerable area of the city. Each of the groups/communities inthe vulnerable area responded in different ways regardingdisaster vulnerability as well as potential disaster mitigationmeasures in the area. This would obviously help in formulatingnecessary planning guidelines for the proper development of thevulnerable area. Besides this, detailed discussion with urbanutility agencies and city development authorities have been madeto acquire understanding about disaster vulnerability of thepublic agencies and their plan to mitigate natural disasters inthe city.
5.2 Reactions of Disaster Affected People in the Vulnerable Area
It is evident from Table 5.1 that around 36.00% of therespondents received cyclone warnings from the radio /TV sourceswhile around 64.00% of the respondents received warnings fromboth radio/TV and CCC men in the HRA before the occurrence of the1991 cyclone in the city. The CCC men were sent to the vulnerablearea of the city to alarm people about the imminent naturaldisaster and to help the evacuation of the inhabitants from thedisaster prone areas. In the HRA of the city major percentage ofthe government employees (42.86%) received cyclone warnings fromthe radio/TV sources whereas major percentage of the fishermen(66.67%) group received warning from both radio/TV and CCC.
.>
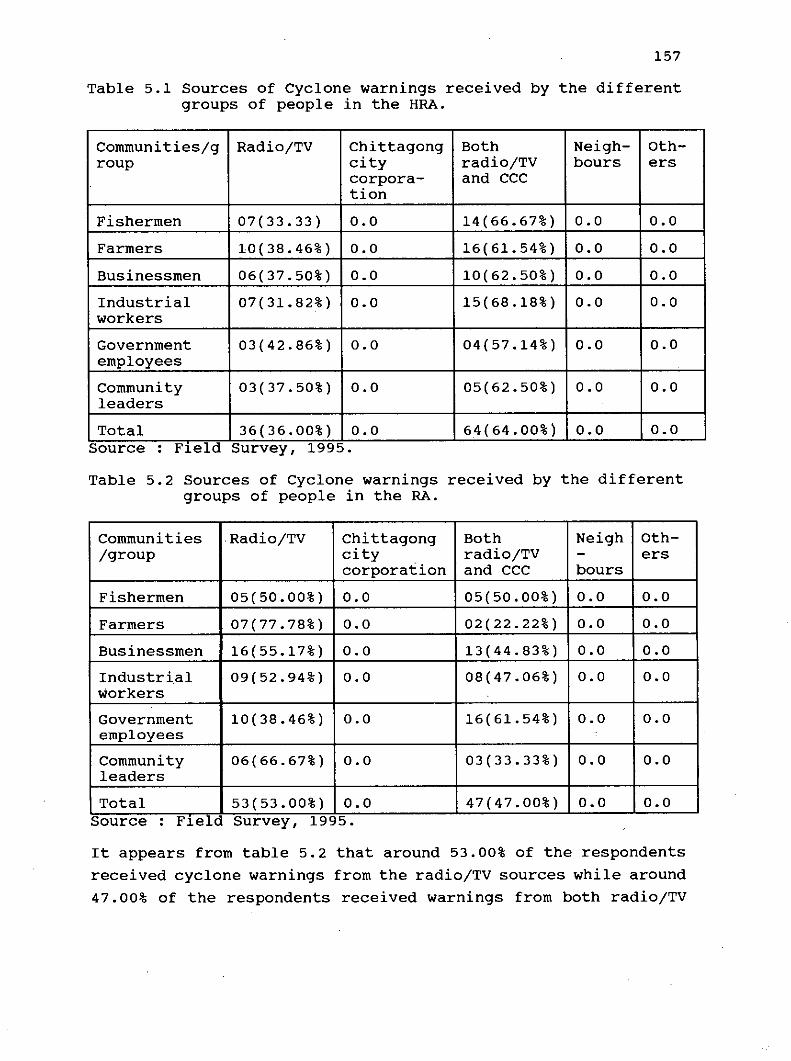
157
Table 5.1 Sources of Cyclone warnings received by the differentgroups of people in the HRA.
Communities/g Radio/TV chittagong Both Neigh- oth-roup city radio/TV bours ers
corpora- and CCCtion
Fishermen 07(33.33) 0.0 14(66.67%) 0.0 0.0Farmers 10(38.46%) 0.0 16(61.54%) 0.0 0.0Businessmen 06(37.50%) 0.0 10(62.50%) 0.0 0.0Industrial 07(31.82%) 0.0 15(68.18%) 0.0 0.0workersGovernment 03(42.86%) 0.0 04(57.14%) 0.0 0.0employeesCommunity 03(37.50%) 0.0 05(62.50%) 0.0 0.0leadersTotal 36(36.00%) 0.0 64(64.00%) 0.0 0.0
Source: F1eld Survey, 1995.
Table 5.2 Sources of Cyclone warnings received by the differentgroups of people in the RA .
Communities .Radio/TV Chittagong Both Neigh oth-/group city radio/TV - ers
corporation and CCC boursFishermen 05(50.00%) 0.0 05(50.00%) 0.0 0.0Farmers 07(77.78%) 0.0 02(22.22%) 0.0 0.0Businessmen 16(55.17%) 0.0 13(44.83%) 0.0 0.0Industri.al 09(52.94%) 0.0 08(47.06%) 0.0 0.0workersGovernment 10(38.46%) 0.0 16(61.54%) 0.0 0.0employees .
Community 06(66.67%) 0.0 03(33.33%) 0.0 0.0leadersTotal 53(53.00%) 0.0 47(47.00%) 0.0 0.0
Source: F1eld Survey, 1995.
It appears from table 5.2 that around 53.00% of the respondentsreceived cyclone warnings from the radio/TV sources while around47.00% of the respondents received warnings from both radio/TV
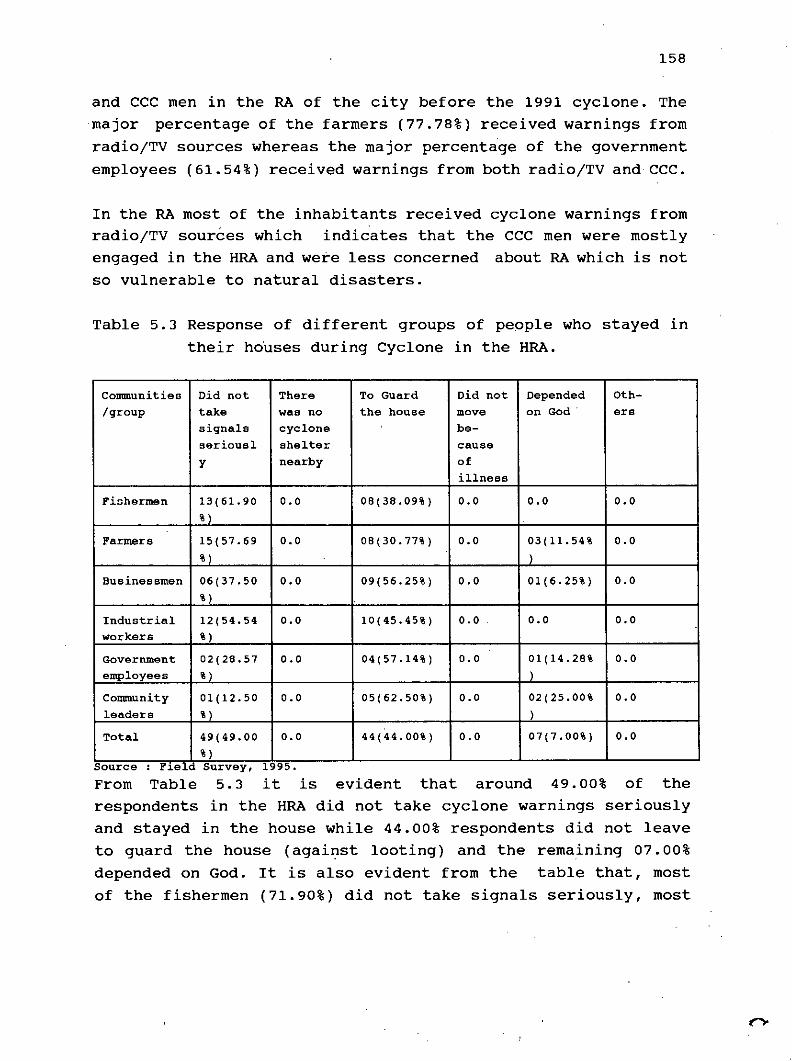
158
and CCC men in the RA of the city before the 1991 cyclone. Themajor percentage of the farmers (77.78%) received warnings fromradio/TV sources whereas the major percentage of the governmentemployees (61.54%) received warnings from both radio/TV and CCC.
In the RA most of the inhabitants received cyclone warnings fromradio/TV sources which indicates that the CCC men were mostlyengaged in the HRA and were less concerned about RA which is notso vulnerable to natural disasters.
Table 5.3 Response of different groups of people who stayed intheir houses during Cyclone in the HRA.
Communities Did not There To Guard Did not Depended Oth-/group take was no the house move on God. era
signals cyclone be-seriousl shelter cause
y nearby ofillness
Fishermen 13(61.90 0.0 08(38.09%) 0.0 0.0 0.0%)
Farmers 15(57.69 0.0 08(30.77%) 0.0 03(11.54% 0.0%) )
Businessmen 06(37.50 0.0 09(56.25%) 0.0 01(6.25%) 0.0%)
Industrial 12(54.54 0.0 10(45.45%) 0.0 0.0 0.0workers %)Government 02(28.57 0.0 04(57.14%) 0.0 01(14.28% 0.0employees % ) )
Community 01(12.50 0.0 05(62.50%) 0.0 02(25.00% 0.0leaders % ) )
Total 49(49.00 0.0 44(44.00%) 0.0 07(7.00%) 0.0%)
Source : F~eld Survey, 1995.From Table 5.3 it is evident that around 49.00% of therespondents in the HRA did not take cyclone warnings seriouslyand stayed in the house while 44.00% respondents did not leaveto guard the house (against looting) and the remaining 07.00%depended on God. It is also evident from the table that, mostof the fishermen (71.90%) did not take signals seriously. most
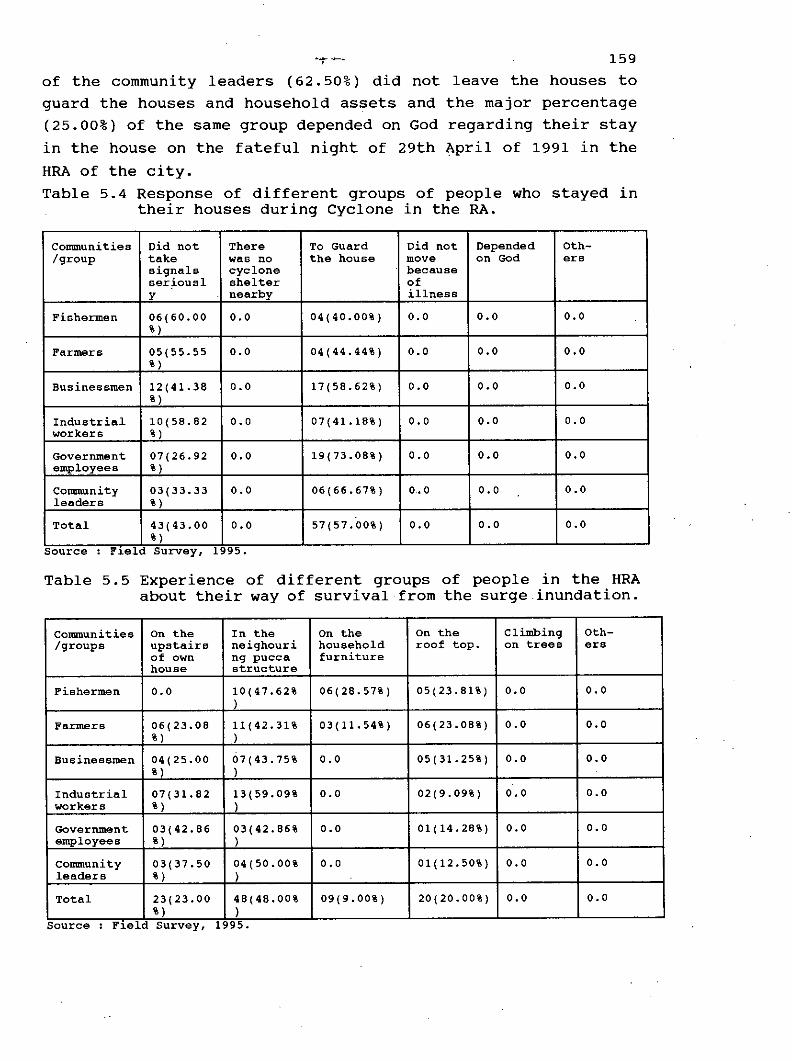
159of the community leaders (62.50%) did not leave the houses toguard the houses and household assets and the major percentage(25.00%) of the same group depended on God regarding their stayin the house on the fateful night of 29th April of 1991 in theHRA of the city.Table 5.4 Response of different groups of people who stayed in
their houses during Cyclone in the RA.
Communities Did not There To Guard Did not Depended Oth-Igroup take was no the house move on God er.
signals cyclone becauseserj.ousl shelter ofy nearby illness
Fishermen 06(60.00 0.0 04(40.00%) 0.0 0.0 0.0%)
Farmers 05(55.55 0.0 04(44.44%) 0.0 0.0 0.0%)
Businessmen 12(41.38 0.0 17(58.62%) 0.0 0.0 0.0%)
Industrial 10(58.82 0.0 07(41.18%) 0.0 0.0 0.0workers % )Government 07(26.92 0.0 19(73.08%) 0.0 0.0 0.0employees %)Community 03(33.33 0.0 06(66.67%) 0.0 0.0 0.0leaders %)Total 43(43.00 0.0 57(57.00%) 0.0 0.0 0.0
%)Source : F~eld Survey, 1995.
Table 5.5 Experience of different groups of people in the HRAabout their way of survival from the surge inundation.
conununities On the In the On the On the Climbing Oth-/gr:oups upstairs neighouri household roof top. on trees er.
of own ng puces. furniturehouse structure
Fishermen 0.0 10(47.62% 06(28.57%) 05(23.81%) 0.0 0.0)
Farmers 06(23.08 11(42.31% 03(11.54%) 06(23.08%) 0.0 0.0%) )
Businessmen 04(25.00 07(43.75% 0.0 05 (31. 25%) 0.0 0.0%) )
Industrial 07(31.82 13(59.09% 0.0 02(9.09%) 0.0 0.0workers %) )
Government 03(42.86 03(42.86% 0.0 01(14.28%) 0.0 0.0employees %) )
Conununity 03(37.50 04(50.00% 0.0 01(12.50%) 0.0 0.0leaders % ) )
Total 23(23.00 48(48.00% 09(9.00%) 20(20.00%) 0.0 0.0%) )
Source F1eld Survey, 1995.
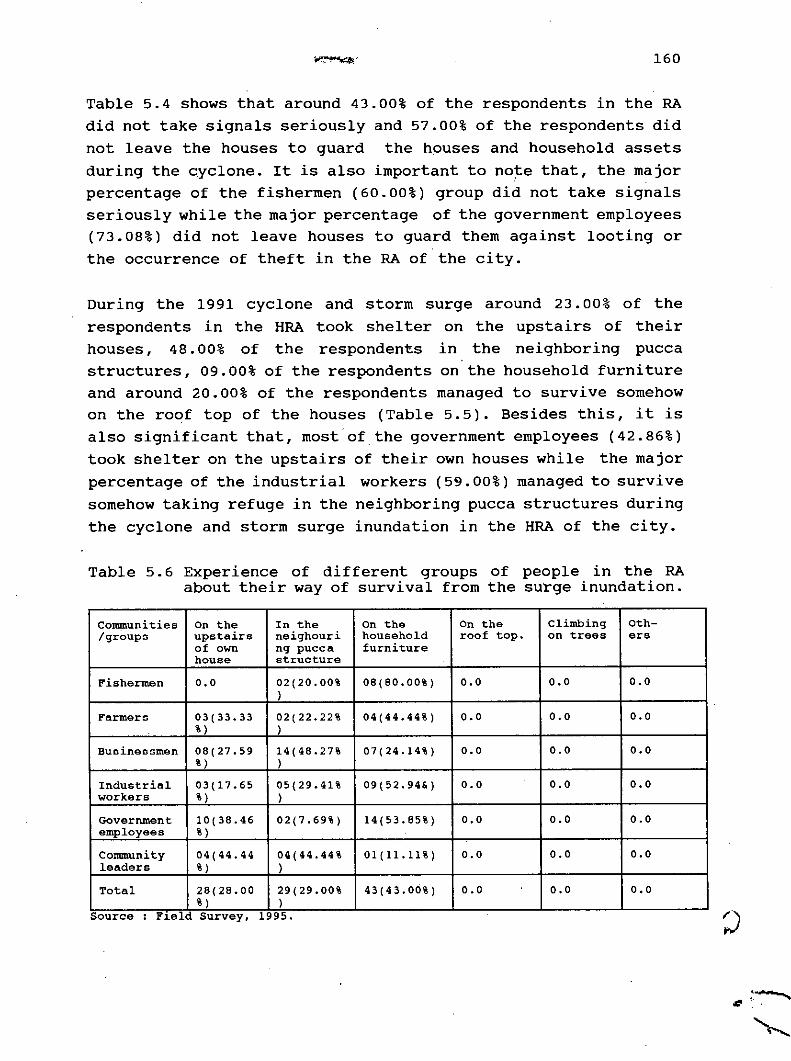
160
Table 5.4 shows that around 43.00% of the respondents in the RAdid not take signals seriously and 57.00% of the respondents didnot leave the houses to guard the houses and household assetsduring the cyclone. It is also important to note that, the majorpercentage of the fishermen (60.00%) group did not take signalsseriously while the major percentage of the government employees(73.08%) did not leave houses to guard them against looting orthe occurrence of theft in the RA of the city.
During the 1991 cyclone and storm surge around 23.00% of therespondents in the HRA took shelter on the upstairs of theirhouses, 48.00% of the responden1::s in the neighboring puccastructures, 09.00% of the respondents on the household furnitureand around 20.00% of the respondents managed to survive somehowon the roof top of the houses (Table 5.5). Besides this, it isalso significant that, most'ofthe government employees (42.86%)took shelter on the upstairs of their own houses while the majorpercentage of the industrial workers (59.00%) managed to survivesomehow taking refuge in the neighboring pucca structures duringthe cyclone and storm surge inundation in the HRA of the city.
Table 5.6 Experience of different groups of people in the RAabout their way of survival from the surge inundation.
Communities On the In the On the On the Climbing oth-Igroups upstairs neighouri household roof top. on trees erG
of own nq pucea furniturehouse structure
Fishermen 0.0 02(20.00% 08(80.00%) 0.0 0.0 0.0)
Farmers 03(33.33 02(22.22% 04(44.44%) 0.0 0.0 0.0%) )
Businessmen 08(27.59 14(48.27% 07(24.14%) 0.0 0.0 0.0% ) )
Industrial 03(17.65 05(29.41% 09(52.94&) 0.0 0.0 0.0workers %) )
Government 10(38.46 02(7.69%) 14(53.85%) 0.0 0.0 0.0employees %)
Community 04(44.44 04(44.44% 01 (11.11%) 0.0 0.0 0.0leaders %) )
Total 28(28.00 29(29.00% 43(43.00%) 0.0 0.0 0.0%) )
Source F1eld Survey, 1995.
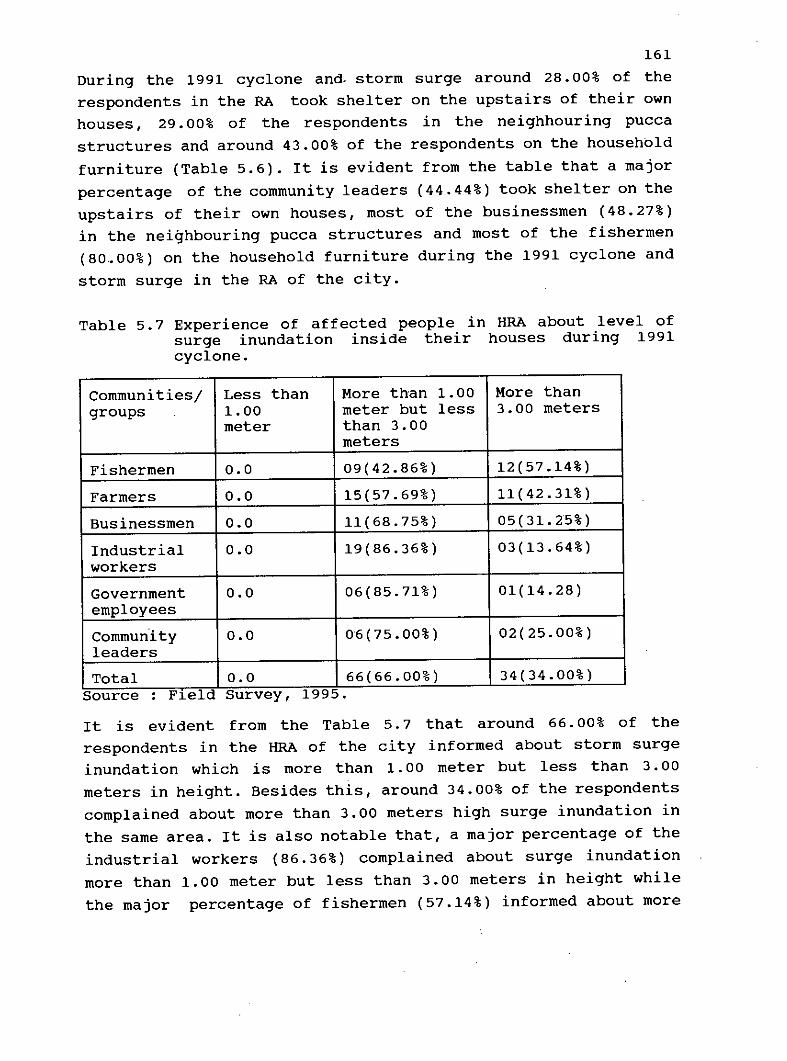
161During the 1991 cyclone and. storm surge around 28.00% of therespondents in the RA took shelter on the upstairs of their ownhouses, 29.00% of the respondents in the neighhouring puccastructures and around 43.00% of the respondents on the householdfurniture (Table 5.6). It is evident from the table that a majorpercentage of the community leaders (44.44%) took shelter on theupstairs of their own houses, most of the businessmen (48.27%)in the neighbouring pucca structures and most of the fishermen(80.•00%) on the household furniture during the 1991 cyclone andstorm surge in the RA of the city.
Table 5.7 Experience of affected people in HRA about level ofsurge inundation inside their houses during 1991cyclone.
Communities/ Less than More than 1.00 More thangroups 1.00 meter but less 3.00 meters
meter than 3.00meters
Fishermen 0.0 09(42.86%) 12(57.14%)Farmers 0.0 15(57.69%) 11(42.31%)Businessmen 0.0 11(68.75%) 05(31.25%)Industrial 0.0 19(86.36%) 03(13.64%)workersGovernment 0.0 06(85.71%) 01(14.28)employeesCommun1ty 0.0 06(75.00%) 02(25.00%)leadersTotal 0.0 66(66.00%) 34(34.00%)
Source : F~eld survey, 1995.It is evident from the Table 5.7 that around 66.00% of therespondents in the HRA of the city informed about storm surgeinundation which is more than 1.00 meter but less than 3.00meters in height. Besides this, around 34.00% of the respondentscomplained about more than 3.00 meters high surge inundation inthe same area. It is also notable that, a major percentage of theindustrial workers (86.36%) complained about surge inundationmore than 1.00 meter but less than 3.00 meters in height whilethe major percentage of fishermen (57.14%) informed about more

162than 3.00 meters high surge. Besides this surge height less than1.00 meter is not recorded in the HRA.
Table 5.8 Experience of affected people in HRA about level ofsurge inundation inside their houses during the 1991cyclone.
Communities/grou Less than 1.00 More than 1.00 More than 3.00ps meter meter but less than meters
3.00 metersFishermen 07 (70.00&) 03 (30.00%) 0.0
Farmers 07(77.78%) 02(22.22%) .. 0.0
Businessmen 26(89.65%) 03(10.34%) 0.0
Industrial 16(94.12%) 01(5.88%) 0.0workersGovernment 25(96.15%) 01(3.85%) 0.0employeesconununity 07(77.78%) 02(22.22%) 0.0leadersTotal 88(88.00%) 12(12.00%) 0.0
Source.: F1eld Survey, 1995.Table 5.9 Response of different groups of people in the HRA
about damage caused by the 1991 cyclone.
Communities/ Human House Crop othergroups death damage damage/ property
cattle loss damageFishermen 02(9.52%) 16(76.19%) 0.0 03(14.28%)Farmers 02(7.69%) 14(53.85%) 07~26.92%) 03(11.54%)Businessmen 0.0 09(56.25%) 02(12.50%) 05(31.25%)Industrial 03(13.64%) 116(72.73%) 0.0 03(13.64%)workersGovernment 0.0 05(71.43%) 0.0 02(28.57%)employeesCommunity 0.0 05(62.50%) 01(12.50%) 02(25.00%)leadersTotal 07(7.00%) 65(65.00%) 10(10.00%) 18(18.00%)
Source: F1eld survey, 1995.
It is evident from tablerespondents in the RA of themeter high surge while 12.00%
5.8 that, around 88.00% of thecity informed about less than 1.00of the respondents complained about
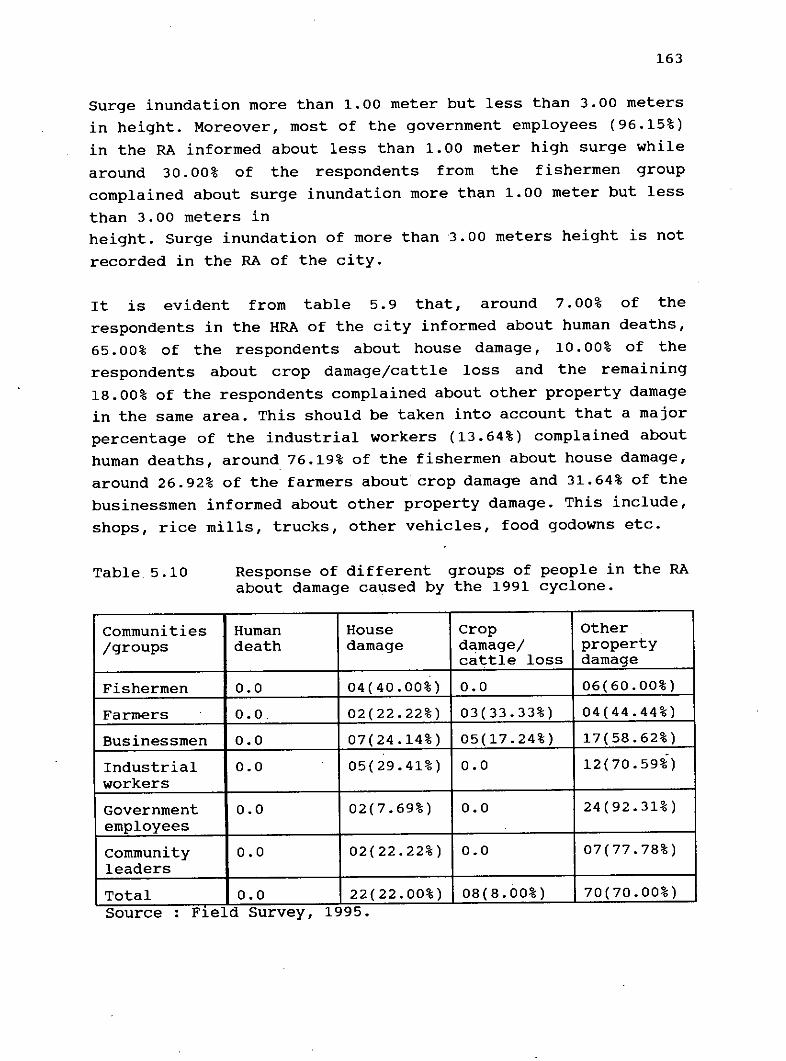
163
Surge inundation more than 1.00 meter but less than 3.00 metersin height. Moreover, most of the government employees (96.15%)in the RA informed about less than 1.00 meter high surge whilearound 30.00% of the respondents from the fishermen groupcomplained about surge inundation more than 1.00 meter but lessthan 3.00 meters inheight. Surge inundation of more than 3.00 meters height is notrecorded in the RA of the city.
It is evident from table 5.9 that, around 7.00% of therespondents in the HRA of the city informed about human deaths,65.00% of the respondents about house damage, 10.00% of therespondents about crop damage/cattle loss and the remaining18.00% of the respondents complained about other property damagein the same area. This should be taken into account that a majorpercentage of the industrial workers (13.64%) complained abouthuman deaths, around 76.19% of the fishermen about house damage,around 26.92% of the farmers about crop damage and 31.64% of thebusinessmen informed about other property damage. This include,shops, rice mills, trucks, other vehicles, food godowns etc.
Table 5.10 Response of different groups of people in the RAabout damage caused by the 1991 cyclone.
Communities Human House Crop Other/groups death damage damage/ property
cattle 1055 damageFishermen 0.0 04(40.00%) 0.0 06(60.00%)Farmers 0.0 02(22.22%) 03(33.33%) 04(44.44%)Businessmen 0.0 07(24.14%) 05(17.24%) 17(58.62%)Industrial 0.0 05(29.41%) 0.0 12(70.59%)workersGovernment 0.0 02(7.69%) 0.0 24(92.31%)employeescommunity 0.0 02(22.22%) 0.0 07(77.78%)leadersTotal 0.0 22(22.00%) 08(8.00%) 70(70.00%)Source F1eld Survey, 1995.
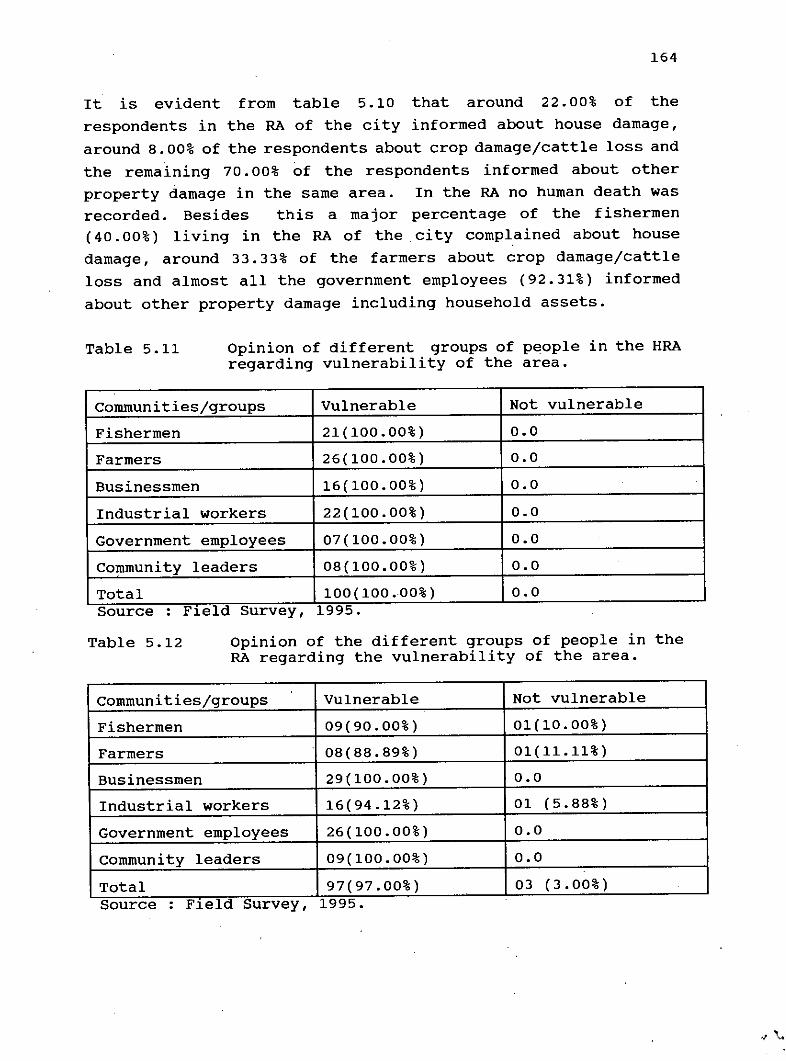
164
It is evident from table 5.10 that around 22.00% of therespondents in the RA of the city informed about house damage,around 8.00% of the respondents about crop damage/cattle loss andthe remaining 70.00% of the respondents informed about otherproperty damage in the same area. In the RA no human death wasrecorded. Besides this a major percentage of the fishermen(40.00%) living in the RA of the city complained about housedamage, around 33.33% of the farmers about crop damage/cattleloss and almost all the government employees (92.31%) informedabout other property damage including household assets.
Table 5.11 Opinion of different groups of people in the HRAregarding vulnerability of the area.
communities/groups Vulnerable Not vulnerableFishermen 21(100.00%) 0.0Farmers 26(100.00%) 0.0Businessmen 16(100.00%) 0.0Industrial workers 22(100.00%) 0.0Government employees 07(100.00%) 0.0Community leaders 08(100.00%) 0.0Total 100(100.00%) 0.0Source: F1eld Survey, 1995.
Table 5.12 Opinion of the different groups of people in theRA regarding the vulnerability of the area.
Communities/groups Vulnerable Not vulnerableFishermen 09(90.00%) 01(10.00%)Farmers 08(88.89%) 01(11.11%)Businessmen 29(100.00%) 0.0Industrial workers 16(94.12%) 01 (5.88%)Government employees 26(100.00%) 0.0Community leaders 09(100.00%) 0.0Total 97(97.00%) 03 (3.00%) .
Source F1eld Survey, 1995.

165In the HRA of the city cent per cent of the respondents haverealization about the disaster vulnerability of the area (Table5.11). Different groups of people in the area such as,fishermen, farmers, businessmen, industrial workers, governmentemployees and community leaders were interviewed and cent percent of the group members responded in favour of disastervulnerability of the area regarding future natural disaster inthe city. It is notable that, none of the respondents in the HRAresponded against the vulnerability of the area.
In the RA of the city around 97.00% of the respondents haveadequate realization regarding disaster vulnerability of the areaand the remaining 3.00% of the respondents have lack ofrealization about the vulnerability of the RA. It is significantthat, these people residing close to the RA margin in the citydid not suffer surge inundation in the 1991 cyclone because ofhigher land levels. However, cent percent of the respondentunder the different population groups such as businessmen,government employees and community leaders responded in favourof disaster vulnerability of the RA of the city.
Table 5.13 Opinion of different groups of people in the HRAabout their future settlement in the area.
communities/groups To stay in the To settle in thevulnerable area risk free areas
Fishermen . 19(90.48%) 02(9.52%)Farmers 23(88.46%) 03(11.54%)Businessmen 14(87.50%) 02(12.50%)Industrial workers 17(77.27%) 05(22.73%)Government employees 05(71.43%) 02(28.57%)cOIlImunityleaders 07(87.50%) 01(12.50%)Total 85(85.00%) 15(15.00%)Source: Fleld survey, 1995.
It is evident from table 5.13 that, around 85.00% of therespondents in the HRA opined to stay in the same area while15.00% of the respondents opined to settle in the risk free areas
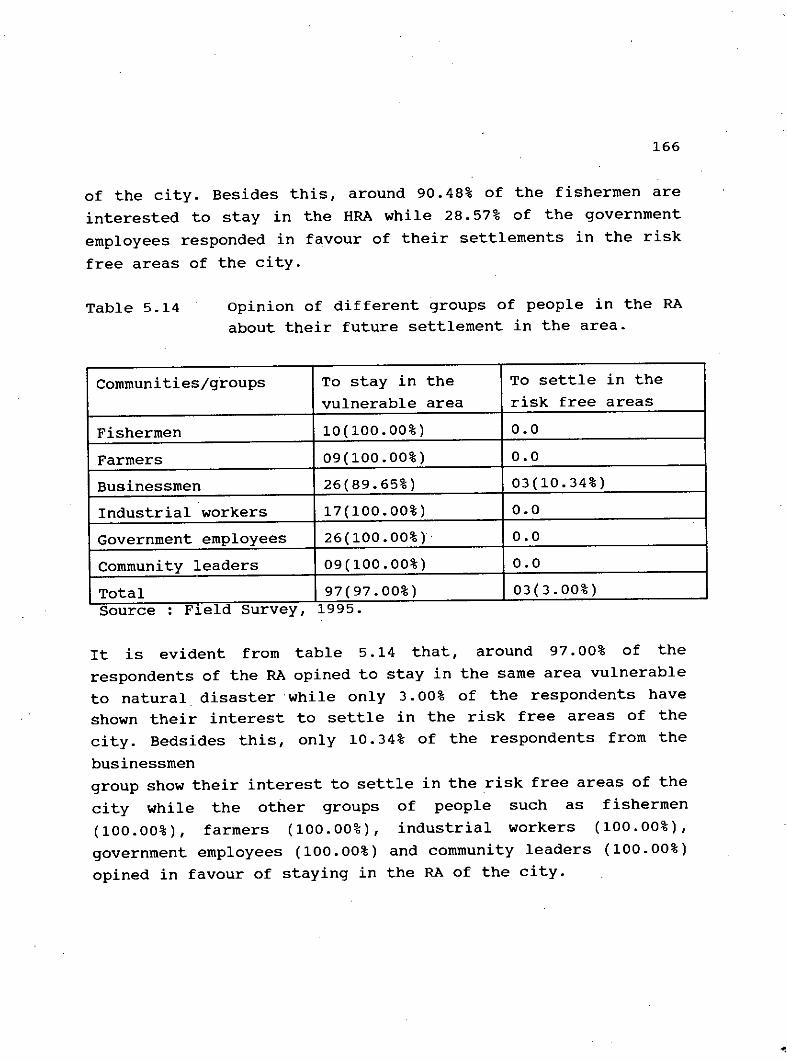
166
of the city. Besides this, around 90.48% of the fishermen areinterested to stay in the HRA while 28.57% of the governmentemployees responded in favour of their settlements in the riskfree areas of the city.
Table 5.14 opinion of different groups of people in the RAabout their future settlement in the area.
Communities/groups To stay in the To settle in thevulnerable area risk free areas
Fishermen 10(100.00%) 0.0Farmers 09(100.00%) 0.0Businessmen 26(89.65%) 03(10.34%)Industrial workers 17(100.00%) 0.0Government employees 26(100.00%) 0.0Community leaders 09(100.00%) 0.0Total 97(97.00%) 03(3.00%)Source: F1eld survey, 1995.
It is evident from table 5.14 that, around 97.00% of therespondents of the RA opined to stay in the same area vulnerableto natural disaster while only 3.00% of the respondents haveshown their interest to settle in the risk free areas of thecity. Bedsides this, only 10.34% of the respondents from thebusinessmengroup show their interest to settle in the risk free areas of thecity while the other groups of people such as fishermen(100.00%), farmers (100.00%), industrial workers (100.00%),government employees (100.00%) and community leaders (100.00%)opined in favour of staying in the RA of the city.
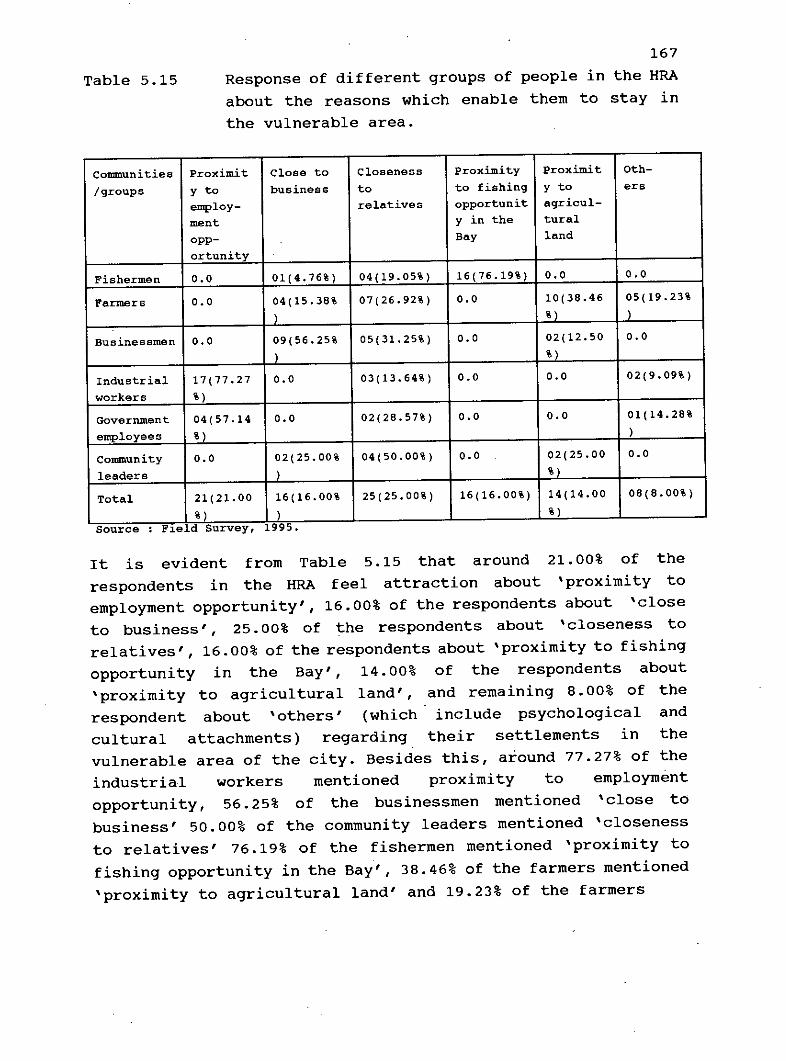
Table 5.15167
Response of different groups of people in the HRAabout the reasons which enable them to stay inthe vulnerable area.
Source : F~eldSurvey, 1995.
Conununities Proximit Close to Closeness Proximity Proximit Oth-/groups y to business to to fishing y to ers
employ- relatives opportunit agricul-
ment Y in the turalopp- Bay landortunity
Fishermen 0.0 01(4.76%) 04(19.05%) 16(76.19%) 0.0 0.0
Farmers 0.0 04(15.38% 07(26.92%) 0.0 10(38.46 05(19.23%) %) )
Businessmen 0.0 09(56.25% 05(31.25%) 0.0 02(12.50 0.0) %)
Industrial 17(77.27 0.0 03(13.64%) 0.0 0.0 02(9.09%)workers %)
Government 04(57.14 0.0 02(28.57%) 0.0 0.0 01 (14.28%employees %) )
connnunity 0.0 02(25.00% 04(50.00%) 0.0 02(25.00 0.0leaders \ %)
Total 21(21.00 16(16.00% 25(25.00%) 16(16.00%) 14(14.00 08(8.00%)%) \ %)
It is evident from Table 5.15 that around 21.00% of therespondents in the HRA feel attraction about 'proximity toemployment opportunity', 16.00% of the respondents about 'closeto business', 25.00% of the respondents about 'closeness torelatives', 16.00% of the respondents about 'proximity to fishingopportunity in the Bay', 14.00% of the respondents about'proximity to agricultural land', and remaining 8.00% of therespondent about 'others' (which include psychological andcultural attachments) regarding their settlements in thevulnerable area of the city. Besides this, around 77.27% of theindustrial workers mentioned proximity to employmentopportunity, 56.25% of the businessmen mentioned 'close tobusiness' 50.00% of the community leaders mentioned 'closenessto relatives' 76.19% of the fishermen mentioned 'proximity tofishing opportunity in the Bay', 38.46% of the farmers mentioned'proximity to agricultural land' and 19.23% of the farmers
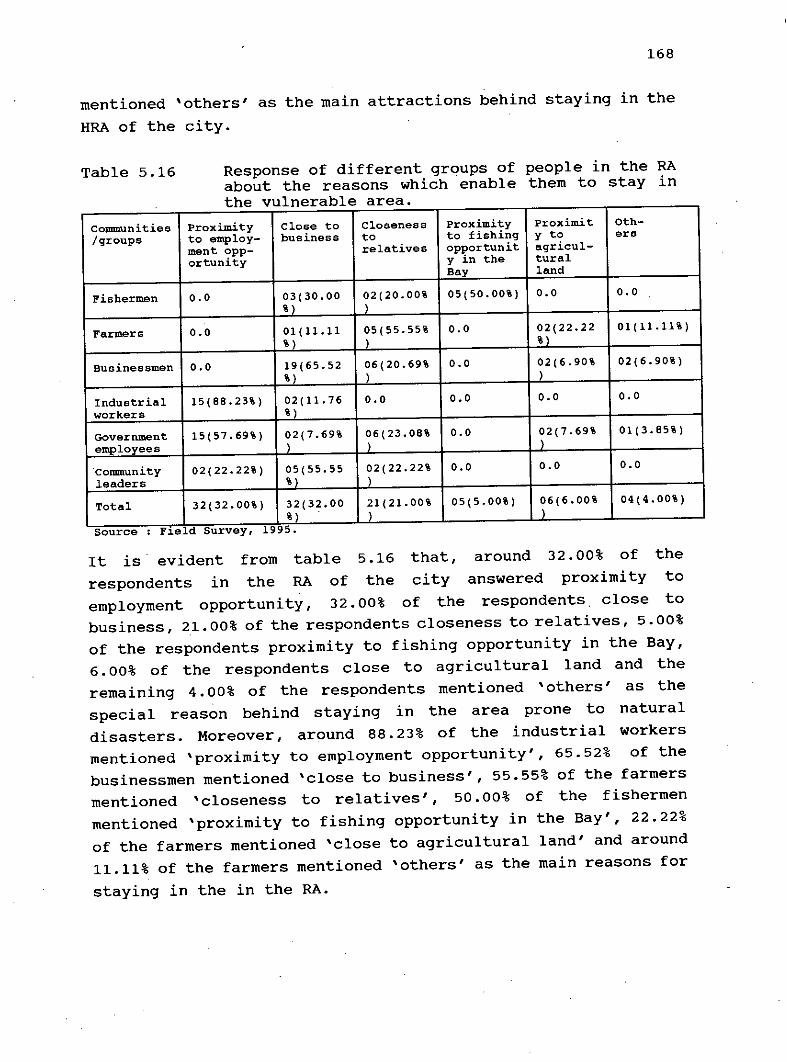
168
mentioned 'others' as the main attractions behind staying in theHRA of the city.
Response of different groups of people in the RAabout the reasons which enable them to stay inthe vulnerable area.
Communities Proximity close to closeness Proximity Proximit Oth-/qroups to employ- business to to fishing y to era
ment opp- relatives opportunit agricul-ortunity y in the tural
Bay land
Fishermen 0.0 03 (30.00 ~2(20.00% 05(50.00%) 0.0 0.0%}
.
Farmers 0.0 01(11.11 05(55.55% 0.0 02(22.22 01 (11.11%)%) ) %\
Businessmen 0.0 19(65.52 06(20.69% 0.0 ~2(6.90% 02(6.90%)%) )
Industrial 15(88.23%) 02(11.76 0.0 0.0 0.0 0.0workers %)
Government 15(57.69%) 02(7.69% ~6(23.08% 0.0 ~2(7.69% 01(3.65%)emnloyees }
.Community 02(22.22%) 05(55.55 ~2(22.22% 0.0 0.0 0.0leaders %)
Total 32 (32.00%) 32(32.00 21(21.00% 05(5.00%) ~6(6.00% 04(4.00%)%) . )
Table 5.16
Source F1eld Survey, 1995.
It is evident from table 5.16 that, around 32.00% of therespondents in the RA of the city answered proximity toemployment opportunity, 32.00% of the respondents. close tobusiness, 21.00% of the respondents closeness to relatives, 5.00%of the respondents proximity to fishing opportunity in the Bay,6.00% of the respondents close to agricultural land and theremaining 4.00% of the respondents mentioned 'others' as thespecial reason behind staying in the area prone to naturaldisasters. Moreover, around 88.23% of the industrial workersmentioned 'proximity to employment opportunity', 65.52% of thebusinessmen mentioned 'close to business', 55.55% of the farmersmentioned 'closeness to relatives', 50.00% of the fishermenmentioned 'proximity to fishing opportunity in the Bay', 22.22%of the farmers mentioned 'close to agricultural land' and around11.11% of the farmers mentioned 'others' as the main reasons forstaying in the in the RA.
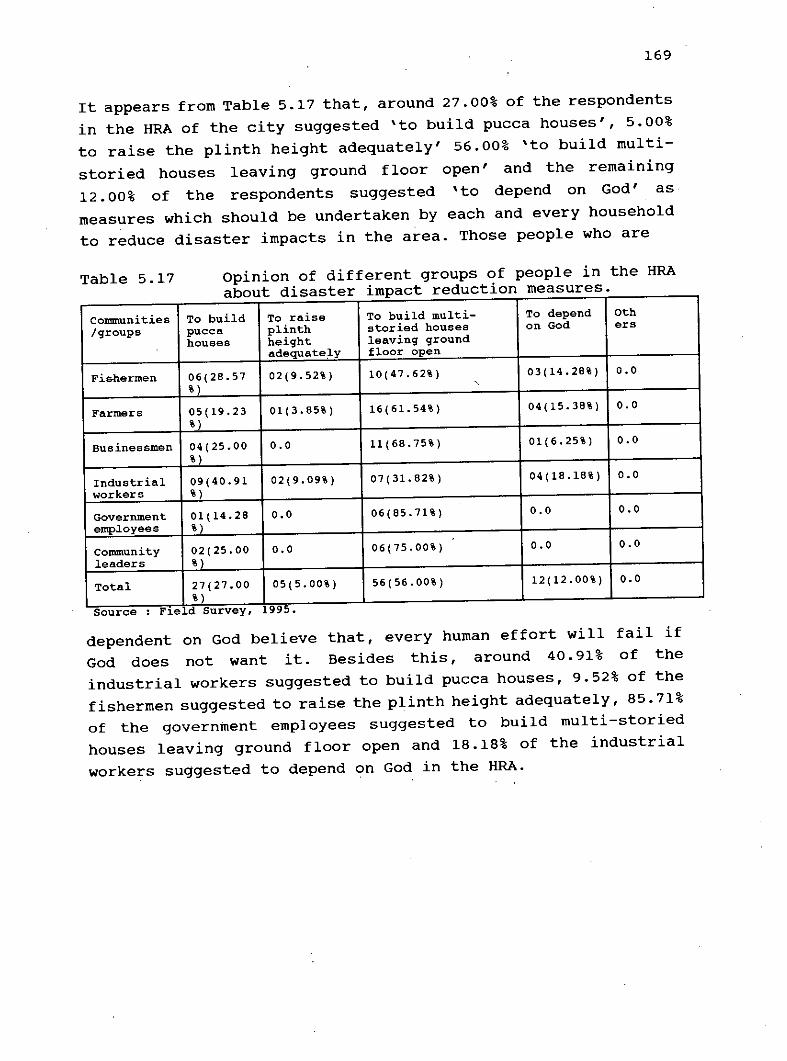
169
It appears from Table 5.17 that, around 27.00% of the respondentsin the HRA of the city suggested 'to build pucca houses', 5.00%to raise the plinth height adequately' 56.00% 'to build multi-storied houses leaving ground floor open' and the remaining12.00% of the respondents suggested 'to depend on God' asmeasures which should be undertaken by each and every householdto reduce disaster impacts in the area. Those people who are
opinion of different groups of people in the HRAabout disaster impact reduction measures.
Source: F1eld survey, 1995.
Communities To build To raise To build multi- To depend Oth/groups puced plinth storied houses on God ers
houses height leaving groundadequate.1 y floor open
Fishermen 06(28.57 02(9.52%) 10(47.62%) 03(14.28%) 0.0%)
,
Farmers 05(19.23 01(3.85%) 16(61.54%) 04(15.38%) 0.0%)
Businessmen 04(25.00 0.0 11(68.75%) 01(6.25%) 0.0%)
Industrial 09(40.91 02(9.09%) 07(31.82%) 04(18.18%) 0.0workers %)
Government 01(14.28 0.0 06(85.71%) 0.0 0.0emp~oyees %)
Community 02(25.00 0.0 06(75.00%) 0.0 0.0leaders %)
Total 27(27.00 05(5.00%) 56(56.00%) 12(12.00%) 0.0%)
Table 5.17
dependent on God believe that, every human effort will fail ifGod does not want it. Besides this, around 40.91% of theindustrial workers suggested to build pucca houses, 9.52% of thefishermen suggested to raise the plinth height adequately, 85.71%of the government employees suggested to build multi-storiedhouses leaving ground floor open and 18.18% of the industrialworkers suggested to depend on God in the HRA.
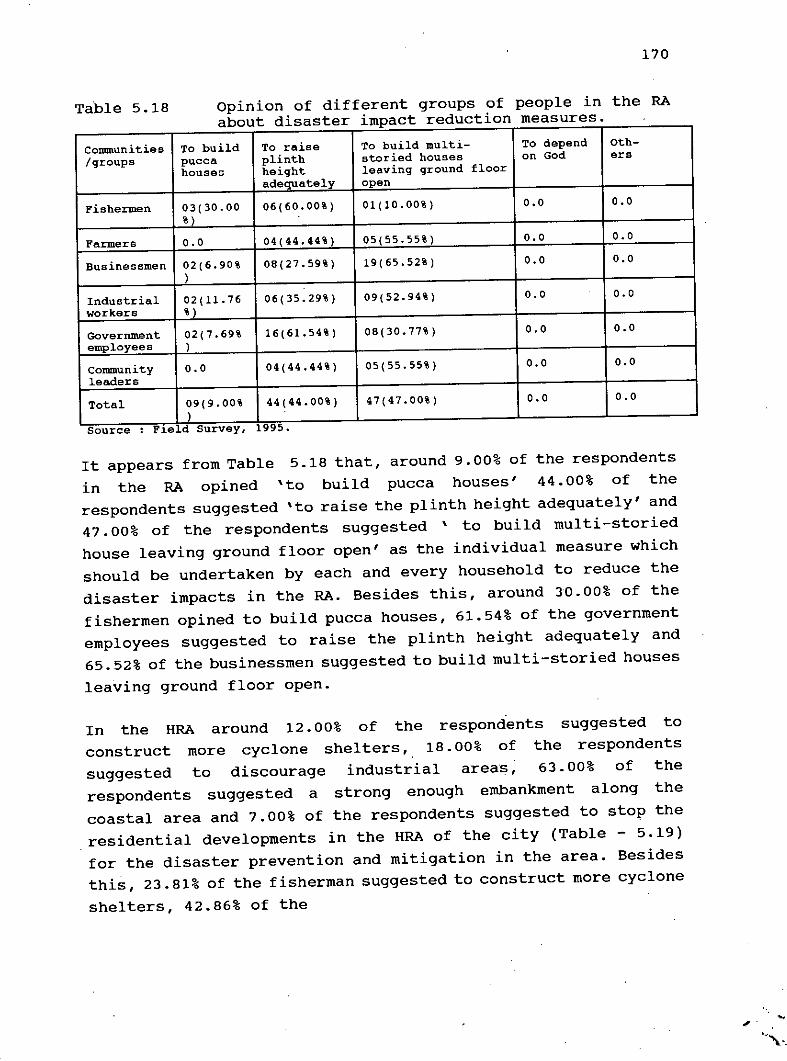
170
Opinion of different groups of people in the RAabout disaster impact reduction measures.
Source: F1eld Survey, 1995.
Communities To build To raise To build multi- To depend oth-/groups pucca plinth storied houses on God era
houses height leaving ground flooradequately open
Fishermen 03(30.00 06(60.00%) 01(10.00%) 0.0 0.0%\
Farmers 0.0 04(44.44%) 05(55.55%) 0.0 0.0
Businessmen 02(6.90% 08(27.59%) 19(65.52%) 0.0 0.0)
Industrial 02(11.76 06(35.29%) 09 (52.94%) 0.0 0.0workers %)
Government 02(7.69% 16 (61. 54%) 08(30.77%) 0.0 0.0employees )
Community 0.0 04(44.44%) 05(55.55%) 0.0 0.0leadersTotal 09(9.00% 44(44.00%) 47(47.00%) 0.0 0.0
)
Table 5.18
It appears from Table 5.18 that, around 9.00% of the respondentsin the RA opined 'to build pucca houses' 44.00% of therespondents suggested 'to raise the plinth height adequately' and47.00% of the respondents suggested' to build multi-storiedhouse leaving ground floor open' as the individual measure whichshould be undertaken by each and every household to reduce thedisaster impacts in the RA. Besides this, around 30.00% of thefishermen opined to build pucca houses, 61.54% of the governmentemployees suggested to raise the plinth height adequately and65.52% of the businessmen suggested to build multi-storied housesleaving ground floor open.
In the HRA around 12.00% of the respondents suggested toconstruct more cyclone shelters, 18.00% of the respondentssuggested to discourage industrial areas, 63.00% of therespondents suggested a strong enough embankment along thecoastal area and 7.00% of the respondents suggested to stop theresidential developments in the HRA of the city (Table - 5.19)for the disaster prevention and mitigation in the area. Besidesthis, 23.81% of the fisherman suggested to construct more cycloneshelters, 42.86% of the
,.
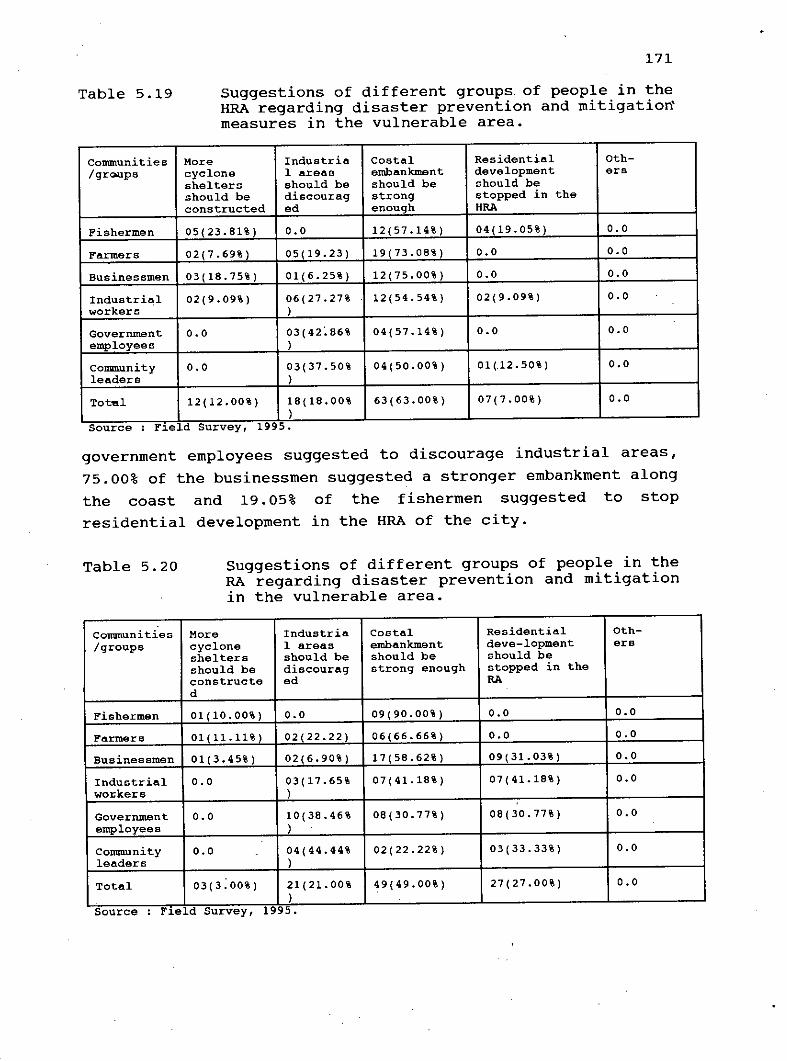
Table 5.19
171
Suggestions of different groups. of people in theHRA regarding disaster prevention and mitigatioITmeasures in the vulnerable area.
Communities More Industria Costal Residential Oth-/grcwps cyclone 1 areas embankment development erB
shelters should be should be should beshould be discourag strong stopped in theconstructed ed enough BRA
Fishermen 05(23.81%) 0.0 12(57.14%) 04(19.05%) 0.0
Farmers 02(7.69%) 05 (19.23) 19(73.08%) 0.0 0.0
Businessmen 03(18.75%) 01(6.25%) 12(75.00% ) 0.0 0.0
Industria;l 02(9.09%) 06 (27. 27% 12(54.54%) 02(9.09%) 0.0workers )
Government 0.0 03(42~86% 04(57.14%) 0.0 0.0employees )
COJImunity 0.0 03(37.50% 04(50.00%) 01 (12.50%) 0.0leaders )
Tot",l 12(12.00%) 18(18.00% 63(63.00%) 07(7.00%) 0.0)
Source : F~eldSurvey, 1995.
government employees suggested to discourage industrial areas,75.00% of the businessmen suggested a stronger embankment alongthe coast and 19.05% of the fishermen suggested to stopresidential development in the HRA of the city.
Table 5.20 suggestions of different groups of people in theRA regarding disaster prevention and mitigationin the vulnerable area.
communities More Industria Costal Residential Oth-/groups cyclone 1 areas embankment deve-lopment erB
shelters should be should be should beshould be discourag strong enough stopped in theconstructe ed RAd .
Fishermen 01(10.00%) 0.0 09(90.00%) 0.0 0.0
Farmers 01 (11.11% I 02(22.22) 06(66.66%) 0.0 0.0
Businessmen 01(3.45%) 02(6.90%) 17(58.62%) 09(31.03%) 0.0
Industrial 0.0 03(17.65% 07(41.18%) 07 (41.18%) 0.0wot;kers )
Government 0.0 10(38.46% 08(30.77% ) 08(30.77%) 0.0employees ) .
.
Community 0.0 04(44.44% 02(22.22%) 03 (33.33%) 0.0leaders )
Total 03(3.00%) 21(21.00% 49(49.00%) 27(27.00%) 0.0)
Source F~eld Survey, 1995.

172
In the RA around 3.00% of the respondents suggested constructionof more cyclone shelters, 21.00% of the respondents suggested todiscourage industrial areas, 49.00% of the respondents suggestedstrong enough coastal embankment along the coast and 27.00% ofthe respondents suggested to stop the residential developmentsin the RA of the city (Table 5.18) for the prevention andmitigation of natural disasters in the city area. Besides this,only 11.11% of the farmers suggested to construct more cycloneshel ters, 44.44% of the community leaders suggested to discourageindustrial areas, 90.00% of the fishermen suggested theconstruction of a stronger embankment along the coast and 41.18%of the industrial workers suggested to restrict residentialdevelopments in the RA of the city.
5.3. Reactions or Utility Ageocies and City Devdopment Authorities about Disaster
Mitigation Measures
Public utilities such as electricity, water supply, gas supply,telecommunication system are essential factors of daily urbanlife. During the natural disasters these utilities and servicessuffer severe damages thereby disrupting normal life in the urbanarea. Worse post-disaster conditions are often considered as theresul ts of affected utility services in the urban areas. InBangladesh the. utility systems can be classified into twocategories such as, underground and over ground. It has beenobserved that the public utility systems like, water supply,tele-communication partly and gas remain under the ground withadequate depth of cover and hence experience minimum impactsduring natural disasters. On the other hand, the utility servicessuch as electricity and telecommunication network remain exposedover the ground and hence suffer severe disaster damages.
To develop a clear understanding regarding the disastervulnerability of the existing utility systems in the city area,the researcher interviewed respective officials about differentaspects related to natural disasters.

173During discussion with an Executive Engineer of PDB (PowerDevelopment Board) engaged in the city distribution systemregarding disaster vulnerability of the existing power supplysystem and protective measures to minimize the impacts of naturaldisasters, it was conveyed that, the existing sub-station atHalishahar suffered a severe surge inundation during the 1991cyclone causing a huge damage to the equipments and it tookseveral days to come into operation after the disaster (figure4.13). Presently this station has been lifted to the first floorof a multi-storied building ensuring adequate protection againstsurge inundation.
In another interview with the Executive Engineer of the CWASA itwas known that the major part of the urban area is provided withfull capability water supply network which is totallyunderground with adequate depth of cover and remain free from theimpacts of cyclone disaster. Besides this, a partial capabilityof supplying water has already been ensured in the differentfringe areas of the city (Figure 4.14). Moreover, the watersupply establishment which are responsible for the efficientsupply system in the urban area are mostly located in the riskfree locations and did not suffer severe disaster impacts in the1991 cyclone and storm surge. These establishments are - MohraWater Treatment Plant, Chandgaon Deep Tube Well Field and IronRemoval Plant, Batali Hill Reservoir, ADC Hill Reservoir, DhakaTrunk Road Booster station and Patenga Booster station. Amongthese establishments only the Patenga Booster station experiencedsome disaster effects in the 1991 cyclone because of powerfailure which resulted immediately after the disaster in thecity.
Regarding the situation of gas supply in the city area the DeputyGeneral Manager (DGM) of Bakharabad Gas Systems Ltd. who is alsoa senior Engineer associated with the city distribution system,informed that, the underground gas supply system with adequate(around 5'-0") depth of cover including three high pressuredistrict regulator stations along the coastal belt of the cityare not vulnerable to natural disasters. Only the regulating and
174metering stations (RMS) for individual industrial customerssuffered minor repairable damages in the Patenga industrial areaand CEPZ. Besides this, it was reported that the gas supply inthe city was not interrupted during the severe most cyclone andstorm surge of 1991 (Figure 4.15).
The researcher also interviewed the T&T Executive Engineer whodiscussed matters related with 1991 cyclone disaster and theimpacts of the natural disaster on the T&T establishments as wellas on respective network in the city area. The engineer informedthat, the failure of the T&T tower at Nandankanan which createda real havoc disconnecting the city from the remaining parts ofthe country has already been replaced by another tower. Otherthan this, a stand-by tower has also been erected at Agrabad tosupport the new tower on different occasions. These new towershave been designed to withstand the wind speed of 254 km/hour.Besides this, 95% of the cable network has already been providedthrough the underground ducts to resist the future disasterimpacts and only 5% of this network still remain exposed asoverhead lines to disaster.
While discussing matters related to disaster prevention andmitigation in the vulnerable areas and the role of the ChittagongCity Corporation (CCC) in reducing the impacts of naturaldisasters in the city, the Superintendent Engineer (SE) of thelocal government (municipal) agency informed that, still thereis no such planning regulations regarding the provision ofmunicipal services from the relevant planning authority whichcould play a very vital role in the mitigation of naturaldisasters. The CCC which is engaged in the provision of municipalservices in the city area (like, maintenance and repair of thecity road network, construction of the new roads, constructionand maintenance of drainage system, garbage disposal, healthservices, educational programmes, development of the civicfacilities and amenities) is liable to meet the people's demandthrough services like other utility and service departments oragencies in the city. Moreover, in the absence of necessaryplanning guidelines and coordination among the concerned

175
agencies, the development activities in the city area is oftenseen to be hampered due to the lack of clarity about individualduties and responsibilities. Admitting the delineation of therisk areas by the researcher, the SE emphasized the need toimpose proper regulations on the development activities in thevulnerable areas which would contribute to the mitigation ofnatural disasters in the metropolitan city. He also stressed theneed to establish a 'high power' coordinating agency to guide andcontrol the activities of different service agencies to ensureproper development activity through public participation.
Talking to the Assistant Chief Town Planner of CDA (PlanningProject) regarding existing planning guidelines as well asrecently prepared structure Plan proposals under the assistanceof UNCHS/UNDP for disaster prevention and mitigation in the city,it was informed that, the existing planning principles which arebeing followed to approve development activities do not includemeasures for disaster mitigation in the city area. Regarding theapproval of the development activities, land use categories areusually emphasised only as indicated in the out-dated 1961 MasterPlan. Moreover, it is notable that this land use plan does notcontain enough provisions for disaster mitigation in the city.The only DM measure that has been taken in the mater plan, is theprovision of an embankment along the coastal belt of the city.On the other hand, chittagong Metropolitan Development Plan(1995) delineates a narrow strip of urban land along the coastalregion as 'special Control Zone - No Development Zone' (Figure -4.9) with due consideration to mitigate natural disasters in thecity. Other DM considerations involve 'Afforestation Schemes'along the coastal embankment and 'undeveloped Coasts andEstuaries' at different locations, i.e, beside the PatengaAirport and along the north-western coastal belt in the cityarea.
176
SA Summary
Different groups/communities live in the vulnerable area of thecity for generations. These include fishermen, farmers,businessmen, industrial workers, government employees andcommunity leaders who experienced several natural disasters inthe past. Most of the people in the vulnerable area arehabituated with the special life style and feel that naturaldisasters are part of their lives.
Different government departments including utility agencies andcity development authorities are found to be less concerned aboutmitigation measures against future natural disasters in the cityarea. It has also been observed that the city developmentagencies are facing lack of coordination towards an integratedapproach for disaster management in the metropolitan city.Chittagong city corporation (CCC) and Chittagong DevelopmentAuthority (CDA) presently do not follow any policy guidelines forthe mitigation of disaster impacts regarding the approval of thenew development acti vities in the city. Besides this, littleefforts have been made in the recently prepared Chittagongstructure Plan (1994) to put forward enough planning and land usemeasures and guidelines regarding the mitigation of naturaldisasters in the city area.

-....--.•....--.~. --
. .c. -.~... '- - ..1::_ 'S., ..
'". ,.,.. . -...-, -:P .
. - - • >\- .
, I" • - •
• •. '.
l... - .• - . .~ .• "..•.)O:- _"oW",
-- - -:",..". -".
CHAPTER SIX
LAND-USE PLANNIIIG AND DISASTER MITIGATION
CHAPfER.SIXLAND USE PlANNING AND DISASTER MITIGATION
6.1 Introduction
In the developing countries like Bangladesh natural disastersoften cause serious damages to the urban areas where the urbanpoor is concentrated. So an understanding of the measures whichcan be directly applied toward the prevention and mitigationnatural disasters in the urban areas is essential. In the past,the international community primarily focussed on relief actionsbut now it is being realized that the actual and potentialimpacts of disasters can be minimized through planning andprotective measures.
This chapter focusses on the spatial aspects of disasterprevention and mitigation which can be specified as land useplanning. It describes and evaluates measures designed to steerdevelopment away from the hazardous areas toward safer locationsand demonstrates how physical planning and land use control cancontribute to reduce both disasters and the vulnerability ofhuman settlements. It also prescribes land use policies andmeasures which are most relevant to disaster prevention andmitigation, including legal controls, fiscal and financialincentives, and direct government action.
6.2 Land Use Planning
Land use planning is an adjustment measure to disaster risk andas an adjustment measure it is responsive to the economic andsocial balance of the region or the country. Application ofinappropriate standards and techniques to the problem ofdeveloping countries are very common. Disaster prevention ormitigation is not the only goal and may sometimes conflict withother interests like employment and income opportunities. Toreconcile such differences in a right manner suitable for thelocal custom and resources is essential. Because in a developingeconomy initial decisions direct far reaching effects. At the

178
national planning level where land use plans become an integralpart of the development process, it is easier to recognizeadverse economic forces and harness those in favour of reducingdisaster risk. It is more likely that where a sound macroframework of land use policies has been adopted, undue burdenwill not be placed on the particular micro-level land usemeasures and regulations. These micro-level measures andregulations will then be more likely to be in tune with theeconomic setting, either working with it or not attempting tocombat more than local government offices and inspectors canhandle. One of the most serious and difficult challenges to landuse policies is the need to provide safe and suitable urban landfor all segments of population, including the lowest incomegroups who can least afford the disruption brought about byhaving to live in areas constantly subject to disasters. Furthermore, the lowest income groups congregate as near as possible totheir sources of employment, whatever the risks. In sum nothingshort of comprehensive policies can effectively cope withproblems of disaster prevention in urban development.
"The comprehensiveness of a policy frame work isdemonstrable where land use policies are supported bycorresponding social and economic policies. Thus thereservation of new urban land for housing, especiallywhere low income families are concerned, should belinked to transport and employment facilities,education and other social services. The modes ofinvestment in, and development of, new urban land arecomplex, and vary from country to country. The mostfeasible approach is one that undertakes thedevelopment of infrastructure services and housing inprogressive phases, employing wherever possiblepopular participation techniques to reduce capitalcosts by investing the labour and savings of theinterested population itself. One may cite corehousing, sites and services and the creation of smallsavings and loans societies or co-operatives ascomponents of the total land development process"(UNDRO, 1977).
179
6.3 Land Use Componalts
The land use components put forward in this research work are inline with the government study such as, SPARRSO land use map for~Chittagong city area on the basis of which various thesis workhave already been carried out. The land use components appliedin the preparation of land use map for Chittagong city area areplanned residential, unplanned residential, commercial,industrial, cultivated land, hilly area, tide area, unclassifiedarea, mixed area and other types of small land uses such as,graveyard, marshy land, ponds, lake and small water bodies, blankarea, play ground, mosque, park etc. Besides these, the symbolsof metalled roads, unmetalled roads, railways, embankment, riversand khals etc. highlights the condition of transportation networkin the city.
The unclassified area of the city land use contains variousactivities such as, government academic institutions, scientificresearch institutions, air port, sea port and other governmentactivities. other than this, both the residential and commercialfunctions are located jointly at the different locations of thecity which are identified as mixed areas.
6A Land Use Policies and Mitigation or Disaster Loss
The following land use policy measures and regulations can beadopted for the prevention and mitigation of disaster loss in adisaster prone urban area.
6.4.1 Administration or Land Policies :
A. DECENTRALIZED ADMINISTRATION: Decentralization depends on co-operation between local and central government in theadministration of land use policies and measures oriented towardsdisaster management. Central government can provide assistancein delineating risk areas within a particular geographicallocation by combining the expertise and information from

180
different government departments regarding the preparation ofrisk maps. In a decentralized system of government, the influenceof central government in the land use practice is usuallylimited. But the central government should influence land policythroughout the country by its programmes of financial aid andassistance to regional or local level. Therefore, developmentgrants, loans and subsidies may be provided on condition thatcertain land use measures be applied to reduce the disaster loss.
"The benefits of decentralization are often compromised in theabsence of co-ordination among various local departments.Actually, decentralized system of public administration iscriticized because of their contribution to uncoordinated effortsat all levels of government. Semi -autonomous, local, metropolitanand regional agencies in some cases lack an integrated approach,and are left to work with fragmented policies and plans,including the area of disaster management" (UNDRO, 1977).Moreover, the failure of integration contributes to theuniformity of codes and ordinances among local authoritiesexposed to the same risk. Thus vigilance with regard to properzoning and other land use measures to reduce disaster risks inone community may be compromised or negated by negligence inanother.
B. CENTRALIZED AUTHORITY: Plans and policies prepared centrallyare usually clear and well defined although there are manyproblems and limitations in this system also. Plans and policiesformulated in this system may not reflect the localcircumstances. Actually the participation of local and regionallevel agencies should be ensured in the preparation of plans atthe national level. There should be policies based on detailedphysical analysis to regulate and control the land use practicesat the local level. So the micro zoning for risk areas shouldoccupy small areas to provide the sufficient details regardingthe individual project. This duty can not be performed by thecentral authority alone' without. rece1v1ng ,the local levelexpertise which could contribute in providing effective anddetailed information for the same. An administrative or
181
institutional coordination is essential for integrating land usecontrol, fiscal control and legislation to ensure an effectivedisaster prevention and mitigation programme. An institutionalframe work which encourages distributed responsibilities ordiscourages local demand would not be able to provide aneffective planning guide line for the particular region or thenation as a whole (UNDRO, 1977).
6A.2 UgaI Controls:
A. Zoing Controls: "In terms of the typical planning effort,zoning may be defined as the division of land into districts orland use zones, and the prescription of regulations within thosezones regarding height and bulk of buildings, .floor area ratios,the density of population, set back regulations and thepercentage of lot occupancy" (UNDRO, 1977). For most part, zoningordinances are divided into broad land use categories such asagricultural, residential, industrial and commercial uses. Thesebroad categories have been refined in many countries by addinguses such as open.space and recreation and sub-dividing in greatdetail the general category into any number of specific sub-uses.zoning involves the delineation of contiguous tracts of landwhich differ from one another in some respect, either in termsof existing or anticipated characteristics. Zoning is the highlyeffective land use control device to mitigate and prevent naturaldisasters from planning point of view. Delineation of areas aredone depending upon their land uses and are shown in an officialmap. Once the zoning ordinance has been enacted and becomes law,difference in the ordinance require a special approval frompublic officials. Theoretically the zoning ordinance is based ona professionally conceived land use plan for the total planningarea.
B. Land Use Macro-Zoning: Land use planning zones normallyestablish macro-zoning at the national and regional levels. Thesezones identify agricultural, industrial, recreational and urbanuses incorporating existing and future patterns. To accommodatechanges and growth, macro-zoning plans are revised time to time
182
and the specific uses are allowed in the selected areas only.This type of zoning is an efficient tool to control the overallgrowth of various human activities at a particular location. Thusmacro-zoning can contribute in reducing disaster risk and usuallyprovide agricultural and recreational uses in the risk areasminimizing concentration of urban population. Preservation ofopen spaces through macro-zoning system can also contribute tothe prevention and mitigation of disaster loss in the vulnerableareas prone to various natural disasters. Furthermore, regionalmacro-zoning should harmonize the overall environmental, socialand economic goals of a nation. Thus the reservation of openspace for the mitigation of disaster risk should not overlook theeconomic potentials
c. Land Use Micro-Zoning: The preparation of detailed land-usemaps specially for the urban areas regarding the specific land-uses for each site are termed as Micro-zoning. The land-uses thusidentified by the public authorities are for exampleresidential, commercial, industrial, educational, transport etc.It also provides detailed information about the density of land-uses at a particular site. Micro-zoning is a basic tool fordisaster management which provide risk assessment to land-useplanning.In the risk micro-zoning identification of intensity aswell as the probable return periods or frequency of risks arealso made. For establishing land-use zoning ordinancequantitative as well as qualitative criteria can be employed inthe risk mapping. Also it enables to formulate more preciselybuilding codes for providing different urban facilities andtransport network as well.These urban facilities include publicworks, housing, industry, education, health etc.
D. Subdivision Regulations: Subdivision regulations are similarto zoning regulations which provide public control over landdevelopment. For the proper development of raw or virgin land,the subdivision regulation is a widely used tool. A developer isstopped from carrying out a development acti vity wfthout theapproval of the proposed design from the public authority.Subdivision regulations serve a wide variety of purposes, they
•
183
can ensure the provision of a safe and adequate water supply andsewage disposal system in new developments. They can alsocontribute to preserve or leave a land undeveloped where the landis prone to natural disasters. As a legal control, it has aconsiderable influence over the location and timing of privatedevelopment through the extension of public utility services. Theelement of co-ordination in the subdivision regulation providesa means for ensuring a safe development patterns on hazardouslands.
E. Construction or Location Permits: Through construction andlocation permits public authorities can exercise micro-controlsover land development. Type of land use, employment opportunityinfluencing overall development pattern etc. can also be guidedby the public authority with the help of this regulation. Whenan area is subject to natural disasters it becomes essential tocontrol the concentration of human activities in that location.
since industrial and commercial activities which directlyinfluence the urban concentration providing employmentopportuni ty , these activities should be discouraged in thedisaster prone areas. Various tax incentives may be imposed toattract industrial activities away from the high risk areas.
F. Open Space Control: Open spaces can play an important role inmitigating disaster risk in a particular location or area. Thelocation of agriculture land have a close relationship with theprovision of open space in the land use planning of an area.Agricultural land, parks etc. along with other open spacesdiscourage the high concentration of population and help mitigatethe disaster 10ss.The disaster loss include not only the loss oflife but also the capital loss due to the existence of variouseconomic activities in the risk areas. Provision of open spacedoes not mean the total non-use of land but a wide variety ofsocial and economic needs are satisfied at the same time. Thusopen spaces serve purposes ensuring economic return whileminimizing disaster loss. In the local, regional and nationallevels government acquisition of land is done by the transfer of
184
full or partial development rights. other than this, techniquesof lease back or sale back may be applied in this regard oncondition that certain open spaces be provided. Both the systemsensure public control over land development and provide necessaryopen spaces for disaster prevention. Moreover, productive use ofland is made possible by providing land for agricultural andrecreational uses and ensuring the sources of income to thecommunity through taxes and rents etc. In some cases taxexemption is allowed for undeveloped open spaces.
G. Building Codes: To avoid disaster risk, the standardsfollowed in the construction work or how the buildings are beingbuilt is an important factor along with location of the same.Building codes establish minimum standards of design,construction and materials in order to avoid structural collapseunder conditions of severe physical stress caused by extremenatural phenomena. Building codes which is essential formitigating the effects of natural disa'sters should beincorporated in the land use control and zoning regulations. Thiscoordinated efforts can be most effective local level instrumentfor the prevention and mitigation of disaster effects. Thestructural efficiency of buildings should directly correlate thelevel and nature of disaster identified in the micro-zoning andthe land-use maps. Besides this, the existing buildings in thesite should be repaired or improved according to the setstandards of building codes.
H. Land readjustment (Land pooling): Disaster prevention andmitigation can be practiced through the provision of publicutility and service facilities. There are other land developmentschemes which might prove effective in this regard is land .~readjustment or pooling.
In the land readjustment measure the land owners with the parcelsof land they possess are brought under a common pool for thecommon interest of the community. Then public services andutilities are provided in the site which include road network,school, community centre, health centre etc. Subtracting the land

185
required for services and facilities from the total site, theremaining land is sub-divided into plots and are distributedamong the owners. The new plot size usually become smaller thanthe original plot size and the differences are adjusted normallythrough compensations. Land readjustment projects are usuallycarried out by the public authorities or by the organizations ofland owners at the private level.The most significant advantageof land readjustment measure is the provision of public utilityservices in a planned manner. In the risk areas where zoning andsub-division controls are weak and ineffective, land readjustmentcan ensure as a measure of disaster mitigation (UNDRO, 1977).
6.4.3 Fiscal and Financial Incentives:
Fiscal and financial incentives can encourage development totake place in the risk free areas while policies can also beformulated to discourage development in the disaster prone areaswhich would help mitigate the disaster loss. So fiscal andfinancial incentives can be an effective tool in land use controlto prevent or mitigate disaster effects. Government may providefiscal and financial incentives in the form of loans andsubsidies to the owners of land who follow the land useregulations designated to mitigate the disaster risks.This typeof incentives can help proper land development in the disasterrisk areas. On the other hand tax measures can be used todiscourage development in the high risk areas where open spacesare obvious for disaster prevention and mitigation. Agriculturalland and open spaces should be taxed at a suitable rate toencourage land owners to keep their land undeveloped.
A. Taxation: In the high risk areas tax can be imposed on thedevelopment activities to provide subsidy for low income housingin the safer locations. If the development activities in the highrisk areas are reduced, it will become difficult to support lowincome housing in the risk free areas with subsidies.
Taxes which penalize the use of land and are not in tune with thedisaster management policies, are termed as negative policies.
186
These are limited within various kinds of land taxes, landimprovement taxes and taxes on income earned from land.
Subsidies, grants for specific developments and locations ofdevelopments or interest rate subsidies on development projectsfall under positive policies. Subsidized loans can be providedto build structures out side the risk area or to maintain asuitable use of high risk land i.e for agricultural purposes.
Negative incentives can be applied in the developed or modernsector. In the developing countries the low income traditionalsector remain out side the tax system. This picture is notdifferent for Bangladesh also. Due to high interest rate onloans, subsidy is becoming inaccessible to low income people. Thecosts of administering tax in the rural areas or in the lowincome urban sector may be really high. positive incentives inthe form of housing and land subsidies can be more effective andpoli tically more acceptable in the low income settlements.positive land and housing policies on risk free areas canreinforce negative fiscal and financial incentives on risk areas.The combination of both positive and negative policies can bemore effective than any of the policies taken separately.
Negative Incentives: Land taxation may have various purposes andeffects. It can help reduce the land speculation, enhance thedevelopment activity, rise in land price, increase in commercialactivity etc. Land taxation for disaster prevention should beprepared in harmony with other purposes and some delicacy inpolicy formulation is made for the overall social and economicgoals. Government may receive high tax yields from the risk areaswhere heavy tax burden is imposed to discourage the normal .•••development activity rather than. prevent development in thedisaster prone areas. Land taxes to discourage development on thehigh risk land may simply encourage intensive use of land to paymore taxes.
187
In the risk areas, low taxes are imposed on agricultural use toslow down the urbanization of this land. Low taxation onagricultural land will be only a small part of the total policyframe work required for holding the present use of land as aresult of which high pressure on land will be created toaccommodate other uses like residential, commercial, educational,industrial etc. An interest rate policy may not be effective tocontrol development in the high risk areas where low interestrate subsidies may be suitable for,development activities in thesafe areas.
positive Incentives: positive incentives like various kinds ofgrants, low interest loans for buildings or for purchasing ofbuilding materials etc. can be provided for low incomesettlements situated in the risk free areas. The subsidies at theinitial level should be sufficient enough to out weight economicbenefits such as access to transport, proximity to working placeetc. which may attract unplanned development in the high riskarea. There should be no basic difference between subsidiesgranted for low income housing as a counter measure of disastermitigation and low income housing in general. In high disasterrisk countries like Bangladesh priority should be given to theschemes to reduce disaster risk over low income housing schemesin general.
B. Non-Profit Limited Dividend companies: Large scale developmentprojects such as new towns or planned unit developments whichmake optimal use of land for public services and infrastructureworks can be taken as a fiscal control measure to minimize therisk of natural disaster. This type of developments ensure openspaces and low density areas in the risk areas.
These large scale development projects involves huge investmentsover a long period of time and the financial return is not asimmediate as it is often possible in the small projects. This isthe reason why private sector discourage the development of largeprojects of this kind. Government may participate in thisprojects to alleviate the problems and to provide necessary

188
public control over such projects. This approach is applicablein mixed or free market economy and would not function in thecentrally planned economy where the state is the only developer.
The wider scope of action is the important character of limiteddividend company. It acquire land, provide public services andfacilities, perform site design and sell or lease out land topublic agencies and private developers. In addition to this,adherence to building codes, zoning ordinances and subdivisionregulations can be well maintained. The concept of limiteddividend company is an innovative approach to provide necessaryhousing, public services and industrial locations. The disasterprevention and the virtual construction of the project can beadministered by one agency and the phases of development are allcoordinated. Limited dividend company may serve a number ofpurposes. The most significant is that this type of institutionalarrangements can be used for disaster prevention and mitigationand serve normal social and economic objectives at the same time.
c. Government Guarantee of Development Bond: To attract privatedevelopment away from the risk areas, it is essential to providesome government control for land development in the form ofgovernment guarantee of development bonds. This ensures a faithand reliability to the purchasers of the bond regarding the safeinvestment. It can also provide incentive for private investmentin development projects. To receive necessary government backing,the development work would have to be carried out according tothe certain land use, specific location and type of buildings tobe constructed. Policies for disaster prevention and mitigationmay also be included in this connection.
D. Insurance and Mortgage Policies: Insurance and mortgagepolicies can be formulated to encourage people 'tomaintain zoningregulations and building codes specially for the prevention andmitigation of disaster risk in the disaster prone areas.
189
In the developing countries the insurance and mortgage policiesfor disaster mitigation should be carefully made and hence itdemands much effort and examinations for this reason. Mortgageinstitutions should encourage development in the risk free areas,providing building loans in the locations which are not prone tonatural disasters. Insurance against disasters may be providedfor housing, commercial development, various economic acti vities,agriculture etc.
Finally, insurance and mortgage policies should not be consideredas isolated methods to prevent natural disaster only, but shouldbe developed in conjunction with many other programmes such assavings and loan societies, co-operatives, land use regulations,building codes, local administration, income and employmentopportunities ,the creation of resources of added capitalinvestment, financial and other incentives and public educationin disaster matters. Insurance and mortgage policies designed fordisaster prevention should merit closer attention in future years(UNDRO, 1977).
6AA Direct Government Action:
A. Public Acquisition: To form publicly owned land reservesgovernment may decide to go for acquisition through directpurchase of private land. This land reserves can help providingland for urban development projects or development of a certainarea can be discouraged holding the land for indefinite periodof time which may contribute the disaster prevention measures.Centralized control over land resource may discourage thespeculation of land and can establish a greater governmentcontrol on development activities. For the prevention andmitigation of disaster risks the concept of public acquisitionshould be encouraged which would be really effective to satisfythe various aspects of proper development. To ensure theproductive use of land as well as low density human activities(such as agriculture and recreation) in the vulnerable area,public acquisition can be most suitable in this regard. "Measuresto reduce the price of land acquired by public authorities

190
include compensation or expropriation procedures. These serve toexpedite acquisition and freeze land price at an early date inorder to avoid paying exaggerated prices later (UNDRO, 1977).Measures to reduce the cost of public acquisition of land areessential for the prevention and mitigation of disaster risk.
There are measures to reduce the cost of public land acquisitionwhich include advance acquisition of land for new development,selective land use controls in areas designated for futureacquisition,freezing development and prices pending acquisitionand giving priority purchase rights to the public authorities,and finally, general legal measures controlling the land-marketand avoiding or preventing speculation. Land speculationpractices ignore or conceal disaster risks. The private landmarket is often unwilling to recognize and is not aware of therisk associated with the natural hazards.
Through public acquisition policies, the creation of landreserves can provide for orderly, rational urban expansion whichwill include efficient extension of public services, themaintenance of natural resources and the realization of socio-economic potential from land.
B. Expropriation and Pre-Emption: "The right of pre-emption maybe defined as the right of first priority where publicauthorities have opportunity to acquire land in instances wherethe land owner is interested in selling" (UNDRO, 1977). In thissystem the land owner is bound to offer his land to the publicauthority first, if the public authority is not interested inacquiring the land, the owner may then sell it to other partiesin the open market. To control land use changes, to control landmarket and to set up land reserves without being forced topurchase large tracts of land in relatively short periods oftime, public authorities may exercise this measure ofexpropriation and pre-emption. Expropriation rights are normallyinvoked for public good. The agency responsible for expropriationof land must prove public interest by public hearings. And theland owner should be allowed to defend his right and to demand
191
appropriate compensation. Expropriation which is required forprevention and mitigation of natural disasters is in publicinterest and serves public purposes, hence expropriation mayoften be justified for these purposes. Expropriation is usuallycarried out by municipal or local government agencies, regionalauthorities may also practice it in case of large municipalitiesconsisting of numerous independent local governments.
c. Purchase of Development Rights: In this case, the owner of theland maintains the title of the property with some restrictionsregarding the use of land. Government acquires development rightswithout transfer of the land title. Normally, this measure isused to maintain public rights of way, utility lines, for scenicbeauties and environmental purposes. This measure provides directcontrol over the rate and type of development while reducing thecost of full land purchase. This concept is regulatory one andis less restrictive than other acquisition methods.
The purchase of development rights may prove to be effective asa land use control measure tool for the prevention and mitigationof natural disasters. For example, in the coastal areas exposedto cyclones and storm surge this measure can provide safedevelopment without interfering the socio-economic potential ofthe land.
D. Financing Public Land Acquisition: Regulatory measures, suchas zoning, building permits, and subdivision controls may proveto be ineffective in ares where land is developed by privateinitiative. Public land acquisition can control haphazarddevelopment, especially where land speculation is a commonpractice. In countries where natural disasters occur, haphazarddevelopment contributes to unsafe development practices and asa concept, public acquisition is justified on the grounds thatit is in the public interest to acquire hazardous lands for safeand careful development. The policy measures requiring for thefinancing of land acquisition can differ country to countrydepending upon the wealth and economic structure of the country.
192
Short and long term loans can be provided for municipalities thatattempt public land acquisition programmes from the governmentsources. The rate of interest should be lower than the privatemarket. This procedure allows municipalities to borrow money forshort periods of time at lower interest rate from the centralgovernment.
Besides this, national government can provide a major part of thefund required to assemble land for development purposes whilethe local government can supply the rest. Through this pOliciesthe national government can provide loans to local governments,municipalities, and other agencies that pay upto 90 percent ofthe cost of land acquisition and development. Repayment of theloans can be made over a suitable period of time while disposalof the land should be the responsibility of the borrowing agency.The method of financing is important, because the publicacquisition of land can be a necessary tool to controldevelopment in the disaster prone areas. In the third worldcountries where disasters occur frequently, public ownership ofland is highly essential. Regarding the fact that much of theAsian land is under private freehold tenure where publicacquisition through expropriation or pre-emption is unavoidable(UNDRO, 1977).
6.4.5 Public Land Dewdopmeot :
A. Secondary Centers and New Towns:
There are reasons in favour of creating secondary centers or newtown in the regions prone to natural disasters. The strategywould be to reduce risks by a more even distribution ofpopulation and activities as well as assuring economics of scalefor disaster related measures at the same time. The importantpoint should be considered regarding the creation of 'new towns'is that where new towns are created, their location should notonly be guided by social and economic parameters, but also by theanalysis of disaster risk factors (vulnerability analysis).
193
Although it is doubtful that investments in new infra-structureservices and employment could be justified on the grounds of thebenefits to be derived from disaster prevention alone,nevertheless the economics of creating secondary centers and newsettlements in disaster prone areas can not afford to ignore thedisaster risk factor.
From the disaster prevention point of view, there are at leastthree valid reasons behind the creation of secondary centers ornew towns. Firstly, the concentration of urban population in oneor two focal points usually causes congestion and overcrowdingand thus leads to higher levels of disaster damage probabilitythan if the same population were evenly distributed over a largerportion of the area prone to natural disaster. Secondly, highconcentration of population and buildings in disaster prone areasmay contribute the risk of damage, destruction and loss of lifeaggravating or changing the character of the natural hazarditself. Thirdly, disaster are not selective in the areas theystrike. Problems of natural hazards in rural areas may be justas acute as in large urban centers. Under certain conditions, theregrouping of rural population in a number of small centers mayprovide the economics of scale necessary to justify expenditureon disaster preparedness and prevention measures.
B. Provision of Infrastructure and Housing:
Various infrastructural and service facilities can be providedin risk free areas to direct growth away form the disaster proneland. As a development strategy, the provision of infrastructuremay be used to curtail development by prohibiting publicutilities, such as sewer and water supply facilities in the highrisk area. New development in the fringe areas depends greatlyon the availability of public services. Infrastructure facilitiesare an important lever to force development away from thehazardous areas or to attract development in the safer locationsthrough the curtailment or extension of public servicesrespectively.

194
Government intervention into the field of housing can alsoprovide strategies for disaster prevention. In principle, housingdevelopments should be encouraged in the areas free from theeffects of natural disaster. Once the risks are identified andtaken into account, The more complex decision making processinvolve reconciling the objective of prevention and mitigationwith the scarce resources and available technology in thedeveloping countries specially, housing for low income group isa sensitive field for planners and decision makers for the samereason. The situation of increasing levels of overcrowding andcongestion.in existing low income housing areas which only serveto aggravate the risk of disaster. In the situations where thetrade - offs between quality and quantity are the difficultissues to decide upon, the sensitive and sensible landuseregulations may offer some hope of resolving the problem. Byproviding new urban land for low income housing development awayfrom the high risk areas and by combining the measures ofrealistic development and investment policies, government maybecome able to reduce risks maintaining reasonable levels ofhousing output.
New housing developments require new investment in infrastructureservices, transport etc. These can be provided gradually throughaided self-help and other sources of citizen participation. withtechnical assistance from the local or national authorities,house owners may be taught how to build or rebuild more safelyand how to adhere to landuse regulations more closely tosafeguard their own safety. Some significant results regardingthis aspects have been achieved in a number of developingcountries in the field of low income housing, using the 'sitesand services' system for developing residential land inconformity with basic environmental and safety standards (UNDRO,1977) .
•

195
60S Summary
Land use policy measures presented in this Chapter (especiallyadministration of land policies, legal measures, fiscal andfinancial incentives, direct government action and public landdevelopment policy) can be applied to prevent and mitigatenatural disasters in Bangladesh subject to proper examination andevaluation of the policy measures with respect to the socio-economic condition of the people, type and nature of the disastervulnerability, state of development activity in the vulnerablearea. Moreover, one of the most serious and difficult challengesto land use policies is the need to provide safe and suitableurban land for all segments of the population. This includes thelowest income groups who can least afford the disruptions in thevulnerable areas prone to frequent natural disasters.
The comprehensiveness of a policy framework is demonstrable where-land use policies are supported by corresponding social andeconomic policies. Thus, the reservation of new urban land forhousing, especially where low income families are concentratedshould be linked to transport and employment facilities,education and other social services. other policies such as core-housing, site and services and the creation of small savings andloans societies or co-operatives may the components of total landdevelopment process.
Finally, proper application of policy measures can ensuresuccessful disaster prevention and mitigation in practice. Thisnecessitates a strong institutional framework for the successfulimplementation of the policy measures at the local level whichwould guide and control the development activities under setregulations.
-.,-'-- •.....--.1,. .-
06: -.J:.. '._ ~.~- 't~-
,._. "J.. . . ...-., -.•..- -,>-- .,. . .. .
• •, .
CHAPTER SEVEN
CONCLUSIONS AND RECOMMENDATIONS
--_ .
. --

CHAPrER SEVEN
CONCLUSION AND RECOMMENDATIONS
7.1 Introduction
In absence of necessary zoning regulations and policy guidelinesregarding prevention and mitigation of natural disasters thevulnerable areas are undergoing rapid development activity in anunplanned or haphazard manner increasing disaster vulnerabilityof the city area. Out of the five industrial areas in the city,three of these industrial areas (such as, Potenga industrialarea, CEPZ and Kattali industrial area) remain vulnerable tonatural disasters like cyclones and storm surges. Moreover theKalurghat industrial area exists in the low lying area (LLA)which is prone to flood inundations while the Sholoshaharindustrial area is situated in the risk free area of the city.These industrial locations in the vulnerable areas specially thePatenga industrial area and the CEPZ contribute to the disastervulnerability to a great extent increasing the concentration ofurban population in the surrounding areas. Other than this, thelocation of the proposed Chittagong International Airport in theHRA can playa very vital role in increasing the vulnerabilityof the area at least several times of the present situation.
7.2 Conclusions
The metropolitan city of Chittagong was hit by severe cyclonicstorms several times in the last few years including the greatdisasters of 1985 and 1991. Moreover, it is significant to notethat, out of a total of 20 severe cyclones which the countryexperienced form 1960, 13 of these cyclones had landfall area inChi ttagong (BMD, 1991). Most of these cyclones in Chittagongaccompanied by 2.4-10 meters (8-33 ft.) high surge with thetremendous wind speed varying from 150 km/hr. to 225 km/hr. andcaused severe damage to life and property in the study area. Thepresent urban growth in response to the rapid growth of urbanpopulation in the hazardous areas is sourly responsible for theincreasing disaster vulnerability of the city. area.
197From the land use survey it is estimated that out of a total of39475.75 acres of urban land in the city, 11567.78 acres(29.30%)of the urban land is situated in the high risk area (HRA),3613.99 acres (9.15%) in the risk area(RA) that is total15181. 77 acres (38.46%) is situated in the vulnerable areaexposed to natural disasters, 3969.19 acres S10.05%) in the lowlying area (LLA) and the remaining 20324.79 acres (51.49%) in therisk free area (RFA).
On the other hand, out of a total of 1961. 45 acres plannedresidential land use in the city, 139.00 acres (7.09%) exists inthe high risk area (HRA), 525.12 acres (26.77%) in the risk area(RA), i.e, 664.12 acres (33.86%) in the vulnerable area and theremaining 1297.33 acres (66.14%) is situated in the risk freearea (RFA).
Out of 10378.62 acres of unplanned residential land use 2471.10acres (23.81%) is situated in the high risk area (HRA), 1235.55acres (11.90%) in the risk area (RA), i.e, 3706.65 acres (35.71%)in the vulnerable area, 1420.88 acres (13.69%) in the low lyingarea (LLA) and the remaining 5251.09 acres (50.59%) in the riskfree area.
Out of a total of 988.43 acres of commercial land use in thecity, 185.33 acres (18.75%) is situated in the high risk area(HRA), 247.11 acres (25.00%) in the risk area (RA), i.e, 432.44acres (43.75%) in the vulnerable area, 123.55 acres (12.50%) inthe low lying area (LLA) and the remaining 432.44 acres (43.75%)in the risk free area (RFA).
Out of 3243.31 acres of industrial land used in the city, 1266.44acres (39.05%) is situated in the high risk area (HRA), 370.66acres (11.43%) in the risk area (RA) i.e, 1637.10 acres (50.48%)in the vulnerable area, 370.66 acres (11.43%) in the low lyingarea (LLA) and the remaining 1235.55 acres (38.09%) in the riskfree area (RFA).
Out of a total of 10996.40 acres of cultivated land in the city,3953.76 acres (35.95%) exists in the (HRA), 679.55 acres (6.18%)
198in the risk area (RA), Le, 4633.31 acres (42.13%) in thevulnerable area, 1668.00 acres (15.17%) in the low lying area(LLA) and 4696.09 acres (42.70%) in the risk free area (RFA).
Cent per cent of the hilly area (5930.64 acres) is situated inthe risk free area (RFA) in the city.
Out of 2594.60 acres of tide area, 2347.49 acres (90.47%) issituated in the high risk area (HRA), while the remaining 247.11acres (9.52%) is situated in the low lying area.
Out of a total of 1899.66 acres of unclassified area, 1019.33acres (53.66%) is situated in the high risk area (HRA), 308.89acres (16.26%) in the risk area (RA), i.e, 1328.22 acres (69.92%)in the vulnerable area, 15.44 acres (0.81%) in the low lying area(LLA) and the remaining 556.00 acres (29.27%) in the risk freearea (RFA).
The whole mixed use area (which is around 556.00 acres) issituated in the risk free area in the city.
Out of 926.65 acres of other land uses in the city 185.33 acres(20.00%) is situated in the high risk area (HRA), 247.11 acres(26.67%) in the risk area (RA), i.e, 432.44 acres (46.67%) in thevulnerable area, 123.55 acres (13.33%) in the low lying area(LLA) and the remaining 370.66 acres (40.00%) is situated in therisk free area (RFA) of the city.
The high risk area (HRA) is mostly composed of cultivated land(34.18%) and unplanned residential land use (21.36%) while amajor part of the risk area (RA), is occupied by the unplannedresidential area (34.19%) activity mainly.
On the other hand, thecultivated land (42.02%)(35.80%) mainly.
low lying area (LLA), consists ofand unplanned residential land use
The public establishments which are located in the high risk area(HRA), such as government offices, industrial activities,

199scientific and training institutions, hospitals, warehouses,airport, seaport etc. suffered severe damages in the 1991 cycloneand storm surge.
Cent per cent of the respondents in the high risk area (HRA) andrisk area (RA) have enough realization about disastersvenerability of the area, still most of the responden~do notwant to leave the area for safer locations in the city. Becausethey have cultural attachments to stay close to their relativesas well as income opportunities (employment, business, fishing,agricultural etc.)
Most of the respondents in the vulnerable area proposedmulti storied buildings leaving ground floor vacant as anindividual measure to reduce disasters vulnerability in the area.
Besides this, most of the respondents suggested stronger coastalembankment while some of them suggested to stop the industrialactivities in the vulnerable area as a part of the governmentresponsibility for disasters mitigation in the city.
Although most of the public establishments are concentrated inand around the central locations of the city, only a few of theseestablishments which include government offices, industrialacti vities, scientific and training institutions, hospitals,warehouses, ai~port, port etc. incurred severe disaster damagein the 1991 cyclone because of the size and nature of theestablishments is the vulnerable area. The public establishmentswhich experienced massive damages in the 1991 cyclone are mostlysituated in the HRA of the city which include Patenga industrialarea, Chittagong Port and Patenga Airport mainly.
During the 1991 cyclone disaster, cent per cent of therespondents received cyclone warnings timely from various sources(radio/TV and CCC) in the vulnerable area (HRA and RA) but themajor part of the respondents did not move to guard the houseswhile the other important part of the respondents did not takesignals seriously.

200In the HRA, cent per cent of the respondents experienced surgeinundation which is more than 1.00 meter high and informed abouthouse damage in most of the cases with some, human deaths.Moreover, cent per cent of the respondents in the HRA have enoughrealization about the disaster vulnerability of the area, stillmost of the respondents opined to stay in the same area. Thesepeople feel attraction to stay closely with other relatives aswell as at the close proximity to the income opportunities suchas, employment, business, fishing, agricultural land etc.Finally, most of the respondents in the HRA opined in favour of'multi-storied buildings leaving ground floor open' as anindividual measure to reduce disaster vulnerability of the areaby the households while most of these respondents in the samearea suggested stronger coastal embankment for.the prevention andmitigation of natural disasters in the city.
On the other hand, most of the respondents in the RA experiencedless than 1.00 meter high surge except a few residing beside theHRA margin who suffered more than 1.00 meter high surge in the1991 cyclone. A great percentage of these respondents complainedabout other property damage (which include household assets,shops, rice mills, trucks, other vehicles etc.) with some housedamage in the RA of the city. Although almost all the respondentsof the same area have enough realization about disastervulnerability of the area, a very few of them opined to settlein the risk free areas of the city. Most of these respondentsfeel attraction for the income opportunities (such a,semployment, business etc.) and relatives at the close proximityto their settlements.
Moreover, a major part of the respondents in the RA opined infavour of building multi-storied houses leaving ground floor openwhile the other important part of the respondents opined toraise the plinth height adequately as an individual measure toreduce disaster vulnerability of the area by the households.Besides this, a major group of respondents suggested to ensurea stronger coastal embankment while the other groups suggestedto stop the residential activities in the HRA and to discouragethe industrial areas in the vulnerable area of the city.
'\"".

201The study concerning disaster management situation in Bangladeshreveal that adequate disaster management measures are absent inthe metropolitan areas of Bangladesh specially in the Chittagongmetropolitan area to fight the natural disasters like cyclonesand storm surges. Even the newly prepared Chittagong structureplan does not provide necessary policy guide lines regardingdisaster prevention and mitigation in the city which is growingvery rapidly with the increase of disaster vulnerability at thesame time.
7.3. Policy Recommendations:
Planning Policies:
Following are the Planning Policies for disasters mitigation inthe vulnerable areas of the metropolitan city of Chittagong.
A. Industrial Area:Following structrual measures are proposed for the protection ofthe existing industrial areas at Patenga and Chittagong ExportProcessing Zone (CEPZ) as part of the individual initiative fromindustrial activities.
i) RCC retaining walls at the suitable locations.ii) Raised plinth height to protect the industrial activities
from surge inundation.ii) The permanent structures with water resistant sliding door
system and strong walls above the level of storm surgeinundation to protect the existing industrial activities.
Moreover, a stronger coastal embankment with RCC constructionswith sluice gates at the suitable locations may provide enoughsafeguard against cyclones and storm surges.
On the other hand, nonstructural measures like afforestation orgreen belt development outside the coastal embankment wouldprovide adequate protection for the embankment as well as theexisting industrial areas along the coastal region in the city.
...- ..~~.....•.1;.--.._
}"
'"
202
B. Patenga Airport:Following structural measures are recommended for the protectionof the existing Airport (which is being upgraded as aninternational Airport) against natural disasters like cyclonesand storm surges that can be implemented by the respectiveauthority.
i) RCC retaining walls at the suitable locations.ii) Adequate earth filling to raise the land level thus reducing
the impacts of natural disasters.iii) Well protected hanger complex with water resistant
sliding door system to protect the aeroplane and equipments .inside.
Besides this, a stronger coastal embankment with RCCconstructions and sluice gates at the suitable locations canprovide adequate protection for the Airport against the impactsof natural disasters.
On the other hand, some nonstructural measures can also beproposed to protect the Airport from the impacts of naturaldisasters. These are:i) Green belt or forest development outside the embankment can
provide enough safeguard for the embankment as well as theexisting Airport against disaster impacts.
ii) Necessary training schemes can be undertaken for theofficials and staffs regarding mitigation of the disasterimpacts.iii) Practice drills can be undertaken to develop awareness among
the staff and officials of the agency.
C. Chittagong Port Authority:Following are the structural measures recommended which can beundertaken by the respective authority individually for theprotection of the Chitta gong Port against natural disasters.i) storage sheds with strong walls above surge height and water
resistant sliding door system.ii) Appropriate structural measures can be undertaken to protect
the jetties and cranes in the Port.
203
iii) Improved anchorage mechanism for the ship and vessels.
Moreover, some nonstructural measures can also be proposed tomitigate the disaster impacts on the Chittagong Port Authority.These are:i) Training schemes can be undertaken for the officials and
staff regarding disaster mitigation in the Port.ii) Practice drills (at least once a year) should be introduced
to develop awareness and fitness among the staff andofficials of the authority.
D. Warehouses:
Following structural measures are proposed for the protection ofexisting warehouses from the impact of cyclones and storm surgeswhich can be implemented by the respective authority.
i) storage sheds with strong walls above surge height withwater resistant sliding door system.
ii) RCC retaining walls to protect the activity from the impactof storm surge inundation.
Besides this, a stronger coastal embankment wi th RCCconstructions and sluice gates at the suitable locations canprovide adequate protection against surge inundation.
On the other hand, nonstructural measures such as afforestationor green belt development outside the embankment can provideenough protection for the embankment as well as warehouses.
E. Scientific and Training Institutions:Adequate protective structural and nonstructural measures shouldbe undertaken by the institutions individually to protect theirequipments and other property from the impacts of naturaldisasters in the light of previous experiences.
204
Land use Policies:
Following are the planning and land-use policy guide linesregarding disaster prevention and mitigation vulnerable areas ofthe city.
High Risk Area (HRA):CUltivated Land:
- Public acquisition of agricultural land should beundertaken to ensure proper development in the HRA. Sincea significant portion of the HRA still remain undeveloped,the acquisition programme can be undertaken as early aspossible before the land price goes up and permanentdevelopments are started.
- Expropriation or preemption and purchase of developmentrights Policies can be applied on the cultivated land toensure proper development of the HR land..
Agricultural activity should also be discouraged in theHRA, so that people do not feel interested to settle besidethe productive cultivated land which would contribute inmitigating natural disasters in the same area.
- Any development activity in the cultivated land should bestrictly prohibited by the concerned planning authority tominimize the disaster vulnerability of this HR land(betterment fees can be levied in case of special changesin the land use.
- The HRA beside the .coastal belt should be developed as arecreational zone providing necessary recreationalfacilities such as, park, children's park, beach area,picnic spot, golf course etc. with respect to the futuredemand of the city. Tourist attraction can also bedeveloped to ensure a better earning from the HRA.
205- Reserve land in the form of open space or wood land can be
allowed to facilitate urban development as well as futureexpansion of the existing functions such as, port, airportetc.
Unplanned Residential
The unplanned urban developments specially the slum areasin the HRA need to be upgraded with basic infrastructurefacilities under the Slum Improvement Project.
The unplanned urban developments in the HRA should not beput under direct acquisition programme but different policymeasures can be applied to discourage the developmentactivity in the same area. The following are the policymeasured can be undertaken in this regard:
Development loans should be discouraged in the HRA
.Low income housing schemes should be encouraged in the riskfree areas with adequate financial incentives (such as, lowinterest development loans, tax holiday, compensation etc.)to attract people living in the HRA.
High rate of land development tax should be imposed in theHRA.to support low income subsidized housing at the saferlocations which would minimize the present development ratein the HRA at the same time.
strict regulations and appropriate building codes should beimposed for permanent construction work in HRA regardingthe aspects like use of the building, structural system,building material, plinth height, no. of floors, use ofground floor etc.
Purchase of development rights policies can be imposed tomitigate natural disasters in the HRA which woulddiscourage overall development activity 'in the same area.
206Expropriation or pre-emption policies can be applied toacquire unplanned residential areas in the HRA. Under thispolicy measure, government authority will have the right offirst priority to purchase any land in the HRA when theowner is interested in selling his land. If the publicauthority is not interested in purchasing any land, thenthe owner may go for selling it in the open market.
Land pooling or land readjustment measures can be exercisedin the existing rural settlements and fishermen villages toreduce the disaster vulnerability of the high risk land.
Industrial Area
Adequate protective measures through engineering structuresshould be undertaken to protect the industrial areas such as,Patenga industrial area and CEPZ in the HRA from the impact ofnatural disasters.
The existing industrial acti vities should undertake necessarymeasures against cyclones and storm surges individually from theprevious experience of 1991 cyclone and storm surge disasterespecially.
Delicate, electronic and light industrial activities should bediscouraged in the HRA with the provision of other industrialareas in the risk free areas of the city.
other than the heavy engineering works and dock activities, theremaining industrial activities should be properly assessed tobe located in the coastal area .
New industrial activates should be discouraged in the HRA, untiland unless it is examined and found suitable to be located in thesame area. (The industrial activities which would require portfacility for the transportation of raw material or finishedgoods, may be considered in this regard).
207Unclassified Area
The unclassified area situated in the HRA (composed ofairport and seaport mainly with other academic and traininginstitutions) should undertake adequate protective measuresindividually in the light of 1991 cyclone and storm surgedisaster experience.
- Necessary measure through engineering structures should beundertaken to protect the existing airport from the impactsof natural disasters.
Upgradation of the existing Airport to the internationalstandard would certainly contribute the higher disastervulnerability directly, so appropriate policy measuresshould be undertaken to mitigate disaster impacts in theoperational plan of the Airport.
The existing port activity which is being performed withinthe narrow strip of land along the bank of the Karnaphuliriver remain vulnerable to natural disasters and shouldundergo further expansion on the left bank regarding largerport activities and reducing disaster impacts at the sametime.
Risk Area (RA)
Planned Residential
- Planned housing for low income and middle income groupsshould be encouraged in the risk area (RA) to attractpeople living in the HRA with subsidized housing facilitiesand financial incentives (such as, low rate of developmenttaxes, low interest housing loans etc.) especially forthose who are engaged in fishing or related activities.
- To enhance existing planned residential activity in therisk area (RA), appropriate taxation measures should beimposed on undeveloped vacant plots to discourage land
208speculation in the same area which would contribute inreducing the pressure of urban concentration on the highrisk area (HRA).
- Appropriate building codes should be imposed on futuredevelopment activities by the relevant planning agenciesfor the prevention and mitigation of natural disasters inthe risk area (RA).
The regulations regarding type of buildings, construction system,building material, plinth height, no. of floors, use of groundfloor etc. can be imposed to fight cyclones and storm surges inthe same area.
Type of buildings: Residential buildings with related socialfacili ties (such as schools, play grounds, parks, mosques, healthfacilities etc.) will be allowed for construction in the riskarea.
structural System: R.C.C. frame structures will be constructedin the risk area to facilitate the diversified use of thebuilding floors and to ensure enough structural resistanceagainst cyclones and storm surges,
Building materials: Specified building materials by the qualifiedprofessional engineers should be used in the structural works sothat expected structural strength can be ensured very well.
Plinth height: The plinth height should be at least 1.00 meterhigh from the adjacent city Corporation road level and in caseof low lying areas or in Special cases it should be determinedby the qualified professional Architect.
No.of floors: The buildings that will be constructed in the riskarea should not possess more than six (6) floors. Since theWalkup height is six story, and the building exceeding thisneight would require some mechanical devices for the provisionof lifts which may contribute the disaster risk.

209Use of the ground floor: The ground floors of the buildings tobe constructed in the risk area, should be kept open for carparking or other related activities which would contribute inmitigating the disaster risk.
- Repair and maintenance of old andstructures or the reconstruction ofshould be carried out in relationbuilding codes.
Unplanned Residential :
disaster affectedexisting buildingsto the respective
- Temporary or kutcha houses/structures which are prone tonatural disasters should be discouraged in the risk area(RA) through the provision of low interest developmentloans and minimum taxation on land developments.
- High density unplanned settlements such as slum or squattersettlements which contribute the disaster vulnerability,should be diverted towards the safer locations of the citythrough the provisions of. low cost housing form publicsector and ensuring the desired development in the RA atthe same time.
Permanent construction works should be carried out withrespect to the set regulations or building codes by theconcerned planning authority to -mitigate the disastervulnerability in the RA.
- Reconstruction and repair works should also be carried outin accordance with the respective regulations or buildingcodes prepared by the local planning agency.
Industrial Area :- Full concentration of industrial activities should be
ensured in the existing Kattali industrial areadiscouraging other industrial developments in the RA of thecity which would positively contribute in reducing disastervulnerability of the RA.
r
210- The present unplanned and haphazard growth of garment
industries should be prohibited in the RA throughappropriate policy measures imposed by the concernedplanning authority and directing their concentration in theprescribed risk free locations of the city.
- Haphazardly located small industrial activities (such as,car repair, ship breaking, engineering workshop etc.)should also be discouraged in the Risk Area (RA) whichwould contribute in minimizing disaster effects reducingthe concentration of working population in the same area.
Depending upon the size and nature of theactivities, only non-polluting medium sizeactivities should be located in the RA.
Commercial Area
industrialindustrial
- Heavy investment commercial developments such as, hugemarkets, shopping centres, commercial offices etc. -shouldbe restricted in the RA through proper policy guide linesimposed by the local planning authority.
- Commercial activities of such a nature or size essential tosupport the existing settlements should be encouraged inthe RA.
- Commercial activities which are unplanned and haphazardlylocated in the RA prone to natural disasters, should bediscouraged with appropriate planning regulations from theconcerned planning agency reducing the impact of naturaldisasters on the same area.
- High concentration of commercial activitiesencouraged in the selected central locations ofadequate urban facilities and services for the
should bethe RA withsame.

211
Low Lying AreaUnplanned Residential
Provisions of low interest development loans and minimum landdevelopment tax should be allowed to enhance permanentconstruction in the low lying area (LLA) of the city.
Permanent construction works should be carried out inaccordance with the set regulations under the localplanning authority regarding the prevention and mitigationof the impacts of natural disasters in the LLA.
- For the preparation of construction regulations regardingthe mitigation of the impacts of natural disasters in theLLA, special emphasis should be given on the aspects oflevel of earth filing, plinth height, use of the groundfloor, structural system building material etc.
- The existing rural settlements in the low lying area (LLA)should be discouraged with the provisions of adequate urbanfacilities and services (such as, schools, play grounds,parks, water supply, electric gas, supply, garbage disposaletc. ).
CUltivated Land
- Due to the close proximity to central city area,agricultural activities in the LLA should be discouragedwith the prov1s10ns of urban facilities and essentialservices which would encourage rapid development activityin the same area reducing the impacts of natural disastersat the same time.
- The cultivated land along the bank of the Karnaphuli riversituated in the flood prone low lying area (LLA) in thecity should be developed as a picnic spot/park to withstandthe immediate effects of natural disasters in the samearea.

212- Agricultural land in the low lying area can be bright under
public acquisition to accommodate future urban facilities(such as, play grounds, schools, community centres,markets, parks, graveyards etc.) to accelerate permanentdevelopment activity which would contribute the mitigationof disaster vulnerability of the area ultimately.
Industrial Area :
- Concentration of industrial activities should be ensured inthe Kalurghat industrial area discouraging unplanned andhaphazard industrial locations throughout the whole LLAwhich would contribute the mitigation of disastervulnerability in the same area.
- Adequate protective measures should be undertaken throughengineering structure to reduce the disaster vulnerabilityof the Kalurghat industrial area from the previousexperience of the 1991 cyclone and storm surge.
- Necessary safety measures should also be undertaken by theindividual industrial activities to prevent the impact ofnatural disaster on the same.
Planning and Land-use Policies for the OVerall Development of thecity Mitigating Natural Disasters:
Housing: (Low Income and High Income)
Low income housing settlements should be provided form the publicsector (at a subsidized price) at the safer locations of thecity.
The unutilized hilly area in the city can be brought underdevelopment process and housing developments can be encouragedthere.
•

213Private sector housing should be encouraged in the city todevelop various types of housing settlements under the control
regulations of the public development authority.
sites and Services schemes may be provided to attract peopleliving in the unplanned settlements of the high risk area aswell as to discourage development activity in the disaster proneareas of the city.
Low interest or subsidized development loans should be providedfor low income housing development at the safer locations of thecity.
To relocate or attract any particular community or ethnicgroup(for example, fishermen community) from the high risk areato the risk free locations, proper care should be takenregarding the distance from the work place and the location ofthe same.
Infrastructural Services :
utility and services such as, Electricity, Water supply, gastelecommunication etc. can be extended to the potentially saferlocations of the city where new developments can be encouraged.
The high risk area or the risk area where development activityis not desired or a slower pace is likely to be encouraged, theutility and services to be provided there should be in harmonywith the overall planning goals.
To cope with the limitations of scarce resources, theinfrastructural services may be provided in different phases onthe basis of development sequence in the city.
Urban Land Development :
The new urban land development can be encouraged in the threelocations, these are,
214(1) The north - western hilly area(2) The north-eastern low lying agricultural land(3) The northern plain land
In the hilly region of the city, hill cutting may be allowed upto a certain level to facilitate the new development activityminimizing the chances of land slides because of sharp steepness.
Unplanned hill cutting and developments should be restricted bythe respective planning authority to enhance a proper developmentin the region.
Hill cutting should be carried out in such a way so that drainsand canals does not become silted to create flash floods in thedifferent parts of the city.
The north-eastern low lying area is prone to flash floods andtidal inundation, so the new developments in this region shouldnot be implemented without adequate earth filling.
The provision of an open space or a park along the bank of theKarnaphuli river would contribute in mitigating the directdisaster effects on rest of the developments in the region.
Economic ActivitiesEconomic activities such as, banks, offices, markets, industriesetc. should not be located in the high risk area. Theseactivities should be located in the risk free areas to minimizethe disaster effects.
To encourage tourism in the city, the high risk area with otherhistorical events can be developed with minimum capitalinvestment which can ensure a good earning of foreign currencyevery year.
Industrial activities located in the high risk area such as,Patenga Industrial Area and Export Processing Zone should beprotected from the natural disasters through structural measures.

215The industrial activities which do not essentially require portfacili ties for the transportation of raw materials or goodsproduced; they should be encouraged to be located at the saferlocations of the city rather than Patenga Industrial Area andCEPZ.
New industrial areas should be developed at thelocations of the city where light and delicateactivities can be encouraged to mitigate the disasterdue to the haphazard distribution of activities.
risk freeindustrialloss caused
Medium scale industrial activities should be encouraged to belocated in the Sholashahar Industrial Area.
Commercial and business activities such as, offices, banksmarkets etc. in the high risk area should be discouraged by therelevant planning authority.
If-
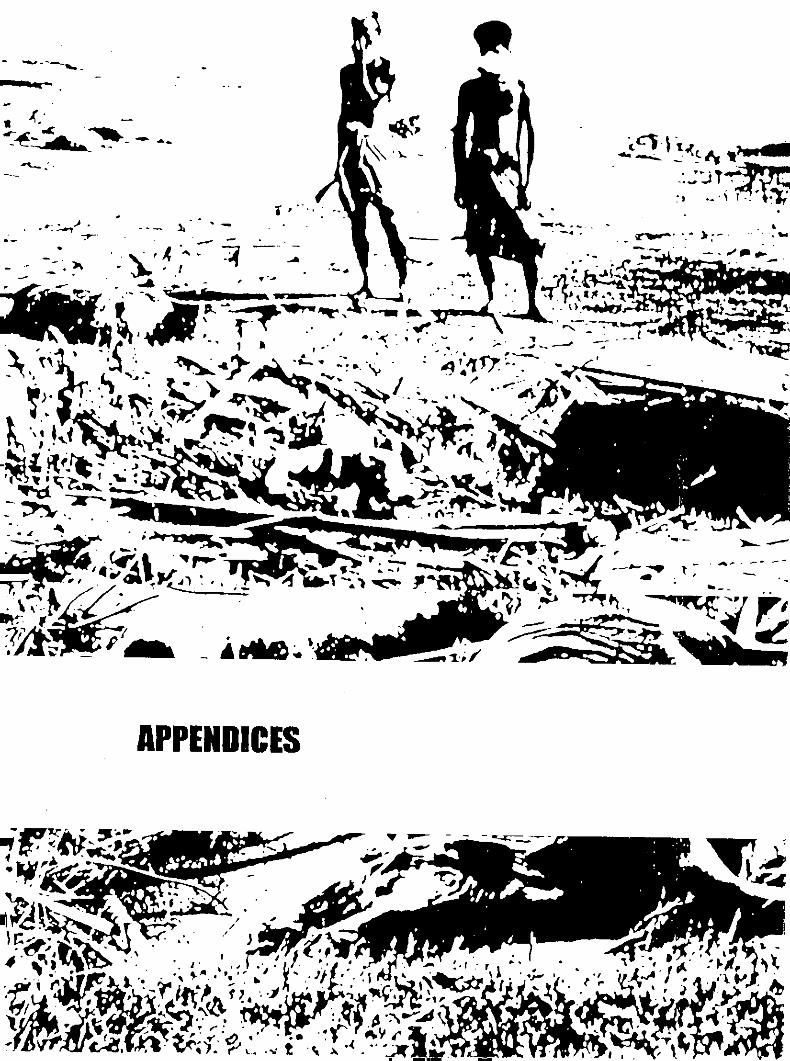
-~--
. .~' ..• It ~-" .", •••
.... -;';'-' -~"--".-,.~'~.A~-:-~::.I'...:._\I_~
.." ' ..
.1< ••• -
-. ~- .
••- -- -----.. -
APPENDICES
APPENDIX-I
BmuOGRAPIIY
BBS (1981), Bangladesh Census of Population. (Dhaka: Bangladesh Bureau ofStatistics).BBS (1983), Chittagong District Statistics. (Dhaka: Bangladesh Bureau ofStatistics).BBS (1985), Bangladesh population Census of 1981 (Thana series). ChittagongDistrict, (Dhaka: Bangladesh Bureau of Statistics).BBS (1989), Small Area Atlas of Bangladesh: Mauzas and Mahallahs of ChjttagongDistrict. (Dhaka: Bangladesh Bureau of Statistics).BBS (1990), Bangladesh Census of Non-farm Economic Activities 1986. (Dhaka:Bangladesh Bureau of Statistics).BBS (1991), Statistical Pocket Book of Bangladesh. (Dhaka: Bangladesh Bureauof Statistics).BBS (1991), Statistical Year Book of Bangladesh. (Dhaka: Bangladesh Bureau ofStatistics).BUET-BIDS (1992), Draft Final Report (Vol. IV. V. VIII. X. XI). MultipurposeCyclone Shelter Programme: World Bank/UNDP/GOB-Project (BGD/91/25), July,1992.BUET-BIDS (1993), Working Paper for National Seminar. Multipurpose CycloneShelter Programme: World Bank/UNDP/GOB-Project (BGD/91/025) January, 1993.BUET/BIDS, (1993): Multipurpose Cyclone Shelter Programme, Planning andImplementation Issues, Part-4, Volume-IV, UNDP/ World Bank and GOB Project,Dhaka.BUET/BIDS, (1993): Multipurpose Cyclone Shelter Programme, Planning andImplementation Issues, Part-I, Volume-I, UNDP/ World Bank and GOB Project,.Dhaka.Chiara, J.D. and Callender, J. (eds.)(1983), Time-Saver Standards for BuildingTypes (2nd edition), (Singapore: McGraw-Hill International Book Company).Ebdon, D, (1987), Statistics in Geography, (New York: Basil Blackwell).Hoque, M, (1991): Field Study and investigatjon on the Damage Caused byCyclones in Bangladesh: A Report on the April 1991 Cyclone, Cyclone Damage inBangladesh, UNCRD Report, Nagoya, Japan.Hoque, A, (1994): Cyclone Shelter Planning for Disaster Management andCommunity Development in Bangladesh: A Case Study of Khurashkul Union of Cox'sBazar Djstrict, an unpublished MURP Thesis, Department of URP, BUET, Dhaka,IEB (1991), Report on Task Force on Cyclone and Storm Surge, April 29-30.1991, Institution of Engineers", Bangladesh.
217Jahan, Sarwar (1991), Integrated Approach to Cyclone Disaster Management andRegional Development Planning, UNCRD report, Cyclone Damage in Bangladesh,Nagoya, Japan.Takahashi, Y. (1991): Characterist ics, Meanings and Countermeasures forCyclone Disaster in Bangladesh, Cyclone Damage in Bangladesh, UNCRD Report,Nagoya, Japan.Matsuda, I. (1991): Standing Problems in Countermeasures for Cyclone Disaster:How is it Possible to Help itself? Cyclone Damage in Bangladesh, UNCRD Report,Nagoya, Japan.Nishat, Ainun (1991): Environmental Issues Pertinent to the Recent Cyclone andStorm Surge and Cons iderations for Future Management Plans ADAB News-ADevelopmental Journal, Vol. XIX, No.2, April-June.Ohiduzzaman, Md. (1993), Socio-Economic and Environmental Effects of the 1991Cyclone in Coastal Bangladesh: A Local Level Analysis, an unpublished MURPthesis, BUET, Dhaka.Tennakoon, W. Dissanayeke, M. (1992): Mobilizing Local Level Potential.Abilities and Resources for Disaster Management Including Training Needs andTechniques in Development of Modules for Training on Integrated Approach toDisaster Management and Regional/Rural Development Planning, UNCRD, CIRDAP,Dhaka.U.N. Centre for Regional Development (1991), Cyclone Damage in Bangladesh,Report on Field Study and Investigations on the Damage Caused by the Cyclonein Bangladesh in 29-30 April 1991, UNCRD, Nagoya, Japan.UNDRO (1977), Disaster Prevention and Mitigation, A Compendium of CurrentKnowledge (Volume 5, Land Use Aspects), United Nations Disaster ReliefCoordinator, Geneva.UNDP/UNCHS, (1994): Draft Structure Plan For Chittagong, GOB Project,Bangladesh.UNDP/GOB, (1994): FAP-II, Assistance to Ministry Relief and Rehabilitation inConditions of Cyclone Rehabilitation,. Main Report, Volume I, Dhaka,Bangladesh.UNESCO (1980), Integrated Rural Development and the Role of Education, Report Iof the Bangladesh-UNESCO Field Operational Seminar held in Bangladesh, 4-19March 1979, UNESCO, Paris.UNIDO, (1977): Disaster Prevention and Mitigation, Vol.5, Land-use Aspect,United Nations, New York.Whittick, Arnold (ed.) (1974), Encyclopedia of Urban Planning, McGraw-HillBook Company, New York.

218APPENDIX-D
SAMPLE OF SURVEY QUESI10NNAIRE
QUESTIONNAIRE SURVEY IN THE VULNERABLE AREA OF CHITTAGONG CITYDepartment of Urban and Regional PlanningBangladesh University of Engineering and TechnologyDhaka-1000, BANGLADESH.Name of the Respondent:Address:------------------------Name of Head of the Household : _Relationship with the respondent: _01. Did you receive the cyclone warnings timely? If yes, mention the
sources'# Radio/TV# Chittagong City Corporation men (CCC man)# Both radio/TV and CCC man# Neighbors# Others if any, please specify _
02. (a) Did you stay in the house on the fateful night of 29th April,1991, if yes, (a) Why did not you leave house to take shelterany where receiving warnings timely?# Did not take warnings seriously# There was no cyclone shelter nearby# To guard the house# Did not move because of illness# Depended on God.# Others if any, please specify _
(b) How did you manage to survive during the surge attack?# Taking shelter on the upstairs of the same house# Taking shelter in the neighboring pucca house# On the household furniture# On the roof top of the house# Climbing on the tree# Others if any, please specify _
03. What was the level of storm surge inundation beside your house?# Less than 1.00 (3.28') meter.# More than 1.00 (3.28)' meter but less than 3.00
(9.84')meters.# More than 3.00 (9.84') meters. •
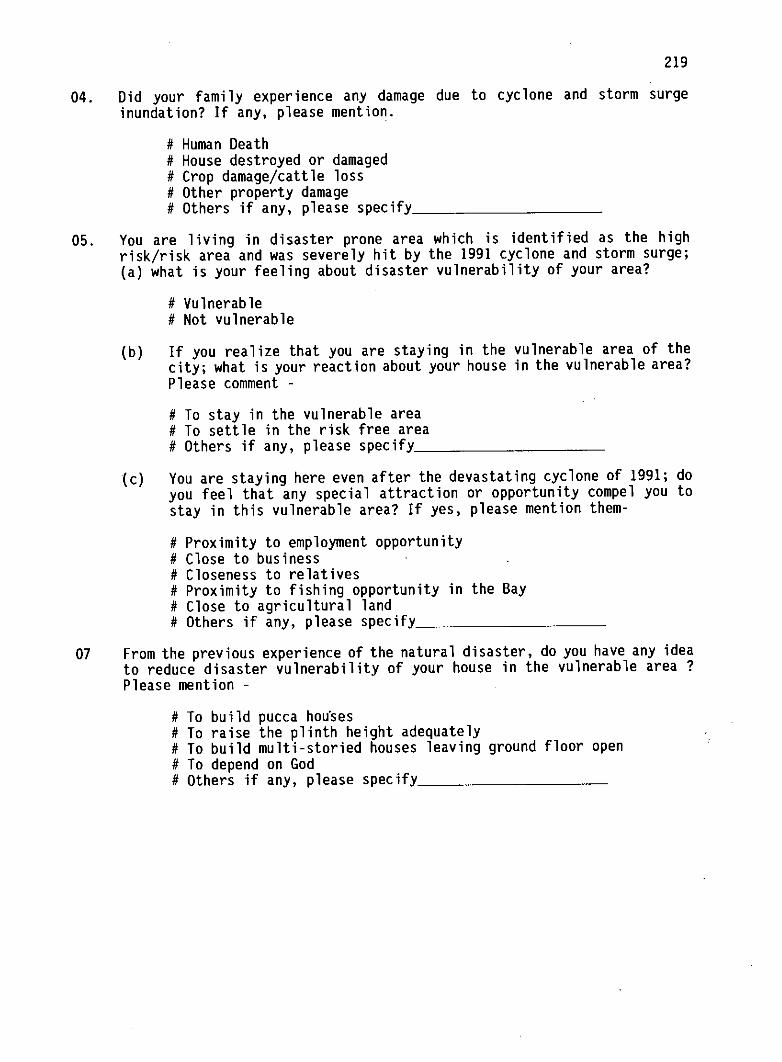
21904. Did your fami ly experience any damage due to cyclone and storm surge
inundation? If any, please mention.# Human Death# House destroyed or damaged# Crop damage/cattle loss# Other property damage# Others if any, please specify _
05. You are living in disaster prone area which is identified as the highrisk/risk area and was severely hit by the 1991 cyclone and storm surge;(a) what is your feeling about disaster vulnerability of your area?
# Vulnerable# Not vulnerable
(b) If you realize that you are staying in the vulnerable area of thecity; what is your reaction about your house in the vulnerable area?Please comment -# To stay in the vulnerable area# To settle in the risk free area# Others if any, please specify _
(c) You are staying here even after the devastating cyclone of 1991; doyou feel that any special attraction or opportunity compel you tostay in this vulnerable area? If yes, please mention them-# Proximity to employment opportunity# Close to business# Closeness to relatives# Proximity to fishing opportunity in the Bay# Close to agricultural land# Others if any, please specify _
07 From the previous experience of the natural disaster, do you have any ideato reduce disaster vulnerability of your house in the vulnerable area?Please mention -
# To build pucca houses# To raise the plinth height adequately# To build multi-storied houses leaving ground floor open# To depend on God# Others if any, please specify _
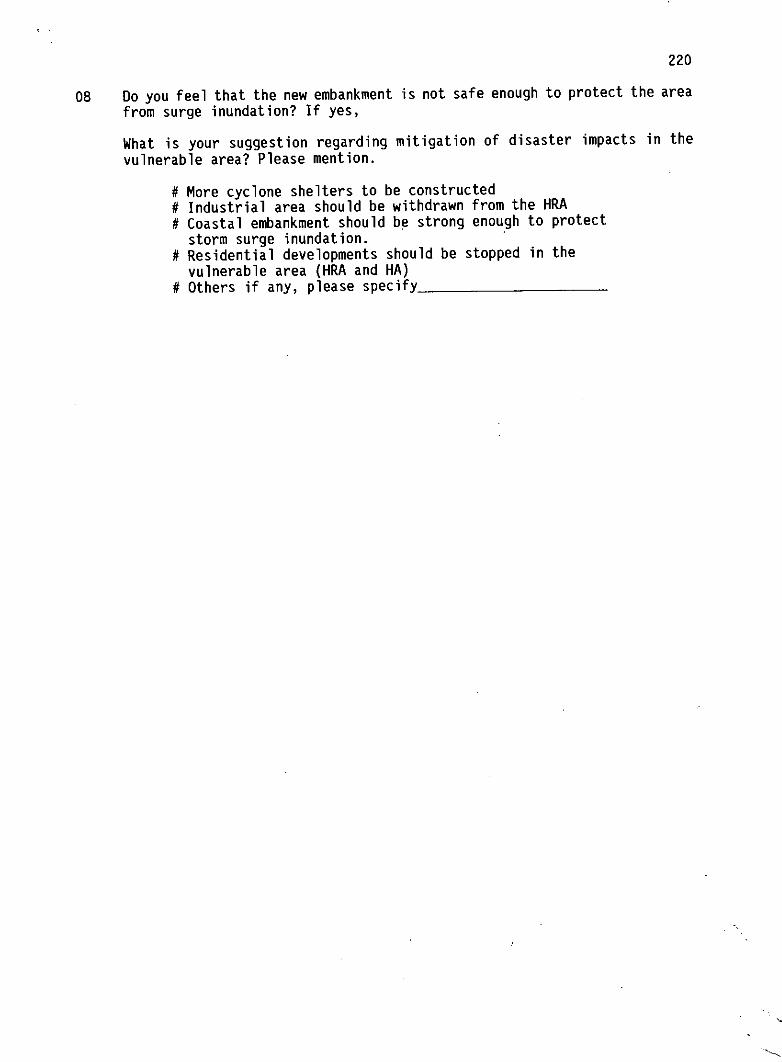
22008 Do you feel that the new embankment is not safe enough to protect the area
from surge inundation? If yes,What is your suggestion regarding mitigation of disaster impacts in thevulnerable area? Please mention.
# More cyclone shelters to be constructed# Industrial area should be withdrawn from the HRA# Coastal embankment should be strong enough to protect
storm surge inundation.# Residential developments should be stopped in the
vulnerable area (HRA and HA)# Others if any, please specify _
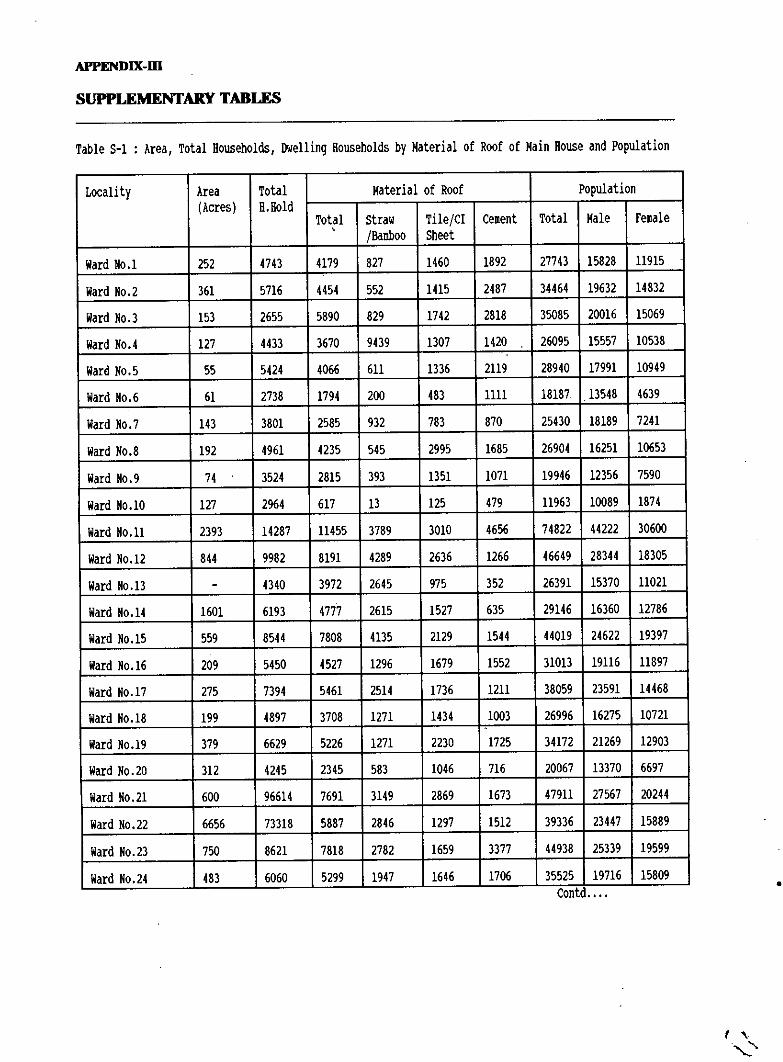
APPENDIX.m
SUPPLEMENTARY TABLES
Table 5-1 : Area, Total Households, Dwelling Households by Material of Roof of Main House and Population
Locality Area Total Material of Roof population(Acres) H.Hold
Total straw Tile/CI Cement Total Male Female• /BamboO Sheet
Ward NO.1 252 4743 4179 827 1460 1892 27743 15828 11915Ward NO.2 361 5716 4454 552 1415 2487 34464 19632 14832Ward NO.3 153 2655 5890 829 1742 2818 35085 20016 15069Ward NO.4 127 4433 3670 9439 1307 1420 26095 15557 10538Ward NO.5 55 5424 4066 611 1336 2119 28940 17991 10949Ward NO.6 61 2738 1794 200 483 1111 18187 13548 4639Ward NO.7 143 3801 2585 932 783 870 25430 18189 7241Ward NO.8 192 4961 4235 545 2995 1685 26904 16251 10653
Ward NO.9 74 3524 2815 393 1351 1071 19946 12356 7590Ward NO.I0 127 2964 617 13 125 479 11963 10089 1874Ward NO.11 2393 14287 11455 3789 3010 4656 74822 44222 30600Ward NO.12 844 9982 8191 4289 2636 1266 46649 28344 18305Ward NO.13 - 4340 3972 2645 975 352 26391 15370 11021Ward NO.14 1601 6193 4777 2615 1527 635 29146 16360 12786Ward NO.15 559 8544 7808 4135 2129 1544 44019 24622 19397
Ward NO.16 209 5450 4527 1296 1679 1552 31013 19116 11897Ward NO.17 275 7394 5461 2514 1736 1211 38059 23591 14468Ward NO.18 199 4897 3708 1271 1434 1003 26996 16275 10721Ward NO.19 379 6629 5226 1271 2230 1725 34172 21269 12903Ward NO.20 312 4245 2345 583 1046 716 20067 13370 6697Ward NO.21 600 96614 7691 3149 2869 1673 47911 27567 20244Ward NO.22 6656 73318 5887 2846 1297 1512 39336 23447 15889Ward NO.23 750 8621 7818 2782 1659 3377 44938 25339 19599Ward NO.24 483 6060 5299 1947 1646 1706 35525 19716 15809
Contd •••• •

222
Locality Area Total Material of Roof Population(Acres) H.Hold
Total straw TilefC Cement Total Male FemalefBambo I0 Sheet
Ward No.25 843 12865 11359 3861 2222 5276 72363 40968 31395Ward NO.26 1589 5732 4632 2212 1752 668 33388 18624 14764Ward NO.27 2557 7693 6942 1955 3192 1795 44477 23984 20493Ward NO.28 2243 10272 7445 3267 2886 1292 47843 28783 19060Ward NO.29 538 2767 2607 631 1359 6179 16021 87161 73059Ward NO.30 673 4232 4085 2001 1666 4181 26189 14011 12178Ward NO.31 583 7252 6558 1997 2471 2090 40890 22181 18709Ward NO.32 1346 9365 7938 4545 2031 1362 47833 28221 19612Ward No.33 447 4127 3833 1448 1158 1231 22885 12157 10728Ward NO.34 1132 3606 3010 1117 1423 470 21338 13031 8317Ward NO.35 1087 43117 39885 1752 1299 937 23404 12677 10727Ward NO.36 1296 4849 4314 1631 1081 1602 28071 15676 12396Ward NO.37 1012 5857 5621 8225 1836 2963 36291 20210 16081Ward NO.38 1518 6523 5773 1082 3382 1309 40373 22611 17762Ward NO.39 1857 9118 7690 1569 3533 2588 52099 30390 21709Ward NO.40 2327 8004 6549 1738 2106 2705 44622 25809 18813Ward NO.41 4315 4928 4602 2512 936 1154 36709 20949 15756Total 42167 259640 214915 75117 72445 67357 1428593 20949 15756
Source: BBS, 1992.
r:,

Table S-2 : Population 10 Years and over by Main activity.
223
Locality Total Not Househo Agri. Indus. Const. Trans. Business Service othersworking ld work
Ward NO.1 21074 4917 4987 55 117 136 377 2266 722. 7497
Ward NO.2 27486 7690 6754 56 568 187 256 3110 1027 7838
Ward NO.3 27520 49746 7961 42 728 399 599 4204 1450 7163
Ward NO.4 20314 4685 4762 57 752 82 266 3562 414 5734
Ward NO.5 22998 4693 5523 53 286 115 629 4289 415 6995
Ward No.6 15441 4029 2141 210 36 30 120 2645 287 5941
Nard NO.7 20539 3394 3068 71 129 73 302 4700 304 8498
Nard NO.8 21332 4758 4677 29 192 155 371 3214 707 7229
Ward NO.9 15537 4094 3111 85 3 45 98 2896 139 5066
Ward NO.I0 10576 1223 865 10 8 4 39 2988 64 5375
Ward NO.ll 57413 13602 13063 255 4870 1177 1589 5042 1366 16449
Ward NO.12 34362 6140 8090 85 6265 450 849 2802 666 9015
Ward NO.13 '. 39118 4035 5961 963 439 135 458 900 203 6024
Ward 110.14 21202 4646 5234 270 4206 J27 737 1561 424 3797
Ward NO.15 31171 5934 8789 79 457 492 2484 2851 462 9623
Nard NO.16 24322 3919 5829 34 458 192 2113 3624 353 7800
Ward NO.17 28316 3755 7262 71 2169 475 1996 5486 461 6641
Nard NO.18 19960 4165 4461 23 695 242 886 3717 475 5296
Ward NO.39 26528 5168 6012 26 701 291 87134 3743 1436 8280
Ward NO.20 16215 3m 2924 20 107 95 508 1685 148 7356
Ward NO.21 33795 9019 9100 158 2618 807 2812 4156 432 4693
Ward NO.n 27933 5815 7076 149 7314 J19 1899 1987 451 2923
Ward NO.23 30641 8123 7906 62 1067 590 3094 2000 520 7279
Ward NO.24 25973 7004 7364 76 902 302 1350 2761 645 5569
Contd •.•.
li
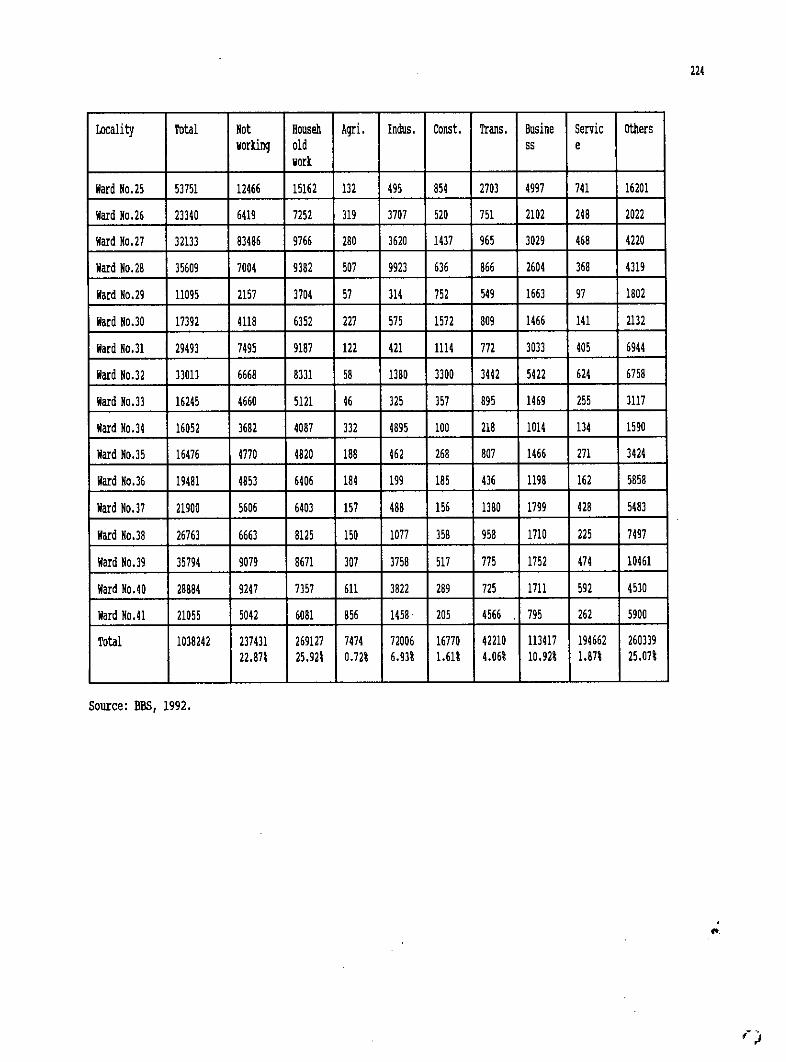
Locality Total Not Househ Agri. Indus. Const. Trans. Busine servic othersworking old ss e
workWard NO.25 53751 12466 15162 132 495 854 2703 4997 741 16201Ward NO.26 23340 6419 7252 319 3707 520 751 2102 248 2022Ward NO.27 32133 83486 9766 280 3620 1437 965 3029 468 4220Ward NO.28 35609 7004 9382 507 9923 636 866 2604 368 4319Ward NO.29 11095 2157 3704 57 314 752 549 1663 97 1802Ward NO.30 17392 4118 6352 227 575 1572 809 1466 141 2132Ward NO.31 29493 7495 9187 122 421 1114 712 3033 405 6944Ward NO.32 33013 6668 8331 58 1380 3300 3442 5422 624 6758Ward NO.33 16245 4660 5121 46 325 357 895 1469 255 3117Ward NO.34 16052 3682 4087 332 4895 100 218 1014 134 1590Ward NO.35 16476 4770 4820 188 462 268 807 1466 271 3424Ward NO.36 19481 4853 6406 184 199 185 436 1198 162 5858Ward NO.37 21900 5606 6403 157 488 156 1380 1799 428 5483Ward NO.38 26763 6663 8125 150 1077 358 958 1710 225 7497Ward NO.39 35794 9079 8671 307 3758 517 775 1752 474 10461Ward NMO 28884 9247 7357 611 3822 289 125 1711 592 4530Ward NO.41 21055 5042 6081 856 1458 205 4566 795 262 5900Total 1038242 237431 269127 7474 72006 16770 41110 11J417 194662 260339
22.m 25.921 0.721 6.931 l.m 4.061 10.921 l.871 25.071
Source: BBS, 1992.
224
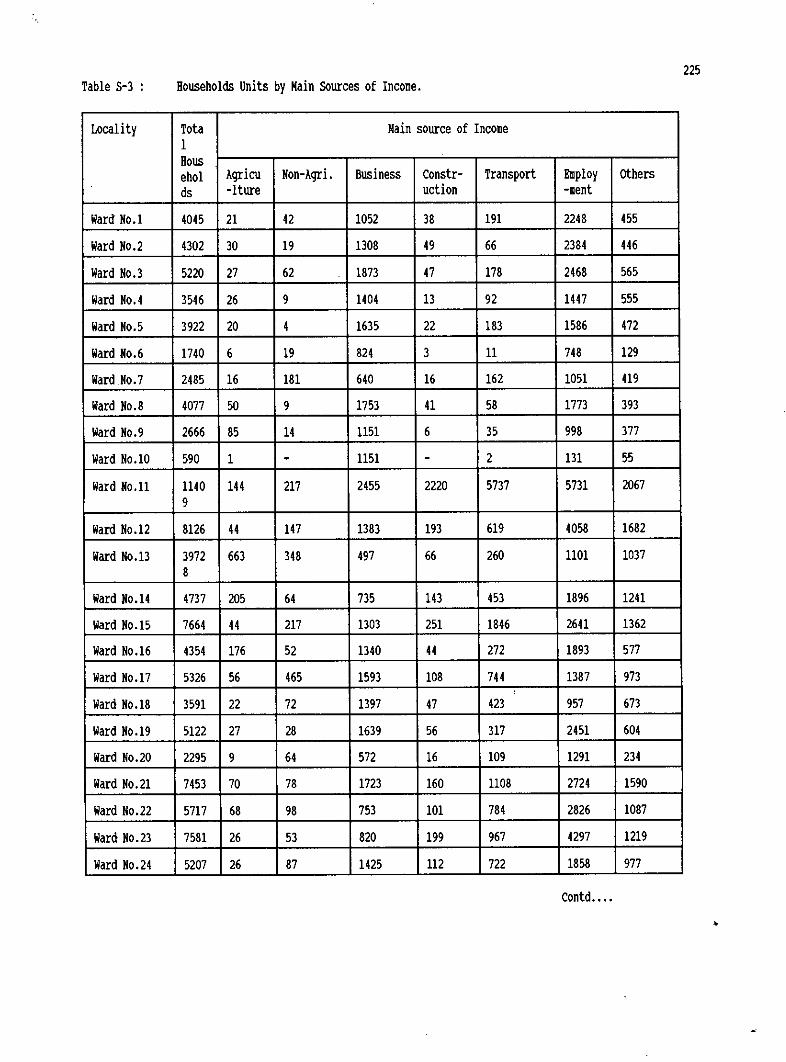
Table 5-3 : Households units by Main Sources of Income.225
Locality Tota Main source of Income1Househol Agricu Non-Agri. Business Constr- Transport Employ othersds -lture uction -ment
Ward NO.1 4045 21 42 1052 38 191 2248 455Ward NO.2 4302 30 19 1308 49 66 2384 446Ward NO.3 5220 27 62 . 1873 47 178 2468 565Ward NO.4 3546 26 9 1404 13 92 1447 555Ward NO.5 3922 20 4 1635 22 183 1586 472Ward NO.6 1740 6 19 824 3 11 748 129Ward.No.7 2485 16 181 640 16 162 1051 419Ward NO.8 4077 50 9 1753 41 58 1773 393Ward NO.9 2666 85 14 1151 6 35 998 377Ward NO.10 590 1 - 1151 - 2 131 55Ward NO.11 1140 144 217 2455 2220 5737 5731 2067
9Ward NO.12 8126 44 147 1383 193 619 4058 1682Ward NO.13 3972 663 348 497 66 260 1101 1037
8Ward NO.14 4737 205 64 735 143 453 1896 1241Ward NO.15 7664 44 217 1303 251 1846 2641 1362Ward NO.16 4354 176 52 1340 44 272 1893 577Ward NO.17 5326 56 465 1593 108 744 1387 973
,Ward NO.18 3591 22 72 1397 47 423 957 673Ward NO.19 5122 27 28 1639 56 317 2451 604Ward NO.20 2295 9 64 572 16 109 1291 234Ward NO.21 7453 70 78 1723 160 1108 2724 1590Ward NO.22 5717 68 98 753 101 784 2826 1087Ward NO.23 7581 26 53 820 199 967 4297 1219Ward NO.24 5207 26 87 1425 112 722 1858 977
Contd •••••
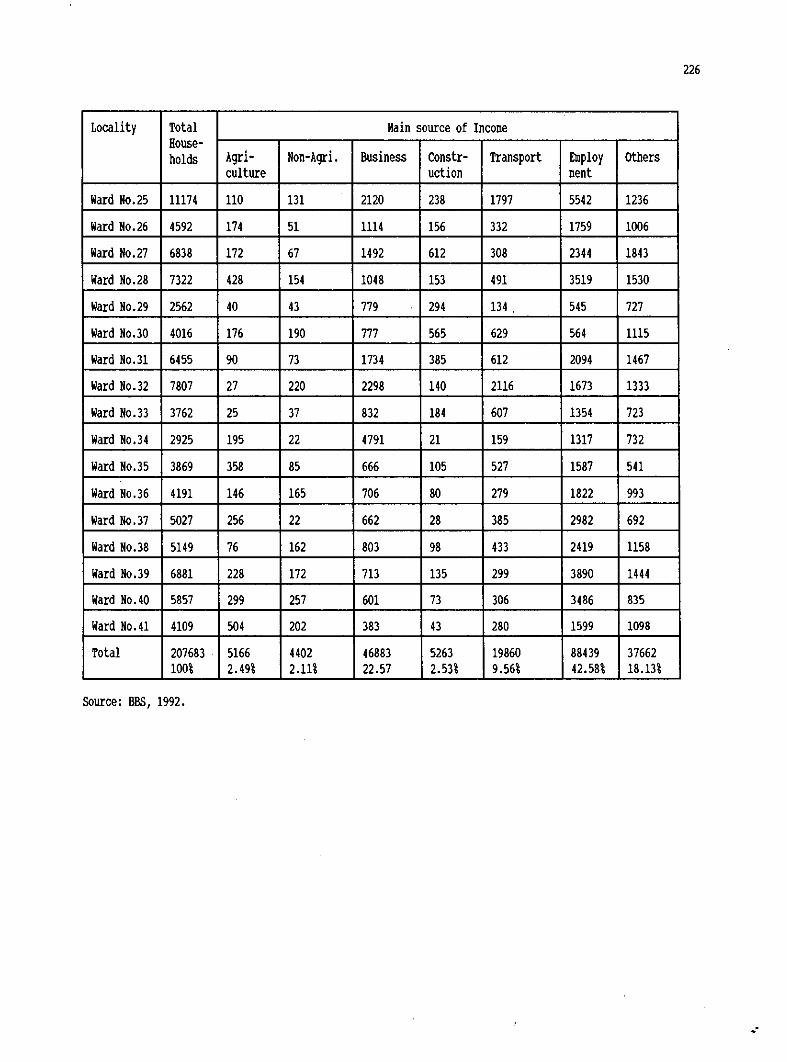
Locality Total Main source of IncomeHouse-holds Agri- Non-Agri. Business Constr- Transport Employ others
culture uction mentWard Ho.25 11174 110 131 . 2120 238 1797 5542 1236Ward NO.26 4592 174 51 1114 156 332 1759 1006Ward NO.27 6838 172 67 1492 612 308 2344 1843Ward NO.28 7322 428 154 1048 153 491 3519 1530Ward NO.29 2562 40 43 779 294 134 , 545 727Ward NO.30 4016 176 190 777 565 629 564 1115Ward NO.3l 6455 90 73 1734 385 612 2094 1467Ward NO.32 7807 27 220 2298 140 2116 1673 1333Ward NO.33 3762 25 37 832 184 607 1354 723Ward NO.34 2925 195 22 4791 21 159 1317 732Ward NO.35 3869 358 85 666 105 527 1587 541Ward NO.36 4191 146 165 706 80 279 1822 993Ward Ho.37 5027 256 22 662 28 385 2982 692Ward NO.38 5149 76 162 803 98 433 2419 1158Ward NO.39 6881 228 172 713 135 299 3890 1444Ward NO.40 5857 299 257 601 73 306 3486 835Ward NO.41 4109 504 202 383 43 280 1599 1098Total 207683 . 5166 4402 46883 5263 19860 88439 37662
100% 2.49% 2.11% 22.57 2.53% 9.56% 42.58% 18.13%
Source: BBS, 1992.
226
,"
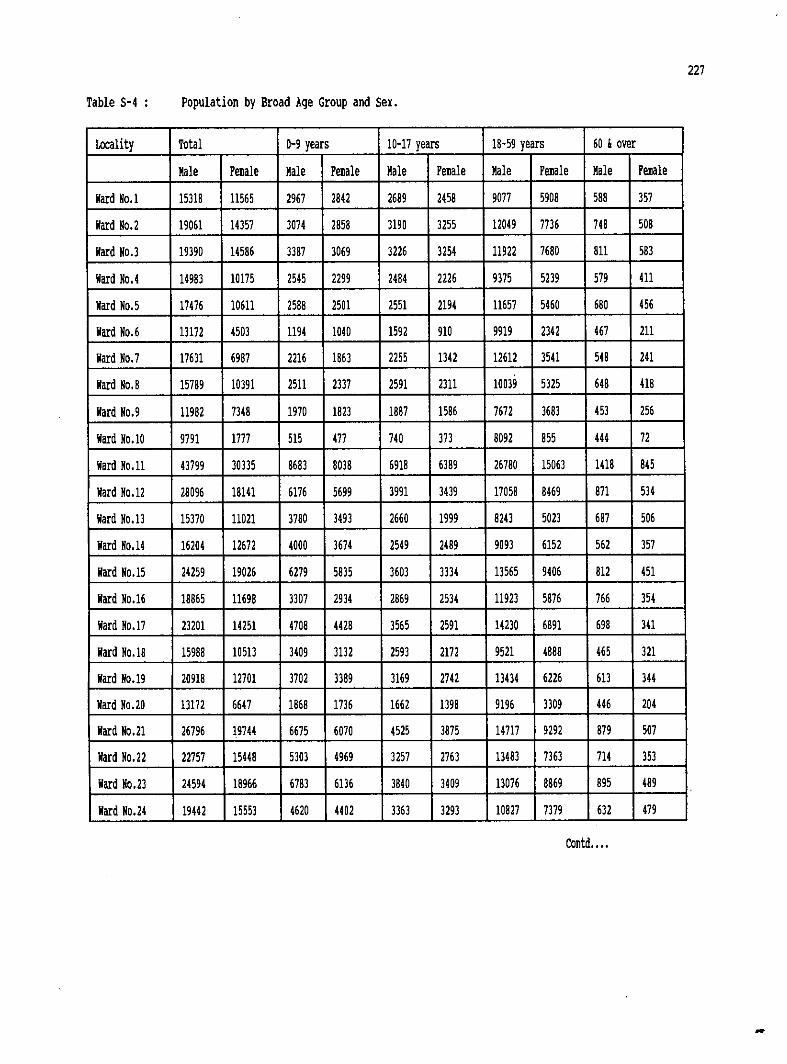
Table S-4 : Population by Broad Age Group and Sex.
227
Locality Total 0-9 years 10-17 years 18-59 years 60 loverMale FeJlale Male FeJlale Male FeDale Male FeJlale Male FeJlale
Nard NO.1 15318 11565 2967 2842 2689 2458 9077 5908 588 357Nard NO.2 19061 14357 3074 2858 3190 3255 12049 7736 748 508Nard NO.3 19390 14586 3387 3069 3226 3254 11922 7680 B11 583Ward NO.4 14983 10175 2545 2299 2484 2226 9375 5239 579 411Ward NO.5 17476 10611 2588 2501 2551 2194 11657 5460 680 456Ward NO.6 13172 4503 1194 1040 1592 910 9919 2342 467 211Nard NO.7 17631 6987 2216 1863 2255 1342 12612 3541 548 241Nard NO.8 15789 10391 2511 2337 2591 2311 10039 5325 648 418Nard NO.9 11982 7348 1970 1823 1887 1586 7672 3683 453 256Nard NO.10 9791 1777 515 477 740 373 8092 855 444 72Ward No.11 43799 30335 8683 8038 6918 6389 26780 15063 1418 845Ward NO.12 28096 18141 6176 5699 3991 3439 17058 8469 871 534Nard NO.13 15370 11021 3780 3493 2660 1999 8243 5023 687 506Ward NO.14 16204 12672 4000 3674 2549 2489 9093 6152 562 357Nard NO.15 24259 19026 6279 5835 3603 3334 13565 9406 812 451Ward NO.16 18865 11698 3307 2934 2869 2534 11923 5876 766 354Ward NO.17 23201 14251 4708 4428 3565 2591 14230 6891 698 341Nard NO.18 15988 10513 3409 3132 2593 2172 9521 4888 465 321Nard NO.19 20918 12701 3702 3389 3169 2742 13434 6226 613 344Ward NO.20 13172 6647 1868 1736 1662 1398 9196 3309 446 204Ward NO.21 26796 19744 6675 6070 4525 3875 14717 9292 879 507Nard NO.22 22757 15448 5303 4969 3257 2763 13483 7363 714 353Ward 110.23 24594 18966 6783 6136 3840 3409 13076 8869 895 489Nard NO.24 19442 15553 4620 4402 3363 3293 10827 7379 632 479
Contd••••
-
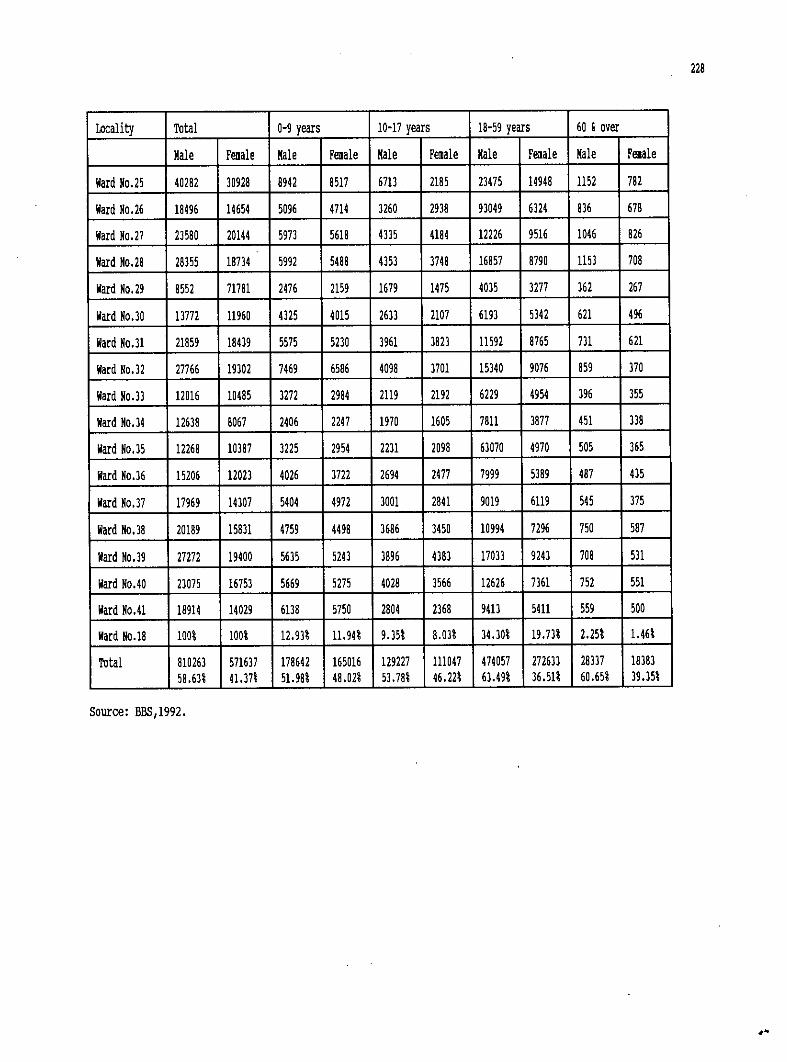
Locality Total 0-9 years 10-17 years 18-59 years 60 & over
Male Fenale Male Female Male Female Male Fenale Male Fenale
Ward NO.25 40282 30928 8942 8517 6713 2185 23475 14948 1152 782
Ward NO.26 18496 14654 5096 4714 3260 2938 93049 6324 836 678
Ward NO.27 23580 20144 5973 5618 4335 4184 12226 9516 1046 826
Ward NO.28 28355 18734 5992 5488 4353 3748 16857 8790 1153 708
Ward NO.29 8552 71781 2476 2159 1679 1475 4035 3277 362 267
Ward No.30 13772 11960 4325 4015 2633 2107 6193 5342 621 496
Ward NO.31 21859 18439 5575 5230 3961 3823 11592 8765 731 621
Ward NO.32 27766 19302 7469 6586 4098 3701 15340 9076 859 370
Ward NO.33 12016 10485 3272 2984 2119 2192 6229 4954 396 355
Ward NO.34 12638 8067 2406 2247 1970 1605 7811 3877 451 338
Ward No.35 12268 10387 3225 2954 2231 2098 63070 4970 505 365
Ward NO.36 15206 12023 4026 3722 2694 2477 7999 5389 487 435
Ward NO.37 17969 14307 5404 4972 3001 2841 9019 6119 545 375
Ward NO.38 20189 15831 4759 4498 3686 3450 10994 7296 750 587
Ward NO.39 27272 19400 5635 5243 3896 4383 17033 9243 708 531
Ward NO.40 23075 16753 5669 5275 4028 3566 12626 7361 752 551
Ward NO.41 18914 14029 6138 5750 2804 2368 9413 5411 559 500
Ward NO.18 100\ 1001 12.93\ 11. 941 9.35% 8.03\ 34.30\ 19.m 2.251 1.461
Total 810263 571637 178642 165016 129227 111047 474057 272633 28337 1838358.631 41.37\ 51. 981 48.02\ 53.78\ 46.22\ 63.49\ 36.51\ 60.651 39.35\
Source: BBS,1992.
228
.-
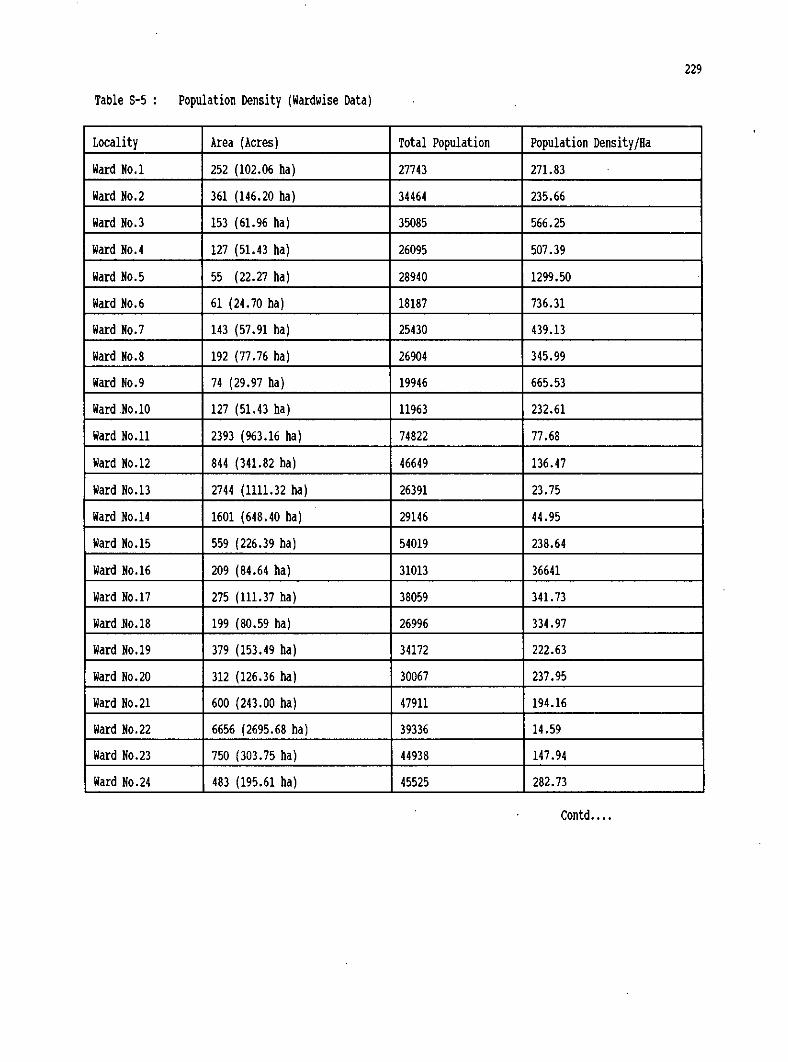
Table 5-5: Population Density (Wardwise Data)
229
Locality Area (Acres) Total Population Population DensityjBaWard NO.1 252 (102.06 hal 27743 271.83Ward NO.2 361 (146.20 hal 34464 235.66Ward NO.3 153 (61.96 hal 35085 566.25Ward NO.4 127 (51.43 hal 26095 507.39Ward NO.5 55 (22.27 hal 28940 1299.50Ward NO.6 61 (24.70 hal 18187 736.31Ward No.7 143 (57.91 hal 25430 439.13Ward NO.8 192 (77.76 hal 26904 345.99Ward NO.9 74 (29.97 hal 19946 665.53Ward.No.10 127 (51.43 hal 11963 232.61Ward NO.11 2393 (963.16 hal 74822 77.68Ward NO.12 844 (341.82 hal 46649 136.47Ward NO.13 2744 (1111.32 hal 26391 23.75
.
Ward NO.14 1601 (648.40 hal 29146 44.95Ward NO.15 559 (226.39 hal 54019 238.64Ward NO.16 209 (84.64 hal 31013 36641Ward NO.17 275 (111.37 ha) 38059 341.73Ward 110.18 199 (80.59 hal 26996 334.97Ward NO.19 379 (153.49 hal 34172 222.63Ward NO.20 312 (126.36 hal 30067 237.95Ward NO.21 600 (243.00 hal 47911 194.16Ward NO.22 6656 (2695.68 hal 39336 14.59Ward NO.23 750 (303.75 hal 44938 147.94Ward NO.24 483 (195.61 hal 45525 282.73
Contd ••••
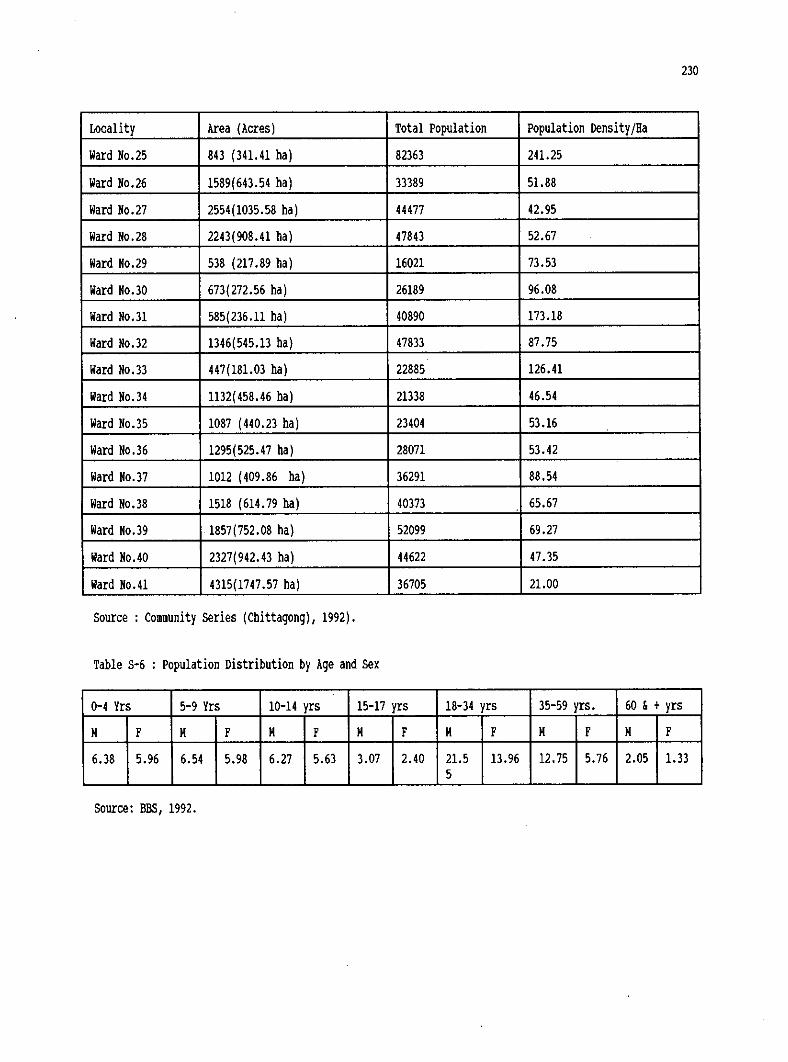
230
Locality Area (Acres) Total Population population Density/BaWard NO.25 843 (341.41 ha) 82363 241.25Ward NO.26 1589(643.54 hal 33389 51.88Ward NO.27 2554(1035.58 hal 44477 42.95Ward NO.28 2243(908.41 hal 47843 52.67Ward NO.29 538 (217.89 hal 16021 73.53Ward NO.30 673(272.56 hal 26189 96.08Ward NO.31 585(236.11 hal 40890 173.18Ward NO.32 1346(545.13 hal 47833 87.75Ward NO.33 447(181.03 hal 22885 126.41Ward NO.34 1132 (458.46 hal 21338 46.54Ward NO.35 1087 (440.23 hal 23404 53.16Ward NO.36 1295(525.47 hal 28071 53.42Ward NO.37 1012 (409.86 hal 36291 88.54Ward NO.38 1518 (614.79 hal 40373 65.67Ward NO.39 1857(752.08 hal 52099 69.27Ward NO.40 2327(942.43 hal 44622 47.35Ward NO.41 4315(1747.57 hal 36705 21.00
Source: Community Series (Chittagong), 1992).
Table S-6 : Population Distribution by Age and Sex
0-4 Yrs 5-9 Yrs 10-14 yrs 15-17 yrs 18-34 yrs 35-59 yrs. 60&+yrsH F H F H F H F H F H F H F
6.38 5.96 6.54 5.98 6.27 5.63 3.07 2.40 21.5 13.96 12.75 5.76 2.05 1.335
Source: BBS, 1992.
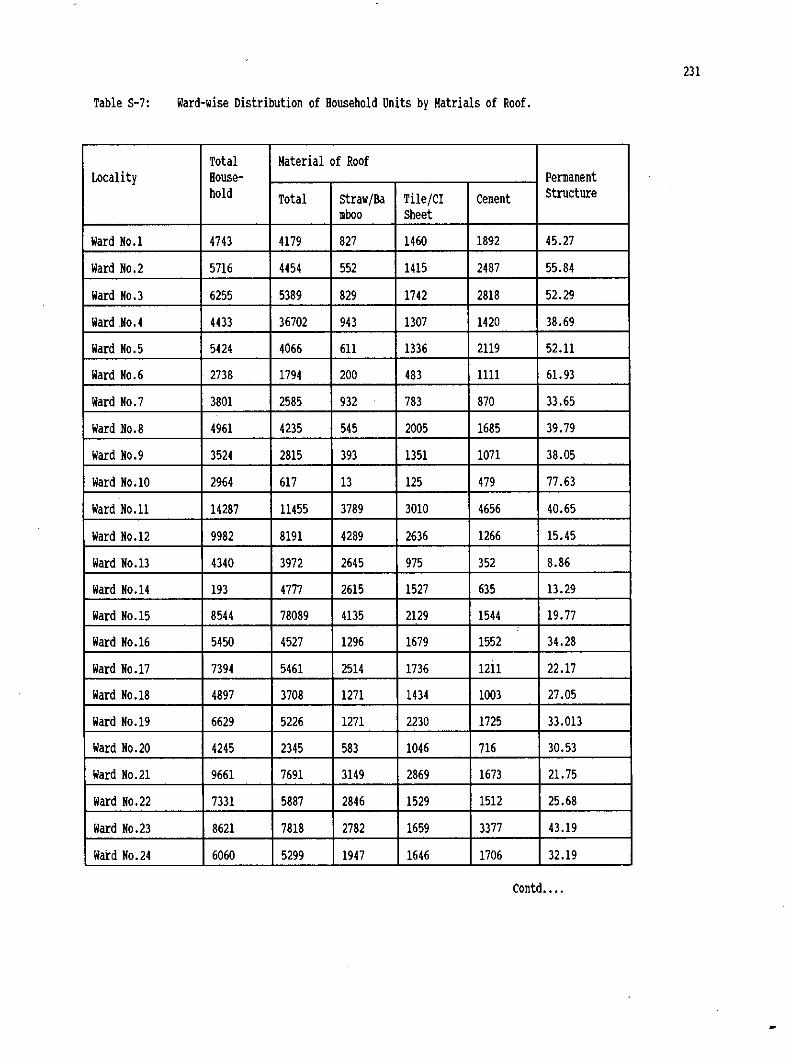
Table S-7: Ward-wise Distribution of Household units by Matrials of Roof.
231
Total Material of RoofLocality House- Permanent
hold Total strawfBa TilefCI Cement structuremboo Sheet
Ward NO.1 4743 4179 827 1460 1892 45.27Ward NO.2 5716 4454 552 1415 2487 55.84Ward NO.3 6255 5389 829 1742 2818 52.29Ward NO.4 4433 36702 943 1307 1420 38.69Ward NO.5 5424 4066 611 1336 2119 52.11Ward NO.6 2738 1794 200 483 1111 61.93Ward NO.7 3801 2585 932 783 870 33.65Ward 110.8 4961 4235 545 2005 1685 39.79Ward 110.9 3524 2815 393 1351 1071 38.05Ward No.1O 2964 617 13 125 479 77.63
.
Ward 110.11 14287 11455 3789 3010 4656 40.65Ward 110.12 9982 8191 4289 2636 1266 15.45Ward 110.13 4340 3972 2645 975 352 8.86Ward NO.14 193 4777 2615 1527 635 13.29Ward NO.15 8544 78089 4135 2129 1544 19.77Ward NO.16 5450 4527 1296 1679 1552 34.28Ward 110.17 7394 5461 2514 1736 1211 22.17Ward NO.18 4897 3708 1271 1434 1003 27.05Ward NO.19 6629 5226 1271 2230 1725 33.013Ward 110.20 4245 2345 583 1046 716 30.53Ward NO.21 9661 7691 3149 2869 1673 21.75Ward 110.22 7331 5887 2846 1529 1512 25.68Ward NO.23 8621 7818 2782 1659 3377 43.19Ward NO.24 6060 5299 1947 1646 1706 32.19
Contd ••••
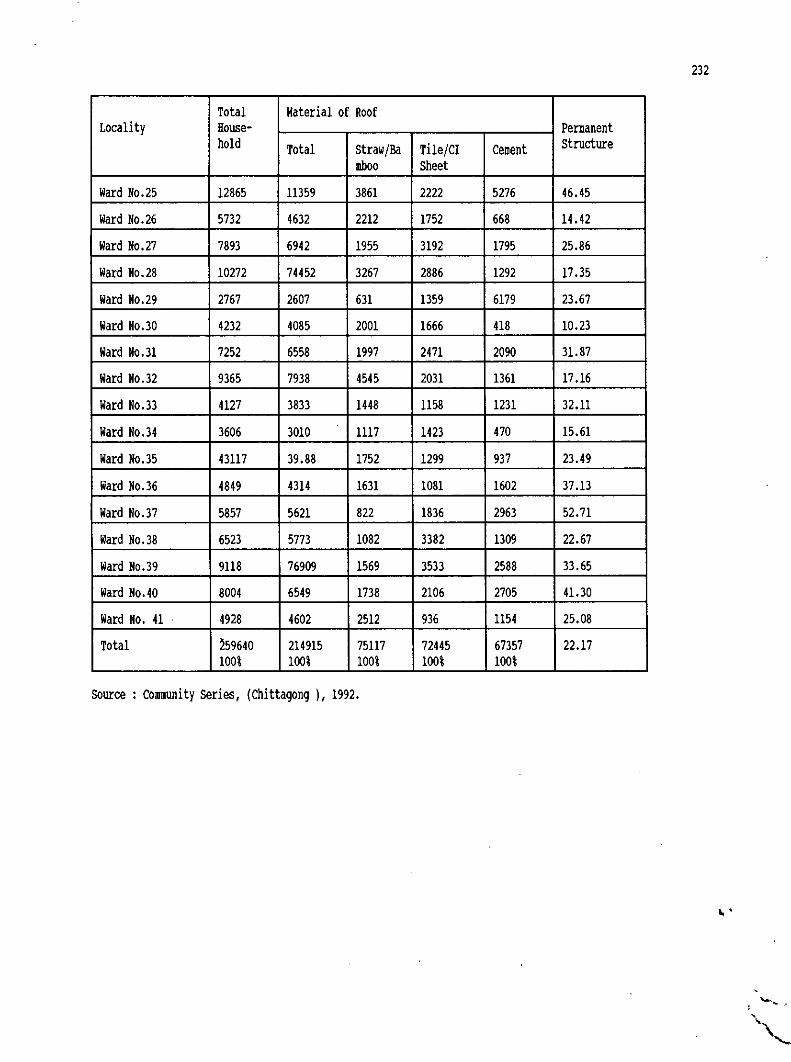
Total Material of RoofLocality House- PerJlanent
hold Total Straw/Ba Tile/CI Cement structuremboo Sheet
Ward NO.25 12865 11359 3861 2222 5276 46.45Ward NO.26 5732 4632 2212 1752 668 14.42Ward No.27 7893 6942 1955 .3192 1795 25.86Ward NO.28 10272 74452 3267 2886 1292 17.35Ward NO.29 2767 2607 631 1359 6179 23.67Ward NO.30 4232 4085 2001 1666 418 10.23Ward No.31 7252 6558 1997 2471 2090 31.87Ward NO.32 9365 7938 4545 2031 1361 17.16Ward NO.33 4127 3833 1448 1158 1231 32.11Ward NO.34 3606 3010 1117 1423 470 15.61Ward No.35 43117 39.88 1752 1299 937 23.49Ward NO.36 4849 4314 1631 1081 1602 37.13Ward NO.37 5857 5621 822 1836 2963 52.71Ward NO.38 6523 5773 1082 3382 1309 22.67Ward NO.39 9118 76909 1569 3533 2588 33.65Ward NO.40 8004 6549 1738 2106 2705 41.30Ward No. 41 . 4928 4602 2512 936 1154 25.08Total ~59640 214915 75117 72445 67357 22.17
100% 100% 100% 100% 100%
Source: Community Series, (Chittagong ), 1992.
232
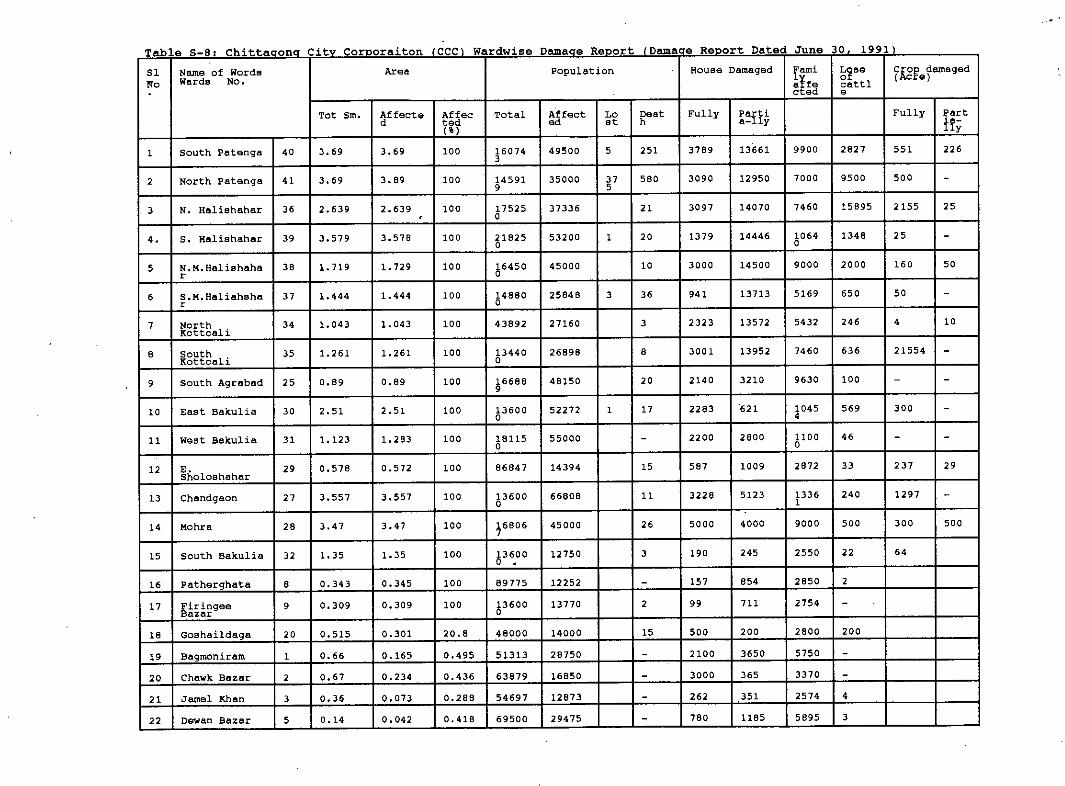
Table 5-8: Chitta"ona City Cornoraiton Ieee' Wardwise DamaNa Re•...ort fDama e ReDort Datea June ,jU .1~~.1'
81 Name of Words Araa Population House Damaged lami ~~8e Crop damagedNo Wards No. at£e cattl
(Acre). eted a
Tot Sm. affecte Aiiee Total Affect Lo Deat Fully Parti Fully :Jil8rtted ad at h a-lly ify(' )
1 South Patenga 40 3.69 3.69 100 16074 49500 5 251 3789 13661 9900 2827 551 2263
2 North patenga 41 3.69 3.89 100 14591 35000 37 580 3090 12950 7000 9500 500 -9 5
3 N. Haliahahar 36 2.639 2.639 100 17525 37336 21 3097 14070 7460 15895 2155 25, a
4. S. Haliahahar 39 3.579 3.578 100 21825 53200 1 20 1379 14446 5°64 1348 25 -a
5 N.M.Halishaha 38 L 719 1.729 100 16450 45000 10 3000 14500 9000 2000 160 50r a
6 S.M.Haliahaha 37 1.444 1.444 100 14880 25848 3 36 941 13713 5169 650 50 -r a
7 North 34 1.043 1.043 100 43892 27160 3 2323 13572 5432 246 4 10Kottoali
8 South 35 1.261 1.261 100 13440 26898 8 3001 13952 7460 636 21554 -Kottoali a
9 South Agrabad 25 0.89 0.89 100 16688 48150 20 2140 3210 9630 100 - -9
10 East Baltulia 30 2.51 2.51 100 13600 52272 1 17 2283 "621 1045 569 300 -0 4
11 West Baltulia 31 1.123 1.283 100 18115 55000 - 2200 2800 1100 46 - -0 a
12 E. 29 0.578 0.572 100 86847 14394 15 587 1009 2872 33 237 29sholoshahar
13 chandgaon 27 3.557 3.557 100 13600 66808 11 3228 5123 1336 240 1297 -a 1
14 Mohra 28 3.47 3.47 100 16806 45000 26 5000 4000 9000 500 300 5007
15 South Baltulia 32 1.35 1.35 100 13600 12750 3 190 245 2550 22 64a .
16 patherghata 8 0.343 0.345 100 89775 12252 - 157 854 2850 2
17 Firingee 9 0.309 0.309 100 13600 13770 2 99 711 2754 -Bazar a
18 Goshaildaga 20 0.515 0.301 20.8 48000 14000 15 500 200 2800 200
19 Bagrnonirarn 1 0.66 0.165 0.495 51313 28750 - 2100 3650 5750 -20 Chawlt Bazar 2 0.67 0.234 0.436 63879 16850 - 3000 365 3370 -21 Jamal Khan 3 0.36 0.073 0.288 54697 12873 - 262 351 2574 4
22 Dewan Bazar 5 0.14 0.042 0.418 69500 29475 - 780 1185 5895 3
.
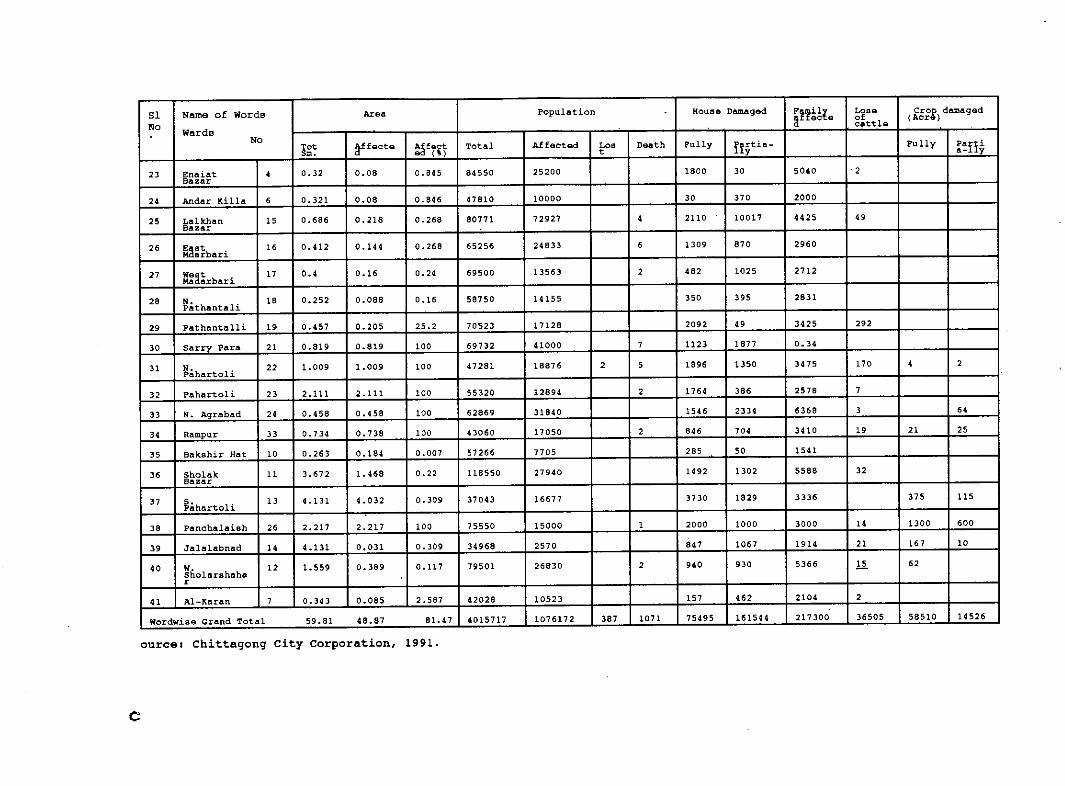
51 Name of Words Aro. Population House Dam4ged F~f1 Lose (ig~g)damagedNo Warda
~ ~cte gittleNo
~fectQ AffectedTot ~~f(lr Total Lo. Death Fully iiytia- Fully ~~n~Sm. t
23 Enaiat • 0.32 0.08 0.645 84550 25200 1800 30 5040 2Bazar
2. Andar Kill", 6 0.321 0.08 0.846 47810 10000 30 370 2000
25 Lalkhan 15 0.686 0.218 0.268 80771 72927 • 2110 ' 10017 4425 .9Bazar
26 ~a:ibari 16 0.412 0.144 0.268 65256 24633 6 1309 870 2960
27::~~rbari
17 0.' 0.16 0.24 69500 13563 2 .82 1025 2712
28 ~;thantali 18 0.252 0.088 0.16 58750 14155 350 395 2831
29 Pathantalli 19 0.457 0.205 25.2 70523 17128 2092 .9 3425 292
30 Sarry Para 21 0.619 0.819 100 69732 41000 7 1123 1877 . 0.34
31~';hartoli
22 1.009 1.009 100 47281 18876 2 5 1696 1350 3475 170 • 2
32 Pahartoli 23 2.111 2.111 100 55320 12894 2 1764 386 2578 7
33 N. Agrabad 2. Q.458 0.458 100 62869 31840 1546 2334 6368 3 6.
34 Rampur 33 Q. 7 34 0.138 100 43060 11050 2 8.6 70. 3410 19 21 25
35 Bakshir Hat 10 0.263 0.184 0.001 51266 7105 285 50 1541
36 Sholak 11 3.612 1.468 0.22 118550 21940 1492 1302 5588 32Bazar
37 ~ahartoli 13 4.131 4.032 0.309 37043 16671 3730 1829 3336 375 115
38 Panchalaish 26 2.217 2.217 100 75550 15000 1 2000 1000 3000 14 1300 600
39 Jalalabnad 14 4.131 0.031 0.309 34968 2570 847 1067 1914 21 167 10
.0 W. 12 1.559 0.389 0.117 79501 26830 2 940 930 5366 15 62Sholarshaha -r
41 AI-Karan 7 0.343 0.085 2.587 42028 10523 157 .62 2104 2
Wordwise Grand Total 59.81 48.87 81.47 4015717 1076172 387 1071 75495 151544 217300 36505 58510 14526
ourcea Chittaqong City Corporation, 1991.
c
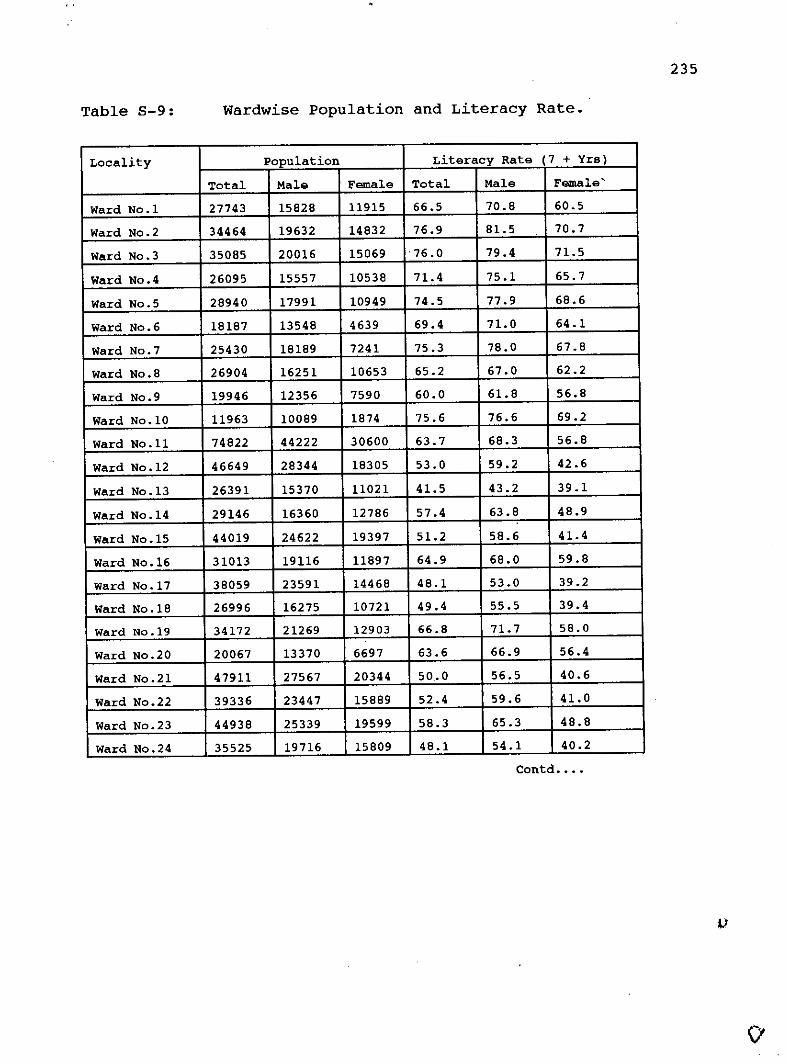
Table 8-9: Wardwise population and Literacy Rate.
235
Locality population Literacy Rate (7 + Yrs)
Total Male Female Total Male Female'
Ward No.1 27743 15828 11915 66.5 70.8 60.5
Ward No.2 34464 19632 14832 76.9 81.5 70.7
Ward No.3 35085 20016 15069 76.0 79.4 71.5
Ward No.4 26095 15557 10538 71.4 75.1 65.7
Ward No.5 28940 17991 10949 74.5 77 .9 68.6
Ward No.6 18187 13548 4639 69.4 71.0 64.1
Ward No.7 25430 18189 7241 75.3 78.0 67.8
Ward No.8 26904 16251 10653 65.2 67.0 62.2
Ward No.9 19946 12356 7590 60.0 61.8 56.8
Ward No.10 11963 10089 1874 75.6 76.6 69.2
Ward No.11 74822 44222 30600 63.7 68.3 56.8
Ward No.12 46649 28344 18305 53.0 59.2 42.6
Ward No.13 26391 15370 11021 41.5 43.2 39.1
Ward No.14 29146 16360 12786 57.4 63.8 48.9
Ward No.15 44019 24622 19397 51.2 58.6 41.4
Ward No.16 31013 19116 11897 64.9 68.0 59.8
Ward No.1? 38059 23591 14468 48.1 53.0 39.2
Ward No.18 26996 16275 10721 49.4 55.5 39.4
Ward No .19 34172 21269 12903 66.8 71.7 58.0
Ward No.20 20067 13370 6697 63.6 66.9 56.4
Ward No.21 47911 27567 20344 50.•0 56.5 40.6
Ward No.22 39336 23447 15889 52.4 59.6 41.0
Ward No.23 44938 25339 19599 58.3 65.3 48.8
Ward No.24 35525 19716 15809 48.1 54.1 40.2Contd ••••
lJ

Locality Population Literacy Rate (7 + Yrs)Total Male Female Total Male Female'
Ward No.25 72363 40968 31395 60.1 66.3 51.8Ward No.26 33388 18624 14764 48.3 55.4 38.8Ward No.27 44477 23984 20493 54.3 60.4 47.0Ward No.28 47843 28783 19060 52.4 57.2 44.7Ward No.29 16021 8716 7305 46.8 52.4 40.1Ward No.30 26189 14011 12178 27.1 32.1 21.2Ward No.31 40890 22181 18709 54.9 60.3 48.3Ward No.32 47833 28221 19612 35.2 40.8 26.7Ward No.33 22885 12157 10728 57.1 62.7 50.7Ward No.34 21338 13021 8317 57.9 62.1 50.9Ward No.35 23404 12677 10727 55.2 60.9 48.3Ward No.36 28071 15676 12395 53.2 62.0 41.6Ward No.37 36291 20210 16081 60.7 66.9 52.5Ward No.38 40373 22611 17762 53.6 60.3 44.5Ward No.39 52099 30390 21709 62.1 67.9 53.5Ward No.40 44622 25809 18813 56.9 62.8 48.4Ward No.41 36705 20949 15756 45.0 54.8 30.7Total 142859 83705 591540 2360 2568 2049
3 3Percentage 100% 58.59 41.41 57.56 62.63 49.07
236
Source Community Series (Chittagong), 1992.
•
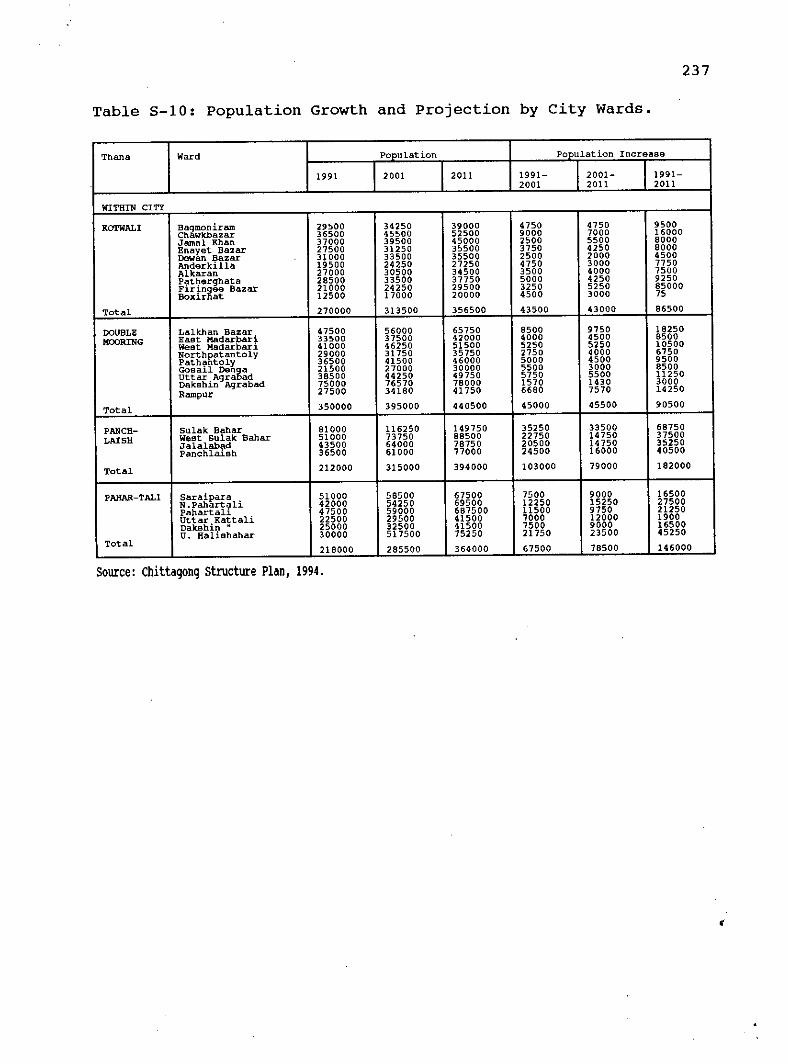
Table 5-10: population Growth and projection by City Wards.
237
Thana Ward Population Poculation Increase
1991 2001 2011 1991- I 2001- 1991-2001 2011 2011
WITHIN CITY
Karwl\LI Bagmoniram 29500 34250 39000 4750 4750 9500Chawkbazar 36500 45500 52500 9000 7000 16000Jamal Khan 37000 39500 45000 2500 5500 8000Enayet Bazar 27500 31250 35500 3750 4250 8000Dewan Bazar 31000 33500 35500 2500 2000 4500Anderkilla 19500 24250 27250 4750 3000 7750Alkaran 27000 30500 34500 3500 4000 7500Patherghata 28500 33500 37750 5000 4250 9250Fir;ngee Bazar 21000 24250 29500 3250 5250 85000Box1.r at 12500 17000 20000 4500 3000 75
Total 270000 313500 356500 43500 43000 86500
DOUBLE Lallman Bazar 47500 56000 65750 8500 9750 18250MOORING East Hadarbari 33500 37500 42000 4000 4500 8500
West Hadarbari 41000 46250 51500 5250 5250 10500Northpatantoly 29000 31750 35750 2750 4000 6750Pathantoly 36500 41500 46000 5000 4500 9500Gosail Denga 21500 27000 30000 5500 3000 8500Uttar Agra ad 38500 44250 49750 5750 5500 11250Dakshin Agrabad 75000 76570 78000 1570 1430 3000Rampur 27500 34180 41750 6680 7570 14250
Total 350000 395000 440500 45000 45500 90500
PANCH- Sulak Bahar 81000 116250 149750 35250 33500 68750LAlSH West Sulak Bahar 51000 73750 88500 22750 14750 37500
Ja1alabad 43500 64000 78750 20500 14750 35250Panchlaish 36500 61000 77000 24500 16000 40500
Total 212000 315000 394000 103000 79000 182000
PAHAR-TALI saraipara 51000 58500 67500 7500 9000 16500N .Pahartali 42000 54250 69500 12250 15250 27500Pahartali 47500 59000 687500 11500 9750 21250Uttar Kattali 22500 29500 41500 7000 12000 1900Dakshin • 25000 32500 41500 7500 9000 16500U. Halishahar 30000 517500 75250 21750 23500 45250
Total 218000 285500 364000 67500 78500 146000
Source: Chittagong Structure Plan, 1994.
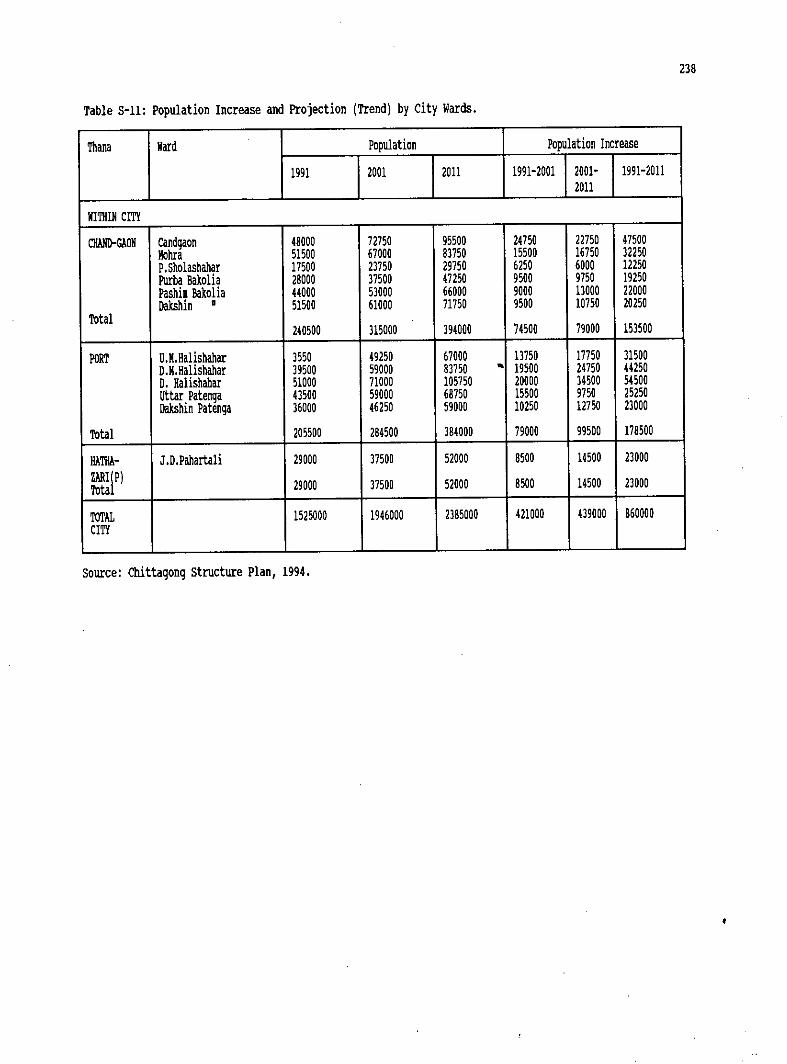
Table 5-11: Population Increase and Projection (Trend) by city Wards.
238
Thana Ward Population Population Increase
1991 2001 2011 1991-2001 2001- 1991-20112011
WITHIHCITY
ClllJID-GAON Candgaon 48000 72750 95500 24750 22750 mooMobra 51500 67000 83750 15500 16750 32250P. Sholashahar 17500 23750 29750 6250 6000 12250Purba Bakolia 28000 37500 47250 9500 9750 19250Pashi. Bakolia 44000 53000 66000 9000 13000 22000Dakshin • 51500 61000 71750 9500 10750 20250
Total240500 315000 394000 74500 79000 153500
PORT U•M.Halishahar 3550 49250 67000 13750 17750 31500D.M.Halishahar 39500 59000 83750 •• 19500 24150 44150D. Halishahar 51000 71000 105750 20000 34500 54500uttar PateMa moo 59000 68750 15500 9750 25250Dakshin Patenga 36000 46250 59000 10250 12750 23000
Total 205500 284500 384000 79000 99500 178500
HATHA- J .D.Pahartali 29000 37500 52000 8500 14500 23000ZARIIP) 29000 37500 52000 8500 14500 23000Tota
TOTAL 1525000 1946000 2385000 421000 439000 860000CITY
Source: Chittagong Structure Plan, 1994.
•
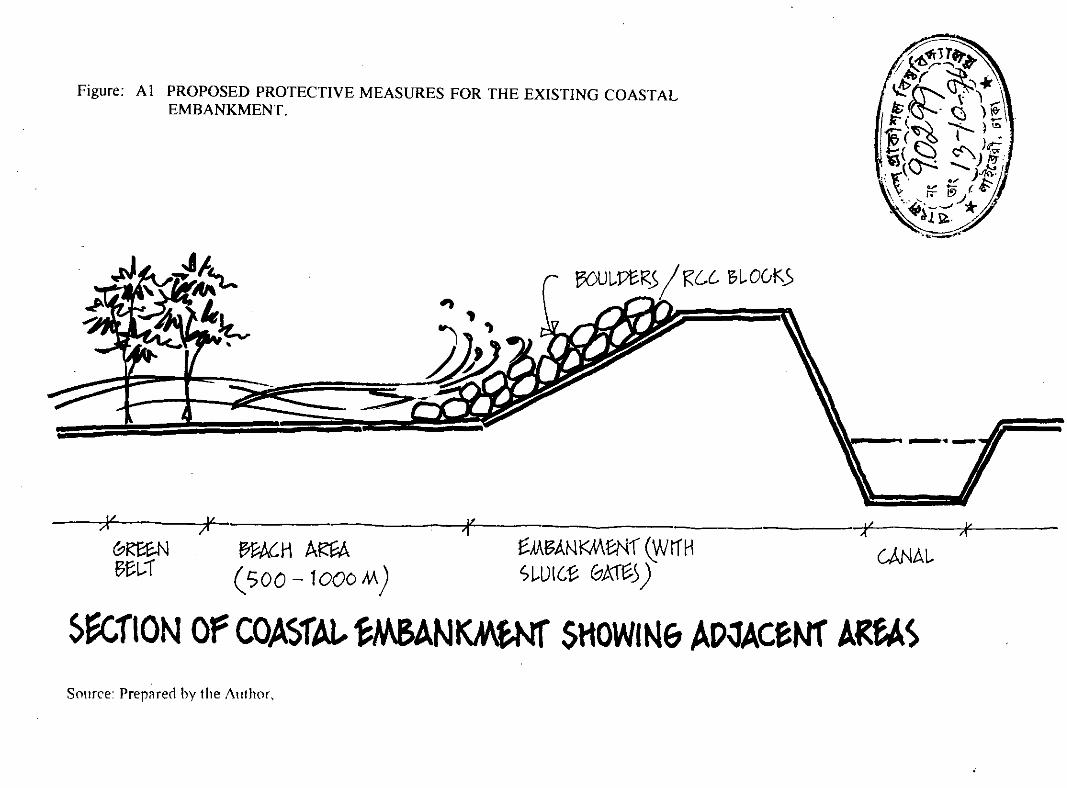
Figure: A I PROPOSED PROTECTIVE MEASURES FOR THE EXISTING COASTALEMBANKMENT.
~~.!,~r~~~~r ~.,'~.(\'..\' I \,
I&~. <::J )f\lei ~ 1'-".,--,~ I .~(c:s~)~~{a--::. -) •.•I,:{ if ~ ItlJto, ",~,_---,J*"
""~ -l ~, /.0
r--------;(---~H ARf:A ~N\~ANt<MBNl(yJtfH(SOO -1000M) SWIGt 0A1~))
CANAl-At ;f
I:1OUl-~R.s/ Rl:.c. ~l-00K.>~
(:,~~el.-1*
~,~cnONOf COA~1Al,~ANKk\f,Nf SHOWIN& A~ceN1"AReASSource: Prep~red by the Author,
Related Documents


