DEPARTMENT OF THE INTERIOR U.S. GEOLOGICAL SURVEY Preliminary Results of Precise Leveling and Trilateration Surveys in Yellowstone National Park, Wyoming, 1985 Daniel Dzurisinl, Kenneth M. Yamashita 1 , and Daniel J. Johnson 1 Open-File Report 86-265-B This report is preliminary and has not been reviewed for conformity with U. S. Geological Survey editorial standards. Any use of trade names is for descriptive purposes only and does not imply endorsement by the USGS, u. S. Geological Survey, David A. Johnston Cascades Volcano Observatory, 5400 MacArthur Blvd., Vancouver, Washington 98661 1986

Welcome message from author
This document is posted to help you gain knowledge. Please leave a comment to let me know what you think about it! Share it to your friends and learn new things together.
Transcript

DEPARTMENT OF THE INTERIOR
U.S. GEOLOGICAL SURVEY
Preliminary Results of Precise Leveling and Trilateration Surveys in Yellowstone National Park, Wyoming, 1985
Daniel Dzurisinl, Kenneth M. Yamashita1 , and Daniel J. Johnson1
Open-File Report 86-265-B
This report is preliminary and has not been reviewed for conformity with U. S. Geological Survey editorial standards. Any use of trade names is for descriptive purposes only and does not imply endorsement by the USGS,
u. S. Geological Survey, David A. Johnston Cascades Volcano Observatory, 5400 MacArthur Blvd., Vancouver, Washington 98661
1986

-2-
FOREWA.RDThis report describes preliminary results of precise leveling and
trilateration surveys in Yellowstone National Park in September 1985. A companion report (Dzurisin and Yamashita, 1986) describes initial surveys in October 1983 and September 1984. Each report has its own figures and tables; the report by Dzurisin and Yamashita (1986) also contains an appendix with descriptions of 50 benchmarks measured during the leveling surveys.

-3-
Table of Contents
Abstract.........................................................4Introduction.....................................................4
Purpose and Scope...........................................4Bac kground.................................................. 4Earlier Work................................................4Scedule and Participants....................................4
Leveling Results.................................................5Benchmarks..................................................5Procedures.................................................. 5Standard Errors............................................. 51923-1984 Results........................................... 61985 Results................................................ 6
Trilateration Results............................................ 7The Network................................................. 71984-1985 Results........................................... 7
Pelican Valley Reconnassaince....................................7Discussion....................................................... 9
Is Yellowstone 1 s Uplift Steady or Episodic?................. 9Is Yellowstone Cooling Down or Heating Up?.................. 9
Acknowledgments................................................. 11References...................................................... 12Tables..........................................................13Figures.........................................................21
List of Tables
Table 1: Benchmark replacements, 1984-1985......................13Table 2: Level changes, 1984-1985...............................14Table 3: Benchmark elevations, 1923-1985........................15Table 4: Elevation changes, 1923-1985...........................17Table 5: Average maximum uplift rates, 1923-1985................19Table 6: Line length changes, 1984-1985........................ 20
List of Illustrations
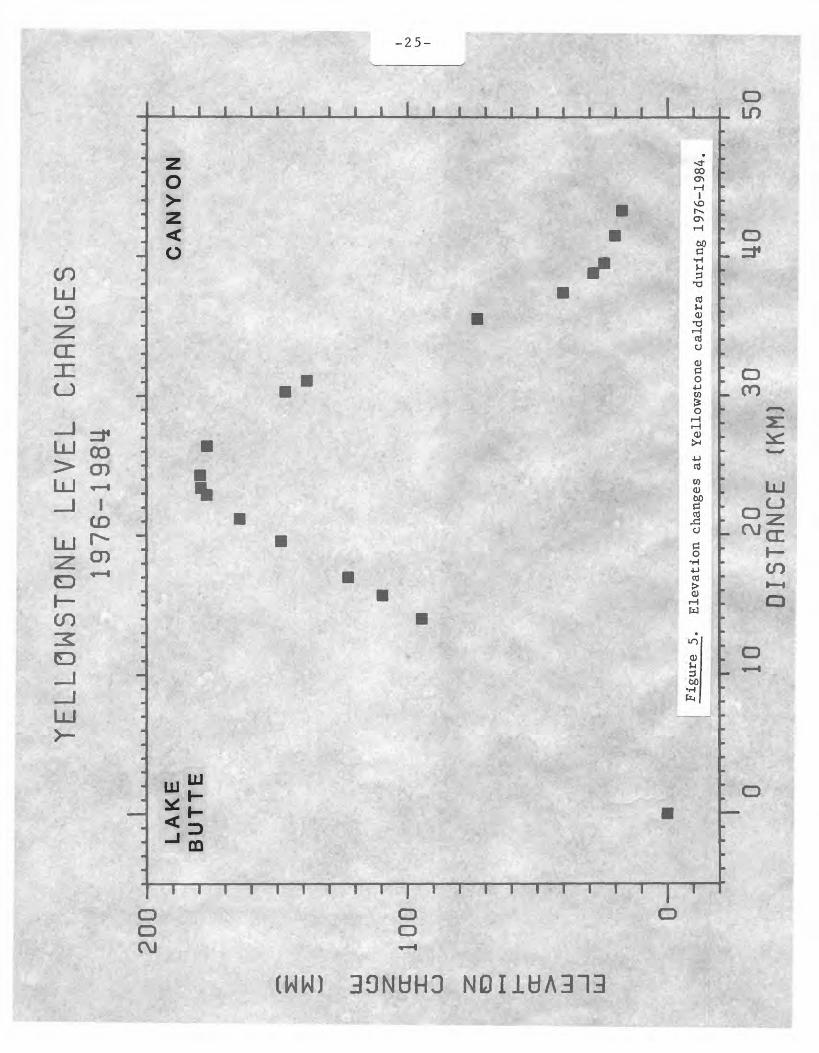
Figure 1: Lake Butte-Canyon Junction level line................. 21Figure 2: Yellowstone trilateration network.....................22Figure 3: Level changes, 1923-1976 and 1923-1985................23Figure 4: Level changes, 1976-1983..............................24Figure 5: Level changes, 1976-1984..............................25Figure 6: Level changes, 1983-1984..............................26Figure 7: Level changes, 1984-1985..............................27Figure 8: Topographic map of lower Pelican Creek................ 28

-4-
ABSTRACTPrecise level and trilateration surveys in the eastern part of
Yellowstone caldera detected no significant crustal deformation from September 1984 to September 1985. Earlier level surveys had shown that the caldera floor rose by 16-23 mm/yr during 1923-1976, 1976-1983, and 1983-1984. It thus appears that historical uplift at Yellowstone has been relatively steady over time scales of decades, but episodic over time scales of years.
INTRODUCTIONPurpose and ScopeThis informal report was prepared to make available to interested
parties the results of USGS leveling and trilateration surveys in Yellowstone National Park in September 1985. It also includes a short description of fluvial features in Pelican Valley that might record post-glacial deformation in the eastern part of the caldera. Data reported here are preliminary and subject to revision; final results will be published in the formal literature.
BackgroundThis work is part of a project on Physical Processes in Large Silicic
Magma Systems funded by the USGS Volcanic Hazards Reduction Program. The project's goal is to better understand physical processes that contribute to unrest at silicic calderas, as a basis for better assessments of volcanic hazards. "Unrest" includes seismicity, ground deformation, hydrothermal activity, and other processes that commonly occur in magmatic systems beneath young calderas. Many such "restless" calderas are probably capable of future eruptions. Our approach is to measure contemporary ground deformation using precise geodesy, and to determine past deformation using surveys and appropriate dating techniques.
Earlier WorkOur work at Yellowstone began in October 1983 with a first order
level survey along the paved road from Indian Pond to Trout Creek. The line was remeasured and extended from Lake Butte to Canyon Junction in September 1984, when a precise trilateration network was added in the northeast part of the caldera (Figures 1 and 2). In September 1985, the level line and trilateration network were resurveyed, and a reconnaissance study of Pelican Valley was conducted. Preliminary results of the 1983 and 1984 level surveys were described by Dzurisin and Yamashita (1986) in a companion report.
Schedule and ParticipantsAs in the past, we began our work this year immediately after Labor
Day (September 2, 1985) to avoid the peak tourist season. On September 4, Willie Kinoshita began preparations for the trilateration survey; Dzurisin, Ken Yamashita, Roger Denlinger, and Ron Hanatani began leveling from Lake Butte to Canyon Junction. The level survey was completed on September 13, after poor weather on September 10, 12, and 13 forced postponement of the trilateration survey. Yamashita, Denlinger, and Hanatani left Yellowstone on September 14; they were replaced by Dan Johnson, Karl Gross, and Chuck Stiffler. Fieldwork in Pelican Valley began on September 16; the trilateration survey was completed in marginal weather on September 24, 26, and 27. Gross and Stiffler left Yellowstone

-5-
on September 28; Dzurisin and Johnson completed the Pelican Valley fieldwork on September 29, and left Yellowstone on September 30.
LEVELING RESULTSBenchmarksA complete set of benchmark descriptions for the 1923-1984 level
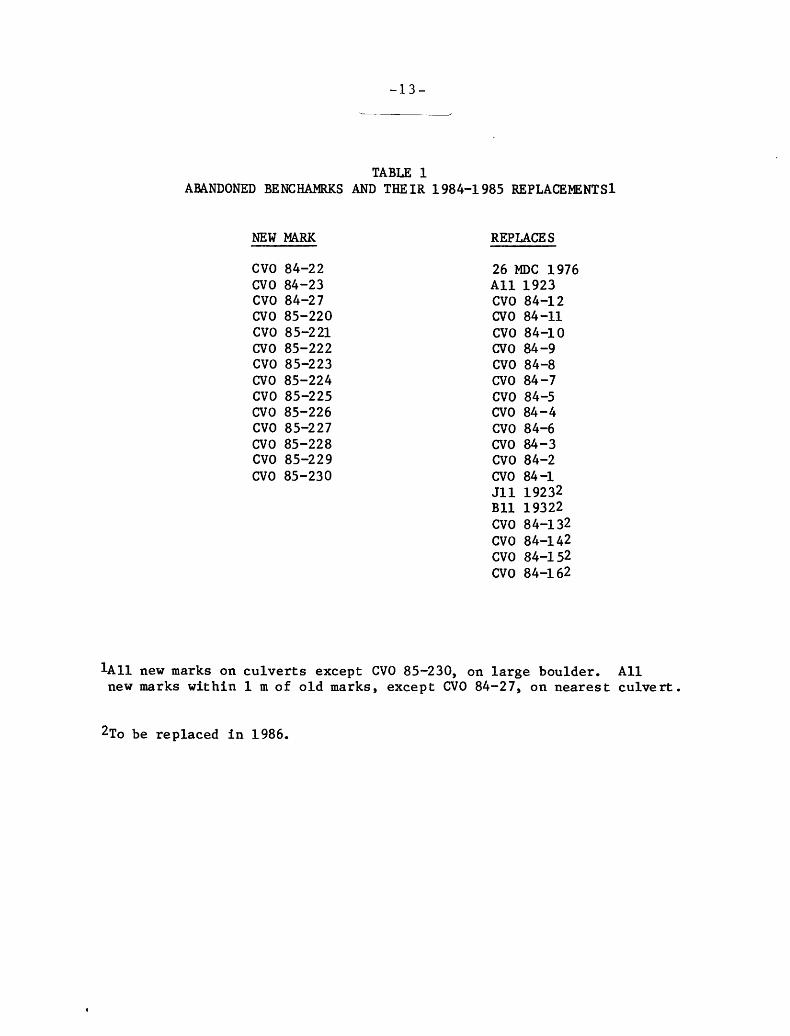
surveys between Lake Butte and Canyon Junction was provided by Dzurisin and Yamashita (1986). In 1984, 3 marks suspected of being unstable (26 MDC, All 1923, and CVO 84-12) were replaced by nippled marks specifically designed for precise leveling; in 1985, 11 more standard marks were replaced with nippled marks. The abandoned marks and their 1984-1985 replacements are listed in Table 1. About 6 more replacements are planned for 1986. The Lake Butte to Canyon Junction level line is about 43 road kilometers long (33 linear kilometers), with an average benchmark spacing of about 1 km.
ProceduresNational Geodetic Survey procedures for first class, second order
leveling were followed during the 1983-1985 surveys, with minor exceptions. Briefly, elevation differences between benctmarks were measured using a Wild N-3 spirit level and Wild GPLE-3 Invar 3 m level rods. The N-3 uses a manual spirit level and therefore is not subject to magnetic errors associated with some automatic levels. To increase precision, the maximum acceptable difference between left and right rod readings was reduced to 0.010 cm, without significantly increasing the time required for the survey. The level rods were calibrated annually at the National Bureau of Standards to an accuracy of (0.000015 + 0.OOOOOSh) meters, where h is the distance from the bottom of the rod to the graduation of interest. P-K surveying nails driven flush with the pavement were used as recoverable turning points. Temperatures 0.5 m and 2.5 m above the ground surface were recorded to an accuracy of 0.1 degree Celsius. Adjacent benctmarks were double-run the first time they were measured, and single run in opposing directions thereafter to randomize the effect of pin settling. Data were recorded in the field using a Hewlett-Packard 41C calculator. Results reported here include rod scale, rod temperature, and refraction corrections; they do not include astronomic or orthometric corrections, which are negligible in this case. Refraction corrections were based on the model of Kukkamaki (1939), adopted in 1980 by NGS (Balazs and Young, 1982, p. 6).
Standard ErrorsThe International Geodetic Association resolved in 1948 that standard
errors in high precision level surveys should be less than 3 mm x dl/2 ? where d is the distance in km from the start of the survey. The standard error between surveys should be less than 3 mm x (2d)l/2 (Bomford, 1980, p. 219). Using improved instruments and rigorous field procedures, these limits can now be reduced under optimum conditions to about 1 mm x dl/2 for single surveys, and 1 mm x (2d)l/2 between surveys. At Canyon Junction (11 MDC 1976), this corresponds to a standard error of about 6 mm for a single survey and 9 mm between surveys (relative to 36 MDC 1976 near Lake Butte). Near the center of uplift, the calculated errors are about 4 mm and 6 mm. These appear to be realistic estimates for the 1983-1985 surveys, based on observed closures and reproducibility at 11 MDC 1976 between 1984 and 1985.

-6-
1923-1984 ResultsPrecise level surveys in 1923 and 1975-1977 revealed a broad pattern
of uplift centered in Yellowstone caldera, along an axis connecting the Mallard Lake and Sour Creek resurgent domes (Pelton and Smith, 1979, 1982). The maximum uplift measured was 726 mm at benchmark Bll 1923 near LeHardy Rapids on the Yellowstone River (Figure 3). Thus, the maximum average uplift rate during 1923-1976 was 14 mm/yr (the Lake Butte-Canyon Junction line was measured in 1976 during the 1975-1977 survey).
Our level survey from Indian Pond to Trout Creek in October 1983 detected 78 mm of additional uplift at benchmark DA 3 1934 near LeHardy Rapids, relative to benchmark 32 MDC 1976 at Indian Pond (Figure 4). This result was confirmed by the more complete 1984 survey, which showed that DA 3 1934 had beed uplifted since 1976 by 179 mm relative to 36 MDC 1976 (Figure 5), at an average rate of 22 mm/yr. The shape of the 1976-1983 uplift profile between Indian Pond and Trout Creek is similar to the 1976-1984 profile in that area, so the 1976-1983 result at DA 3 1932 (78 mm relative to 32 MDC 32 MDC) can be extrapolated to an assumed stable base outside the caldera (162 mm relative to 36 MDC), using the 1976-1984 profile as a guide. This yields an average uplift rate at DA 3 1932 during 1976-1983 of 23 mm/yr, about 70% greater than during 1923-1976. The maximum inferred uplift during 1983-1984 is 23 mm at Fll A (Figure 6), suggesting that the uplift rate was essentially constant from 1976 to 1984. Slight differences between the above results and those reported by Dzurisin and Yamashita (1986) are caused by different extrapolations of the 1983 results.
There are at least 3 viable explanations for the apparent rate increase during 1976-1984: 1) uplift may have accelerated since 1976; 2) uplift may have started sometime after the first level survey in 1923; or 3) uplift may be episodic over short time scales. More on this later.
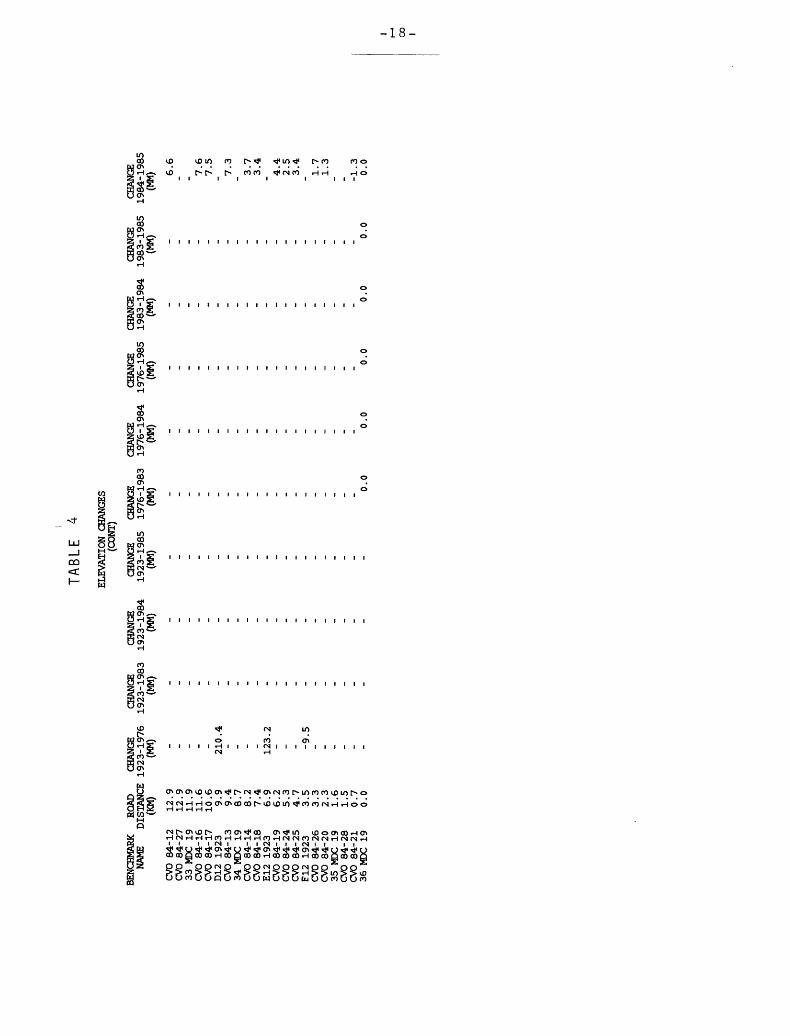
1985 ResultsBenchmark elevations in September 1984 and September 1985, and
elevation changes during that interval, are listed in Table 2 and plotted versus road distance in Figure 7. There were no changes larger than expected error during September 1984 - September 1985. The largest positive change along the line (+7.6 mm) occcurred at CVO 84-16 at Mary Bay. The largest negative change (-5.9 mm) occurred at CVO 84-6 in Hayden Valley. The net change at DA 3 1934 near the former center of uplift was 0.0 mm; the net change from 36 MDC 1976 at Lake Butte to 11 MDC 1976 at Canyon Junction was +3.2 mm. In short, the entire line was stable within our detection limit.
Benchmark elevations from each survey since 1923 are listed in Table 3; elevation changes between surveys are listed in Table 4. The maximum uplift measured between Lake Butte and Canyon Junction during 1923-1985 was 889 mm at Bll 1932 relative to 36 MDC 1976. Since 1976, uplift has been centered about 2 km north of Bll 1932, between Mud Volcano and LeHardy Rapids. We therefore estimate the true maximum uplift during 1923-1985 as 970 mm, at an average rate of 16 mm/yr. Average uplift rates for each of the surveyed intervals since 1923 are listed in Table 5,

-7-
TRILATERATION RESULTSThe NetworkA precise trilateral:ion network of 9 lines was established in
September 1984 to complement the first order level monitor. The trilateration lines are 11.3 km to 34.7 km long; together they span the northeast part of Yellowstone caldera (Figure 2), including a low velocity zone that Smith and Braile (1982) attribute to the presence of shallow partial melt above the Yellowstone hot spot. A larger network spanning the entire caldera would have been preferable, but lines-of sight are obscured by dense forest in most of the central and western caldera.
1984-1985 ResultsThe trilateration network was measured in September 1984 and
September 1985 to a precision of a few parts in 107 using a Geodolite, a precise electro-optical distance meter. Atmospheric refractivity corrections were based on measurements from an aircraft flown along the line of sight during ranging. The longest line, Washburn - Chittenden, was not measured in 1984 owing to high winds; all 9 lines were measured in 1985.
Results of the 1984 and 1985 trilateration surveys are listed in Table 6. No significant changes occurred in the network during that interval. Five of 8 lines changed by less than 1 standard deviation, 7 of 8 by less than 2 standard deviations, and the eighth line (Washburn-Amethyst) changed by less than 3 standard deviations: the expected error distribution for a stable network. Together, the level and trilateration results show conclusively that no detectable crustal deformation occurred in the eastern part of Yellowstone caldera from September 1984 to September 1985.
PELICAN VALLEY RECONNASSAINCEWork by Meyer and Locke (1985) and by Hamilton and Vincent (written
communication, 1985) has demonstrated the utility of surveying lake and stream terraces at Yellowstone to detect prehistoric deformation. Combined with radiocarbon and hydration rind dating, this technique might eventually provide a reasonably complete record of Holocene deformation at Yellowstone. With this in mind, Dzurisin and Johnson spent several days in Pelican Valley this year looking for fluvial features that might record paleo-deformation in the eastern caldera. Two promising areas were identified for further study.
From its headwaters along the eastern margin of the Sour Creek resurgent dome to its mouth near the outlet of Yellowstone Lake, Pelican Creek is well situated to record post-glacial deformation in the eastern part of Yellowstone caldera (Figure 8). The stream's southerly upper reach occupies a narrow saddle between the eastern margin of the resurgent dome and the eastern wall of the caldera. The central reach meanders westward through a broad flat valley cut into Pinedale lake and kame deposits, before the stream turns southward again below a bedrock narrows to enter Yellowstone Lake. The historic deformation pattern defined by Pelton and Smith (1979, 1982) would cause eastward or southeastward, cross-valley tilting in Pelican Valley's upper and lower reaches, and upstream longitudinal tilt of the stream's middle reach. Such tilting would increase the gradient of the upper reach slightly, and decrease the gradient of the central reach. If uplift were instead

-8-
centered at the Sour Creek dome, the upper and central regions would experience cross-valley tilting, and the lower reach would be steepened.
We were first intrigued by the sharp southward bend that Pelican Creek makes to reach Yellows tone Lake, rather than continuing westward to the Yellowstone River. We therefore looked for evidence that the stream had once continued westward to the river, before being diverted to its present course by differential uplift of the central caldera floor. We found no such evidence, and concluded that Pelican Creek has probably occupied its present valley at least since late Pinedale time.
Our next goal was to identify terraces or strand lines of Pinedale lakes in Pelican Valley, to asses the feasibility of surveying them for evidence of post-glacial deformation. Richmond (1976, 1977) discussed a series of such lakes, but he mapped no terraces or strand lines associated with them in Pelican Valley. We walked both banks of the valley from Yellowstone Lake to Raven Creek, and inspected the upper valley by helicopter during the trllateration survey, but found no shoreline features suitable for such a study.
On the other hand, we did find numerous stream terraces in the lower reach of Pelican Valley that could be surveyed to assess post-glacial deformation there. Richmond (1977) mapped several stream terrace scarps on the south bank of the valley just below its bedrock narrows; we found more examples on both banks throughout the narrows. Farther downstream, in the southerly lower reach, there is a clear distinction between the number of terraces preserved on opposite banks. Along the eastern bank between the narrows and the lake, we found only 2 terrace scarps at a single location. Along the corresponding western bank, we found more than 20 terrace scarps, from less than 1 m to more than 10 m above the current flood plain. Presumably, the eastern terraces have been erased by preferential erosion of the eastern bank.
Another promising topic is the response of Pelican Creek itself to long term tilting of Pelican Valley. Ouchi (1985) recently described the response of meandering and braided streams to tectonic tilting, and his results are applicable to Pelican Valley. Briefly, a meandering stream subject to an increasing gradient will respond with increasing sinuosity, bank erosion, and point-bar growth. The same stream subject to a decreasing gradient will flood its point bars and deposit fines in response to a reduced flow velocity. As a first attempt to identify such responses at Pelican Creek, we compared 1954 and 1984 aerial photographs of the area, available at the National Park Service photo library in Mammoth. Our casual examination of the photos revealed surprisingly little change during the past 30 years: the current sinuous channel has been modified only slightly during that interval. However, there is independent evidence that Pelican Creek has responded in other ways to historic deformation.
Work in progress by W. L. Hamilton (written communication, 1985) shows that the level of Yellowstone Lake has risen perceptibly in response to differential uplift of its outlet since the turn of the century. As a result, the base level of Pelican Creek has risen, and the stream has flooded point bars in its lower reach. The stream there has become increasingly sluggish, forcing the movement of a fish trap and then reducing the efficiency of the new installation (J. Varley, oral communication, 1985). Oxbow lakes are much more numerous along the stream's lower reach than elsewhere, suggesting differential sinuosity changes that might reflect differential tilting or base level changes in different reaches of the stream.

-9-
DISCUSSIONIs Yellowstone 1 s Uplift Steady or Episodic?Until recently, available evidence suggested that uplift at
Yellowstone has been relatively steady for at least the past few decades, and possibly for many centuries. Level surveys in 1923, 1976, and 1984 suggested that the uplift rate varied by less than 50% on those time scales, and the incomplete 1983 survey suggested that the annual rate during 1983-1984 was comparable to the average rate during 1976-1983 (Table 5). Surveying of deformed shoreline terraces at Yellowstone Lake showed that uplift has occurred there at 60-65% of the 1976-1984 rate for at least the past few thousand years (Meyer and Locke, 1985). The average 1923-1985 uplift rate (16 mm/yr) is 70% of the 1976-1984 rate (22 mm/yr), so the average rate for the past few thousand years (terraces) is essentially the same as the average rate for the past 62 years (leveling). The implication in 1984 was that uplift is a relatively steady, long term process.
This view must now be modified to accommodate two new pieces of evidence. First, Hamilton (written communication, 1985) used gaging records from Yellowstone Lake and the upper Yellowstone River to determine the annual uplift history there since 1923. He showed that uplift has been relatively steady, with several notable exceptions. Uplift at about 5 times the average rate occurred during 1940-1943 and 1952-1956. At other times, uplift was too slow to be detected for several years. Short periods of unusually rapid deformation may have accompanied the magnitude 7 Hebgen Lake earthquake in 1959 and the magnitude 6 Yellowstone Park earthquake in 1975.
The 1923-1985 level surveys reinforce the view that uplift has been steady over time scales of decades, but episodic over time scales of years. A separate result from the terrace study by Meyer and Locke (1985) is that uplift during the past few millennia has occurred at about the same rate as during the past few decades. Finally, Hamilton (1985) has argued that higher terraces on the southeast shore of Yellowstone Lake are best explained by a model including substantial intracaldera subsidence starting in the early Holocene, followed by uplift from the late Holocene to the present.
Thus, it appears that the uplift rate has changed significantly on time scales of years (1984-1985 leveling) and millennia (high terraces), but that it has been relatively constant on time scales of decades (1923-1984 leveling and lake gaging) and centuries (lower terraces). Not surprisingly, our picture of Yellowstone 1 s post-glacial deformation history is becoming increasingly complex; much work remains to be done before its implications for volcanic hazards can be properly assessed.
Is Yellowstone Cooling Down or Heating Up?Fournier and Pitt (1985) concluded that Yellowstone 1 s magmatic system
is probably cooling down, because the heat input they infer from the observed uplift is not enough to balance the heat output they calculate from hydrothermal measurements. They recognized that the true heat input at depth may exceed their estimate based on uplift at the surface, and qualified their conclusion accordingly. This issue has clear implicatons for future volcanic hazards at Yellowstone, and it therefore deserves careful consideration. The following comments summarize current knowledge and explore two alternate approaches to this important question.

-10-
The most likely cause of uplift at Yellowstone is the influx of basaltic magma near the base of a large silicic magma reservoir (Pelton and Smith, 1982). Basaltic intrusions beneath silicic calderas cause uplift for at least two reasons: 1) they increase the volume of magma in the reservoir, and 2) they add heat to the silicic magma, causing it to expand. Under some conditions, basaltic intrusions may also cause uplift by triggering vesiculation. This process of basaltic underplating is a primary source of heat for silicic reservoirs in the upper crust. If the heat input from basaltic intrusions does not balance the heat loss from thermal conduction and hydrothermal convection, a silicic reservoir cools and eventually solidifies. At least 0.01 km3/y r of basaltic underplating is required to maintain a large silicic magma reservoir in the upper crust (Smith, 1979; Smith and Shaw, 1975, 1979; Shaw, 1984).
The volume of uplift within Yellowstone caldera during 1923-1985, calculated from Pelton and Smith's (1982) map scaled to include the 1976-1985 leveling results, is about 0.75 km3. The average rate of volume increase is thus about 0.012 km3/yr. The minimum average thermal flux from Yellowstone 1 s hydrothermal system is 1800 mW/m2 throughout 2,500 km2. This corresponds to the amount of heat released by crystallization and partial cooling of about 0.085 km3/yr of basalt (Fournier and Pitt, 1985). If we assume that the surface uplift rate equals the basaltic influx rate, the hydrothermal output is about 7 times the magmatic input, and the Yellowstone system is cooling down.
An alternate approach is to assume that Yellowstone 1 s magmatic and hydrothermal systems operate at or near steady state thermal equilibrium, which requires a hidden heat source to account for the high contemporary heat flux. One possibility is that the current hydrothermal output reflects a significantly higher magmatic heat input sometime in the recent geologic past. As noted above, uplift at Yellowstone has been episodic over both short and long time scales. Hamilton's (1985) model suggests that the current uplift rate is the highest since the early Holocene, but available evidence does not preclude earlier periods of rapid uplift. Is it possible that today's hydrothermal system's reflect's magmatic conditions more than 10,000 years ago? This question might be resolved by estimating the probable lag between a heat pulse at the base of the reservoir and its thermal manifestation at the surface.
A second possibility is that the volume of basalt contributing heat to the base of the silicic reservoir is significantly greater than the volume of surface uplift. Fournier and Pitt (1985) recognized this possibility when they wrote: "Unless additional thermal energy is being derived from basaltic magma that intrudes the crust, cools slightly (melting silicic material), and then convects back down to the mantle, the Yellowstone magmatic-hydrothermal system as a whole is cooling down rather than heating up." The existence of a "thermal conveyor belt" in the upper mantle is entirely speculative, but it deserves additional consideration. The fundamental issue is the relationship between hydrothermal heat flux, magmatic cooling in the shallow crust, and magmatic heating near the base of the crust. If hydrothermal systems have their roots in the shallow crust, they are trademarks of dying silicic systems. But if some are more deeply rooted (i. e., if they reflect deep magmatic heat input), they may provide important information about magmatic processes that have no other surface manifestation.

-11-
ACKNOWLEDGMENTSDzurisin appreciates the long hours and hard work by members of the
1985 level crew: Ken Yamashita, Ron Hanatani, and Roger Denlinger. Special thanks also go to Karl Gross and Chuck Stiffler for overcoming marginal weather and finicky equipment to complete the trilateration survey, and to Jim Savage and Will Prescott for lending us their equipment. John Varley and Wayne Hamilton of the National Park Service provided commodious accommodations and logistical support. Les Herman answered our helicopter questions in pre-dawn hours, Jim Sweaney lent us needed air photos after leading us through the Yellowstone photo collection, and Rick Hutchinson lent us a rare topographic map of Pelican Valley.

-12-
REFERENCES
Balazs, E. I., and Young, G. M., 1982, Corrections applied by theNational Geodetic Survey to precise leveling observations, NOAATechnical Memorandum NOS NGS 34, 12 p.
Bomford, G., 1980, Geodesy: 4th ed., Oxford University Press, 855 p. Dzurisin, D., and Yamashita, K. M., 1986. Preliminary results of precise
leveling and trilateration surveys in Yellowstone National Park,Wyoming, 1983-1984, U. S. Geological Survey Open-File Report86-265-A, 33 p.
Fournier, R. 0. and Pitt, A. M., 1985, The Yellowstonemagmatic-hydrothermal system: Geothermal Research Council Trans.,1985, 24 ms. p.
Hamilton, W. L., 1985, Deformation models for interpreting warpedHolocene terraces of Yellowstone Lake and the Yellowstone River atthe Yellowstone caldera, Wyoming (abstract): Transactions of theAmerican Geophysical Union, EOS, v. 66, no. 46, p. 853.
Kukkamaki, T. J., 1939, Formeln und Tabellen zur Berechnung derNivellitischen Refraktion: Finnish Geodetic Institute PublicationNo. 27, Helsinki, 18 p.
Meyer, G. A. and Locke, W. W., 1985, Deformation of Holocene shorelineterraces, Yellowstone Lake, Wyoming: in preparation.
Ouchi, S., 1985, Response of alluvial rivers to slow active tectonicmovement: Geological Society of America Bulletin, v. 96, p. 504-515.
Richmond, G. M., 1976, Surficial geologic history of the Canyon VillageQuadrangle, Yellowstone National Park, Wyoming, for use with Map1-652: U. S. Geological Survey Bulletin 1427, 35 p.
Richmond, G. M., 1976, Surficial geologic map of the Canyon VillageQuadrangle, Yellowstone National Park, Wyoming: U. S. GeologicalSurvey Map 1-652.
Pelton, J. R. and Smith, R. B., 1979, Recent crustal uplift inYellowstone National Park, Science, v. 206, p. 1179-1182.
Pelton, J. R. and Smith, R. B., 1982, Contemporary vertical surfacedisplacements in Yellowstone National Park, J. Geophys. Res., v. 87,no. B4, p 2745-2761.
Shaw, H. R., 1984, A note on links between magma-tectonic rate balances,plutonism and volcanism: U. S. Geological Survey Open-File Report84-939, p 886-908 (also J. Geophys. Res., in press).
Smith, R. L., 1979, Ash-flow magmatism: Geol. Soc. Am. Special Paper180, p. 5-26.
Smith, R. L., and Shaw, H. R., 1975, Igneous-related geothermal systems:in Assessment of geothermal resources of the United States - 1975, D.E. White and D. L. Williams, eds., U. S. Geological Survey Circular726, p. 58-83.
-13-
TABLE 1 ABANDONED BENCHAMRKS AND THEIR 1984-1985 REPLACEMENTSl
NEW MARK
CVO 84-22 CVO 84-23 CVO 84-27 CVO 85-220 CVO 85-221 CVO 85-222 CVO 85-223 CVO 85-224 CVO 85-225 CVO 85-226 CVO 85-227 CVO 85-228 CVO 85-229 CVO 85-230
REPLACES
26 MDC 1976 All 1923 CVO 84-12 CVO 84-11 CVO 84-10 CVO 84-9 CVO 84-8 CVO 84-7 CVO 84-5 CVO 84-4 CVO 84-6 CVO 84-3 CVO 84-2 CVO 84-1 Jll 19232 Bll 19322 CVO 84-132 CVO 84-142 CVO 84-152 CVO 84-162
new marks on culverts except CVO 85-230, on large boulder. All new marks within 1 m of old marks, except CVO 84-27, on nearest culvert
2To be replaced in 1986.

-14-
BENCHMARK
36MDCCV084-21CVO84-20CV084-26CV084-25CV084-24CV084-19CV084-18CV084-14CV084-13CV084-17CV084-16CV084-1232MDCCV084-15USBPR774331MDCCV084-23All 1923L19NPS30MDCCV084-11Bll 1923CV084-1029MDCDA328MDCCVO84-927MDCCV084-8CVO84-2226MDCCV084-7Ell A2Fll ACV084-5CV084-4CV084-6CV084-325MDCCV084-224MDC23MDC22MDCLC58Jll 1923CV084-111MDC
TABLE 2YELLOWSTONE LEVEL (
1984 ELEV(M)
2545.61832547.14312465.62132437.81812379.12352360.54662360.52542376.91872366.00442358.89722358.36652359.24732371.98612366.09592362.29032360.55352363.94532374.48882375.48222395.13672390.39772380.64752365.92482362.84962368.76952353.31082359.25852350.71362351.24762354.39142363.61302364.36062369.59352344.97902343.69732343.24562345.10522369.85602341.20482340.89752342.08452344.95922340.46092346.29272366.04102377.55252413.14992413.0373
1984-1985
1985 ELEV(M)
2545.61832547.14182465.62262437.81982379.12692360.54912360.52982376.92212366.00812358.90452358.37402359.25492371.99272366.10182362.29692360.55712363.94682374.49002375.48142395.13742390.39702380.64622365.92332362.84862368.77032353.31082359.25732350.71262351.24612354.38962363.60942364.36572369.59472344.97702343.69392343.24582345.10352369.85012341.19922340.89232342.08032344.95602340.45952346.29272366.03952377.55272413.14642413.0405
CHANGE (MM)
0.0-1.3 1.3 1.7 3.4 2.5 4.4 3.4 3.7 7.37.57.6 6.6 5.9 6.6 3.6 1.5 1.2
-0.8 0.7-0.7-1.3-1.5-1.0 0.8 0.0
-1-1-1.5-1.8-3.6 5.1 1.2
-2.0-3.4 0.2
-1.7-5.9-5.6-5.2-4.2-3.2-1.4 0.0-1.5 0.2-3.5 3.2
DISTANCE (KM)
0.00.72.33.34.75.36.27.48.29.410.611.612.914.014.515.717.018.218.219.119.620.321.222.122.923.424.325.126.427.328.628.629.530.331.132.133.234.034.935.536.737.438.839.540.641.542.243.3

-15-
TABLE 3 BENCHMARK ELEVATIONS
BENCHMARK ROAD ELEVATION ELEVATION ELEVATION ELEVATION ELEVATIONNAME DISTANCE 1923 1976 1983 1984 1985
(KM) (M) (M) (M) (M) (M)
11 MDC 1976 CVO 84-1 CVO 85-230 Jll 1923 LC 58 197722 MDC 197623 MDC 197624 MDC 1976 CVO 84-2 CVO 85-22925 MDC 1976 CVO 85-228 CVO 84-3 CVO 84-6 CVO 85-227 Gil 1923 CVO 84-4 CVO 85-226 CVO 84-5 CVO 85-225 Fll A Ell A2 CVO 84-7 CVO 85-22426 MDC 1976 CVO 84-22 CVO 84-8 CVO 85-22327 MDC 1976 CVO 84-9 CVO 85-22228 MDC 1976 DA 3 193429 MDC 1976 CVO 84-10 CVO 85-221 Bll 1923 CVO 84-11 CVO 85-22030 MDC 1976 L19 1977 All 1923 CVO 84-2331 MDC 1976 USBPR7743 CVO 84-1532 MDC 1976
4342424140393837363635343434343333333232313029292828272726252524232222222120201919181817151414
.3
.2
.2
.5
.6
.5
.8
.4
.7
.7
.5
.9
.9
.0
.0
.5
.2
.2
.1
.1
.1
.3
.5
.5
.6
.6
.3
.3
.4
.1
.1
.3
.4
.9
.1
.1
.2
.3
.3
.6
.1
.2
.2
.0
.7
.5
.0
2413--
2377.3269 2377-
234623402344
-
2340----
2358.2080 2358----
23432344
--
2364---
2351--
235923532368
--
2365.0341 2365--
2390-
2374.7207 2375-
23632360
-2366
.0200--.5324-.2685.4325.9191--.8244----.6691----.5588.8323--.1762---.0709--.0792.1317.5925--.7604--.2493-.3398-.8227.4440-.0016
23432344
2364
2351
235923532368
2365
2390
2375
23632360
2366
--------------------.6743.9568--.3401---.2251--.2385.2937.7529--.9075--.3848-.4705-.9341.5420-.0853
2413.2413.
2377 .2366.2346.2340.2344.2342.
2340.
2341.2369.
2345.
2343.
2343.2344.2369.
2364.2363.2354.
2351.2350.
2359.2353.2368.2362.
2365.2380.
2390.2395.2375.2374.2363.2360.2362.2366.
03731499-552504102927460995920845-8975-20488560--1052-2456-697397905935-360661303914-24767136-2585310876958496-92486475-39771367482248889453553529030959
241324132413237723662346234023442342234223402341234123692369
2345234523432343234323442369236923642363235423542351235023502359235323682362236223652380238023902395237523742363236023622366
.0405
.1464
.2910
.5527
.0395
.2927
.4595
.9560
.0803
.0759
.8923
.2146
.1992
.8501
.9104-.1035.0749.2458.2891.6939.9770.5947.6235.3657.6094.3896.4307.2461.7126.5684.2573.3108.7703.8486.9141.9233.6462.6714.3970.1374.4814.4900.9468.5571.2969.1018

-16-
TABLE 3BENCHMARK ELEVATIONS
(CONT)
BENCHMARK ROAD ELEVATION ELEVATION ELEVATIONNAME DISTANCE 1923 1976 1983
(KM) (M) (M) (M)
CVO 84-12 12.9CVO 84-27 12.933 MDC 1976 11.9CVO 84-16 11.6CVO 84-17 10.6D12 1923 9.9CVO 84-13 9.434 MDC 1976 8.7CVO 84-14 8.2CVO 84-18 7.4E12 1923 6.9CVO 84-19 6.2CVO 84-24 5.3CVO 84-25 4.7F12 1923 3.5CVO 84-26 3.3CVO 84-20 2.335 MDC 1976 1.6CVO 84-28 1.5CVO 84-21 0.736 MDC 1976 0.0
2381.6153
2436.8932 2437.1036
2411.7201
2425.0619 2425.1851
2475.9387 2475.9292
2492.5972
ELEVATION 1984 (M)
2371.9861
2359.24732358.3665
ELEVATION 1985 (M)
2371.99272376.1045
2359.25492358.3740
2358.8972 2358.9045
2545.6183 2545.6183
2366.00442376.9187
2360.52542360.54662379.1235
2437.81812465.6213
2547.14312545.6183
2366.00812376.9221
2360.52982360.54912379.1269
2437.81982465.6226
2547.14182545.6183

TABLE 4
BENCHMARK
ROAD
CHANGE
CHANGE
NAME
DISTANCE 19
23-1
976
1923-1983
(KM)
(MM)
(MM)
205.5
ELEVATION CHANGES
CHANGE
CHANGE
CHANGE
CHANGE
CHANGE
CHANGE
CHANGE
CHANGE
1923-1984
1923-1985
1976-1983
1976-1984
1976
-198
5 1983-1984
1983-1985
1984
-198
5(M
M)
(MM
) (M
M)
(MM
) (M
M)
(MM
) (M
M)
(MM
)
11 MDC 19
CVO 84-1
CVO 85-23
Jll
1923
LC 58
19
722 MDC 19
23 MDC 19
24 MDC 19
CVO 84-2
CVO 85-22
25 MDC 19
CVO 85-22
CVO 84-3
CVO 84
-6CVO 85-22
Gil 19
23CVO 84-4
CVO 85-22
CVO 84-5
CVO 85-22
Fll A
Ell A2
CVO 84
-7CVO 85-22
26 MDC 19
CVO 84-22
CVO 84-8
CVO
85-22
27 MDC 19
CVO 84-9
CVO 85-22
28 MDC 19
DA 3
1934
29 MDC 19
CVO 84-10
CVO
85-22
Bll
1923
CVO 84-11
CVO
85-22
30 MDC 19
L19
1977
All 19
23CVO 84-23
31 MDC 19
USBPR7743
CVO 84-15
32 MDC 19
43.3
42.2
42.2
41.5
40.6
39.5
38.8
37.4
36.7
36.7
35.5
34.9
34.9
34.0
34.0
33.5
33.2
33.2
32.1
32.1
31.1
30.3
29.5
29.5
28.6
28.6
27.3
27.3
26.4
25.1
25.1
24.3
23.4
22.9
22.1
22.1
21.2
20.3
20.3
19.6
19.1
18.2
18.2
17.0
15.7
14.5
14.0
22
5.6
22
5.8
46
1.1
726.3
619.1
873.4
74
9.8
890.7
761.5
88
9.2
76
0.7
115.5
12
4.5
16
3.9
154.2
15
9.3
162.0
16
0.4
14
7.1
17.3
20.1
24.2
28
.440.1
73.1
13
8.5
14
6.7
184.4
17
6.7
17
9.3
17
9.1
17
7.0
164.4
20.5
20
.3
24.2
27.0
36.9
67
.9
13
5.1
14
4.7
18
9.5
175.2
17
8.1
179.1
17
7.8
16
2.9
23.0
22
.2
20
.5
22
.5
20.0
17.1
16.6
17.3
19.6
20.2
25.6
21.0
18.8
17.1
17.4
15.8
13
5.5
13
0.7
11
1.4
98.0
148.4
14
2.4
12
2.6
1
09
.5
14
7.7
14
1.6
12
4.1
1
13
.1
12.9
11.7
11.2
11.5
12.2
10.9
12.7
15.1
83
.794.3
100.2
10.6
16.5
3.2
-3.5
0.2
-1.5
0.0
-1.4
-3.2
-4.2
-5.2
-5.6
-5.9
-1.7
0.2
-3.4
-2.0
1
.2
5.1
-3.6
-1.8
-1.5
-1.0
-1.2
0.0
0.8
-1.0
-1.5
-1.3
-0.7
0
.7-0
.8
1.2
1.5
3
.6
6.6
5.9
TABLE
ELEVATION CHANGES
(CON
T)
BENCHMARK
ROAD
CHANGE
CHANGE
CHANGE
CHANGE
CHANGE
CHANGE
CHANGE
NAME
DISTANCE 1923-1976
1923-1983
1923-1984
1923
-198
5 19
76-1
983
1976-1984
1976-1985
(KM)
(MM)
(MM)
(MM)
(MM)
(M
M)
(MM)
(MM)
210.4
123.2
-9.5
CVO 84-12
CVO 84-27
33 MDC 19
CVO 84-16
CVO 84-17
D12
1923
CVO 84-13
34 MDC 19
CVO 84-14
CVO 84-18
E12
1923
CVO 84-19
CVO 84-24
CVO 84-25
F12
1923
CVO 84-26
CVO 84-20
35 MDC 19
CVO 84-28
CVO 84-21
36 MDC 19
12.9
12.9
11.9
11.6
10.6 9.9
9.4
8.7
8.2
7.4
6.9
6.2
5.3
4.7
3.5
3.3
2.3
1.6
1.5
0.7
0.0
CHANGE
1983-1984
(MM)
CHANGE
1983-1985
(MM)
0.0
0.0
0.0
0.0
0.0
CHANGE
1984-1985
(MM)
6.6
7.6
7.5
7.3
3.7
3.4
4.4
2.5
3.4
1.7
1.3
-1.3
0.0
00
I

-19-
TABLE 5 AVERAGE MAXIMUM UPLIFT RATES AT YELLOWSTONE CALDERAl
INTERVAL
1923-1976 1923-1983 1923-1984 1923-1985
1940-1976 1940-1984
1976-1983 1976-1984 1976-1985
1983-19841983-1985
1984-1985
MAXIMUM UPLIFT2
792 mm 952 mm 971 mm 969 mm
792 mm 971 mm
162 mm 179 mm 179 mm
23 mm 21 mm
0 mm5
UPLIFT RATE2
16 mm/yr2 16 mm/yr 16 mm/yr 16 mm/yr
22 mm/yr322 mm/yr3
23 mm/yr4 22 mm/yr 20 mm/yr
23 mm/yr 11 mm/yr
0 mm/yr^
^Maximum measured uplift divided by the number of years between level surveys, unless otherwise noted.
^Uplift values and rates for intervals starting in 1923 have been multiplied by 1.09 to account for the fact that the 1923 survey did not include a benchmark at the post-1976 center of uplift.
3 Assumes 1940 onset.
^Post-1976 rates exclude 26 MDC 1976, which is unstable.
on change at DA 3 1934 near former center of uplift, assuming small changes elsewhere reflect only measurement uncertainty.

-20-
TABLE 6LINE LENGTH CHANGES
SEPTEMBER 1984 - SEPTEMBER 1985
STATION 1
AMETHYST
AMETHYST
AMETHYST
CHITTENDEN
CHITTENDEN
CHITTENDEN
CONE
CONE
TROUT
STATION 2
CONE
TROUT
WASHBURN
CONE
TROUT
WASHBURN
TROUT
WASHBURN
WASHBURN
MARK TO MARK DISTANCE 1984 (M)
20591.
30878.
14615.
11309.
27632.
-
25025.
25291.
21000.
8633
4928
9699
1762
4211
5312
8931
5582
MARK TO MARK CHANGE DISTANCE (MM) 1984 (M)
20591.
30878.
14615.
11309.
27632.
34745.
25025.
25291.
21000.
8616
4864
9850
1705 -
4207
9005
5300
8830
5587
-1.
-6.
15.
-5.
-0.
-1.
-10.
0.
7
4
1
7
5
2
0
5
±7 -
±9 -
±5 -
±5 -
±8-
-
+8.
±8 -
+7.
2
5
9
3
8
2
2
3
CHANGE (PPM)
0.
0.
1.
0.
0.
0.
0.
0.
08
21
03
50
02
05
40
02

I N3
Figu
re 1.
Level
line
from La
ke Butte
to Ca
nyon
Ju
ncti
on,
with lo
cati
ons
of
1"''
J "1U/
benchmark^.
See
Tabl
e 1
for
1985
replacements.

YE
LL
OW
ST
ON
E-T
RIL
AT
ER
AT
ION
1M
ET
WO
RK
WA
SH
iUR
IO
bser
vatio
n P$
akO
_
cc
Si&
bon
fails
-S
Sn
H
lf!
r
,kX
W
"M
Peak
:
s Sen
ses
frai
l
,*'.;
mm
rgN
$6e.
rfW;*t
ffce>
wo
LAK
E
,l,:A
Wla
nfc
HB
Pea
k
?<
*i
N3 I
h'L.
.
..?;;-.
-. «
»
i*£..!;,'
...
*.
" Lo
ne S
tar f
GSV
8«
»
;C
,x
-"
>,.
; ''«
$ :
<.
',«
^'s,"
m
^
;O
;
Figu
re 2.
Precise
tril
ater
atio
n ne
twor
k es
tabl
ishe
d in
Se
ptem
ber
1984 and
remeasured in September
1985.
The Wa
shbu
rn-C
hitt
ende
n li
ne w
as no
t measured
in 1984 owing
to hi
gh w
inds;
it was
measured fo
r th
e first
time
in
1985.

TE
LLG
NS
TO
NE
L
EV
EL
C
HflN
GE
S
1923-1
976
flND
1
92
3-1
98
5
iuuu
-=
90
01
80
01
I
70
01
uj
60
01
o
=|
50
01
z
100
Io
i£
300 |
<r
= £
2001
LU
i 100
|
0-j
-1 n
n -^
LA
KE
C
AN
YO
NB
UT
TE
4
1923-1
976
4
* 19
23-1
985
'
. t
'
1
Fig
ure
3.
E
levat
ion c
hang
es at
Yel
low
stone
cald
era
duri
ng
1923
-197
6 an
d19
23-1
985,
p
lott
ed
v
ersu
s ro
ad dis
tance
al
on
g
the
level
line
show
n in
Fig
ure
1.
E E" ~ E- E- E- E E E- E- E- i- z
I ro U) I
010
20
30
D
IST
flNC
E
(KM
)50

YELL0HSTGNE LEVEL CHftNGES
1976
-198
3
200
UJ =
100
CJ o i §
i
cr LU UJ
Q
IL
AK
E
BU
TT
EC
AN
YO
N
i ro
Figu
re 4.
Elevation
changes
at Ye
llow
ston
e caldera
duri
ng 1976-1983.
The
partial
1983
survey wa
s extrapolated to
an assumed
stable base using
the
shap
e of th
e 19
76-1
984
upli
ft profile
as a
guide.
010
20
30
D
IST
flNC
E
(KM
)50
TELLONSTONE LEVEL CHflNGES
1976
-198
4
200
LU
CD
100-
CE >
LoJ
_l
UJ
0-
LA
KE
B
UT
TE 0
CA
NY
ON
Figu
re 5.
Elevation
changes
at Yellowstone
caldera
during 19
76-1
984.
10
20
30
DISTANCE
(KM)
50
I ro

LJ
O cr z CJ
CD (X >
UJ _J UJ
50 140
-
30
J
20 -
10 - 0-
-10
YELLOWSTONE LEVEL CHflNGES
1983-1984
ILAKE
BUTTE 0
CANYON
Figure 6.
El
evat
ion
chan
ges
at Yellowstone
caldera
during 1983-1984.
10
20
30
DIST
flNC
E (KM)
50

LU
CO cr X o <X >
UJ _J LU
20 10 - 0-
-10
-
-20
YELLOWSTONE LEVEL CHflNGES
1984
-198
5I
LA
KE
B
UT
TE
CA
NY
ON
I ro
Figu
re 7.
Elevation
changes
at Ye
llow
ston
e ca
lder
a du
ring
19
84-1
985.
010
20
30
DISTflNCE
(KM)
50

\\ 3#
fft"7'
'-" ̂
\^
( f
" t
"~N
. \ \
,'//((.
f\^\
YELLOWSTONE
Figu
re 8.
Topographic
map
of the
middle and
lowe
r with locations
of abandoned
stream terraces identified
terr
aces
ma
pped
by Ri
chmo
nd (1
977)
; B, two
isolated
numerous te
rrac
es 1-
10 m above current
floo
dpla
in.
Related Documents