Department of Mechanical and Industrial Engineering IOT BASED FRAMEWORK FOR COMPRESSED AIR SYSTEM MANAGEMENT IN O-I PRODUCTION ESTONIA AS IOT BAASIL PÕHINEV RAAMISTIK SURUÕHU SÜSTEEMIDE HALDAMISEKS O-I PRODUCTION ESTONIA AS’S MASTER THESIS Student: Robert Jakobson Student code: 153063 Supervisor: Eduard Ševtšenko Tallinn, 2018

Welcome message from author
This document is posted to help you gain knowledge. Please leave a comment to let me know what you think about it! Share it to your friends and learn new things together.
Transcript
Department of Mechanical and Industrial Engineering
IOT BASED FRAMEWORK FOR COMPRESSED AIR SYSTEM MANAGEMENT IN O-I PRODUCTION ESTONIA AS
IOT BAASIL PÕHINEV RAAMISTIK SURUÕHU SÜSTEEMIDE HALDAMISEKS O-I PRODUCTION ESTONIA AS’S
MASTER THESIS
Student: Robert Jakobson
Student code: 153063
Supervisor: Eduard Ševtšenko
Tallinn, 2018

AUTHOR’S DECLARATION
Hereby I declare, that I have written this thesis independently.
No academic degree has been applied for based on this material. All works, major viewpoints and
data of the other authors used in this thesis have been referenced.
“.......” .................... 2018
Author: ..............................
/signature /
Thesis is in accordance with terms and requirements
“.......” .................... 2018
Supervisor: ….........................
/signature/
Accepted for defence
“.......”....................2018
Chairman of theses defence commission: .............................................................................
/name and signature/

TUT Department of Mechanical and Industrial Engineering
THESIS TASK
Student: Robert Jakobson
Study programme: Industrial Engineering and Management
Supervisor: Eduard Ševtšenko - Associate Professor
Thesis topic:
(English) IoT based Framework for compressed air system management in O-I Production Estonia
AS
(Estonian) IoT baasil põhinev raamistik suruõhu süsteemide haldamiseks O-I Production Estonia
AS's
Thesis main objective:
To propose a framework for developing an IoT based system for compressed air system
management in order to reduce uncertainties, plan preventive actions and to collect data for
further improvements.
Thesis tasks and time schedule:
No Task description Deadline
1. Thesis topic generation 16.03.2017
2. IoT system development 20.08.2017
3. Framework deployment 23.03.2018
4. Formulation of thesis 25.05.2018
Language: English Deadline for submission of thesis: 28.may.2018
Student: Robert Jakobson .....................…….............. “.......”....................2018
/signature/
Supervisor: Eduard Ševtšenko ………….............................. “.......”......................2018
/signature/
4
CONTENTS PREFACE ................................................................................................................................. 5
LIST OF ABBREVIATIONS AND SYMBOLS ............................................................................... 6
1 INTRODUCTION ............................................................................................................. 7
2 THEORY AND METHODS ................................................................................................ 9
2.1 Industry 4.0 .................................................................................................................. 9
2.1.1 Internet of Things ............................................................................................... 12
2.2 Lean Six Sigma ........................................................................................................... 13
2.3 Reliability Engineering Tools ...................................................................................... 15
2.3.1 Basics of reliability .............................................................................................. 15
2.3.2 Reliability Prediction ........................................................................................... 16
2.3.3 Reliability Block Diagram .................................................................................... 18
2.3.4 Fault Tree Analysis .............................................................................................. 19
2.3.5 Markov Analysis .................................................................................................. 20
2.3.6 Failure Mode and Effects Analysis ...................................................................... 21
2.3.7 Selection of suitable Reliability Engineering tool ............................................... 25
3 IOT BASED FRAMEWORK DEVELOPMENT ................................................................... 28
4 FRAMEWORK DEPLOYMENT ON COMPRESSED AIR SYSTEM ...................................... 30
4.1 Overview of O-I Production Estonia AS ..................................................................... 30
4.2 Main production processes description .................................................................... 31
4.3 Detailed description of compressed air systems ....................................................... 33
4.4 FMEA analyses ........................................................................................................... 36
4.4.1 FMEA results ....................................................................................................... 38
4.5 IoT system development ........................................................................................... 40
5 DESIGNED IOT SYSTEM VALIDATION AND DEPLOYMENT ........................................... 45
5.1 Framework validation ................................................................................................ 45
5.2 IoT deployment in compressed air system ................................................................ 48
SUMMARY ........................................................................................................................... 52
KOKKUVÕTE ......................................................................................................................... 54
LIST OF REFERENCES ............................................................................................................ 56
5
PREFACE
Objective of the thesis is to develop an IoT based framework for compressed air management in O-
I Production Estonia AS for preventive and improvement actions in the system. This thesis topic was
initiated by the author and is related to authors everyday job profile as Maintenance Manager and
Plant Engineer in O-I glass container production plant in Järvakandi. Necessary data for thesis was
gathered internally from Järvakandi plant.
First and foremost, the author of the thesis would like to thank the Järvakandi previous plant
manager Piotr Jakubazko for supporting this thesis framework deployment. Hereupon, without the
guidance and perspicacity from Associate Professor Eduard Ševtšenko, this thesis would not be as
it is today. Additionally, the author of the thesis would like to share appreciation to all contributors
for this thesis from the plant, as they are: Vello Veinberg, Joonas Tiido, Tarmo Orav and Märt
Kruusmaa.
6
LIST OF ABBREVIATIONS AND SYMBOLS
IoT – Internet of things
CPS – Cyber-Physical system
OEE – Overal Equipment Effectiveness
MTBF – Mean Time Between Failures
MTTF – Mean Time To Failure
MTTR – Mean Time To Repair
RP – Reliability Prediction
RBD - Reliability Block Diagram
FTA – Fault Tree Analysis
FMEA – Fault Mode and Effect Analysis
RPN – Risk Priority Number
LPS – Low Pressure System
HPS – High Pressure System
O-I – Owens Illinois
ROI – Return on Investment
7
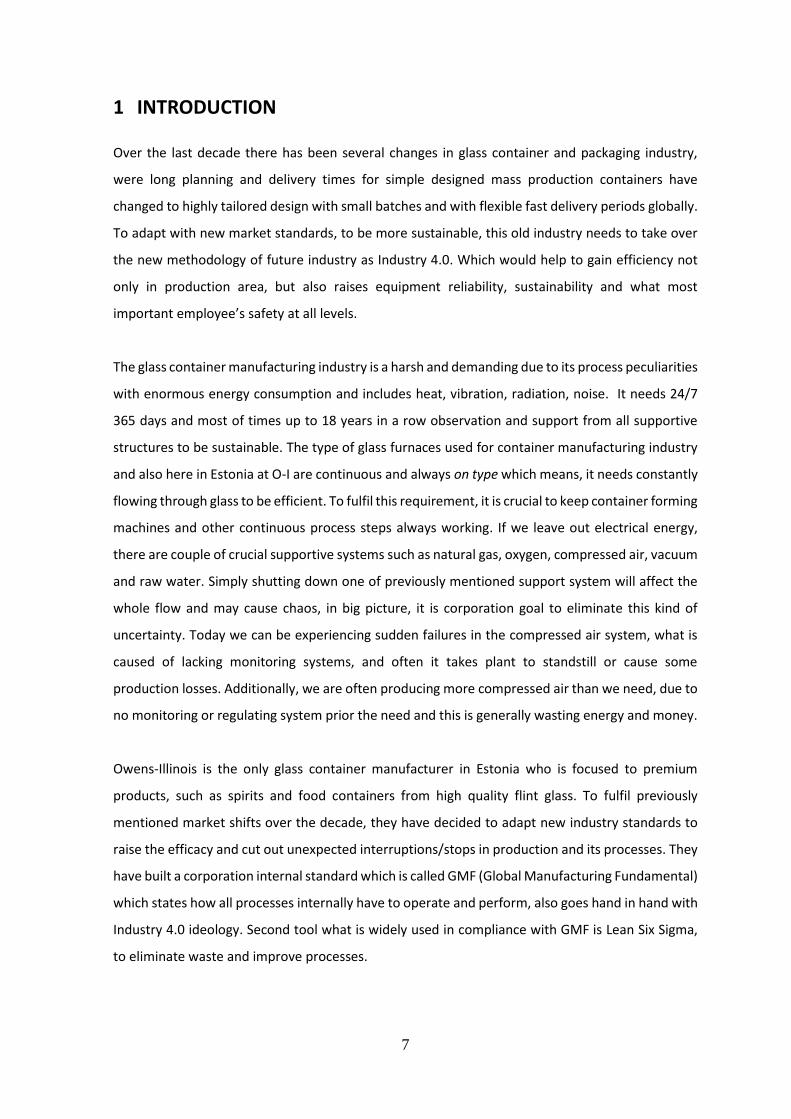
1 INTRODUCTION
Over the last decade there has been several changes in glass container and packaging industry,
were long planning and delivery times for simple designed mass production containers have
changed to highly tailored design with small batches and with flexible fast delivery periods globally.
To adapt with new market standards, to be more sustainable, this old industry needs to take over
the new methodology of future industry as Industry 4.0. Which would help to gain efficiency not
only in production area, but also raises equipment reliability, sustainability and what most
important employee’s safety at all levels.
The glass container manufacturing industry is a harsh and demanding due to its process peculiarities
with enormous energy consumption and includes heat, vibration, radiation, noise. It needs 24/7
365 days and most of times up to 18 years in a row observation and support from all supportive
structures to be sustainable. The type of glass furnaces used for container manufacturing industry
and also here in Estonia at O-I are continuous and always on type which means, it needs constantly
flowing through glass to be efficient. To fulfil this requirement, it is crucial to keep container forming
machines and other continuous process steps always working. If we leave out electrical energy,
there are couple of crucial supportive systems such as natural gas, oxygen, compressed air, vacuum
and raw water. Simply shutting down one of previously mentioned support system will affect the
whole flow and may cause chaos, in big picture, it is corporation goal to eliminate this kind of
uncertainty. Today we can be experiencing sudden failures in the compressed air system, what is
caused of lacking monitoring systems, and often it takes plant to standstill or cause some
production losses. Additionally, we are often producing more compressed air than we need, due to
no monitoring or regulating system prior the need and this is generally wasting energy and money.
Owens-Illinois is the only glass container manufacturer in Estonia who is focused to premium
products, such as spirits and food containers from high quality flint glass. To fulfil previously
mentioned market shifts over the decade, they have decided to adapt new industry standards to
raise the efficacy and cut out unexpected interruptions/stops in production and its processes. They
have built a corporation internal standard which is called GMF (Global Manufacturing Fundamental)
which states how all processes internally have to operate and perform, also goes hand in hand with
Industry 4.0 ideology. Second tool what is widely used in compliance with GMF is Lean Six Sigma,
to eliminate waste and improve processes.
8
The main objective of this thesis is to propose a possible solution for continuous observation for
critical support system as compressed air, by applying IoT, Industry 4.0 ideology, reliability
engineering tools and Lean Six Sigma methodology. Main focus points for continuous observation
are to:
Downtime and cause registration
Preventive maintenance planning
Resource measuring and optimization
Equipment lifecycle/health evaluation
Furthermore, previously mentioned data will help management to make decision on future
investments, putting together maintenance budget, scheduling workforce and planning downtime
on machines. Secondly, and the most important factor is reliability as safety gain.
The structure of the thesis is as follows. First chapter gives a through overview of used ideology’s
and methodologies in the thesis as they are basis for framework development and deployment. It
includes Industry 4.0, IoT, Lean Six Sigma ideologies and Reliability engineering tools for
improvement analyses. Chapter ends with selecting suitable reliability engineering tool for the
framework development. As it follows, next chapter covers an IoT based framework development
with step-by-step description how it can be used. Following chapter gives an overview of Järvakandi
O-I plant and its production processes. In the first part of chapter, will be described how dependent
is plant on compressed air. Chapter includes also compressed air system detailed description and
current layout. Further on, FMEA analysis will be performed in sight of IoT system design. Chapter
ends with developed IoT solution layout and payback calculations. Last chapter is about framework
deployment in the plant, where first will be proven provided system feasibility and there on step-
by-step implementation of designed system.
9
2 THEORY AND METHODS
In this chapter the author of the thesis will give an overview of Industry 4.0, IoT and Lean Six Sigma
ideologies what are implemented together with one of the Reliability Engineering tool for building
an IoT based infrastructure to monitor compressed air systems. Chapter covers also most widely
used reliability engineering tools and ends with choosing the most suitable one for developing and
IoT based management system.
2.1 Industry 4.0
It states to be high-tech project, started by the German government, who promotes the
computerization of manufacturing. Before moving onto Industry 4.0, it would be beneficial to give
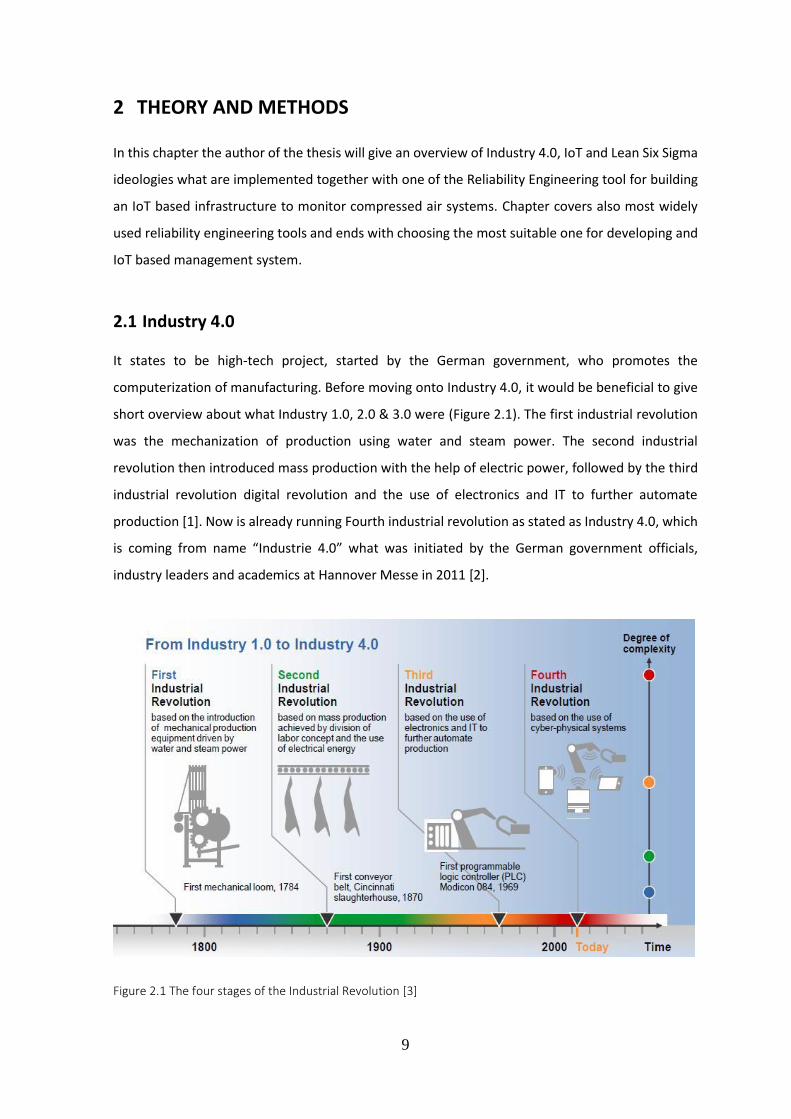
short overview about what Industry 1.0, 2.0 & 3.0 were (Figure 2.1). The first industrial revolution
was the mechanization of production using water and steam power. The second industrial
revolution then introduced mass production with the help of electric power, followed by the third
industrial revolution digital revolution and the use of electronics and IT to further automate
production [1]. Now is already running Fourth industrial revolution as stated as Industry 4.0, which
is coming from name “Industrie 4.0” what was initiated by the German government officials,
industry leaders and academics at Hannover Messe in 2011 [2].
Figure 2.1 The four stages of the Industrial Revolution [3]
10
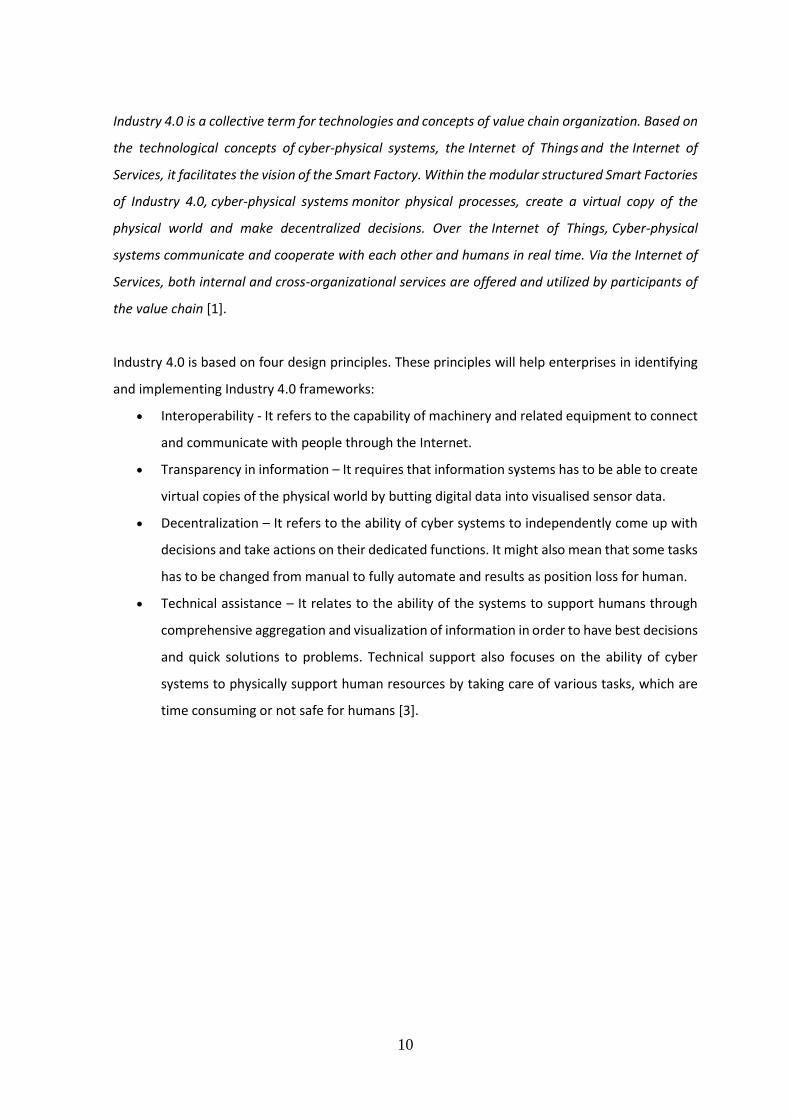
Industry 4.0 is a collective term for technologies and concepts of value chain organization. Based on
the technological concepts of cyber-physical systems, the Internet of Things and the Internet of
Services, it facilitates the vision of the Smart Factory. Within the modular structured Smart Factories
of Industry 4.0, cyber-physical systems monitor physical processes, create a virtual copy of the
physical world and make decentralized decisions. Over the Internet of Things, Cyber-physical
systems communicate and cooperate with each other and humans in real time. Via the Internet of
Services, both internal and cross-organizational services are offered and utilized by participants of
the value chain [1].
Industry 4.0 is based on four design principles. These principles will help enterprises in identifying
and implementing Industry 4.0 frameworks:
Interoperability - It refers to the capability of machinery and related equipment to connect
and communicate with people through the Internet.
Transparency in information – It requires that information systems has to be able to create
virtual copies of the physical world by butting digital data into visualised sensor data.
Decentralization – It refers to the ability of cyber systems to independently come up with
decisions and take actions on their dedicated functions. It might also mean that some tasks
has to be changed from manual to fully automate and results as position loss for human.
Technical assistance – It relates to the ability of the systems to support humans through
comprehensive aggregation and visualization of information in order to have best decisions
and quick solutions to problems. Technical support also focuses on the ability of cyber
systems to physically support human resources by taking care of various tasks, which are
time consuming or not safe for humans [3].
11
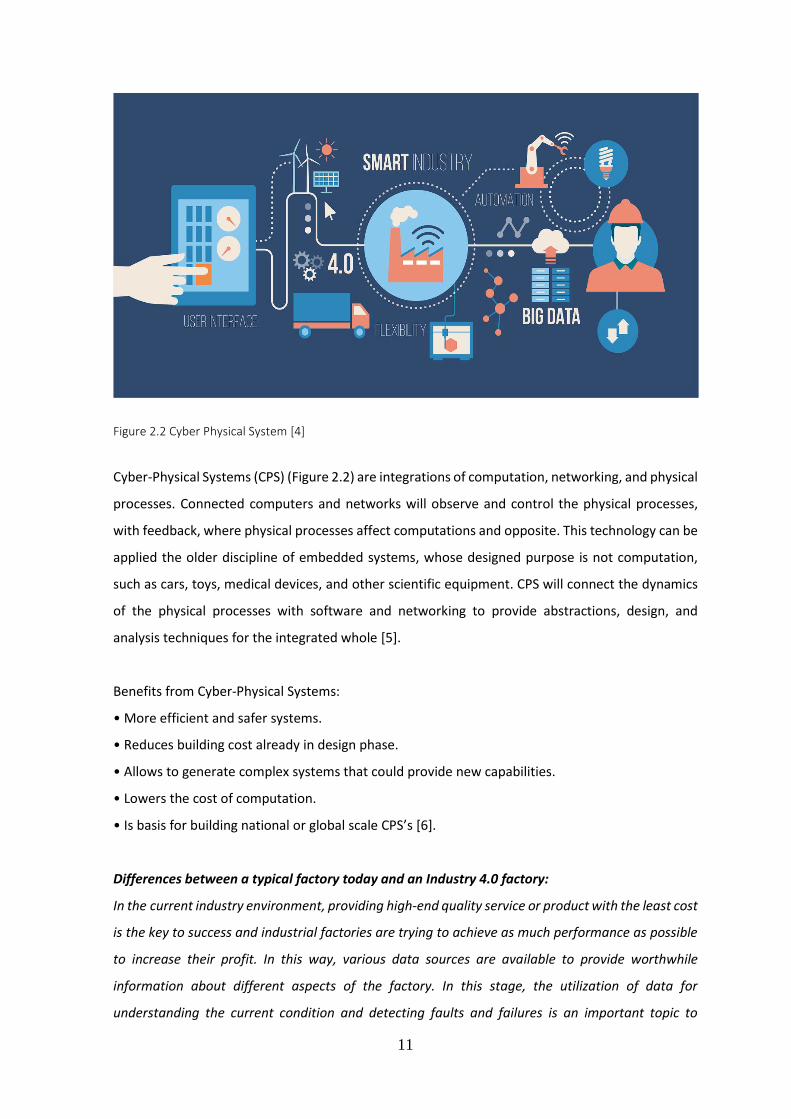
Figure 2.2 Cyber Physical System [4]
Cyber-Physical Systems (CPS) (Figure 2.2) are integrations of computation, networking, and physical
processes. Connected computers and networks will observe and control the physical processes,
with feedback, where physical processes affect computations and opposite. This technology can be
applied the older discipline of embedded systems, whose designed purpose is not computation,
such as cars, toys, medical devices, and other scientific equipment. CPS will connect the dynamics
of the physical processes with software and networking to provide abstractions, design, and
analysis techniques for the integrated whole [5].
Benefits from Cyber-Physical Systems:
• More efficient and safer systems.
• Reduces building cost already in design phase.
• Allows to generate complex systems that could provide new capabilities.
• Lowers the cost of computation.
• Is basis for building national or global scale CPS’s [6].
Differences between a typical factory today and an Industry 4.0 factory:
In the current industry environment, providing high-end quality service or product with the least cost
is the key to success and industrial factories are trying to achieve as much performance as possible
to increase their profit. In this way, various data sources are available to provide worthwhile
information about different aspects of the factory. In this stage, the utilization of data for
understanding the current condition and detecting faults and failures is an important topic to
12
research. For instance, in production, there are various commercial tools available to provide OEE
(Overall Equipment Effectiveness) information to factory management in order to highlight root
cause of problems and possible faults in the system.
In comparison, in an Industry 4.0 factory, in addition to condition monitoring and fault diagnosis,
components and systems are able to gain self-awareness and self-prediction, which will provide
management with more insight on the status of the factory. Furthermore, peer-to-peer comparison
and fusion of health information from various components provides a precise health prediction in
component and system levels and force factory management to trigger required maintenance at
the best possible time to reach just-in time maintenance and gain near zero downtime.
Modern information and communication technologies like Cyber-Physical Systems, Big Data and
Cloud Computing will help predict the possibility to increase productivity, quality and flexibility
within the manufacturing industry and thus to understand advantages within the competition [1].
2.1.1 Internet of Things
The Internet of Things or IoT is an umbrella term for a broad range of underlying technologies and
services, which depend on the use cases and in turn are part of a broader technology ecosystem
which includes related technologies such as artificial intelligence, cloud computing, next-gen
cybersecurity, advanced analytics, big data, various connectivity-communication technologies,
digital twin simulation, augmented and virtual reality, block chain and more. The IoT is an additional
layer of information, interaction, transaction and action which is added to the Internet thanks to
devices, equipped with data sensing, analysis and communication capabilities, using Internet
technologies. The Internet of Things further bridges digital and physical realities and powers
information-driven automation and improvements on the level of business, society and people’s
lives (Figure 2.3).
13
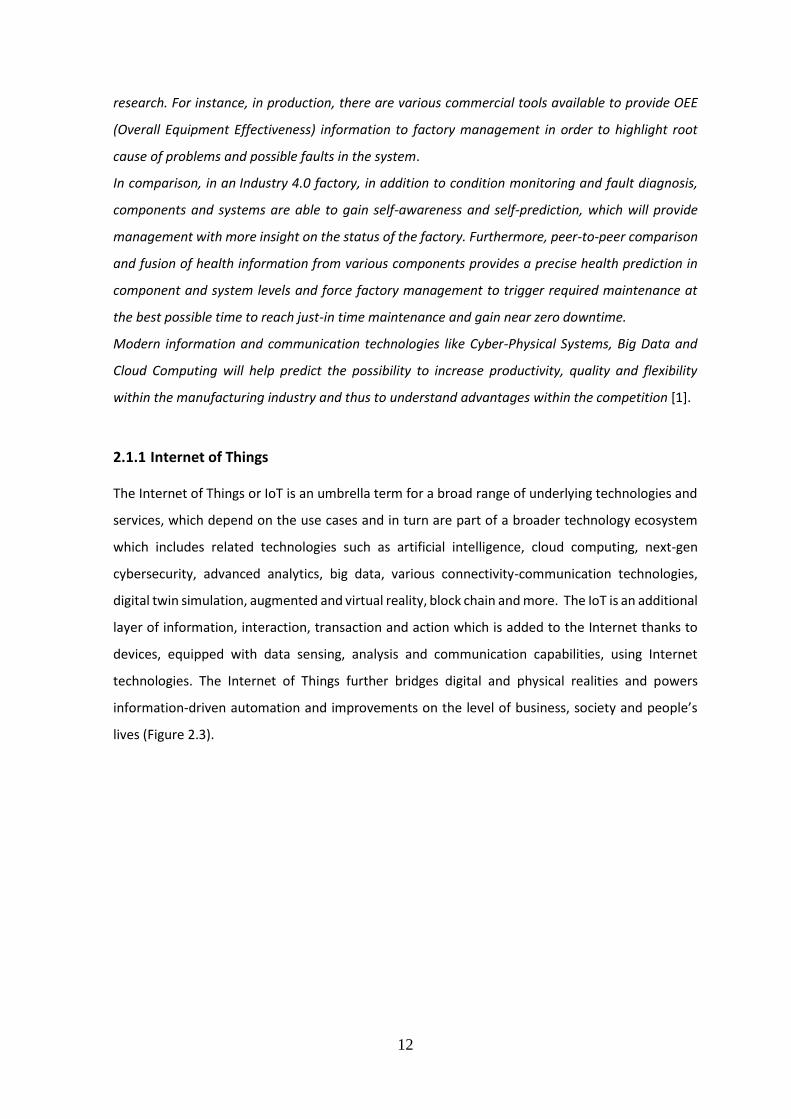
Figure 2.3 The Internet of Things from connecting devices to human value [7]
Captured, aggregated and analysed data are leveraged for several use cases, including
maintenance, human, semi-autonomous and autonomous decisions (whereby data flows do not
just come from IoT- enabled devices but also are exchanged between them, occur within them or
are sent to them in the form of instructions), scientific research, real-time monitoring, data
exchanges, new business models and far more [7].
2.2 Lean Six Sigma
Lean Six Sigma is a fact based and data driven philosophy of improvements that values most defect
prevention rather than defect detection. It drives customer satisfaction and basic results by
reducing variation, waste, and cycle times. Additionally, promoting the work standardization and
flow optimization, what will result as competitive advantage. It is applicable anywhere when
variation and waste exist, thus every employee has to be involved.
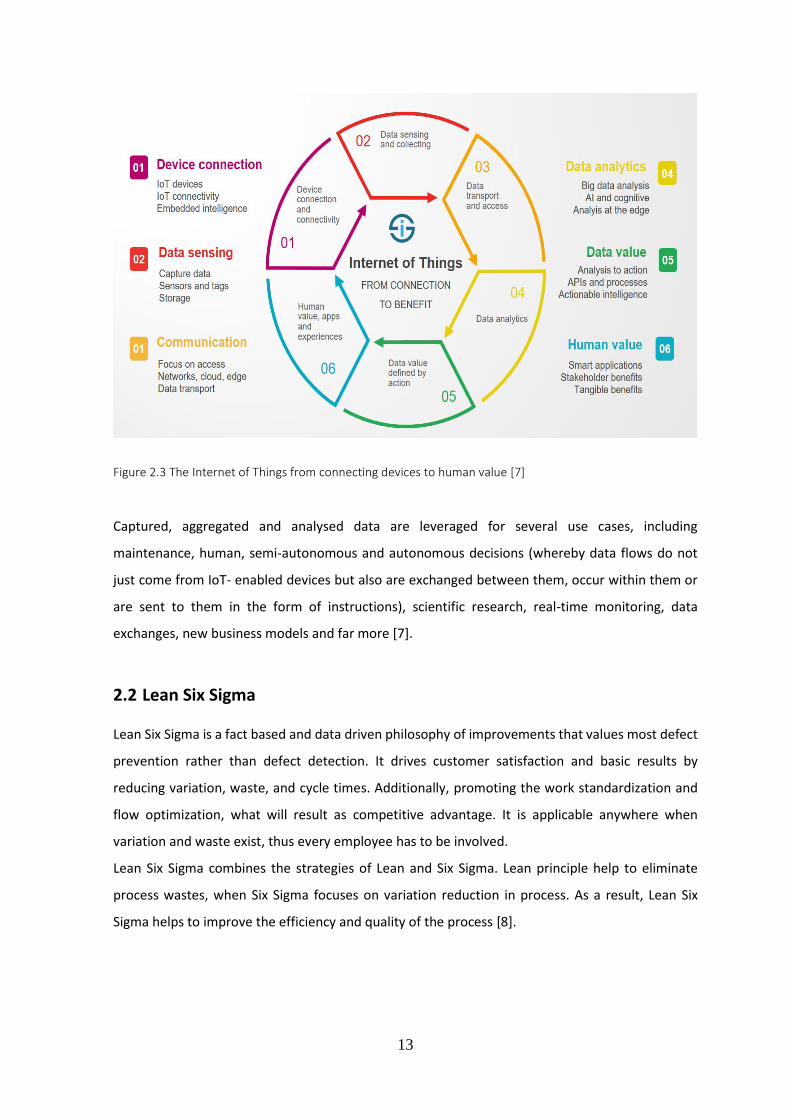
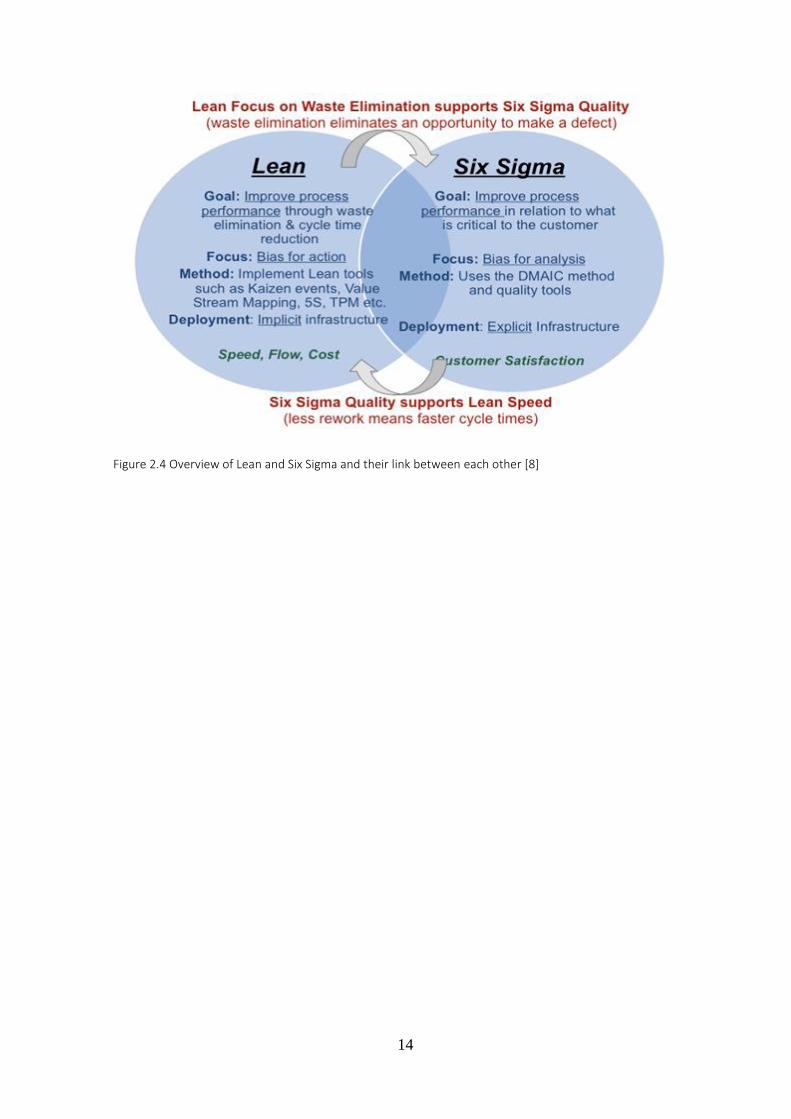
Lean Six Sigma combines the strategies of Lean and Six Sigma. Lean principle help to eliminate
process wastes, when Six Sigma focuses on variation reduction in process. As a result, Lean Six
Sigma helps to improve the efficiency and quality of the process [8].
14
Figure 2.4 Overview of Lean and Six Sigma and their link between each other [8]
15
2.3 Reliability Engineering Tools
2.3.1 Basics of reliability
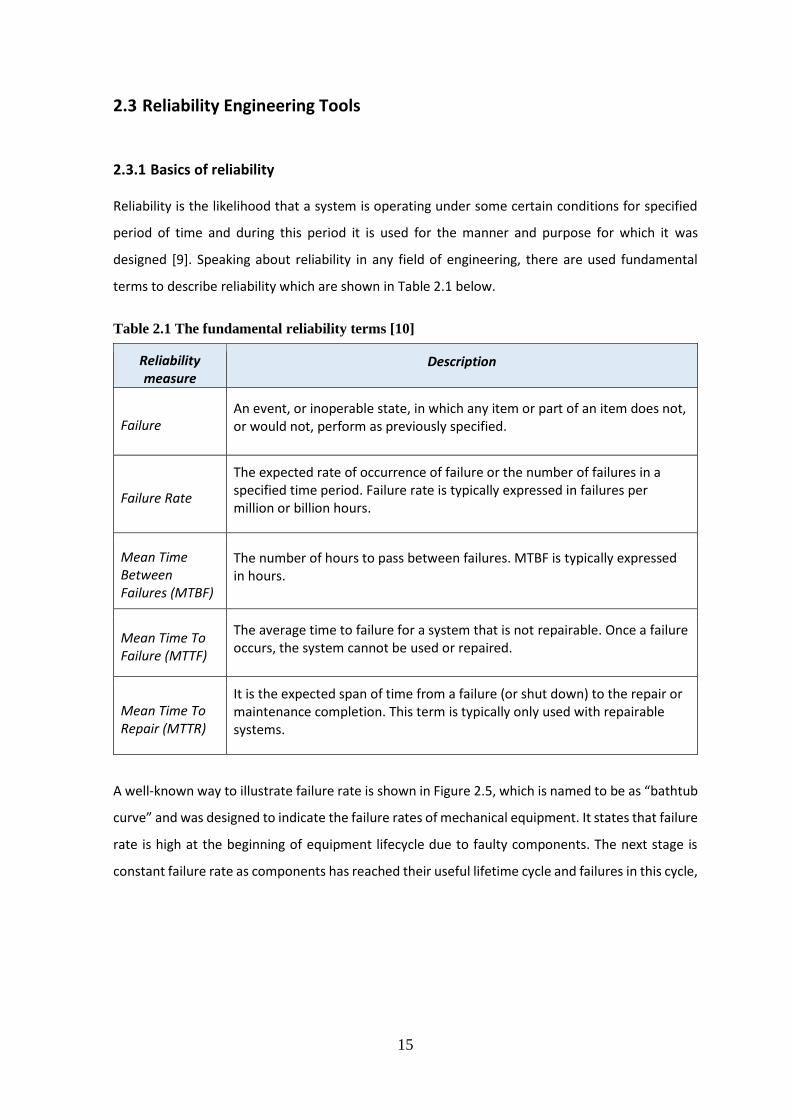
Reliability is the likelihood that a system is operating under some certain conditions for specified
period of time and during this period it is used for the manner and purpose for which it was
designed [9]. Speaking about reliability in any field of engineering, there are used fundamental
terms to describe reliability which are shown in Table 2.1 below.
Table 2.1 The fundamental reliability terms [10]
Reliability measure
Description
Failure An event, or inoperable state, in which any item or part of an item does not, or would not, perform as previously specified.
Failure Rate
The expected rate of occurrence of failure or the number of failures in a specified time period. Failure rate is typically expressed in failures per million or billion hours.
Mean Time Between Failures (MTBF)
The number of hours to pass between failures. MTBF is typically expressed in hours.
Mean Time To Failure (MTTF)
The average time to failure for a system that is not repairable. Once a failure occurs, the system cannot be used or repaired.
Mean Time To Repair (MTTR)
It is the expected span of time from a failure (or shut down) to the repair or maintenance completion. This term is typically only used with repairable systems.
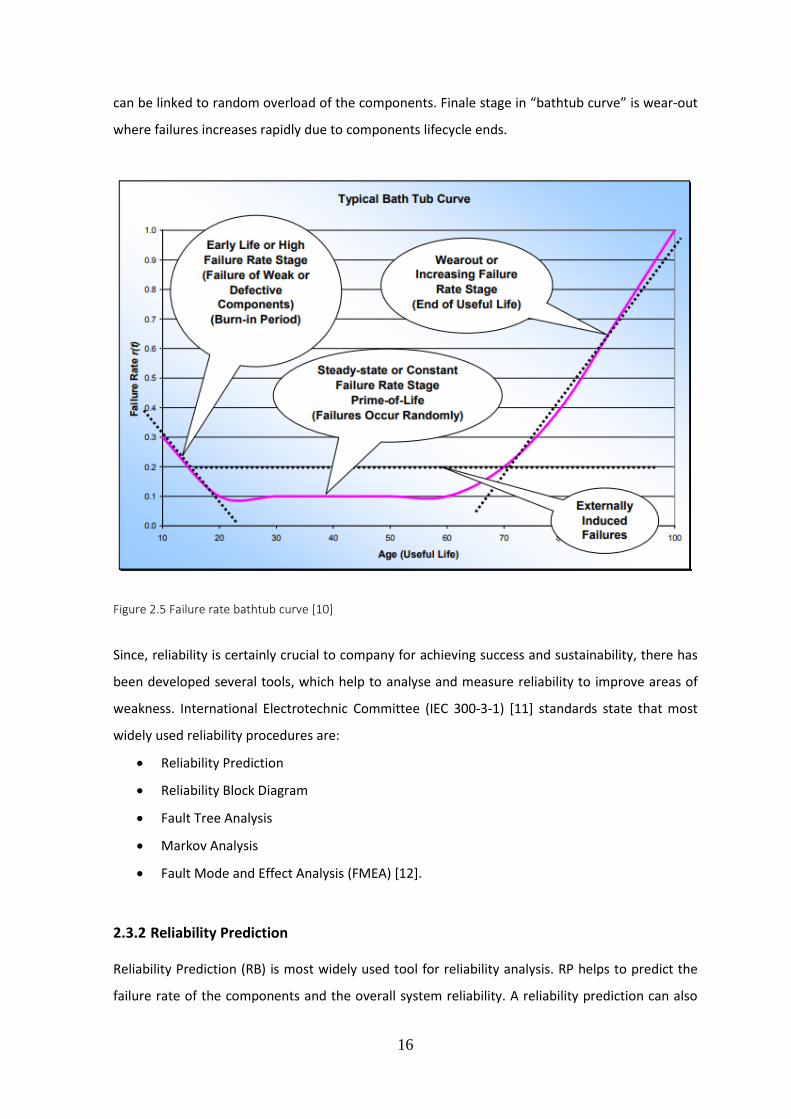
A well-known way to illustrate failure rate is shown in Figure 2.5, which is named to be as “bathtub
curve” and was designed to indicate the failure rates of mechanical equipment. It states that failure
rate is high at the beginning of equipment lifecycle due to faulty components. The next stage is
constant failure rate as components has reached their useful lifetime cycle and failures in this cycle,
16
can be linked to random overload of the components. Finale stage in “bathtub curve” is wear-out
where failures increases rapidly due to components lifecycle ends.
Figure 2.5 Failure rate bathtub curve [10]
Since, reliability is certainly crucial to company for achieving success and sustainability, there has
been developed several tools, which help to analyse and measure reliability to improve areas of
weakness. International Electrotechnic Committee (IEC 300-3-1) [11] standards state that most
widely used reliability procedures are:
Reliability Prediction
Reliability Block Diagram
Fault Tree Analysis
Markov Analysis
Fault Mode and Effect Analysis (FMEA) [12].
2.3.2 Reliability Prediction
Reliability Prediction (RB) is most widely used tool for reliability analysis. RP helps to predict the
failure rate of the components and the overall system reliability. A reliability prediction can also
17
assist in evaluating the significance of reported failures. At the end, the results obtained by
performing a reliability prediction analysis can be useful when conducting further analyses such as
a FMEA (Failure Mode and Effect Analyses), RBD (Reliability Block Diagram) or a Fault Tree analysis.
The reliability predictions are used to evaluate the probabilities of failure events described in these
alternate failure analysis models. At a certain point in time, a component or system is either
functioning or failed, and that the component or system operating state changes as time evolves.
Any operating component or system will eventually fail. The failed state will continue forever, if the
component or system is non-repairable. A repairable component or system will remain in the failed
state for a period of time while it is being repaired and then transcends back to the functioning
state when the repair is completed. This transition is assumed to be instantaneous. The change
from a functioning to a failed state is failure while the change from a failure to a functioning state
is referred to as repair. It is also assumed that repairs bring the component or system back to an
“as good as new” condition. This cycle continues with the repair-to-failure and the failure-to-repair
process; and then, repeats over and over in a repairable system [10].
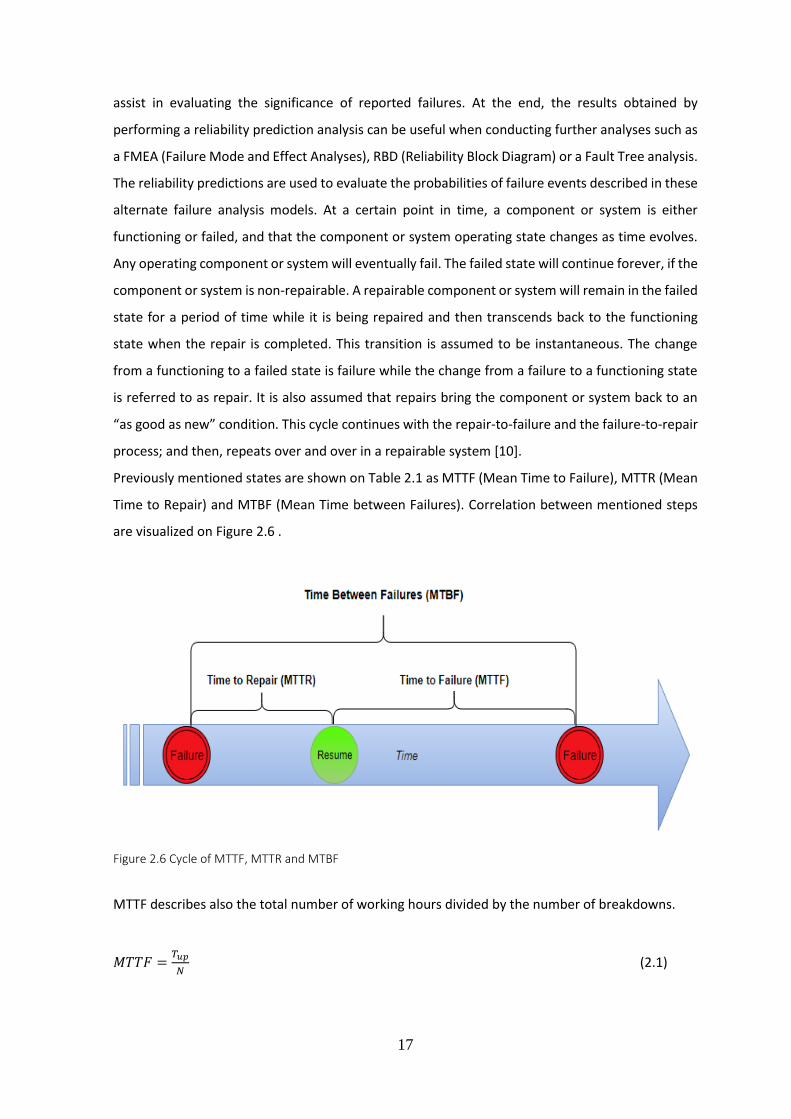
Previously mentioned states are shown on Table 2.1 as MTTF (Mean Time to Failure), MTTR (Mean
Time to Repair) and MTBF (Mean Time between Failures). Correlation between mentioned steps
are visualized on Figure 2.6 .
Figure 2.6 Cycle of MTTF, MTTR and MTBF
MTTF describes also the total number of working hours divided by the number of breakdowns.
𝑀𝑇𝑇𝐹 =𝑇𝑢𝑝
𝑁 (2.1)

18
Where
Tup = total uptime
N = Number of breakdowns
MTTR defines the total time spent on performing corrective/fixing actions or preventive
maintenance repairs divided by the total numbers of these actions. It typically can be used only
with repairable systems.
𝑀𝑇𝑇𝑅 =𝑇𝑑𝑜𝑤𝑛
𝑁 (2.2)
Where
Tdown = total downtime
N = Number of breakdowns
The basic measure for repairable systems is MTBF. It concludes total time from one failure to
another and often calculated as sum of MTTR and MTTF [13].
𝑀𝑇𝐵𝐹 = 𝑀𝑇𝑇𝑅 + 𝑀𝑇𝑇𝐹 =𝑇𝑢𝑝+𝑇𝑑𝑜𝑤𝑛
𝑁 (2.3)
2.3.3 Reliability Block Diagram
Reliability Block Diagram (RBD) is a deductive method to evaluate reliability of a system. RBD gives
a visual analysis of logical structure of the system, on which individual partial systems and/or parts
some reliability connections exist. This method allows representing the possible ways of successful
operation of the system by those arrays (partial systems/components) the common operation of
which is necessary for the operation of the system. There are several methods for evaluation of the
reliability diagram. Depending on the type of the system structure, simple Boolean-like methods,
analysis of the successful way of operation as well as truth tables can be used to predict the
reliability and usability of the system.
The rational course of a RBD stems from an input node located at the left side of the diagram. The
input node flows to arrangements of series or parallel blocks that conclude to the output node at
the right side of the diagram. A diagram should only contain one input and one output node. The
RBD system is connected by a parallel or series configuration. A parallel connection is used to show
redundancy and is joined by multiple links or paths from the Start Node to the End Node. A series
connection is joined by one continuous link from the Start Node to the End Node.
19
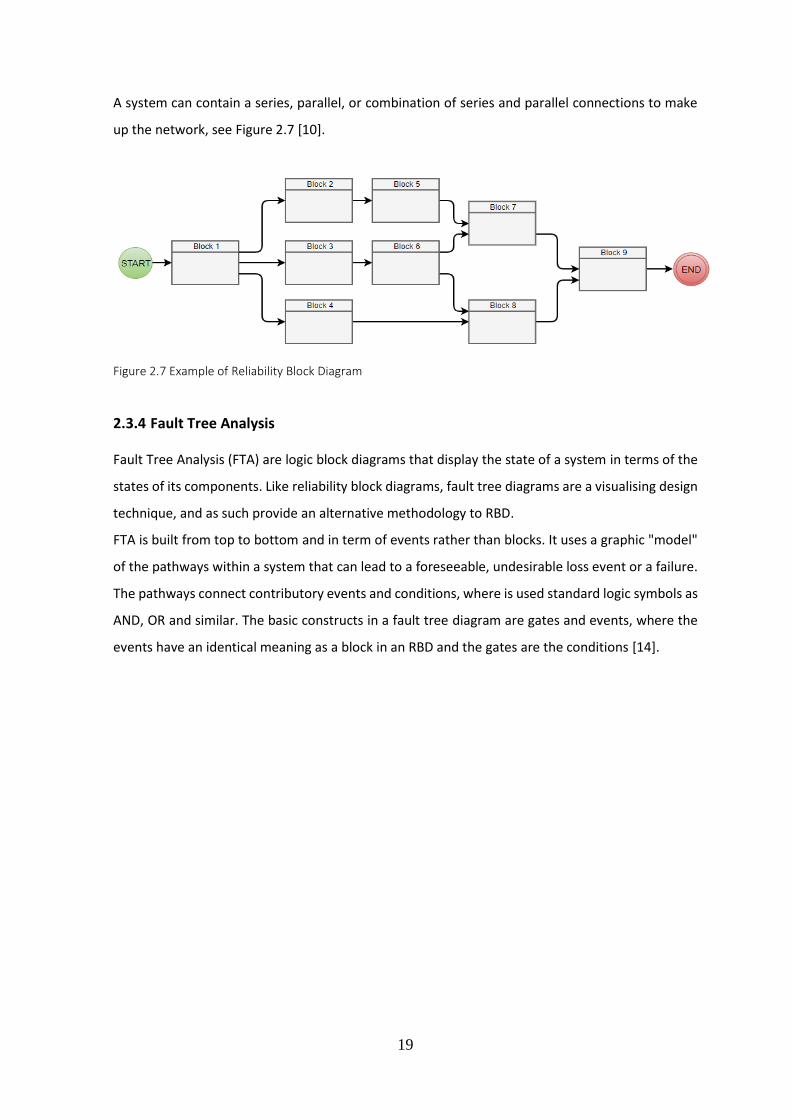
A system can contain a series, parallel, or combination of series and parallel connections to make
up the network, see Figure 2.7 [10].
Figure 2.7 Example of Reliability Block Diagram
2.3.4 Fault Tree Analysis
Fault Tree Analysis (FTA) are logic block diagrams that display the state of a system in terms of the
states of its components. Like reliability block diagrams, fault tree diagrams are a visualising design
technique, and as such provide an alternative methodology to RBD.
FTA is built from top to bottom and in term of events rather than blocks. It uses a graphic "model"
of the pathways within a system that can lead to a foreseeable, undesirable loss event or a failure.
The pathways connect contributory events and conditions, where is used standard logic symbols as
AND, OR and similar. The basic constructs in a fault tree diagram are gates and events, where the
events have an identical meaning as a block in an RBD and the gates are the conditions [14].
20
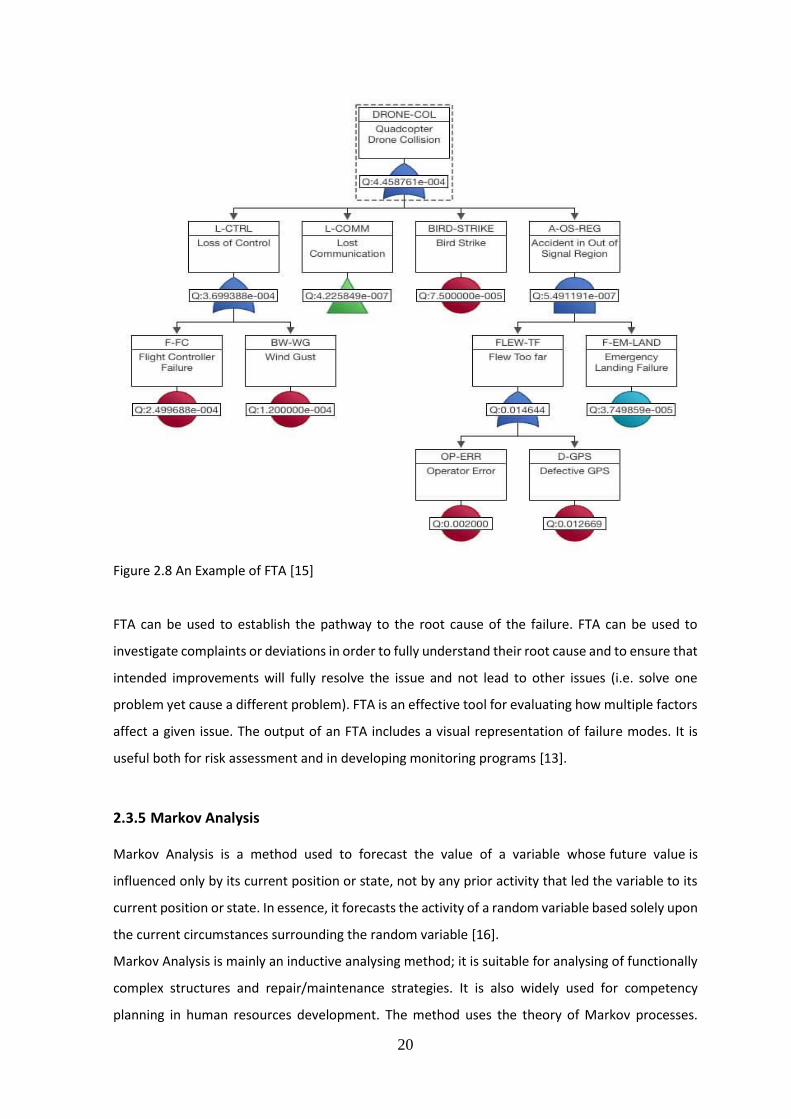
Figure 2.8 An Example of FTA [15]
FTA can be used to establish the pathway to the root cause of the failure. FTA can be used to
investigate complaints or deviations in order to fully understand their root cause and to ensure that
intended improvements will fully resolve the issue and not lead to other issues (i.e. solve one
problem yet cause a different problem). FTA is an effective tool for evaluating how multiple factors
affect a given issue. The output of an FTA includes a visual representation of failure modes. It is
useful both for risk assessment and in developing monitoring programs [13].
2.3.5 Markov Analysis
Markov Analysis is a method used to forecast the value of a variable whose future value is
influenced only by its current position or state, not by any prior activity that led the variable to its
current position or state. In essence, it forecasts the activity of a random variable based solely upon
the current circumstances surrounding the random variable [16].
Markov Analysis is mainly an inductive analysing method; it is suitable for analysing of functionally
complex structures and repair/maintenance strategies. It is also widely used for competency
planning in human resources development. The method uses the theory of Markov processes.

21
Theoretically it evaluates probability of being in a given functional status of system elements (parts,
partial systems) or probability of occurrence of given events at given times or periods [12].
Figure 2.9 An example of Marko Analysis in manufacturing operations [17]
2.3.6 Failure Mode and Effects Analysis
Failure Mode and Effects Analysis as FMEA, is a reliability procedure which gives an estimation of
potential failure modes for processes and also how they might affect its outcome on products. With
failure mode analysis, this tool defines the effect of each failure and identifies single failure points
that are crucial to achieve targeted goals and staff safety. FMEA is most suitable when it is examined
what effects have faults of basic materials, parts and equipment on the next functional level of
higher, and also what fault mechanism can be found at this level. Most commonly FMEA is applied
to equipment, facilities or processes, it means it can be used to analyse a manufacturing operation
and its effect on product or process. The outcome of FMEA can be used as a basis for design or
further analysis or for guidance of resource deployment [18].
IN FMEA analysis, each failure what is studied, is considered to be the only failure in the system,
what mean that it is single failure analysis. FMEA utilizes inductive logic in a "bottoms up" approach.
Beginning at the lowest level of the system hierarchy and from a knowledge of the failure modes
of each part, the analyst traces up through the system hierarchy to determine the effect that each
failure mode will have on system performance [9].
22
FMEA analysis has to be team based to conduct knowledge and experiences from variety of
specialist, for example engineers from area of design, manufacturing, quality and repairs. Never the
less, FMEA is team based to gather data from different areas, there has to be one person who is
responsible of collection of the data.
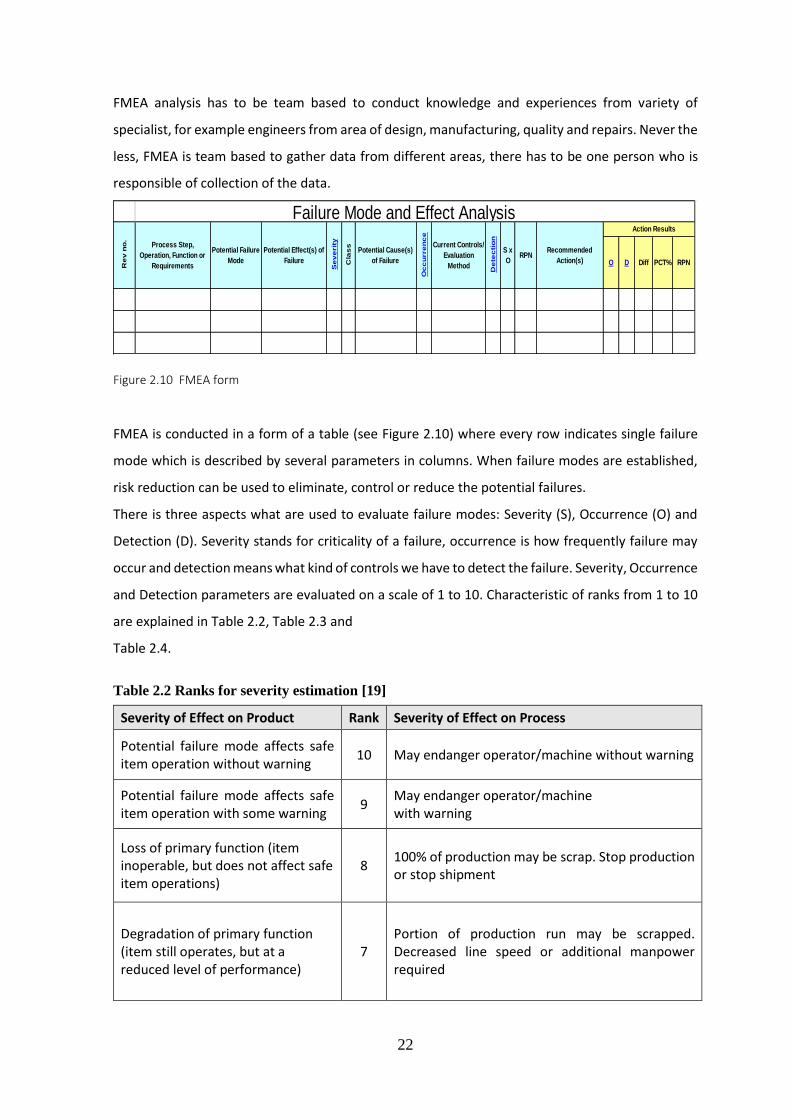
Figure 2.10 FMEA form
FMEA is conducted in a form of a table (see Figure 2.10) where every row indicates single failure
mode which is described by several parameters in columns. When failure modes are established,
risk reduction can be used to eliminate, control or reduce the potential failures.
There is three aspects what are used to evaluate failure modes: Severity (S), Occurrence (O) and
Detection (D). Severity stands for criticality of a failure, occurrence is how frequently failure may
occur and detection means what kind of controls we have to detect the failure. Severity, Occurrence
and Detection parameters are evaluated on a scale of 1 to 10. Characteristic of ranks from 1 to 10
are explained in Table 2.2, Table 2.3 and
Table 2.4.
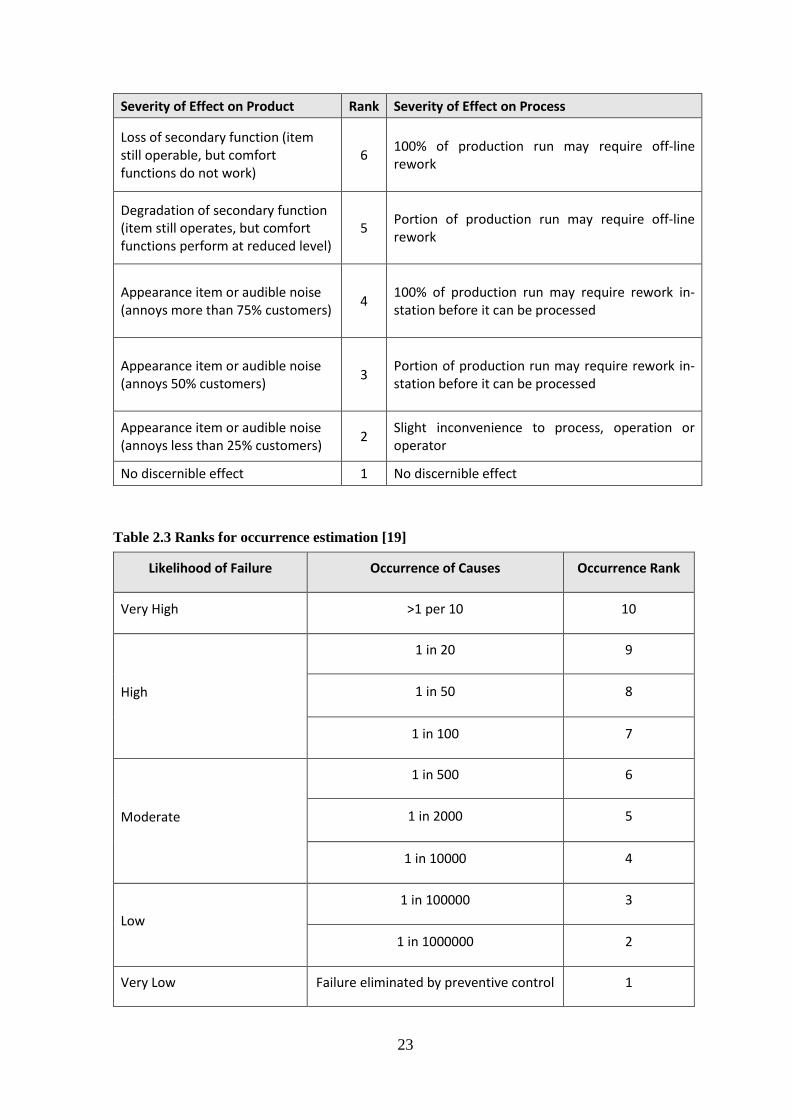
Table 2.2 Ranks for severity estimation [19]
Severity of Effect on Product Rank Severity of Effect on Process
Potential failure mode affects safe item operation without warning
10 May endanger operator/machine without warning
Potential failure mode affects safe item operation with some warning
9 May endanger operator/machine with warning
Loss of primary function (item inoperable, but does not affect safe item operations)
8 100% of production may be scrap. Stop production or stop shipment
Degradation of primary function (item still operates, but at a reduced level of performance)
7 Portion of production run may be scrapped. Decreased line speed or additional manpower required
O D Diff PCT% RPN
Action Results
Re
v n
o.
Failure Mode and Effect Analysis
Potential Failure
Mode
Process Step,
Operation, Function or
Requirements Cla
ss
Oc
cu
rre
nc
e
Potential Cause(s)
of Failure
Se
ve
rit
y
Potential Effect(s) of
Failure
S x
O
De
tec
tio
n
Current Controls/
Evaluation
Method
Recommended
Action(s)RPN
23
Severity of Effect on Product Rank Severity of Effect on Process
Loss of secondary function (item still operable, but comfort functions do not work)
6 100% of production run may require off-line rework
Degradation of secondary function (item still operates, but comfort functions perform at reduced level)
5 Portion of production run may require off-line rework
Appearance item or audible noise (annoys more than 75% customers)
4 100% of production run may require rework in-station before it can be processed
Appearance item or audible noise (annoys 50% customers)
3 Portion of production run may require rework in-station before it can be processed
Appearance item or audible noise (annoys less than 25% customers)
2 Slight inconvenience to process, operation or operator
No discernible effect 1 No discernible effect
Table 2.3 Ranks for occurrence estimation [19]
Likelihood of Failure Occurrence of Causes Occurrence Rank
Very High >1 per 10 10
High
1 in 20 9
1 in 50 8
1 in 100 7
Moderate
1 in 500 6
1 in 2000 5
1 in 10000 4
Low
1 in 100000 3
1 in 1000000 2
Very Low Failure eliminated by preventive control 1
24
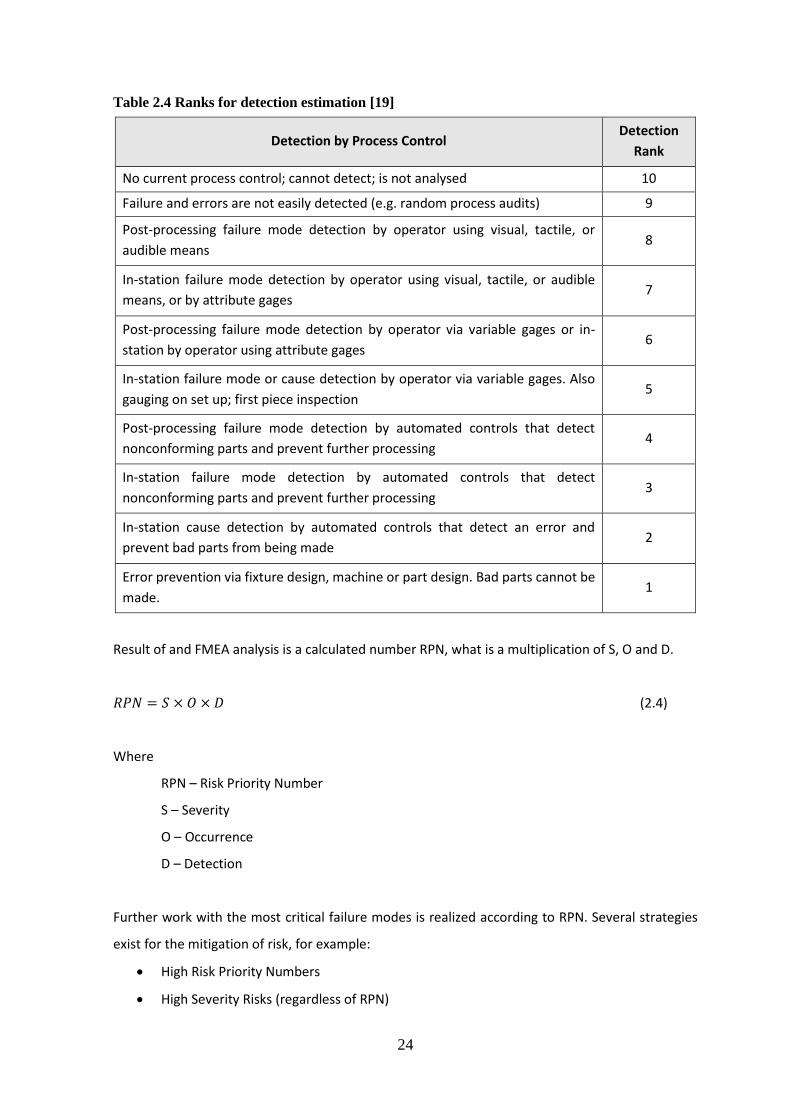
Table 2.4 Ranks for detection estimation [19]
Detection by Process Control Detection
Rank
No current process control; cannot detect; is not analysed 10
Failure and errors are not easily detected (e.g. random process audits) 9
Post-processing failure mode detection by operator using visual, tactile, or
audible means 8
In-station failure mode detection by operator using visual, tactile, or audible
means, or by attribute gages 7
Post-processing failure mode detection by operator via variable gages or in-
station by operator using attribute gages 6
In-station failure mode or cause detection by operator via variable gages. Also
gauging on set up; first piece inspection 5
Post-processing failure mode detection by automated controls that detect
nonconforming parts and prevent further processing 4
In-station failure mode detection by automated controls that detect
nonconforming parts and prevent further processing 3
In-station cause detection by automated controls that detect an error and
prevent bad parts from being made 2
Error prevention via fixture design, machine or part design. Bad parts cannot be
made. 1
Result of and FMEA analysis is a calculated number RPN, what is a multiplication of S, O and D.
𝑅𝑃𝑁 = 𝑆 × 𝑂 × 𝐷 (2.4)
Where
RPN – Risk Priority Number
S – Severity
O – Occurrence
D – Detection
Further work with the most critical failure modes is realized according to RPN. Several strategies
exist for the mitigation of risk, for example:
High Risk Priority Numbers
High Severity Risks (regardless of RPN)
25
High Design Risk (Severity x Occurrence)
Other Alternatives (S, O, D) and (S, D) [13].
As mentioned the outcome of FMEA is RPN number, what is product of three parameters what
measure the risk of a failure or fault. Since, RPN is result of multiplication of three parameters it has
no meaning as a number, it is useful only for comparison of two solutions. Although, FMEA is widely
used and successful tool, but the most value will bring in as management tool, not as technical
prediction tool. It is ideal tool to evaluate systems for implementing continuous improvement and
lean strategies for reliability engineering.
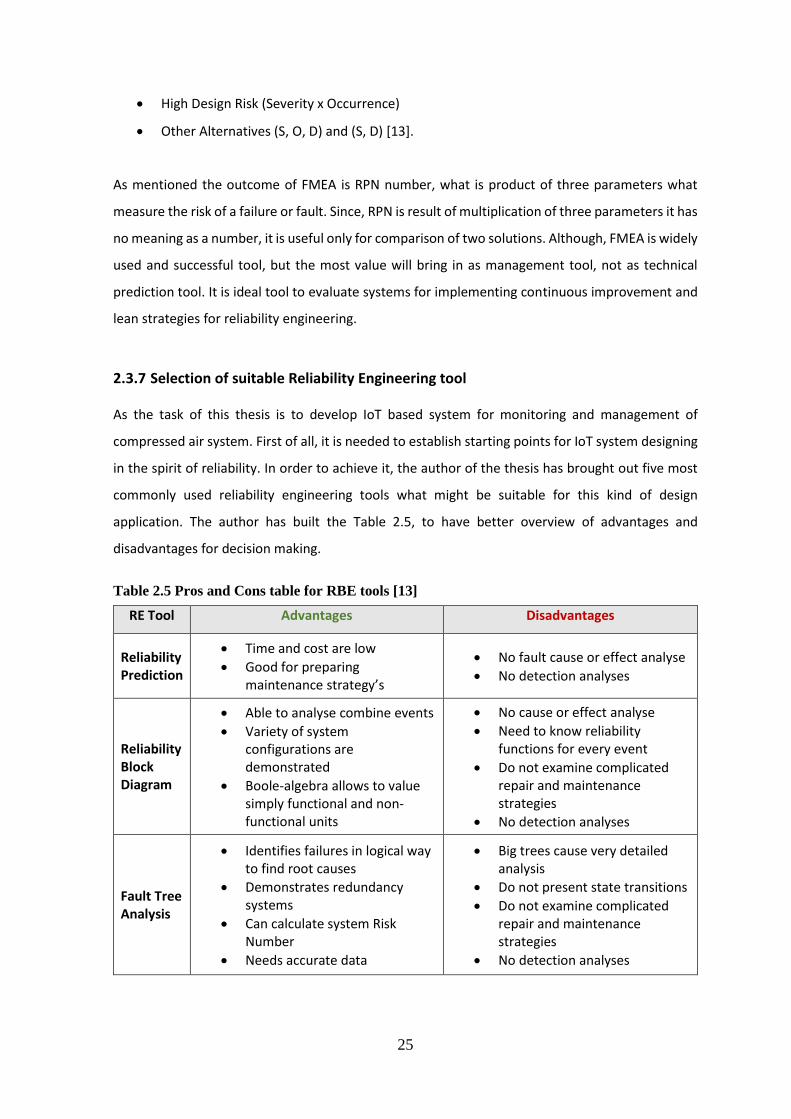
2.3.7 Selection of suitable Reliability Engineering tool
As the task of this thesis is to develop IoT based system for monitoring and management of
compressed air system. First of all, it is needed to establish starting points for IoT system designing
in the spirit of reliability. In order to achieve it, the author of the thesis has brought out five most
commonly used reliability engineering tools what might be suitable for this kind of design
application. The author has built the Table 2.5, to have better overview of advantages and
disadvantages for decision making.
Table 2.5 Pros and Cons table for RBE tools [13]
RE Tool Advantages Disadvantages
Reliability Prediction
Time and cost are low
Good for preparing maintenance strategy’s
No fault cause or effect analyse
No detection analyses
Reliability Block Diagram
Able to analyse combine events
Variety of system configurations are demonstrated
Boole-algebra allows to value simply functional and non-functional units
No cause or effect analyse
Need to know reliability functions for every event
Do not examine complicated repair and maintenance strategies
No detection analyses
Fault Tree Analysis
Identifies failures in logical way to find root causes
Demonstrates redundancy systems
Can calculate system Risk Number
Needs accurate data
Big trees cause very detailed analysis
Do not present state transitions
Do not examine complicated repair and maintenance strategies
No detection analyses
26
RE Tool Advantages Disadvantages
Markov Analysis
Demonstrates multi stage events
Values complicated repair events
Can be complicated due to big number of system states
No logical solution to problems
Fault Mode and Effects Analysis
Identifies connections between reasons and effects
Demonstrates previous unknown event outcome
Is a systematized analysis
Allows singe mode analyses
Good for design processes
Data can be too much
Analyses may be too complicated
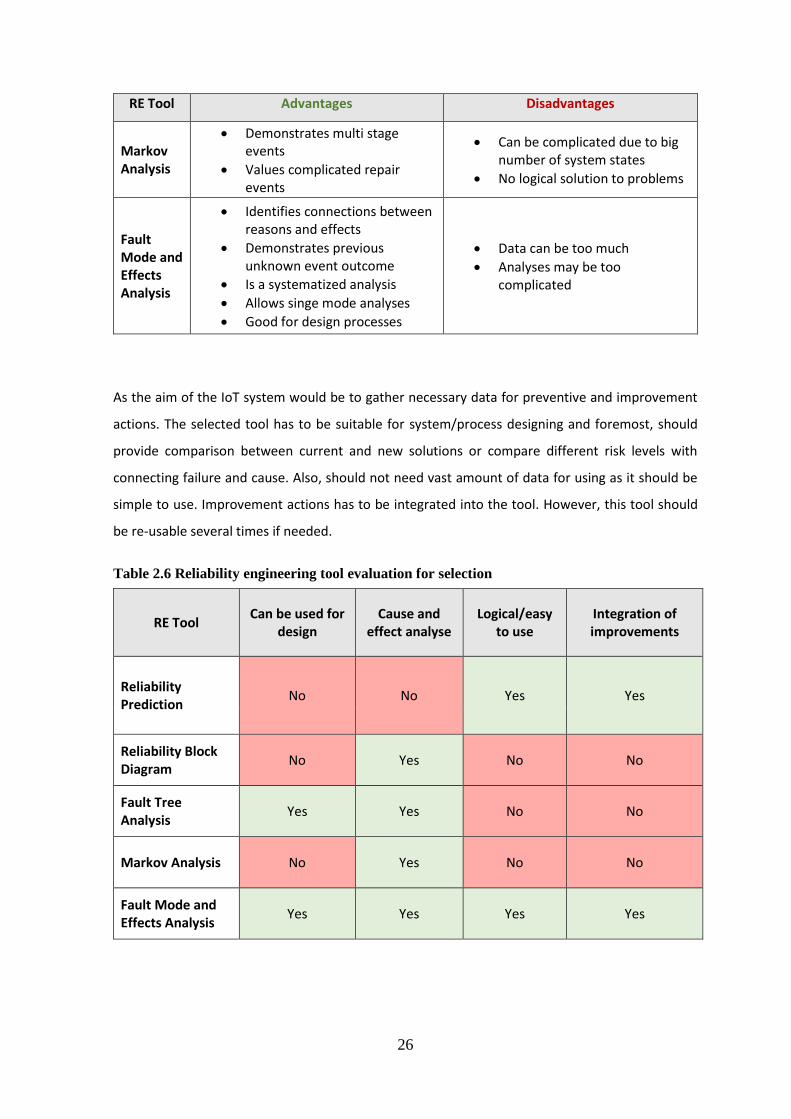
As the aim of the IoT system would be to gather necessary data for preventive and improvement
actions. The selected tool has to be suitable for system/process designing and foremost, should
provide comparison between current and new solutions or compare different risk levels with
connecting failure and cause. Also, should not need vast amount of data for using as it should be
simple to use. Improvement actions has to be integrated into the tool. However, this tool should
be re-usable several times if needed.
Table 2.6 Reliability engineering tool evaluation for selection
RE Tool Can be used for
design Cause and
effect analyse Logical/easy
to use Integration of improvements
Reliability Prediction
No No Yes Yes
Reliability Block Diagram
No Yes No No
Fault Tree Analysis
Yes Yes No No
Markov Analysis No Yes No No
Fault Mode and Effects Analysis
Yes Yes Yes Yes

27
For choosing the most suitable engineering tool for the IoT system development, author gathered
together all required parameters for the tool and put them together to
Table 2.6 for evaluation. From the evaluation came out that, for us would be the best tool FMEA,
as it complies with all the parameters. Further on will be FMEA tool used as basis for the framework
development.
Addition to design tool selection, during the marking advantages and disadvantages, the author of
the thesis discovered that FTA tool could be useful for risk and improvement management after the
desired IoT system deployment for data recording. As FTA needs accurate data for conducting
analyses, what we do not have at the moment. It will be considered to add FTA for future framework
as second reliability engineering tool and can be used when accurate data is gathered.
28
3 IOT BASED FRAMEWORK DEVELOPMENT
As the glass manufacturing plant processes are continuously constant, its success and efficiency
depend on its supportive system reliability to function. With reliable system can be achieved
sustainable and stable system operation, which will result in quality raise and also reduction of
production losses. Current thesis is working on to raise the reliability of compressed air systems to
reduce production losses related to it. In order to improve the system by preventive actions or with
redesigning, it needs data what can be used for this purpose for further analyses. Since, at the
moment the data for improvements is missing and all the actions are done in order to “extinguish
the fire”. To start fixing problems in preventive way, this thesis has focused to develop a framework
for designing an IoT structure for compressed air, what will provide required data for previously
mentioned problem to solve. For framework generation is used knowledge from Industry 4.0, IoT
and Lean Six Sigma principles in order to have desired outcome.
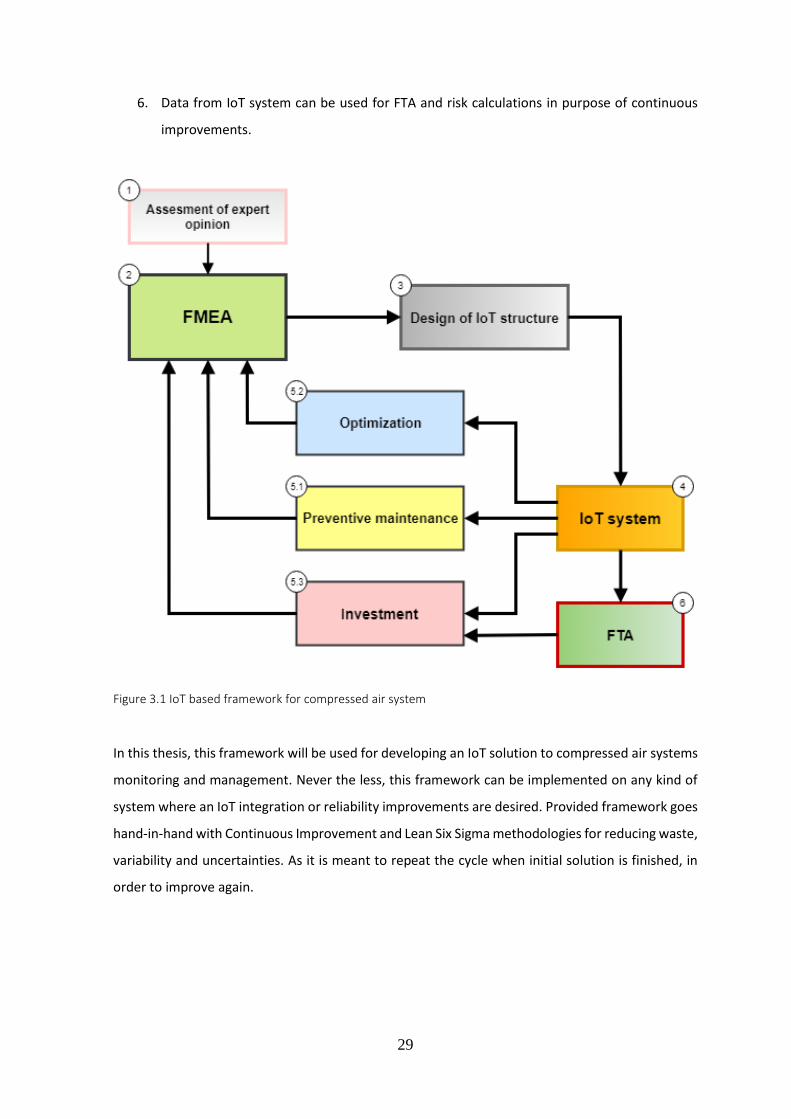
The main idea behind developed framework is represented in Figure 3.1 and as it can be seen the
first cornerstone for further framework is on reliability analyses with FMEA tool. For better
understanding the scope of work to be covered in framework, will be explained step-by-step in
following part:
1. In order to perform FMEA analyses an expert team has to be gathered to define input
failure modes for the analyses. To focus on right input data are given three directions as
Preventive maintenance, Optimization and Investments.
2. FMEA analyses are conducted by evaluating failure mode three parameters as Severity,
Occasion and Detection in scale of 1 to 10. Respectively of RPN result, will be provided
improvement actions in order to reduce the RPN.
3. According to improvement actions from FMEA and status of current equipment, it will be
used to design adequate and desired IoT system. For system monitoring to take preventive
actions and for data collection in order to improve.
4. Next step would be the deployment of designed IoT system to gather crucial data for the
further analyses to take preventive actions or for improvements.
5. Data analyses on certain purpose can be performed or what may be new input data for new
FMEA (1.) analyses with related topic.
5.1 Preventive maintenance actions from data.
5.2 Equipment/System optimization can performed with data.
5.3 Investment for further improvements can planned with data.
29
6. Data from IoT system can be used for FTA and risk calculations in purpose of continuous
improvements.
Figure 3.1 IoT based framework for compressed air system
In this thesis, this framework will be used for developing an IoT solution to compressed air systems
monitoring and management. Never the less, this framework can be implemented on any kind of
system where an IoT integration or reliability improvements are desired. Provided framework goes
hand-in-hand with Continuous Improvement and Lean Six Sigma methodologies for reducing waste,
variability and uncertainties. As it is meant to repeat the cycle when initial solution is finished, in
order to improve again.
30
4 FRAMEWORK DEPLOYMENT ON COMPRESSED AIR SYSTEM
Next step will be deploying developed framework on compressed air system in Järvakandi O-I plant
for IoT integration. Before that, will be given an overview of company itself together with describing
main production processes to understand their connections to described compressed air system.
Further on will be covered framework steps as conducting FMEA and IoT design with payback
calculations.
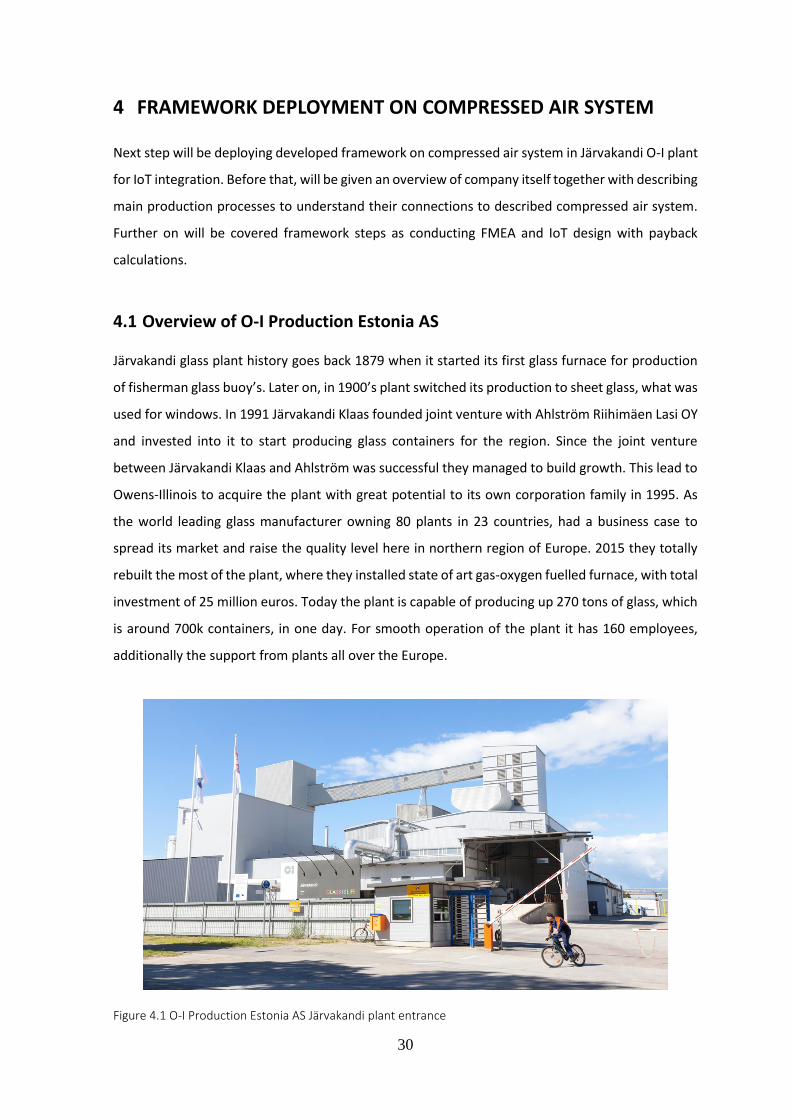
4.1 Overview of O-I Production Estonia AS
Järvakandi glass plant history goes back 1879 when it started its first glass furnace for production
of fisherman glass buoy’s. Later on, in 1900’s plant switched its production to sheet glass, what was
used for windows. In 1991 Järvakandi Klaas founded joint venture with Ahlström Riihimäen Lasi OY
and invested into it to start producing glass containers for the region. Since the joint venture
between Järvakandi Klaas and Ahlström was successful they managed to build growth. This lead to
Owens-Illinois to acquire the plant with great potential to its own corporation family in 1995. As
the world leading glass manufacturer owning 80 plants in 23 countries, had a business case to
spread its market and raise the quality level here in northern region of Europe. 2015 they totally
rebuilt the most of the plant, where they installed state of art gas-oxygen fuelled furnace, with total
investment of 25 million euros. Today the plant is capable of producing up 270 tons of glass, which
is around 700k containers, in one day. For smooth operation of the plant it has 160 employees,
additionally the support from plants all over the Europe.
Figure 4.1 O-I Production Estonia AS Järvakandi plant entrance
31
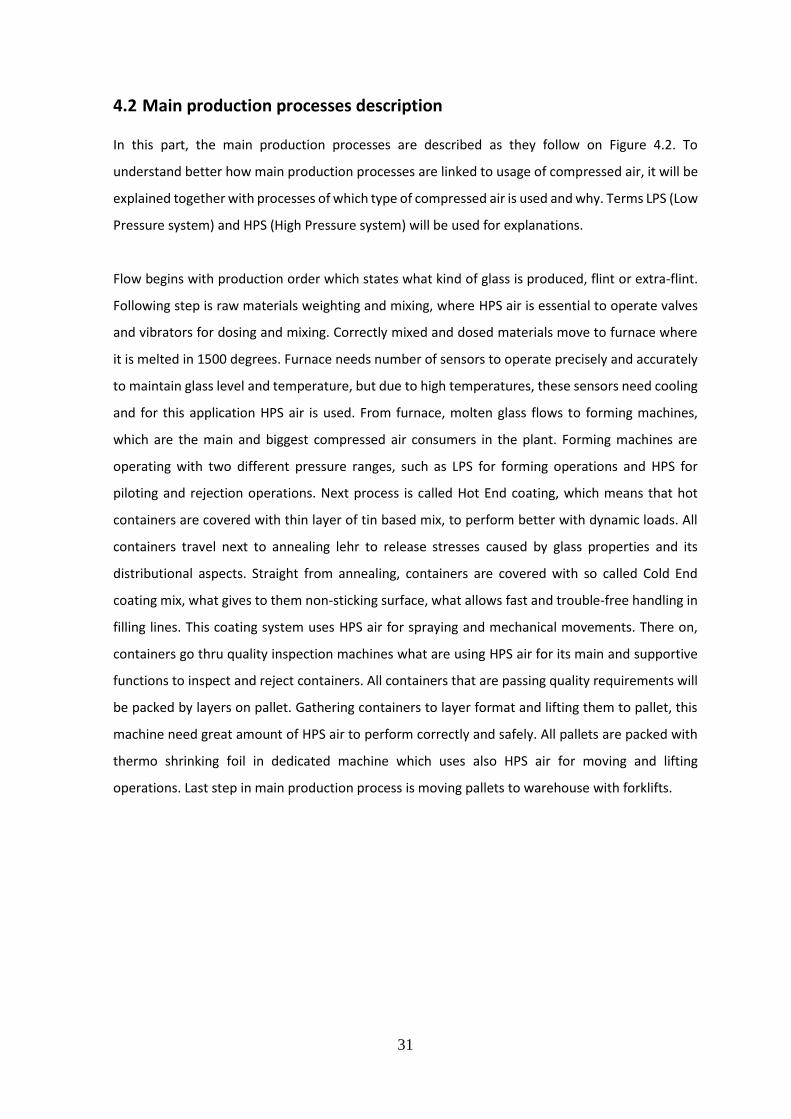
4.2 Main production processes description
In this part, the main production processes are described as they follow on Figure 4.2. To
understand better how main production processes are linked to usage of compressed air, it will be
explained together with processes of which type of compressed air is used and why. Terms LPS (Low
Pressure system) and HPS (High Pressure system) will be used for explanations.
Flow begins with production order which states what kind of glass is produced, flint or extra-flint.
Following step is raw materials weighting and mixing, where HPS air is essential to operate valves
and vibrators for dosing and mixing. Correctly mixed and dosed materials move to furnace where
it is melted in 1500 degrees. Furnace needs number of sensors to operate precisely and accurately
to maintain glass level and temperature, but due to high temperatures, these sensors need cooling
and for this application HPS air is used. From furnace, molten glass flows to forming machines,
which are the main and biggest compressed air consumers in the plant. Forming machines are
operating with two different pressure ranges, such as LPS for forming operations and HPS for
piloting and rejection operations. Next process is called Hot End coating, which means that hot
containers are covered with thin layer of tin based mix, to perform better with dynamic loads. All
containers travel next to annealing lehr to release stresses caused by glass properties and its
distributional aspects. Straight from annealing, containers are covered with so called Cold End
coating mix, what gives to them non-sticking surface, what allows fast and trouble-free handling in
filling lines. This coating system uses HPS air for spraying and mechanical movements. There on,
containers go thru quality inspection machines what are using HPS air for its main and supportive
functions to inspect and reject containers. All containers that are passing quality requirements will
be packed by layers on pallet. Gathering containers to layer format and lifting them to pallet, this
machine need great amount of HPS air to perform correctly and safely. All pallets are packed with
thermo shrinking foil in dedicated machine which uses also HPS air for moving and lifting
operations. Last step in main production process is moving pallets to warehouse with forklifts.
32
Figure 4.2 Main production process with compressed air usage areas
It can be clearly seen that seven main production processes out of eleven, are using compressed
air to operate. This process chart is not covering several supportive structures such as mould shop,
where forming moulds are repaired and prepared for production. This department uses grinding
tools what are compressed air driven, which means they cannot operate without it.
33
Generally, 64% of the plant is dependent on compressed air and to keep efficient, sustainable and
stable production, it is crucial to have constant and continuous compressed air supply at all times.
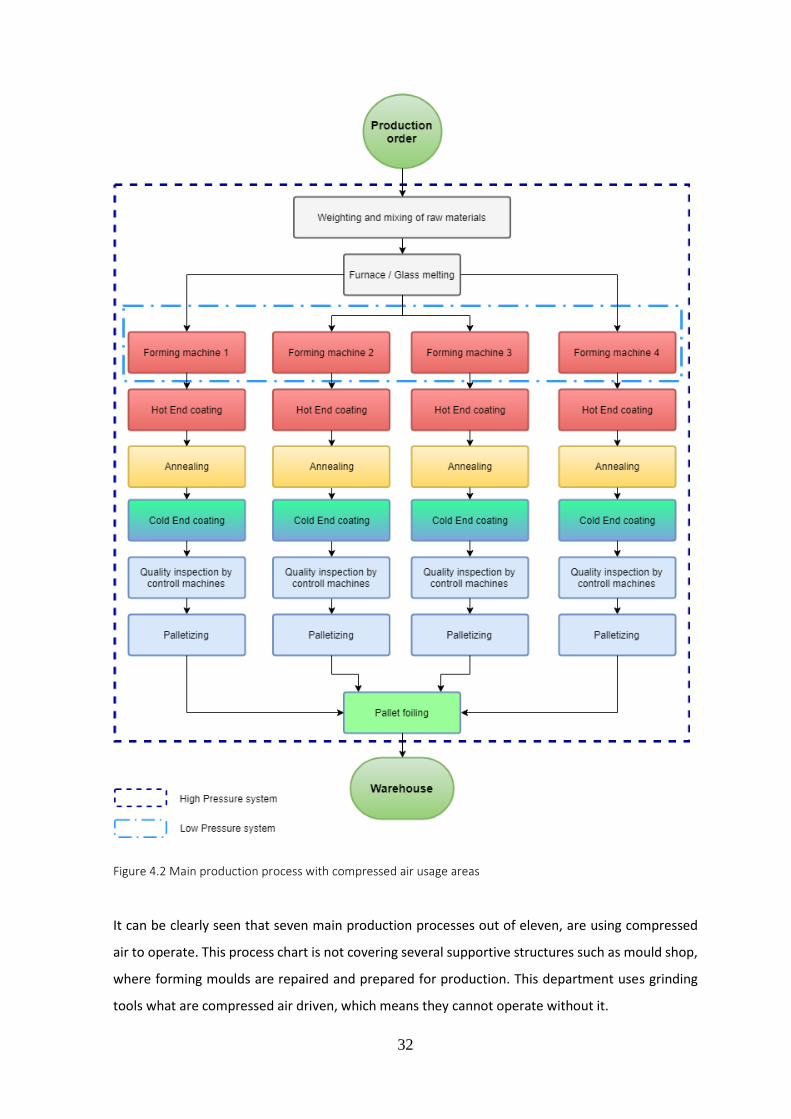
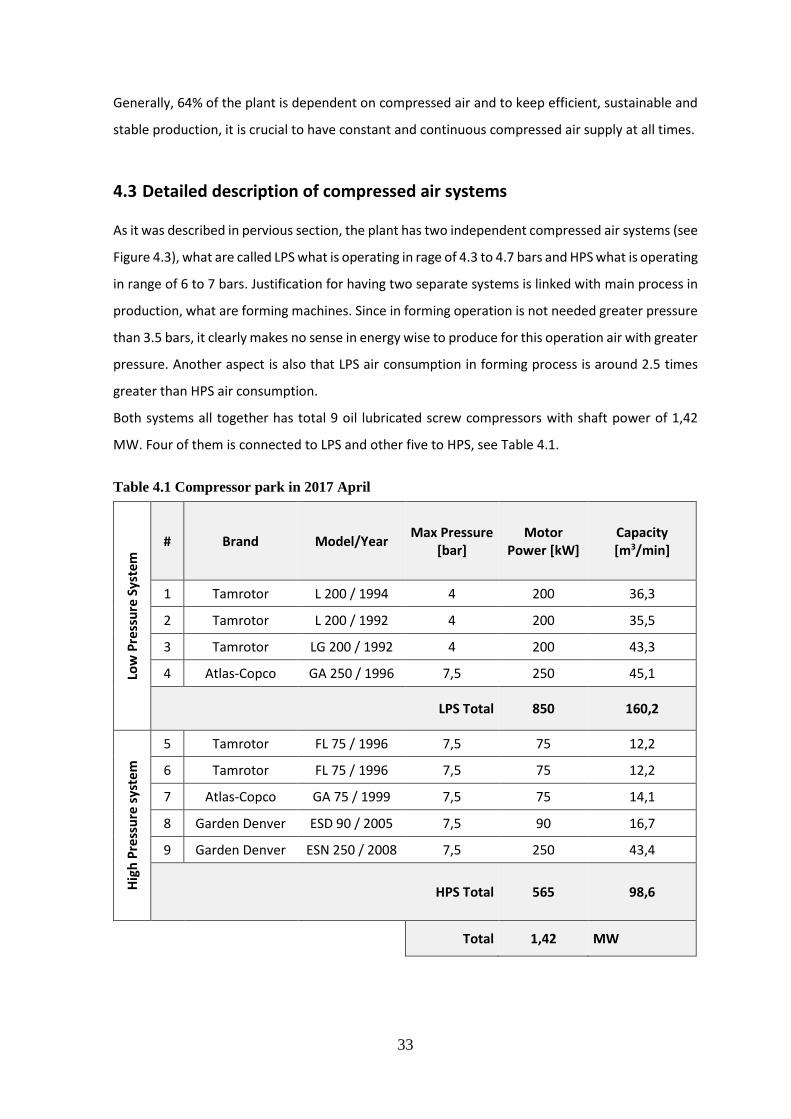
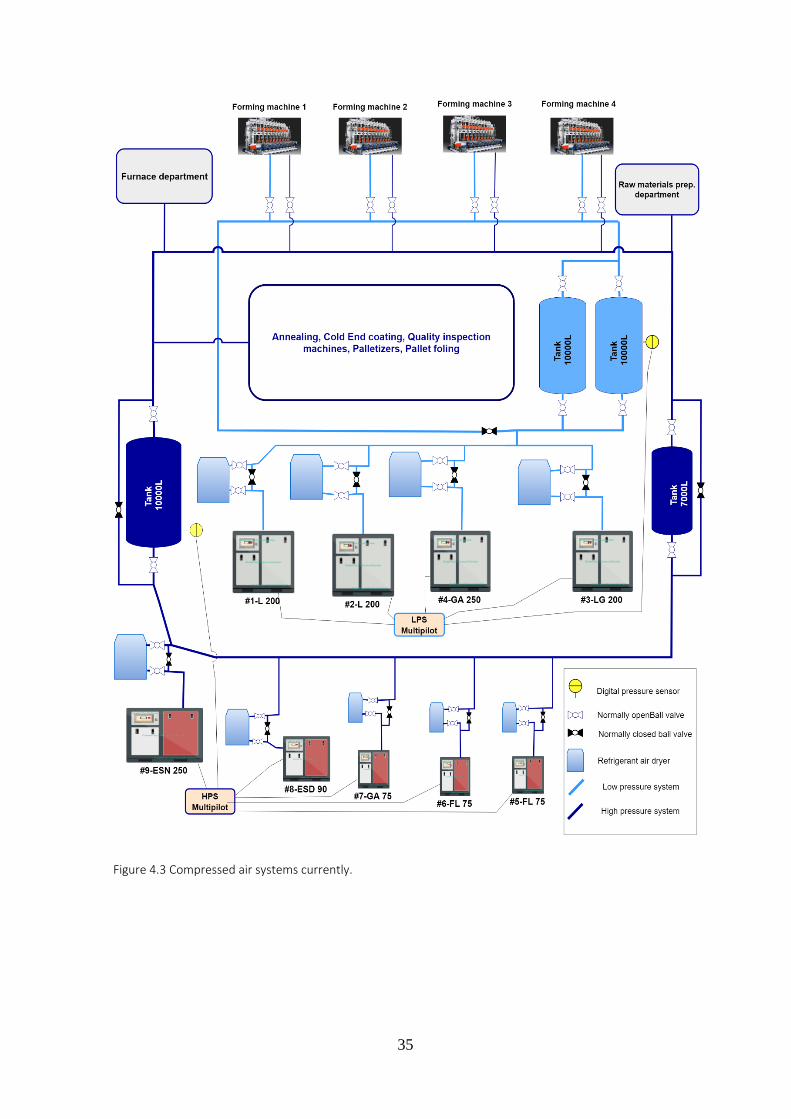
4.3 Detailed description of compressed air systems
As it was described in pervious section, the plant has two independent compressed air systems (see
Figure 4.3), what are called LPS what is operating in rage of 4.3 to 4.7 bars and HPS what is operating
in range of 6 to 7 bars. Justification for having two separate systems is linked with main process in
production, what are forming machines. Since in forming operation is not needed greater pressure
than 3.5 bars, it clearly makes no sense in energy wise to produce for this operation air with greater
pressure. Another aspect is also that LPS air consumption in forming process is around 2.5 times
greater than HPS air consumption.
Both systems all together has total 9 oil lubricated screw compressors with shaft power of 1,42
MW. Four of them is connected to LPS and other five to HPS, see Table 4.1.
Table 4.1 Compressor park in 2017 April
Low
Pre
ssu
re S
yste
m # Brand Model/Year
Max Pressure [bar]
Motor Power [kW]
Capacity [m3/min]
1 Tamrotor L 200 / 1994 4 200 36,3
2 Tamrotor L 200 / 1992 4 200 35,5
3 Tamrotor LG 200 / 1992 4 200 43,3
4 Atlas-Copco GA 250 / 1996 7,5 250 45,1
LPS Total 850 160,2
Hig
h P
ress
ure
sys
tem
5 Tamrotor FL 75 / 1996 7,5 75 12,2
6 Tamrotor FL 75 / 1996 7,5 75 12,2
7 Atlas-Copco GA 75 / 1999 7,5 75 14,1
8 Garden Denver ESD 90 / 2005 7,5 90 16,7
9 Garden Denver ESN 250 / 2008 7,5 250 43,4
HPS Total 565 98,6
Total 1,42 MW
34
Both systems are controlled with Multi Pilot systems, which allows to prioritize compressors to
starting sequence. These Multi Pilot systems starts and stops compressors according to the
pressure of the system, it also gives visual overview of which machine is operating under load and
which is not, also displays current pressure in the system. All compressors are equipped with
SOCOMEC energy reading devices, what allows to monitor this parameter. Energy consumption
data is at the moment only parameter from the compressed air systems, what is collected for the
analyses and daily overview.
The whole infrastructure and compressor park is rather old and its design is outdated for most
optimal operation for this purpose. It can be seen from the problems, what has been occurring after
plant rebuild in 2014, when rated production capacity raised. Production capacity raise is linked to
bigger forming machines what now need more compressed air than before and are quite more
sensitive to any errors caused by pressure variations in air systems. Secondly, as it was mentioned
previously, the compressor park is old and need constant supervision to prevent major failures. Due
to lack of qualified operators in the plant, this part may suffer and the result would be failures, what
can affect production. Third aspect is lack of information to perform preventive actions, as warnings
or any kind of parameters what are showing signs of failure.
As we cannot rely on human memory and senses all the time, we need to start gathering this crucial
data in digital form for preventive actions and further analyses for investments to raise the
reliability of the system. Main topic of this thesis is to develop an IoT system what could provide
data for preventive actions, optimization and further investments.
35
Figure 4.3 Compressed air systems currently.
36
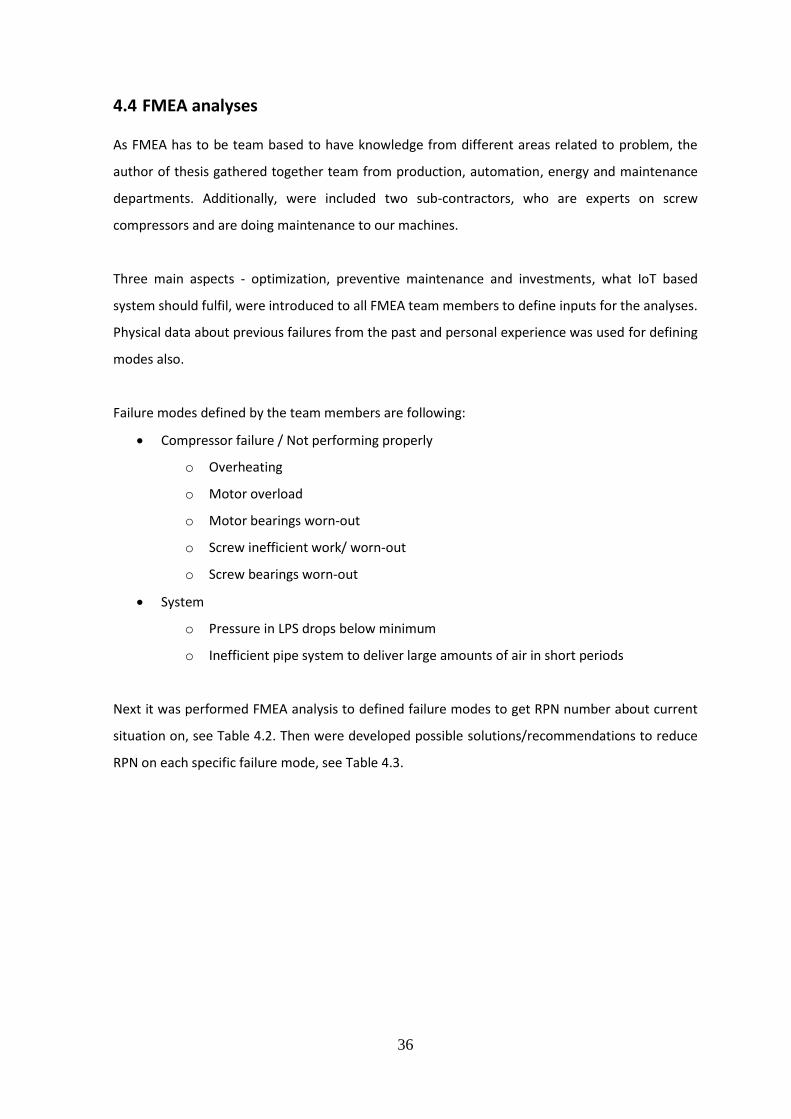
4.4 FMEA analyses
As FMEA has to be team based to have knowledge from different areas related to problem, the
author of thesis gathered together team from production, automation, energy and maintenance
departments. Additionally, were included two sub-contractors, who are experts on screw
compressors and are doing maintenance to our machines.
Three main aspects - optimization, preventive maintenance and investments, what IoT based
system should fulfil, were introduced to all FMEA team members to define inputs for the analyses.
Physical data about previous failures from the past and personal experience was used for defining
modes also.
Failure modes defined by the team members are following:
Compressor failure / Not performing properly
o Overheating
o Motor overload
o Motor bearings worn-out
o Screw inefficient work/ worn-out
o Screw bearings worn-out
System
o Pressure in LPS drops below minimum
o Inefficient pipe system to deliver large amounts of air in short periods
Next it was performed FMEA analysis to defined failure modes to get RPN number about current
situation on, see Table 4.2. Then were developed possible solutions/recommendations to reduce
RPN on each specific failure mode, see Table 4.3.
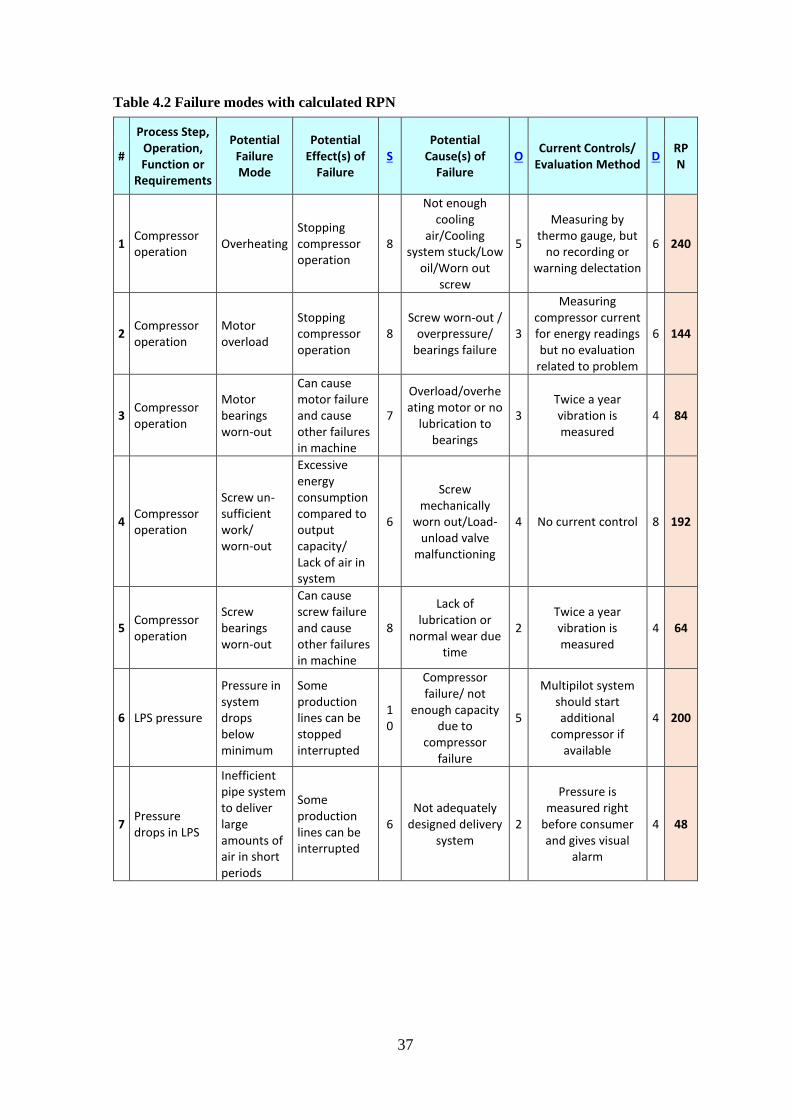
37
Table 4.2 Failure modes with calculated RPN
#
Process Step, Operation, Function or
Requirements
Potential Failure Mode
Potential Effect(s) of
Failure S
Potential Cause(s) of
Failure O
Current Controls/ Evaluation Method
D
RPN
1 Compressor operation
Overheating Stopping compressor operation
8
Not enough cooling
air/Cooling system stuck/Low
oil/Worn out screw
5
Measuring by thermo gauge, but
no recording or warning delectation
6 240
2 Compressor operation
Motor overload
Stopping compressor operation
8 Screw worn-out /
overpressure/ bearings failure
3
Measuring compressor current for energy readings but no evaluation
related to problem
6 144
3 Compressor operation
Motor bearings worn-out
Can cause motor failure and cause other failures in machine
7
Overload/overheating motor or no
lubrication to bearings
3 Twice a year vibration is measured
4 84
4 Compressor operation
Screw un-sufficient work/ worn-out
Excessive energy consumption compared to output capacity/ Lack of air in system
6
Screw mechanically
worn out/Load-unload valve
malfunctioning
4 No current control 8 192
5 Compressor operation
Screw bearings worn-out
Can cause screw failure and cause other failures in machine
8
Lack of lubrication or
normal wear due time
2 Twice a year vibration is measured
4 64
6 LPS pressure
Pressure in system drops below minimum
Some production lines can be stopped interrupted
10
Compressor failure/ not
enough capacity due to
compressor failure
5
Multipilot system should start additional
compressor if available
4 200
7 Pressure drops in LPS
Inefficient pipe system to deliver large amounts of air in short periods
Some production lines can be interrupted
6 Not adequately
designed delivery system
2
Pressure is measured right
before consumer and gives visual
alarm
4 48
38
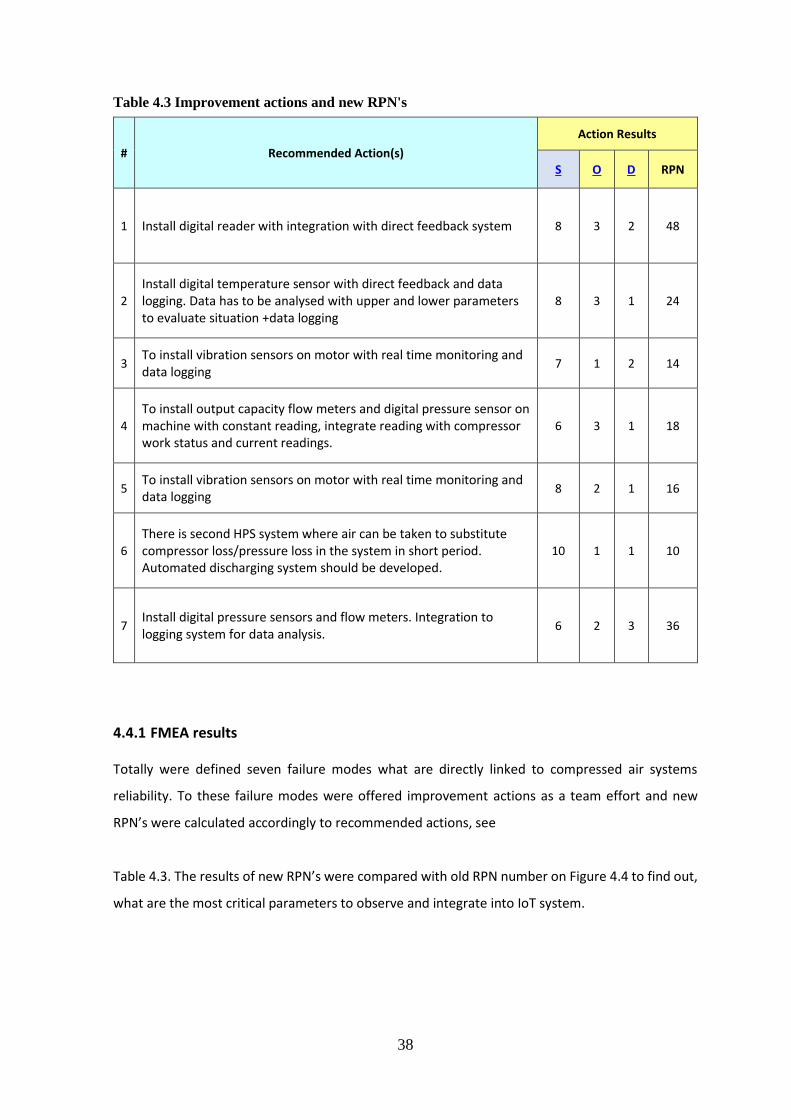
Table 4.3 Improvement actions and new RPN's
# Recommended Action(s)
Action Results
S O D RPN
1 Install digital reader with integration with direct feedback system 8 3 2 48
2
Install digital temperature sensor with direct feedback and data logging. Data has to be analysed with upper and lower parameters to evaluate situation +data logging
8 3 1 24
3 To install vibration sensors on motor with real time monitoring and data logging
7 1 2 14
4
To install output capacity flow meters and digital pressure sensor on machine with constant reading, integrate reading with compressor work status and current readings.
6 3 1 18
5 To install vibration sensors on motor with real time monitoring and data logging
8 2 1 16
6
There is second HPS system where air can be taken to substitute compressor loss/pressure loss in the system in short period. Automated discharging system should be developed.
10 1 1 10
7 Install digital pressure sensors and flow meters. Integration to logging system for data analysis.
6 2 3 36
4.4.1 FMEA results
Totally were defined seven failure modes what are directly linked to compressed air systems
reliability. To these failure modes were offered improvement actions as a team effort and new
RPN’s were calculated accordingly to recommended actions, see
Table 4.3. The results of new RPN’s were compared with old RPN number on Figure 4.4 to find out,
what are the most critical parameters to observe and integrate into IoT system.
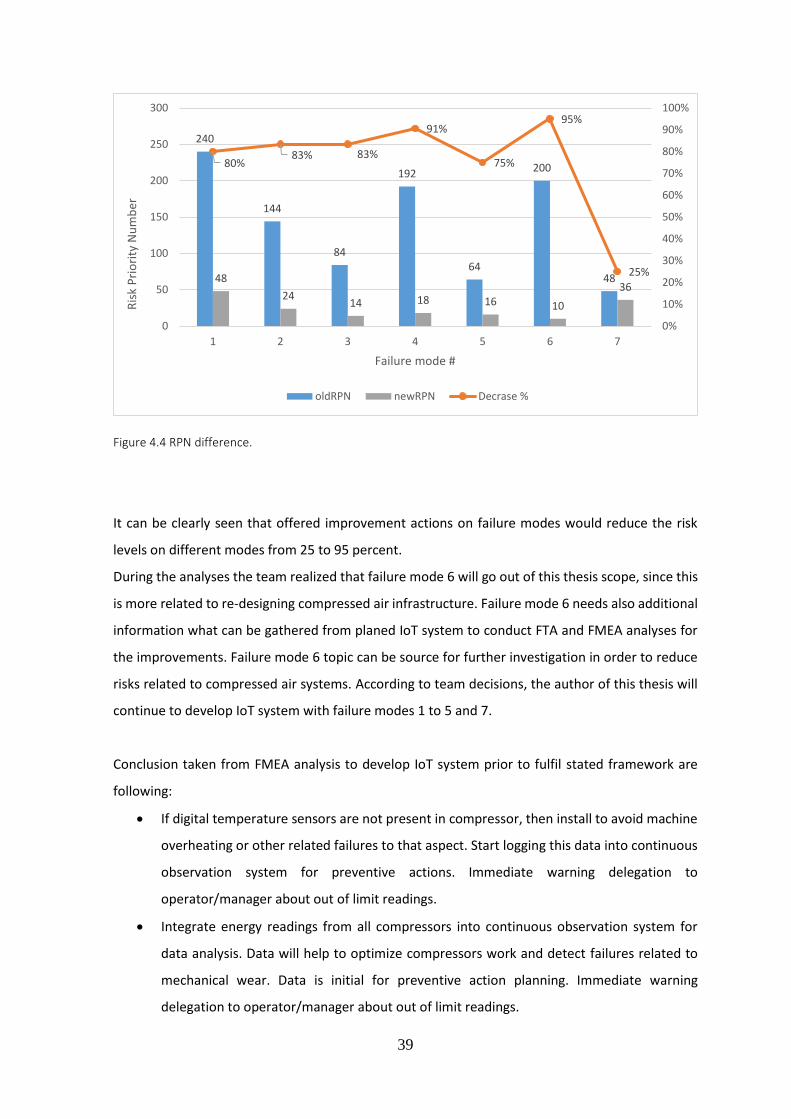
39
Figure 4.4 RPN difference.
It can be clearly seen that offered improvement actions on failure modes would reduce the risk
levels on different modes from 25 to 95 percent.
During the analyses the team realized that failure mode 6 will go out of this thesis scope, since this
is more related to re-designing compressed air infrastructure. Failure mode 6 needs also additional
information what can be gathered from planed IoT system to conduct FTA and FMEA analyses for
the improvements. Failure mode 6 topic can be source for further investigation in order to reduce
risks related to compressed air systems. According to team decisions, the author of this thesis will
continue to develop IoT system with failure modes 1 to 5 and 7.
Conclusion taken from FMEA analysis to develop IoT system prior to fulfil stated framework are
following:
If digital temperature sensors are not present in compressor, then install to avoid machine
overheating or other related failures to that aspect. Start logging this data into continuous
observation system for preventive actions. Immediate warning delegation to
operator/manager about out of limit readings.
Integrate energy readings from all compressors into continuous observation system for
data analysis. Data will help to optimize compressors work and detect failures related to
mechanical wear. Data is initial for preventive action planning. Immediate warning
delegation to operator/manager about out of limit readings.
240
144
84
192
64
200
4848
2414 18 16 10
36
80%83% 83%
91%
75%
95%
25%
0%
10%
20%
30%
40%
50%
60%
70%
80%
90%
100%
0
50
100
150
200
250
300
1 2 3 4 5 6 7
Ris
k P
rio
rity
Nu
mb
er
Failure mode #
oldRPN newRPN Decrase %
40
Install vibration sensors to motor and screw element to detect components wear. Crucial
for preventive actions. Immediate warning delegation to operator/manager about out of
limit readings.
Install digital flow meters and pressure sensors on each machine with data logging to detect
screw element wear or failures. Data will give an overview of compressors capacity
currently in system, will help to optimize system parameters. Immediate warning
delegation to operator/manager about out of limit readings.
Install digital pressure sensors and flow meters before forming machines in LPS for data
logging. With data can future investments planned and designed. Immediate warning
delegation to operator/manager about out of limit readings.
4.5 IoT system development
Next step is to find out what kind of equipment plant already have in place and what is need
additionally to build desired IoT system for compressed air management. Further on, this data will
be one of the base information for investment calculations to external companies.
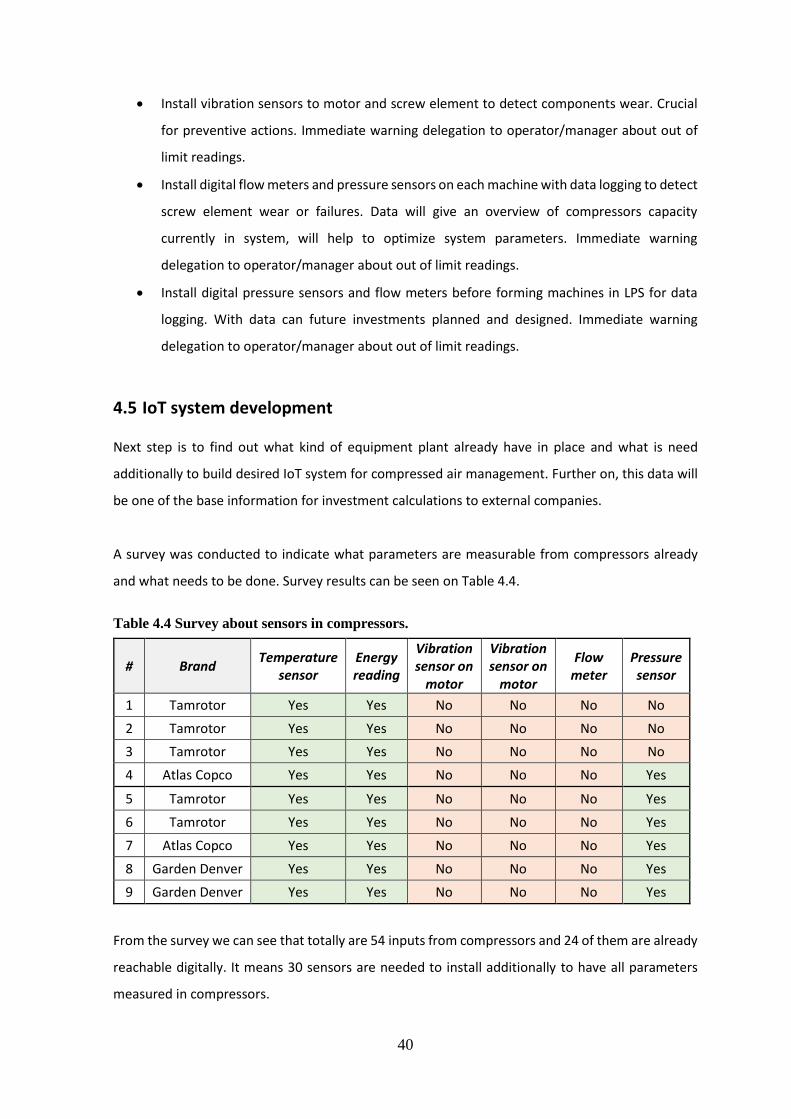
A survey was conducted to indicate what parameters are measurable from compressors already
and what needs to be done. Survey results can be seen on Table 4.4.
Table 4.4 Survey about sensors in compressors.
# Brand Temperature
sensor Energy reading
Vibration sensor on
motor
Vibration sensor on
motor
Flow meter
Pressure sensor
1 Tamrotor Yes Yes No No No No
2 Tamrotor Yes Yes No No No No
3 Tamrotor Yes Yes No No No No
4 Atlas Copco Yes Yes No No No Yes
5 Tamrotor Yes Yes No No No Yes
6 Tamrotor Yes Yes No No No Yes
7 Atlas Copco Yes Yes No No No Yes
8 Garden Denver Yes Yes No No No Yes
9 Garden Denver Yes Yes No No No Yes
From the survey we can see that totally are 54 inputs from compressors and 24 of them are already
reachable digitally. It means 30 sensors are needed to install additionally to have all parameters
measured in compressors.
41
In FMEA analysis came out also problems with LPS and there we need to install additional 4
flowmeters and 4 pressure sensors to forming machines to gather required data. It means that 38
sensors are required to install out of 62, prior to full fill desired goal.
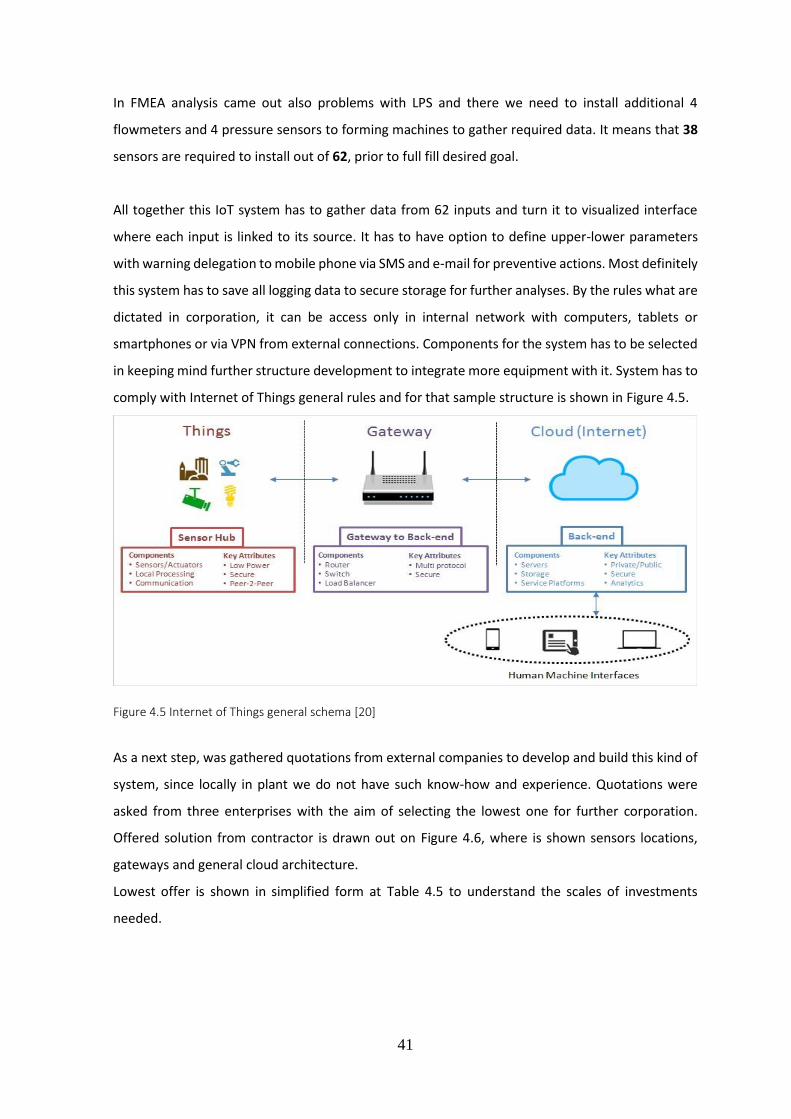
All together this IoT system has to gather data from 62 inputs and turn it to visualized interface
where each input is linked to its source. It has to have option to define upper-lower parameters
with warning delegation to mobile phone via SMS and e-mail for preventive actions. Most definitely
this system has to save all logging data to secure storage for further analyses. By the rules what are
dictated in corporation, it can be access only in internal network with computers, tablets or
smartphones or via VPN from external connections. Components for the system has to be selected
in keeping mind further structure development to integrate more equipment with it. System has to
comply with Internet of Things general rules and for that sample structure is shown in Figure 4.5.
Figure 4.5 Internet of Things general schema [20]
As a next step, was gathered quotations from external companies to develop and build this kind of
system, since locally in plant we do not have such know-how and experience. Quotations were
asked from three enterprises with the aim of selecting the lowest one for further corporation.
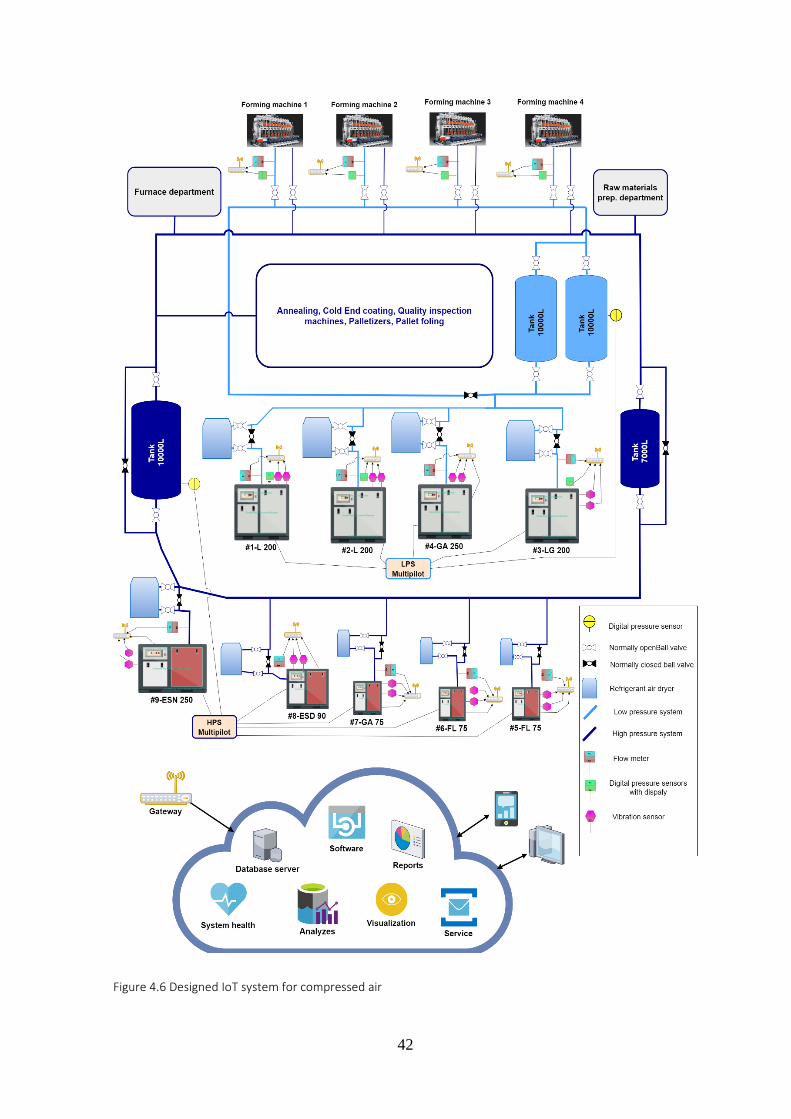
Offered solution from contractor is drawn out on Figure 4.6, where is shown sensors locations,
gateways and general cloud architecture.
Lowest offer is shown in simplified form at Table 4.5 to understand the scales of investments
needed.
42
Figure 4.6 Designed IoT system for compressed air
43
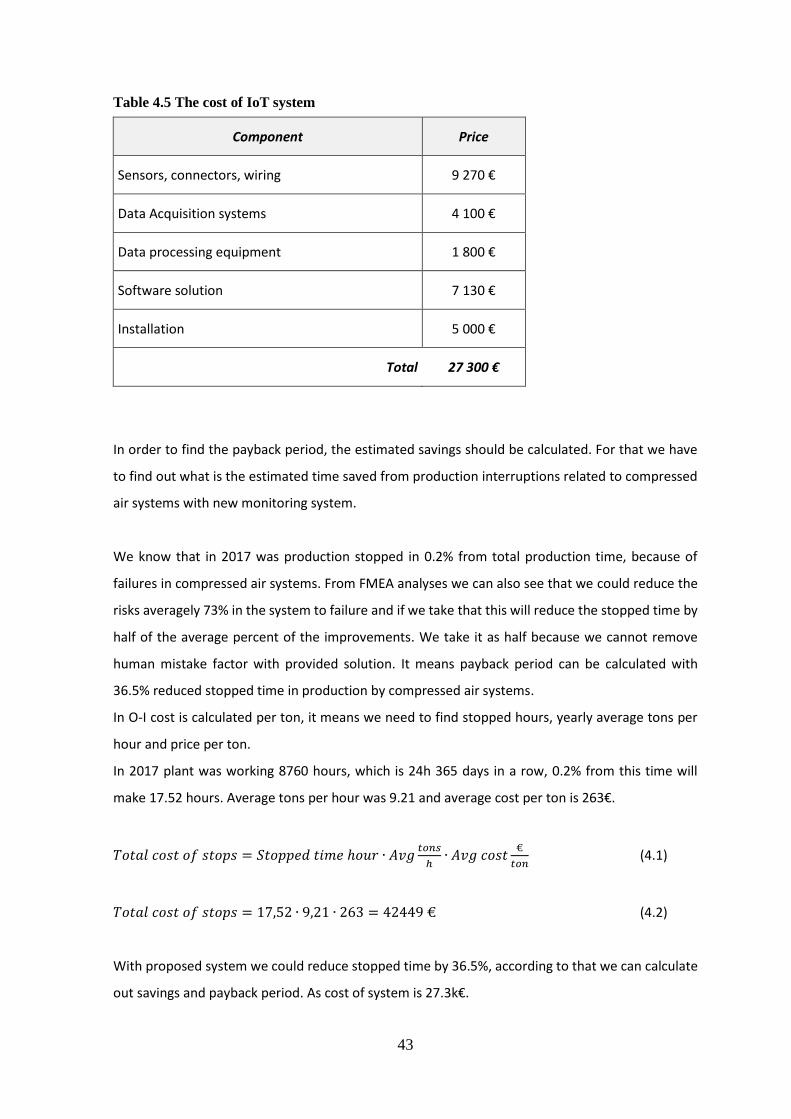
Table 4.5 The cost of IoT system
Component Price
Sensors, connectors, wiring 9 270 €
Data Acquisition systems 4 100 €
Data processing equipment 1 800 €
Software solution 7 130 €
Installation 5 000 €
Total 27 300 €
In order to find the payback period, the estimated savings should be calculated. For that we have
to find out what is the estimated time saved from production interruptions related to compressed
air systems with new monitoring system.
We know that in 2017 was production stopped in 0.2% from total production time, because of
failures in compressed air systems. From FMEA analyses we can also see that we could reduce the
risks averagely 73% in the system to failure and if we take that this will reduce the stopped time by
half of the average percent of the improvements. We take it as half because we cannot remove
human mistake factor with provided solution. It means payback period can be calculated with
36.5% reduced stopped time in production by compressed air systems.
In O-I cost is calculated per ton, it means we need to find stopped hours, yearly average tons per
hour and price per ton.
In 2017 plant was working 8760 hours, which is 24h 365 days in a row, 0.2% from this time will
make 17.52 hours. Average tons per hour was 9.21 and average cost per ton is 263€.
𝑇𝑜𝑡𝑎𝑙 𝑐𝑜𝑠𝑡 𝑜𝑓 𝑠𝑡𝑜𝑝𝑠 = 𝑆𝑡𝑜𝑝𝑝𝑒𝑑 𝑡𝑖𝑚𝑒 ℎ𝑜𝑢𝑟 ∙ 𝐴𝑣𝑔𝑡𝑜𝑛𝑠
ℎ∙ 𝐴𝑣𝑔 𝑐𝑜𝑠𝑡
€
𝑡𝑜𝑛 (4.1)
𝑇𝑜𝑡𝑎𝑙 𝑐𝑜𝑠𝑡 𝑜𝑓 𝑠𝑡𝑜𝑝𝑠 = 17,52 ∙ 9,21 ∙ 263 = 42449 € (4.2)
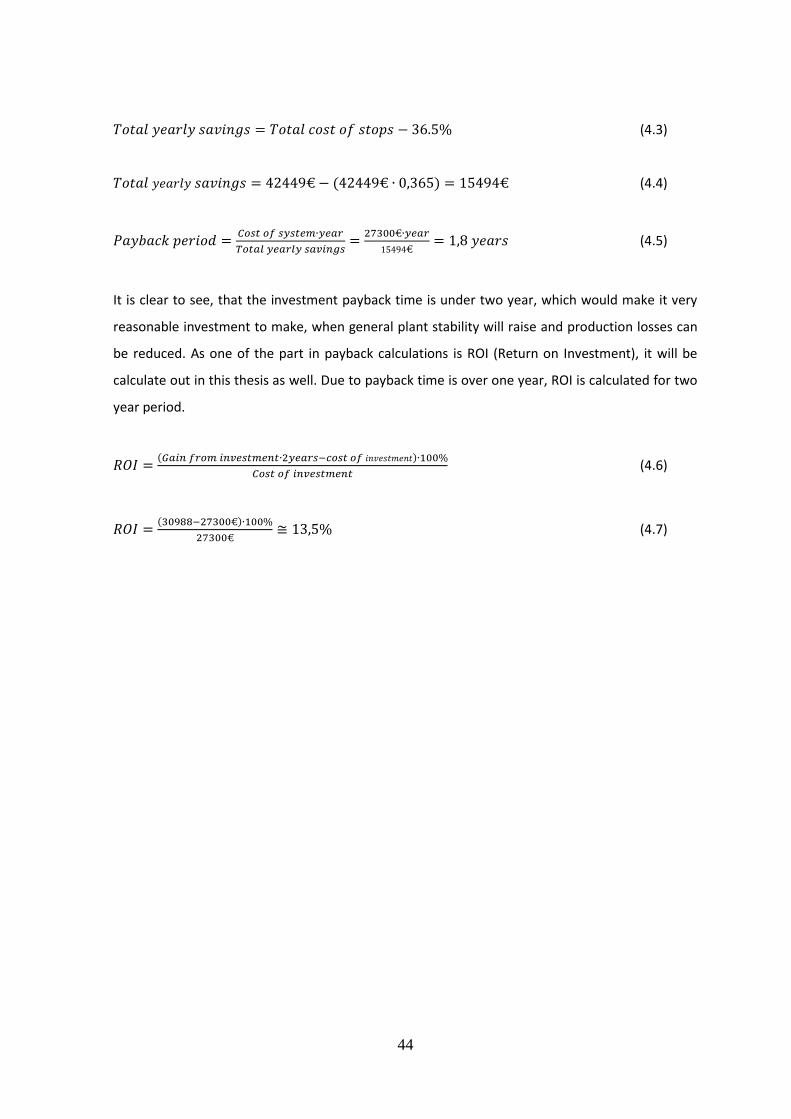
With proposed system we could reduce stopped time by 36.5%, according to that we can calculate
out savings and payback period. As cost of system is 27.3k€.
44
𝑇𝑜𝑡𝑎𝑙 𝑦𝑒𝑎𝑟𝑙𝑦 𝑠𝑎𝑣𝑖𝑛𝑔𝑠 = 𝑇𝑜𝑡𝑎𝑙 𝑐𝑜𝑠𝑡 𝑜𝑓 𝑠𝑡𝑜𝑝𝑠 − 36.5% (4.3)
𝑇𝑜𝑡𝑎𝑙 𝑦𝑒𝑎𝑟𝑙𝑦 𝑠𝑎𝑣𝑖𝑛𝑔𝑠 = 42449€ − (42449€ ∙ 0,365) = 15494€ (4.4)
𝑃𝑎𝑦𝑏𝑎𝑐𝑘 𝑝𝑒𝑟𝑖𝑜𝑑 =𝐶𝑜𝑠𝑡 𝑜𝑓 𝑠𝑦𝑠𝑡𝑒𝑚∙𝑦𝑒𝑎𝑟
𝑇𝑜𝑡𝑎𝑙 𝑦𝑒𝑎𝑟𝑙𝑦 𝑠𝑎𝑣𝑖𝑛𝑔𝑠=
27300€∙𝑦𝑒𝑎𝑟
15494€= 1,8 𝑦𝑒𝑎𝑟𝑠 (4.5)
It is clear to see, that the investment payback time is under two year, which would make it very
reasonable investment to make, when general plant stability will raise and production losses can
be reduced. As one of the part in payback calculations is ROI (Return on Investment), it will be
calculate out in this thesis as well. Due to payback time is over one year, ROI is calculated for two
year period.
𝑅𝑂𝐼 =(𝐺𝑎𝑖𝑛 𝑓𝑟𝑜𝑚 𝑖𝑛𝑣𝑒𝑠𝑡𝑚𝑒𝑛𝑡∙2𝑦𝑒𝑎𝑟𝑠−𝑐𝑜𝑠𝑡 𝑜𝑓 𝑖𝑛𝑣𝑒𝑠𝑡𝑚𝑒𝑛𝑡)∙100%
𝐶𝑜𝑠𝑡 𝑜𝑓 𝑖𝑛𝑣𝑒𝑠𝑡𝑚𝑒𝑛𝑡 (4.6)
𝑅𝑂𝐼 =(30988−27300€)∙100%
27300€≅ 13,5% (4.7)
45
5 DESIGNED IOT SYSTEM VALIDATION AND DEPLOYMENT
Despite of the fact, that calculations stated high feasibility of the investments for building an IoT
system. Although, our plant management decided to test the idea for having solid proof that it will
give us the needed information for preventive actions and future improvements.
5.1 Framework validation
In order to prove it, the author of the thesis decided to test air flow meters for capacity measures
and see how this data can be helpful for predicting failures and organizing preventive actions. Flow
meter test was also chosen because it gives results about one of the main parameter about air
compressor, as capacity. And it is the most expensive from sensors, what are planned to install for
designed IoT system.
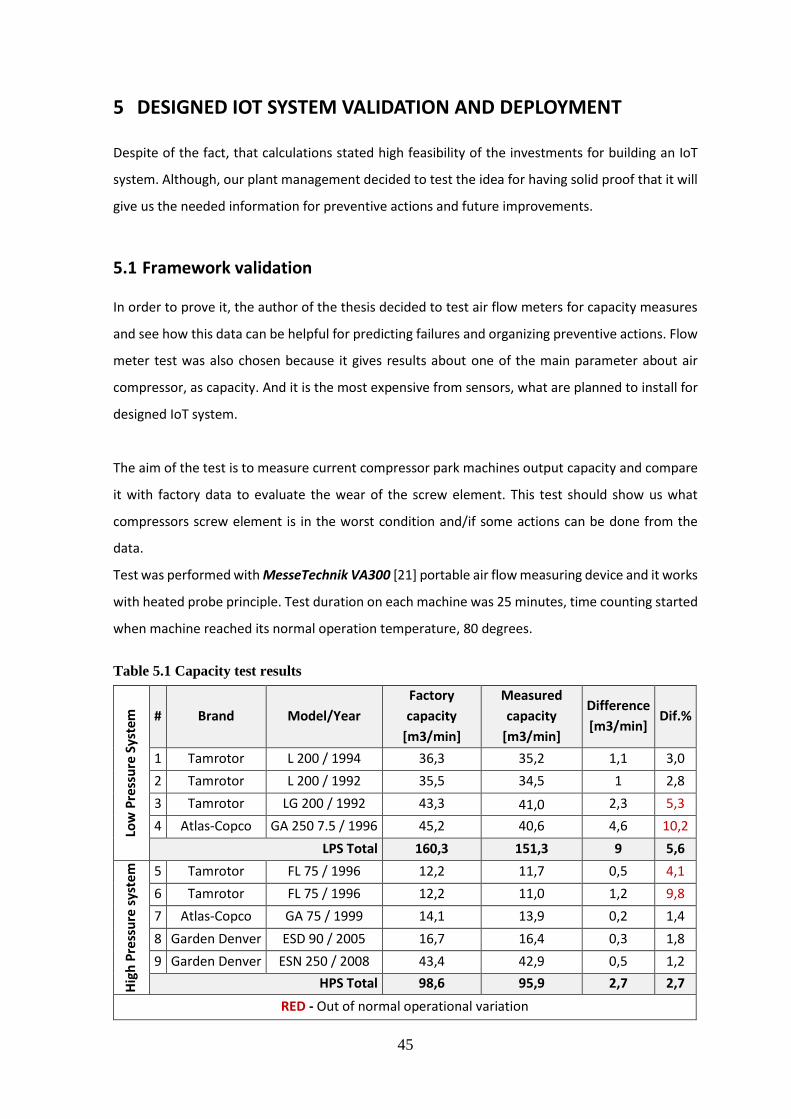
The aim of the test is to measure current compressor park machines output capacity and compare
it with factory data to evaluate the wear of the screw element. This test should show us what
compressors screw element is in the worst condition and/if some actions can be done from the
data.
Test was performed with MesseTechnik VA300 [21] portable air flow measuring device and it works
with heated probe principle. Test duration on each machine was 25 minutes, time counting started
when machine reached its normal operation temperature, 80 degrees.
Table 5.1 Capacity test results
Low
Pre
ssu
re S
yste
m
# Brand Model/Year
Factory
capacity
[m3/min]
Measured
capacity
[m3/min]
Difference
[m3/min] Dif.%
1 Tamrotor L 200 / 1994 36,3 35,2 1,1 3,0
2 Tamrotor L 200 / 1992 35,5 34,5 1 2,8
3 Tamrotor LG 200 / 1992 43,3 41,0 2,3 5,3
4 Atlas-Copco GA 250 7.5 / 1996 45,2 40,6 4,6 10,2
LPS Total 160,3 151,3 9 5,6
Hig
h P
ress
ure
sys
tem
5 Tamrotor FL 75 / 1996 12,2 11,7 0,5 4,1
6 Tamrotor FL 75 / 1996 12,2 11,0 1,2 9,8
7 Atlas-Copco GA 75 / 1999 14,1 13,9 0,2 1,4
8 Garden Denver ESD 90 / 2005 16,7 16,4 0,3 1,8
9 Garden Denver ESN 250 / 2008 43,4 42,9 0,5 1,2
HPS Total 98,6 95,9 2,7 2,7
RED - Out of normal operational variation
46
Further inspection of machines #5 and #6 showed us that transmission belts and discs from motor
to screw element were worn and slipped under load, which caused inefficient compressor work.
Worn components were replaced and re-measuring on capacity showed that differences were
reduced to 1.5% and 1%, which is in allowed variation. With these actions we can confirm that
provided IoT solution could be beneficial for preventive actions and repairs.
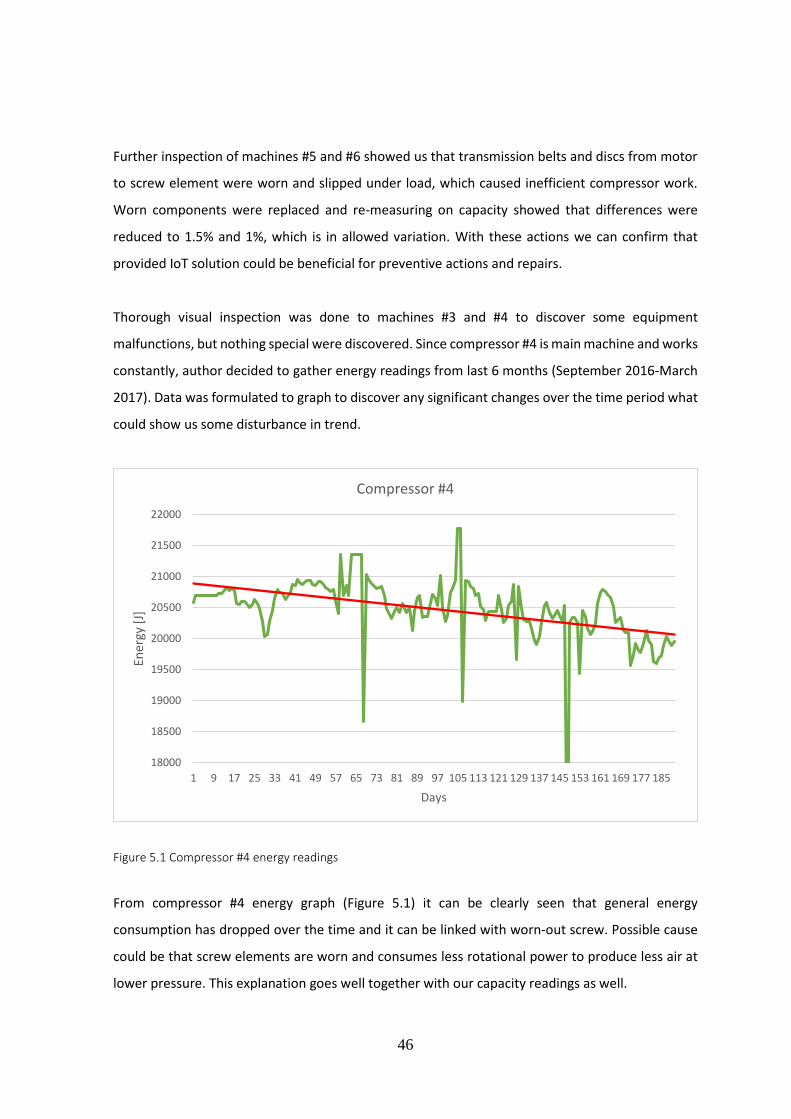
Thorough visual inspection was done to machines #3 and #4 to discover some equipment
malfunctions, but nothing special were discovered. Since compressor #4 is main machine and works
constantly, author decided to gather energy readings from last 6 months (September 2016-March
2017). Data was formulated to graph to discover any significant changes over the time period what
could show us some disturbance in trend.
Figure 5.1 Compressor #4 energy readings
From compressor #4 energy graph (Figure 5.1) it can be clearly seen that general energy
consumption has dropped over the time and it can be linked with worn-out screw. Possible cause
could be that screw elements are worn and consumes less rotational power to produce less air at
lower pressure. This explanation goes well together with our capacity readings as well.
18000
18500
19000
19500
20000
20500
21000
21500
22000
1 9 17 25 33 41 49 57 65 73 81 89 97 105 113 121 129 137 145 153 161 169 177 185
Ener
gy [
J]
Days
Compressor #4
47
As compressor #3 is mostly in rest mode for backing up system if needed, it does not have enough
energy data to compare, what could link with capacity reduction as root cause. Further on, author
ordered vibration analyses from external company to measure both machines for vibrations. As
mechanical vibration is clear sign of physical wear, it can be linked to screw wear and approve our
capacity measurement results.
Vibration analyse report from contractor showed that current situation in both machine screws are
over the normal operation parameters, what are stated in ISO 10816-3:2009 [22] standard. Results
were 2.1% over nominal for compressor #4 and 3.8% over nominal vibration for compressor #3.
In order to fix previously found problems with compressors #3 and #4 were asked quotations from
original supplier for screw overhauling. It turned out that fixing cost for both machines were roughly
23k and 27k euros, what is half of the price of new same size compressor. Fixing cost is high, because
they are both out of production model as they are old and need custom made spare parts.
In correlation of capacity and energy analyses came out interesting matter what is related to low
pressure system total capacity and production variation. Issue can occur if all production lines will
be occupied with large containers and LPS is running with all compressors. Problem stands in the
question, is the LPS capacity big enough to tolerate any compressor failures in this kind occasion.
This matter could be source for further FTA analyses for risk management and investment planning.
FTA analyses will not be conducted in this thesis, since it will go out of the scope of this thesis, thus
this problem can be source for further analyses in some other project/thesis.
The test revealed the poor condition of our four compressors, where two of them were repairable
with reasonable cost and other two were not. As a result of this test, our management decided to
invest into two new modern compressors what has already IoT integration capability to raise the
system reliability and efficiency by detection and preventive actions. Additionally, was replaced LPS
multipilot system with newer and modern one, also with IoT integration possibilities.
This test proved to our management that this kind of new approach in Järvakandi O-I plant will be
beneficial for reliability wise and they decided to continue implementing this framework with
provided solution to collect further data in order to improve.

48
5.2 IoT deployment in compressed air system
Previous sub-chapter help to validate the idea of developing IoT based system is beneficial to our
enterprise. Infatuated to that, our company is thriving forward to this direction by taking step-by-
step actions.
Due to problems what were discovered in framework validation phase, were replaced two old
compressors GA 250 and LG200, from low pressure system to new modern ones. These new Atlas
Copco GA200 (Figure 5.2) compressors have already installed gateway connection to internal
network for cloud monitoring. It allows to see machine’s operations, but do not record it to internal
cloud.
Figure 5.2 Atlas Copco GA 200 interface with IoT integration
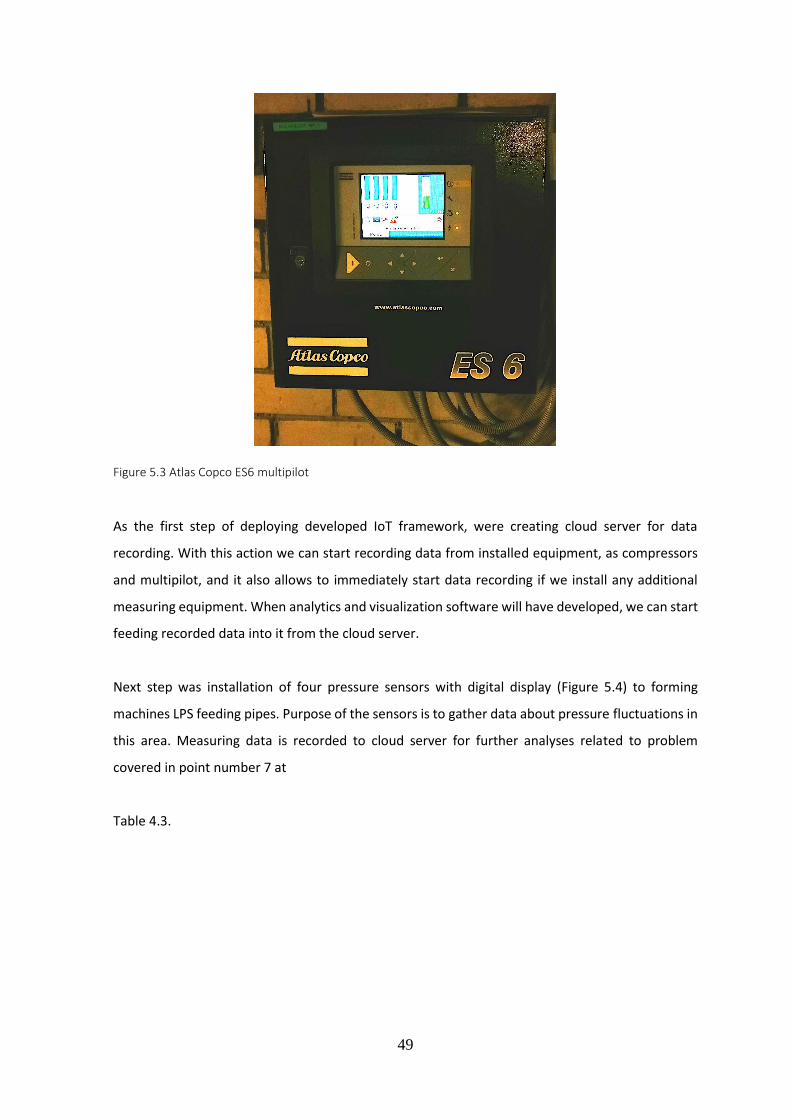
Together with compressors was installed also new ES6 Atlas Copco (Figure 5.3) multipilot system
what is connected with all LPS machines. ES6 has again network gateway connection and with that
can be observed the system operation, but no recording is done to internal server for further
analyses.
49
Figure 5.3 Atlas Copco ES6 multipilot
As the first step of deploying developed IoT framework, were creating cloud server for data
recording. With this action we can start recording data from installed equipment, as compressors
and multipilot, and it also allows to immediately start data recording if we install any additional
measuring equipment. When analytics and visualization software will have developed, we can start
feeding recorded data into it from the cloud server.
Next step was installation of four pressure sensors with digital display (Figure 5.4) to forming
machines LPS feeding pipes. Purpose of the sensors is to gather data about pressure fluctuations in
this area. Measuring data is recorded to cloud server for further analyses related to problem
covered in point number 7 at
Table 4.3.

50
Figure 5.4 Pressure sensors on forming machines LPS feed pipes
The next steps will be analytics/visualization software development and deployment for further
actions in order to make improvements. There on would be installation of other missing
components from designed IoT frame. As they are flow meters, pressure and vibration sensors.
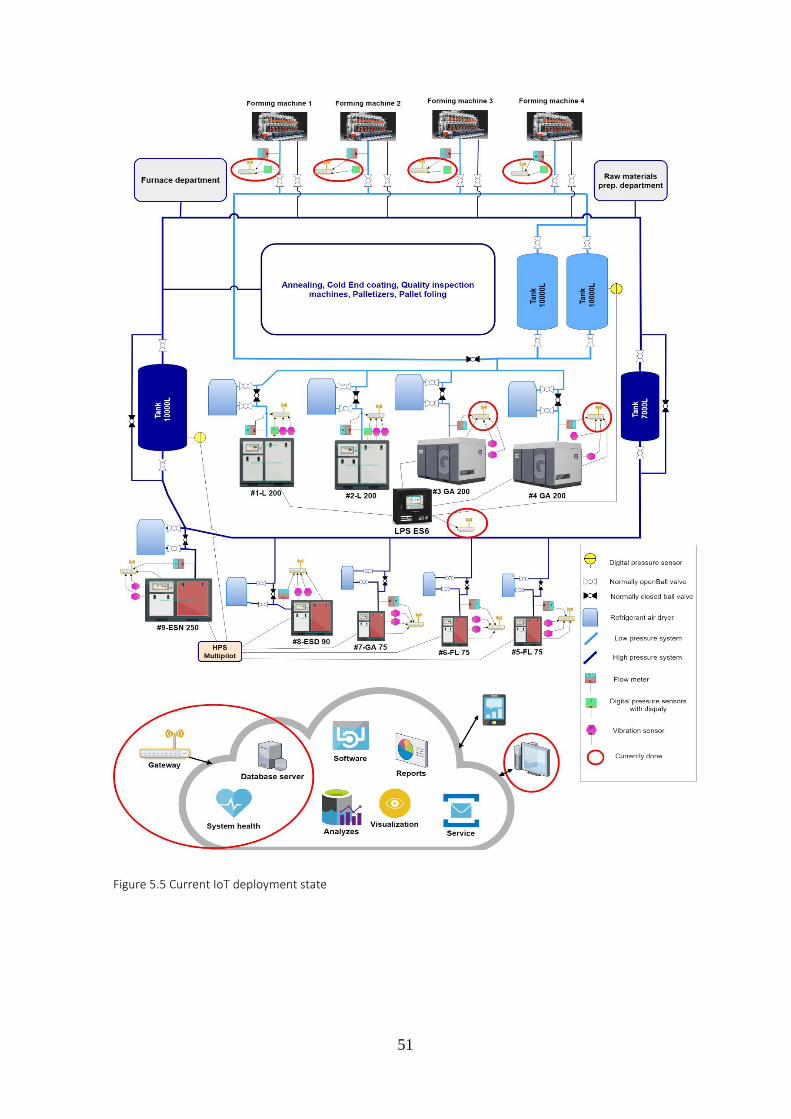
Current situation with the deployment is visualized on Figure 5.5, where already accomplished
works are surrounded with red frames.
51
Figure 5.5 Current IoT deployment state
52
SUMMARY
The purpose of this master thesis was to develop an IoT based framework in order to design and
built IoT infrastructure for managing compressed air system. Thesis topic was raised from the issue
of compressed air system reliability, what is causing production losses and instability in general
efficiency of the plant. The aim of new IoT system is to observe the compressed air system in order
to plan preventive actions for avoidance of major failures and to stop acting as “extinguishing the
fire”. Additionally, to start gathering data about the system, on based what could improvement
actions developed and deployed in the plant.
In the introductory part of the thesis, the author gives an overview of what is happening in glass
container industry to better understand why company is moving forward to implementing Industry
4.0 and IoT ideology’s in sight of improvements. Shortly is explained they logic behind the plant
core functions and the criticality of support systems.
In order to fulfil the main task of the thesis, thorough literature review was conducted for fully
understand the scope of main thesis objective. Literature review is covering the latest dynamics in
industry as they are Industry 4.0 and IoT ideologies together with Lean Six Sigma, also are explained
five most common tools for reliability engineering for purpose to select most suitable one for the
IoT framework development.
Following task was to develop a framework for designing an IoT based infrastructure in order to
manage compressed air system. Framework is developed with keeping in mind Industry 4.0, IoT and
Lean Six Sigma basics, together with reliability engineering tool FMEA, what helps to define most
critical points for IoT integration for data collection in order to take action preventively or for
improvements. As in this thesis, this framework is used for managing compressed air systems with
IoT integration, as well it can be used with any other kind of systems where is desired reliability
gain trough IoT integration.
Prior of using developed framework for designing an IoT system, author of the thesis gave a brief
overview of O-I Production Estonia AS and visualised with explanations the main production
processes for understanding how compressed air driven everything is. Detailed description of
previous compressed air system together with visualised schema was provided to have a clear
understanding of the system. Further on were conducted team based FMEA analyses to define base
RPN number for marked failure modes. Improvement actions were offered together with the team
53
and new RPN’s were calculated in order to compare them with old ones. As a result RNS’s were
improved from 25-95% on specific failure modes, it confirmed that planned IoT system will be
beneficial for reducing risks in system. Improvement actions from FMEA were used for carrying out
survey about compressors in order to design IoT system with external contractors.
The last task of the thesis was to validate developed framework and prove to the plant management
that provided IoT system will be beneficial as it raises compressed air system reliability. In this part,
author conducted a test, where was discovered that 4 out of 9 compressors had some problems
with main function and needed repairs. Performed test validated framework fully as is gave desired
data in order to take preventive actions and plan investment. Conclusion was drawn by the
management as well, to continue deployment of designed IoT system with step-by-step actions.
In conclusion, author of the thesis is very satisfied with the outcome, as the developed framework
were validated well in the conducted test, what additionally proved to our management to continue
with IoT integration bath. Moreover, from here raises many topics for further research as in the
plant are several other critical support systems such as vacuum and raw water, where an IoT
integration can raise the reliability and safety in the plant.
54
KOKKUVÕTE
Antud magistritöö eesmärk oli arendada raamistik, mille abil on võimalik disainida ja arendada välja
IoT-l põhinev juhtimis ning jälgimis süsteem suruõhule. Magistritöö teema arenes välja suruõhu
süsteemi problemidest ja ebastabiilsustes tulenevalt riketest, mis põhjustavad tootmise seisakuid
ning üleüldist effektiivsuse langust. Uue arendatavad IoT infrastruktuuri eesmärk on alustada
suruõhu süsteemis ennetavate tegevuste tegemist, et vältida rikkeid ning mitte päästa olukorda,
kui see on juba juhtunud. Teiseks eemärgiks oleks olekuinfo kogumine, mis võimaldaks viia läbi
analüüse süsteemi parendamiseks ning nende planeerimiseks.
Sissejuhatavas osas autor annab ülevaate hetkel klaaskonteinerite turul toimuvast, mis selgitab
miks ettevõte on otustanud rakendada enda tootmises Tööstus 4.0 ja IoT ideloogiaid. Lühidalt on
kirjeldatud ka tehase põhisüsteemide loogika ning opereerimine kui tervik süsteem.
Magistritöö püstitatud eesmärgi täitmiseks, viis autor läbi põhjaliku kirjanduse uurimuse, et mõista
terve töö temaatikat ja teooria arusaamu. Kirjanduse valik hõlmab Tööstus 4.0, IoT ja Lean Six Sigma
ideoloogiad. Lisaks uuriti ka viite enimlevinud tehnika usaldusväärsuse arendamise töörista, mille
seast valiti välja kõige sobilikum töö tarvis.
Järgnev ülesanne oli arendada sobilik raamistik IoT süsteemi disainimiseks, et hallata suruõhu
süsteemi. Raamistiku arendamisel on jälgiti Tööstus 4.0, IoT ja Lean Six Sigma põhialuseid koos
süsteemide usaldusväärsuse disainimise tööriistaga. Eelnimetatud tööriist aitab defineerida kõige
kriitilisemaid seadmete parameetreid, mida integreerida IoT jälgimissüsteemi, mis võimaldab
planeerida tegevusi ennetavalt. Kuigi selles töös kasutatkse arendatud raamistikku ainult suruõhu
süsteemi haldamiseks IoT võimalustega, siis lisaks on seda võimalik rakendada kõikide tehniliste
süsteemide puhul, kus soovitakse selle usaldusväärsust tõsta.
Enne arendatud raamistiku kasutamist, annab autor ülevaate O-I Production Estonia AS-st ja selle
põhilistest tootmise funktsioonidest. Lisaks selgitab selle juurde kus ja kuidas need on seotud
suruõhusüsteemidega. Peatükis on samuti põhjalik suruõhusüsteemi kirjeldus koos visualiseeriva
skeemiga. Järgnevalt viidi läbi arendatud raamistiku rakendamine, kus siis tehtid FMEA analüüs
koos meeskonnaga, et määrata esialgsed riski hinded. Järgnevalt leiti koos meeksonnaga
soovitatavad parendustegevust, mille põhjal arvutati välja uued riski hinded ning võrreldi algseteks,
et leida nende effektiivsus. Tulemusena vähenesid rikete riskid 25-95%, mis tõestas planeeritava
IoT süsteemi kasulikkust. Parendustegevused FMEA analüüsist oli aluseks planeeritava IoT süsteemi
disainimiseks ning nende põhjal arendati koostöös väliste ettevõtetega välja sobilik IoT lahendus.

55
Magistritöö viimaseks ülesandeks oli valideerida raamistik ja põhjendada ettevõtte juhatusele, miks
pakutud IoT lahendus on neile kasulik. Eelnimetatud ülessannete täitmiseks viis autor läbi testi,
mille käigus avastati neljal kompressoril üheksast vead kruvielemendi tööga, mis vajasid parandusi.
Avastatud probleemid analüüsiti põhjalikud, et kinitatada nende tõesust, mis ka suudeti. Läbiviidud
test valideeris täielikult arendatud raamistiku, kuna võimaldas saada infot ennetavateks
tegevusteks ja tuleviku investeeringuteks. Samuti, ettevõtte juhtkond otustas testi tulemuste põhjal
edasi liikuda pakutud IoT süsteemi rakendamisega.
Kokkuvõttes on autor väga rahul antud magistirtööst saadud tulemustega, kuna läbiviidud testiga
suudeti positiivselt valideerida arendatud raamistik. Ning see omakorda aitas veenda ettevõtte
juhtkonda IoT põhiste süsteemide arendamise poolt, et vähendada ettevõtlusrikse. See omakorda
tõstatab ainest edasiseks uurimiseks, kuna tehases on veel plaju teisigi põhiprotsesse toetavaid
süsteeme, kus oleks suureks kasuks IoT lahendustest riskide vähendamisel.

56
LIST OF REFERENCES
[1] N. Gandhi, “Industry 4.0 – fourth industrial revolution,” SAP, [Online]. Available:
https://blogs.sap.com/2015/06/30/industry-40-fourth-industrial-revolution/. [Accessed 20
April 2018].
[2] I-SCOOP, “The Industrial Internet of Things (IIoT): the business guide to Industrial IoT,” I-
Scoop, [Online]. Available: https://www.i-scoop.eu/internet-of-things-guide/industrial-
internet-things-iiot-saving-costs-innovation/#The_definitions_of_Industrial_IoT_and_IIoT.
[Accessed 19 April 2018].
[3] D. Underwood, “Industry 4.0: Key Design Principles,” KingStar, [Online]. Available:
https://kingstar.com/industry-4-0-key-design-principles/. [Accessed 17 April 2018].
[4] J. B. Jørgensen, “Cyber-Physical Systems (CPS),” [Online]. Available:
http://www.imm.dtu.dk/~jbjo/cps.html. [Accessed 22 April 2018].
[5] UC Berkeley Dept., “Cyber-Physical Systems,” [Online]. Available:
https://ptolemy.berkeley.edu/projects/cps/. [Accessed 23 April 2018].
[6] A. Zanni, “Cyber-physical systems and smart cities,” IBM, 20 April 2015. [Online]. Available:
https://www.ibm.com/developerworks/library/ba-cyber-physical-systems-and-smart-cities-
iot/index.html. [Accessed 29 April 2018].
[7] I-SCOOP, “The Internet of Things (IoT) – essential IoT business guide,” I-SCOOP, [Online].
Available: https://www.i-scoop.eu/internet-of-things-guide/. [Accessed 19 April 2018].
[8] A. Rastogi, „A Brief Introduction To Lean, Six Sigma And Lean Six Sigma,“ GreyCampus, 12
March 2018. [Võrgumaterjal]. Available: https://www.greycampus.com/blog/quality-
management/a-brief-introduction-to-lean-and-six-sigma-and-lean-six-sigma. [Kasutatud 16
May 2018].
[9] USA DEP of Defence, “MIL-HDBK-338B ELECTRONIC RELIABILITY DESIGN HANDBOOK,” 1998.
57
[10] ITEM Software, “Reliability Prediction Basics,” 2007. [Online]. Available:
http://www.reliabilityeducation.com/ReliabilityPredictionBasics.pdf. [Accessed 1 May 2018].
[11] International Electrotechnical Commission, “IEC 300-3-1 Dependability management-Guide
on methodology,” 1991.
[12] M. Lendvay, “Dependability Assurance of Industrial Production,” Proceedings: Science in
Engineering, Economics and Education, Budabest, 2004.
[13] M.Kostina, „Reliability Management of Manufacturing Processes in Machinery Enterprises,“
TUT, 2012.
[14] WEIBULL, “Fault Tree Analysis,” [Online]. Available: http://www.weibull.com/basics/fault-
tree/index.htm. [Accessed 15 May 2018].
[15] RELYENCE, “Answering the 5 W’s of Fault Tree Analysis,” [Online]. Available:
https://www.relyence.com/2017/07/12/answering-the-5-ws-of-fault-tree-
analysis/#prettyPhoto. [Accessed 14 May 2018].
[16] INVESTOPEDIA, “Markov Analysis,” [Online]. Available:
https://www.investopedia.com/terms/m/markov-analysis.asp. [Accessed 15 May 2018].
[17] PEARSON, “Human Resources planning,” [Online]. Available:
https://www.slideshare.net/irshadfullclip/chapter-05-dessler-12cepptch05. [Accessed 15
May 2018].
[18] “ICH Q9 Quality Risk Management,” European Medicines Agency Inspections, 2006.
[19] Quality-One, “Failure Mode and Effects Analysis (FMEA),” [Online]. Available: https://quality-
one.com/fmea/. [Accessed 15 April 2018].
[20] Open_Silicon, “IOT ASICS,” [Online]. Available: https://www.open-silicon.com/solutions/iot-
asics/. [Accessed 16 May 2018].
[21] MesseTechnik Gmbh, “High-accuracy flow and air consumption,” [Online]. Available:
http://www.humiditysystems.com/Images/Messtechnik/prospect_VA_300_english.pdf.
58
[22] International Organization for Standardization, ISO 10816-3:2009, 2018.
[23] GTAI, “INDUSTRIE 4.0,” German Trade & Invest, [Online]. Available:
https://www.gtai.de/GTAI/Navigation/EN/Invest/Industries/Industrie-4-0/Industrie-4-
0/industrie-4-0-what-is-it.html. [Accessed 20 April 2018].
[24] JGraph Ltd., “draw.io,” [Online]. Available: https://www.draw.io/. [Accessed 2018].
[25] Atlas Copco, “Atlas Copco ES controllers for multiple compressor installations,” [Online].
Available: https://www.sustainabilitymatters.net.au/content/energy/hot-product/atlas-
copco-es-controllers-for-multiple-compressor-installations-1137161042. [Accessed 23 May
2018].
[26] J. Sahno, E. Shevtshenko, T. Karaulova and K. Tahera, “Framework for Continuous
Improvement of Production Processes,” Engineering Economics, vol. 26, no. 2, pp. 169-180,
2015.
[27] T. Karaulova, M. Kostina and E. Shevtshenko, “Reliability Assessment of Manufacturing
Processes,” International Journal of Industrial Engineering and Management (IJIEM), vol. 3,
no. 3, pp. 143-151, 2012.
Related Documents