A Project Report (16MBAPR407) A STUDY ON IMPACT OF FOREIGN CURRENCY FLUCTUATIONS ON INDIAN STOCK MARKET WITH REFERENCE TO NIFTY BY SOMASHEKHAR C (1AY16MBA77) SUBMITTED TO VISVESVARAYA TECHNOLOGICAL UNIVERSITY BELAGAVI In the fulfillment of the requirement for the award of the degree of MASTER OF BUSNIESS ADMINISTRATION Under the Guidance of INTERNAL GUIDE EXTERNAL GUIDE DR. PRAKASH B. YARAGOL Ms. RAHSMI RANJAN PADHI Professor Dept of MBA AIT Unit Head- Karnataka Department of MBA ACHARYA INSTITUTE OF TECHNOLOGY Soldevanahali, Hesaraghatta Main Road, Bangalore-107 May 2018

Welcome message from author
This document is posted to help you gain knowledge. Please leave a comment to let me know what you think about it! Share it to your friends and learn new things together.
Transcript
A Project Report
(16MBAPR407)
A STUDY ON IMPACT OF FOREIGN CURRENCY FLUCTUATIONS ON
INDIAN STOCK MARKET WITH REFERENCE TO NIFTY
BY
SOMASHEKHAR C
(1AY16MBA77)
SUBMITTED TO
VISVESVARAYA TECHNOLOGICAL UNIVERSITY
BELAGAVI
In the fulfillment of the requirement for the award of the degree of
MASTER OF BUSNIESS ADMINISTRATION
Under the Guidance of
INTERNAL GUIDE EXTERNAL GUIDE
DR. PRAKASH B. YARAGOL Ms. RAHSMI RANJAN PADHI Professor Dept of MBA AIT Unit Head- Karnataka
Department of MBA
ACHARYA INSTITUTE OF TECHNOLOGY Soldevanahali, Hesaraghatta Main Road, Bangalore-107
May 2018
....L.
Ji .
WEALTH . Br.IA CREATORS -- -- -- - -- -- -- ·-- -- - --Bui Id Ing Relattonahlpa . Crtallng Wealth BMA Wealth Creators Ltd.
CERTIFICATE
This is to certify that Mr. SOMASHEKHAR C USN I A Y l 6MBA 77 a student
of MBA studying at A CHARY A INSTITUTE OF TECHNOLOGY, Bangalore
has undergone the internship and has completed project titled as "A study on
Impact of Foreign Currency Fluctuation on Indian Stock Market With
Reference To Nifty" at BMA Wealth creators Ltd (Jayanagar Bangalore
Branch) from the period of 15thJanuary 2018 to 24th March 2018 in our
company under the guidance of Ms. RASHMI RAJAN P ADHI.
We wish to express our appreciation for his excellent work done and wish him
all the success in his new endeavour.
Place: Bangalore
Date: 24-March-2018
Ext'\')nal GHide
-~~\,\\i ' _.,.,..,-::: '}..,-'•
RASH~~ADID
Corporate Office:
Vishwakarma 2915A, Or. Ambedkar Sarani. Topsia Road,
Kolkata - 700046 PH : 033-400110099
Rogd Office 14/1 , Paul Mansion. 1st Floor, 6, Bishop Lefroy Rod, Kolkata 700020
I I
~
ACHARYA INSTITUTE OF TECHNOLOGY
(Affiliated to Visvesvaraya Technological University, Belagavi, Approved byAICTE, New Delhi and Accredited by NBA and NAAC)
25/05/2018
CERTIFICATE
This is to certify that Mr. Somashekhar C bearing USN
lA Y16MBA 77 is a bonafide student of Master of Business Administration
course of the Institute 2016-18 batch, affiliated to Visvesvaraya
Technological University, Belgaum. Project report on "A Study on Impact
of Foreign Currency Fluctuations on Indian Stock Market with
Reference to NIFTY at BMA Wealth Creators Ltd" Bangalore is
prepared by him under the guidance of Dr. Prakash B Yaragol in partial
fulfillment of the requirements for the award of the degree of Master of
Business Administration, Visvesvaraya Technological University, Belgaum,
Kamataka.
'k~ 1.-f]S /u ~
JjN~ ~~'ln;;;:~nt Signature of Internal Guide
<
Separ-tment of MBA Acharya Institute of Technology
J oldevanahtn, sa~r,?.1ore-560 io·,·
~~~ Signature of Principal
PRINCIPAL
'· ~ tQ\!f 'f·'C'"'l'rlJ'f': u···- T;. , 'Ol OGV ., .., ,~., ,H, i.) 1 1 t r .... \oo7 ,'i _
~;oldevanat1a!li Bangalure-550 1 o;
Acharya Or. Sarvepalli Aadhakrrshnan Road. Soladevanahalli, Acharya PO .. Bangalore 560 107, Karna1aka, lnd1a • www.acharya.ac.1n/ait/ • Ph: +91-80-225 555 55 Extn.: 2102 • Fax· +91-80-237 002 42 • E-mail: [email protected]
DECLARATION
I SOMASHEKAHR C hereby declare that internship report entitled "A STUDY ON IMPACT ,
OF FOREIGN CURRENCY FLUCTUATIONS ON INDIAN STOCK MARKET WITH
REFERENCE TO NIFTY" at BMA WEALTH CREATORS LTD, Bangalore prepared by
me under the guidance of DR. PRAKASH B Y ARAGOL, Professor of MBA Department,
Acharya Institute of Technology and external assistance by Ms. RASHMI RANJAN PADHI unit
head at BMA wealth creators ltd Bangalore.
I also declare this Internship work is towards the partial fulfillment of the university regulations
for the award of the degree of Master of Business Administration by Visvesvaraya Technological
University, Belgaum.
I have undergone a summer project for a period of TEN weeks. I further declare that this project
is based on the original study undertaken by me and has not been submitted for the award of any
degree/diploma from any other University Institution.
Place: Bangalore iomashekhar C. 1AY16MBA77

ACKNOWLEDGEMENT
I would like to thank all of those who have helped and supported me in completing this
project successfully.
Firstly I thank Dr.S.C.Pilli Principal,Dr.Mahesh Dean Academics and Dr.Nijaguna G.
Head of the department of MBA of Acharya Institution of Technology for giving
encouragement and support for completing the project.
I take this opportunity to thank our internal guide Dr. Prakash B Yaragolfor his constant
guidance in completing the project.
I wish to pay my heartfelt respect and regards to Ms.RASHMI RANJAN PADHI
Bangalore, for the cooperation and support, which helped me successfully to accomplish my
project work. Also, I am thankful to them for their valuable guidance given to me during the
course of my project.
Finally, it gives me great pleasure to extend my thanks to my Parents, Family, Friends and all
Teaching staff and Non-Teaching staff who have been instrumental either directly or
indirectly for this constant encouragement in carrying out this project successfully.
Place: BANGALORE SOMASHEKHAR C 1AY16MBA77
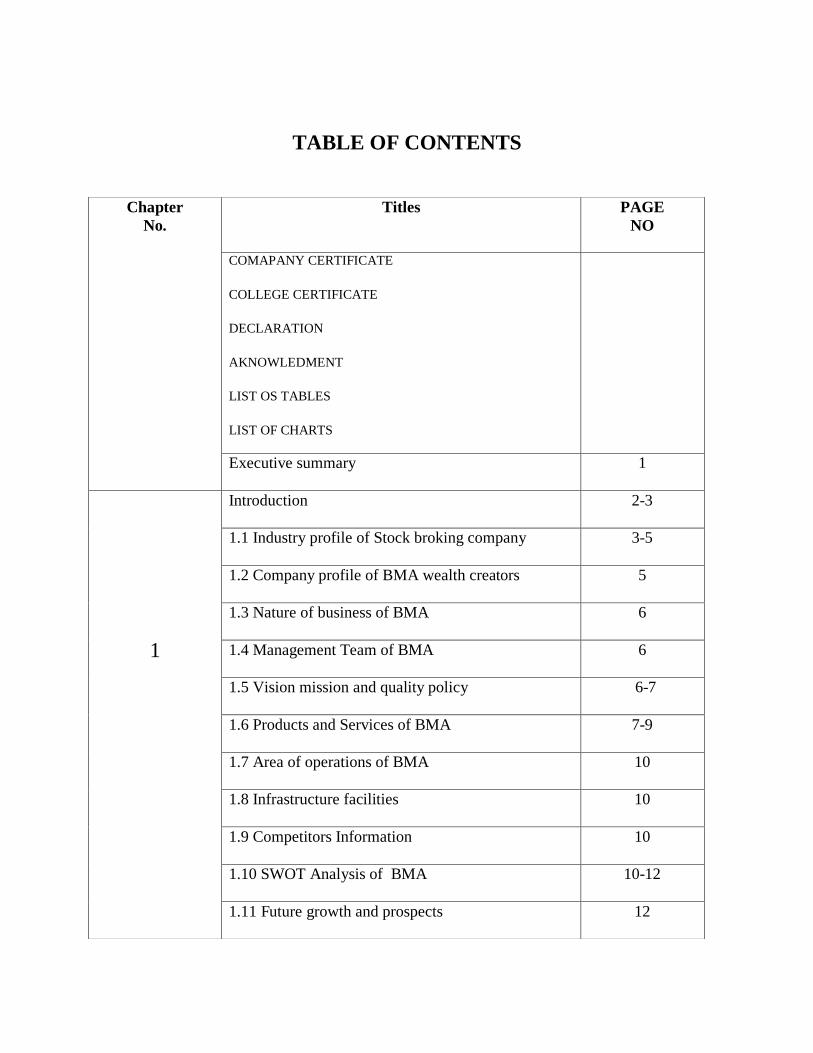
TABLE OF CONTENTS
Chapter
No.
Titles PAGE
NO
COMAPANY CERTIFICATE
COLLEGE CERTIFICATE
DECLARATION
AKNOWLEDMENT
LIST OS TABLES
LIST OF CHARTS
Executive summary 1
1
Introduction 2-3
1.1 Industry profile of Stock broking company 3-5
1.2 Company profile of BMA wealth creators 5
1.3 Nature of business of BMA 6
1.4 Management Team of BMA 6
1.5 Vision mission and quality policy 6-7
1.6 Products and Services of BMA 7-9
1.7 Area of operations of BMA 10
1.8 Infrastructure facilities 10
1.9 Competitors Information 10
1.10 SWOT Analysis of BMA 10-12
1.11 Future growth and prospects 12
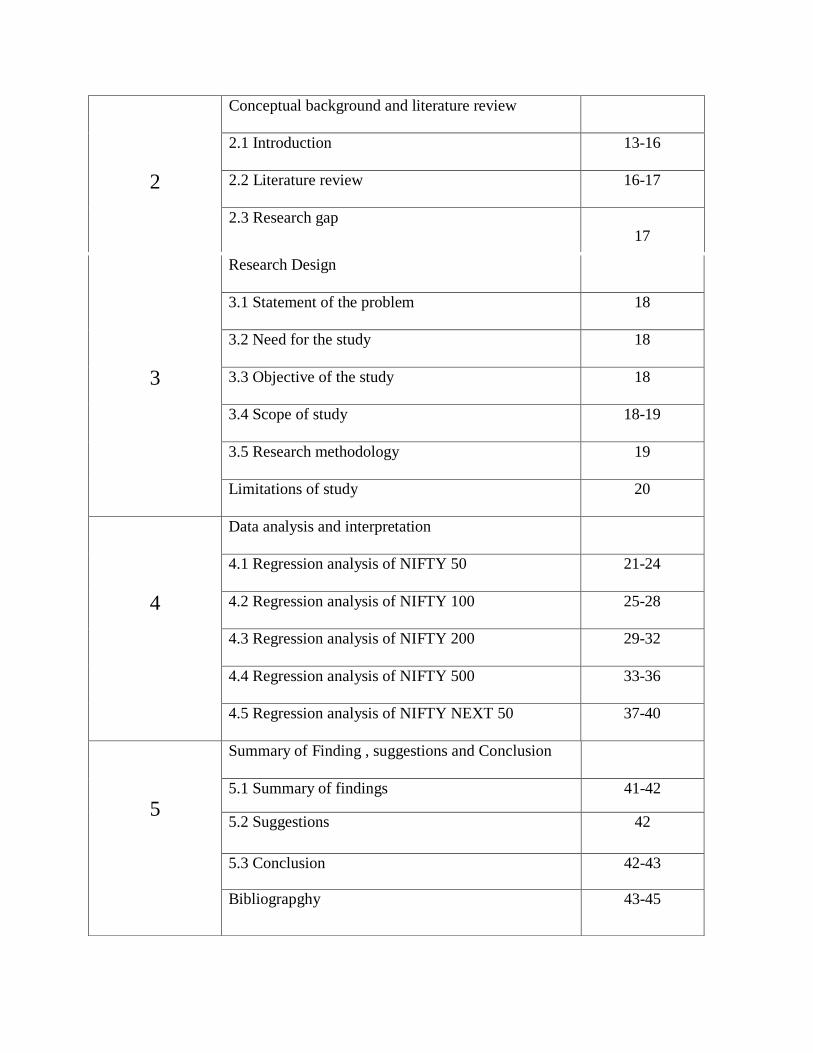
2
Conceptual background and literature review
2.1 Introduction 13-16
2.2 Literature review 16-17
2.3 Research gap
17
3
Research Design
3.1 Statement of the problem 18
3.2 Need for the study 18
3.3 Objective of the study 18
3.4 Scope of study 18-19
3.5 Research methodology 19
Limitations of study 20
4
Data analysis and interpretation
4.1 Regression analysis of NIFTY 50 21-24
4.2 Regression analysis of NIFTY 100 25-28
4.3 Regression analysis of NIFTY 200 29-32
4.4 Regression analysis of NIFTY 500 33-36
4.5 Regression analysis of NIFTY NEXT 50 37-40
5
Summary of Finding , suggestions and Conclusion
5.1 Summary of findings 41-42
5.2 Suggestions 42
5.3 Conclusion 42-43
Bibliograpghy 43-45
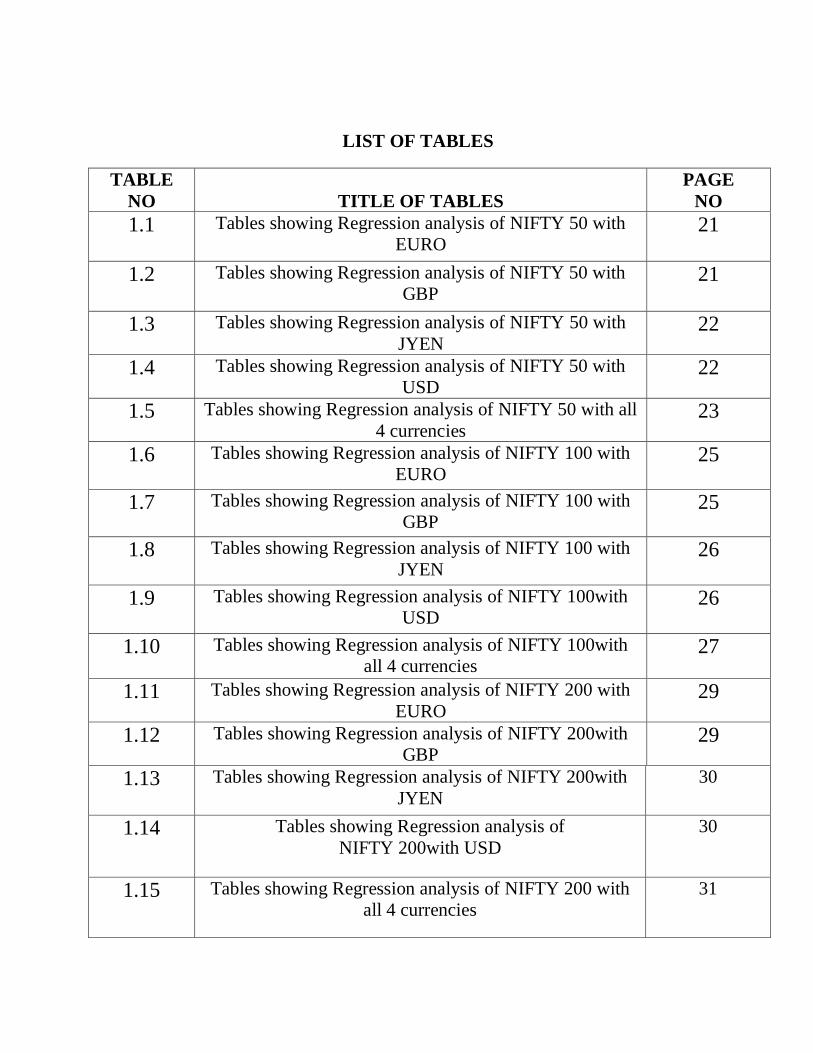
LIST OF TABLES
TABLE
NO
TITLE OF TABLES
PAGE
NO
1.1 Tables showing Regression analysis of NIFTY 50 with
EURO 21
1.2 Tables showing Regression analysis of NIFTY 50 with
GBP 21
1.3 Tables showing Regression analysis of NIFTY 50 with
JYEN 22
1.4 Tables showing Regression analysis of NIFTY 50 with
USD 22
1.5 Tables showing Regression analysis of NIFTY 50 with all
4 currencies 23
1.6 Tables showing Regression analysis of NIFTY 100 with
EURO 25
1.7 Tables showing Regression analysis of NIFTY 100 with
GBP 25
1.8 Tables showing Regression analysis of NIFTY 100 with
JYEN 26
1.9 Tables showing Regression analysis of NIFTY 100with
USD 26
1.10 Tables showing Regression analysis of NIFTY 100with
all 4 currencies 27
1.11 Tables showing Regression analysis of NIFTY 200 with
EURO 29
1.12 Tables showing Regression analysis of NIFTY 200with
GBP 29
1.13 Tables showing Regression analysis of NIFTY 200with
JYEN
30
1.14 Tables showing Regression analysis of
NIFTY 200with USD
30
1.15 Tables showing Regression analysis of NIFTY 200 with
all 4 currencies
31
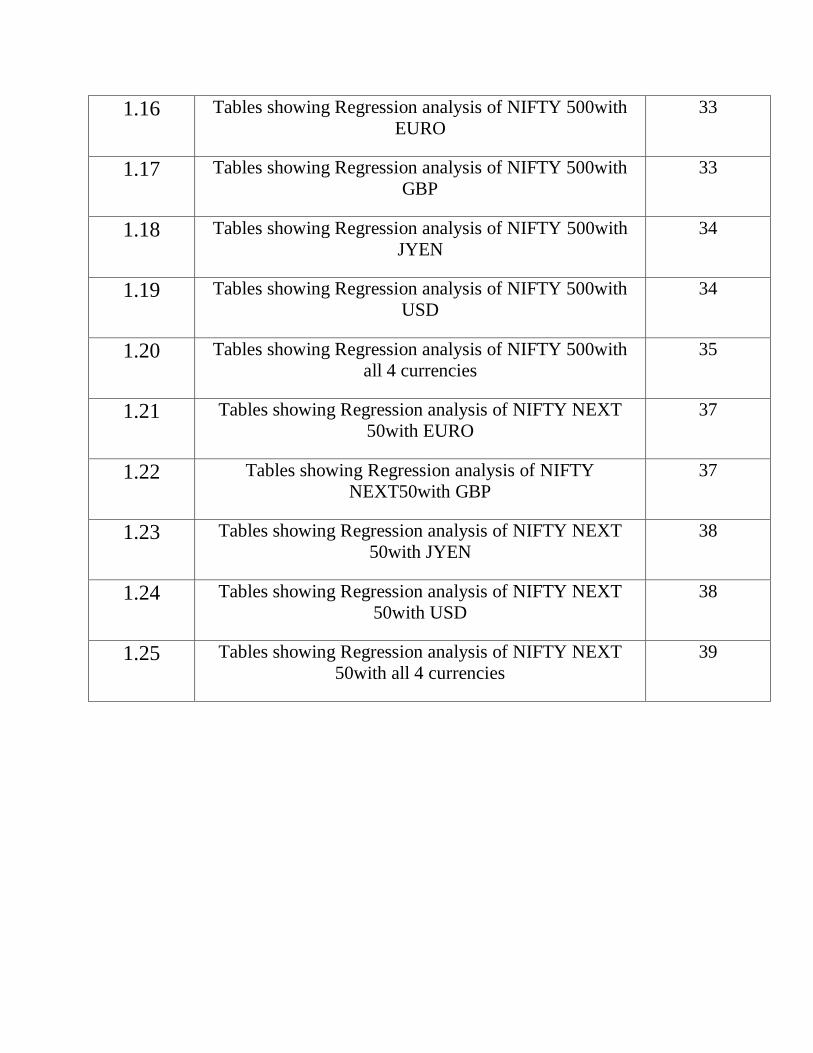
1.16 Tables showing Regression analysis of NIFTY 500with
EURO
33
1.17 Tables showing Regression analysis of NIFTY 500with
GBP
33
1.18 Tables showing Regression analysis of NIFTY 500with
JYEN
34
1.19 Tables showing Regression analysis of NIFTY 500with
USD
34
1.20 Tables showing Regression analysis of NIFTY 500with
all 4 currencies
35
1.21 Tables showing Regression analysis of NIFTY NEXT
50with EURO
37
1.22 Tables showing Regression analysis of NIFTY
NEXT50with GBP
37
1.23 Tables showing Regression analysis of NIFTY NEXT
50with JYEN
38
1.24 Tables showing Regression analysis of NIFTY NEXT
50with USD
38
1.25 Tables showing Regression analysis of NIFTY NEXT
50with all 4 currencies
39
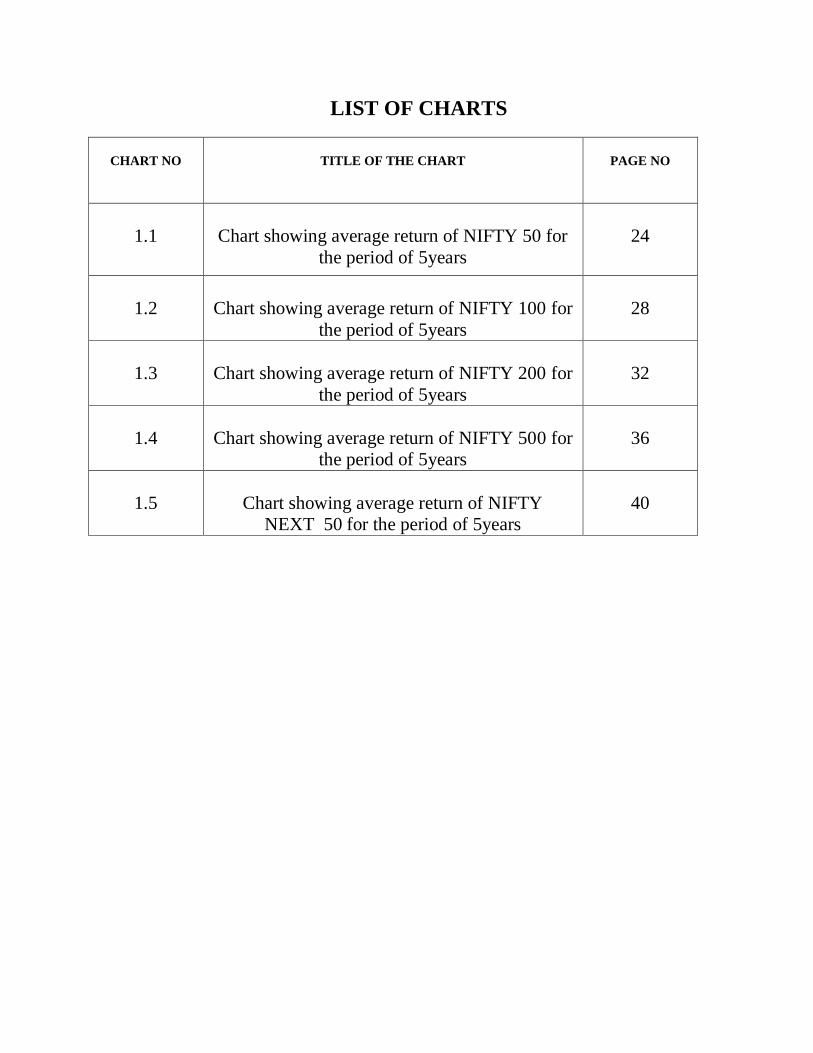
LIST OF CHARTS
CHART NO
TITLE OF THE CHART
PAGE NO
1.1
Chart showing average return of NIFTY 50 for
the period of 5years
24
1.2
Chart showing average return of NIFTY 100 for
the period of 5years
28
1.3
Chart showing average return of NIFTY 200 for
the period of 5years
32
1.4
Chart showing average return of NIFTY 500 for
the period of 5years
36
1.5
Chart showing average return of NIFTY
NEXT 50 for the period of 5years
40
1
EXECUTIVE SUMMARY
This project gives the insight of the one of the oldest financial service providing firm BMA
Wealth Creators located in Kolkata. The project gives the complete information about the
organisation and the various kinds of services provided to the clients to satisfy to their needs,
the firm’s strengths, weakness, opportunities and threats are also analysed.
The economic development of the country mainly depends upon growth and efficiency of the
stock markets. The efficiency and growth of stock markets largely depends on various
macroeconomic factors. One of the main macroeconomic, external factors which have a
major impact on activities of stock market is FOREIGN EXCHANGE RATE. So, to find
whether the foreign currency fluctuation will affect the stock market of India or not and to
provide suggestions to the investors on the basis of the conclusion derived.
Stock market and foreign currency fluctuation are having a significant relationship. So, in
order to analyse these things we have taken closing prices of 5 NSE indices for 5years.
Choosing 4 major foreign exchange rates which deals in Indian securities exchange (USD,
GBP, EURO and JYEN) taking 5 years time span estimation of currencies against Indian
rupee. Based on these information we figured yearly return for indices, we computed
Regression analysis as a result we found that there is so significant relationship between
foreign currency fluctuation and Indian stock market. So according to the examination we
presume that effect of foreign currency fluctuation does not influence the Indian stock
market. Financial investors while making ventures does not consider the foreign currency
fluctuation as an indicator for analysing stock prices for making investment.
2
Chapter-1
INTRODUCTION
INTRODUCTION TO THE TOPIC
Day by day we go over news like Rupees' esteem slides to 69. We see levels of Indian Rupee
going up or tumbling down against US Dollar. Have you at any point wondered what happens
when estimation of a money acknowledge or deteriorate? All things considered, in this time
of globalization where a scarcest change in one perspective can influence the countries
identified with that viewpoint, we can't neglect the regular variances of foreign currency
fluctuation which puts an enormous effect on an economy of a country. The problem area
deals the same.
The effort has been made to find out the value of the currency, how foreign currency
fluctuation influence stock prices of various organizations. This examination is to look at the
time of effect of currency fluctuation on Indian securities exchange. In order to examine the
impact and it has US dollar (USD) EURO, JYEN, POUNDS, and currency fluctuation against
Indian rupee as independent factors and national stock index (NIFTY) as a dependent
variable. The examination has been led for the time of five years from 2012 to 2017.
Furthermore, carrying out regression analysis for the NSE indices with the different foreign
currencies to find the co-relation and the impact of currency on the nifty due to which the
nifty movement takes place. This investigation reasons that there is no impact of foreign
currency fluctuation on NIFTY. Today’s globalized economy and alternate monetary forms
and universal financial system the impact of macroeconomic elements were directing the
basics and details prevailing in the internal markets. In the current past, Indian securities
exchange have seen greatest crash of around some cross worth of investments have vanished
in a solitary day. So, it is felt that there is a need of inspecting the relative and the effect of
US dollar, Euro, Pounds and JYEN fluctuations on Indian securities exchange. So as to watch
the present economic situations and to reveal the actualities to the financial
specialists(investors). This investigation purposes to take in the dynamics and Effect of
fluctuations in the currency. Currency fluctuations are fundamentally the proceeding with
deviations between the relative ethics of the cash dispensed by one nation when compared to
various currencies. This effect of the various currencies every day It is these fluctuations that
3
investor in coinage trade exchanges appearance too carefully keeping in mind the end goal of
incurring incomes from their assets. Exchange rates among the most watched, explored and
legislatively operated economic measures.
1.01 INDUSTRY PROFILE
Stock Broking Company is a money related establishment which gives services like
purchasing and selling of financial securities to the purchaser and seller. Stock broking firm
generally trade with the assistance of specialists who help to manage investors money. They
for the most part do stock exchanging and bond exchanging with their clients. Stock breakage
additionally gives benefits like purchasing IPO, bonus shares etc. It is the registered
representative, in which the investor buys and sells stocks and other securities through a stock
market for a fee or commission. The employees of the stock broking company are entrusted
with the responsibility of carrying out research in the market to provide optimum information
to the investors, and in doing so they act as the pension fund managers and portfolio
managers alike. The firm provides loans for certain approved clients to purchase investments,
with applied terms and conditions.
The firm also provides up to date live stock prices and quotes. When the stock broking firm
does the trade for its own account, it is known as broker dealer.
BOMBAY STOCK EXCHANGE
In the nineteenth period of Indian history the business men called Premchan Roychan
established Bombay Stock Exchange (BSE). The primary stock exchange in India and oldest
most stock exchange in Asia. The BSE is the 11 the biggest stock exchanges. The market
capitalization of BSE as on July 2017 is $2 trillion.
BSE was framed with the assistance of 5 stock merchants. In the year 1957 the BSE was
perceived by Indian government under Securities Contracts Acts. Later on in the ear 1986 the
BSE created S&P BSE SENSEX. In the year 2000 the BSE utilized BSE SENSEX as device
to open derivative market trading with S&P BSE SENSEX future markets.
4
BSE in the year 2012 moved toward becoming accomplice trade of United Nations
Sustainable Stock Exchange activity.
NATIONAL STOCK EXCHANGE
“In the year 1992 the countries initially desalinated stock exchange was set up called National
Stock Exchange (NSE). NSE is just stock exchange which give completely mechanized,
screen based electronic exchanging framework. Vikram Limaye is present CEO and MD of
NSE. The aggregate market capitalization of NSE is $1.41 trillion.
NSE's NIFTY 50 came into drive on 1996 and reveals to us top 50 financial companies in
India and world. Nifty is managed by Indian Index and service Products (IISL).
NSE offers services like trading of securities, clearing and settlement process, trading of
derivatives etc. NSE is the twelfth biggest stock exchange in the world. The fundamental
companies of NSE are LIC, SBI, IFCI and IDBI Etc”1
SECURITIES AND EXCHANGE BOARD (SEBI)
“SEBI established in the year 1992, on April 12 according to the terms and conditions of
securities and exchange board of India Act 1992. It is the watchdog for all the transactions
carries out the security market in the market. The principle function of the SEBI is to
supervise activities in connection to all the monetary activities by giving guidelines. The
present CEO and chairman of SEBI is Ajay tyagi. It consists of 4 whole time directors and 4
part time directors. The major achievement of SEBI is making markets electronic and
paperless and introducing T+2 settlement system in April 2003. The SEBI is responsive to
3categories of people that is investors, issuer of securities (issuing companies), brokers or any
market intermediaries”2
5
INDIAN STOCK MARKET
Stock market is a very popular market where the company’s shares and securities are traded.
World’s first stock market was establishes in Belgium, later on many countries started their
own stock market.
MAJOR STOCK EXCHANGES IN INDIA
1. Bombay Stock Exchange.
2. Calcutta Stock Exchange.
3. National Stock Exchange.
4. Cochin Stock Exchange.
5. Over the Counter Stock Exchange (OTC).C
Capital market is a market for long term securities where the securities are bought and sold
for more than a year. It channels the wealth of investors to long term productive use, such as
companies or government making investments. There are importantly two types of capital
market
Primary Market
Secondary Market
Primary market is a market where the company’s issues shares for the first (initial) time. It
also called as new issue market. It issues shares in order to raise the capital from the public.
Secondary Market is market where securities which are already issued are traded. The shares
which are issued by primary market are traded in secondary market.
1.02 COMPANY PROFILE
BMA Wealth Creators is a firm which provides financial services to its clients. It was
established in the year 2000. Its net worth is over Rs2000crores. It has a 40 plus branches and
7000 plus business partners all over India. It provides the services like equity, Commodity,
mutual funds and Insurance. Its headquarters is located in Kolkata with over 1800 employees
who are working for the success of the company. It has a highly qualified research team that

6
is lead by industry stalwarts and experts who contribute massively to the day to day trends of
the market both in technical and fundamental parts.
It takes care of the dreams, needs, aspirations and concerns of its clients and builds a good
relationship with them.
1.03 NATURE OF BUSINESS CARRIED
BMA WC Ltd is one of the India’s leading stock brokerage companies. BMA WC Ltd also
provided online trading, stock marketing and investments to country. The important features
Providing Depository services
Providing advisory services
Opening trading account
Opening Demat accounts
Helps in online trading.
1.04 MANAGEMENT TEAM
CHAIRMAN AND MANAGING DIRECTOR:- Anubhav Bhatter
DIRECTOR:- Avinash Agarwalla
CEO:- Mrugesh Devashrayi
RESEARCH HEAD:- Dharmesh Rajdev
CHIEF HR OFFICER:- Sambit Kumar Ghosh
HEAD BROKING:- Sarat Murarka
KEY PERSON:- Asit kumar Ghosh and Shiv Kumar Damani
1.05 COMPANY VISSION AND MISSION
VISION
Aspire to be the global financial industry benchmark for providing integrated financial
services building investor wealth and confidence.
MISSION
Strive to be global premier financial supermarket providing integrated investment services to
our clients thereby partnering their aspirations and the growth of the society at large.
7
QUALITY POLICY
Our people: By promoting team work in the company, appreciating the talent, enhancing
leadership quality and acting in time and carrying out the work in pride and passion.
Our service: By becoming the financial consultant to its clients, delivering good products
and services to them and creating value.
Our technology: By trying unfaltering to deliver better technological platforms that enable
our stakeholders into deriving better business with us.
Our innovation: By continuously striving to innovate ways to better our service and enhance
the client connect experience.
Our conduct: By providing a good and safe work place, respecting the work environment,
caring for our communities and demonstrating high ethical standards.
1.06 BMA PRODUCTS AND SERVICES
BMA wealth creators provide various types of financial services to its clients. It provides
quality and superior services. Following are the areas in which BMA wealth creators render
services and satisfy its investors and clients:-
Equity Broking: The firm arrangements in value offers and subsidiaries. Offers are an
offer in an organization's offer capital. It is the littlest unit of an association's offer
capital. Open purchase shares and get profits as indicated by economic situations and
profit approach of the association
Derivative Broking: these are the instruments that derive from other securities, which
are referred to as underlying assets. The price, risk and function of the derivative
depend on underlying asset. When the underlying asset is affected the derivative is
affected. Commonly included underlying asset are stocks, commodities, bonds,
interest rates etc.
Life and General Insurance:
1. LIFE INSURANCE - Life is brimming with startling amazements.
Unpredictable occasions can strike abruptly and upset the smooth beat of life
whenever. Subsequently, one should dependably guarantee the monetary
security of his/her family. So BMA offers one of the best life insurance plans.
8
2. GENERAL INSURANCE – BMA WC oversees life covers as well as
person's life by and large. They have faith in avoiding potential risk and
remaining shielded from disasters which can happen whenever, wherever.
That is the reason BMA WC offers you a portion of the best designs
accessible in General Insurance fragment:
Motor Insurance
Health Insurance Program
Fire Insurance
Burglary Insurance
Travel Insurance
Depository Services: BMA WC is putting forth a large number of administrations
under one rooftop likewise incorporates unparalleled Depository Services. BMA WC
is an enrolled part/Depository Participant of both CDSL (Central Depository Services
Ltd.) and NSDL (National Securities Depository Ltd.), in this manner giving the
clients a choice to pick their storehouse benefits as well as the chance of exchanging
at one place.
Investment Advisory: BMA WC has an aptitude group who give venture counsel to
their customers relying upon the report put together by the exploration board of
trustees. The venture suggestions assist the financial specialists with making choice
and follow up on. They likewise furnish quality item and administrations with one of
the great research program offices.
Mutual funds: it is an investment vehicle that is made up of pool of funds from many
investors for the purpose of investing in the stocks, money market instruments and
various other assets. Mutual funds are operated by money managers who invest the
pooled funds in order gain capital gains. It is constructed in such a way that it matches
the investment objectives of the pooled investors.
Initial Public Offerings: At the point when shares are being offered by any
organization to open for acquiring in showcase out of the blue, it is known as IPO. An
IPO has a specific opening and shutting date. An IPO must be over 90% bought in of
what the firm has offered to people in general before the end date generally the entire
9
IPO gets wiped out and the cash so gathered must be returned back to the general
population.
Commodity Broking: Items like Gold, Silver and Copper and so on which are utilized
as a part of everyday life are additionally exchanged through a broking house. As a
matter of fact SEBI characterizes a great deal size of these items and that much
amount must be purchased by a speculator or in numerous of the part measure
characterized keeping in mind the end goal to buy a ware.
Bonds: An obligation instrument issued for a specific time of planned typically over a
year to raise capital. BMA WC gives a phase were the administration or corporate
organizations can pitch their securities to the overall population. The organization
ensures that the intrigue and singular amount sum is paid on the development.
Currency trading: Cash Derivatives are Future and Options contracts which you can
purchase or offer particular amount of a specific money match at a future date. It is
like the Stock Futures and Options however the fundamental happens to be money
match (i.e. USDINR, EURINR, JPYINR OR GBPINR) rather than Stocks
Fixed Deposits: A Fixed Deposits is a budgetary instrument given by Indian banks
which give financial specialists a higher rate of interest than a general investment
account, until the point when the given development dates. It could possibly require
the making of a different record. It is known as time deposit..
The characterizing standard for a fixed deposit is that the cash can't be pulled back
from the FD. Note that banks may offer lesser financing costs under unverifiable
monetary conditions. The financing cost fluctuates in the vicinity of 4 and 11 percent.
Organization Fixed Deposits are the settled stores plans offered by an organization
and it wins a settled rate of return over some stretch of time. Such stores are
additionally acknowledged by Financial Institutions and Non-Banking Finance
Companies (NBFCs). Organization Deposits offer higher rate of interests than typical
Fixed Deposits
1.07 AREA OF OPERATION
10
It has a 40 plus branches and 7000 plus business partners all over India. It provides the
services like equity, Commodity, mutual funds and Insurance. Its headquarters is located in
Kolkata with over 1800 employees who are working for the success of the company.
1.08 INFRASTRUCTURE FACILITIES
BMA provides good infrastructural facilities to their employee and company. They provide
the best environment and one of the best work place to their employee.
They provide a good place and clean environment for work for employee.
They also maintain good ventilation facilities in order have work efficiency.
They provide all office necessary (computer, tables, stationary, etc) to their employee.
They also internet facilities for employee all time for work need with speed network
connection.
They also provide quality product and services with one of the good research
program facilities.
1.09 COMPETITORS
BMA wealth creators are the main financial service provider in India. It has many
competitors in the field. The main competitors are
Angel Broking Ltd
Share khan Ltd
Motilal Oswal Securities Ltd
ICICI Securities Ltd
Religare Ltd
1.10 SWOT ANALYSIS
SWOT analysis is a method of recognising the strength and weakness of the organisation and
to forecast the opportunity and threat of the organisation. It is an effective way to run the
company.
It also provides information about the resources and capability of the company. It also helps
in formulation of strategy and policy of the company.
Strength-It is the internal capacity of the company.
11
Weakness- It is internal disadvantage of the company.
Opportunity- Provides external positive information which helps the company.
Threat- provides external negative information to take preventive measures.
1.11 SWOT ANALYSIS OF BMA WEALTH CREATORS
STRENGHTS
It has its branches located in more than 3000 locations all over the country.
They have a good reliability.
They provide both online and offline services.
They have a good brand image compared to other organisation.
They have good research expertise.
They provide excellent services to their clients.
They provide IPO and mutual fund facilities to their customers.
WEAKNESSES
They do not go for much of promotional activities like advertisement.
They carry high level of risk.
Entry of clients/investors to the business is less.
OPPOTUNITIES
Market development and Growth will play a positive picture in the minds of the
clients to contribute.
Flourishing monetary market in nation and also around the world.
Still there are people who have money in their pockets but they are unaware about
how market works or what are the complications
Exploring the new market.
THREATS
High level of competition in the industry.
A change in technology also affects the business.
A change in the policies of the capital market.
Competitors charge a less rate of brokerage which decreases the clients from BMA
WC.
12
1.12 FUTURE GROWTH AND PROSPECTUS
Company has a decent research group with better system in diversifying and it is
having better systems administration, quality research and customized
administrations.
It is as of now having more branches in south India and wanted to open more in north
India with speed web offices.
Within the coming 5-6years organization expects to become a market pioneer in
financial administrations.
With an intention of Development and Growth, It has dispatch IPOs in the year 2011.
13
CHAPTER 2
CONCEPTUAL BACKGROUND AND LITERATURE REVIEW
2.1 THEORETICAL BACKGROUND OF THE FOREX MARKET
Until the mid-1970s, due to the steady administration of the rate, foreign trade was
considered as a system only to make exchange shipments. With the fall of the Breton Woods
agreement and the rise of significant monetary standards, the conduct of foreign exchange
policy for the national banks was an extraordinary challenge as currency fluctuations opened
up tremendous opportunities for traders to exchange cash volatility in the borderless market
The market in India has been preserved since exchange rate controls have limited the
development of capital, and banks have been urged to continue to cover and keep the market
square.
Gradually, a request was made to allow banks in India to exchange FOREX. Due to this
request, the RBI allowed banks to try to exchange FOREX during the day in 1978, as a first
step. As a result, the determination of adherence to a square or near border location was
agreed to foreclosure every day. The rate of the position that has been detected overnight
(free position) and the limitations that traders have exchanged on the day have been selected
by the bank's management.
As profit opportunities began to appear, the major banks began offering bidirectional prices
against rupees even in currencies (rupees), and the volume of trades gradually began to
increase. This made it possible to fundamentally change the exchange rate regime in 1975,
when the rupees were divided by pounds of sterling and under a controlled floating
arrangement; the external value of the rupee was determined by the RBI in relation to the
weighted basket of currencies of India's main trading partners. Given the RBI's obligation to
buy and sell unlimited pound sterling (intervention currency) stemming from the Bank's
business transactions, its buy / sell quotations have effectively become the support around the
market.
As volumes grew, it was found that the desire to profit led to the observance of very different
procedures (some of which were irregular), dictated mainly by the size of the players, their
14
location, the expertise of the traders and the availability of means of communication. a set of
instructions relating to a whole range of transactions to be followed by banks dealing with
FOREX trading. Therefore, in 1981, "instructions for internal control of foreign exchange"
were created for admission by banks.
During the 1980s, the macroeconomic situation deteriorated, which eventually justified a
structural change in the exchange rate regime, which had an impact on the FOREX market.
Large and persisting external imbalances have been reflected in an increasing level of internal
indebtedness. Higher depreciation of the rupee could not offset the deepening of the inflation
gap between India and the rest of the world, and the rupee exchange rate was still overvalued.
The Gulf Problems of August 1990, due to the fragile state of the economy, caused an
unprecedented crisis of liquidity and trust. This unprecedented crisis has called for
extraordinary remedial action. At the same time, the country has taken adjustment measures
to stabilize the economy and start structural reforms that would restore the impetus for stable
growth.
As the initial phase towards this route, the RBI suffered a two-stage downward revision of
rupees in July 1991. At the same time, given the ultimate goal of providing a closer
arrangement between prices and imports, the EXIM plot was presented. The plan provides a
lift that transmits and with the experience gained in the plan was thought to regulate part of
the motivational power and pass it with a value tool while protecting basic imports from
money differences. In this way, with effect from 1 March 1992, the RBI initiated a double-
rate trading agreement under the Liberalized Exchange Rate Scheme (LERMS). For this
purpose, 40% of business revenue must be surrendered at the rate set by the RBI and RBI is
obliged to offer external trade only for imports of basic goods such as oil, fertilizers, life-
saving drugs and others. than the duty of general administration. Adaptation of 60% could be
changed in market-driven prices. The plan worked with an acceptable market set-up for its
developing part, and Rupee remained really stable, with the range between authority and
market rate of around 17%.
Even through a double frame for the exchange of degrees it worked admirably, it is, as far as
possible, derives a certain assessment of exporters and settlements. In addition, it avoided a
thorough division of property. LERMS was essentially a transitional system and in March
1993 two legs of the trade rates joined and started modified LERMS. He stipulated that form
15
on March 2, 1993; All the FOREX receipt could be changed in the exchange rates decided.
During the following eighteen months, the limitations on several other current record
exchanges were casual and on August 20, 1994, the Rupee became fully convertible for all
current record records and the nation formally recognized the commitments under Article
VIII of the Article of Agreement of the IMF
2.2 LITERATURE REVIEW
Seifert(1992.), investigated GARCH outline for day-to-day statistics as of the US, the U K,
Germans and Japanese, exposed that complete alterations in stocks earnings have optimistic
impact on exchange rates instability.
Maaysami Koh(2000.), studied influences of the interests rates and conversations rates of
stocks revenues and displayed that those exchanges rates and interests rates stay as the
elements in stock values.
Iqbal and Haider (2005) analysed that risk aspects rise from variations in certain important
monetary and commercial variable namely interest rate, price rises, existent commercial
movement, and argument rate between additional variables.
Abhayy. Pethee and Ajitt Kaarnik (2000.)analysed that inter – relationship flanked by
stock values and significant macro-economic variants, vice interchange rates against INR vis-
a-vis USD, main advancing rates, narrow money supply, and index of industrial production.
Solniks (1987.) studied outlook it shows adverse connection among stock market & native
currencies. Specify that the 1st and 2nd-order effect of conversation rates change
significantly affect differentiated selections in the US shares market.
Takeshi(2008) studied uni-directional connection from stock revenues to FII movements,
unrelated of the example historical in India whereas the opposite interconnection works only
post 2003.
Stone(2009) examine that in 2005, the rand was maintained by high product values, foreign
straight investment movements, and optimistic economic data for SA in spite of the rising
current account shortage. After left over relatively stable, the conversation rate encountered
devaluate on weights in 2006.
16
Edwards, Biscarri and Gracia, (2003), Huang and Yang , (2000),Jayasuriya,
(2005)Investigated the variability also lean towards to growth nearby some actions: earning
declarations, integration, gossips showed, etc. The result of the liberalization on the
unpredictability of the market is also substantial.
Mishras (2004.) examine, present is No theoretic agreement On the interface flanked by
stocks rates& exchanges rates.
BenassyQuere, Fontagné, and LahrecheRevil, (2001.)investigated interchange rates was 1
of more significant essentials in background fiscal rules in the developing states. Indeed,
conversation rates procedures play a main part to invite direct external investment and to
swallow the spread stages. The left over part of the work is controlled as follow. In the 2nd
section, we give a theoretic background of the relationships among Forex rate and stocks
revenues. In this 3rd sector, we gave an explanation of these data’s and method utilised.
Martins & Zdzienickas(2009.) examined lesser conversation rates unpredictability related
high development, high shares of FDI, high current accounts shortages, and high additional
acclaim.
Adjasis & Biekpes(2005.) examined in the large-Run interchange rates reduction indicates to
growth of stocks market value within certain nations & in the small-Run, conversation rates
devaluation decrease stock market yields.
Schnabl, G. (2007). Studied, in attendance not any Co-Integration among conversation rates
and the Malaysia’s stocks marketplaces among lengthy route, duo sage connection study
discloses Uni-directional causation happens interchange rates to those stocks markets with
small course.
Ndri Konans Leon.(2008.) studied the interests rate, it vital influence explanation stock
markets profit moderately with instability.
Engles & Rangels (2005.) were examined relation among those unqualified instability & a
no. of macro-economic variants. They incorporated macro-economic info in a straight line
estimate of such Garch methods. Was established the predictions of macro-economic variants
may be frequently combined with unpredictability calculations on shares indices yields.
Rizwan and Khan (2007) examined clarified variable reputation of local macro-economic
variants used clarifying connection in the middle of stocks earnings & instability in Karachi’s
stocks conversations. A weakening in conversation rates ambiguity although improves worth
clearness increasing effectiveness of amount machineries at global Phase.
Allayanis and Ofeks(2001.), Allayanis, Browns and Klaper,(2001.). Investigated the threat
organization in overall it decrease improbability around the commercial outcomes of those
17
company. These detail spirit shrivel the instability of those stocks yields. Consuming
equivocation tools also diminish infection flanked by marketplaces. Though these processes
were expensive can reduce efficiencies of the business.
Ma & KaoS (1990.) studied money gratefulness depressingly disturbs the local stocks
markets for Export-leading state and definitely influences the internal stocks marketplaces,
Import-Dominant states, looks to be reliable properties market place concept.
Schwerts (1990.) analysed actions of stocks yield instability everywhere, stocks market
places cracks & expose stocks market instability obstacles intensely throughout smash &
revenues to little Pre-Crashes stages fast.
Domelys & Sheehys (1996.) examine that contemporary connection among imported
argument rates and the market places price huge local or domestic vendors in their learning.
Khoo,S (1994.) analysed excavating firms financial experience by means of conversion rates,
Interest Rates & prices of Oils ,exposed the understanding of stocks revenues relating
difference rates undertaking, quantity of stocks profits clarified through Forex rate measure
were little.
2.3 RESEARCH GAP
Most of the studies have used regression analysis tool to examine the foreign
currency fluctuation impact on Indian stock market. In this study we have used
the regression tool for both individual currency and the multiple currencies.
The individual currency is taken up to analyse with the various Nifty indices
and also all the 4 currencies are taken up with the individual Nifty index to
examine the impact.
18
CHAPTER 3
RESEARCH DESIGN
3.1 STATEMENT OF THE PROBLEM
“A study on impact of foreign currency fluctuation on Indian stock market with
reference to Nifty”
3.2 NEED FOR THE STUDY
The study is undertaken in order to find out or examine the impact of foreign currency
fluctuation on the Indian stock market and the various macro economic factors which
influence the exchange rate by using 4 major foreign currencies. The study also helps in
suggesting the investor that the foreign exchange fluctuation does not influence the stock
prices and the investment can be made without any hesitation.
3.3 OBJECTIVE OF THE STUDY
To examine the impact of foreign currency fluctuations on volatility of the Indian
stock market with reference to Nifty.
To give the suggestions to the investors
3.4 SCOPE OF THE STUDY
The target of the examination is to comprehend those elements which influence foreign
exchange rates and how the exchange rates affects price of shares of various listed
organizations. The problem study deals with the different kinds of currencies like Dollar of
US, Pound of Britain, Euro of Europe, Yen of Japan and Indian Rupee. It additionally
manages how Indian Rupee's value has devalued throughout the years against all other
currencies said before.
The exchange rate volatility has an imperative association with Indian securities exchange for
this reason we have taken NSE records we have mainly 10 indices 5 from Broad based and 5
from Sector based indices separately, in those lists we taken every day closing price in
19
connection to this we taken Four major Foreign currency exchange rates USD, GBP, EURO
and JYEN day by day price against INR. Both Stock Indices and Exchange rates information
are gathered for a long time period to understand the macroeconomic variables.
3.5 RESEARCH METHODOLOGY
Data source: - The data is collected from the secondary source. The daily closing price of
NIFTY indices is collected form NSE official website (www.nseindia.com) and varying
currency values against Indian rupee is fetched from RBI official website (www.rbi.org.in)
Sample size: - The data is fetched for the period of 5years from 1/04/2012 to 30/03/2017.
Analytical research: - In Analytical Research, the researcher need to use actualities or data
effectively accessible, and examine them to make a assessment of the collected information.
It includes the inside and out examination and assessment of accessible data trying to clarify
complex marvel. In other words it uses the available information to evaluate the critical
problems and under goes in depth study.
Tools and Techniques used:-
Regression analysis
Return of indices
HYPOTHESIS
The following hypothesis is used to find the relationship between the foreign currency
fluctuation and stock price.
H0: There is a no significant relationship between NIFTY and currency fluctuations.
H1: US Dollar has a significant relationship on NIFTY
H2: Euro has a significant relationship on NIFTY
H3: Japanese YEN has a significant relationship on NIFTY.
H4: Pound Sterling has a significant relationship on NIFTY
20
LIMITATIONS
Only few currency exchange rates were taken into consideration against Indian rupee.
There are other currencies which can affect the stock price of the Indian stock market.
Only 5 NSE indices were considered for the analysis and computation.
The data is collected for only 5years for the analysis.
The authenticity of the data while doing the calculations can be a limitation.
The statistical tool regression analysis is only used for the examination/finding
conclusion to the study.
The company has the limitation to disclose their financial details , so a detailed
analysis of financial performance of the company is not possible
21
CHAPTER- 4
DATA ANALYSIS AND INTERPRETATION
4.1 REGRESSION ANALYSIS OF NIFTY 50
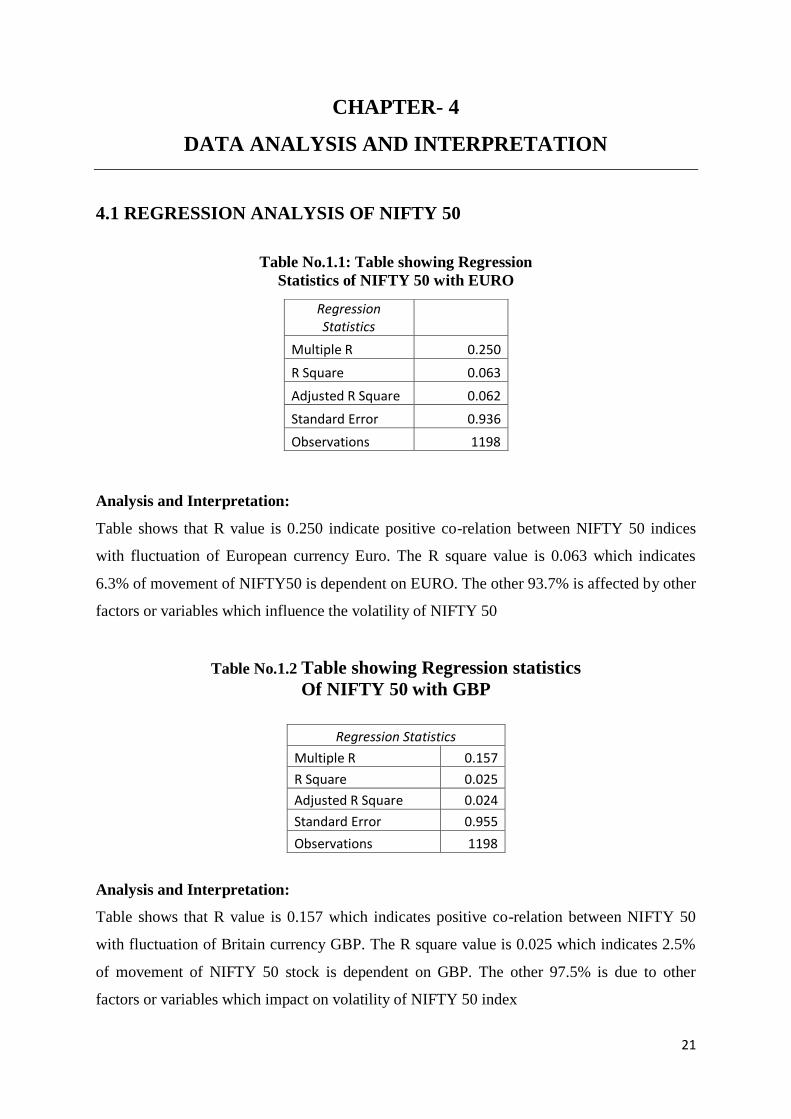
Table No.1.1: Table showing Regression
Statistics of NIFTY 50 with EURO
Analysis and Interpretation:
Table shows that R value is 0.250 indicate positive co-relation between NIFTY 50 indices
with fluctuation of European currency Euro. The R square value is 0.063 which indicates
6.3% of movement of NIFTY50 is dependent on EURO. The other 93.7% is affected by other
factors or variables which influence the volatility of NIFTY 50
Table No.1.2 Table showing Regression statistics
Of NIFTY 50 with GBP
Analysis and Interpretation:
Table shows that R value is 0.157 which indicates positive co-relation between NIFTY 50
with fluctuation of Britain currency GBP. The R square value is 0.025 which indicates 2.5%
of movement of NIFTY 50 stock is dependent on GBP. The other 97.5% is due to other
factors or variables which impact on volatility of NIFTY 50 index
Regression Statistics
Multiple R 0.250
R Square 0.063
Adjusted R Square 0.062
Standard Error 0.936
Observations 1198
Regression Statistics
Multiple R 0.157
R Square 0.025
Adjusted R Square 0.024
Standard Error 0.955
Observations 1198
22
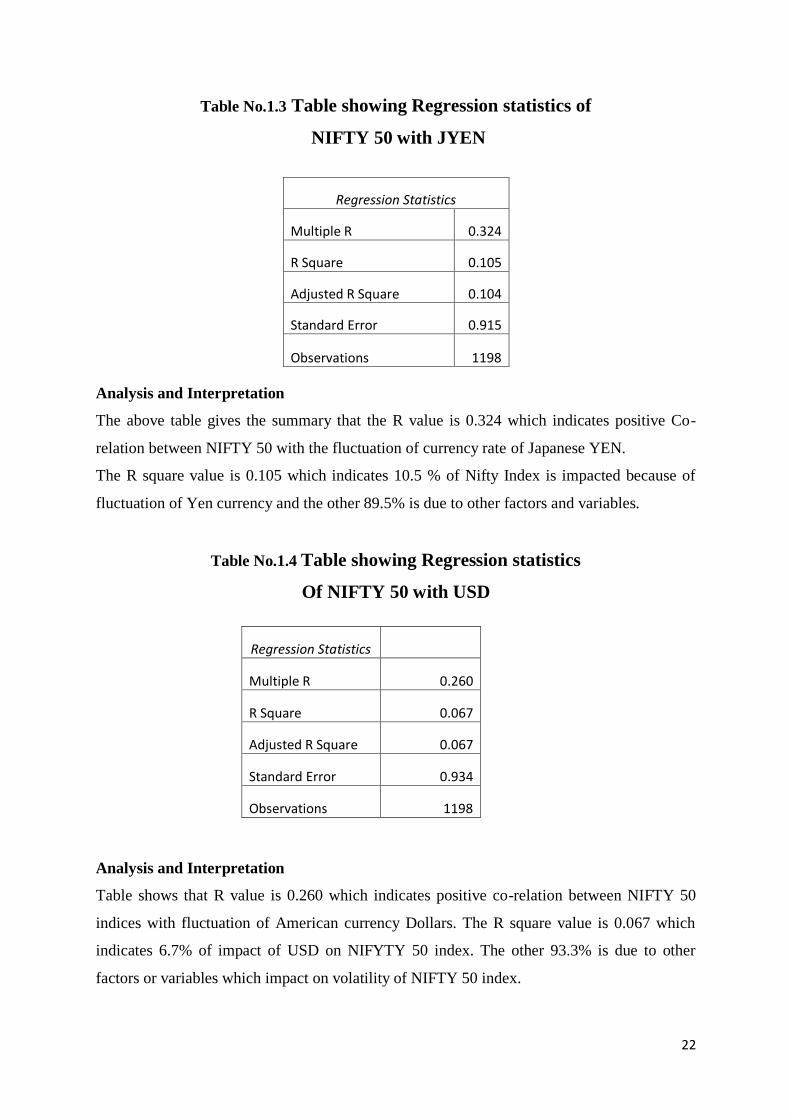
Table No.1.3 Table showing Regression statistics of
NIFTY 50 with JYEN
Analysis and Interpretation
The above table gives the summary that the R value is 0.324 which indicates positive Co-
relation between NIFTY 50 with the fluctuation of currency rate of Japanese YEN.
The R square value is 0.105 which indicates 10.5 % of Nifty Index is impacted because of
fluctuation of Yen currency and the other 89.5% is due to other factors and variables.
Table No.1.4 Table showing Regression statistics
Of NIFTY 50 with USD
Analysis and Interpretation
Table shows that R value is 0.260 which indicates positive co-relation between NIFTY 50
indices with fluctuation of American currency Dollars. The R square value is 0.067 which
indicates 6.7% of impact of USD on NIFYTY 50 index. The other 93.3% is due to other
factors or variables which impact on volatility of NIFTY 50 index.
Regression Statistics
Multiple R 0.324
R Square 0.105
Adjusted R Square 0.104
Standard Error 0.915
Observations 1198
Regression Statistics
Multiple R 0.260
R Square 0.067
Adjusted R Square 0.067
Standard Error 0.934
Observations 1198
23
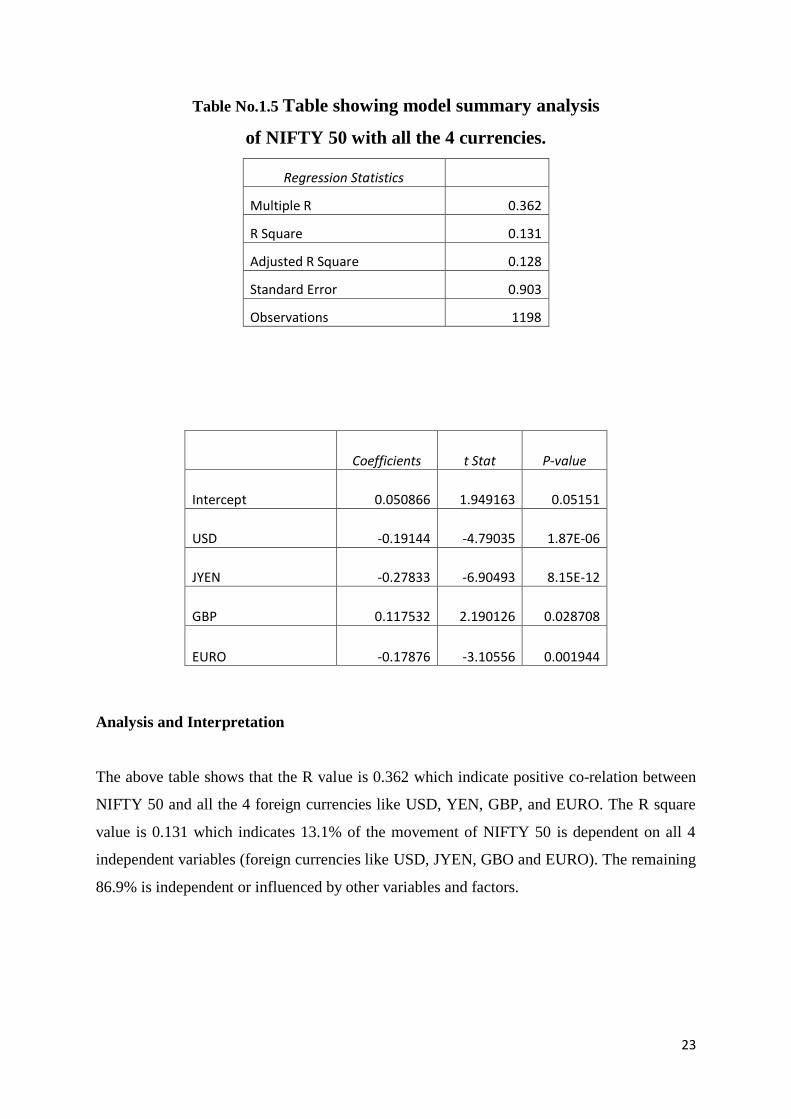
Table No.1.5 Table showing model summary analysis
of NIFTY 50 with all the 4 currencies.
Regression Statistics
Multiple R 0.362
R Square 0.131
Adjusted R Square 0.128
Standard Error 0.903
Observations 1198
Analysis and Interpretation
The above table shows that the R value is 0.362 which indicate positive co-relation between
NIFTY 50 and all the 4 foreign currencies like USD, YEN, GBP, and EURO. The R square
value is 0.131 which indicates 13.1% of the movement of NIFTY 50 is dependent on all 4
independent variables (foreign currencies like USD, JYEN, GBO and EURO). The remaining
86.9% is independent or influenced by other variables and factors.
Coefficients t Stat P-value
Intercept 0.050866 1.949163 0.05151
USD -0.19144 -4.79035 1.87E-06
JYEN -0.27833 -6.90493 8.15E-12
GBP 0.117532 2.190126 0.028708
EURO -0.17876 -3.10556 0.001944
24
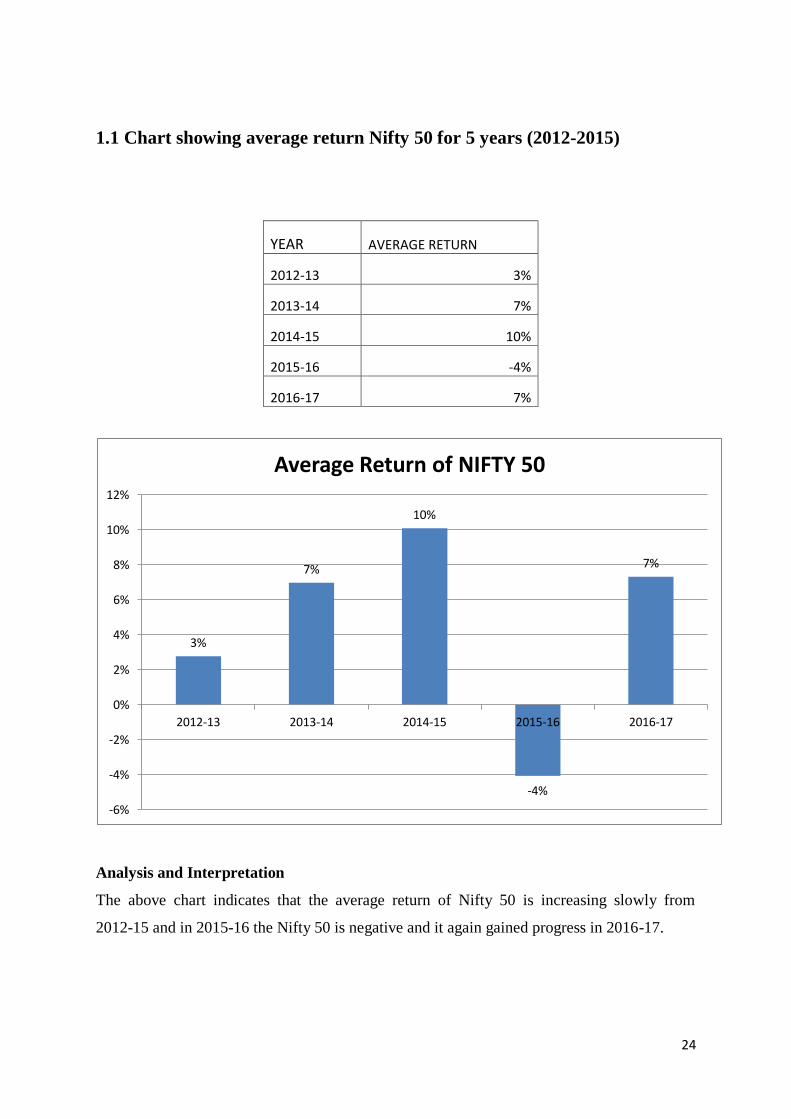
1.1 Chart showing average return Nifty 50 for 5 years (2012-2015)
YEAR AVERAGE RETURN
2012-13 3%
2013-14 7%
2014-15 10%
2015-16 -4%
2016-17 7%
Analysis and Interpretation
The above chart indicates that the average return of Nifty 50 is increasing slowly from
2012-15 and in 2015-16 the Nifty 50 is negative and it again gained progress in 2016-17.
3%
7%
10%
-4%
7%
-6%
-4%
-2%
0%
2%
4%
6%
8%
10%
12%
2012-13 2013-14 2014-15 2015-16 2016-17
Average Return of NIFTY 50
25
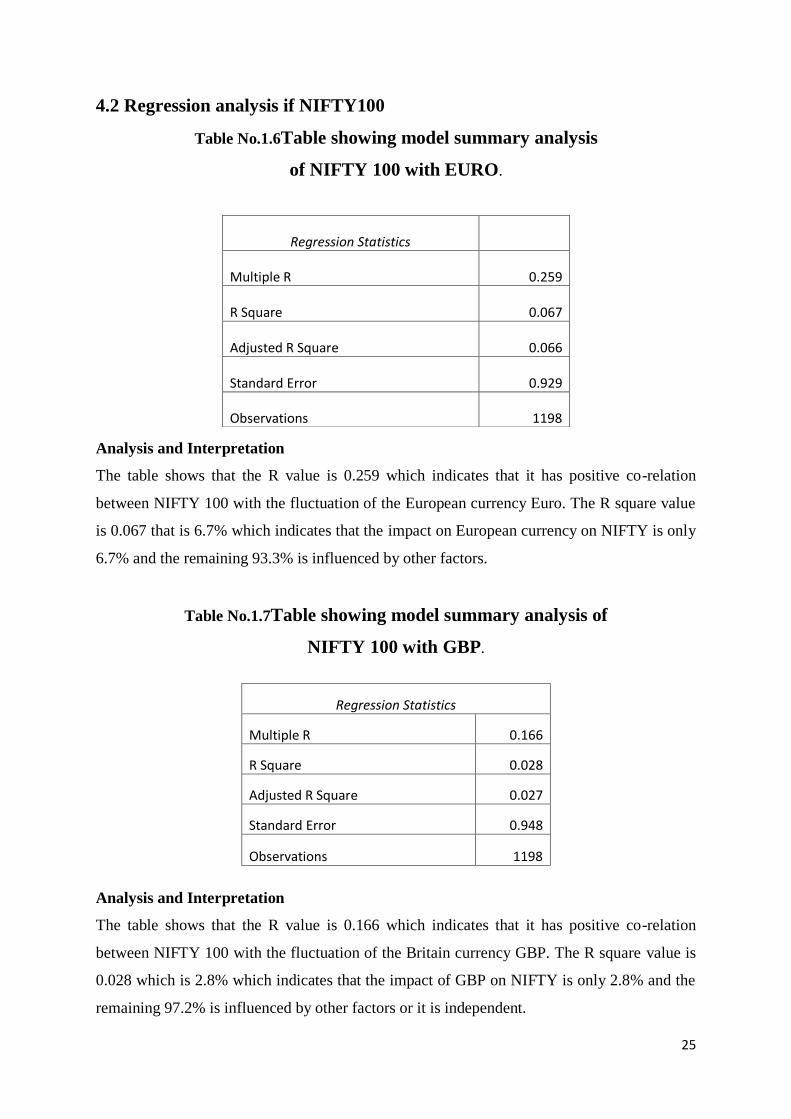
4.2 Regression analysis if NIFTY100
Table No.1.6Table showing model summary analysis
of NIFTY 100 with EURO.
Analysis and Interpretation
The table shows that the R value is 0.259 which indicates that it has positive co-relation
between NIFTY 100 with the fluctuation of the European currency Euro. The R square value
is 0.067 that is 6.7% which indicates that the impact on European currency on NIFTY is only
6.7% and the remaining 93.3% is influenced by other factors.
Table No.1.7Table showing model summary analysis of
NIFTY 100 with GBP.
Analysis and Interpretation
The table shows that the R value is 0.166 which indicates that it has positive co-relation
between NIFTY 100 with the fluctuation of the Britain currency GBP. The R square value is
0.028 which is 2.8% which indicates that the impact of GBP on NIFTY is only 2.8% and the
remaining 97.2% is influenced by other factors or it is independent.
Regression Statistics
Multiple R 0.259
R Square 0.067
Adjusted R Square 0.066
Standard Error 0.929
Observations 1198
Regression Statistics
Multiple R 0.166
R Square 0.028
Adjusted R Square 0.027
Standard Error 0.948
Observations 1198
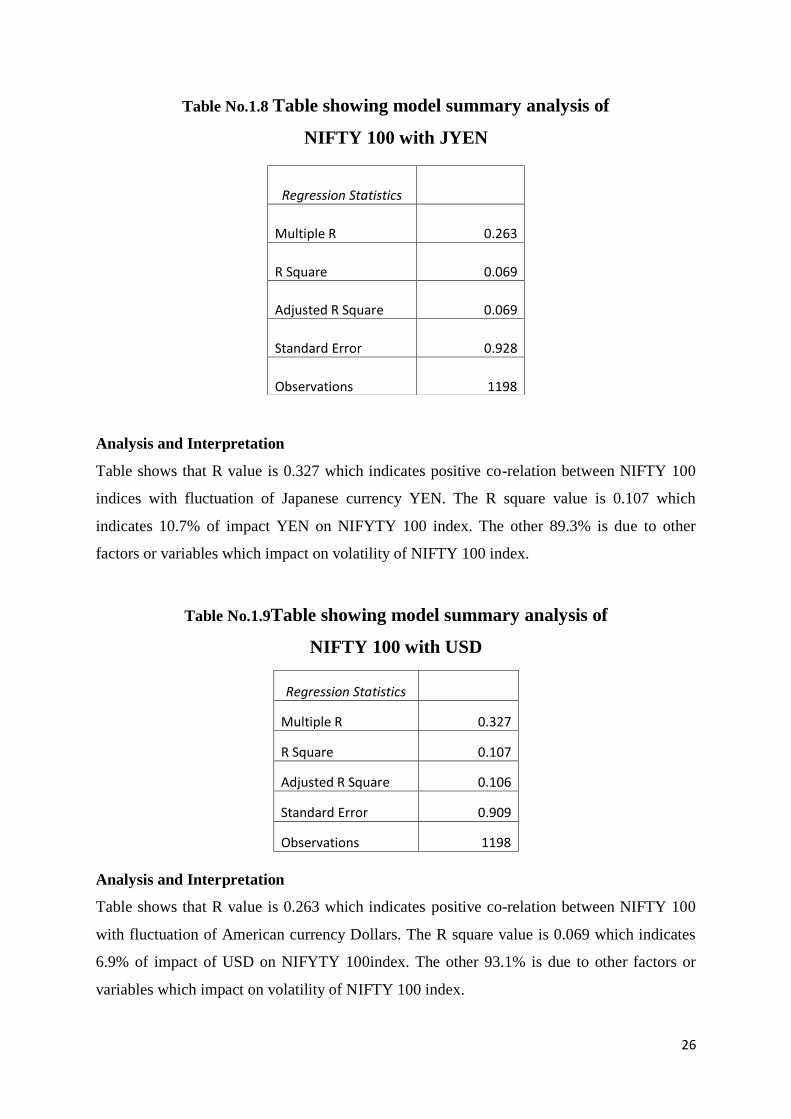
26
Table No.1.8 Table showing model summary analysis of
NIFTY 100 with JYEN
Analysis and Interpretation
Table shows that R value is 0.327 which indicates positive co-relation between NIFTY 100
indices with fluctuation of Japanese currency YEN. The R square value is 0.107 which
indicates 10.7% of impact YEN on NIFYTY 100 index. The other 89.3% is due to other
factors or variables which impact on volatility of NIFTY 100 index.
Table No.1.9Table showing model summary analysis of
NIFTY 100 with USD
Analysis and Interpretation
Table shows that R value is 0.263 which indicates positive co-relation between NIFTY 100
with fluctuation of American currency Dollars. The R square value is 0.069 which indicates
6.9% of impact of USD on NIFYTY 100index. The other 93.1% is due to other factors or
variables which impact on volatility of NIFTY 100 index.
Regression Statistics
Multiple R 0.263
R Square 0.069
Adjusted R Square 0.069
Standard Error 0.928
Observations 1198
Regression Statistics
Multiple R 0.327
R Square 0.107
Adjusted R Square 0.106
Standard Error 0.909
Observations 1198
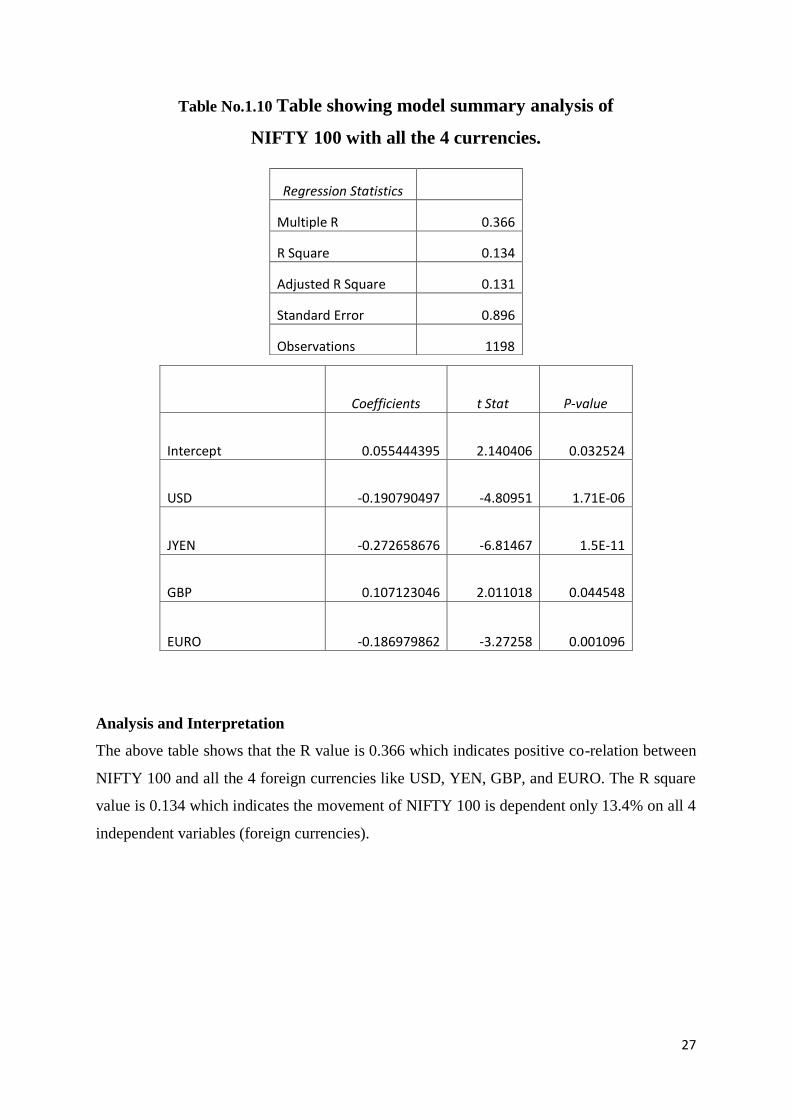
27
Table No.1.10 Table showing model summary analysis of
NIFTY 100 with all the 4 currencies.
Analysis and Interpretation
The above table shows that the R value is 0.366 which indicates positive co-relation between
NIFTY 100 and all the 4 foreign currencies like USD, YEN, GBP, and EURO. The R square
value is 0.134 which indicates the movement of NIFTY 100 is dependent only 13.4% on all 4
independent variables (foreign currencies).
Regression Statistics
Multiple R 0.366
R Square 0.134
Adjusted R Square 0.131
Standard Error 0.896
Observations 1198
Coefficients t Stat P-value
Intercept 0.055444395 2.140406 0.032524
USD -0.190790497 -4.80951 1.71E-06
JYEN -0.272658676 -6.81467 1.5E-11
GBP 0.107123046 2.011018 0.044548
EURO -0.186979862 -3.27258 0.001096
28
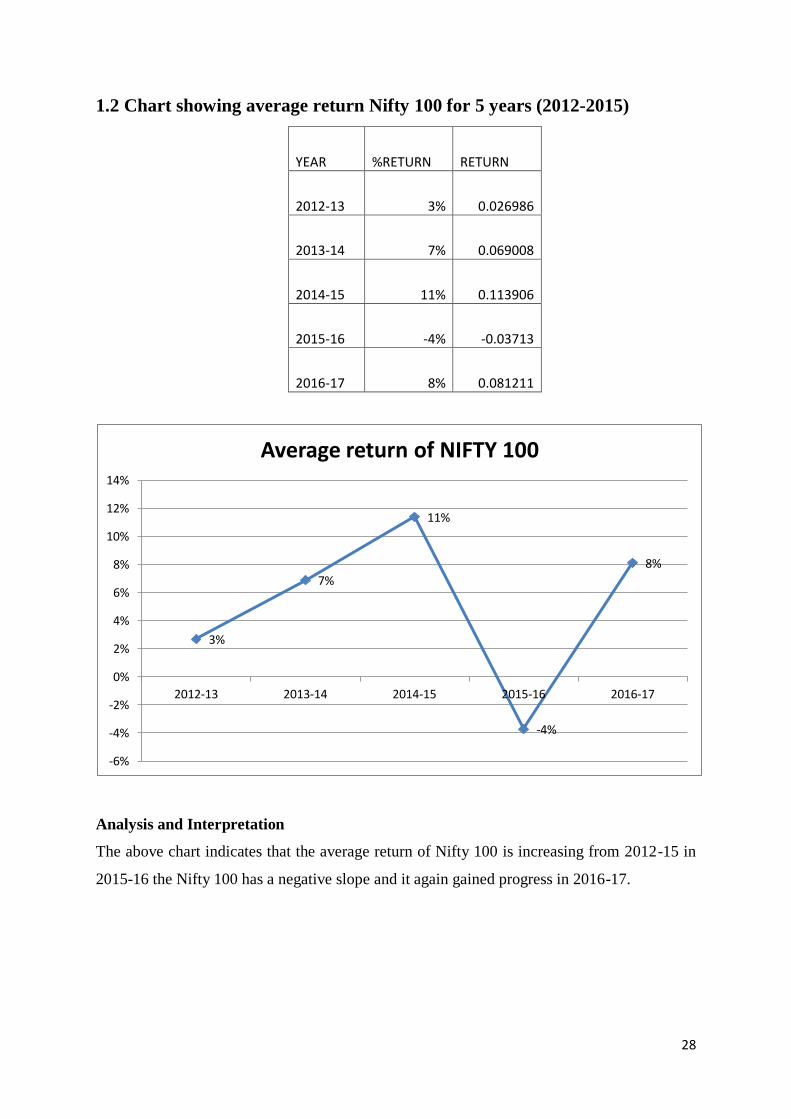
1.2 Chart showing average return Nifty 100 for 5 years (2012-2015)
YEAR %RETURN RETURN
2012-13 3% 0.026986
2013-14 7% 0.069008
2014-15 11% 0.113906
2015-16 -4% -0.03713
2016-17 8% 0.081211
Analysis and Interpretation
The above chart indicates that the average return of Nifty 100 is increasing from 2012-15 in
2015-16 the Nifty 100 has a negative slope and it again gained progress in 2016-17.
3%
7%
11%
-4%
8%
-6%
-4%
-2%
0%
2%
4%
6%
8%
10%
12%
14%
2012-13 2013-14 2014-15 2015-16 2016-17
Average return of NIFTY 100
29
4.3 Regression analysis of NIFTY 200
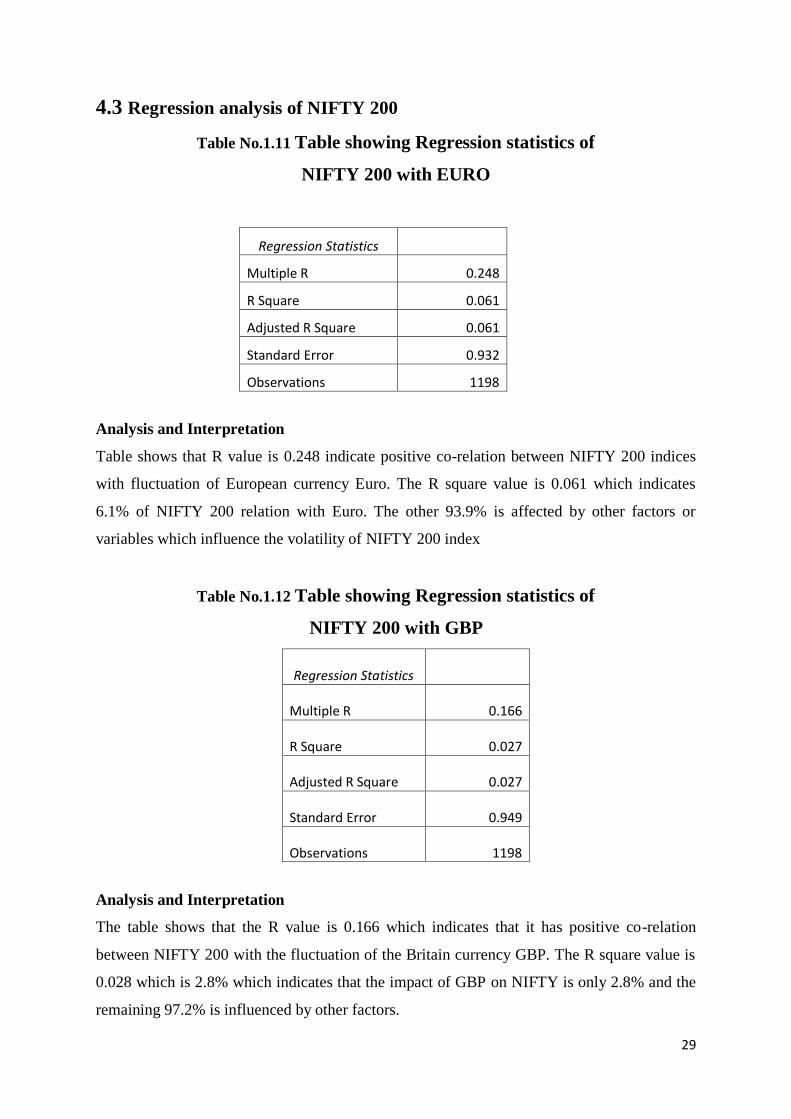
Table No.1.11 Table showing Regression statistics of
NIFTY 200 with EURO
Regression Statistics
Multiple R 0.248
R Square 0.061
Adjusted R Square 0.061
Standard Error 0.932
Observations 1198
Analysis and Interpretation
Table shows that R value is 0.248 indicate positive co-relation between NIFTY 200 indices
with fluctuation of European currency Euro. The R square value is 0.061 which indicates
6.1% of NIFTY 200 relation with Euro. The other 93.9% is affected by other factors or
variables which influence the volatility of NIFTY 200 index
Table No.1.12 Table showing Regression statistics of
NIFTY 200 with GBP
Regression Statistics
Multiple R 0.166
R Square 0.027
Adjusted R Square 0.027
Standard Error 0.949
Observations 1198
Analysis and Interpretation
The table shows that the R value is 0.166 which indicates that it has positive co-relation
between NIFTY 200 with the fluctuation of the Britain currency GBP. The R square value is
0.028 which is 2.8% which indicates that the impact of GBP on NIFTY is only 2.8% and the
remaining 97.2% is influenced by other factors.
30
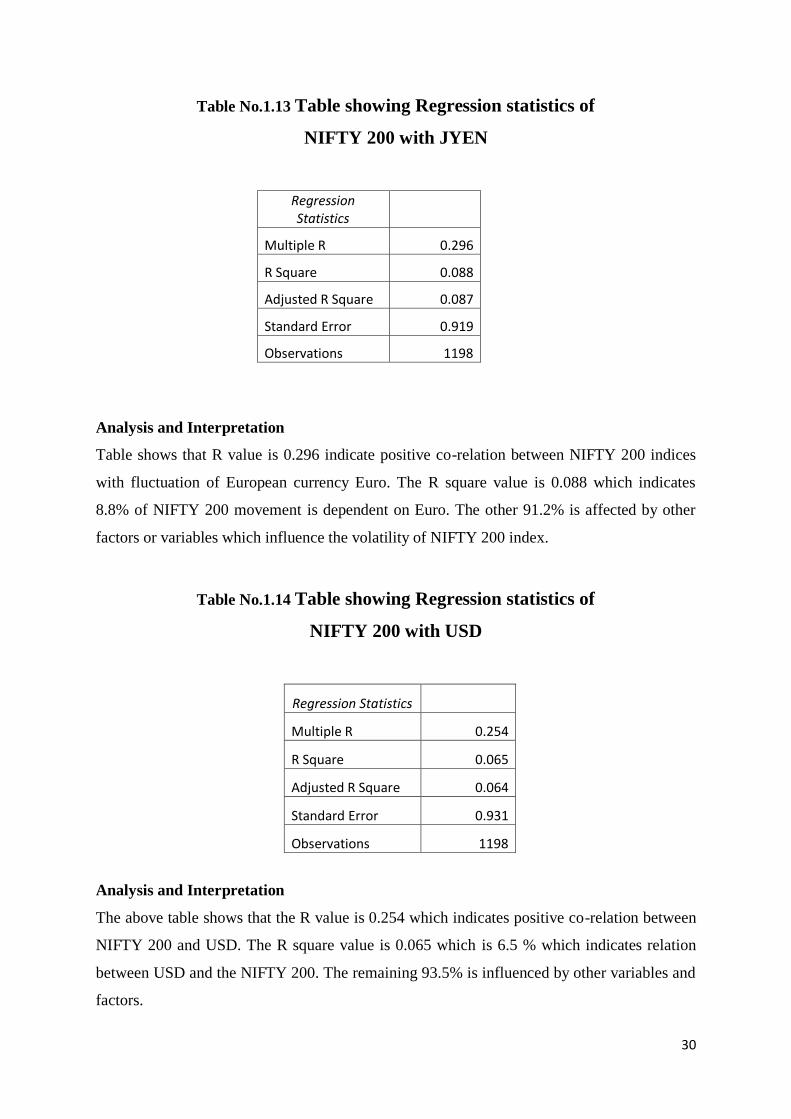
Table No.1.13 Table showing Regression statistics of
NIFTY 200 with JYEN
Regression Statistics
Multiple R 0.296
R Square 0.088
Adjusted R Square 0.087
Standard Error 0.919
Observations 1198
Analysis and Interpretation
Table shows that R value is 0.296 indicate positive co-relation between NIFTY 200 indices
with fluctuation of European currency Euro. The R square value is 0.088 which indicates
8.8% of NIFTY 200 movement is dependent on Euro. The other 91.2% is affected by other
factors or variables which influence the volatility of NIFTY 200 index.
Table No.1.14 Table showing Regression statistics of
NIFTY 200 with USD
Regression Statistics
Multiple R 0.254
R Square 0.065
Adjusted R Square 0.064
Standard Error 0.931
Observations 1198
Analysis and Interpretation
The above table shows that the R value is 0.254 which indicates positive co-relation between
NIFTY 200 and USD. The R square value is 0.065 which is 6.5 % which indicates relation
between USD and the NIFTY 200. The remaining 93.5% is influenced by other variables and
factors.
31
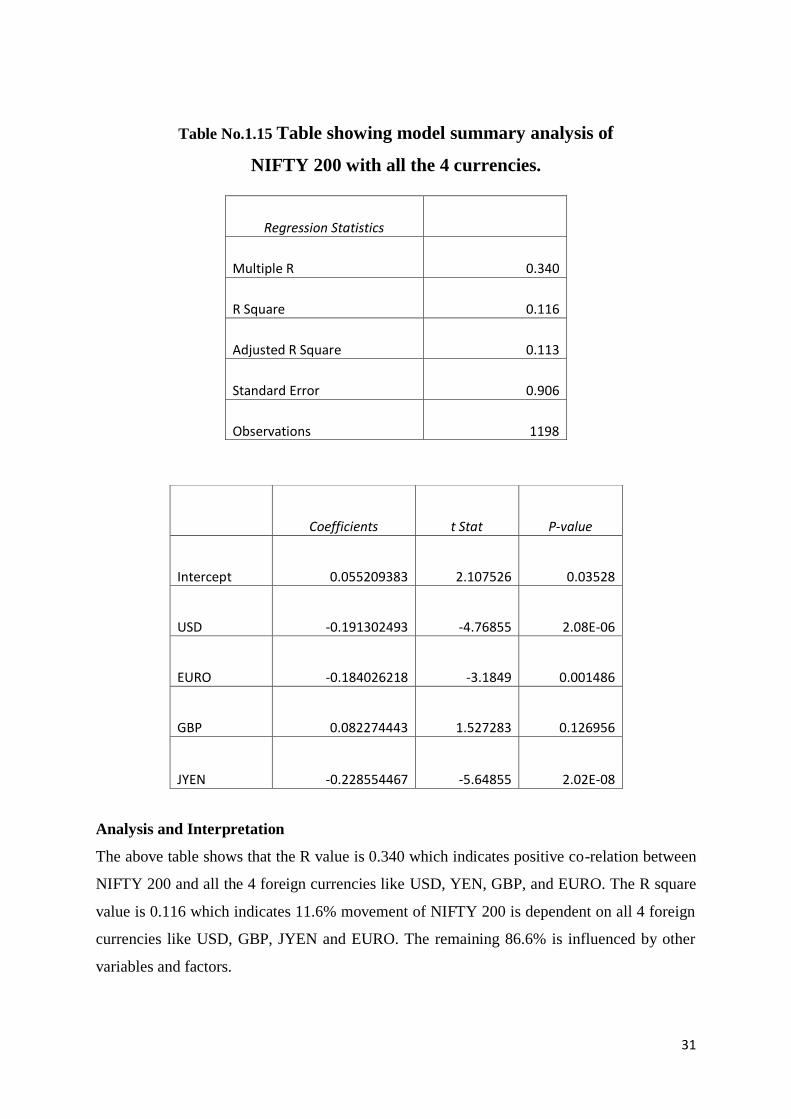
Table No.1.15 Table showing model summary analysis of
NIFTY 200 with all the 4 currencies.
Analysis and Interpretation
The above table shows that the R value is 0.340 which indicates positive co-relation between
NIFTY 200 and all the 4 foreign currencies like USD, YEN, GBP, and EURO. The R square
value is 0.116 which indicates 11.6% movement of NIFTY 200 is dependent on all 4 foreign
currencies like USD, GBP, JYEN and EURO. The remaining 86.6% is influenced by other
variables and factors.
Regression Statistics
Multiple R 0.340
R Square 0.116
Adjusted R Square 0.113
Standard Error 0.906
Observations 1198
Coefficients t Stat P-value
Intercept 0.055209383 2.107526 0.03528
USD -0.191302493 -4.76855 2.08E-06
EURO -0.184026218 -3.1849 0.001486
GBP 0.082274443 1.527283 0.126956
JYEN -0.228554467 -5.64855 2.02E-08
32
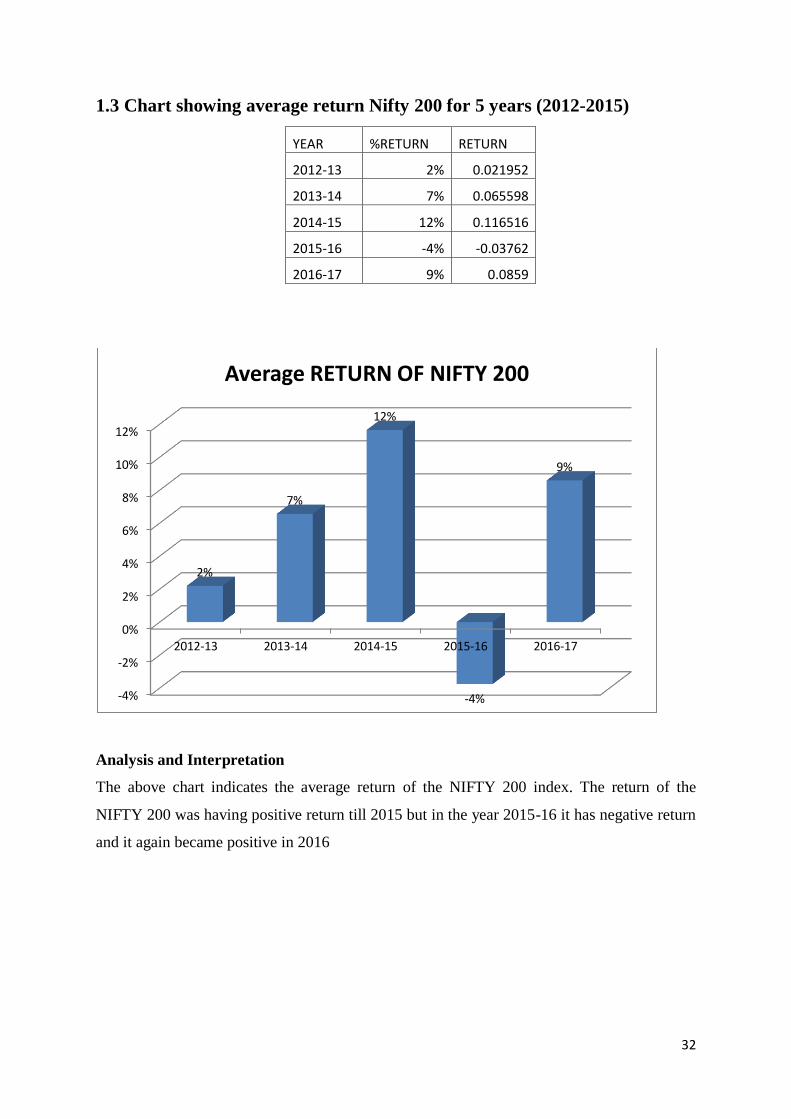
1.3 Chart showing average return Nifty 200 for 5 years (2012-2015)
YEAR %RETURN RETURN
2012-13 2% 0.021952
2013-14 7% 0.065598
2014-15 12% 0.116516
2015-16 -4% -0.03762
2016-17 9% 0.0859
Analysis and Interpretation
The above chart indicates the average return of the NIFTY 200 index. The return of the
NIFTY 200 was having positive return till 2015 but in the year 2015-16 it has negative return
and it again became positive in 2016
-4%
-2%
0%
2%
4%
6%
8%
10%
12%
2012-13 2013-14 2014-15 2015-16 2016-17
2%
7%
12%
-4%
9%
Average RETURN OF NIFTY 200
33
4.4 Regression analysis of NIFTY 500
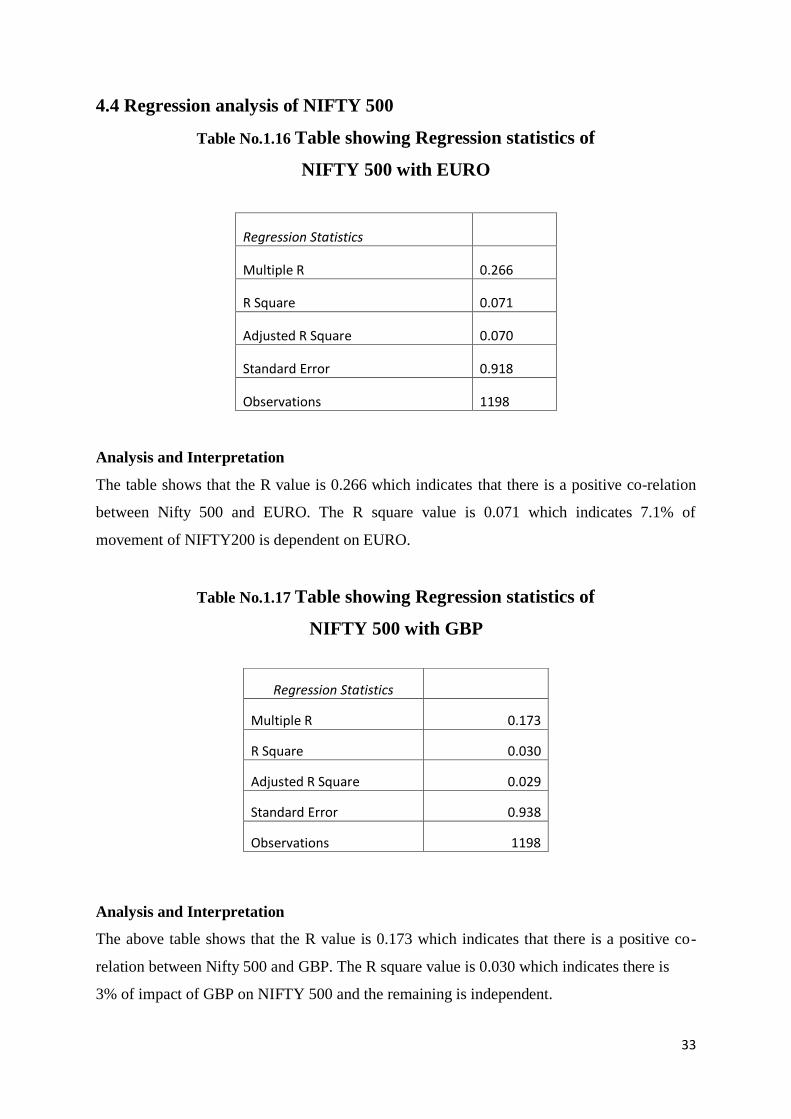
Table No.1.16 Table showing Regression statistics of
NIFTY 500 with EURO
Analysis and Interpretation
The table shows that the R value is 0.266 which indicates that there is a positive co-relation
between Nifty 500 and EURO. The R square value is 0.071 which indicates 7.1% of
movement of NIFTY200 is dependent on EURO.
Table No.1.17 Table showing Regression statistics of
NIFTY 500 with GBP
Analysis and Interpretation
The above table shows that the R value is 0.173 which indicates that there is a positive co-
relation between Nifty 500 and GBP. The R square value is 0.030 which indicates there is
3% of impact of GBP on NIFTY 500 and the remaining is independent.
Regression Statistics
Multiple R 0.266
R Square 0.071
Adjusted R Square 0.070
Standard Error 0.918
Observations 1198
Regression Statistics
Multiple R 0.173
R Square 0.030
Adjusted R Square 0.029
Standard Error 0.938
Observations 1198
34
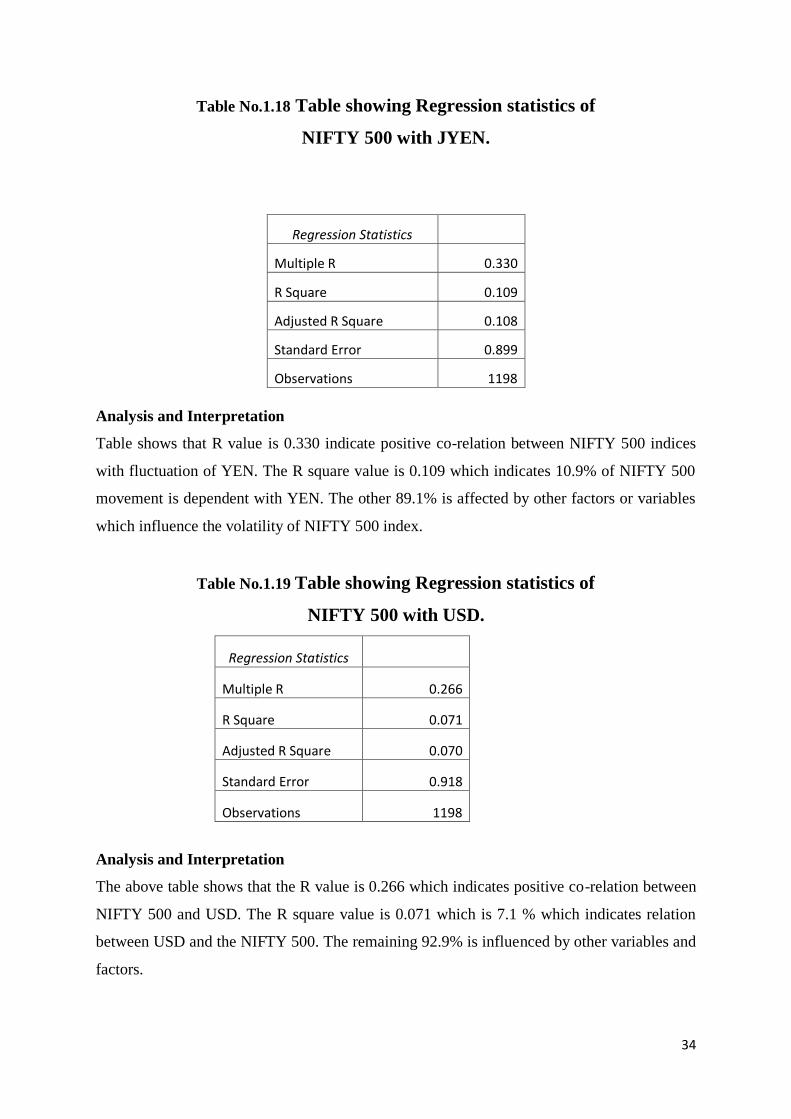
Table No.1.18 Table showing Regression statistics of
NIFTY 500 with JYEN.
Analysis and Interpretation
Table shows that R value is 0.330 indicate positive co-relation between NIFTY 500 indices
with fluctuation of YEN. The R square value is 0.109 which indicates 10.9% of NIFTY 500
movement is dependent with YEN. The other 89.1% is affected by other factors or variables
which influence the volatility of NIFTY 500 index.
Table No.1.19 Table showing Regression statistics of
NIFTY 500 with USD.
Regression Statistics
Multiple R 0.266
R Square 0.071
Adjusted R Square 0.070
Standard Error 0.918
Observations 1198
Analysis and Interpretation
The above table shows that the R value is 0.266 which indicates positive co-relation between
NIFTY 500 and USD. The R square value is 0.071 which is 7.1 % which indicates relation
between USD and the NIFTY 500. The remaining 92.9% is influenced by other variables and
factors.
Regression Statistics
Multiple R 0.330
R Square 0.109
Adjusted R Square 0.108
Standard Error 0.899
Observations 1198
35
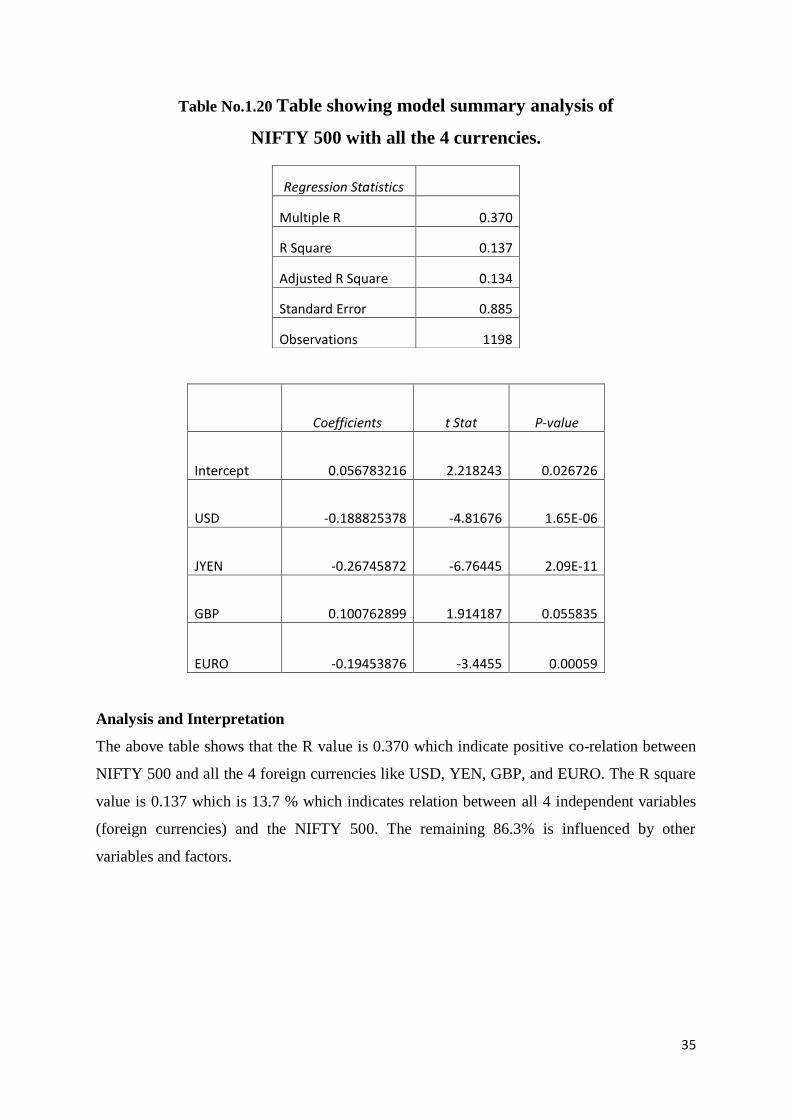
Table No.1.20 Table showing model summary analysis of
NIFTY 500 with all the 4 currencies.
Analysis and Interpretation
The above table shows that the R value is 0.370 which indicate positive co-relation between
NIFTY 500 and all the 4 foreign currencies like USD, YEN, GBP, and EURO. The R square
value is 0.137 which is 13.7 % which indicates relation between all 4 independent variables
(foreign currencies) and the NIFTY 500. The remaining 86.3% is influenced by other
variables and factors.
Regression Statistics
Multiple R 0.370
R Square 0.137
Adjusted R Square 0.134
Standard Error 0.885
Observations 1198
Coefficients t Stat P-value
Intercept 0.056783216 2.218243 0.026726
USD -0.188825378 -4.81676 1.65E-06
JYEN -0.26745872 -6.76445 2.09E-11
GBP 0.100762899 1.914187 0.055835
EURO -0.19453876 -3.4455 0.00059
36
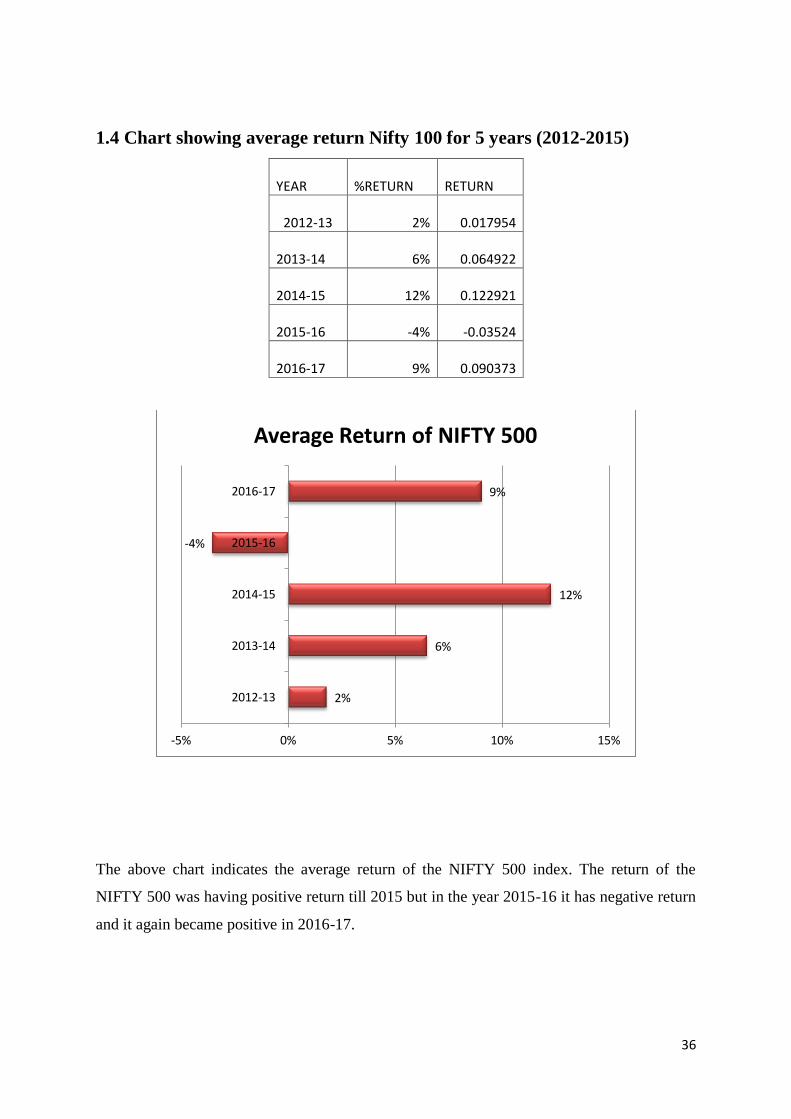
1.4 Chart showing average return Nifty 100 for 5 years (2012-2015)
YEAR %RETURN RETURN
2012-13 2% 0.017954
2013-14 6% 0.064922
2014-15 12% 0.122921
2015-16 -4% -0.03524
2016-17 9% 0.090373
The above chart indicates the average return of the NIFTY 500 index. The return of the
NIFTY 500 was having positive return till 2015 but in the year 2015-16 it has negative return
and it again became positive in 2016-17.
2%
6%
12%
-4%
9%
-5% 0% 5% 10% 15%
2012-13
2013-14
2014-15
2015-16
2016-17
Average Return of NIFTY 500
37
4.5 Regression analysis of NIFTY NEXT 50
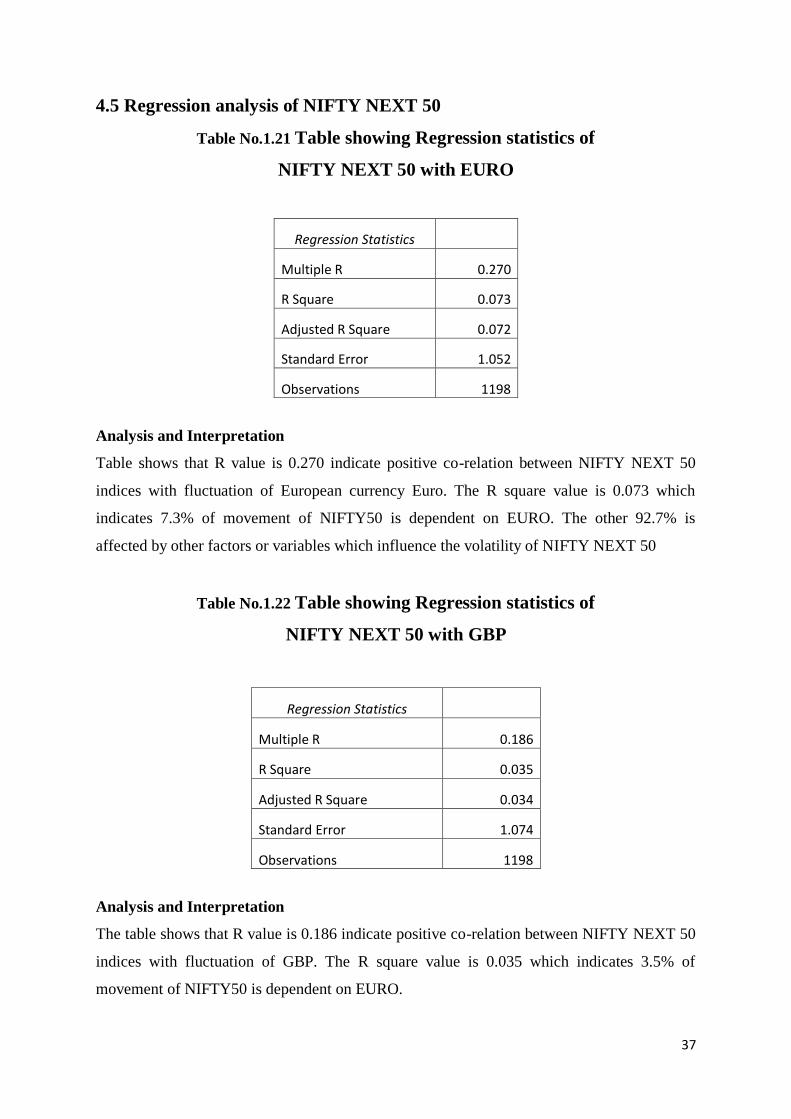
Table No.1.21 Table showing Regression statistics of
NIFTY NEXT 50 with EURO
Regression Statistics
Multiple R 0.270
R Square 0.073
Adjusted R Square 0.072
Standard Error 1.052
Observations 1198
Analysis and Interpretation
Table shows that R value is 0.270 indicate positive co-relation between NIFTY NEXT 50
indices with fluctuation of European currency Euro. The R square value is 0.073 which
indicates 7.3% of movement of NIFTY50 is dependent on EURO. The other 92.7% is
affected by other factors or variables which influence the volatility of NIFTY NEXT 50
Table No.1.22 Table showing Regression statistics of
NIFTY NEXT 50 with GBP
Regression Statistics
Multiple R 0.186
R Square 0.035
Adjusted R Square 0.034
Standard Error 1.074
Observations 1198
Analysis and Interpretation
The table shows that R value is 0.186 indicate positive co-relation between NIFTY NEXT 50
indices with fluctuation of GBP. The R square value is 0.035 which indicates 3.5% of
movement of NIFTY50 is dependent on EURO.
38
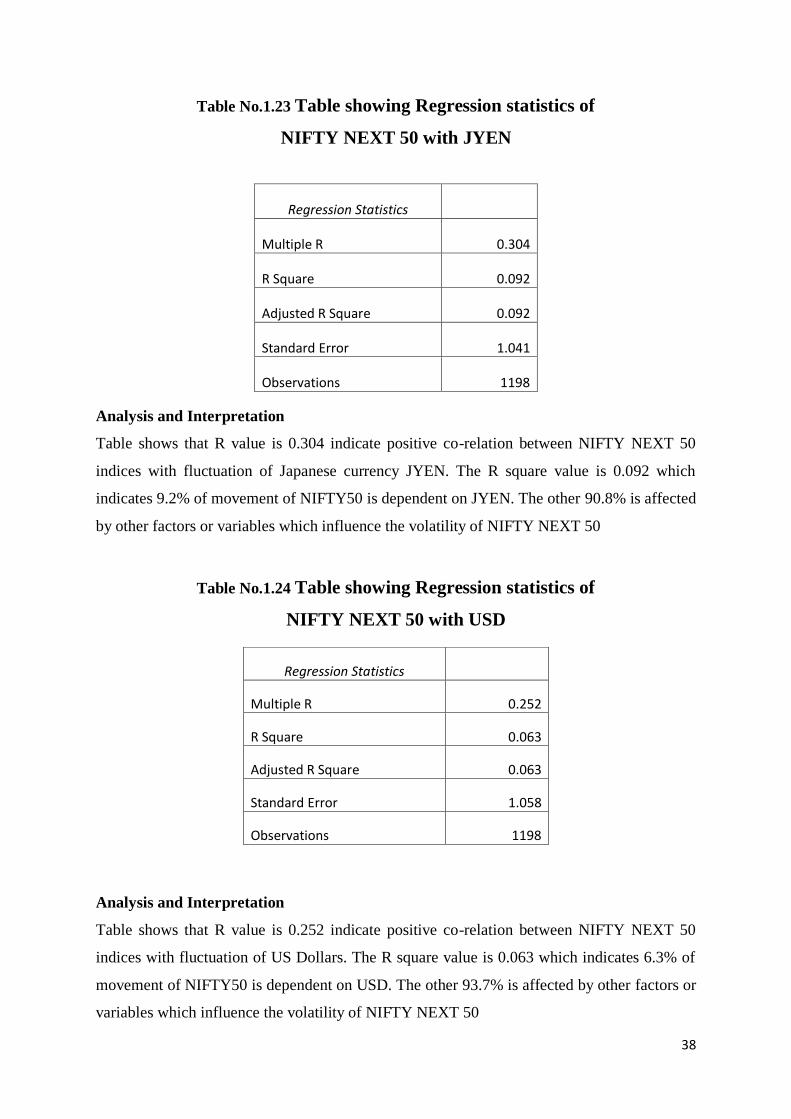
Table No.1.23 Table showing Regression statistics of
NIFTY NEXT 50 with JYEN
Analysis and Interpretation
Table shows that R value is 0.304 indicate positive co-relation between NIFTY NEXT 50
indices with fluctuation of Japanese currency JYEN. The R square value is 0.092 which
indicates 9.2% of movement of NIFTY50 is dependent on JYEN. The other 90.8% is affected
by other factors or variables which influence the volatility of NIFTY NEXT 50
Table No.1.24 Table showing Regression statistics of
NIFTY NEXT 50 with USD
Analysis and Interpretation
Table shows that R value is 0.252 indicate positive co-relation between NIFTY NEXT 50
indices with fluctuation of US Dollars. The R square value is 0.063 which indicates 6.3% of
movement of NIFTY50 is dependent on USD. The other 93.7% is affected by other factors or
variables which influence the volatility of NIFTY NEXT 50
Regression Statistics
Multiple R 0.304
R Square 0.092
Adjusted R Square 0.092
Standard Error 1.041
Observations 1198
Regression Statistics
Multiple R 0.252
R Square 0.063
Adjusted R Square 0.063
Standard Error 1.058
Observations 1198
39
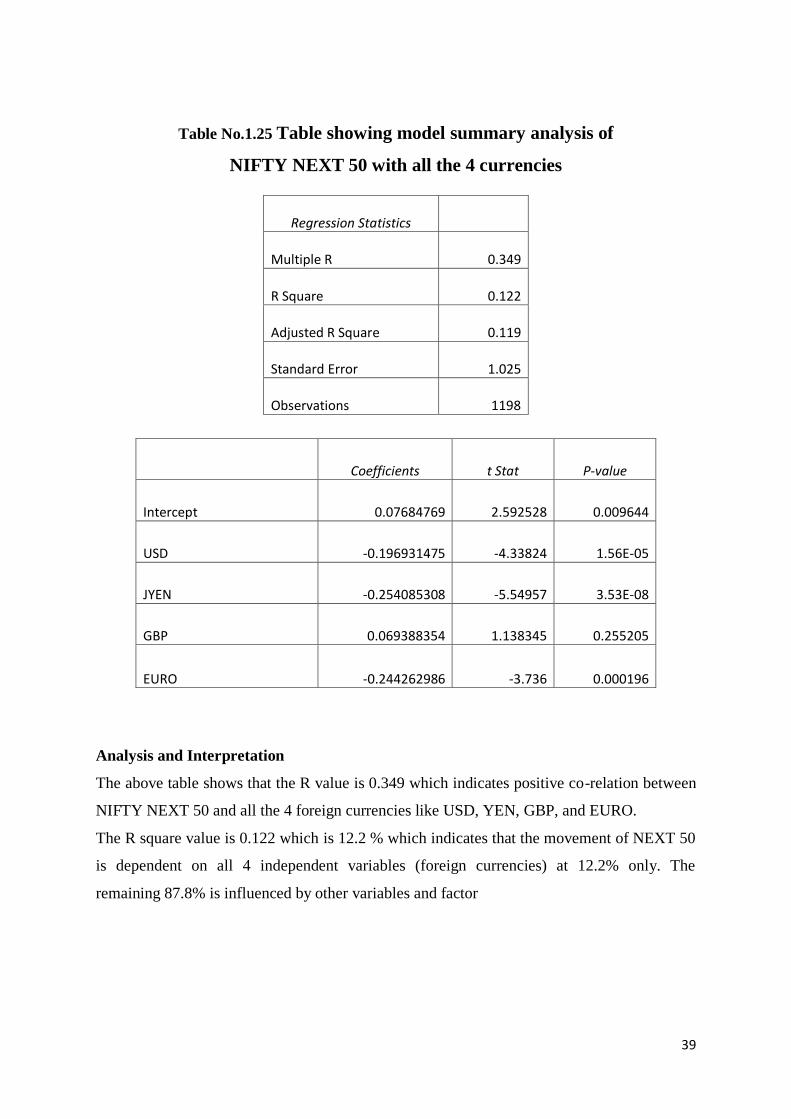
Table No.1.25 Table showing model summary analysis of
NIFTY NEXT 50 with all the 4 currencies
Analysis and Interpretation
The above table shows that the R value is 0.349 which indicates positive co-relation between
NIFTY NEXT 50 and all the 4 foreign currencies like USD, YEN, GBP, and EURO.
The R square value is 0.122 which is 12.2 % which indicates that the movement of NEXT 50
is dependent on all 4 independent variables (foreign currencies) at 12.2% only. The
remaining 87.8% is influenced by other variables and factor
Regression Statistics
Multiple R 0.349
R Square 0.122
Adjusted R Square 0.119
Standard Error 1.025
Observations 1198
Coefficients t Stat P-value
Intercept 0.07684769 2.592528 0.009644
USD -0.196931475 -4.33824 1.56E-05
JYEN -0.254085308 -5.54957 3.53E-08
GBP 0.069388354 1.138345 0.255205
EURO -0.244262986 -3.736 0.000196
40
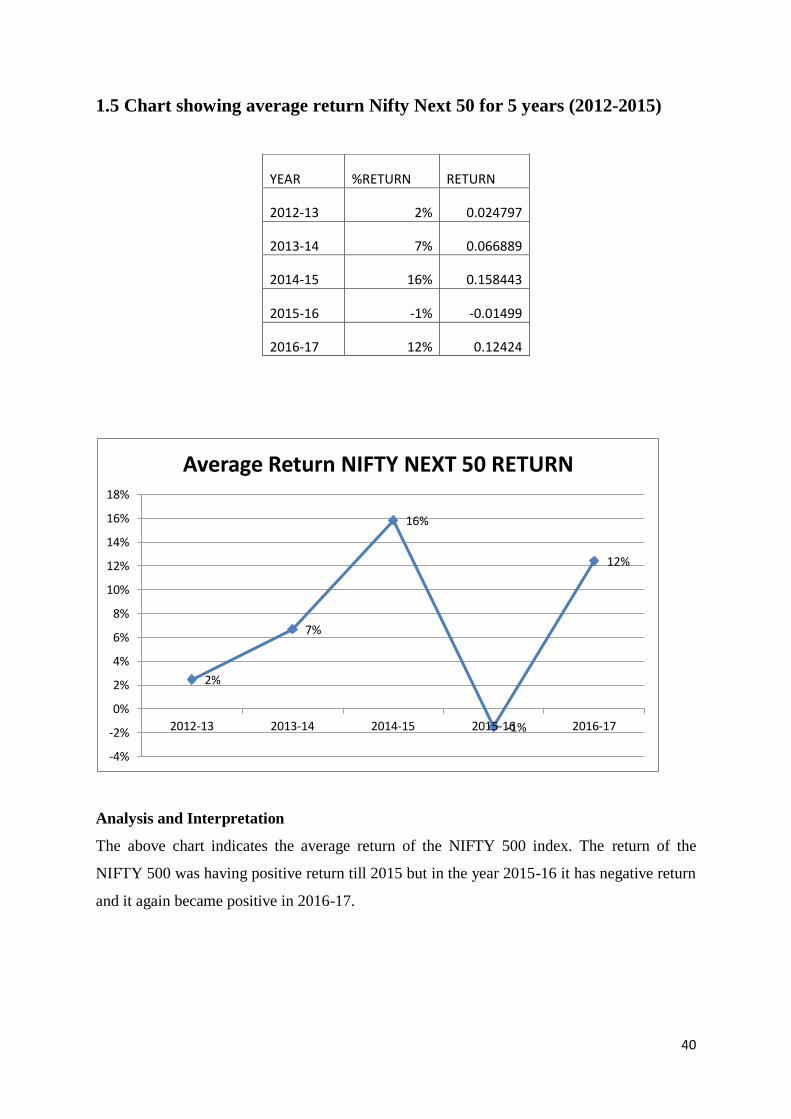
1.5 Chart showing average return Nifty Next 50 for 5 years (2012-2015)
Analysis and Interpretation
The above chart indicates the average return of the NIFTY 500 index. The return of the
NIFTY 500 was having positive return till 2015 but in the year 2015-16 it has negative return
and it again became positive in 2016-17.
2%
7%
16%
-1%
12%
-4%
-2%
0%
2%
4%
6%
8%
10%
12%
14%
16%
18%
2012-13 2013-14 2014-15 2015-16 2016-17
Average Return NIFTY NEXT 50 RETURN
YEAR %RETURN RETURN
2012-13 2% 0.024797
2013-14 7% 0.066889
2014-15 16% 0.158443
2015-16 -1% -0.01499
2016-17 12% 0.12424
41
CHAPTER 5
SUMMARY OF FINDINGS, SUGGESTIONS AND CONCLUSION
SUMMARY OF FINDINGS
From the examination it is discovered that, the co-effective of INR_USD, INR_GBP,
INR_EURO, and INR_JYEN were discovered insignificant for all the chosen stock
indices of National Stock Exchange (NSE). The above statements disclose that as per
above estimations of study it clearly indicates that there is no Influence of FOREIGN
CURRENCY fluctuation on the Indian Stocks Market.
From the above amalgamated regression table we effortlessly found that the effect of
foreign currency volatility does not influence the not even a single NSE stock index in
the course of 5 years. The 5 NSE indices for example, nifty50, nifty100, nifty200,
nifty 500, nifty next 50 with the examination of four principle Exchange rates in
connection to INR, for example, USD, GBP, EURO and JYEN individually were
altogether observed to be significant so we can easily analyse that foreign currency
fluctuation will won't influence the Indian stock market.
The co-relation of all the 4 currencies for NIFTY50 is 0.362 which indicates that there
is no much movement of NIFTY50 due to foreign currency fluctuation
The co-relation of all the 4 currencies for NIFTY 100 is 0.366 which indicates there is
positive correlation and for NIFTY 200 is 0.340, nifty 500 and nifty next50 is 0.370
and 0.349 respectively.
From the above analysis only NIFTY next 50 is affected to the most as it has a
positive correlation of 0.370. It is because it contains only few stocks, hence it is
affected the most than any other.
From all the most significant than 4 currencies only GBP has a positive coefficient
which states that GBP price are the most significant than EURO, JYEN and USD.
42
From the above return analysis of the NSE indices it is found that the return of all the
indices is negative in the year 2015-16 due to impact of various other factors other
than foreign currency fluctuation.
The average return of the NIFTY indices indicated the state of economy of the
country as most of the top companies are under the NIFTY index and hence it can be
found that it has a positive growth from 2012-2015 but in 2015-16 it has a negative
growth due to various reasons.
SUGGESTIONS
As indicated by the above investigation in the wake of all the pertinent approaches and its
examination clearly tells that foreign currency fluctuation does not influence the Stock
market of India. Since there was no effect of volatility of exchange rates to Indian capital
market/securities exchange of India. We can give important exhortation to the general
population who are keen on making investment in stock market, we will recommend to all the
investors while they are investing, if there is volatility in the exchange rates it won't impact
the Stock market. So don't consider foreign currency volatility as an important factor as factor
to invest in Indian securities exchange.
As the currency fluctuations do not influence the Indian stock market, the investors can also
go for FOREX trade separately. This includes trading of currencies were the currency of one
nation is traded or exchanged for a value with another nation currency. The investor can also
make gains through FOREX trade.
CONCLUSION
Under this examination we can undoubtedly comprehend that foreign currency fluctuation
doesn't influence money markets. According to the regression analysis carried out we found
that fluctuation of trade rates against INR, for example, USD, GBP, EURO and JYEN
separately. These don't have any effect on the Indian securities exchange in the course of the
last 5years. So Investors while making interest in the share trading system don't consider the
foreign currency fluctuation as a factor of budgetary pointer or instrument.
43
The examination covers important indices of the NSE and it can be used for taking decisions.
There are lot other stocks or indices which might be affected by the foreign currency
fluctuation but most of the top rated companies which are under NSE indices are included in
NIFTY.
From the above amalgamated regression table we effortlessly found that the effect of foreign
currency volatility does not influence the not even a single NSE stock index in the course of 5
years. The 5 NSE indices for example, nifty50, nifty100, nifty200, nifty 500, nifty next 50
with the examination of four principle Exchange rates in connection to INR, for example,
USD, GBP, EURO and JYEN individually were altogether observed to be significant so we
can easily analyse that foreign currency fluctuation will won't influence the Indian stock
market.
44
BIBLIOGRAPHY
Iqbal, J., & Haider, A. (2005). Arbitrage Pricing Theory: Evidence from an Emerging Stock
Market. The Lahore Journal of Economics, 10,123-139
Maysami, R., & Koh, T. (2000). A Vector Error Correction Model of the Singapore Stock
Market. International Review of Economics and Finance, 9:1, 79-96.
Seifert, B. (1992). Volatility of exchange rates, interest rates, and stock returns. Journal of
Multinational Financial Management, 2, 1-19.
Ajayi, R. A., & Mougoue, M. (1996). On the dynamic relation between stock prices and
Exchange Rates. Journal of Financial Research, 19 , 193-207.
V.Murinde, & Abdalla, I. S. (1997). Exchange rate and stock price interactions in emerging
financial markets: Evidence on India, Korea, Pakistan and the Philippines. Applied Financial
Economics, 25-35.
Pethe, A., & Karnik, A. (2000). Do Indian Stock Markets matter? Stock Market Indices and
Macro Economic Variables. Economic and Political Weekly, 35: 5, 349-356.
Morley, B., & Pentecost, E. (2000). Common Trends and Cycles in G-7 Countries Exchange
Rates and Stock Prices. Applied Economic Letters, 7, 7-10.
Ozair, A. (2006). Causality Between Stock prices and Exchange Rates: A Case of The United
States. Florida Atlantic University, Master of Science Thesis.
Vygodina, A. V. (2006). Effects of size and international exposure of the US firms on the
realtionship between stock prices and exchange rates. Global Finance Journal, 17, 214-223.
Takeshi, I. (2008, November). The causal relationships in mean and variance between stock
returns and Foreign institutional investment in India. IDE Paper Discussion, No. 180.
Stone(2009). Using financial prices to test exchange rate models: A note. Journal of Finance,
42 (1), pp. 141-149.
Allayannis, G., G. Brown, and L. Klapper, 2003, Capital structure and financial risk:
Evidence from foreign debt use in East Asia, Journal of Finance, 58, 2667- 2709.
Allayannis, G., and O. Ofek, 2001, Exchange rate exposure, hedging, and the use of foreign
currency derivatives, Journal of International Money and Finance 20, 273296
Edwards, S., and R., Susmel, 2001, Volatility dependence and contagion in emerging equity
markets, Journal of Development Economics, 66, 505-532.
Edwards, S., J., Biscarri, and P., Gracia, 2003, Stock market cycles, financial liberalization
and volatility, Journal of International Money and Finance, 22, 925955.
Huang, B.N., and C.W., Yang, 2000, The impact of financial liberalization on stock price
volatility in emerging markets, Journal of Comparative Economics 28, 321-339.
45
Jayasuriya, S., 2005, Stock market liberalization and volatility in the presence of favorable
market characteristics and institutions, Emerging Markets Review 6, 170191.
Bekaert, G., and C., Harvey, 2003, Emerging Markets Finance, Journal of Empirical Finance
10, 3-55.
Bénassy-Quéré A., L., Fontagné, and A., Lahreche-Revil 2001, Exchange Rate Strategies in
the Competition for Attracting Foreign Direct Investment, Journal of the Japanese and
International Economies 15, 178-198.
Mishra K.A (2004) Stock market and foreign Exchange market in India. Are they related?
South Asia Economic Journal, 5:2, Sage Publications, New Delhi.
Solnik, B. (1987). Using financial prices to test exchange rate models- A note. Journal of
Finance, 42, 141-149.
Benita, G., and B. Lauterbach. (2004), Policy Factors and Exchange Rate Volatility: Panel
Data Verses a Specific Country Analysis,Research Unit, Foreign Exchange Activity
Department, Bank of Israel, Jerusalem.
Mishkin, F. S (2001). The Economics of Money, Banking and Financial Markets. New York:
Addison Wesley.
Schnabl, G. (2007). Exchange Rate Volatility and Growth in Small Open economies at the
EMI Periphery. ECB Working Paper, No.773.
N.dri. Konan, L. (2008) “The Effects of Interest Rates Volatility on Stock Returns and
Volatility: Evidence from Korea”, International Research Journal of Finance and
Economics, Issue 14, 285-290
Engle, R.F and J.G.Rangel (2005) The SPLINE GARCH model for unconditional volatility
and its global microeconomic causes, Mimeo, presented at the world congress of the
Econometric Society, London August, 2005
Rizwan, M.F and Khan, S. U. (2007). “Stock Return Volatility in Emerging Equity Market
(Kse): The Relative Effects of Country and Global Factors”, International Review of
Business Research Papers, Vol.3, No.2, pp. 362 – 375
Schwert, W. (1990), Stock Returns and Real Activity: A Century of Evidence, Journal of
Finance, 45, pp.1237-1257.
. Mao, C. K. G., and W. Kao. (1990), On Exchange Rate Changes and Stock Price Reactions,
Journal of Business Finance and Accounting, 17 (3), pp.441-449.
Donnelly, R., and E. Sheeby. (1996), The Share Price Reaction of UK Exporters to Exchange
Rate Movements: An Empirical Study, Journal of International Business Studies, 27(1): 157–
65.
Adjasi, C. K.D., and B.N. Biekpe. (2005), Stock Market Returns and Exchange Rate
Dynamics in Selected African Countries: A bivariate analysis, The African Finance Journal,
July, Cape Town, South Africa.

46
Khoo, A. (1994), Estimation of foreign Exchange exposure: an application to mining
companies in Australia, Journal of International Money and Finance, June, 13 (3), pp.342-
363.
Skousen, M. (2006), Inflation’s Effect on the Stock Market, The Investment UELetter: Issue
No.509, February.
Websites
https://www.rbi.org.in/scripts/ReferenceRateArchive.aspx
https://www1.nseindia.com/products/content/equities/indices/historical_index_data.html
http://www.investopedia.com/dictionary/https://www.wikipedia.org/
http://www.bmawc.com/
ACHARYA
ACHARY A INSTITUTE OF TECHNOLOGY
DEPARTMENT OF MBA
INSTITUTES INTERNSHIP WEEKLY REPORT (16M BA PR407)
Name of the Student: Somashekhar C
USN No: 1AY16MBA77
Internal Guide: DR. Prakash B Yaragol
Specialization: Core Finance
· "th Title of the Project: "A Study on Impact of Foreign Currency Fluctuations wi
Reference to Nifty
Company Name & Address: BMA WEAL TH CREATORS LTD, Bangalore
Week
15-01-18 to 20-01-18
22-01-18 to27-01-18
29-01-18 to03-02-l 8
05-02-18 to 10-02-18
12-02-18 to 17-02-18
19-02-18 to24-02-l8
Work undertaken
Orientation with the company. Collection of secondary data relating to industry and Organization.
Orientation with functional department of the organization and detailed study of department.
Finalization of problem area of the study and finalization of research objectives and Methodology.
Finalization of data collection
Discussion with the external guide and internal guide. Fonnation of hypothesis. Classification and analysis of collected
Conducting regression analysis for all the nifty indices with 4 different currencies
External Guide
Signature
Internal Guide
Signature
\~
1
26-02-18 to 03-03-18
05-03-18 tol0-03-18
12-03-18 tol 7-03-18
Compilation of research data and interpretation of data.
Data analysis and Finalization of report.
Finalization of project report and approval of draft by company and college guide.
19-03-18 Report submission to the to24-03-18 Institution.
'
·--- ~~~ HOD
2
Related Documents


![ACHARYA INSTITUTE OF TECHNOLOGY ~!]===== ;;;;;~ w Delhi ...](https://static.cupdf.com/doc/110x72/6266cf57b43f6c1a7d2cff35/acharya-institute-of-technology-w-delhi-.jpg)
