land affairs A N N U A L R E P O R T 1 APRIL 2008 - 31 MARCH 2009

Welcome message from author
This document is posted to help you gain knowledge. Please leave a comment to let me know what you think about it! Share it to your friends and learn new things together.
Transcript

land affairs
A N N U A L R E P O R T1 A P R I L 2 0 0 8 - 3 1 M A R C H 2 0 0 9

land affairs
R P 1 7 1 / 2 0 0 9I S B N : 9 7 8 - 0 - 6 2 1 - 3 8 7 6 7 - 4
Submission of Annual Report tothe Executive Authority
I have the honour of submitting the 2008/2009 AnnualReport of the Department of Land Affairs in terms of thePublic Finance Management Act, 1999, to the HonourableMinister of Rural Development and Land Reform.
THOZAMILE GWANYAAccounting OfficerDATE: 9 September 2009

land
aff
airs
DEPARTMENT OF LAND AFFAIRS: ANNUAL REPORT2
contents
Contact Details...............................................................................................................3
Part 1: General Information
Overview of the Director-General ................................................................................5
Overview of Service Delivery Environment....................................................................8
Strategic Overview & Key Policy Developments ............................................................10
Part 2: Programmatic Context
Programme 1: Administration.....................................................................................12
Programme 2: Surveys & Mapping ..............................................................................24
Programme 3: Cadastral Survey Management .............................................................27
Programme 4: Restitution ...........................................................................................30
Programme 5: Land & Tenure Reform..........................................................................33
Programme 6: Spatial Planning & Information.............................................................37
Programme 7: Deeds Registration ...............................................................................40
Part 3: Report of the Audit Committee
Report of the Audit Committee for the year ended 31 March 2009 .............................45
Part 4: Annual Financial Statements
Report of the Accounting Officer ................................................................................48
Report by the Auditor-General ....................................................................................56
Statement of Accounting Policies & Related Matters....................................................61
Financial Statements ...................................................................................................66
Report by the Auditor-General on the Deeds Registration Trading Account ..................97
Financial Statements of the Deeds Registration Trading Account..................................100
Part 5: Human Resource Management
Oversight Report: National Department of Land Affairs 2008/2009 .............................115
Abbreviations & Acronyms ...........................................................................................142

land affairs
1 APRIL 2008 - 31 MARCH 2009 3
contact details
Director-GeneralMr Thozi Gwanya Tel: 012 312 8503Fax: 012 323 6072e-mail: [email protected]
Cape Town Tel: 021 465 6320Fax: 021 465 3282
Deputy Director-General Land and Tenure Reform
Region 1 (Acting)Mr Moshe SwartzTel: 012 312 8409Fax: 012 323 6072e-mail: [email protected]
Region 2Mr Mdu ShabaneTel: 012 312 9552Fax: 012 312 9128e-mail: [email protected]
Deputy Director-General Land Planning and InformationDr Nozizwe MakgalemeleTel: 012 312 9834Fax: 012 326 9524e-mail: [email protected]
Chief Lands ClaimsCommissionerMr Andrew MphelaTel: 012 312 9244Fax: 012 321 0428e-mail: [email protected]
Chief Financial Officer (Acting)Mr Vusi MahlanguTel: 012 312 8154/9310Fax: 012 321 3279e-mail: [email protected]
Office of the DGChief Operations Officer(Acting)Ms Leona ArcharyTel: 012 312 9556Fax: 012 323 6072e-mail: [email protected]
Deputy Director-GeneralCorporate Services (Acting)Mr Anton van StadenTel: 012 312 8424Fax: 012 321 0658e-mail: [email protected]
National OfficePrivate Bag X833Pretoria, 0001184 Jacob Maré Street Pretoria, 0001Tel: 012 312 8911Fax: 012 312 8066Website:http://www.ruraldevelopment.gov.za

land
aff
airs
1P A R T 1 G E N E R A L I N F O R M A T I O N

land affairs
1 APRIL 2008 - 31 MARCH 2009 5
part1G E N E R A LI N F O R M A T I O N
TThis is the last report for the year ended 31March 2009, of the old Department of LandAffairs (DLA); now the new Department ofRural Development and Land Reform.
The pace of land delivery in the year underreview acutely reflects the impact when adisjunction exists between the task at handand the resources provided in executing thattask. This is illustrated by the fact that theDepartment spent almost 100% of its landacquisition budget, but could only deliver443,600.4886 hectares of redistributed land.The same trend was quite visible in the case ofthe Land Claims Commission, which had topay an average of R12 949.00 per hectarewhich was a substantive increase compared tothe price paid in the 2007/2008 financial year,ballooning its restitution budget to a total ofR3.5 billion to address and restore land rightsinfringed on by the apartheid policies of thepast.
The Department effectively spent 99.9% ofthe adjusted budget in the 2008/2009financial year compared to 99.5% in2007/2008. The commendable spendingperformance of R6,66 billion is largelyattributable to the initiatives put in place tofast-track the settlement of restitution claims,as well as the acquisition of land at scale inaccordance with the provisions of the Pro-active Land Acquisition Strategy (PLAS) forredistribution purposes.
Land & tenure reformThe Department initially had a nationalredistribution target of 1 500 000 hectares ofland for the year under review, but this targetwas subsequently reduced to 608 060hectares to bring it in line with the actualbudget allocation of the land reformprogramme. A total of 443,600.4886 hectaresof land was eventually transferred andalthough this was less than the revised target,the programme spent almost 100% of itsallocated budget.
Factors such as escalating land priceseroded the buying power of the budget,
Overview ofthe Director-
General
Mr T T GwanyaDirector-General: Department of Land Affairs

land a
ffair
s
DEPARTMENT OF LAND AFFAIRS: ANNUAL REPORT6
making it impossible for the programme to meet the revisedtarget. The programme nevertheless finalised 501 projects,reaching 14 457 beneficiaries.
RestitutionTo date, the Restitution programme has settled 95% of thetotal number of claims lodged by the cut-off date of 31December 1998. During the 2008/2009 financial year, theCommission on Restitution of Land Rights settled 653 claims,resulting in approximately 394 000 hectares of landrestituted to claimants. Approximately 4 296 complex claimsare outstanding.
Cumulatively, the approved hectares of land transferred interms of restitution since 1995 is 2.47 million hectares. Thisrepresents a significant contribution towards the overalltarget of redistributing 30% of white-owned agriculturalland by 2014.
To accelerate the pace of the settlement of claims, theCommission has concluded several agreements withstakeholders. These agreements are also intended to ensurethat capacity is provided to beneficiaries once a claim hasbeen settled and land transferred in order for suchbeneficiaries to actively leverage restituted land fordevelopment purposes and therefore their significantparticipation in the economy.
Post settlement supportOur assessment of land reform projects revealed that thereare indeed some land reform projects that have not met ourexpectations. The assessment also revealed, amongst others,that some of the factors leading to such a lustreperformance relate to the commitment of beneficiaries, theplanning of projects (including the choice of land),institutional alignment, as well as access to supportmeasures and farmer support. To ensure our redistributedand restituted land goes only to people who can makeoptimal use of it, the Department developed a strategywhich includes the careful selection and categorisation ofland reform beneficiaries into (a) landless households(inclusive of farm dwellers and labour tenants in communalareas, on farms and other land); (b) commercially-readysubsistence producers; (c) expanding commercial small-holders; (d) well-established black commercial farmers; and(e) financially capable aspirant farmers. This will help in theappropriate design of land reform products and in definingthe development agenda going forward.
Given the importance of strategic partnerships in securinga significant measure of land reform success, theDepartment has invested much resources in refining,consolidating and deepening relationships with suchpartners, central to which is access to support measures andfarmer support through the private sector. Consequently, theDepartment has rolled-out the strategic partners approachand 30 such partners have been accredited. This approach isimperative if we are to enhance the Department’s deliverycapability, in terms of amongst others, drawing specificprivate sector associates into the design, establishment andoperation of agrarian-based enterprises at various scales. TheDepartment expects that some of these partners will invest inthe enterprises themselves, while others will commit tosupporting initiatives through the whole developmentprocess.
Policy and legislationExtensive research and consultation, which culminated into adraft policy framework on the ownership of land byforeigners, has been undertaken and it is envisaged that thepolicy and accompanying legislation will be finalised in the2009/2010 financial year. With regards to the Willing Buyer-Willing Seller Review, considerable progress has been madeand it is anticipated that this Review will also be finalised in2009/2010. Extensive work on the collation andclassification of submissions in respect of the draftRegulations under the Communal Land Rights Act, 2004 (ActNo. 11 of 2004), including the interrogation and evaluationof such comments were completed in 2008/2009.
Land planning & informationThe regulation of proper land use, spatial planning andspatial information management within the public andprivate sectors is a core responsibility of the Department. Assuch, the provision of legislative, institutional and relevanttechnical skills constitute one of the key tasks theDepartment undertakes for a more effective land usemanagement system, spatially equitable and efficientsettlement patterns. Some of the highlights relating to thework done by the Land Planning and Informationprogramme include the coordination of various consultationsheld in respect of the Land Use Management Bill (LUMB), aswell as the provision of administrative, technical andfinancial support to the South African Council for Planners(SACPLAN).
For effective planning and monitoring of land reform,national infrastructure and sustainable development, theDepartment provided accurate, up-to-date and accessiblemaps and other geo-spatial information and imagery, as wellas an integrated spatial reference framework.
A secure land right provides a source of wealth, anegotiable asset and a platform for investment for the rightsholder, thus the immense potential for contributing topoverty alleviation and socio-economic development. Theapproval, maintenance and archiving of cadastral surveydocuments submitted by land surveyors, the supplying ofsuch cadastral information and the regulation of cadastralsurveys represents a fundamental pathway to unlockingdevelopment opportunities, particularly in the rural areas.
Notwithstanding staff shortages and an increasedworkload as a result of the boom in the property marketduring the period under the review, the Departmentmaintained a world class deeds registration turnaroundperformance time of less than 20 working days.
Strategic support& corporate servicesTo ensure good governance, the Department executed itsAnnual Audit Plan and several comprehensive audit projects.The Monitoring and Evaluation framework was improved tofacilitate the continuous monitoring of Departmentalperformance, accountability and informed decision-making.After extensive engagements with the State InformationTechnology Agency (SITA), the Department implemented aDepartmental Virtual Private Network (VPN) to ensure animproved and more cost-effective network service.
land a
ffair
s
1 APRIL 2008 - 31 MARCH 2009 7
To contribute towards national efforts to fightunemployment and reduce high levels of unemployment inthe country, the Department introduced several initiatives toassist the youth, particularly those from disadvantagedbackgrounds. These included a bursary programme, aninternship programme and a graduate programme, all ofwhich placed priority on people with disabilities as potentialbeneficiaries. These initiatives were not only inward-looking,but were also extended to land reform beneficiarycommunities. For instance, a partnership was formed withthe University of Fort Hare to provide project and farmmanagement training for land reform beneficiaries toaddress constraints identified during a research projectaimed at determining the reasons for the failure of someland reform projects.
Our empowerment programmes would be incompletewithout the integration and mainstreaming of gender. In thisregard the Department facilitated gender awareness andmainstreaming and also finalised both the GenderResponsive Budgeting Framework and the Older PersonsRights Framework.
From the communications angle, the Department initiatedan ambitious Knowledge, Attitude, Perception and Practice
(KAPP) survey to ensure the availability of researched andverifiable baseline information which indicates what thedifferent land reform stakeholders’ knowledge, perceptionsand attitudes are towards land reform and how, amongstothers, they currently access information from theDepartment. This information will be used as a reliablefoundation for the development of measurable interventionsand, in later years, as the basis to evaluate the impact ofcommunication interventions that have been implemented.
ConclusionThe year under review has seen a number of successes whichcontributed to the achievement of certain set targets ashighlighted in this Annual Report. While the Department isproud of these achievements, it is also acknowledged thatthere are many areas where performance and delivery can beimproved.
The 2008/2009 financial year may have been the last yearin which the Department performed as the Department ofLand Affairs, but the challenges and vision of land reformremain and will still be actively pursued by the Departmentof Rural Development and Land Reform.
Mr T T GwanyaDirector-General
land
aff
airs
DEPARTMENT OF LAND AFFAIRS: ANNUAL REPORT8
Aim of the VoteThe aim of the Department of Land Affairsduring the period under review was to providean equitable and sustainable land dispensationthat result in socio-economic development forall South Africans.
Key measurable objectives &programmes
part1 G E N E R A LI N F O R M A T I O N
Overview ofService Delivery
Environment
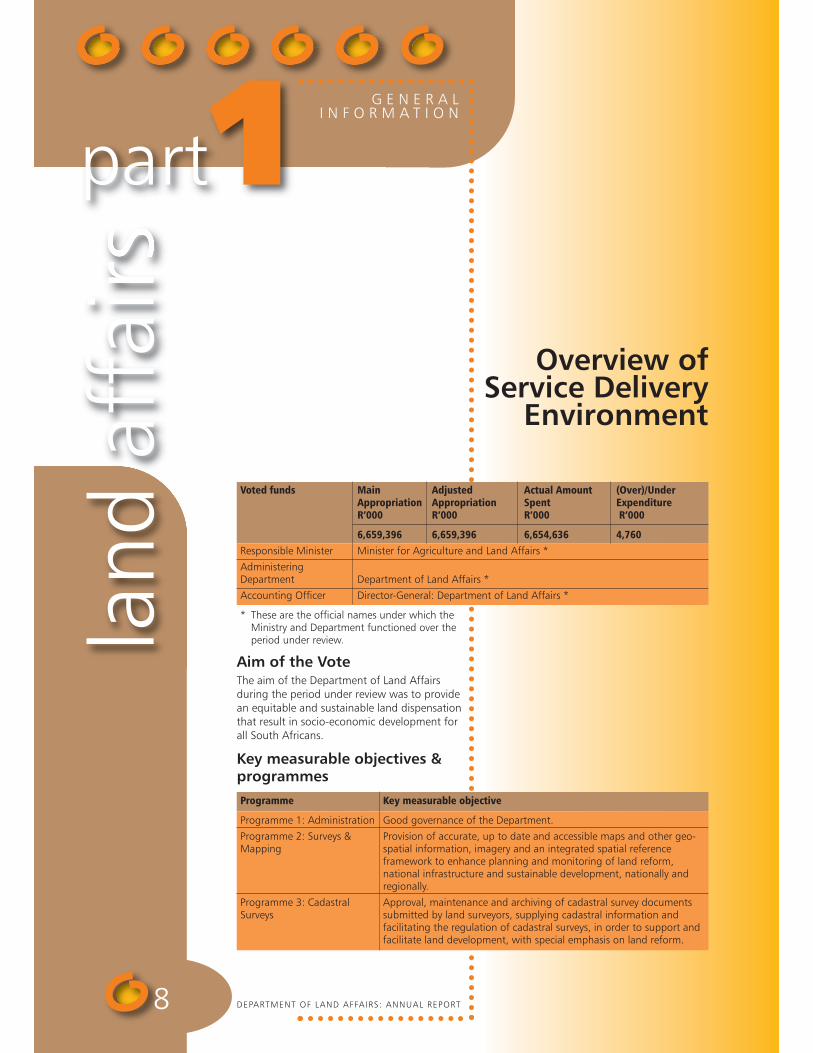
Voted funds Main Adjusted Actual Amount (Over)/UnderAppropriation Appropriation Spent ExpenditureR’000 R’000 R’000 R’000
6,659,396 6,659,396 6,654,636 4,760Responsible Minister Minister for Agriculture and Land Affairs *
AdministeringDepartment Department of Land Affairs *
Accounting Officer Director-General: Department of Land Affairs *
* These are the official names under which theMinistry and Department functioned over theperiod under review.
Programme
Programme 1: Administration
Programme 2: Surveys &Mapping
Programme 3: CadastralSurveys
Key measurable objective
Good governance of the Department.
Provision of accurate, up to date and accessible maps and other geo-spatial information, imagery and an integrated spatial referenceframework to enhance planning and monitoring of land reform,national infrastructure and sustainable development, nationally andregionally.
Approval, maintenance and archiving of cadastral survey documentssubmitted by land surveyors, supplying cadastral information andfacilitating the regulation of cadastral surveys, in order to support andfacilitate land development, with special emphasis on land reform.

land a
ffair
s
1 APRIL 2008 - 31 MARCH 2009 9
Service delivery environmentThe Department committed itself to the Batho Pele principlesin ensuring the delivery of services to all South Africancitizens. In this regard the Department, through its variousprogrammes, continuously strives to improve the wayservices are provided to its clients.
The Land Redistribution Programme delivered443,600.4886 hectares of white-owned commercialagricultural land as part of its contribution to the broaderDepartmental core objective of redistributing 30% ofcommercial agricultural land by 2014. A total of 501projects were finalised and 14 457 beneficiaries werereached through these projects. The annual target for
2008/2009 was 1 500 000 hectares however it had to bereduced to 608,060.0000 hectares in order to align it withthe actual budget allocation. Although the revised targetcould not be met, the Branch: Land and Tenure Reform spentalmost 100% of its allocated budget.
Under the Land Restitution Programme a total of 653claims were dealt with inclusive of 108 claims which weredismissed. This resulted in approximately 394 000 hectaresof land being approved for restoration, affectingapproximately 30 000 households. The annual target for2008/2009 was 1 034 000 hectares and 2 585 claims. Thesetargets were reviewed when it became known that thetenure of the Commission was to be extended.
Programme
Programme 4: Restitution
Programme 5: Land & TenureReform
Programme 6: SpatialPlanning & Information
Programme 7: DeedsRegistration (AuxiliaryServices)
Key measurable objective
Resolve restitution claims within the target period through negotiated settlements that restore landrights or award alternative forms of equitable redress to claimants.
Ensure that sustainable benefits of economic growth accrue to previously disadvantagedcommunities, groups and individuals.
Provision of legislative, institutional and technical skills support to regulate land use management,spatial planning and spatial information management within the public and private sectors.
To provide a high quality deeds registration system whereby secure titles are registered and speedyand accurate information is provided.
Departmental expenditure
GFS Classification Budget allocated R’000 Expenditure to date R’000 Expenditure as % of budget
Compensation of employees 612,728 610,553 99.6%
Goods and services 632,978 631,882 99.8%
Interest and rent on land 7 6 85.7%
Financial transactions in assets& liabilities - 2,361 -
Transfers to households 3,897,032 3,893,332 99.9%
Payment for capital assets 1,516,651 1,516,502 99.9%
TOTAL 6,659,396 6,654,636 99.9%

land
aff
airs
DEPARTMENT OF LAND AFFAIRS: ANNUAL REPORT10
T
part1 G E N E R A LI N F O R M A T I O N
StrategicOverview
& Key PolicyDevelopments
The policy and legislation development processduring 2008/2009 was critically influenced byvarious stakeholders such as government, non-governmental organisations, academics andthe general public. Draft policies on the WillingBuyer-Willing Seller principle and the ownershipof land by foreigners are available but furtherconsultations are necessary to finalise thepolicy options. Significant work was also donein respect of the evaluation of commentsreceived on the draft regulations to be issuedin terms of the Communal Land Rights Act.
An important achievement in the year underreview was the drafting and processing of theLand Reform: Provision of Land and AssistanceAmendment Bill which was enacted andpromulgated as Act No. 58 of 2008. Thisresulted in significant amendments to theProvision of Land and Assistance Act, 1993(Act No. 126 of 1993).
The amendment of Act 126 provided for asufficient legislative framework to continueimplementing the Pro-active Land AcquisitionStrategy (PLAS) and resolved certaininterpretation problems and importantshortages and challenges that bedeviled PLASprojects. The PLAS Implementation Frameworkwas amended to ensure the procedures thatare necessary to acquire, manage and disposeof assets acquired in terms of Act 126 aresufficient and has sound legal and policystanding.
The Department has been developing a newapproach to land and agrarian reform which isfocused on more effectively addressing thevarious aims of land and agrarian reform. Thenew approach will achieve this throughtargeting different identified categories oflandless or land hungry people based on theirland needs, their farming experience and their
access to resources and create developmentalpathways appropriate to the identifiedcategories. The approach provides foraddressing household-level food security andaddressing rights-based applicants at the lowerlevels by means of providing the very poor withthe opportunity to gain access to land toengage in farming. At the same time, itaddresses the transformation of agriculture byproviding opportunities and enhanced supportto existing black commercial farmers. Thedifferent categories that will be targetedthrough this new approach are:
� Category 1: Households with no individualaccess to land – those who have no spaceeven for subsistence production and seekland for small-scale subsistence purposes,with or without settlement.
� Category 2: Commercial-ready subsistenceproducers – those who wish and arecapable of having a more commercialfocus, mostly on a part-time basis, butneed appropriate land and support.
� Category 3: Expanding commercialsmallholders – those who have alreadybeen farming commercially at a small scaleand with aptitude to expand, but areconstrained by land and other resources.
� Category 4: Well-established blackcommercial farmers – those who havebeen farming at a reasonable scale, butare disadvantaged by location and othercircumstances, and with real potential tobecome large-scale commercial farmers.
� Category 5: Financially capable, aspirantblack commercial farmers – establishedbusiness people who wish to expand intoagriculture and who by and large will bepart-time farmers.

land affairs
2P A R T 2 P R O G R A M M A T I C
C O N T E X T
land
aff
airs
DEPARTMENT OF LAND AFFAIRS: ANNUAL REPORT12
1Programme Administration
part2P R O G R A M M A T I CC O N T E X T
PPurposeTo render corporate services to theDepartment.
MeasurableobjectiveGood governance of the Department.
Intended impactImproved governance of the Department andaccountability for its resources.
IntroductionThe components that are part of Programme 1are mostly components that focus on specificcorporate and executive support or certainspecialised services. These components arestrategically located within two Branches –
� the Office of the Director-General; and� Corporate Services.
Office of theDirector-GeneralChief OperationsOfficerThe Chief Operations Officer (COO) of theDepartment is located within the Office of the
Director-General (ODG). The primaryresponsibility of the COO is to assist theDirector-General with the overall managementof the Department, especially from a strategicmanagement support perspective, as well asto ensure the oversight of organisationalperformance.
The COO is responsible for themanagement of various components in theODG. This includes the responsibility for thedevelopment and drafting of departmentalpolicies and legislation; stakeholder andinternational relations; risk and compliancemanagement; and the implementation ofstrategies related to transformation, vulnerablegroups and gender, to name a few.
CommunicationServicesIn line with the over-arching strategic objectiveof implementing needs-based, pro-active andanalytical communication interventions, theChief Directorate: Communications Servicesinitiated the Knowledge, Attitude, Perceptionand Practice (KAPP) survey as a flagship projectfor the achievement of this objective. Theintended outcome of the KAPP survey is theavailability of researched and verifiablebaseline information which indicates what thedifferent land reform stakeholders’ knowledge,perceptions and attitudes are towards landreform and how, amongst others, theycurrently access information from the

land a
ffair
s
1 APRIL 2008 - 31 MARCH 2009 13
Department. This information will be used as a reliablefoundation for the development of measurable interventionsand, in later years, as the basis to evaluate the impact ofcommunication interventions that have been implemented.Public surveys as well as focused group sessions have beenconducted in three provinces. Similar sessions in theremaining provinces will resume in May 2009. The project isto be completed towards the end of 2009.
To create a conducive environment for theimplementation of the Minister’s programme of action andthe Department’s strategic plan, the Chief Directorateundertook several communication initiatives, including theprovision of integrated marketing communication supportaround the Ilima/Letsema campaign. Furthermore, toimprove the availability and quality of information in respectof Departmental policies, programmes, services and projects,the upgrading of the Department’s website gainedmomentum towards the end of the financial year.
Financial constraints forced Communication Services toinnovate inexpensive and creative ways to communicate,publicise and clarify the Ministry and Department’s positionson various issues. Letters to the editors of variouspublications were used to great effect to position landreform in the public domain. Unfortunately several
communications projects such as the basket of opportunitiescampaign and the insightful media surveillance had to bepostponed to the 2009/2010 financial year.
As part of the process to manage the corporate identity ofland reform, the Department undertook an advertisingcampaign to position the role of the Department within thebroader development context taking place in the country.The campaign was augmented with the print mediaadvertising on various issues.
Public discourse on land reform cannot be left only to themedia who, in some instances have clearly reflectedinsufficient understanding of land and agrarian reform. Toaddress this challenge, Communication Services reviewed itsinteractions with the Media, known as the 4th Estate, andamongst others, put into place measures such as ensuringproper coordination of media interviews and responses tomedia inquiries. Further interventions include the issuing ofweekly media diaries to alert the media of majorforthcoming Ministerial and Departmental undertakings, aswell as dedicated and focused outings with members of themedia to strengthen relationships and to brief the media tobetter understand the nuances, successes and challengesrelated to land and agrarian reform.
Strategic objectives
Development of acomprehensive,proactive, analyticaland needs-basedcommunicationstrategy
Outputs
A client-approved, GCISguidelines compliant,comprehensive 1-yearcommunication strategyto support the Ministryand Department’sstrategic and operationalplans to support coreobjectives
Performance indicators
The development,implementation andevaluation of thecomprehensive, goal-orientated,client-sanctionedcommunication strategyover a 1-year period tosupport the Departmentin terms of internal andexternal communication
Targets 2008/2009
Review, update,implementation andmanagement of thecomprehensive 1-yearcommunication strategyin support of and alignedwith the 5-year MTEFcycle
Actual
• Strategy developedand submitted toGCIS on 9 April 2008
• Operational plandeveloped andimplemented toensure achievementof objectives of thestrategy.
Actual performance against targets
Executive ServicesThe Directorate: Executive Services is strategically located inthe Office of the Director-General to enable the provision ofimmediate and direct administrative, advisory and personalsupport to the Director-General. The Directorate comprisesthree specialised units, which report to the head of thiscomponent. These units are geographically organised basedon the services that they provide; to this end, the Sub-directorates: Administrative Support and Secretariat SupportServices are located in Pretoria, and the Sub-directorate:Parliamentary Support is located in Cape Town. The threeSub-directorates are cumulatively responsible for providingco-ordinated support within their respective areas ofresponsibility and channelling vital information to theDirector-General thus facilitating the effective performanceof his duties.
As a core function, the Sub-directorate: AdministrativeSupport is entrusted with the responsibility of continuouslyensuring that Ministerial and Director-General enquiries areprocessed without any delay. As a result of this rapidresponse, the Sub-directorate has managed to achieve aone-day turnaround time during the year under review andthis resulted in 1583 Ministerial and Director-Generalenquiries being disposed of to other components within the
Department. Over and above that function, the componentis also charged on a daily basis with tasks such as, theprocessing of submissions to and from the Director-General,ensuring the quality of submissions as well as decisivelyrendering advice to the Director-General in this regard. Inrespect of this remarkable service, a total of 1143submissions were processed based on an achievableturnaround time of two days.
The Sub-directorate: Secretariat Support Services wasestablished more than a year ago and since its inception hasprogressed successfully into a fully functional and cohesiveunit that renders an effective and professional service insofaras high-level meetings are concerned. These range frommanagement and inter-departmental meetings to meetingswith other government departments, non-governmentalorganisations and foreign delegations. Such meetings arechaired by the Minister for Agriculture and Land Affairs, theDirector-General of Land Affairs or are co-chaired by theDirectors-General of the Departments of Land Affairs andAgriculture. The Sub-directorate is responsible for recordingquality minutes and securing hospitable, user-friendly anddisability accessible venues. During the year under review,the Secretariat arranged several meetings, including aMinisterial Lekgotla, a Senior Management Service (SMS)Conference, a Strategic Planning meeting, three Quarterly

land a
ffair
s
DEPARTMENT OF LAND AFFAIRS: ANNUAL REPORT14
Review and Assessment meetings, three Top Managementmeetings and seven Strategic Management Committeemeetings. A total of 33 meetings were minuted (includingthe Director-General’s 16 Ad Hoc meetings) and finalisedwithin specific turnaround times. In addition to its corefunction, the component implemented an effective follow-up system for decisions and allocation of tasks emanatingfrom meetings, developed a new meeting checklist andreviewed and revised membership to meetings. The unitculminated the year by developing an electronicDepartmental year planner that is currently posted on theDLA intranet.
The Sub-directorate: Parliamentary Support is primarilyresponsible for processing all Cabinet-related matters atdepartmental level, for monitoring and reporting onparliamentary activities, and for co-ordinating both thefulfilment of Parliamentary obligations by the Department, asdictated by the various regulatory frameworks, as well assecuring the attendance of the Director-General anddepartmental delegations at parliamentary events. Inaddition, this unit serves as a communication link not onlybetween the Department, the Ministry, the Deputy Ministryand Parliament, but also between the DLA, Parliament, otherstate departments and Ministries as well as civil society.
As part of its monitoring role, this unit assessed 529Cabinet Memoranda to ascertain their relevance and impacton DLA line functions and attended and reported on 44Parliamentary portfolio and select committee meetings whichcovered matters such as the Land Use Management Bill, theProvision of Land and Assistance Amendment Bill, budgetarymatters, annual reports and strategic plans of theDepartment, the Commission on Restitution of Land Rightsand the Ingonyama Trust Board. In addition, 40
Parliamentary questions were processed during this period.Parliamentary legislation tabled by other Departments, suchas the Prevention of Illegal Eviction from and UnlawfulOccupation of Land Amendment Bill, the South AfricanSpace Agency Bill and the Cross Boundary MunicipalitiesLaws Repeal Bill to name a few, were also monitored andreported on. A total of 204 parliamentary bills wereassessed.
GenderDuring this reporting year the Gender Unit focussed on twocritical outputs in its continued endeavour to facilitategender awareness, mainstreaming and the development ofstrategies. These outputs were the availability of operationaltools to fast-track mainstreaming and the management ofadvocacy programmes which are to be observed within theDepartment as well as externally with clients.
The Unit is proud to report that these targets wereachieved. In respect of the mainstreaming target, theGender Responsive Budgeting Framework was alreadyapproved in the second quarter of 2008, while the targetwas March 2009. In addition, the Older Persons RightsFramework was finalised and submitted for approval.
With regard to the advocacy programmes the Unit hadplanned four programmes but managed to coordinate five,namely the National Women’s Day, the World RuralWomen’s Day, the International Women’s Day, the SouthernAfrican Women Innovators and Inventors Symposium andthe 16 Days of Activism for No Violence Against Women andChildren.
The Gender Unit is commended for exceeding its targetsin the 2008-2009 financial year.
Strategic objectives
Development ofprogrammes forempowerment ofwomen, children andolder persons withinthe context of theDepartment’smandate
Outputs
Mainstreaming facilitated
Advocacy programmespromoted within theDepartment andexternally withDepartmental clients
Performance indicators
Availability ofoperational tools to fast-track mainstreaming
4 advocacy programmesundertaken by theDepartment annually
Targets 2008/2009
2 approved operationaltools (Gender ResponsiveBudgeting and OlderPersons RightsFramework)
4
Actual
2
5
Actual performance against targets
Internal Audit
PurposeThe purpose of the Directorate: Internal Audit is to provideassurance services in the form of internal audit services.
Measurable objectiveImprove internal control systems through effective internalauditing.
Service delivery objectives& indicatorsImprove the Department’s systems of internal controls.
Service delivery achievementsDuring 2008/2009, the Directorate: Internal Audit executedthe Annual Audit Plan and spent 23 500 hours on fourcomprehensive audit projects (including financial andoperational audits, performance audits, legal complianceaudits, fraud risk reviews and information technologyaudits), as well as one financial, operational and complianceaudit. The approved audit plan projects were executed at theDepartment’s national office and 17 provincially-basedoffices. The Directorate also completed 33 forensicinvestigation projects during the financial year while afurther 37 projects were in progress at year-end. Due tocapacity constraints within the component, seven projectswere outsourced. Internal Audit also assisted with the riskmanagement functions within the Department.

land a
ffair
s
1 APRIL 2008 - 31 MARCH 2009 15
Monitoring & EvaluationThe Monitoring and Evaluation (M&E) Directorate isresponsible for developing M&E systems and tools, as well asthe institutionalisation of the M&E function within theDepartment. It is also responsible for programmeperformance monitoring, programme evaluation andstatistical services.
In the year under review the M&E Directorate’s main aimwas to produce an improved M&E framework which formsthe basis of the above functions. The point of departure wasto facilitate the continuous improvement of Departmentalperformance, accountability and informed decision-makingthrough an effective M&E. This function will continuously beimproved. The Directorate achieved its target of producingan improved M&E framework, but also exceeded this target
by producing two additional documents, namely theProgramme Performance Monitoring and the Statistics &Information Management Guidelines.
The Directorate managed to achieve a higher degree ofreporting on Departmental performance by producing andpresenting quarterly performance reports at each QuarterlyReview and Assessment Meeting. It was realised that anelectronic M&E system that could be used as a performanceinformation repository will make it easier for Departmentalcomponents to submit information on a regular basis andfor such information to be verified. For this reason, anappropriate system has been purchased and will beimplemented in 2009/2010. It is envisaged that this systemwill ensure that requirements regarding performanceinformation set by Treasury and the Auditor-General are met.
Strategic objectives
Improvement of theMonitoring andEvaluationFramework
Outputs
ComprehensiveMonitoring andEvaluation Framework toprovide evidence-basedprogramme performancemonitoring, human rightscompliance reporting,evaluation studies of landreform; and baselineinformation forprogramme planning andevaluations
Performance indicators
ComprehensiveMonitoring andEvaluation Frameworkdeveloped to produce:programme indicators,programme performancemonitoring annually,human rights complianceannually, Quality of LifeSurvey and baselineinformation forprogrammes
Targets 2008/2009
Framework forimplementation infinancial year 2008/09available by June 2008.
Actual
The DLA M&E Frameworkwas developed andapproved in February2009
Actual performance against targets
Policy & LegislationDevelopmentThe Policy and Legislation Development Unit is responsiblefor the drafting, reviewing and assessment of policyguidelines aimed at amplifying the core objectives of theDepartment. The Unit is further responsible for the draftingof Departmental legislation (including subordinatelegislation) and the analysis of other legislation that mayhave an impact on Departmental functions. During2008/2009 the Unit built on a number of lessons emergingfrom various internal and external reviews and the ongoingimplementation of the land reform programmes.
In respect of the regulation of the ownership of land byforeigners, the Unit has done extensive research andconsultation which culminated in the drafting of a policy
framework and bill. On request of the executive furtherconsultation is taking place and it is envisaged that the policyand bill be finalised in the 2009/2010 financial year.
A third draft of the Willing Buyer-Willing Seller Review wasalso completed, however further work on the compensationformula linked to the expropriation model is to be finalisedin 2009/2010. The Unit also assisted in the finalisation of theProvision of Land and Assistance Amendment Bill. This Billwas approved by Parliament and promulgated as theProvision of Land and Assistance Amendment Act, 2008 (ActNo.58 of 2008).
Despite the capacity constraints faced by the Unit, workon the classification and collation of submissions received onthe draft Regulations under the Communal Land Rights Act,2004 (Act No. 11 of 2004), and the interrogation andevaluation of such comments were all completed during theyear under review.
Strategic objectives
Development ofpolicy guidelines toamplify the coreobjectives
Outputs
Implementable policies,legislative and regulatoryreforms to intervene inthe land market
Performance indicators
Availability of a newpolicy regulating theownership of land byforeigners in South Africa
Targets 2008/2009
Approved andimplementable policyregulating ownership ofland by foreigners inSouth Africa (availableSeptember 2008)
Actual
A draft policy frameworkand bill were finalised.Further consultation withkey governmentdepartments is to befinalised in the2009/2010 financial year.
Actual performance against targets

land a
ffair
s
DEPARTMENT OF LAND AFFAIRS: ANNUAL REPORT16
Strategic objectives
Development ofpolicy guidelines toamplify the coreobjectives (continued)
Outputs
Implementable policies,legislative and regulatoryreforms to intervene inthe land market(continued)
Implementable policies,legislative and regulatoryreforms to benefit peopleliving on communal landand State land
Performance indicators
Availability of the willingbuyer-willing sellerprinciple review reportand regulatorymeasures/approachesunderpinned by a pricedetermination formulaproviding for Stateintervention in the landmarket
Availability of new policyon land ceilings
Availability of theamended White Paperthat addresses therecommendations of theLand Summit
Availability of (a)Communal Land RightsAct Regulations and (b)Deeds RegistriesAmendment ActRegulations (CLaRA-related) which entrenchesdemocratic landadministration system
Availability of theamended Regulation 18of the Deeds Registries togive effect to compulsorydisclosure by nationality,race, gender and otherinformation for theregistration of titles, past,present and future alongFICA requirements
Targets 2008/2009
Approved willing buyer-willing seller principlereview report andimplementableregulatorymeasures/approachesunderpinned by a pricedetermination formulaproviding for Stateintervention in the landmarket (availableSeptember 2008)
N/A(No target set for2008/2009)
N/A(No target set for2008/2009)
Two sets of regulationsdrafted and extensiveconsultations undertakenin all provinces exceptKwaZulu-Natal (KZN).
N/A(No target set for2008/2009)
Actual
A gap analysis of thethird draft of the policyframework has beencompleted. Furtherconsultation on thecompensation aspects isto be finalised in the2009/2010 financial year.
Although there is notarget for this output inthe 2008/2009 financialyear, a draft policy hasbeen developed.However, the finalisationof the policy has beenplaced on hold pendingthe review of the WhitePaper.
The Unit developed aprocess map for thereview and redrafting ofthe White Paper. Thetarget date for thefinalisation thereof is2010/2011.
Two sets ofimplementableRegulations, one underthe CLaRA and one underthe Deeds RegistriesAmendment Act (CLaRA-related), December 2008
The target for this outputis September 2009.The project has howeverbeen aborted as theintended outcome couldnot be achieved throughthe amendment ofRegulation 18. Theprinciple is to be dealtwith in the proposedLand Protection Billwhich forms part of theoutput on the regulationof the ownership of landby foreigners.
Actual performance against targets
land a
ffair
s
1 APRIL 2008 - 31 MARCH 2009 17
Risk & ComplianceManagement
PurposeThe proactive identification and understanding of factorsand events that may impact on the achievement of strategic,operational and compliance objectives, followed by themanagement, monitoring and reporting of these risks.
Measurable objectiveImplement risk management and compliance managementstrategy and risk management implementation planthroughout the Department. Availability of a formal structureof risk reporting and monitoring.
Service delivery objectives &indicatorsImproved risk management awareness and regulatorycompliance by the Department of Land Affairs.
Service delivery achievementsDuring 2008/2009, the Directorate: Risk and ComplianceManagement re-established the reporting structure of riskswithin the Department. The Risk & Compliance Committeewas also re-established to monitor the risk profile of theDepartment.
Security Management ServicesAs one of the support functions of the Department, theDirectorate: Security Management Services is responsible forensuring the implementation of safety and security standardsand services throughout the Department. The componentmanages a complete security function in respect ofpersonnel, physical, document, communication, computerand surveillance security. This is done to ensure a healthyand safe working environment.
During 2008/2009 the Directorate focussed mainly onimproving physical security measures by standardisingsecurity operations for all Departmental offices. Physicalsecurity measures such as automated access control andCCTV camera systems were installed at most Departmentaloffices in Limpopo, as well as at the Provincial Land ReformOffice in Gauteng, the Deeds Office in Vryburg andDepartmental offices in Mpumalanga (with the exception ofthe Deeds Office, the Regional Land Claims Commission andthe Witbank district office). Furthermore, the Directoratemanaged to finalise the technical security specifications foroffices in KwaZulu-Natal, the Western Cape, Eastern Cape,Northern Cape and Free State.
A security vetting unit has been established to fast-tracksecurity vetting processes and the post of ICT SecuritySpecialist was filled.
The Directorate continuously strives to enhance safety andsecurity measures in the Department.
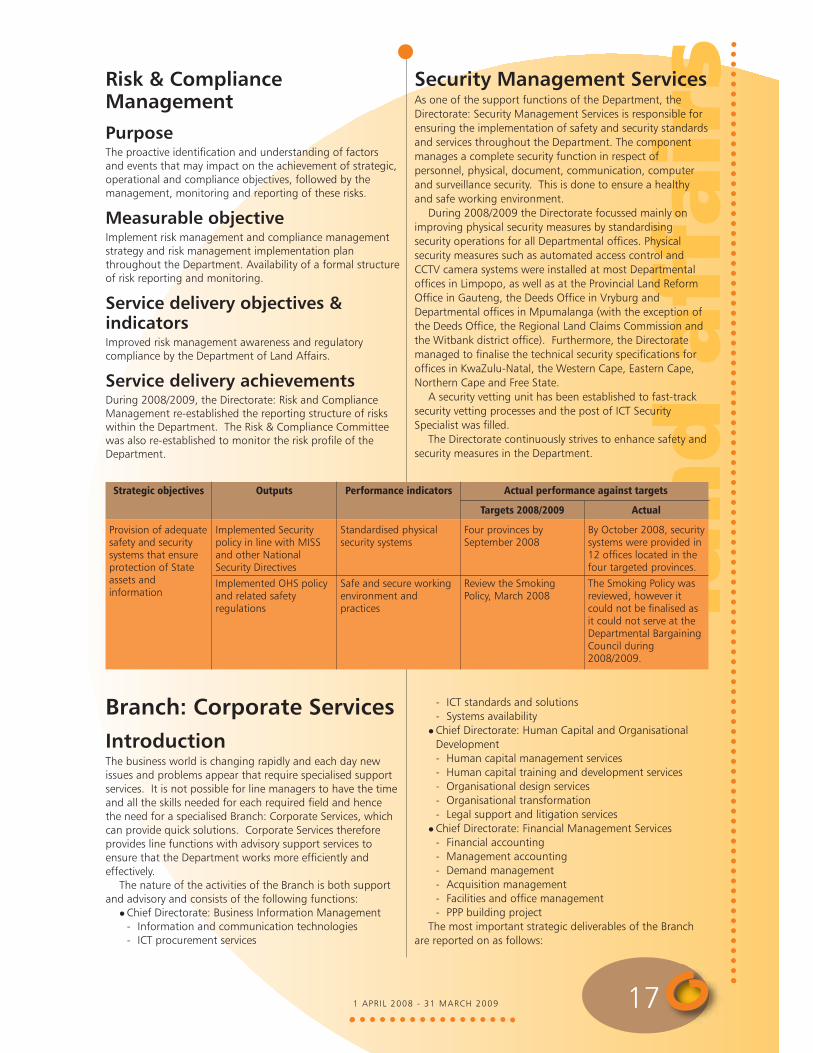
Strategic objectives
Provision of adequatesafety and securitysystems that ensureprotection of Stateassets andinformation
Outputs
Implemented Securitypolicy in line with MISSand other NationalSecurity Directives
Implemented OHS policyand related safetyregulations
Performance indicators
Standardised physicalsecurity systems
Safe and secure workingenvironment andpractices
Targets 2008/2009
Four provinces bySeptember 2008
Review the SmokingPolicy, March 2008
Actual
By October 2008, securitysystems were provided in12 offices located in thefour targeted provinces.
The Smoking Policy wasreviewed, however itcould not be finalised asit could not serve at theDepartmental BargainingCouncil during2008/2009.
Actual performance against targets
Branch: Corporate ServicesIntroductionThe business world is changing rapidly and each day newissues and problems appear that require specialised supportservices. It is not possible for line managers to have the timeand all the skills needed for each required field and hencethe need for a specialised Branch: Corporate Services, whichcan provide quick solutions. Corporate Services thereforeprovides line functions with advisory support services toensure that the Department works more efficiently andeffectively.
The nature of the activities of the Branch is both supportand advisory and consists of the following functions:
� Chief Directorate: Business Information Management- Information and communication technologies- ICT procurement services
- ICT standards and solutions- Systems availability
� Chief Directorate: Human Capital and OrganisationalDevelopment - Human capital management services- Human capital training and development services- Organisational design services- Organisational transformation- Legal support and litigation services
� Chief Directorate: Financial Management Services- Financial accounting- Management accounting- Demand management- Acquisition management- Facilities and office management- PPP building project
The most important strategic deliverables of the Branchare reported on as follows:
land a
ffair
s
DEPARTMENT OF LAND AFFAIRS: ANNUAL REPORT18
Business InformationManagement
Implementation of a VirtualPrivate NetworkThe Department has, after extensive engagement with theState Information Technology Agency (SITA) implemented aDepartmental Virtual Private Network (VPN). The VPNensures Departmental control of its network. The VPN alsoensures improved and a more cost-effective network service.It further provides the architectural foundation for thedeployment of productivity improvement tools such as videoconferencing and collaboration software.
Long term ICT strategic planA five-year ICT Strategic Plan was developed that provides atechnology roadmap aimed at moving the Department toworld class ICT capabilities. This strategy will be finalisedduring the early part of the new financial year.
Development & deployment ofICT business solutionsThe Branch assisted various business units with the planning,analysis, development and deployment of business solutionsaimed at improving operational efficiency and servicedelivery to customers. These are at various stages ofdevelopment and include:
� Restitution management (Umhlaba Wethu)� Balance of grants management� Land reform project tracking� Organisational transformation surveys� Internet/Intranet revamp� Financial administration website revamp.
Capacity building in ICTThe Chief Directorate: Business Information Managementwas traditionally a consultant driven component. Thisstrategy was reviewed due to the cost involved and theexternal dependencies created by such an approach. Anorganisational structure was developed and approved. Arigorous recruitment drive was subsequently embarked uponin support of the implementation of the amended structureas well as boosting capacity to further improve ICT servicedelivery. The scarcity of skills in this environment is still asignificant challenge which is further aggravated by the non-competitiveness of public service salaries for these skills.Notwithstanding these challenges 11 out of 17 advertisedposts have been filled.
Human Capital &Organisational Development
Development of an integratedHuman Resource Plan for theDepartmentThe Human Resource Plan of the Department was reviewedand aligned to the framework issued by the Department ofPublic Service and Administration during the financial year.
The plan addresses the recruitment of staff in accordancewith the additional capacity required in respect of allDepartmental strategic objectives, including theredistribution of 30% white-owned agricultural land by theyear 2014. The plan will further guide the execution ofhuman resource management activities to support theachievement of Departmental strategic objectives. As we areoperating in a dynamic environment, the plan will bemaintained as a living document to be reviewed as andwhen it becomes necessary to ensure that the Departmentkeeps abreast of developments affecting operationalrequirements. The implementation of this plan will resumeat the end of this reporting year.
Recruitment and selectionThe Department initiated a recruitment programme duringNovember 2006. This is an ongoing programme aimed atreducing the number of vacancies and addressing thecapacity needs of the Department. Key milestones achievedthrough this project include, inter alia, the reduction ofvacancies from 22.6% in 2007/2008 to 16.5% in2008/2009. In addition to the filling of existing posts, 32%of the new and prioritised posts on the amended structureof the Department were advertised. This process will beintensified through the proactive development of time-bound recruitment plans during the next financial year.
A significant number of vacancies are filled throughinternal promotions, resulting in internal recycling of staff.Although this is positive for the career development andretention of staff, it is the main reason why the vacancy ratewas not reduced to 10% as intended. A further challengethat affects progress in reducing the vacancy rate to thedesired level is the shortage of suitably qualified candidates,resulting in the costly re-advertisement of vacancies andprotracted head-hunting processes.
Exit interviewsThe strategy to retain staff has become a key focus area inreducing the vacancy rate. An exit management frameworkwas developed and implemented. An external serviceprovider was appointed to objectively interview a sample ofstaff leaving the Department to obtain the reasons for themleaving. The Department has now established dedicatedinternal capacity to focus on exit management and continueto improve retention policies and practices.
Labour relationsDuring the previous financial year it was determined thatmanagers and supervisors require capacity to discipline staffand to effectively resolve grievances. The Departmenttherefore initiated a capacity building project with theintention to empower managers and supervisors in respectof labour relations management. The project enabledmanagers to familiarise themselves with what is expectedfrom them in terms of their management responsibilitiestowards staff and maintaining discipline in the Department.A total of 391 managers and supervisors were trained. Thetraining focused on the management of grievances, as wellas disciplinary and dispute resolution procedures. TheDepartment intends conducting an impact analysis duringthe next financial year to determine the extent to which thisproject had contributed towards improving labour relationsin the workplace.

land a
ffair
s
1 APRIL 2008 - 31 MARCH 2009 19
Employee Wellness ProgrammeThe Department has a well established Employee WellnessProgramme (EWP). The strategic target of this programmewas to involve 80% of the Department’s staff in the activitiesof the programme. The majority of staff participated inhealth promotion sessions which included health screening,voluntary counselling and testing for HIV and relatedmatters. Other activities of the programme include psycho-social counselling and stress relief.
Bursary programmeThe bursary programme focussed on areas of scarce skillswhich are difficult to find through the normal recruitmentprocess. Prospective students who wish to obtain degreesand diplomas in geomatics, surveying, town and regionalplanning and cartography at various tertiary institutions inthe country were attracted through invitations published inthe national and certain local media. Currently a total of214 bursary holders are participating in the programme.Students are also afforded the opportunity to do theirexperiential learning in the Department during their holidayswith allocated mentors in order to fulfil requirements fortheir qualification. Specific emphasis is placed on attractingwomen and black youth from disadvantaged and ruralcommunities.
Career exhibitions were held in Pietermaritzburg, Soweto,Kimberley, Durban, Cape Town and Pretoria, as well as at theYouth in Agriculture and Rural Development Conferencewhich took place in Pretoria.
The Department awarded 41 new bursaries for studentsto study BSc Geomatics in 2009 at the University of CapeTown and at the University of KwaZulu-Natal. Memorandaof Understanding have been signed with these twoinstitutions. At the end of 2008, 43 students completedtheir studies in BSc Geomatics and Town & RegionalPlanning. These students were subsequently employed by theDepartment in the Chief Directorate: Cadastral SurveyManagement and the Chief Directorate: Spatial Planning andInformation.
Internship programmeThe Department recruited 246 interns during this reportingyear. The main focus of this programme is to provide internswith work experience over a 12-month period. Interns wereallocated mentors and specific learning programmes weredeveloped which support their field of study. A total of 66interns subsequently received permanent employment in theDepartment and other government Departments. Theinterns also attended various training programmes such asthe induction programme, project management, jobevaluation, supply chain management, labour relations andcomputer training.
Graduate programmeIn addition to the internship programme, the Departmentalso implemented a Graduate Programme. This programmeis a four-year programme and differs from the internshipprogramme in the sense that these graduates are appointedon a permanent basis and are contractually bound to theDepartment. The Department employed 128 graduates ofwhom seven are persons with disabilities. This programmeintends to address the high vacancy rate and the highunemployment rate of the youth. A total of 88 graduates
were placed in the Deeds Offices, 33 in the Branch: Land andTenure Reform and seven in Corporate Services. Allgraduates attended a compulsory induction programme ofthe public service. Mentors have been allocated to guidetheir learning process. The graduates in the Deeds Officeshave commenced with the Examination of Deeds training.
Training of land reformbeneficiariesThe Department in conjunction with the University of FortHare developed a dedicated training programme in projectmanagement and farm management for land reformbeneficiaries. The programme was developed after aresearch project was conducted to determine the reasons forthe failure of certain land reform projects and the skills levelsof the beneficiaries. The training in isiXhosa was piloted inthe Eastern Cape in the districts of Tshatshu, Chatha andDwesa Cweba. A total of 203 beneficiaries received trainingand 90 beneficiaries received Certificates in ProjectManagement and Farm Management during November2008 from the University of Fort Hare. This project will beextended to other land reform beneficiaries in the newfinancial year.
Batho Pele programme The Department continued to train employees on theDepartmental Batho Pele Revitalisation Strategy (BPRS). TheDepartment’s BPRS is informed by the Service DeliveryImprovement Plan, Service Excellence Awards Policy as wellas the Complaints Handling Policy and Procedure Manual. Inorder to mainstream and institutionalise Batho Pele, 440employees were trained on customer care and 153 oncomplaints handling and management. The Departmentestablished a cross functional Batho Pele forum comprisingrepresentatives from most chief directorates. The forum wasinvolved in various projects including the “name tagsproject” during which 2 914 name tags were produced foremployees.
The Department also participated in the Public ServiceWeek and Africa Public Service and Fun Day celebrations.
Employment Equity programme The Employment Equity Plan of the Department was updatedquarterly to ensure that employment equity targets arecarefully monitored. The Employment Equity Status Report2007/2008 as submitted to the Department of Labourduring October 2008 was posted on the intranet to ensureaccess to it by all staff. The report outlines successes,challenges and the degree of compliance in order to intensifyefforts towards achieving employment equity targets in theDepartment
Youth & disability empowermentstrategiesThe empowerment of youth and people with disabilitiesremains a top priority for the Department. A workforceanalysis survey was conducted to update disability statistics.The survey confirmed that the Department employs 98 staffmembers with disabilities, which amounts to 2,4% of theDepartment’s staff.
The Department celebrated the International Day ofPersons with Disabilities and World AIDS Day in onecelebration which was attended by 293 employees.

land a
ffair
s
DEPARTMENT OF LAND AFFAIRS: ANNUAL REPORT20
The Minister officially launched the Braille Atlas. Duringthe launch, 23 Braille Atlases were handed to organisationsand schools that support blind persons in Gauteng and 24Braille Atlases were handed to organisations and schoolsthat support blind persons in the Free State and theNorthern Cape.
The Minister also launched the Youth in Agriculture andRural Development (YARD) programme in Pretoria. Thislaunch was attended by 902 youth.
Organisational structure &establishmentThe amendment of the organisational structure has beenfinalised and the implementation of certain areas of prioritywas approved. One of the most significant changes is thesplit of the Land and Tenure Reform Branch into twobranches to be known as Region 1 and Region 2. Region 1will comprise of five provinces, namely Mpumalanga,Gauteng, Northern Cape, Western Cape and Eastern Cape,while Region 2 will comprise of the provinces of KwaZulu-Natal, Limpopo, North West and Free State as well as thenational office land reform components.
The amended structure could only be partly funded dueto financial constraints. The funding available has beenprioritised in those components of the Department whereservice delivery is directly affected. The following number ofposts at different levels has been approved:
Component Number of posts
Office of the Director-General 31
Corporate Services 132
Deeds Registries 374
Cadastral Surveys 13
Internal Audit 34
Land Reform 620
TOTAL 1 204
An important aspect of the amendment of theorganisational structure was the development of generic jobprofiles for all occupational classes and the job evaluation ofthese profiles. These job profiles represent 973 jobdescriptions that cover 7 219 posts which will be createdover the next five years as and when additional fundingbecomes available.
Provision of a new nationaloffice buildingThe Department has for some time considered the possibilityof obtaining a new building for its national and otherPretoria-based offices. The Pretoria-based operations of theDepartment are accommodated in six different buildings,which result in several inefficiencies. Attempts to secure asuitable existing building were not successful. TheDepartment decided to explore the possibility of a PrivatePublic Partnership (PPP) as contemplated in Chapter 16 ofthe Treasury Regulations.
This process is currently well underway. The Departmentreceived Treasury Approval II A from the National Treasury forreleasing the Request for Qualification (RFQ) which wasissued on 23 September 2008. Subsequently, an RFQ briefingsession was held with 55 interested parties on 30 September2008. The RFQ evaluation was finalised in January 2009resulting in three Consortia being selected for the next stageof Request for Proposal (RFP). In December 2008, theDepartment of Public Works signed the purchase agreementfor the Berea Park site for the new building. The Departmentis currently finalising documentation for submission toNational Treasury for approval to proceed with the release ofthe RFP as part of the procurement process.
Legal mattersThe Royal Bafokeng Nation and others lodged a case againstthe Minister for Agriculture and Land Affairs wherein theyrequested the court for an order declaring certain propertiesin the Rustenburg area to be registered in their name andfurther, that registration of the properties in the name of theMinister as a trustee be declared unlawful. The matter is stillsub judice. The possibility of a settlement between theparties is being explored.
The court case on the Communal Land Rights Act, 2004(Act No. 11 of 2004)(CLaRA) commenced before the currentreporting year. It was instituted by four applicants fromcommunities in Mpumalanga and North West who havebrought an application in the Pretoria High Court declaringthe provisions of CLaRA and the Traditional Leadership andGovernance Framework Act, 2003 (Act No. 41 of 2003), tobe invalid and unconstitutional. The matter was consideredby the court from 14 to 17 October 2008, howeverjudgment was reserved. The judgment is still awaited as atthe end of the reporting year.

land a
ffair
s
1 APRIL 2008 - 31 MARCH 2009 21
Strategic objective
Creation of anenabling environmentfor improved servicedelivery throughleadership alignmentand appropriateorganisational cultureand architecture
Outputs
Improved ServiceDelivery
Performance indicators
Optimised BusinessArchitecture(organisationalstructure,establishment,processes, HumanResource [HR] plan,information andtechnology) thatachieve departmentalstrategic objectives
Degree of complianceto Batho Pele principles
Adequate HR capacity –Scarce Skills
Implement Scarce SkillsPlan
Targets 2008/2009
10% Non-achievedobjectives
100%
2 Progress Reports
Reduce vacancies inold structure tobelow 10%
15% of posts in newstructure filled
100%
Actual
Achieved• Organisational structure
completed – only prioritisedand funded posts in certaincomponents approved
• Establishment was updated• Business process maps were
finalised and are storedelectronically
• Existing and new posts werejob evaluated
• The HR Plan wasdeveloped and is awaitingapproval
• VPN was successfullyimplemented
• MSP Review was completedend of March 2009
• The ICT Strategy for the next 5years has been developed.
Not achieved• Service Delivery Improvement
Plans for 2008/2009 notsubmitted by all ChiefDirectorates
• Two performance quarterlyreports received
• Standards set in the SDIP werenot implemented.
Not achieved• 1 Report was submitted
Not achieved• Vacancies were reduced to
16,5%
Not achieved• 32% of posts were advertised• 8% of posts in the amended
structure were filled.
Achieved• 9 Scarce skills career
exhibitions/open days were heldtargeting Grade 12 students
• 173 Bursary students arestudying for diplomas anddegrees in Geomatics, Townand Regional Planning,Cartography and Surveying
• 41 New bursaries wereawarded for BSc Geomaticsstudies commencing in 2009 atthe Universities of Cape Townand KwaZulu-Natal
• 27 Students completed studiesin Geomatics and wereemployed
• 16 Students completed studiesin town and regional planningand were employed.
Actual performance against targets

land a
ffair
s
DEPARTMENT OF LAND AFFAIRS: ANNUAL REPORT22
Financial ManagementThe Chief Directorate: Financial Management consists of –
� the Directorate: Financial Administration;� the Directorate: Management Accounting; and� the Directorate: Supply Chain Management.
Directorate: ManagementAccountingThis Directorate performs a variety of functions including themonitoring of financial performance, especially as it relatesto operational performance. This is done through regularinteraction with the various Departmental Programmes. Inaddition, reporting on financial performance is done tostructures such as the Strategic Management Committeewhich meets regularly to discuss strategic matters. Earlywarning systems were also put in place to monitor spending.
The Department has managed to spend 99.9% of theadjusted budget in the 2008/2009 financial year, comparedto 99.5% in 2007/2008. The commendable spendingperformance of R6,66 billion is largely attributable to theinitiatives put in place to fast-track the settlement ofrestitution claims, as well as the acquisition of land at scalein accordance with the provisions of the Pro-active LandAcquisition Strategy (PLAS) for redistribution purposes.
Directorate: Supply ChainManagementDuring the 2008/2009 financial year this Directorate ensuredthat the capital and non-capital assets that were procuredduring the year were properly captured on the BAUD AssetRegister. The Directorate achieved compliance with allrelevant minimum requirements, as well as with the AssetManagement Reforms (AMR) milestones. There were noresolutions by the Standing Committee on Public Accounts inrespect of the vote or the Deeds Trading Account.
A functional and effective call centre has beenestablished. This call centre serves as a supply chainhelpdesk to address all supply chain related enquiries of bothinternal and external clients. Furthermore, a documentcontrol system has been established to ensure thatdocumentation are not lost.
Directorate: FinancialAdministration The Directorate ensured that policies on Surveyor-Generaldebtors and Lease Revenue Management were in place,while the reconciliation of lease debtors was performed. TheDepartment however received audit qualifications in respectof the following:
� Receivable for Departmental revenue:The reconciliation on receivables on State Land leasesand land acquired in terms of PLAS was performedduring the year to ensure accuracy and completeness. Asimilar exercise was done in respect of the interestreceivable on pre-payments.
� Balance of grants:With the assistance of provincial land reform officials,the register of projects was scrutinised and re-worked toensure the correctness of information. There werehowever various challenges in obtaining information onprojects that were captured on the FinancialManagement System, especially since these projectsrelate to financial periods prior to 2004. Nevertheless, allprojects that were captured on the Basic AccountingSystem have been reconciled. An in-house system forthe management of balance of grants was developedand the relevant financial reports will in future begenerated by this system. This includes statements andage analysis.
� Advance payment to conveyancers:A plan was developed to establish proper control overadvance payments made to conveyancers and to audit
Strategic objective
Creation of anenabling environmentfor improved servicedelivery throughleadership alignmentand appropriateorganisational cultureand architecture(continued)
Outputs
Improved ServiceDelivery (continued)
Performance indicators
Percentage of Trainedand Skilled HumanResources
Degree of participationin EWP
Targets 2008/2009
20%
80%
Actual
Achieved• 4 208 Officials attended various
training programmes in linewith personal developmentplans and Departmentalpriorities
• Courses attended amongstothers were:-- Project management- property valuation- risk assessment and
management- negotiation and conflict
management- deeds registration- financial management- effective media relations- free and open source
software for geospatial- monitoring and evaluation
reporting.
Achieved• 90% participated.
Actual performance against targets

land a
ffair
s
1 APRIL 2008 - 31 MARCH 2009 23
payments received since 2004. Schedules of all affectedtransactions have since been drawn and thereconciliation thereof is still in process. Through theLegal Unit of the Commission on Restitution of LandRights, letters of demand were sent to various defaultingconveyancers. As a result, a total of R34 million wasreceived by 31 March 2009 of which R18 million wasrecovered in the 2008/2009 financial year. In caseswhere conveyancers did not respond to the letters, theState Attorney has been requested to proceed with legalaction against those conveyancers.

land
aff
airs
DEPARTMENT OF LAND AFFAIRS: ANNUAL REPORT24
2Programme Surveys& Mapping
part2 P R O G R A M M A T I CC O N T E X T
PPurposeProvide national mapping, earth imagery,integrated spatial reference framework andother geo-spatial information in support of thenational infrastructure and sustainabledevelopment, as mandated by the Land SurveyAct, 1997 (Act No. 8 of 1997). Provideprofessional and technical services in supportof land reform and other public services.
MeasurableobjectiveProvision of accurate, up to date andaccessible maps and other geo-spatialinformation, imagery and an integrated spatialreference framework to enhance planning andmonitoring of land reform, nationalinfrastructure and sustainable development,nationally and regionally.
Intended impactEffective policy-making and developmentplanning (socio-economic sustainabledevelopment, poverty alleviation, jobcreation); Improved efficiencies of servicedelivery by organs of State; SupportGovernment capacity to deliver (e.g. landreform, security, environmental conservation;
food security, disaster management, basicservices); Effective force in global relations.
Service deliveryobjectives &indicators The Surveys and Mapping programme consistsof a single sub-programme of the same name,namely Surveys and Mapping, which isresponsible for the following:
� Promoting and controlling all mattersconnected with geodetic andtopographical surveying and geo-spatialinformation services;
� conducting geodetic, topographical andother relevant survey operations;
� acquiring aerial photography or otherremotely sensed imagery;
� establishing and maintaining a nationalcontrol survey system;
� preparing, compiling and amending suchmaps and other cartographicrepresentations of geo-spatialinformation;
� taking charge of and preserving therecords of all geodetic and topographicalsurveys, maps and aerial photography orother remotely sensed imagery; and

land a
ffair
s
1 APRIL 2008 - 31 MARCH 2009 25
� providing professional and technicalsupport and client services.
Service deliveryachievements Integrated spatial referenceframeworkThe unique national spatial reference framework of thisprogramme provides South Africa’s national control surveynetwork. Due to a revised beacon maintenance schedule, theNational Control Survey System has been available to clients99% of the time in the reporting year, exceeding the settarget by 4%. The network of continuously operating globalpositioning system (GPS) base stations, TrigNet, has beenimproved to ensure a reliable service by installing more basestations (52 in the reporting period) and replacing ageingequipment and software. This resulted in the network beingavailable 97.5% of the time, exceeding the target by 2.5%.
Acquisition of earth imageryThe national aerial photography and imagery archive is ofnational importance and is seen as a major output of thisProgramme, providing coverage of the whole country or1,22 million km². In 2008/2009, aerial photographycovering 163 688 km² were acquired against the initialtarget of 220 000 km². The target was subsequentlyamended to 190 000 km² as a result of delays in the tenderprocess. An underachievement of 26 312 km² can beattributed to the delay in the contract being awarded andthe seasonal weather conditions over Limpopo, KwaZulu-Natal and Mpumalanga which affected flying negatively.
Maps & other geo-spatialinformationIn the year under review, 159 375 km² of fundamental geo-spatial data was updated against the set target of 150 000km². This target has been exceeded by 9 375 km². Thenational mapping programme was on track and 2 146 maps
were produced, which resulted in 532 more maps than theset target of 1 614 maps.
The development of the national land cover mapping wasunfortunately not completed due to delays in the acquisitionof technologies and the loss of key expertise. A Land CoverField Reference Guide will be contracted out, as well as adraft report on land use methodology (user needrequirement) will be made available. In an effort to empowerpeople with disabilities, the Chief Directorate is well on trackto develop maps for visually-impaired citizens. The BrailleAtlas of South Africa, a first for South Africa and probablythe African continent, produced by the Chief Directorate wasofficially launched by the Minister for Agriculture and LandAffairs in March 2009.
Geo-spatial informationproducts & servicesThe turn-around time for supplying geo-spatial informationto clients was well within the service delivery standard,exceeding the set target by 10%. There is a growing demandin the country for map literacy and map awareness trainingamongst clients and other stakeholders. This demand isclearly demonstrated by the over-achievement of 44workshops against the target of 18 workshops in thisoutput.
Professional & technicalsupport & client servicesIn assisting other organs of State with professional andtechnical advisory and support services, the target ofresponding within 5 days was exceeded when a responsetime of 4 days was achieved. The Chief Directorate hasoverachieved in rendering professional support to landreform programmes. The contribution that the ChiefDirectorate made to promote the African Agenda is of highimportance. This was done through development projectssuch as the Mapping Africa for Africa and African GeodeticReference Frame (AFREF) projects. The overall contributionof this component and the completion of project tasks arerated at 98% against the target of 90%.
Strategic objectives
Provide fundamentalgeo-spatialinformation servicesto the nation
Outputs
Integrated SpatialReference Framework
Earth imagery (aerialphotography/satelliteimagery) covering thewhole country (1.22million km²)
Performance indicators
Percentage of availabilityat all times of permanentspatial reference pointsand positioning servicefrom TrigNet stations
Number of km² of earthimagery acquired by 31March
Targets 2008/2009
95% availability
High resolution:
220 000 km²;
(amended target:
190 000 km²) (1)
Medium resolution:
0 million km²
Actual
Target exceeded.Permanent spatial referencepoints: 99% availability Average uptime (availability)97.7% for post processingservices and 97.3% for realtime services.
Target not achieved.163 688 km² acquired. Thisis due to the delay in theawarding of tenders whichin turn resulted inphotography to be flownoutside of the windowperiod. A further factor waspoor weather conditions inLimpopo, KwaZulu-Nataland Mpumulanga.
Actual performance against targets

land a
ffair
s
DEPARTMENT OF LAND AFFAIRS: ANNUAL REPORT26
Strategic objectives
Provide fundamentalgeo-spatialinformation servicesto the nation(continued)
Participation inrelated land andagrarian reformactivities andprogrammes aimedat consolidation ofthe African Agenda
Outputs
Maps and other geo-spatial informationcovering the wholecountry (1.22 millionkm²)
Professional and technicalsupport and clientservices (other than landreform) to all spheres ofgovernment and otherorgans of State
Development projects forNEPAD, particularly inSADC (eg. AFREF,Mapping Africa forAfrica)
Performance indicators
Completion of theintegrated database offundamental geo-spatialinformation by 31 March2012, through thecapture and revision oftopographical data
Number of up-to-datemaps produced/revisedduring the year
Client satisfaction rating(out of 5)
Average number of daystaken to respond toclient’s request
Successful completion(%) of project tasksallocated, in accordancewith project plan forregional development
Participation rating of 3(out of 5) in regional andsub-regional structures asapproved (e.g.Committee onDevelopmentInformation; RegionalCentre for Mapping ofResources forDevelopment (RCMRD))
South Africa'smembership of RegionalCentre for Mapping ofResources forDevelopment (RCMRD)maintained
Targets 2008/2009
150 000 km²
1614 maps
Average rating of 3out of 5 in clientsurveys
5 days
90%
3
March 2009
Actual
159 375 km²Target exceeded.
2146 mapsTarget exceeded.
Average score received fromclients that have responded,is 4.Target exceeded.
4 daysTarget exceeded.
98%Target exceeded.
4.9 Target exceeded.
July 2008.Significant contributionmade. Target exceeded.
Actual performance against targets
(1) Target amended as a result of delays in the awarding of bids, which in turn resulted in aerial photography to be flown outsideof the window period. The programme of work therefore had to be reduced.

land affairs
1 APRIL 2008 - 31 MARCH 2009 27
P
part2P R O G R A M M A T I CC O N T E X T
3ProgrammeCadastral
SurveyManagement
PurposeThe Chief Directorate: Cadastral SurveyManagement aims to ensure that accuratecadastral surveys are carried out and toprovide cadastral information services insupport of land delivery and orderlydevelopment.
MeasurableobjectiveApproval, maintenance and archiving ofcadastral survey documents submitted by landsurveyors, supplying cadastral information andfacilitating the regulation of cadastral surveys,in order to support and facilitate land andeconomic development, with special emphasison land tenure reform.
Intended impactEach secure land right provides a source ofwealth, a negotiable asset and a platform forinvestment for the rights holder, thuscontributing to poverty alleviation and socio-economic development.
Service deliveryobjectives &indicatorsThe Chief Directorate is mandated to performits functions through the Land Survey Act,
1997 (Act No. 8 of 1997). This programmeconsists of a single subprogramme of thesame name, responsible for the following:
� Regulation of Surveyor-General’s offices� Examining and approving all surveys for
the registration of land and real rights� Maintaining cadastral survey records� Archiving all cadastral surveys� Compiling, maintaining and revising maps
of property boundaries� Providing cadastral advisory and spatial
information services.
A secure system ofcadastral surveysThe function of approval of cadastral surveys iscarried out in the six Offices of the Surveyors-General situated in Bloemfontein, Pretoria,Cape Town, Pietermaritzburg, Polokwane andNelspruit. Despite the continuing critical staffshortages in both the professional andtechnical categories, and the increasedworkload resulting from the boom in theproperty market, these Offices, with theexception of the newly created PolokwaneSurveyor-General Office, managed to limit theturnaround time to less than 20 working days.This is a world class performance as theinternational norm is between two and threemonths. This was achieved through thecontinued improvement of internaltechnological systems and procedures such asenhanced cadastral information system, auto-emailer and multi-media lodgement which
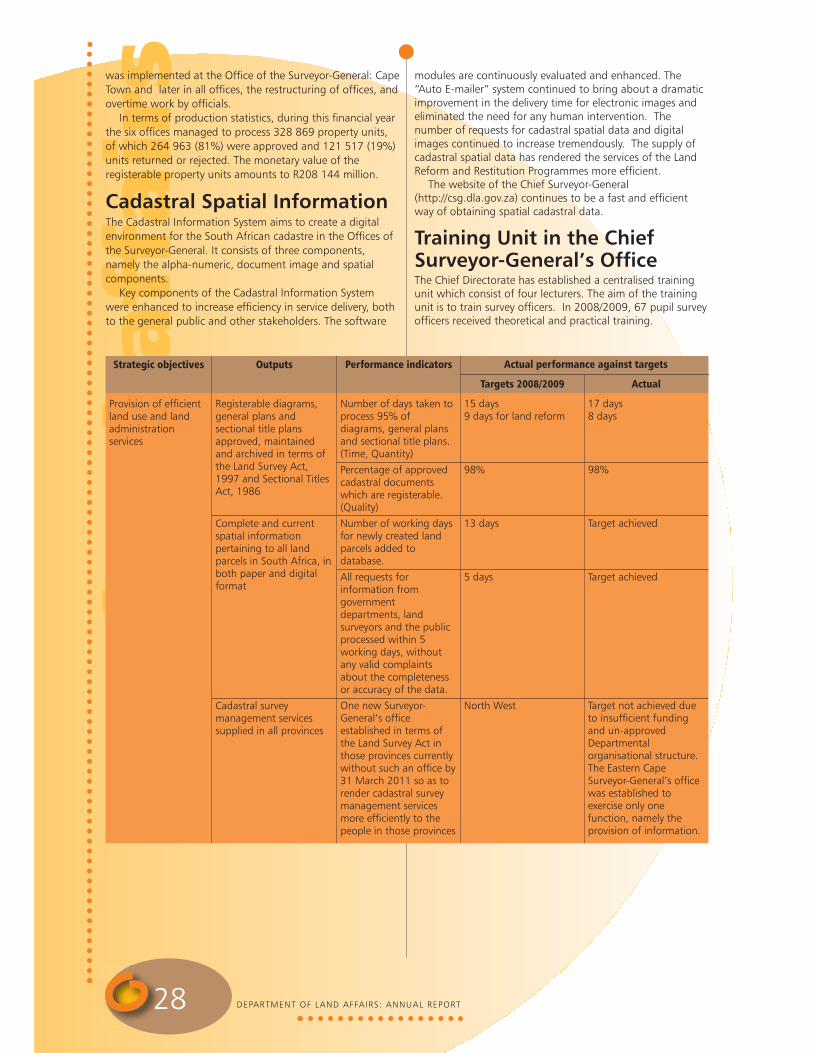
land a
ffair
s
DEPARTMENT OF LAND AFFAIRS: ANNUAL REPORT28
was implemented at the Office of the Surveyor-General: CapeTown and later in all offices, the restructuring of offices, andovertime work by officials.
In terms of production statistics, during this financial yearthe six offices managed to process 328 869 property units,of which 264 963 (81%) were approved and 121 517 (19%)units returned or rejected. The monetary value of theregisterable property units amounts to R208 144 million.
Cadastral Spatial InformationThe Cadastral Information System aims to create a digitalenvironment for the South African cadastre in the Offices ofthe Surveyor-General. It consists of three components,namely the alpha-numeric, document image and spatialcomponents.
Key components of the Cadastral Information Systemwere enhanced to increase efficiency in service delivery, bothto the general public and other stakeholders. The software
modules are continuously evaluated and enhanced. The“Auto E-mailer” system continued to bring about a dramaticimprovement in the delivery time for electronic images andeliminated the need for any human intervention. Thenumber of requests for cadastral spatial data and digitalimages continued to increase tremendously. The supply ofcadastral spatial data has rendered the services of the LandReform and Restitution Programmes more efficient.
The website of the Chief Surveyor-General(http://csg.dla.gov.za) continues to be a fast and efficientway of obtaining spatial cadastral data.
Training Unit in the ChiefSurveyor-General’s OfficeThe Chief Directorate has established a centralised trainingunit which consist of four lecturers. The aim of the trainingunit is to train survey officers. In 2008/2009, 67 pupil surveyofficers received theoretical and practical training.
Strategic objectives
Provision of efficientland use and landadministrationservices
Outputs
Registerable diagrams,general plans andsectional title plansapproved, maintainedand archived in terms ofthe Land Survey Act,1997 and Sectional TitlesAct, 1986
Complete and currentspatial informationpertaining to all landparcels in South Africa, inboth paper and digitalformat
Cadastral surveymanagement servicessupplied in all provinces
Performance indicators
Number of days taken toprocess 95% ofdiagrams, general plansand sectional title plans.(Time, Quantity)
Percentage of approvedcadastral documentswhich are registerable.(Quality)
Number of working daysfor newly created landparcels added todatabase.
All requests forinformation fromgovernmentdepartments, landsurveyors and the publicprocessed within 5working days, withoutany valid complaintsabout the completenessor accuracy of the data.
One new Surveyor-General’s officeestablished in terms ofthe Land Survey Act inthose provinces currentlywithout such an office by31 March 2011 so as torender cadastral surveymanagement servicesmore efficiently to thepeople in those provinces
Targets 2008/2009
15 days9 days for land reform
98%
13 days
5 days
North West
Actual
17 days8 days
98%
Target achieved
Target achieved
Target not achieved dueto insufficient fundingand un-approvedDepartmentalorganisational structure.The Eastern CapeSurveyor-General’s officewas established toexercise only onefunction, namely theprovision of information.
Actual performance against targets

land a
ffair
s
1 APRIL 2008 - 31 MARCH 2009 29
Strategic objectives
Provision of efficientland use and landadministrationservices (continued)
Development ofprogrammes forempowerment ofwomen, youth,people with disabilityand those living withHIV/AIDS as well asolder persons withinthe context of theDepartment’smandate
Outputs
Amended surveyinglegislation implementedto support government’saims and objectives oneconomic developmentand poverty reduction
Trained Professional LandSurveyors, ProfessionalSurveyors, SurveyTechnicians and SurveyOfficers from targetgroups
Performance indicators
Implement the SurveyingProfession Actpromulgated by 31October 2008 totransform the surveyingprofession.
Amend regulationsframed under LandSurvey Act 8 of 1997 soas to improve theefficiency of cadastralsurveys.
Number of candidatestrained.
Targets 2008/2009
June 2008 submission toParliament
November 2008
50 Pupil Survey Officers40 Interns (PLST & ST)
Actual
Legislation wasreprioritised and theSurveying Profession Billwas not included.
The new SurveyRegulations Board wasonly constituted at thebeginning of 2009. Theirfirst meeting is scheduledfor August 2009.
• 67 Pupil SurveyOfficers received in-house training onSurveyor-Generaloperations, as well aslectures on cadastralsurveys
• 11 Professional LandSurveyors wereemployed and receivedin-house training, aswell as training offeredby private landsurveyors
• 33 Survey Interns(Survey Technicians)received training inthree Surveyor-GeneralOffices.
Actual performance against targets

land
aff
airs
DEPARTMENT OF LAND AFFAIRS: ANNUAL REPORT30
4Programme Restitution
part2 P R O G R A M M A T I CC O N T E X T
PPurpose To take responsibility for the settlement ofland restitution claims in accordance with theprovisions of the Restitution of Land RightsAct, 1994 (Act No. 22 of 1994), and providesettlement support to beneficiaries.
MeasurableobjectiveResolve restitution claims within the targetperiod through negotiated settlements thatrestore land rights or award alternative formsof equitable redress to claimants.
Intended impact� Ensure land ownership by previous victims
of racial land dispossessions.� Poverty alleviation through sustainable
development on restored land as well asimproved livelihoods.
� Foster the rights of vulnerable groups interms of ownership and participation ineconomic agricultural activities.
OverviewDuring the year under review the Commissionon Restitution of Land Rights settled a total of653 claims inclusive of the 108 claims whichwere dismissed. This resulted in approximately394 000 hectares of land being approved forrestoration, affecting approximately 30 000
households. Cumulatively, the approvedhectares of land for restitution purposes since1995 is 2.47 million hectares.
A total amount of R3.5 billion wascommitted for the acquisition of land forrestitution beneficiaries. Compared to thehectares approved for transfer to beneficiaries,the amount approved for land purchases isindicative of the high cost of acquiring landfor land reform purposes.
Several agreements were concluded withstakeholders including the First National Bank,AgriSETA, the Development Bank of SouthernAfrica (DBSA), the Amahlathi ForestryCompany, as well as the Anglo Group. Greatprogress has been made with regard to theimplementation of the memoranda ofagreements signed with Mondi as well as theDepartment of Water Affairs and Forestry onthe settlement of forestry claims, and much ofthe deliverables in that regard will be reportedon in the forthcoming financial year.
The lack of skills on the part of beneficiariesremains a challenge with the implementationof land reform programmes. The agreemententered into with AgriSETA will ensure thatland reform beneficiaries receive the necessarytraining to enable them to make optimal useof the land restored to them.
The successful implementation of asustainable land reform programme relies oneffective collaborative initiatives involving roleplayers from the public and private sectors.Notwithstanding positive engagements with

land a
ffair
s
1 APRIL 2008 - 31 MARCH 2009 31
many strategic partners, the association with certainstrategic partners has not yielded the desired effect forrestitution beneficiaries. All such partnerships are currentlybeing reviewed in order to ensure that the Department andthe relevant land reform beneficiaries get value for moneyout of such relationships.
A review on all the projects where land has beentransferred to restitution beneficiaries has been concluded.Approximately 200 struggling projects have been identifiedfor recapitalization with funding from the Department ofAgriculture as part of the implementation of the Land andAgrarian Reform Programme (LARP).
The Commission is left with approximately 4 296 complexrural claims that are still outstanding. Four of the regionaloffices should however be finalising their claims by the endof the 2009/2010 financial year. These include the Gautengoffice, the Free State office, the Northern Cape office and theWestern Cape office.
Budget constraints also remain a challenge for theCommission, especially in view of the ever increasing landprices. The Commission will be seeking an audience withTreasury to explore ways in which the situation can beimproved.
Strategic objectives
To fast trackredistribution of 30%of white-ownedagricultural land by2014 for sustainableagriculturaldevelopment
Settlement of alloutstanding landclaims by 31 March2012
Outputs
Claimed/alternative landrestored to restitutionclaimants contributing tothe LARP Programme
All lodged restitutionclaims settled
Restitution memorials ineach Provincecommemorating claimssettled in that province
Settlement supportprocesses of land claimswith development aspectfacilitated to ensuresustainable development
Performance indicators
2 033 200 hectares ofland restored torestitution claimants forsustainable development
All the remaining 5 083(1)
land claims validated,gazetted, verified andsettled by 2011 in termsof the Restitution of LandRights Act, 22 of 1994
Restitution memorialserected in each Provincein terms of relevantlegislation in line withtourism corridors andcommemorating claimssettled in that province.
Implementation of the10 Year Strategy withrelevant stakeholders
Targets 2008/2009
1 034 000
389(2)
Strategy in place
Analysis andimplementation plan byJune 2008
Actual
394 755
653(545 settled & 108dismissed)
The project is ongoingand should be completedwithin the next threeyears. Challenges wereexperienced with regardto the appointment ofservice providers andbudgetary constraints.
Support is currently beingrendered in respect ofapproximately 560projects where land hasbeen restored with adevelopment aspect.Projects are beingimplemented andsettlement support isfacilitated with all therelevant stakeholders inline with the 10-yearstrategy. In order toensure sustainability ofprojects where land hasbeen handed over tobeneficiaries, close liaisonwith the ProvincialDepartments ofAgriculture is beingfostered.An improved focusedapproach has beenadopted to assist projectsthat are struggling.
Actual performance against targets

land a
ffair
s
DEPARTMENT OF LAND AFFAIRS: ANNUAL REPORT32
Strategic objectives
Settlement of alloutstanding landclaims by 31 March2012 (continued)
Outputs
Rights of vulnerablegroups protected in theresolution of land claims
Effective FinancialManagement and riskcontrol
Performance indicators
Strategy in place toensure the rights andinterests of vulnerablegroups i.e. femaleheaded households,youth, people withdisability, are adequatelyaddressed in thefinalisation of the claims
Financial controlsimplemented to minimiseall identified risks
Targets 2008/2009
July 2008
Unqualified Audit
Actual
The strategy has beencompleted.Implementation of thestrategy is ongoing.
Qualified audit on theinterest owed byconveyancers. (3)
Actual performance against targets
Explanatory notes:
(1) Internal auditing performed on the statistics on outstanding claims revealed that the correct figure for outstanding claims was5 083 instead of 4 891 as previously reported in the Departmental Strategic Plan. This error was the result of the incorrectcalculation in respect of the Pietersburg claims.
(2) The original target for the 2008/2009 financial year of 2 585 was revised in accordance with a management decision. Thefigure was initially set at 2 585 due to the envisaged closure of the Commission in December 2008. The revised target of 389claims is in line with the Commission’s extended tenure.
(3) The Auditor General reported an audit qualification consequent to poor systems for monitoring the collection of interest onfunds payable as a deposit on land acquisition and ensuring that supporting documentation is provided.

land affairs
1 APRIL 2008 - 31 MARCH 2009 33
5Programme Land &Tenure Reform
PPurposeProvide sustainable land reform programmesin South Africa.
MeasurableobjectiveEnsure that sustainable benefits of economicgrowth accrue to previously disadvantagedcommunities, groups and individuals.
Intended impactContribute to social and economicdevelopment through more equitable accessto land by all citizens.
IntroductionAs reflected in the 2008-2011 Strategic Planof the Department, the Branch: Land andTenure Reform initially had a nationalredistribution target of 1 500 000 hectares forthe 2008/2009 financial year, which was to beachieved through two sub-programmes,namely redistribution and tenure reform. Thistarget however was reduced to a target of608,060.0000 hectares in order to align itwith the actual budget allocation when itbecame apparent that the baseline allocationwas not to be increased. Despite theadjustment of the target, which was set aspart of the APEX of priorities, the Departmentcould not meet the revised target due to
among other reasons, the general escalationof land prices and the fact that certain land isvery expensive due to the nature thereof. TheBranch nevertheless spent almost 100% of thebudget allocated to it during the period underreview.
The Branch delivered a total of443,600.4886 hectares which is164,459.5114 hectares short of the revisedtarget. In the redistribution of the443,600.4886 hectares, a total of 501 projectswere finalised and 14 457 beneficiaries werereached through these projects.
All land acquired through the ProactiveLand Acquisition Strategy (PLAS) during the2008/2009 financial year, have been registeredin the name of the State. In certain instancesthe State provides potential beneficiaries withaccess to land by means of lease orcaretakership agreements until the land istransferred permanently to suitablebeneficiaries. Plans for the disposal of land topotential beneficiaries are being finalisedwhereafter such land will be transferred to thebeneficiaries in terms of the provisions of theLand Redistribution for AgriculturalDevelopment Grant (LRAD), the Settlementand Production Land Acquisition Grant(SPLAG) and/or the Commonage Grant(COMG). These grant systems are theprincipal funding models that are used underthe Land and Tenure Reform Programme.
Performance and delivery in terms of thesefunding models can be tabulated as follows:
part2P R O G R A M M A T I CC O N T E X T

land a
ffair
s
DEPARTMENT OF LAND AFFAIRS: ANNUAL REPORT34
As part of the amendment of the Department’sorganisational structure, the Branch: Land and TenureReform was divided into two Branches known as Region 1and Region 2, each consisting of the following provinces:
� Region 1: Eastern Cape, Gauteng, Mpumalanga,Northern Cape and Western Cape;
� Region 2: Free State, KwaZulu-Natal, Limpopo andNorth West, as well as the national office-based landreform components.
Region 1
Eastern Cape Provincial LandReform Office (ECPLRO)The initial target for the redistribution of land by the ECPLROwas 184,107 hectares. This target was adjusted to 75,000hectares and the actual delivery of the ECPLRO amounted to47,522.9434 hectares comprising of 59 projects and 772beneficiaries. However, the ECPLRO were unfortunately27,477.0566 hectares short of meeting their revised target.
Of the 47,522.9434 hectares delivered, a total of32,603.5142 hectares were land acquired through PLAS,while 14,919.4292 hectares comprised of land transferred toeither individual beneficiaries or municipalities in accordancewith the provisions of the LRAD, SPLAG, SLAG or COMGfunding models.
Gauteng Provincial Land ReformOffice (GPLRO)The GPLRO had an initial redistribution target of 48,565hectares of land, which had to be adjusted to 16,000hectares. The GPLRO however only delivered a total of2,554.5806 hectares and were therefore 13,445.4194hectares short of meeting the revised target.
The 2,554.5806 hectares delivered comprised of 16projects and 44 beneficiaries. All 2,554.5806 hectares areland acquired through PLAS.
Mpumalanga Provincial LandReform Office (MPLRO)The initial redistribution target of 189,237 hectares for theMPLRO was adjusted to 75,000 hectares. The MPLRO
finalised 65 projects, reaching 1 177 beneficiaries. Thisresulted in 52,272.6668 hectares of land being transferred.The MPLRO was 22,727.3332 hectares short of meetingtheir target.
Of the 52,272.6668 hectares delivered a total of37,025.8538 hectares were acquired through PLAS, while15,246.8130 hectares comprised of land transferred toeither individual beneficiaries or municipalities in accordancewith the provisions of the LRAD, SPLAG, SLAG or COMGfunding models.
Northern Cape Provincial LandReform Office (NCPLRO)A redistribution target of 329,107 hectares was initially setfor the NCPLRO, but had to be reduced to 140,000 hectares.The NCPLRO almost reached the target and delivered a totalof 125,362.5521 hectares and was therefore 14,637.4479hectares short of meeting the revised target. The Officefinalised 25 projects, involving 364 beneficiaries.
Of the 125,362.5521 hectares acquired, 44,247.6487hectares were acquired through PLAS and 81,114.9034hectares were land transferred to either individualbeneficiaries or municipalities in accordance with theprovisions of the LRAD, SPLAG, SLAG or COMG fundingmodels.
Western Cape Provincial LandReform Office (WCPLRO)In the case of the WCPLRO the initial redistribution target of154,107 hectares was revised to 60,000 hectares for the2008/2009 financial year. This Office managed toredistribute a total of 18,637.2954 hectares, consisting of 19projects and 1 719 beneficiaries. The WCPLRO was41,362.7046 hectares short of meeting their target.
The 18,637.2954 hectares delivered were acquiredthrough the LRAD and comprised of land transferred toeither individual beneficiaries or municipalities in accordancewith the provisions of the LRAD, SPLAG, SLAG or COMGfunding models.
No of beneficiariesProvince
Eastern Cape
Free State
Gauteng
KwaZulu-Natal
Limpopo
Mpumalanga
Northern Cape
North West
Western Cape
Total
LRAD/COM/SLAG/SPLAG
14,919.4292
8,727.3543
0.0000
59,528.4999
12,208.1997
15,246.8130
81,114.9034
6,231.7997
18,637.2954
216,614.2946
PLAS
32,603.5142
55,514.9262
2,554.5806
6,010.7311
2,392.3794
37,025.8538
44,247.6487
46,636.5600
0.0000
226,986.1940
Total
47,522.9434
64242.2805
2,554.5806
65,539.2310
14,600.5791
52,272.6668
125,362.5521
52,868.3597
18,637.2954
443,600.4886
LRAD/COM/SLAG/SPLAG
26
25
0
95
70
17
17
14
19
283
PLAS
33
73
16
20
3
48
8
16
0
217
Total
59
98
16
115
73
65
25
30
19
501
Indivi-duals
772
144
44
9 449
550
1 177
364
238
1719
14 457
Female
195
53
28
2 279
293
402
48
35
578
3 911
Farmwor-kers
59
42
0
258
164
0
232
1
993
1 749
Youth
153
40
9
1 755
215
446
46
27
0
2 691
Disab-led
2
0
0
91
6
0
1
0
563
663
Hectares No of projects
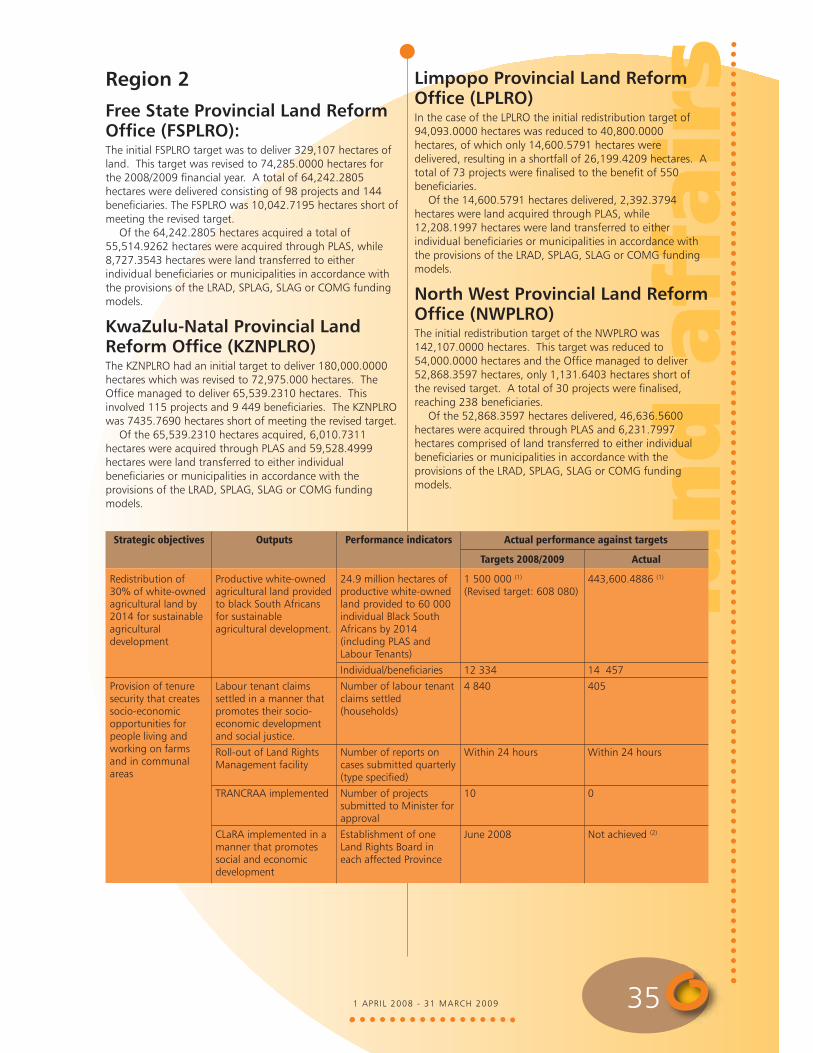
land a
ffair
s
1 APRIL 2008 - 31 MARCH 2009 35
Region 2
Free State Provincial Land ReformOffice (FSPLRO):The initial FSPLRO target was to deliver 329,107 hectares ofland. This target was revised to 74,285.0000 hectares forthe 2008/2009 financial year. A total of 64,242.2805hectares were delivered consisting of 98 projects and 144beneficiaries. The FSPLRO was 10,042.7195 hectares short ofmeeting the revised target.
Of the 64,242.2805 hectares acquired a total of55,514.9262 hectares were acquired through PLAS, while8,727.3543 hectares were land transferred to eitherindividual beneficiaries or municipalities in accordance withthe provisions of the LRAD, SPLAG, SLAG or COMG fundingmodels.
KwaZulu-Natal Provincial LandReform Office (KZNPLRO)The KZNPLRO had an initial target to deliver 180,000.0000hectares which was revised to 72,975.000 hectares. TheOffice managed to deliver 65,539.2310 hectares. Thisinvolved 115 projects and 9 449 beneficiaries. The KZNPLROwas 7435.7690 hectares short of meeting the revised target.
Of the 65,539.2310 hectares acquired, 6,010.7311hectares were acquired through PLAS and 59,528.4999hectares were land transferred to either individualbeneficiaries or municipalities in accordance with theprovisions of the LRAD, SPLAG, SLAG or COMG fundingmodels.
Limpopo Provincial Land ReformOffice (LPLRO)In the case of the LPLRO the initial redistribution target of94,093.0000 hectares was reduced to 40,800.0000hectares, of which only 14,600.5791 hectares weredelivered, resulting in a shortfall of 26,199.4209 hectares. Atotal of 73 projects were finalised to the benefit of 550beneficiaries.
Of the 14,600.5791 hectares delivered, 2,392.3794hectares were land acquired through PLAS, while12,208.1997 hectares were land transferred to eitherindividual beneficiaries or municipalities in accordance withthe provisions of the LRAD, SPLAG, SLAG or COMG fundingmodels.
North West Provincial Land ReformOffice (NWPLRO)The initial redistribution target of the NWPLRO was142,107.0000 hectares. This target was reduced to54,000.0000 hectares and the Office managed to deliver52,868.3597 hectares, only 1,131.6403 hectares short ofthe revised target. A total of 30 projects were finalised,reaching 238 beneficiaries.
Of the 52,868.3597 hectares delivered, 46,636.5600hectares were acquired through PLAS and 6,231.7997hectares comprised of land transferred to either individualbeneficiaries or municipalities in accordance with theprovisions of the LRAD, SPLAG, SLAG or COMG fundingmodels.
Strategic objectives
Redistribution of30% of white-ownedagricultural land by2014 for sustainableagriculturaldevelopment
Provision of tenuresecurity that createssocio-economicopportunities forpeople living andworking on farmsand in communalareas
Outputs
Productive white-ownedagricultural land providedto black South Africansfor sustainableagricultural development.
Labour tenant claimssettled in a manner thatpromotes their socio-economic developmentand social justice.
Roll-out of Land RightsManagement facility
TRANCRAA implemented
CLaRA implemented in amanner that promotessocial and economicdevelopment
Performance indicators
24.9 million hectares ofproductive white-ownedland provided to 60 000individual Black SouthAfricans by 2014(including PLAS andLabour Tenants)
Individual/beneficiaries
Number of labour tenantclaims settled(households)
Number of reports oncases submitted quarterly(type specified)
Number of projectssubmitted to Minister forapproval
Establishment of oneLand Rights Board ineach affected Province
Targets 2008/2009
1 500 000 (1)
(Revised target: 608 080)
12 334
4 840
Within 24 hours
10
June 2008
Actual
443,600.4886 (1)
14 457
405
Within 24 hours
0
Not achieved (2)
Actual performance against targets

land a
ffair
s
DEPARTMENT OF LAND AFFAIRS: ANNUAL REPORT36
Strategic objectives
Provision of land forsustainable humansettlements
Provision of efficientState landmanagement thatsupportsdevelopment
Outputs
Land acquired forsustainable humansettlements
State land proactivelyvested
National State LandAdministration Strategydeveloped
Performance indicators
Number of propertiestransferred tomunicipalities forintegrated settlement
Number of parcelssubmitted forconfirmation of vesting interms of Item 28(1)certificates within 30days
Availability date
Targets 2008/2009
34
2 370
June 2008
Actual
4
3 137
Not achieved (3)
Actual performance against targets
(1) The original target of 1 500 000 hectares was revised to 608 060 hectares in order to align it with the actual budget allocationwhen it became apparent that the baseline allocation was not to be increased. Unfortunately the revised target could not beachieved due to various reasons such as the general escalation of land prices.
(2) The court case on the Communal Land Rights Act, 2004 (Act No. 11 of 2004)(CLaRA) where four applicants brought anapplication in the Pretoria High Court to declare the provisions of CLaRA invalid and unconstitutional, has not been finalised.The matter was considered by the Court in October 2008, however judgment was reserved. The implementation of CLaRAdepends on the outcome of this case. In the meantime, the Department held extensive consultation workshops in 2008 withvarious stakeholders.
(3) The National Land Administration Strategy would have provided for vesting and disposal strategies, which would have beendeveloped with internal capacity. The Directorate: Public Land Support Services became overstretched as a result of a backlogin vesting requests that had to be attended to, the analysis of State land audit data and the provision of assistance to the LandClaims Commission with claims on State land. The Strategy is currently being developed together with the National andProvincial Departments of Public Works. The disposal component of the strategy also has to be reconsidered.

land affairs
1 APRIL 2008 - 31 MARCH 2009 37
6Programme SpatialPlanning &
Information
PPurposeProvide for national Land Use Management,Spatial Planning and Spatial InformationSystems
Measurableobjective Provision of legislative, institutional andtechnical skills support to regulate land usemanagement, spatial planning and spatialinformation management within the publicand private sectors
Intended impactMore effective land use management systems,spatially equitable and efficient settlementpatterns
AimThe Chief Directorate: Spatial Planning andInformation is responsible for establishing aneffective and efficient system of spatialplanning, land use management and a spatialinformation framework to support nationaldevelopment and land reform. The ChiefDirectorate is made up of the following sub-programmes:
� Management and Support Services: co-ordinates overarching projects of national
strategic significance and providesmanagement and administrative supportto all units of the Programme.
� Spatial Planning and Information: createsbetter land use systems that aresupported by spatial planning and spatialinformation.
� South African Council for Planners(SACPLAN): established in terms of thePlanning Profession Act, 2002 (Act No. 36of 2002), whose support is within themandate of the Department.
Sub-programme:Management &Support ServicesThe aim of this sub-programme is to provide amanagement service, administrative andfinancial support, as well as to ensure theestablishment of provincial offices and ensurecoordination and alignment of functionsbetween them and Head Office.
Since the functions of the Chief Directoratecannot be effectively executed without somedegree of decentralisation to bring servicescloser to the intended beneficiaries, anadditional five provincial offices were created.There are now spatial planning and/or spatialinformation services offices in all the provincesacross the country to deliver on the mandateof the Chief Directorate.
part2P R O G R A M M A T I CC O N T E X T

land a
ffair
s
DEPARTMENT OF LAND AFFAIRS: ANNUAL REPORT38
Sub-programme: SpatialPlanning & InformationSpatial Planning and Information is responsible forestablishing, implementing and monitoring spatial,environmental and land use planning and managementsystems for the country. It is also responsible for thecoordination and support of a national system for themanagement and exchange of spatially related informationwith strategic and operational perspectives.
Public hearings were held for the Land Use ManagementBill (LUMB), with the amended version being presented andsupported by the Portfolio Committee on Agriculture andLand Affairs. Although the Bill was scheduled to be debatedin the National Assembly, this has not yet materialised andthe Bill is still on hold in Parliament.
As required by the Planning Profession Act, 2002 (Act No.36 of 2002), technical and financial support to the SouthAfrican Council for Planners (SACPLAN) has been provided.
Furthermore, the functions of SACPLAN were reviewed toensure compliance with the Act and a draft report in thisregard is available.
Workshops were held in all provinces to obtain inputsfrom the public in respect of the proposed regulations to beissued in terms of the Spatial Data Infrastructure Act, 2003(Act No. 54 of 2003). The inputs were considered andincorporated in a draft document which is currently beingreviewed by a legal team, to ensure it is aligned to andmeets the required standards. The appointment of newmembers to the Committee for Spatial Information is at anadvanced stage. The appointment of nominated membershas been approved and the names of members are to begazetted.
The Consolidated Environmental ImplementationManagement Plan (CEIMP) report has been finalised. It waspresented to and adopted by the Committee forEnvironmental Coordination (CEC) set up in terms of theNational Environmental Management Act, 1998 (Act No.107 of 1998).
Strategic objectives
Provision ofefficient land useand landadministrationservices
Outputs
Develop, implementand monitorlegislation,regulations andguidelines
Performance indicators
Land Use ManagementAct (LUMA) regulationsdeveloped
Spatial DataInfrastructure Act (SDI)regulations developed
National GeographicInformation Systems(GIS) Strategy developed
Spatial MetaDataDiscovery (SMD) portalestablished
Targets 2008/2009
December 2008
December 2008
November 2008
November 2008
Actual
Not achieved.Public hearings on the Land UseManagement Bill (LUMB) were held inJuly 2008 and these informedamendments to LUMB which werepresented to the Portfolio Committeeon Agriculture and Land Affairs. ThePortfolio Committee supported the Billand although it was scheduled fordebate in the National Assembly, thisdid not materialise. The Bill is currentlyon hold in Parliament. The regulationscan only be finalised once Parliamenthas adopted the Bill.
Not achieved.The draft regulations in terms of theSpatial Data Infrastructure Act, 2003(Act No. 54 of 2003), are currentlybeing edited for legal compliancebefore formal publication for publiccomments.
Not achieved.Due to capacity constraints, it wasdecided to outsource the drafting ofthe strategy. Two briefing sessionswere held but no suitable serviceprovider could be found during theevaluation of proposals. The strategy isnow being developed in-house.
Achieved.The project has reached the final stageof Beta testing and is to be deployed toprovinces.
Actual performance against targets

land a
ffair
s
1 APRIL 2008 - 31 MARCH 2009 39
Strategic objectives
Provision ofefficient land useand landadministrationservices (continued)
Outputs
Develop, implementand monitorlegislation,regulations andguidelines(continued)
Provide technicalskills and services atprovincial andmunicipal level
Performance indicators
National land usemonitoring frameworkdeveloped
Establish offices in thefive remaining provinces
Formulation of SpatialDevelopmentFrameworks (SDFs) andLand Use ManagementSystems (LUMS)supported
GIS capacity building inmunicipalities supported
Targets 2008/2009
November 2008
February 2009
Comply with IDPcycles
11 months frominception
Actual
Target partially achieved.The Settlement Growth Patterns (SGP)project is being reviewed. There is aneed to capture the study results in GISformat. The SGP will form part of theenvisaged framework, with three pilotcities chosen to update the study.Information is still being obtained andthe relevant mapping is beingcompiled. The terms of reference forthe Land Use Monitoring Frameworkwere developed.
Additional offices were establishedin the Free State, Western Cape,North West, Gauteng andMpumalanga.
Target achieved.• Evaluated two LUMS for Thembisile
and Dr J S Moroka municipalities.• Evaluated SDFs for Dipaliseng,
Mkhondo, Vhembe district,Maruleng, Fetakgomo, LepelleNkumpi, Aganang, Sekhukhune,Elias Motsoaledi, MakhuduThamaga, Giyani, Molemole, GreaterLetaba and Lekwa municipalities.
• Evaluation of SDF for Albert Luthuliand Pixley ka Seme municipalitiescarried out.
• Currently providing technical supportin respect of the development of theGert Sibande district municipality,Lephalale, Mogalakwena andBlouberg municipalities.
• Participated in the Nkangala districtmunicipality, Gert Sibande districtmunicipality and Ehlanzeni districtmunicipality’s IDP assessmentprocess.
• Terms of reference have beendeveloped to assist the Ingquza Hilllocal municipality with its SDF.
Target achieved. • GIS implementation in Sekhukhune
district municipality: user needs analysis developed.
• Assisting Bushbuckridge andDipaleseng in the development ofGIS as part of the SDF support.
• Spatial data is available via thespatial data warehouse; updateArcGIS Server software to the latestservice pack.
• Spatial data is available as a webservice over the intranet.
• A training manual is being developedin support of the GIS in Schoolsproject.
• Participation and contribution to GISforums.
Actual performance against targets
land
aff
airs
DEPARTMENT OF LAND AFFAIRS: ANNUAL REPORT40
7Programme DeedsRegistration
part2 P R O G R A M M A T I CC O N T E X T
PPurposeTo provide efficient land use and landadministration services.
Measurableobjective To provide a high quality deeds registrationsystem whereby secure titles are registeredand speedy and accurate information isprovided.
Service deliveryobjectives &indicators The Microfilm Camera Replacement Projectwas completed and day-to-day scanning isnow being done in all Deeds Registries. Thishad a considerable reduction in the delivery ofregistered deeds from three months to 14days. The server storage for the DeedsRegistries at Kimberley, Vryburg and Umtatawas upgraded to accommodate the day-to-day scanning.
The progressive introduction of e-Cadastrewhich is aimed at reducing deeds registrationturnaround times will be implemented overthe MTEF period. A phased approach will befollowed which includes the implementationof an enterprise architecture which willultimately result in the consolidation of
cadastral and deeds data stores and the back-scanning of all the paper records, for purposesof the digitisation of the archives. The projecthas been put on hold due to the unavailabilityof funds. Server storage will also be upgradedto accommodate the increase in records as aresult of the back-scanning. This project willalso facilitate the rationalisation of the areas ofjurisdiction for the Deeds Registries of Pretoria,Limpopo, Cape Town, Umtata, Vryburg andKimberley.
Core functionsThe core functions of the Chief Directorate:Deeds Registration and the 10 Deeds Registriesare as follows:
� To register real rights in land� To maintain a public land register� To provide registration information� To maintain an archive of registration
recordsThe details regarding these functions are as
follows:
Registration of land & realrights in land The Deeds Registries Act, 1937 (Act No. 47 of1937), and the Sectional Titles Act, 1986 (ActNo. 95 of 1986) require that deeds anddocuments be prepared and lodged in aDeeds Registry by a Conveyancer or Notarypublic. These deeds and documents aresubjected to three levels of examination by

land a
ffair
s
1 APRIL 2008 - 31 MARCH 2009 41
legally qualified personnel who scrutinise the contents foraccuracy and compliance with common law, case law andstatutory law. In addition, examiners ensure that appropriateeffect is given to Orders of Court, caveats and interdictsrecorded in the Deeds Registry, where applicable. Security oftitle is not guaranteed by law in South Africa. Instead, the
system of examination described above, together with thechecks and balances which form an integral part of theregistration system, provide the holder of a title deedregistered in a South African Deeds Registry with anindisputable right which is recognised and respected by theCourts, financial institutions and the public at large.
� Section 7 of the Deeds Registries Act obliges a Registrarof Deeds to permit any person, upon payment of theprescribed fees, to inspect the public registers in a DeedsRegistry and to make copies of records of such Registry.
� The Deeds Registries' electronic information system,DeedsWeb, provides electronic access to registrationinformation from anywhere in the world via the internet.
The demand for registration information continues toincrease. During the 2008/2009 financial year, a total of17 384 105 electronic information requests were processedby the Chief Directorate’s information systems. This amountsto a 6,71% increase in requests from the previous financialyear.
DeedsWeb information searchesApr May Jun Jul Aug Sep Oct Nov Dec Jan Feb Mar
2007/2008 1 166 390 1 508 408 1 295 332 1 421 897 1 436 034 1 227 071 1 499 978 1 421 741 1 179 351 1 290 082 1 496 348 1 348 735
2008/2009 1 417 205 1 388 697 1 521 577 1 482 184 1 390 761 1 428 267 1 551 975 1 344 895 862 585 1 182 907 1 382 676 2 430 376
Total number of registered land parcels on the Deeds RegistrationSystem database
# Database not complete – still under construction.
$ The increase in land parcels varies due to subdivisions, consolidations and new buildings registered in different Deeds Registries.
Deeds Registry
Pretoria
Cape Town
Johannesburg
Pietermaritzburg
Bloemfontein
Kimberley
King William's Town
Vryburg
Umtata #
Mpumalanga
As at 31 March 2009$
As at 31 March 2008
Township Erven
1 609 429
1 781 335
982 270
919 833
556 931
86 144
189 497
86 551
66 893
448 910
6 727 7936 594 505
Sectional Title Units
262 916
211 210
149 880
153 354
29 195
831
6 934
696
22
12 895
827 933777 094
AgriculturalHoldings
42 562
0
0
0
7 038
1 153
0
4 100
0
3 757
58 61058 877
Farms
168 258
139 683
0
92 543
60 426
5 110
11 687
10 593
2 137
44 926
535 363 531 160
Total
2 083 165
2 132 228
1 132 150
1 165 730
653 590
93 238
208 118
101 940
69 052
510 488
8 149 699 7 961 636
Provision of registration information
Document Copy System (DCS) & Image Copy System (ICS) requestsApr May Jun Jul Aug Sep Oct Nov Dec Jan Feb Mar
DCS 2007/2008 16 339 21 846 11 617 20 382 21 517 12 962 17 487 12 507 7 205 6 742 8 601 7 038
ICS 2007/2008 7 430 11 128 2 271 4 662 6 006 6 154
TOTAL 2007/2008 16 339 21 846 11 617 20 382 21 517 12 962 24 917 23 635 9 476 11 404 14 607 13 192
Apr May Jun Jul Aug Sep Oct Nov Dec Jan Feb Mar
DCS 2008/2009 7 401 6 741 7 303 9 242 9 050 8 608 9 285 7 402 4 844 5 098 8 148 8 697
ICS 2008/2009 6 045 6 300 7 856 9 581 9 555 10 336 11 644 10 146 6 715 9 374 11 090 11 542
TOTAL 2008/2009 13 446 13 041 15 159 18 823 18 605 18 944 20 929 17 548 11 559 14 472 19 238 20 239
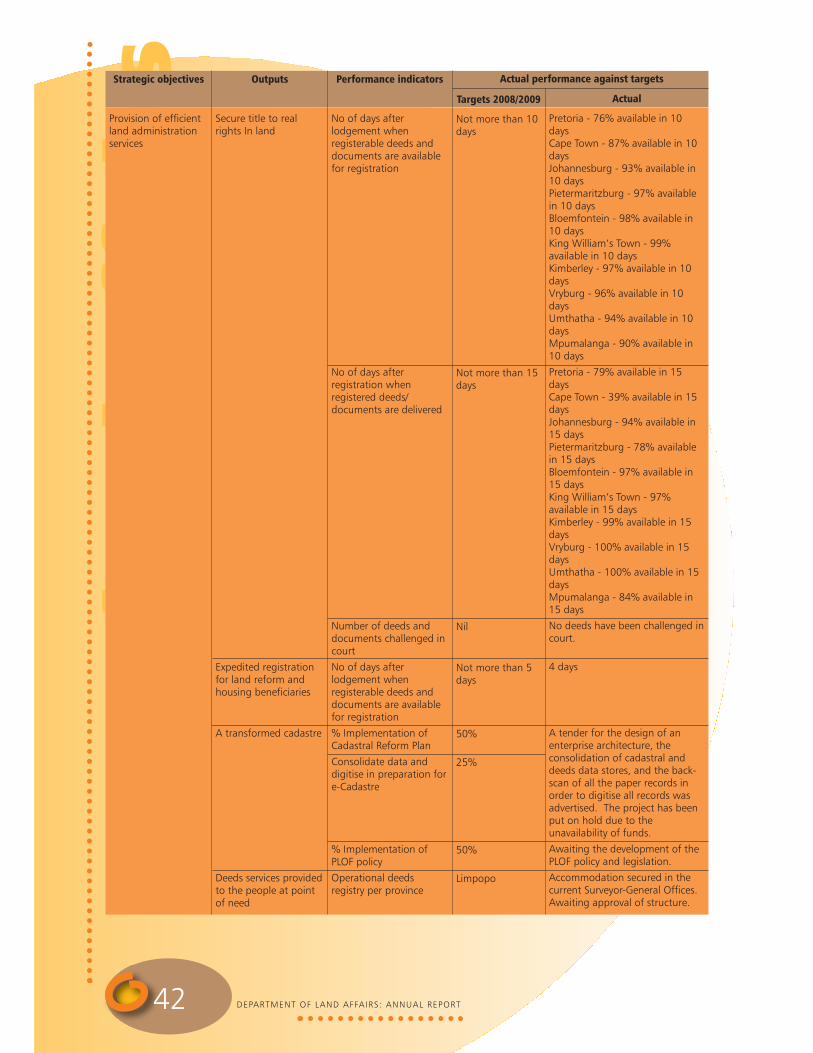
land a
ffair
s
DEPARTMENT OF LAND AFFAIRS: ANNUAL REPORT42
Strategic objectives
Provision of efficientland administrationservices
Outputs
Secure title to realrights In land
Expedited registrationfor land reform andhousing beneficiaries
A transformed cadastre
Deeds services providedto the people at pointof need
Performance indicators
No of days afterlodgement whenregisterable deeds anddocuments are availablefor registration
No of days afterregistration whenregistered deeds/documents are delivered
Number of deeds anddocuments challenged incourt
No of days afterlodgement whenregisterable deeds anddocuments are availablefor registration
% Implementation ofCadastral Reform Plan
Consolidate data anddigitise in preparation fore-Cadastre
% Implementation ofPLOF policy
Operational deedsregistry per province
Targets 2008/2009
Not more than 10days
Not more than 15days
Nil
Not more than 5days
50%
25%
50%
Limpopo
Actual
Pretoria - 76% available in 10daysCape Town - 87% available in 10daysJohannesburg - 93% available in10 daysPietermaritzburg - 97% availablein 10 daysBloemfontein - 98% available in10 daysKing William’s Town - 99%available in 10 daysKimberley - 97% available in 10daysVryburg - 96% available in 10daysUmthatha - 94% available in 10daysMpumalanga - 90% available in10 days
Pretoria - 79% available in 15daysCape Town - 39% available in 15daysJohannesburg - 94% available in15 daysPietermaritzburg - 78% availablein 15 daysBloemfontein - 97% available in15 daysKing William’s Town - 97%available in 15 daysKimberley - 99% available in 15daysVryburg - 100% available in 15daysUmthatha - 100% available in 15daysMpumalanga - 84% available in15 days
No deeds have been challenged incourt.
4 days
A tender for the design of anenterprise architecture, theconsolidation of cadastral anddeeds data stores, and the back-scan of all the paper records inorder to digitise all records wasadvertised. The project has beenput on hold due to theunavailability of funds.
Awaiting the development of thePLOF policy and legislation.
Accommodation secured in thecurrent Surveyor-General Offices.Awaiting approval of structure.
Actual performance against targets
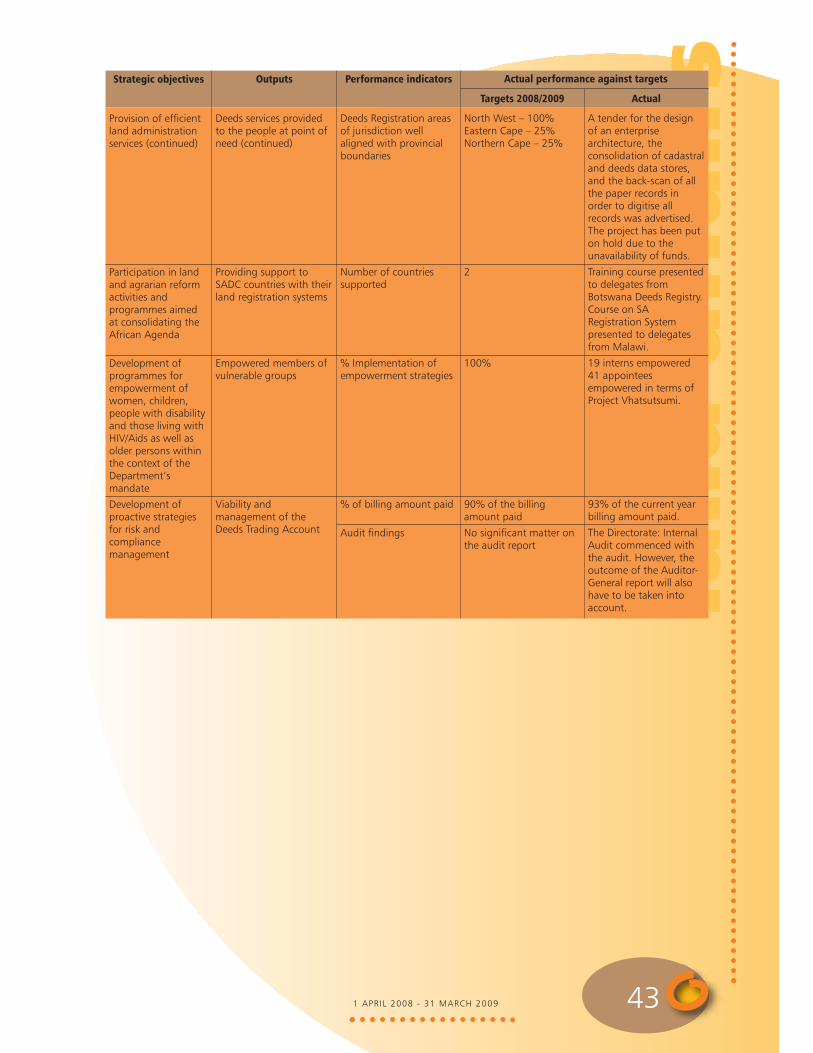
land a
ffair
s
1 APRIL 2008 - 31 MARCH 2009 43
Strategic objectives
Provision of efficientland administrationservices (continued)
Participation in landand agrarian reformactivities andprogrammes aimedat consolidating theAfrican Agenda
Development ofprogrammes forempowerment ofwomen, children,people with disabilityand those living withHIV/Aids as well asolder persons withinthe context of theDepartment’smandate
Development ofproactive strategiesfor risk andcompliancemanagement
Outputs
Deeds services providedto the people at point ofneed (continued)
Providing support toSADC countries with theirland registration systems
Empowered members ofvulnerable groups
Viability andmanagement of theDeeds Trading Account
Performance indicators
Deeds Registration areasof jurisdiction wellaligned with provincialboundaries
Number of countriessupported
% Implementation ofempowerment strategies
% of billing amount paid
Audit findings
Targets 2008/2009
North West – 100%Eastern Cape – 25%Northern Cape – 25%
2
100%
90% of the billingamount paid
No significant matter onthe audit report
Actual
A tender for the designof an enterprisearchitecture, theconsolidation of cadastraland deeds data stores,and the back-scan of allthe paper records inorder to digitise allrecords was advertised.The project has been puton hold due to theunavailability of funds.
Training course presentedto delegates fromBotswana Deeds Registry.Course on SARegistration Systempresented to delegatesfrom Malawi.
19 interns empowered41 appointeesempowered in terms ofProject Vhatsutsumi.
93% of the current yearbilling amount paid.
The Directorate: InternalAudit commenced withthe audit. However, theoutcome of the Auditor-General report will alsohave to be taken intoaccount.
Actual performance against targets
land
aff
airs 3
P A R T 3 R E P O R TO F T H EA U D I TC O M M I T T E E
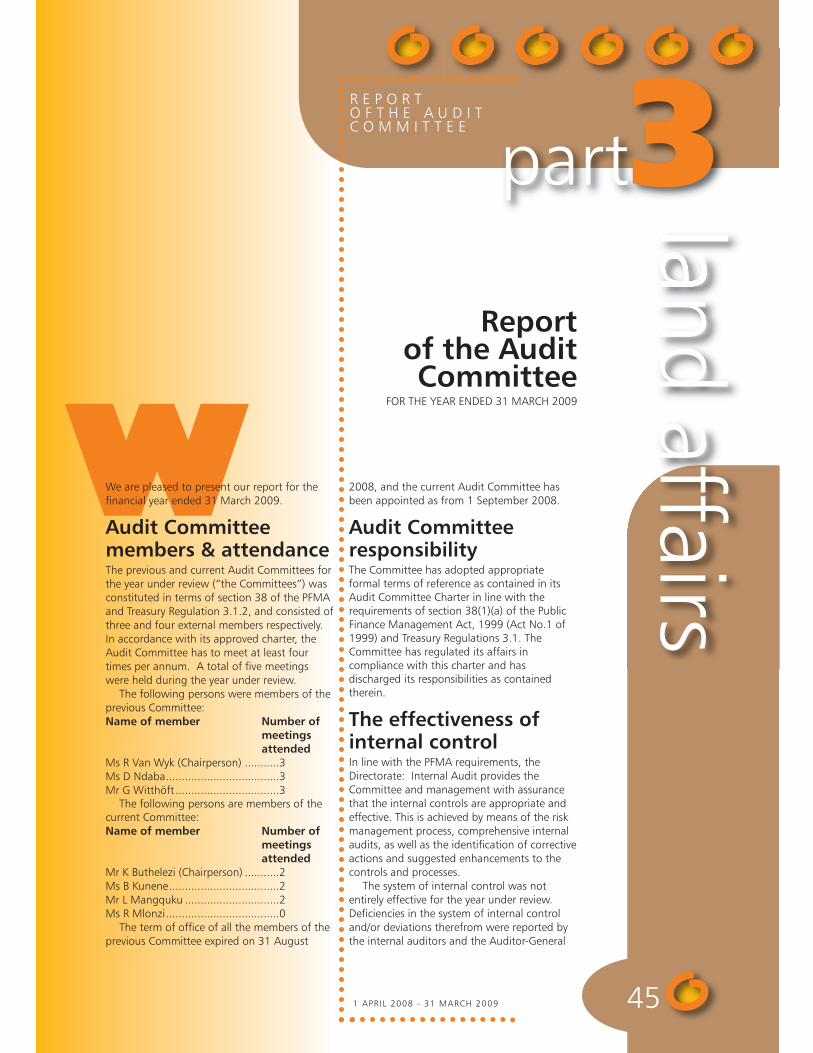
land affairs
1 APRIL 2008 - 31 MARCH 2009 45
W
part3R E P O R TO F T H E A U D I TC O M M I T T E E
Reportof the AuditCommittee
FOR THE YEAR ENDED 31 MARCH 2009
We are pleased to present our report for thefinancial year ended 31 March 2009.
Audit Committeemembers & attendanceThe previous and current Audit Committees forthe year under review (“the Committees”) wasconstituted in terms of section 38 of the PFMAand Treasury Regulation 3.1.2, and consisted ofthree and four external members respectively.In accordance with its approved charter, theAudit Committee has to meet at least fourtimes per annum. A total of five meetingswere held during the year under review.
The following persons were members of theprevious Committee:Name of member Number of
meetingsattended
Ms R Van Wyk (Chairperson) ...........3Ms D Ndaba....................................3Mr G Witthöft .................................3
The following persons are members of thecurrent Committee:Name of member Number of
meetingsattended
Mr K Buthelezi (Chairperson) ...........2Ms B Kunene...................................2Mr L Mangquku ..............................2Ms R Mlonzi....................................0
The term of office of all the members of theprevious Committee expired on 31 August
2008, and the current Audit Committee hasbeen appointed as from 1 September 2008.
Audit CommitteeresponsibilityThe Committee has adopted appropriateformal terms of reference as contained in itsAudit Committee Charter in line with therequirements of section 38(1)(a) of the PublicFinance Management Act, 1999 (Act No.1 of1999) and Treasury Regulations 3.1. TheCommittee has regulated its affairs incompliance with this charter and hasdischarged its responsibilities as containedtherein.
The effectiveness ofinternal controlIn line with the PFMA requirements, theDirectorate: Internal Audit provides theCommittee and management with assurancethat the internal controls are appropriate andeffective. This is achieved by means of the riskmanagement process, comprehensive internalaudits, as well as the identification of correctiveactions and suggested enhancements to thecontrols and processes.
The system of internal control was notentirely effective for the year under review.Deficiencies in the system of internal controland/or deviations therefrom were reported bythe internal auditors and the Auditor-General
land a
ffair
s
DEPARTMENT OF LAND AFFAIRS: ANNUAL REPORT46
South Africa. In certain instances, the matters reportedpreviously have not been fully and satisfactorily addressed.
The Audit Committee has noted with concern the issuesraised in the report of the Auditor-General. The AuditCommittee has tasked management to prepare acomprehensive plan to indicate how the Department willaddress the issues and report progress regularly to theCommittee. Management has embarked on the process ofaddressing these issues with immediate effect, these includeinter alia:
� Verification of performance information against theDepartment’s business plan and Branch business plans.
� Physical verification of assets against the asset register.The delays in receiving management comments on
internal and external audit reports have been noted by theAudit Committee and management has made a commitmentto address these shortcomings.
The Committee has noted the improvement of the overallreporting of the Department which has enabled the AuditCommittee to fulfill its oversight role on audit, risk andoverall governance processes.
Evaluation of financialstatementsThe Committee has
� Reviewed and discussed the Department of Land Affairsand Deeds Registration Trading Account’s annualfinancial statements to be included in the annual report,with the Auditor-General South Africa, the AccountingOfficer and management;
� Reviewed the Auditor-General’s management letters andmanagement’s response thereto;
� Reviewed and discussed the reports and audit opinionsof the Auditor-General with the Auditor-General andmanagement;
� Reviewed possible changes in accounting policies andpractices; and
� Reviewed significant adjustments resulting from theaudit.
We concur with and accept the Auditor-General of SouthAfrica’s reports on the Department of Land Affairs andDeeds Registration Trading Account’s annual financialstatements, and are of the opinion that the audited annualfinancial statements should be accepted read together withthe reports of the Auditor-General South Africa.
Internal AuditWe are satisfied that the internal audit function is operatingeffectively and that it has addressed the risks pertinent to theDepartment in its audits. Internal Audit has made significantprogress with audits conducted in terms of its three-yearrolling plan, as well as with the forensic and specialinvestigations that were performed in addition to the plan.Capacity building is still posing a challenge to the internalaudit function and therefore co-sourcing has been used asan interim measure.
Auditor-General South AfricaWe have met with the Auditor-General South Africa toensure that there are no unresolved issues.
Mr K ButheleziChairperson of the Audit Committee
Date: 31 July 2009

land affairs
4P A R T 4 A N N U A L F I N A N C I A L
S T A T E M E N T S

land
aff
airs
DEPARTMENT OF LAND AFFAIRS: ANNUAL REPORT48
G
part4 A N N U A LF I N A N C I A L
S T A T E M E N T S
Report of theAccounting
Officer
1. General review ofthe state of financialaffairs
1.1 Important policydecisions andstrategic issues facingthe Department
The Proactive Land AcquisitionStrategy [PLAS]The Department introduced the Proactive LandAcquisition Strategy (PLAS) during the2006/2007 financial year. The PLAS providesfor the acquisition of strategic land in terms oflocation and quality and is held by the Statewhilst the prospective beneficiaries are eitherbeing screened or still being identified. As theland temporarily becomes a State asset, theDepartment becomes obliged to manage it ina manner consistent with the provisions of thePublic Finance Management Act, 1999 (ActNo. 1 of 1999).
A number of accounting challenges aroseduring the 2006/2007 and 2007/2008financial years, which resulted in theDepartment receiving a qualified audit onPLAS assets during the 2007/2008 financialyear. This resulted, in the main, from the
absence of proper financial and accountingsystems and also from the lack of clarity in thelegislation regarding the powers of theMinister. The Department consequentlyinitiated legislative amendments whichresulted in the amendment of the Provision ofLand and Assistance Act, 1993 (Act No. 126of 1993), through the promulgation of theProvision of Land and Assistance AmendmentAct, 2008 (Act No. 58 of 2008) which cameinto operation on 9 January 2009.
The significance of the amendments is thatthey clearly empower the Minister to acquireproperty, maintain and improve such property.This makes it possible for the Minister totransfer economically viable enterprises to landreform beneficiaries in order to afford them areasonable chance to succeed. Theamendments also provide for theestablishment of a Trading Entity which shallmaintain separate and itemised financialaccounts and accounting records in respect ofeach agricultural enterprise or separatelyadministered portion of immovable propertywhich it acquires, manages, disposes of, orleases.
The Trading Entity is in the process of beingestablished and will consist of the relevantfinancial management systems related toaccounting for the assets. This will assist theDirector-General in dealing with theaccounting weaknesses that led to thequalification.
FOR THE YEAR ENDED 31 MARCH 2009
land a
ffair
s
1 APRIL 2008 - 31 MARCH 2009 49
Finalisation of the restitution claimsAlthough the Commission on Restitution of Land Rights (theCommission) has managed to settle almost all urban claims,the challenge of finalising the remaining predominantly ruralclaims remains. The remaining claims are costly and complexin nature, and to this end, the Commission has realised thatit will not be in a position to wind down operations duringthe current Medium Term Expenditure Framework. Proposalshave already been submitted for an increased baseline inorder to meet the remaining financial obligations.
Non Compliance with applicablelegislation: Public Finance ManagementAct [PFMA] and Treasury Regulations[TR]: Section 76(4)(b) of the PFMA andChapter 8.2.3 of TR
AccrualsThe Deeds Registration Trading Account reported aforeseeable deficit as a result of a drastic drop in revenue.The Department took appropriate steps to address the deficitby transferring an amount of R54,8 million to augment thedeficit. This has resulted in non-payment of the accrual asdisclosed in note number 22 of the Annual FinancialStatements amounting to R19,9 million. The transfer offunds was approved by National Treasury.
Fruitless and wasteful expenditureFruitless expenditure of R4.8 million which was incurred inthe 2007/2008 financial year was discovered after thereporting date through internal investigations. This amounthas been disclosed in the financial statements as fruitless andwasteful expenditure. The matter is in the process offinalisation and will thereafter be referred to the humanresource management and legal services components for theimplementation of disciplinary procedures against therelevant officials.
Irregular expenditureAs disclosed in note number 26 of the Annual FinancialStatements, irregular expenditure amounting to R74.96million was incurred as a result of Parliament notretrospectively approving the amendments to the Provisionof Land and Assistance Act, 1993 (Act No. 126 of 1993).The former section 10(1)(a) of the Provision of Land andAssistance Act, 1993, empowered the Minister to acquireland only. The Department had acquired assets other thanland through the Pro-Active Land Acquisition Strategy. Asthese purchases did not constitute subsidies or advances tobeneficiaries, it fell outside the mandate provided by the saidAct.
1.2 Significant events that havetaken place during the year
1.2.1 Vacant PostsThe Department has not had a permanent Chief FinancialOfficer (CFO) since 1 October 2007. There is currently anacting CFO while the posts of Chief Director: FinancialManagement and Director: Financial Administration are alsovacant. The process of filling these posts is under way.
1.2.2 VPN ImplementationThe Department has successfully migrated its Wide AreaNetwork (WAN) services from the SITA shared GCCN networkto a much more secured Telkom Virtual Private Network(VPN) in January 2009.
The main objective of this WAN services migration was toenable the Department to control and manage its own WANservices to enable pro-active WAN monitoring as well asbandwidth management through quality of services whichthe Department could not previously implement on the SITAnetwork as it is shared with other government departments.
1.3 Major projects undertaken orcompleted during the year
Amended Structure of the DepartmentAs reported in the previous financial year, the Departmenthas successfully finalised the development of an amendedorganisational structure. The structure was approved by theprevious Minister for Agriculture and Land Affairs and wassupported by the Department of Public Service andAdministration. It is foreseen that the amended structure,once implemented, will contribute to the acceleration ofland reform.
1.4 Budget AllocationThe Department’s approved budget for the 2008/2009financial year, including adjustment estimates, amounted toR6,659 billion (compared to R5,928 billion in 2007/2008),representing an increase of 12% from the previous year’sadjusted budget. Approximately 89% of the total budget isallocated to the Land & Tenure Reform and Restitutionbranches as capital budget for land acquisition and relatedmatters.
1.5 Spending TrendsThe Department has managed to spend 99.9% of theadjusted budget (2007/2008: 99.5%).
The following table indicates a synopsis of the overallDepartmental performance:
2008/09 2007/08R’000 R’000
Final appropriation 6,66 billion 5,93 billion
Expenditure 6,66 billion 5,90 billion
Spending as a percentage ofappropriation 99,9% 99,5%
Unspent funds 4,7 million 30,8 million
Unspent funds as a percentage ofappropriation 0,1% 0,5%
The commendable spending performance of R6,66 billionis largely attributable to the initiatives put in place to fast-track the settlement of restitution claims, as well as theacquisition of land at large scale through PLAS forredistribution purposes.
Throughout the year the financial performance of theDepartment was closely monitored by the StrategicManagement Committee of the Department. Early warningsystems were also put in place to monitor spending.
land a
ffair
s
DEPARTMENT OF LAND AFFAIRS: ANNUAL REPORT50
The shifting of funds is mainly attributable to theaugmentation of the budget in Auxiliary and AssociatedServices for the Deeds Registration Trading Account and thereclassification of expenditure for PLAS under Programme 5:Land Reform. Funds were also shifted to Programme 4:Restitution to settle outstanding claims, to address over-expenditure under Programme 1: Property Management andProgramme 3 to address a shortfall under compensation.The virement was approved by the delegated authority inaccordance with Treasury Regulations and Public FinanceManagement Act, 1999.
Services rendered by the DepartmentIn line with its Service Delivery Commitment Charter andmandate, the Department provides the following services:
� Provision of access to land� Provision of rights in land� Settlement of land claims� Provision of settlement support� Production and supply of maps� Maintenance of the national control survey network� Registration of deeds� Supply of deeds registration information� Provision of spatial planning services� Approval of diagrams, general plans and sectional plans
for registration in a deeds registry
� Tariff policy� Tariffs for deeds registration, sale of maps and related
services are reviewed annually with the aim of recoveringsupplier costs.
Free servicesThe Department provides Map Trix Kits, Map Work TeachingAids and Map Packs to the Department of Education fordistribution to disadvantaged schools that teach Geography.
Inventories� The consumable inventory of the Department consists
mainly of stationary and printing material. The totalvalue of the closing balance as at 31 March 2009 wasR1,5 million (2007/2008 R2,5 million).
� The other main inventory consists of maps produced bythe Surveys and Mapping Programme which are sold tothe public and other government departments. Thetotal value of the balance of maps on hand as at 31March 2009 was R2,3 million (2007/2008: R2,7 million).
2. Capacity constraintsThe attrition rate for employees as at March 2009 was10.09% per annum. The reasons most often cited for leavingthe Department are:
� Better career opportunities;
Virement:The virement within the Department are as followsin R’000
Shift from
1. Administration
2. Surveys and Mapping
2. Surveys and Mapping
2. Surveys and Mapping
3. Cadastral Surveys
4. Restitution
4. Restitution
4. Restitution
5. Land Reform
5. Land Reform
6. Spatial Planning and Information
7. Auxiliary and Associated Services
Shift to
7. Auxiliary and Associated Services
1. Administration
3. Cadastral Surveys
7. Auxiliary and Associated Services
7. Auxiliary and Associated Services
1. Administration
5. Land Reform
7. Auxiliary and Associated Services
4. Restitution
7. Auxiliary and Associated Services
7. Auxiliary and Associated Services
1. Administration
AmountR’000
15,161
658
1,063
8,579
3,322
4,266
8,000
17,859
4,752
8,141
1,752
7,780
Programme 1
Programme 2
Programme 3
Programme 4
Programme 5
Programme 6
Programme 7
Total
Finalappropriation
R’000
426,554
98,085
137,937
3,638,611
1,593,471
22,018
11,593
5,928,269
Spending31/03/2008
R’000
424,994
97,257
137,616
3,638,465
1,571,073
21,836
6,256
5,897,497
Spent
%
99,6%
99,1%
99,7%
100%
98,6%
99,1%
53,9%
99,5%
Finalappropriation
R’000
453,442
72,044
116,384
3,124,781
2,800,713
34,834
57,198
6,659,396
Spending31/03/2009
R’000
453,316
71,875
116,306
3,122,148
2,799,539
34,256
57,196
6,654,636
Variance
R’000
126
169
78
2,633
1,174
578
2
4,760
Spent
%
99,9%
99,8%
99,9%
99,9%
99,9%
98,3%
100%
99,9%
2007/08 Financial year 2008/09 Financial year
Spending per Programme

land a
ffair
s
1 APRIL 2008 - 31 MARCH 2009 51
� a lack of career mobility (often resulting in job-hopping);and
� a lack of employment flexibility.As it is a challenge to source certain critical skills from the
external market, the Department improved its recruitmentstrategy to ensure that the best skills are recruited andretained. This contributed towards reducing the staffturnover rate.
The Department still faces challenges in addressing issuesof representivity in areas that require specialisedoccupational categories such as surveying, mapping,statistical analysis and land planning. The biggest challengein this regard is to offer competitive salaries that will attractthese individuals. Several initiatives have been put in place toaddress this challenge, including:
� A bursary programme for the recruitment of prospectiveemployees;
� entering into Memoranda of Understanding with tertiaryinstitutions i.e. Faculties of Engineering and the BuiltEnvironment;
� training and development programmes throughcontinued specialisation and diversity within the sub-disciplines of the surveying profession;
� the provision of opportunities for experimental learning;and
� a retention strategy.The Department will design a succession plan aimed at
addressing the shortage of critical skills to ensure theappropriate replacement of key staff.
3. Utilisation of donor fundsThe balance of R1,85 million of the funds received from theBelgium Technical Assistance for Land Restitution for postsettlement and development support purposes was spent.Under the Aid Assistance Fund, R3,11 million was spentduring the year leaving a debit balance of R1,2 million.
4. Trading entities & publicentities
4.1 Trading entities – Registrationof Deeds Trading Account
The main purpose of the Deeds Registration Trading Accountis to finance the operating costs of the various DeedsRegistries responsible for the registration of conventionalbonds, sectional titles and leaseholds.
The main source of funding is fees charged on theregistration of deeds and on the sale of deeds information.Any deficit is accounted for by the Department as a sub-programme under Programme 7: Auxiliary and AssociatedServices.
The total audited revenue generated for the year underreview is R309,7 million which is 26% less than the auditedR418,9 million in 2007/2008. The decrease in revenue ismainly attributable to the decrease in bond registration andtransfer of property. The actual expenditure for the yearunder review is R367,6 million which is only 3% higher thanthe previous year. This increase is mainly attributable to thecredit note received as disclosed on note 20 of the AnnualFinancial Statements and the increase in legal expenses.During the year under review an amount of R54,8 million
was received from the Department to augment the projecteddeficit. The actual deficit was R53.0 million. The balance ofR1,8 million was disclosed in the statement of financialposition as Deferred Revenue and will be used to fundprojected deficit for the financial year 2009/2010.
4.2 Public entities
Inala FarmsInala Farms (Pty) Ltd is a property company founded by theDepartment to provide financial assistance in the form of aloan to certain land reform beneficiaries. To this end, theDepartment acquired land measuring 1 483 hectares inextent for R16,11 million on behalf of the beneficiaries withthe view that the latter would buy the property once theoperations company is self sustaining. The operations of thisproject were conducted through Inala Farming Company(Pty) Ltd (Opco). The workers, who are beneficiaries, formeda trust and acquired 25% of the shares in Opco financedthrough land acquisition grants. The acquired land was heldin Propco, with the Department being the sole shareholder.However, the Department’s shareholding was subsequentlyreduced to 75% when the former Managing Directorexercised his share option acquiring 25% shareholding.Operations are continuing satisfactorily with the beneficiariesstill on the farm.
The Regional Land Claims Commission: Mpumalanga is inthe process of purchasing certain claimed properties fromInala Farms for the purpose of settling restitution claimslodged by the Matsamo Community. Deeds of sale havebeen signed.
Ingonyama TrustThe Ingonyama Trust Board was established in terms of theKwaZulu-Natal Ingonyama Trust Act, 1994 (Act No. 3 of1994). The primary objective of the Trust is to manage theadministration of approximately 2.7 million hectares of landspread throughout the KwaZulu-Natal Province. The corebusiness of the Trust is to manage the land for the materialbenefit and social well-being of the individual members ofthe relevant tribes.
The Board is supported in its day-to-day activities by a fulltime Secretariat. The Secretariat’s work consists of thefollowing categories:
� Real estate management;� financial management; and� general administration.The Board meets every six weeks to formulate and review
policy related matters and to consider the approval of landrights for new development. The Board’s Annual Report forthe 2008/2009 financial year was drafted and submitted forapproval.
During the year under review an amount of R2 492 000was transferred by the Department as a transfer payment tothe Board for the management of the Trust. The full amountwas used during the year.
5. Transfer paymentsTransfer payments are made in the form of advances tomunicipalities who are appointed as implementing agents bythe Department. This cooperative arrangement serves tofacilitate the implementation of land reform and restitution
land a
ffair
s
DEPARTMENT OF LAND AFFAIRS: ANNUAL REPORT52
projects through the conclusion of agency agreements.These advances are only recognised as expenditure by theDepartment once the benefit has accrued to the relevantbeneficiaries.
A firm of attorneys, Cheadle Thompson and HaysomIncorporated (CTH), was appointed to coordinate legalrepresentation for farm dwellers that are either evicted orthreatened with eviction. This is done across the countrythrough the management of a panel of attorneys. To limitthe risk of not paying the attorneys’ accounts in time, it wasnecessary to make advance payments to CTH. Theseadvances are invested in an interest bearing account andinterest earned is disclosed and paid to the Department.
6. Public private partnerships(PPP)
The National Office PPP gained new momentum during theperiod under review. The Berea site has been purchased bythe Department of Public Works and the site handover is inprocess. The feasibility study was approved by NationalTreasury in September 2008 and the Request forQualification (RFQ) was issued later that month. The RFQwas evaluated and three bidders have been shortlisted toreceive the Request for Proposal (RFP) document. The worldfinancial crisis led to National Treasury issuing amendmentsto be included in the RFP and this process is under way.
7. Corporate governancearrangements
7.1 Risk managementRisk management in the Department is incorporated in thestrategic planning process and quarterly review andassessment meetings of the Department. Due to the factthat the post of risk manager was vacant for some time, theDirectorate: Internal Audit assisted in providing the riskmanagement service to the Department. During the yearunder review, process risk registers were prepared. The riskmanager was appointed in July 2008 however risk registerscould not be prepared for the entire Department due tocapacity constraints.
The Risk and Compliance Committee has been establishedto review and consider all the relevant policies and the riskprofile of the Department. The Committee consists of theDirector-General as chairperson, all Deputy Directors-Generaland certain other senior managers. Delegations areappropriately cascaded to relevant managers, while non-compliance issues are duly reported and addressed by theChief Financial Officer and the Accounting Officer.
7.2 Fraud prevention policiesAs part of the fraud prevention initiatives, the Departmentcontinuously conduct awareness workshops involving all theemployees. The Department has an active fraud and anti-corruption hotline that is hosted independently from theDepartment. Cases reported to this hotline are monitoredand investigated.
The authenticity of service providers is carefully verifiedfollowing all the supply chain management processes beforea contract is awarded. Other fraud prevention initiativesinclude the use of Departmental committees such as the Bid
Adjudication and Evaluation Committees, the InformationTechnology Committees and the Transport Committees fordecision making. It is however realised that due to thenature of decentralised services, particularly around supplychain management, the fraud prevention strategies needregular improvement. This includes the continuous trainingof supply chain management practitioners, the signing of asupply chain management code of conduct by suchpractitioners and all managers, fraud awareness workshopsand updated fraud risk registers.
7.3 Effectiveness of Internal AuditFunction & Audit Committee
Internal Audit provided assurance services and improved theDepartment’s systems of internal controls through effectiveinternal auditing. The three-year strategic rolling and annualinternal audit plans were adopted by the Audit Committee inthe first quarter of the financial year. Internal Audit executedthe projects of the annual audit plan as well as forensicinvestigations. A total of 31 forensic investigation caseswere reported to the Department. Of these, 12investigations were finalised by the end of the financial year.
Internal Audit experienced challenges with capacitybuilding and outsourced certain projects. They also assistedin the risk management function of the Department duringthe first quarter of the financial year.
The Audit Committee is in place and functions effectivelyas required by the Public Finance Management Act, 1999and Treasury Regulations. The current Audit Committeeassumed its duties in September 2008. There were fiveCommittee meetings during the 2008/2009 financial year(including meetings of the previous Audit Committee).
7.4 Management process forminimising conflict of interest
All senior managers of the Department are compelled toannually declare their financial interests to the Minister. It isfurthermore a requirement for members of the BidEvaluation and Bid Adjudication Committees to declare theirpossible interests before they are allowed to participate inbid processes. Supply chain management practitioners arecontinuously reminded about their code of conduct and areprovided with the relevant training in this regard.
7.5 Safety, health &environmental issues
The Directorate: Security Management Services is responsiblefor ensuring the implementation of safety and securitystandards and services throughout the Department. Thisincludes physical, document, communication, computer andsurveillance security. This is done to ensure a healthy andsafe working environment.
During 2008/2009 the Directorate focussed mainly onimproving physical security measures by standardisingsecurity operations for all Departmental offices. Physicalsecurity measures such as automated access control andCCTV camera systems were installed at certain Departmentaloffices.
The Department also maintains an effective fumigationand cleaning plan throughout the year and all buildings arefumigated on a quarterly basis.

land a
ffair
s
1 APRIL 2008 - 31 MARCH 2009 53
8. Discontinued activitiesThe Department did not have any discontinued activitiesduring the year under review.
9. New proposed activitiesDue to the amendment of the Land Reform: Provision ofLand and Assistance Act, 1993 (Act No. 126 of 1993), theDepartment is in the process of creating a trading entity tomanage all activities relating to PLAS.
10. Asset management
10.1 Departmental & PLAS assetsThe capital and non-capital assets that were procured duringthe 2008/2009 financial year were captured on the BAUDAsset Register. Compliance with the minimum requirementsof PLAS has been achieved, while compliance with the AssetManagement Reforms (AMR) milestones was also achieved.
10.2 Immovable assets In 1994 the Department of Land Affairs inherited immovableproperties which were formerly vested in the South AfricanDevelopment Trust (SADT), Self-governing Territories(Qwaqwa, Lebowa, KaNgwane, GaZankulu and KwaNdebele)and the independent States (Transkei, Bophuthatswana,Venda and Ciskei).
The said immovable properties currently comprises of 8479 land parcels which translates into 1 428 535.2198hectares of land that previously belonged to the mentionedindependent States. It further comprises of 12 009 landparcels which translates to 7 335 935.3090 hectares of landthat previously belonged to the Self-governing Territories andthe SADT.
A further 15 237 parcels of land have been surveyed butnot yet registered in the Deeds Registries. These land parcelscollectively account for 5 436 128.0477 hectares. TheDepartment’s total immovable property portfolio thereforeremains at 35 725 land parcels which translates into a totalof 14 200 598.5765 hectares. This total figure will fluctuateas properties under the custody of the Department getvested and transferred to other spheres of government or aredisposed to private parties, as well as when unsurveyed landis surveyed and registered in the name of the NationalGovernment and placed under the custody of theDepartment.
As the immovable property concerned was acquired priorto 1999, it has been disclosed at a value of R1.00 per landparcel. This in turn means a total value of R35 725.
The extent and value of the immovable property referredto above is accounted for in an Immovable Asset Register.The said register is however incomplete since there remains alot of unsurveyed land in the former Self-governingTerritories and Independent States. This land has recentlybeen identified and maps have been produced to helpfacilitate the surveying process. This is however acomplicated process since all State domestic facilities locatedon such land need to be identified and surveyed to ensurevesting in the correct sphere of government in compliancewith section 239 of the Constitution of the Republic ofSouth Africa, 1993 (Act No. 200 of 1993) and item 28(1) ofSchedule 6 to the Constitution of the Republic of South
Africa, 1996 (Act No. 108 of 1996). This is a real challengesince custodian departments are experiencing resourcerelated challenges. Unless this situation changes, auditorswill continuously express a qualified opinion on thecompleteness of the Immovable Asset Register of theDepartment as these properties cannot be vested until theyare surveyed.
The Department has also noticed that the ImmovableAsset Register is not completely accurate since certainproperties which have been vested in and transferred toprovincial departments, municipalities and private personshave not yet been removed from the register as a result ofcertain internal control weaknesses. This will be addressedbefore the end of the 2009/2010 financial year.
11. Events after thereporting date
The name of the Department has changed from Land Affairsto Rural Development and Land Reform.
Appointment of a new Minister &Deputy MinisterMr G Nkwinti was appointed as the Minister of RuralDevelopment and Land Reform, and Dr J Phaahla wasappointed as the Deputy Minister.
Forensic investigationThere was a forensic audit investigation on PLAS projectsafter the year-end which is still to be finalised. Asrecommended by the investigators, fruitless and wastefulexpenditure was disclosed on the Annual FinancialStatements as a post balance sheet event on the disclosurenote.
12. Performance informationThe operational and financial performance of theDepartment is monitored through various structures such asthe Strategic Management Committee which meets everythird week, Top Management meetings which are held everysecond month and the Quarterly Review and Assessmentmeetings.
The Directorate: Monitoring and Evaluation plays a pivotalrole in synthesising all the performance reports of theDepartment’s Branches and provides comprehensiveoverviews of the Department’s performance to the Director-General and senior management structures. Theseperformance reports are kept as authentic reports forinclusion in the Annual Financial Statements and for theassessment of individual managers.
Performance agreements and work plans are monitoredby the Directorate: Human Resource Management whileperformance assessments are conducted quarterly for juniorstaff and annually for senior managers.
13. Standing Committeeon Public Accounts(SCOPA) Resolutions
There were no SCOPA resolutions in respect of the Vote andthe Deeds Trading Account.

land a
ffair
s
DEPARTMENT OF LAND AFFAIRS: ANNUAL REPORT54
14. Prior modifications toaudit reports
Qualification
Rental Revenue Receivable – Leased LandThe Department has approved policies on Surveyor-Generaldebtors and Lease Revenue Management. A reconciliationof lease debtors was performed.
The Department is still experiencing certain challenges inrespect of the Powers of Attorney. The Department hasliaised with all the Provincial Departments of Agricultureduring the year under review and has undertaken anintensive process of manually compiling a register of all landmanaged through the Powers of Attorney.
The collection of revenue remains a challenge. There arestill certain fundamental principle issues regarding thefunding and maintenance of leased land that have to beresolved between the Department and the ProvincialDepartments of Agriculture.
15. Exemptions & deviationsreceived from NationalTreasury
The Department has applied for exemption in the 2008/2009financial year in respect of the Powers of Attorney, balanceof grants and advances paid to conveyancers. The requestedexemption was not granted. The Department was requestedto prepare relevant policies in this regard.
16. Other
16.1 Audit report on Pro-activeLand Acquisition Strategy(PLAS)
Due to the audit qualification on PLAS in 2007/2008, theDepartment appointed service providers to verify all assetsthat were acquired through PLAS. This was done to ensurethat accurate and complete information is available whenthe trading entity is established.
16.2 Advance payments toconveyancers
The Restitution of Land Rights Act, 1994 (Act No. 22 of1994), creates the means for the right to restitution orequitable redress as referred to in section 25(7) of theConstitution of the Republic of South Africa, 1996, to berealised.
The Restitution Act empowers the Minister of Land Affairsto purchase, acquire in any other manner, or expropriateland for a claim that meets the requirements of the Act, orto provide relief to a claimant who does not qualify for suchrestitution. Once acquired the land vests in the State andmust be transferred to a claimant once an agreement thatdisposes of the claim against the State has been reached.Reference is made to sections 42A, 42D and 42E of theRestitution Act. When land is acquired for restitution
purposes, a sale agreement is entered into. The purchaseprice of the land is payable as follows:
� 50% of the purchase price is paid into a conveyancer’strust account within 30 days of the signature date of thelast party signing. These funds are deposited by theconveyancer into an interest bearing account for thebenefit of the Department in terms of section 78(2A) ofthe Attorneys Act, 1979 (Act No. 53 of 1979).
� When the registration of transfer takes place, the first50% of the purchase price that was deposited by theconveyancer is recalled from the investment account andthe capital amount is payable to the seller.
� The second 50% of the purchase price is paid by theDepartment to the conveyancer, once registration oftransfer has taken place. These funds are payableimmediately by the conveyancer to the seller, subject tobond cancellation costs, if any. Interest reverts to theDepartment.
Control units are in the process of being establishedwithin the Commission on Restitution of Land Rights and theDepartment, to audit the payments received fromconveyancers and to recover the interest outstanding from2004. Schedules of all affected transactions have sincebeen drawn and the reconciliation process is ongoing. TheLegal Unit of the Commission sent letters of demand tovarious defaulting conveyancers which resulted in therecovery of a total of R34 million by 31 March 2009, ofwhich R18 million was received in the 2008/2009 financialyear.
After numerous meetings with the Auditor-General andNational Treasury, it was agreed to use an average interestrate based on the rates used by various financial institutions,as a basis for the outstanding interest on the first 50%.
In the case of conveyancers who have not respondedpositively to the letters of demand, the State Attorney hasbeen approached to institute legal action.
16.3 Balance of grants The Department has through the land reform redistributionprogramme a prime responsibility to provide the poor withland for settlement and productive use in order to improvetheir livelihoods and to contribute to the social andeconomic development of the country. In pursuit hereof theDepartment provides certain grants and services anddifferent land reform products such as land redistribution,land tenure reform and land development.
The provision of financial assistance for land reformpurposes is made possible by the Land Reform: Provision ofLand and Assistance Act, 1993 (Act No. 126 of 1993), theLand Reform (Labour Tenants) Act, 1996 (Act No. 3 of1996), and the Extension of Security of Tenure Act, 1997(Act No. 62 of 1997).
A balance of grant occurs where any part of the totalgrants was not used for the acquisition of land, planningcosts and/or goods and services. Although legally suchbalances belong to the beneficiaries, the Department doesnot transfer the funds to the beneficiaries due to reasonssuch as inefficient control and management.
The Department realised that currently there is noeffective system for producing a statement or record oftransactions including an age analysis to show the status ofsuch balances per project at any given point in time, and
land a
ffair
s
1 APRIL 2008 - 31 MARCH 2009 55
that in terms of good accounting principles such amountsshould be disclosed as commitments. An in-house balanceof grants financial system was therefore developed and isnow in use. All relevant financial reports will in future begenerated by this system, including statements and ageanalysis. The policy on Balance of Grants was approved.
17. ApprovalThe Annual Financial Statements set out on pages 66 to 96of this Annual Report have been approved by the AccountingOfficer.
MR T T GWANYADIRECTOR-GENERAL
31 May 2009
land
aff
airs
DEPARTMENT OF LAND AFFAIRS: ANNUAL REPORT56
part4 A N N U A LF I N A N C I A L
S T A T E M E N T S
Report by theAuditor-General
FOR THE YEAR ENDED 31 MARCH 2009
RReport of the Auditor-General to Parliamenton the financial statements and performanceinformation of Vote No. 27: Department ofLand Affairs for the year ended 31 March2009
Report on thefinancial statements
Introduction1. I have audited the accompanying financial
statements of the Department of LandAffairs (DLA) which comprise theappropriation statement, the statement offinancial position as at 31 March 2009,the statement of financial performance,the statement of changes in net assetsand the cash flow statement for the yearthen ended, a summary of significantaccounting policies and other explanatorynotes, and the accounting officer’s report,as set out on pages 48 to 55.
The accounting officer’sresponsibility for thefinancial statements2. The accounting officer is responsible for
the preparation and fair presentation ofthese financial statements in accordancewith the modified cash basis ofaccounting determined by the NationalTreasury, as set out in accounting policy
note 1.1 and in the manner required bythe Public Finance Management Act,1999 (Act No. 1 of 1999) (PFMA) and forsuch internal control as the accountingofficer determines is necessary to enablethe preparation of financial statementsthat are free from material misstatement,whether due to fraud or error.
The Auditor-General’sresponsibility3. As required by section 188 of the
Constitution of the Republic of SouthAfrica, 1996 read with section 4 of thePublic Audit Act, 2004 (Act No. 25 of2004) (PAA) my responsibility is to expressan opinion on these financial statementsbased on my audit.
4. I conducted my audit in accordance withthe International Standards on Auditingread with General Notice 616 of 2008,issued in Government Gazette No. 31057of 15 May 2008. Those standards requirethat I comply with ethical requirementsand plan and perform the audit to obtainreasonable assurance about whether thefinancial statements are free from materialmisstatement.
5. An audit involves performing proceduresto obtain audit evidence about theamounts and disclosures in the financialstatements. The procedures selecteddepend on the auditor’s judgement,including the assessment of the risks of

land a
ffair
s
1 APRIL 2008 - 31 MARCH 2009 57
material misstatement of the financial statements,whether due to fraud or error. In making those riskassessments, the auditor considers internal controlrelevant to the entity’s preparation and fair presentationof the financial statements in order to design auditprocedures that are appropriate in the circumstances,but not for the purpose of expressing an opinion on theeffectiveness of the entity’s internal control. An auditalso includes evaluating the appropriateness ofaccounting policies used and the reasonableness ofaccounting estimates made by management, as well asevaluating the overall presentation of the financialstatements.
6. I believe that the audit evidence I have obtained issufficient and appropriate to provide a basis for myaudit opinion.
Basis for qualified opinion
Receivables for departmental revenue7. The department embarked on an extensive process to
implement and maintain a database to manage andmonitor the lease revenue. However, the audit stillrevealed significant shortcomings in the managementand control of lease revenue. I was therefore unable toobtain sufficient and appropriate audit evidence for thereceivable for departmental revenue, as disclosed in note25 to the financial statements, due to the following:� The department’s database for lease debtors to the
amount of R56,07 million was not up to date and notall lease contracts were available for audit.
� The lease receivable balance for the prior year wasrestated to the amount of R31,72 million; however,sufficient supporting documentation was not availableto verify the restated amount.
� The breakdown and ageing of the operating leaserevenue receivable were not disclosed in the disclosurenotes to the financial statements.
As a result of a lack of supporting documentation, I wasunable to verify valuation, existence and completenessof the receivable for departmental revenue.Consequently, I could not perform any alternativeprocedures to determine whether any adjustments tothe amounts disclosed in the financial statements forreceivables for departmental revenue might benecessary.
Tangible capital assets8. I was unable to obtain sufficient and appropriate audit
evidence to determine the completeness and rightsregarding immoveable properties disclosed at R1 in note32.3 to the financial statements. The department stilldid not have a complete asset register of all immovableproperties belonging to the national government underthe custodianship of the Department of Land Affairs.� Immovable property registered in the name of other
entities and departments was recorded in theimmovable asset register of the department.
� Immovable property that should have been registeredin the name of the national government was still notregistered and was therefore not included in the assetregister of the department.
9. I was not able to perform alternative procedures toconfirm the completeness and valuation of, and rights
and obligations regarding tangible capital assetsdisclosed in the financial statements
Qualified opinion10. In my opinion, except for the possible effects of the
matters described in the Basis for qualified opinionparagraphs, the financial statements present fairly, in allmaterial respects, the financial position of theDepartment of Land Affairs as at 31 March 2009 and itscash flows for the year then ended, in accordance withthe basis of accounting and in the manner required bythe PFMA.
Emphasis of matters11. I draw attention to the following matters on which I do
not express a qualified opinion:
Basis of accounting12. The department’s policy is to prepare financial
statements on the modified cash basis of accountingdetermined by the National Treasury, as set out inaccounting policy note 1.1.
Fruitless and wasteful expenditure13. As disclosed in note 27 to the financial statements,
fruitless and wasteful expenditure amounting to R4,86million was incurred as a result of irregularities in theacquisition of land reform projects.
Irregular expenditure14. As disclosed in note 26 to the financial statements,
irregular expenditure amounting to R74,96 million wasincurred as a result of Parliament not retrospectivelyapproving expenditure incurred in contravention ofsection 10(1)(a) and (b) of the Provision of Land andAssistance Act, 1993 (Act No. 126 of 1993), whichstates that the Minister of Agriculture and Land Affairscan only acquire land as per section 10(1)(b). TheDepartment of Land Affairs, however, acquired assetsother than land through the Pro-Active Land AcquisitionStrategy process. As these purchases did not constitutesubsidies or advances to beneficiaries, they fell outsidethe mandate provided by the Provision of Land andAssistance Act of 1993.
Other matters15. I draw attention to the following matters that relate to
my responsibilities in the audit of the financialstatements:
Non-compliance with applicablelegislation
Public Finance Management Act andTreasury Regulations16. Accruals which exceeded the payment terms of 30 days
as detailed in Treasury Regulation 8.2.3 amounted toR19,98 million. This amount, in turn, exceeded thevoted funds to be surrendered of R4,76 million, as perthe statement of financial performance, by R15,22million. The amount of R15,22 million would thereforehave constituted unauthorised expenditure had theinvoices been paid in time.

land a
ffair
s
DEPARTMENT OF LAND AFFAIRS: ANNUAL REPORT58
17. The accounting officer did not take effective andappropriate steps to timeously collect all section 78(2A)monies held in trust on behalf of the Department ofLand Affairs, as required in terms of Treasury Regulation11.2.1.
Governance framework18. The governance principles that impact on the auditor’s
opinion on the financial statements are related to theresponsibilities and practices exercised by the accountingofficer and executive management and are reflected inthe internal control deficiencies and key governanceresponsibilities addressed below:
Internal control deficiencies19. Section 38(1)(a)(i) of the PFMA states that the
accounting officer must ensure that the department hasand maintains effective, efficient and transparentsystems of financial and risk management and internalcontrol. The table below depicts the root causes thatgave rise to the deficiencies in the system of internalcontrol, which led to the qualified opinion. The rootcauses are categorised according to the five componentsof an effective system of internal control. (The numberlisted per component can be followed with the legendbelow the table.) In some instances deficiencies exist inmore than one internal control component.
Overall conclusion on financial management based on the root causes20. The findings that resulted in the qualifications are mainly due to an inadequate organisational structure resulting in
inadequate monitoring and supervision to enable an assessment of the effectiveness of internal control over financialreporting.
LegendCE = Control environmentThe organisational structure does not address areas of responsibility and lines of reporting to support effective control overfinancial reporting. 1Management and staff are not assigned appropriate levels of authority and responsibility to facilitate control over financialreporting. 2Human resource policies do not facilitate effective recruitment and training, disciplining and supervision of personnel. 3Integrity and ethical values have not been developed and are not understood to set the standard for financial reporting. 4The accounting officer does not exercise oversight responsibility over financial reporting and internal control. 5Management’s philosophy and operating style do not promote effective control over financial reporting. 6The entity does not have individuals competent in financial reporting and related matters. 7RA = Risk assessmentManagement has not specified financial reporting objectives to enable the identification of risks to reliable financial reporting. 1The entity does not identify risks to the achievement of financial reporting objectives. 2The entity does not analyse the likelihood and impact of the risks identified. 3The entity does not determine a risk strategy/action plan to manage identified risks. 4The potential for material misstatement due to fraud is not considered. 5CA = Control activitiesThere is inadequate segregation of duties to prevent fraudulent data and asset misappropriation. 1General information technology controls have not been designed to maintain the integrity of the information system andthe security of the data. 2Manual or automated controls are not designed to ensure that the transactions have occurred, are authorised, and arecompletely and accurately processed. 3Actions are not taken to address risks to the achievement of financial reporting objectives. 4Control activities are not selected and developed to mitigate risks to financial reporting. 5Policies and procedures related to financial reporting are not established and communicated. 6Realistic targets are not set for financial performance measures, which in turn are not linked to an effective reward system. 7IC = Information and communicationPertinent information is not identified and captured in a form and time frame to support financial reporting. 1Information required to implement internal control is not available to personnel to enable internal control responsibilities. 2Communications do not enable and support the understanding and execution of internal control processes andresponsibilities by personnel. 3M = MonitoringOngoing monitoring and supervision are not undertaken to enable an assessment of the effectiveness of internal controlover financial reporting. 1Neither reviews by internal audit or the audit committee nor self-assessments are evident. 2Internal control deficiencies are not identified and communicated in a timely manner to allow for corrective action to be taken. 3
Par. no. Basis for qualified opinion CE RA CA IC M
7 Receivables for departmental revenue 1, 2 and 3 2, 3 and 4 2, 3, 4, 5 and 6 1
8 Tangible capital assets 1, 2 and 3 2, 3 and 4 2, 3, 4, 5 and 6 1
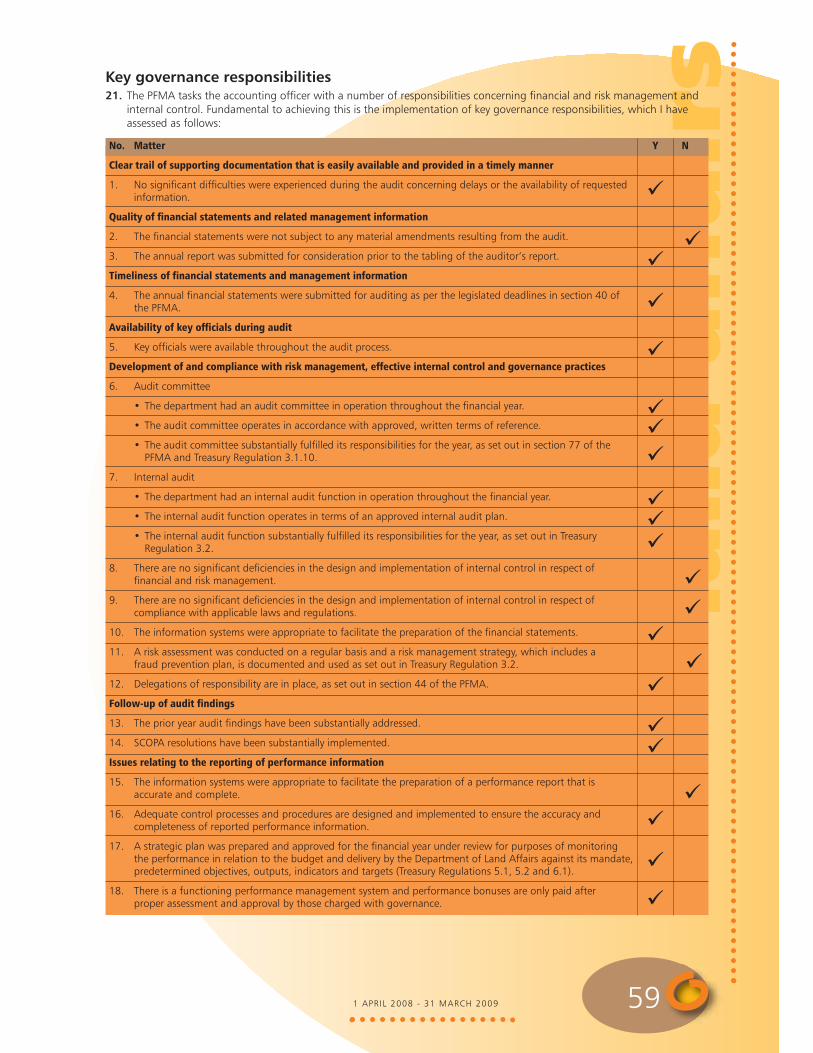
land a
ffair
s
1 APRIL 2008 - 31 MARCH 2009 59
Key governance responsibilities21. The PFMA tasks the accounting officer with a number of responsibilities concerning financial and risk management and
internal control. Fundamental to achieving this is the implementation of key governance responsibilities, which I haveassessed as follows:
No. Matter Y N
Clear trail of supporting documentation that is easily available and provided in a timely manner
1. No significant difficulties were experienced during the audit concerning delays or the availability of requestedinformation.
Quality of financial statements and related management information
2. The financial statements were not subject to any material amendments resulting from the audit.
3. The annual report was submitted for consideration prior to the tabling of the auditor’s report.
Timeliness of financial statements and management information
4. The annual financial statements were submitted for auditing as per the legislated deadlines in section 40 ofthe PFMA.
Availability of key officials during audit
5. Key officials were available throughout the audit process.
Development of and compliance with risk management, effective internal control and governance practices
6. Audit committee
• The department had an audit committee in operation throughout the financial year.
• The audit committee operates in accordance with approved, written terms of reference.
• The audit committee substantially fulfilled its responsibilities for the year, as set out in section 77 of thePFMA and Treasury Regulation 3.1.10.
7. Internal audit
• The department had an internal audit function in operation throughout the financial year.
• The internal audit function operates in terms of an approved internal audit plan.
• The internal audit function substantially fulfilled its responsibilities for the year, as set out in TreasuryRegulation 3.2.
8. There are no significant deficiencies in the design and implementation of internal control in respect offinancial and risk management.
9. There are no significant deficiencies in the design and implementation of internal control in respect ofcompliance with applicable laws and regulations.
10. The information systems were appropriate to facilitate the preparation of the financial statements.
11. A risk assessment was conducted on a regular basis and a risk management strategy, which includes afraud prevention plan, is documented and used as set out in Treasury Regulation 3.2.
12. Delegations of responsibility are in place, as set out in section 44 of the PFMA.
Follow-up of audit findings
13. The prior year audit findings have been substantially addressed.
14. SCOPA resolutions have been substantially implemented.
Issues relating to the reporting of performance information
15. The information systems were appropriate to facilitate the preparation of a performance report that isaccurate and complete.
16. Adequate control processes and procedures are designed and implemented to ensure the accuracy andcompleteness of reported performance information.
17. A strategic plan was prepared and approved for the financial year under review for purposes of monitoringthe performance in relation to the budget and delivery by the Department of Land Affairs against its mandate,predetermined objectives, outputs, indicators and targets (Treasury Regulations 5.1, 5.2 and 6.1).
18. There is a functioning performance management system and performance bonuses are only paid afterproper assessment and approval by those charged with governance.
�
�
�
�
���
���
�
�
��
�
�
�
�
��
�
�

land a
ffair
s
DEPARTMENT OF LAND AFFAIRS: ANNUAL REPORT60
Overall conclusion on the governanceframework22. To address the findings identified in the key governance
responsibilities the department must address theinadequate organisational structure and the monitoringand supervision undertaken to enable an assessment ofthe effectiveness of internal control over financialreporting.
Investigations23. The Department of Land Affairs engaged both internal
staff appointed and independent consulting firms toconduct investigations on its behalf. The investigationswere initiated based on allegations of corruption andirregularities in the department. The investigations werestill ongoing at the reporting date.
Report on other legal ®ulatory requirements
Report on performanceinformation24. I have reviewed the performance information as set out
on pages 16 to 47.
The accounting officer’sresponsibility for the performanceinformation25. The accounting officer has additional responsibilities as
required by section 40(3)(a) of the PFMA to ensure thatthe annual report and audited financial statements fairlypresent the performance against predeterminedobjectives of the department.
The Auditor-General’sresponsibility26. I conducted my engagement in accordance with section
13 of the PAA read with General Notice 616 of 2008,issued in Government Gazette No. 31057 of 15 May2008.
27. In terms of the foregoing my engagement includedperforming procedures of an audit nature to obtainsufficient appropriate evidence about the performanceinformation and related systems, processes andprocedures. The procedures selected depend on theauditor’s judgement.
28. I believe that the evidence I have obtained is sufficientand appropriate to report that significant no findingshave been identified as a result of my review.
Usefulness & reliability of reportedperformance information29. The following criteria were used to assess the usefulness
and reliability of the information on the department’sperformance with respect to the objectives in itsstrategic plan:� Consistency: Has the department reported on its
performance with regard to its objectives, indicatorsand targets in its approved strategic plan?
� Relevance: Is the performance information asreflected in the indicators and targets clearly linked tothe predetermined objectives and mandate? Is thisspecific and measurable, and is the period or deadlinefor delivery specified?
� Reliability: Can the reported performance informationbe traced back to the source data or documentationand is the reported performance information accurateand complete in relation to the source data ordocumentation?
The following audit findings relate to the above criteria:
Reported performance informationnot reliable
Lack of source documentation30. Sufficient appropriate audit evidence in relation to the
reported performance information of programme 5:Land Reform could not be obtained, as the relevantsource documentation could not be provided for auditpurposes on time.
Appreciation31. The assistance rendered by the staff of the Department
of Land Affairs during the audit is sincerely appreciated.
Pretoria2 August 2009

land affairs
1 APRIL 2008 - 31 MARCH 2009 61
T
part4A N N U A LF I N A N C I A LS T A T E M E N T S
Statement ofAccounting
Policies &Related Matters
The Financial Statements have been preparedin accordance with the following policies,which have been applied consistently in allmaterial aspects, unless otherwise indicated.However, where appropriate and meaningful,additional information has been disclosed toenhance the usefulness of the FinancialStatements and to comply with the statutoryrequirements of the Public FinanceManagement Act, Act 1 of 1999 (as amendedby Act 29 of 1999), and the TreasuryRegulations issued in terms of the Act and theDivision of Revenue Act, Act 2 of 2006.
1. Presentation of theFinancial Statements
1.1 Basis of preparationThe Financial Statements have been preparedon a modified cash basis of accounting, exceptwhere stated otherwise. The modified cashbasis constitutes the cash basis of accountingsupplemented with additional disclosure items.Under the cash basis of accounting,transactions and other events are recognisedwhen cash is received or paid.
1.2 Presentation currencyAll amounts have been presented in thecurrency of the South African Rand (R) which isalso the functional currency of the department.
1.3 RoundingUnless otherwise stated all financial figureshave been rounded to the nearest onethousand Rand (R’000).
1.4 Comparative figuresPrior period comparative information has beenpresented in the current year’s financialstatements. Where necessary figures includedin the prior period financial statements havebeen reclassified to ensure that the format inwhich the information is presented isconsistent with the format of the current year’sfinancial statements.
1.5 Comparative figures -AppropriationStatement
A comparison between actual amounts andfinal appropriation per major classification ofexpenditure is included in the appropriationstatement.
2. Revenue
2.1 Appropriated fundsAppropriated funds are recognised in thefinancial records on the date the appropriationbecomes effective. Adjustments to theappropriated funds made in terms of the
FOR THE YEAR ENDED 31 MARCH 2009

land a
ffair
s
DEPARTMENT OF LAND AFFAIRS: ANNUAL REPORT62
adjustments budget process are recognised in the financialrecords on the date the adjustments become effective.
Total appropriated funds are presented in the statementof financial performance.
Unexpended appropriated funds are surrendered to theNational Revenue Fund. Amounts owing to the NationalRevenue Fund at the end of the financial year are recognisedin the statement of financial position.
2.2 Statutory AppropriationStatutory appropriations are recognised in the financialrecords on the date the appropriation becomes effective.Adjustments to the statutory appropriations made in termsof the adjustments budget process are recognised in thefinancial records on the date the adjustments becomeeffective.
Total statutory appropriations are presented in thestatement of financial performance.
Unexpended statutory appropriations are surrendered tothe National Revenue Fund. Amounts owing to the NationalRevenue Fund at the end of the financial year are recognisedin the statement of financial position.
2.3 Departmental revenueAll departmental revenue is paid into the National
Revenue Fund when received, unless otherwise stated.Amounts owing to the National Revenue Fund at the end ofthe financial year are recognised in the statement of financialposition.
Amounts receivable at the reporting date are disclosed inthe disclosure notes to the annual financial statements.
2.3.1 Tax revenueTax revenue consists of all compulsory unrequited amountscollected by the department in accordance with laws and orregulations (excluding fines, penalties & forfeits).
Tax receipts are recognised in the Statement of FinancialPerformance when received.
2.3.2 Sales of goods & services otherthan capital assets
The proceeds received from the sale of goods and/or theprovision of services is recognised in the Statement ofFinancial Performance when the cash is received.
2.3.3 Fines, penalties & forfeitsFines, penalties & forfeits are compulsory unrequitedamounts which were imposed by a court or quasi-judicialbody and collected by the department. Revenue arising fromfines, penalties and forfeits is recognised in the Statement ofFinancial Performance when the cash is received.
2.3.4 Interest, dividends & renton land
Interest, dividends and rent on land is recognised in theStatement of Financial Performance when the cash isreceived.
2.3.5 Sale of capital assetsThe proceeds received on sale of capital assets arerecognised in the Statement of Financial Performance whenthe cash is received.
2.3.6 Financial transactions in assets& liabilities
Repayments of loans and advances previously extended toemployees and public corporations for policy purposes arerecognised as revenue in the Statement of FinancialPerformance on receipt of the funds.
Cheques issued in previous accounting periods that expirebefore being banked are recognised as revenue in theStatement of Financial Performance when the chequebecomes stale. When the cheque is reissued the payment ismade from Revenue.
Forex gains are recognised on payment of funds.
2.3.7 Transfers received(including gifts, donations &sponsorships)
All cash gifts, donations and sponsorships are paid into theNational/Provincial Revenue Fund and recorded as revenue inthe Statement of Financial Performance when received.Amounts receivable at the reporting date are disclosed in thedisclosure notes to the financial statements.
All in-kind gifts, donations and sponsorships are disclosedat fair value in an annexure to the financial statements.
2.4 Direct Exchequer receiptsAll direct exchequer fund receipts are recognised in theStatement of Financial Performance when the cash isreceived.
2.5 Local & foreign aidassistance
Local and foreign aid assistance is recognised as revenuewhen notification of the assistance is received from theNational Treasury or when the department directly receivesthe cash from the donor(s).
All in-kind local and foreign aid assistance are disclosed atfair value in the annexure to the annual financial statements.
The cash payments made during the year relating to localand foreign aid assistance projects are recognised asexpenditure in the Statement of Financial Performance. Thevalue of the assistance expensed prior to the receipt of thefunds is recognized as a receivable in the statement offinancial position.
Inappropriately expensed amounts using local and foreignaid assistance and any unutilised amounts are recognised aspayables in the statement of financial position.
3. Expenditure
3.1 Compensation ofemployees
3.1.1 Short-term employee benefitsSalaries and wages comprise payments to employees(including leave entitlements, thirteenth cheques andperformance bonuses). Salaries and wages are recognised asan expense in the Statement of Financial Performance whenfinal authorisation for payment is effected on the system (byno later than 31 March of each year). Capitalised
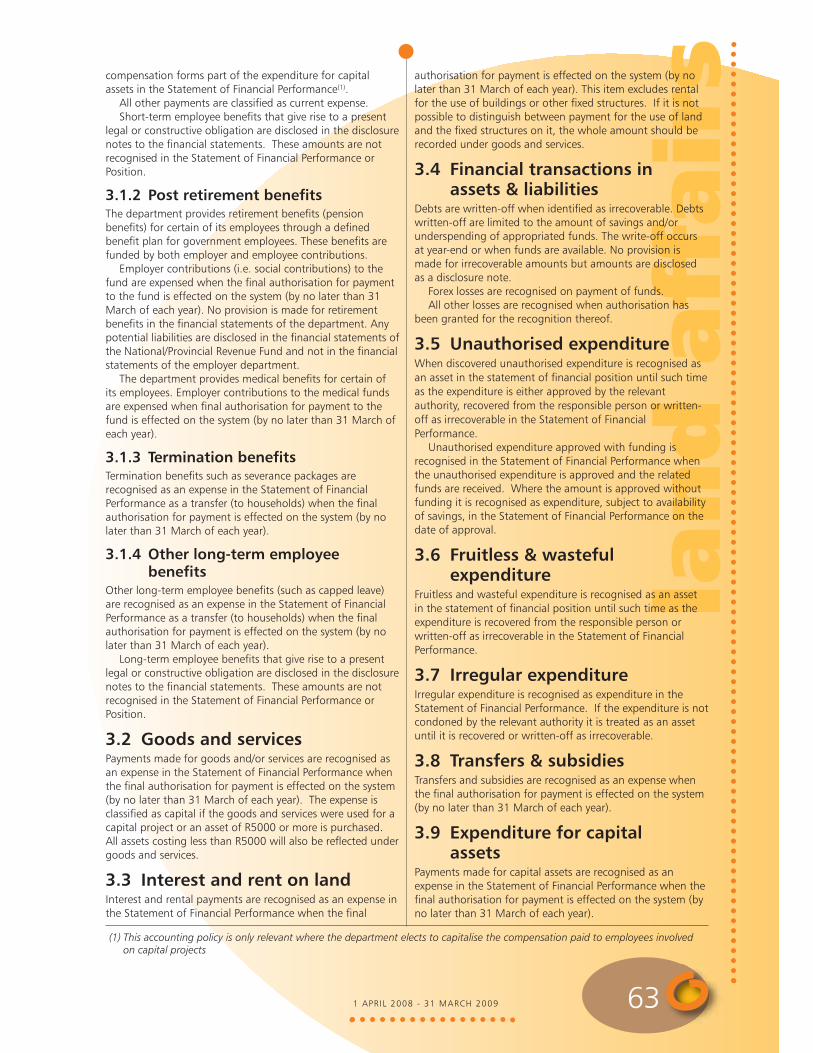
land a
ffair
s
1 APRIL 2008 - 31 MARCH 2009 63
compensation forms part of the expenditure for capitalassets in the Statement of Financial Performance(1).
All other payments are classified as current expense.Short-term employee benefits that give rise to a present
legal or constructive obligation are disclosed in the disclosurenotes to the financial statements. These amounts are notrecognised in the Statement of Financial Performance orPosition.
3.1.2 Post retirement benefitsThe department provides retirement benefits (pensionbenefits) for certain of its employees through a definedbenefit plan for government employees. These benefits arefunded by both employer and employee contributions.
Employer contributions (i.e. social contributions) to thefund are expensed when the final authorisation for paymentto the fund is effected on the system (by no later than 31March of each year). No provision is made for retirementbenefits in the financial statements of the department. Anypotential liabilities are disclosed in the financial statements ofthe National/Provincial Revenue Fund and not in the financialstatements of the employer department.
The department provides medical benefits for certain ofits employees. Employer contributions to the medical fundsare expensed when final authorisation for payment to thefund is effected on the system (by no later than 31 March ofeach year).
3.1.3 Termination benefitsTermination benefits such as severance packages arerecognised as an expense in the Statement of FinancialPerformance as a transfer (to households) when the finalauthorisation for payment is effected on the system (by nolater than 31 March of each year).
3.1.4 Other long-term employeebenefits
Other long-term employee benefits (such as capped leave)are recognised as an expense in the Statement of FinancialPerformance as a transfer (to households) when the finalauthorisation for payment is effected on the system (by nolater than 31 March of each year).
Long-term employee benefits that give rise to a presentlegal or constructive obligation are disclosed in the disclosurenotes to the financial statements. These amounts are notrecognised in the Statement of Financial Performance orPosition.
3.2 Goods and servicesPayments made for goods and/or services are recognised asan expense in the Statement of Financial Performance whenthe final authorisation for payment is effected on the system(by no later than 31 March of each year). The expense isclassified as capital if the goods and services were used for acapital project or an asset of R5000 or more is purchased.All assets costing less than R5000 will also be reflected undergoods and services.
3.3 Interest and rent on landInterest and rental payments are recognised as an expense inthe Statement of Financial Performance when the final
authorisation for payment is effected on the system (by nolater than 31 March of each year). This item excludes rentalfor the use of buildings or other fixed structures. If it is notpossible to distinguish between payment for the use of landand the fixed structures on it, the whole amount should berecorded under goods and services.
3.4 Financial transactions inassets & liabilities
Debts are written-off when identified as irrecoverable. Debtswritten-off are limited to the amount of savings and/orunderspending of appropriated funds. The write-off occursat year-end or when funds are available. No provision ismade for irrecoverable amounts but amounts are disclosedas a disclosure note.
Forex losses are recognised on payment of funds.All other losses are recognised when authorisation has
been granted for the recognition thereof.
3.5 Unauthorised expenditureWhen discovered unauthorised expenditure is recognised asan asset in the statement of financial position until such timeas the expenditure is either approved by the relevantauthority, recovered from the responsible person or written-off as irrecoverable in the Statement of FinancialPerformance.
Unauthorised expenditure approved with funding isrecognised in the Statement of Financial Performance whenthe unauthorised expenditure is approved and the relatedfunds are received. Where the amount is approved withoutfunding it is recognised as expenditure, subject to availabilityof savings, in the Statement of Financial Performance on thedate of approval.
3.6 Fruitless & wastefulexpenditure
Fruitless and wasteful expenditure is recognised as an assetin the statement of financial position until such time as theexpenditure is recovered from the responsible person orwritten-off as irrecoverable in the Statement of FinancialPerformance.
3.7 Irregular expenditureIrregular expenditure is recognised as expenditure in theStatement of Financial Performance. If the expenditure is notcondoned by the relevant authority it is treated as an assetuntil it is recovered or written-off as irrecoverable.
3.8 Transfers & subsidiesTransfers and subsidies are recognised as an expense whenthe final authorisation for payment is effected on the system(by no later than 31 March of each year).
3.9 Expenditure for capitalassets
Payments made for capital assets are recognised as anexpense in the Statement of Financial Performance when thefinal authorisation for payment is effected on the system (byno later than 31 March of each year).
(1) This accounting policy is only relevant where the department elects to capitalise the compensation paid to employees involvedon capital projects

land a
ffair
s
DEPARTMENT OF LAND AFFAIRS: ANNUAL REPORT64
4. Assets
4.1 Cash & cash equivalentsCash and cash equivalents are carried in the statement offinancial position at cost.
For the purposes of the cash flow statement, cash andcash equivalents comprise cash on hand, deposits held, othershort-term highly liquid investments and bank overdrafts.
4.2 Other financial assetsOther financial assets are carried in the statement of financialposition at cost.
4.3 Prepayments & advancesAmounts prepaid or advanced are recognised in thestatement of financial position when the payments aremade.
Pre-payments and advances outstanding at the end of theyear are carried in the statement of financial position at cost.
4.4 ReceivablesReceivables included in the statement of financial positionarise from cash payments made that are recoverable fromanother party.
Receivables outstanding at year-end are carried in thestatement of financial position at cost plus any accruedinterest.
4.5 InvestmentsCapitalised investments are shown at cost in the statementof financial position. Any cash flows such as dividendsreceived or proceeds from the sale of the investment arerecognised in the statement of financial performance whenthe cash is received.
Investments are tested for an impairment loss wheneverevents or changes in circumstances indicate that theinvestment may be impaired. Any loss is included in thedisclosure notes.
4.6 LoansLoans are recognised in the statement of financial position atthe nominal amount when cash is paid to the beneficiary.Loan lances are reduced when cash repayments are receivedfrom the beneficiary. Amounts that are potentiallyirrecoverable are included in the disclosure notes.
Loans that are outstanding at year-end are carried in thestatement of financial position at cost.
4.7 InventoryInventories purchased during the financial year are disclosedat cost in the notes.
4.8 Capital assetsA capital asset is recorded on receipt of the item at cost.Cost of an asset is defined as the total cost of acquisition.Where the cost cannot be determined accurately, the capitalasset should be stated at fair value. Where fair value cannotbe determined, the capital asset is included in the assetregister at R1.
Projects (of construction/development) running over morethan one financial year relating to assets, are only capitalised
as assets on completion of the project and at the total costincurred over the duration of the project.
Disclosure Notes 30 to 32 reflect the total movement inthe asset register for the current financial year.
5. Liabilities
5.1 Voted funds to be surrenderedto the Revenue Fund
Unexpended appropriated funds are surrendered to theNational/Provincial Revenue Fund. Amounts owing to theNational/Provincial Revenue Fund at the end of the financialyear are recognised in the statement of financial position
5.2 Departmental revenue to besurrendered to the RevenueFund
Amounts owing to the National/Provincial Revenue Fund atthe end of the financial year are recognised in the statementof financial position at cost.
5.3 Bank overdraftThe bank overdraft is carried in the statement of financialposition at cost.
5.4 PayablesRecognised payables mainly comprise of amounts owing toother governmental entities. These payables are recognisedat historical cost in the statement of financial position.
5.5 Contingent liabilitiesContingent liabilities are included in the disclosure notes.
5.6 CommitmentsCommitments are not recognised in the statement offinancial position as a liability or as expenditure in theStatement of Financial Performance but are included in thedisclosure notes.
5.7 AccrualsAccruals are not recognised in the statement of financialposition as a liability or as expenditure in the Statement ofFinancial Performance but are included in the disclosurenotes.
5.8 Employee benefitsShort-term employee benefits that give rise to a present legalor constructive obligation are disclosed in the disclosurenotes to the financial statements. These amounts are notrecognised in the Statement of Financial Performance or thestatement of financial position.
5.9 Lease commitmentsFinance leasesFinance leases are not recognised as assets and liabilities inthe statement of financial position. Financial lease paymentsare recognised as an expense in the Statements of FinancialPerformance and are apportioned between the capital and

land a
ffair
s
1 APRIL 2008 - 31 MARCH 2009 65
the interest portions. The finance lease liability is disclosed inthe disclosure notes to the financial statements.
Operating leasesOperating lease payments are recognised as an expense inthe Statement of Financial Performance. The operating leasecommitments are disclosed in the disclosure notes to thefinancial statements.
6. Receivables fordepartmental revenue
Receivables for departmental revenue are disclosed in thedisclosure notes to the annual financial statements.
7. Net Assets
7.1 Capitalisation reserveThe capitalisation reserve comprises of financial assets and/orliabilities originating in a prior reporting period but whichare recognised in the statement of financial position for thefirst time in the current reporting period. Amounts aretransferred to the National/Provincial Revenue Fund ondisposal, repayment or recovery of such amounts.
7.2 Recoverable revenueAmounts are recognised as recoverable revenue when apayment made in a previous financial year becomesrecoverable from a debtor in the current financial year.
8. Related party transactionsSpecific information with regards to related partytransactions is included in the disclosure notes.
9. Key management personnelCompensation paid to key management personnel includingtheir family members where relevant, is included in thedisclosure notes.
10. Public private partnershipsA description of the PPP arrangement, the contract fees andcurrent and capital expenditure relating to the PPParrangement is included in the disclosure notes.

DEPARTMENT OF LAND AFFAIRS: ANNUAL REPORT66
vote 27
Appropriation Statementfor the year ended 31 March 2009
1. AdministrationCurrent paymentTransfers and subsidiesPayment for capital assets
2. Surveys and MappingCurrent paymentTransfers and subsidiesPayment for capital assets
3. Cadastral ServicesCurrent paymentTransfers and subsidiesPayment for capital assets
4. RestitutionCurrent paymentTransfers and subsidiesPayment for capital assets
5. Land ReformCurrent paymentTransfers and subsidiesPayment for capital assets
6. Spatial Planning &informationCurrent paymentTransfers and subsidiesPayment for capital assets
7. Auxiliary & AssociatedServicesCurrent paymentTransfers and subsidiesPayment for capital assets
TOTAL
AdjustedAppro-priation
R'000
406,568116
17,198
81,9312,1467,338
112,19725
2,653
362,4642,721,944
13,897
311,2261,244,0731,333,170
29,6192,080
587
10,1622-
6,659,396
Shifting ofFunds
R'000
18,8368,2694,912
(12,546)772
2,703
2,74581
942
(24,218)72,4573,610
(8,743)(213,775)
139,655
3,950-
350
---
-
Virement
R'000
(3,638)4,602
(3,421)
(6,235)(336)
(3,729)
(2,107)-
(152)
(20,157)(8,238)
3,022
(7,241)8,000
(5,652)
(1,320)-
(432)
(7,780)54,814
-
-
FinalAppro-priation
R'000
421,76612,98718,689
63,1502,5826,312
112,835106
3,443
318,0892,786,163
20,529
295,2421,038,2981,467,173
32,2492,080
505
2,38254,816
-
6,659,396
64,170-
6,723,566
ActualExpendi-
ture
R'000
421,65612,98318,677
62,98525806,310
112,763104
3,439
318,0662,783,672
20,410
294,7431,037,6341,467,162
32,2081,544
504
2,38254,814
-
6,654,636
3,112
6,657,748
Variance
R'000
1104
12
16522
7224
232,491
119
49966411
41536
1
-2-
4,760
Expendi-ture as %of finalappro-
priation%
100.0%100.0%99.9%
99.7%99.9%
100.0%
99.9%98.1%99.9%
100.0%99.9%99.4%
99.8%99.9%
100.0%
99.9%74.2%98.8%
100.0%100.0%
-
99.9%
FinalAppro-priation
R'000
401,3567,461
17,737
70,1364,867
23,082
130,9521,2025,783
288,5123,333,594
16,505
233,748507,810851,913
20,999-
1,019
8,5242
3,067
5,928,269
176,3801,885
6,106,534
ActualExpendi-
ture
R'000
401,1987,304
16,492
70,0744,654
22,529
130,9211,1785,517
288,4433,333,594
16,428
233,440486,119851,514
20,962-
874
3,274-
2,982
5,897,497
35
5,897,532
Appropriation per programme
2008/09 2007/08
TOTAL (brought forward)
Reconciliation with statement of financial performance
ADD
Departmental receiptsAid assistance
Actual amounts per statement of financial performance (totalrevenue)
ADD
Aid assistance
Actual amounts per statement of financial performance (totalexpenditure)

1 APRIL 2008 - 31 MARCH 2009 67
Current paymentsCompensation of employeesGoods and servicesInterest and rent on landFinancial transactions in assetsand liabilitiesTransfers and subsidies Provinces and municipalitiesDepartmental agencies andaccountsUniversities and technikonsForeign governments andinternational organisationsPublic corporations and privateenterprisesNon-profit institutions Households Payments for capital assetsBuildings and other fixedstructuresMachinery and equipmentBiological or cultivated assetsSoftware and other intangibleassetsLand and subsoil assets
Total
AdjustedAppro-priation
R'000
731,936582,231
-
-
4
2,494-
1,200
12,080
3,964,607
14440,036
-
1,3581,333,305
6,659,396
Shifting ofFunds
R'000
(90,556)70,573
7
-
44
--
(75)
-2
(132,167)
(144)11,173
-
(208)141,351
-
Virement
R'000
(28,652)(19,826)
-
-
-
54,814-
-
--
4,028
-(9,452)
-
(1,150)238
-
FinalAppro-priation
R'000
612,728632,978
7
-
48
57,308-
1,125
12,082
3,836,468
-41,757
-
-1,474,894
6,659,396
ActualExpendi-
ture
R'000
610,553631,882
6
2,361
26
57,306-
1,124
-1,546
3,833,330
-41,624
-
-1,474,878
6,654,636
Variance
R'000
2,1751,096
1
(2,361)
22
2-
1
1536
3,138
-133
-
-16
4,760
Expendi-ture as %of finalappro-
priation%
99.6%99.8%85.7%
-
54.2%
100.0%-
99.9%
-74.3%99.9%
-99.7%
-
-100.0%
99.9%
FinalAppro-priation
R'000
479,263674,964
-
-
139
2,353-
1,100
51-
3,851,293
2,44264,1639,493
9,913833,095
5,928,269
ActualExpendi-
ture
R'000
476,092668,388
-
3,832
77
2,351-
1,026
50-
3,829,345
2,44263,1379,491
8,433832,833
5,897,497
Appropriation per economic classification
2008/09 2007/08

DEPARTMENT OF LAND AFFAIRS: ANNUAL REPORT68
vote 27
Detail per Programmefor the year ended 31 March 2009
Programme 1: AdministrationDetails per Sub-Programme
1.1 ManagementCurrent paymentTransfers and subsidiesPayment for capital assets
1.2 Corporate ServicesCurrent paymentTransfers and subsidiesPayment for capital assets
1.3 Property ManagementCurrent paymentTransfers and subsidiesPayment for capital assets
Total
AdjustedAppro-priation
R'000
102,1914
970
264,326112
16,228
40,051--
423,882
Shifting ofFunds
R'000
(29,249)346
7,612
48,0857,923
(2,700)
---
32,017
Virement
R'000
(3,965)(2)
(2,276)
(4,186)4,604
(1,145)
4,513--
(2,457)
FinalAppro-priation
R'000
68,977348
6,306
308,22512,63912,383
44,564--
453,442
Variance
R'000
36-4
7448
---
126
Expen-diture as% of final
appro-priation
%
99.9%100.0%99.9%
100.0%100.0%99.9%
100.0%--
100.0%
FinalAppro-priation
R'000
81,74656
2,089
267,6557,405
15,648
51,955--
426,554
Actualexpen-diture
R'000
81,63851
1,455
267,6557,253
15,037
51,905--
424,994
ActualExpen-diture
R'000
68,941348
6,302
308,15112,63512,375
44,564--
453,316
2008/09 2007/08
Programme 1 per economicclassification
Current paymentCompensation of employeesGoods & servicesInterest & rent on landFinancial transactions in assets &liabilitiesTransfers & subsidies to:Provinces & municipalitiesDepartmental agencies & accountsUniversities & technikonsForeign governments &international organisations Public corporations & privateenterprisesNon-profit institutionsHouseholdsPayment for capital assetsBuildings & other fixed structuresMachinery & equipmentBiological or cultivated assetsSoftware & other intangible assetsLand & subsoil assets
Total
AdjustedAppro-priation
R'000
190,847215,721
-
-
1--
-
--
115
-17,096
-102
-
423,882
Shifting ofFunds
R'000
(44,681)63,517
-
-
9--
-
-2
8,258
-5,014
-(102)
-
32,017
Virement
R'000
(11,740)8,102
-
-
---
-
--
4,602
-(3,421)
---
(2,457)
FinalAppro-priation
R'000
134,426287,340
-
-
10--
-
-2
12,975
-18,689
---
453,442
Variance
R'000
14515
-
(49)
2--
-
--1
-12
---
126
Expen-diture as% of final
appro-priation
%
99.9%100.0%
-
-
80.0%--
-
-100.0%100.0%
-99.9%
---
100.0%
FinalAppro-priation
R'000
109,121292,235
-
-
52--
-
50-
7,359
-8,872
-8,865
-
426,554
Actualexpen-diture
R'000
106,098291,268
-
3,832
18--
-
50-
7,236
-8,309
-8,183
-
424,994
ActualExpen-diture
R'000
134,281287,325
-
49
8--
-
-2
12,974
-18,677
---
453,316
2008/09 2007/08

1 APRIL 2008 - 31 MARCH 2009 69
Details per Sub-Programme
2.1 Surveys and MappingCurrent paymentTransfers and subsidiesPayment for capital assets
Total
AdjustedAppro-priation
R'000
81,9312,1467,338
91,415
Shifting ofFunds
R'000
(12,546)772
2,703
(9,071)
Virement
R'000
(6,235)(336)
(3,729)
(10,300)
FinalAppro-priation
R'000
63,1502,5826,312
72,044
Variance
R'000
16522
169
Expen-diture as% of final
appro-priation
%
99.7%99.9%
100.0%
99.8%
FinalAppro-priation
R'000
70,1364,867
23,082
98,085
Actualexpen-diture
R'000
70,0744,654
22,529
97,257
ActualExpen-diture
R'000
62,9852,5806,310
71,875
2008/09 2007/08
Programme 2 per economicclassification
Current paymentCompensation of employeesGoods & servicesInterest & rent on landFinancial transactions in assets &liabilitiesTransfers & subsidies to:Provinces & municipalitiesDepartmental agencies & accountsUniversities & technikonsForeign governments &international organisations Public corporations & privateenterprisesNon-profit institutionsHouseholdsPayment for capital assetsBuildings & other fixed structuresMachinery & equipmentBiological or cultivated assetsSoftware & other intangible assetsLand & subsoil assets
Total
AdjustedAppro-priation
R'000
44,84337,088
-
-
3--
1,200
--
943
1296,313
-896
-
91,415
Shifting ofFunds
R'000
(8,007)(4,546)
7
-
1--
(75)
--
846
(129)2,578
-254
-
(9,071)
Virement
R'000
(1,990)(4,245)
-
-
---
-
--
(336)
-(2,579)
-(1,150)
-
(10,300)
FinalAppro-priation
R'000
34,83628,297
7
-
4--
1,125
--
1,453
-6,312
---
72,044
Variance
R'000
148171
(2)
2--
1
---
-2---
169
Expen-diture as% of final
appro-priation
%
99.6%99.9%85.7%
-
50.0%--
99.9%
--
100.0%
-100.0%
---
99.8%
FinalAppro-priation
R'000
34,61435,522
-
-
6--
1,100
--
3,761
-22,600
-482
-
98,085
Actualexpen-diture
R'000
34,55235,522
-
-
2--
1,026
--
3,626
-22,529
---
97,257
ActualExpen-diture
R'000
34,69828,280
6
2
2--
1,124
--
1,453
-6,310
---
71,875
2008/09 2007/08
Programme 2: Surveys & Mapping
Programme 3: Cadastral Surveys Details per Sub-Programme
3.1 Cadastral SurveysCurrent paymentTransfers and subsidiesPayment for capital assets
Total
AdjustedAppro-priation
R'000
112,19725
2,653
114,875
Shifting ofFunds
R'000
2,74581
942
3,768
Virement
R'000
(2,107)-
(152)
(2,259)
FinalAppro-priation
R'000
112,835106
3,443
116,384
Variance
R'000
7224
78
Expen-diture as% of final
appro-priation
%
99.9%98.1%99.9%
99.9%
FinalAppro-priation
R'000
130,9521,2025,783
137,937
Actualexpen-diture
R'000
130,9211,1785,517
137,616
ActualExpen-diture
R'000
112,763104
3,439
116,306
2008/09 2007/08

DEPARTMENT OF LAND AFFAIRS: ANNUAL REPORT70
Programme 3 per economicclassification
Current paymentCompensation of employeesGoods & servicesInterest & rent on landFinancial transactions in assets &liabilitiesTransfers & subsidies to:Provinces & municipalitiesDepartmental agencies & accountsUniversities & technikonsForeign governments &international organisations Public corporations & privateenterprisesNon-profit institutionsHouseholdsPayment for capital assetsBuildings & other fixed structuresMachinery & equipmentBiological or cultivated assetsSoftware & other intangible assetsLand & subsoil assets
Total
AdjustedAppro-priation
R'000
88,93423,263
-
-
---
-
--
25
152,278
-360
-
114,875
Shifting ofFunds
R'000
2,879(134)
-
-
1--
-
--
80
(15)1,317
-(360)
-
3,768
Virement
R'000
(3,170)1,063
-
-
---
-
---
-(152)
---
(2,259)
FinalAppro-priation
R'000
88,64324,192
-
-
1--
-
--
105
-3,443
---
116,384
Variance
R'000
2165-
(149)
1--
-
--1
-4---
78
Expen-diture as% of final
appro-priation
%
99.8%100.0%
-
-
---
-
--
99.0%
-99.9%
---
99.9%
FinalAppro-priation
R'000
83,32047,632
-
-
26--
-
--
1,176
-5,637
-146
-
137,937
Actualexpen-diture
R'000
83,28947,632
-
-
2--
-
--
1,176
-5,517
---
137,616
ActualExpen-diture
R'000
88,42724,187
-
149
---
-
--
104
-3,439
---
116,306
2008/09 2007/08
Details per Sub-Programme
4.1 National OfficeCurrent paymentTransfers and subsidiesPayment for capital assets
4.2 Regional OfficeCurrent paymentTransfers and subsidiesPayment for capital assets
4.3 Restitution GrantsCurrent paymentTransfers and subsidiesPayment for capital assets
Total
AdjustedAppro-priation
R'000
44,013-
2,129
318,451-
11,768
-2,721,944
-
3,098,305
Shifting ofFunds
R'000
(7,160)-
10
(17,058)8
3,600
-72,449
-
51,849
Virement
R'000
(6,728)-
(1,055)
(13,429)-
(9,913)
-(8,238)13,990
(25,373)
FinalAppro-priation
R'000
30,125-
1,084
287,9648
5,455
-2,786,155
13,990
3,124,781
Variance
R'000
18-7
51
96
-2,490
16
2,633
Expen-diture as% of final
appro-priation
%
99.9%-
99.4%
100.0%87.5%98.2%
-99.9%99.9%
99.9%
FinalAppro-priation
R'000
27,493-
600
261,01963
15,905
-3,333,531
-
3,638,611
Actualexpen-diture
R'000
27,474-
525
260,96963
15,903
-3,333,531
-
3,638,465
ActualExpen-diture
R'000
30,107-
1,077
287,9597
5,359
-2,783,665
13,974
3,122,148
2008/09 2007/08
Programme 4: Restitution

1 APRIL 2008 - 31 MARCH 2009 71
Details per Sub-Programme
5.1 National OfficeCurrent paymentTransfers and subsidiesPayment for capital assets
5.2 Provincial OfficeCurrent paymentTransfers and subsidiesPayment for capital assets
5.3 Land Reform GrantsCurrent paymentTransfers and subsidiesPayment for capital assets
5.4 KwaZulu-Natal IngonyamaTrust BoardCurrent paymentTransfers and subsidiesPayment for capital assets
5.5 The Land ReformEmpowerment FacilityCurrent paymentTransfers and subsidiesPayment for capital assets
5.6 Communal Land RightsProgrammeCurrent paymentTransfers and subsidiesPayment for capital assets
Total
AdjustedAppro-priation
R'000
59,716-
530
227,820-
1,332,640
-1,241,580
-
-2,492
-
-1-
23,690--
2,888,469
Shifting ofFunds
R'000
(6,556)-
79
(2,187)25
139,576
-(213,800)
-
---
---
---
(82,863)
Virement
R'000
(2,116)-
141
(872)-
(5,793)
-8,000
-
---
---
(4,253)--
(4,893)
FinalAppro-priation
R'000
51,044-
750
224,76125
1,466,423
-1,035,780
-
-2,492
-
-1-
19,437--
2,800,713
Variance
R'000
455-
10
43171
-646
-
---
-1-
1--
1,174
Expen-diture as% of final
appro-priation
%
99.1%-
98.7%
100.0%32.0%
100.0%
-99.9%
-
-100.0%
-
---
100.0%--
100.0%
FinalAppro-priation
R'000
54,589645
1,468
174,61939
850,445
-504,774
-
-2,351
-
-1-
4,540--
1,593,471
Actualexpen-diture
R'000
54,580643
1,126
174,60939
850,388
-483,086
-
-2,351
-
---
4,251--
1,571,073
ActualExpen-diture
R'000
50,589-
740
224,7188
1,466,422
-1,035,134
-
-2,492
-
---
19,436--
2,799,539
2008/09 2007/08
Programme 4 per economicclassification
Current paymentCompensation of employeesGoods & servicesInterest & rent on landFinancial transactions in assets &liabilitiesTransfers & subsidies to:Provinces & municipalitiesDepartmental agencies & accountsUniversities & technikonsForeign governments &international organisations Public corporations & privateenterprisesNon-profit institutionsHouseholdsPayment for capital assetsBuildings & other fixed structuresMachinery & equipmentBiological or cultivated assetsSoftware & other intangible assetsLand & subsoil assets
Total
AdjustedAppro-priation
R'000
207,334155,130
-
-
---
-
--
2,721,944
-10,897
--
3,000
3,098,305
Shifting ofFunds
R'000
(13,008)(11,210)
-
-
8--
-
--
72,449
-(2,390)
--
6,000
51,849
Virement
R'000
(8,661)(11,496)
-
-
---
-
--
(8,238)
-(1,968)
--
4,990
(25,373)
FinalAppro-priation
R'000
185,665132,424
-
-
8--
-
--
2,786,155
-6,539
--
13,990
3,124,781
Variance
R'000
133748
-
(858)
1--
-
--
2,490
-104
--
15
2,633
Expen-diture as% of final
appro-priation
%
99.9%99.4%
-
-
87.5%--
-
--
99.9%
-98.4%
--
99.9%
99.9%
FinalAppro-priation
R'000
127,520160,992
-
-
16--
-
--
3,333,578
-5,422
--
11,083
3,638,611
Actualexpen-diture
R'000
127,501160,942
-
-
16--
-
--
3,333,578
-5,345
--
11,083
3,638,465
ActualExpen-diture
R'000
185,532131,676
-
858
7--
-
--
2,783,665
-6,435
--
13,975
3,122,148
2008/09 2007/08
Programme 5: Land Reform

DEPARTMENT OF LAND AFFAIRS: ANNUAL REPORT72
Programme 5 per economicclassification
Current paymentCompensation of employeesGoods & servicesInterest & rent on landFinancial transactions in assets &liabilitiesTransfers & subsidies to:Provinces & municipalitiesDepartmental agencies & accountsUniversities & technikonsForeign governments &international organisations Public corporations & privateenterprisesNon-profit institutionsHouseholdsPayment for capital assetsBuildings & other fixed structuresMachinery & equipmentBiological or cultivated assetsSoftware & other intangible assetsLand & subsoil assets
Total
AdjustedAppro-priation
R'000
181,209130,017
-
-
-2,492
-
-
1-
1,241,580
-2,865
--
1,330,305
2,888,469
Shifting ofFunds
R'000
(27,038)18,295
-
-
25--
-
--
(213,800)
-4,304
--
135,351
(82,863)
Virement
R'000
(2,391)(4,850)
-
-
---
-
--
8,000
-(900)
--
(4,752)
(4,893)
FinalAppro-priation
R'000
151,780143,462
-
-
252,492
-
-
1-
1,035,780
-6,269
--
1,460,904
2,800,713
Variance
R'000
1,457297
-
(1,254)
16--
-
1-
646
-10
--1
1,174
Expen-diture as% of final
appro-priation
%
99.0%99.8%
-
-
36.0%100.0%
-
-
--
99.9%
-99.8%
--
100.0%
100.0%
FinalAppro-priation
R'000
114,335119,413
-
-
392,351
-
-
1-
505,419
2,44217,6369,493
330822,012
1,593,471
Actualexpen-diture
R'000
114,335119,105
-
-
392,351
-
-
--
483,729
2,44217,5819,491
250821,750
1,571,073
ActualExpen-diture
R'000
150,323143,165
-
1,254
92,492
-
-
--
1,035,134
-6,259
--
1,460,903
2,799,530
2008/09 2007/08
Programme 6: Spatial Planning & InformationDetails per Sub-Programme
6.1 Management & SupportServicesCurrent paymentTransfers and subsidiesPayment for capital assets
6.2 Spatial Planning & InformationCurrent paymentTransfers and subsidiesPayment for capital assets
6.3 South African Council forPlannersCurrent paymentTransfers and subsidiesPayment for capital assets
Total
AdjustedAppro-priation
R'000
11,145-
511
18,474-
76
-2,080
-
32,286
Shifting ofFunds
R'000
4,400-
80
(450)-
270
---
4,300
Virement
R'000
(113)-
(391)
(1,207)-
(41)
---
(1,752)
FinalAppro-priation
R'000
15,432-
200
16,817-
305
-2,080
-
34,834
Variance
R'000
5--
36-1
-536
-
578
Expen-diture as% of final
appro-priation
%
100.0%-
100.0%
99.8%-
99.7%
-74.2%
-
98.3%
FinalAppro-priation
R'000
11,971-
760
9,028-
259
---
22,018
Actualexpen-diture
R'000
11,943-
640
9,019-
234
---
21,836
ActualExpen-diture
R'000
15,427-
200
16,781-
304
-1,544
-
34,256
2008/09 2007/08

1 APRIL 2008 - 31 MARCH 2009 73
Details per Sub-Programme
7.1 Government Motor TransportCurrent paymentTransfers and subsidiesPayment for capital assets
7.2 Registration of Deeds TradingAccountCurrent paymentTransfers and subsidiesPayment for capital assets
7.3 Sector Education & Training AuthorityCurrent paymentTransfers and subsidiesPayment for capital assets
7.4 Capital WorksCurrent paymentTransfers and subsidiesPayment for capital assets
Total
AdjustedAppro-priation
R'000
---
-1-
-1-
10,162--
10,164
Shifting ofFunds
R'000
---
---
---
---
-
Virement
R'000
---
-54,814
-
---
(7,780)--
47,034
FinalAppro-priation
R'000
---
-54,815
-
-1-
2,382--
57,198
Variance
R'000
---
-1-
-1-
---
2
Expen-diture as% of final
appro-priation
%
---
-100.0%
-
---
100.0%--
100.0%
FinalAppro-priation
R'000
--
3,067
-1-
-1-
8,524--
11,593
Actualexpen-diture
R'000
--
2,982
---
---
3,274--
6,256
ActualExpen-diture
R'000
---
-54,814
-
---
2,382--
57,196
2008/09 2007/08
Programme 6 per economicclassification
Current paymentCompensation of employeesGoods & servicesInterest & rent on landFinancial transactions in assets &liabilitiesTransfers & subsidies to:Provinces & municipalitiesDepartmental agencies & accountsUniversities & technikonsForeign governments &international organisations Public corporations & privateenterprisesNon-profit institutionsHouseholdsPayment for capital assetsBuildings & other fixed structuresMachinery & equipmentBiological or cultivated assetsSoftware & other intangible assetsLand & subsoil assets
Total
AdjustedAppro-priation
R'000
18,76910,850
-
-
---
-
-2,080
-
-587
---
32,286
Shifting ofFunds
R'000
(701)4,651
-
-
---
-
---
-350
---
4,300
Virement
R'000
(700)(620)
-
-
---
-
---
-(432)
---
(1,752)
FinalAppro-priation
R'000
17,36814,881
-
-
---
-
-2,080
-
-505
---
34,834
Variance
R'000
7614
-
(49)
---
-
-536
-
-1---
578
Expen-diture as% of final
appro-priation
%
99.6%99.9%
-
-
---
-
-74.2%
-
-99.8%
---
98.3%
FinalAppro-priation
R'000
10,35310,646
-
-
---
-
---
-929
-90
-
22,018
Actualexpen-diture
R'000
10,31710,645
-
-
---
-
---
-874
---
21,836
ActualExpen-diture
R'000
17,29214,867
-
49
---
-
-1,544
-
-504
---
34,256
2008/09 2007/08
Programme 7: Auxiliary & Associated Services

DEPARTMENT OF LAND AFFAIRS: ANNUAL REPORT74
Programme 7 per economicclassification
Current paymentCompensation of employeesGoods & servicesInterest & rent on landFinancial transactions in assets &liabilitiesTransfers & subsidies to:Provinces & municipalitiesDepartmental agencies & accountsUniversities & technikonsForeign governments &international organisations Public corporations & privateenterprisesNon-profit institutionsHouseholdsPayment for capital assetsBuildings & other fixed structuresMachinery & equipmentBiological or cultivated assetsSoftware & other intangible assetsLand & subsoil assets
Total
AdjustedAppro-priation
R'000
-10,162
-
-
-
2
-
---
-----
10,164
Shifting ofFunds
R'000
---
-
-
-
-
---
-----
-
Virement
R'000
-(7,780)
-
-
-
54,814
-
---
-----
47,034
FinalAppro-priation
R'000
-2,382
-
-
-
54,816
-
---
-----
57,198
Variance
R'000
---
-
-
2
-
---
-----
2
Expen-diture as% of final
appro-priation
%
-100.0%
-
-
-
100.0%
-
---
-----
100.0%
FinalAppro-priation
R'000
-8,524
-
-
-
2
-
---
-3,067
---
11,593
Actualexpen-diture
R'000
-3,274
-
-
-
-
-
---
-2,982
---
6,256
ActualExpen-diture
R'000
-2,382
-
-
-
54,814
-
---
-----
57,196
2008/09 2007/08

1 APRIL 2008 - 31 MARCH 2009 75
1. Detail of transfers and subsidies as per Appropriation Act (after Virement):
Detail of these transactions can be viewed in note 8 (Transfers and subsidies) and Annexure 1 (A-F) to the Annual Financial Statements.
2. Detail of specifically and exclusively appropriated amounts voted (after Virement):
Detail of these transactions can be viewed in note 1 (Annual Appropriation) to the Annual Financial Statements.
3. Detail on financial transactions in assets and liabilities
Detail of these transactions per programme can be viewed in note 7 and 2 (Financial transactions in assets and liabilities) to the AnnualFinancial Statements.
4. Explanations of material variances from Amounts Voted (after Virement):
vote 27
Notes to the Appropriation Statementfor the year ended 31 March 2009
Variance as a % ofFinal Appropriation
%
-0,2%0,1%0,1%
-2%
-
VarianceR’000
12616978
2,6331,174
5782
Actual ExpenditureR’000
453,31671,875
116,3063,122,1482,799,539
34,25657,196
Final AppropriationR’000
453,44272,044
116,3843,124,7812,800,713
34,83457,198
4.1 Per Programme
AdministrationSurvey and MappingCadastral SurveysRestitutionLand ReformSpatial Planning and InformationAuxiliary and Associated Services
Variance as a % ofFinal Appropriation
%
0,4%0,2%
14,3%-
45,8%--
100%0,1%
25,7%0,1%
-0,3%
--
-
VarianceR’000
2,1751,096
1(2,361)
222-
11
5363,138
-133
--
16
Actual ExpenditureR’000
610,553631,882
62,361
2657,306
-
-1,1241,546
3,833,330
-41,624
--
1,474,878
Final AppropriationR’000
612,728632,978
7-
4857,308
-
11,1252,082
3,836,468
-41,757
--
1,474,894
4.2 Per Economic classification
Current paymentCompensation of employeesGoods & servicesInterest & rent on landFinancial transactions in assets & liabilities
Transfers & subsidies to:Provinces & municipalitiesDepartmental agencies & accountsUniversities & technikonsForeign governments & internationalorganisations Public corporations & private enterprisesNon-profit institutionsHouseholds
Payment for capital assetsBuildings & other fixed structuresMachinery & equipmentBiological or cultivated assetsSoftware & other intangible assetsLand & subsoil assets

DEPARTMENT OF LAND AFFAIRS: ANNUAL REPORT76
vote 27
Statement of Financial Performancefor the year ended 31 March 2009
Note
123
45673
8
9912
15163
2008/09R'000
6,659,39664,170
-
6,723,566
610,553631,883
62,3612,635
1,247,438
3,938,704
1,471,606--
1,471,606
6,657,748
65,818
4,76064,170(3,112)
65,818
2007/08R'000
5,928,269176,380
1,885
6,106,534
476,092668,388
-3,832
351,148,347
3,832,849
907,9038,433
-916,336
5,897,532
209,002
30,772176,380
1,850
209,002
REVENUEAnnual appropriationDepartmental revenueAid assistance
TOTAL REVENUE
EXPENDITURECurrent expenditureCompensation of employeesGoods and servicesInterest and rent on landFinancial transactions in assets and liabilitiesAid assistanceTotal current expenditure
Transfers and subsidies
Expenditure for capital assetsTangible capital assetsSoftware and other intangible assetsUnauthorised expenditure approved without fundingTotal expenditure for capital assets
TOTAL EXPENDITURE
SURPLUS/(DEFICIT) FOR THE YEARReconciliation of Net Surplus/(Deficit) for the year
Voted FundsDepartmental RevenueAid assistance
SURPLUS/(DEFICIT) FOR THE YEAR

1 APRIL 2008 - 31 MARCH 2009 77
vote 27
Statement of Financial Positionfor the year ended 31 March 2009
ASSETS
Current assetsFruitless and wasteful expenditureCash and cash equivalentsPrepayments and advancesReceivablesAid assistance receivable
Non-current assetsInvestments
TOTAL ASSETS
LIABILITIES
Current liabilitiesVoted funds to be surrendered to the Revenue FundDepartmental revenue to be surrendered to the Revenue FundPayablesAid assistance unutilised
TOTAL LIABILITIES
NET ASSETS
Represented by:Capitalisation reserveRecoverable revenue
TOTAL
Note
101112133
14
1516173
2008/09R'000
86,589596
59,8905,298
19,5431,262
16,11216,112
102,701
83,2074,7602,623
75,824-
83,207
19,494
16,1123,382
19,494
2007/08R'000
105,859596
87,3682,134
15,761-
16,11216,112
121,971
104,26730,7721,949
69,6961,850
104,267
17,704
16,1121,592
17,704

DEPARTMENT OF LAND AFFAIRS: ANNUAL REPORT78
vote 27
Statement of Changes in Net Assetsfor the year ended 31 March 2009
Note 2008/09R'000
16,11216,112
1,5921,790
(23)(515)
(1,461)3,7893,382
19,494
2007/08R'000
16,11216,112
1,264328
(3,832)3,233
(1,666)2,5931,592
17,704
Capitalisation Reserves
Opening balanceClosing balance
Recoverable revenueOpening balanceTransfers:Irrecoverable amounts written off
Debts revisedDebts recovered (included in departmental revenue)Debts raised
Closing balance
TOTAL

1 APRIL 2008 - 31 MARCH 2009 79
vote 27
Cash Flow Statementfor the year ended 31 March 2009
Note
123
18
112.3
19
2008/09R'000
6,722,6036,659,396
63,207-
(818)(94,268)
(1,247,438)(3,938,704)
1,441,375
(1,471,606)963
(1,470,643)
-1,790
-1,790
(27,478)
87,368
59,890
2007/08R’000
5,984,8525,928,269
54,6981,885
(3,894)(181,303)
(1,148,347)(3,832,849)
818,459
(916,336)2,468
(913,868)
119,214328
-119,542
24,133
63,235
87,368
CASH FLOWS FROM OPERATING ACTIVITIESReceipts
Annual appropriated funds receivedDepartmental revenue receivedLocal and foreign aid assistance received
Net increase/(decrease) in working capitalSurrendered to Revenue FundCurrent paymentsTransfers and subsidies paidNet cash flow available from operating activities
CASH FLOWS FROM INVESTING ACTIVITIESPayments for capital assetsProceeds from sale of capital assets
Net cash flows from investing activities
CASH FLOWS FROM FINANCING ACTIVITIESDistribution/dividend receivedIncrease/(decrease) in net assetsIncrease/(decrease) in non-current payables
Net cash flows from financing activities
Net increase/(decrease) in cash and cash equivalents
Cash and cash equivalents at the beginning of the period
Cash and cash equivalents at end of period
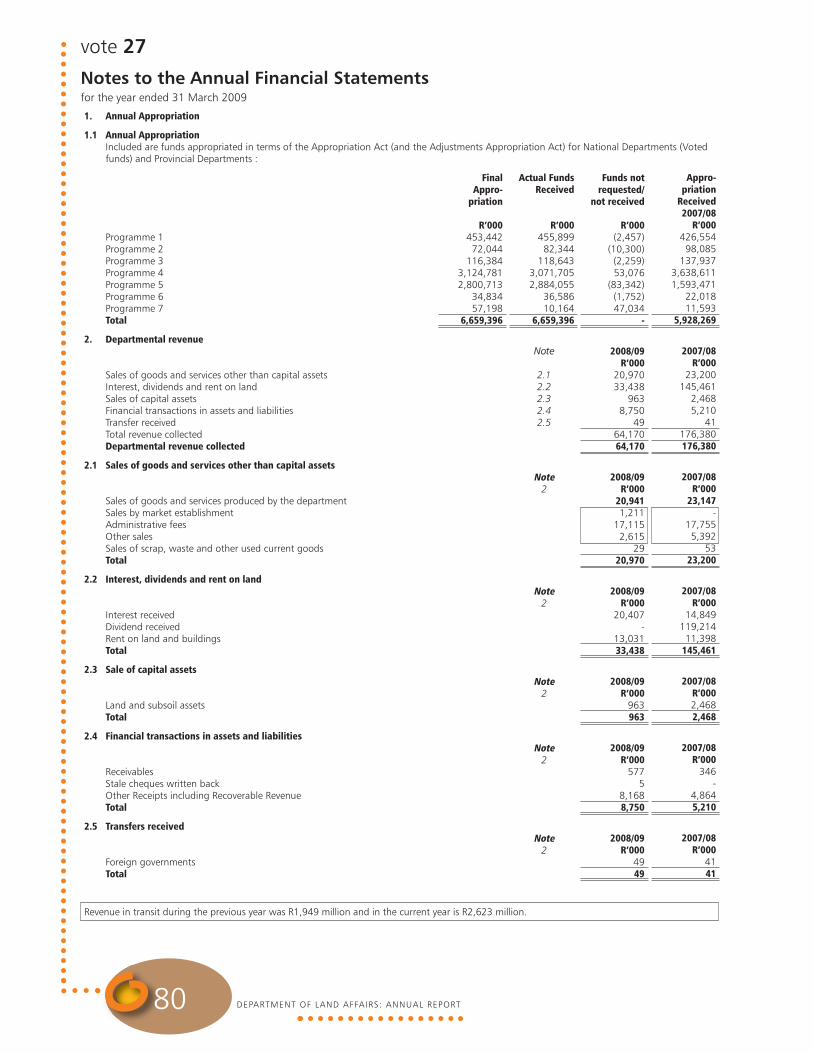
1. Annual Appropriation
1.1 Annual AppropriationIncluded are funds appropriated in terms of the Appropriation Act (and the Adjustments Appropriation Act) for National Departments (Votedfunds) and Provincial Departments :
Programme 1Programme 2Programme 3Programme 4Programme 5Programme 6Programme 7Total
2. Departmental revenue
Sales of goods and services other than capital assetsInterest, dividends and rent on landSales of capital assetsFinancial transactions in assets and liabilitiesTransfer received Total revenue collectedDepartmental revenue collected
2.1 Sales of goods and services other than capital assets
Sales of goods and services produced by the departmentSales by market establishmentAdministrative feesOther salesSales of scrap, waste and other used current goodsTotal
2.2 Interest, dividends and rent on land
Interest receivedDividend receivedRent on land and buildingsTotal
2.3 Sale of capital assets
Land and subsoil assetsTotal
2.4 Financial transactions in assets and liabilities
ReceivablesStale cheques written backOther Receipts including Recoverable RevenueTotal
2.5 Transfers received
Foreign governmentsTotal
Revenue in transit during the previous year was R1,949 million and in the current year is R2,623 million.
DEPARTMENT OF LAND AFFAIRS: ANNUAL REPORT80
vote 27
Notes to the Annual Financial Statementsfor the year ended 31 March 2009
FinalAppro-
priation
R’000453,44272,044
116,3843,124,7812,800,713
34,83457,198
6,659,396
Actual FundsReceived
R’000455,89982,344
118,6433,071,7052,884,055
36,58610,164
6,659,396
Note
2.12.22.32.42.5
Note2
Note2
Note2
Note2
Note2
Funds notrequested/
not received
R’000(2,457)
(10,300)(2,259)53,076
(83,342)(1,752)47,034
-
2008/09R’000
20,97033,438
9638,750
4964,17064,170
2008/09R’000
20,9411,211
17,1152,615
2920,970
2008/09R’000
20,407-
13,03133,438
2008/09R’000
963963
2008/09R’000
5775
8,1688,750
2008/09R’000
4949
Appro-priation
Received2007/08
R’000426,55498,085
137,9373,638,6111,593,471
22,01811,593
5,928,269
2007/08R’000
23,200145,461
2,4685,210
41176,380176,380
2007/08R’000
23,147-
17,7555,392
5323,200
2007/08R’000
14,849119,21411,398
145,461
2007/08R’0002,4682,468
2007/08R’000
346-
4,8645,210
2007/08R’000
4141
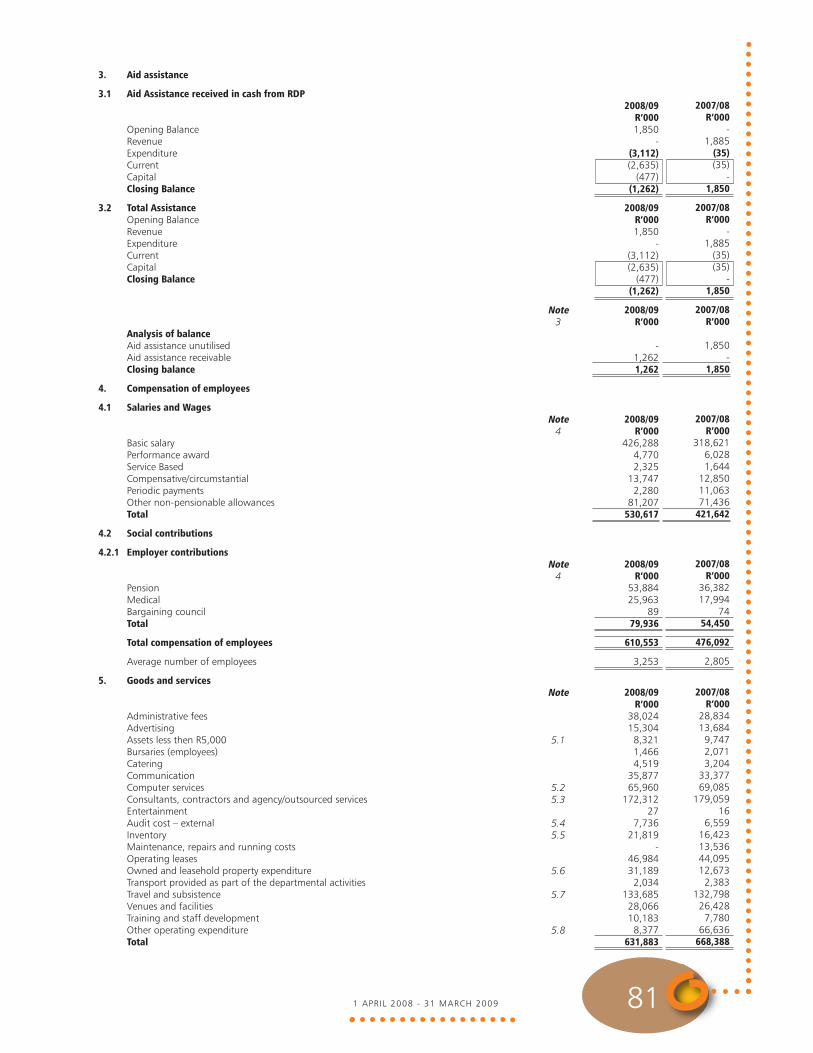
1 APRIL 2008 - 31 MARCH 2009 81
3. Aid assistance
3.1 Aid Assistance received in cash from RDP
Opening BalanceRevenue ExpenditureCurrentCapitalClosing Balance
3.2 Total AssistanceOpening BalanceRevenue ExpenditureCurrentCapitalClosing Balance
Analysis of balanceAid assistance unutilisedAid assistance receivableClosing balance
4. Compensation of employees
4.1 Salaries and Wages
Basic salaryPerformance awardService BasedCompensative/circumstantialPeriodic paymentsOther non-pensionable allowancesTotal
4.2 Social contributions
4.2.1 Employer contributions
PensionMedicalBargaining councilTotal
Total compensation of employees
Average number of employees
5. Goods and services
Administrative feesAdvertisingAssets less then R5,000Bursaries (employees)CateringCommunicationComputer servicesConsultants, contractors and agency/outsourced services EntertainmentAudit cost – externalInventoryMaintenance, repairs and running costsOperating leases Owned and leasehold property expenditureTransport provided as part of the departmental activitiesTravel and subsistenceVenues and facilitiesTraining and staff developmentOther operating expenditureTotal
Note3
Note4
Note4
Note
5.1
5.25.3
5.45.5
5.6
5.7
5.8
2008/09R’0001,850
-(3,112)(2,635)
(477)(1,262)
2008/09R’0001,850
-(3,112)(2,635)
(477)(1,262)
2008/09R’000
-1,2621,262
2008/09R’000
426,2884,7702,325
13,7472,280
81,207530,617
2008/09R’000
53,88425,963
8979,936
610,553
3,253
2008/09R’000
38,02415,3048,3211,4664,519
35,87765,960
172,31227
7,73621,819
-46,98431,1892,034
133,68528,06610,1838,377
631,883
2007/08R’000
-1,885
(35)(35)
-1,850
2007/08R’000
-1,885
(35)(35)
-1,850
2007/08R’000
1,850-
1,850
2007/08R’000
318,6216,0281,644
12,85011,06371,436
421,642
2007/08R’000
36,38217,994
7454,450
476,092
2,805
2007/08R’000
28,83413,6849,7472,0713,204
33,37769,085
179,05916
6,55916,42313,53644,09512,6732,383
132,79826,4287,780
66,636668,388

DEPARTMENT OF LAND AFFAIRS: ANNUAL REPORT82
5.1 Assets less than R5,000
Tangible assetsBiological/cultivated assetsMachinery and equipmentIntangible assetsTotal
5.2 Computer services
SITA computer servicesExternal computer service providersTotal
5.3 Consultants, contractors and agency/outsourced services
Business and advisory servicesInfrastructure and planningLegal costsContractorAgency and support/outsourced servicesTotal
5.4 Audit cost - external
Regulatory auditsOther auditsTotal
5.5 Inventory
Learning and teaching support materialFood and food suppliesFuel, oil and gasOther consumable materialsMaintenance materialStationery and printingMedical suppliesTotal
5.6 Owned and leasehold property expenditure
Municipal servicesOtherTotal
5.7 Travel and subsistence
Local ForeignTotal
5.8 Other operating expenditure
Professional bodies, membership and subscription feesResettlement costsOtherTotal
6. Interest and rent on land
Interest paidTotal
Note5
Note5
Note5
Note5
Note5
Note5
Note5
Note5
2008/09R’0008,321
5437,778
-8,321
2008/09R’000
22,70643,25465,960
2008/09R’000
74,76315,92720,21113,25348,158
172,312
2008/09R’0007,736
-7,736
2008/09R’000
35349830
1,340416
18,910272
21,819
2008/09R’0007,376
28,81331,189
2008/09R’000
132,1781,507
133,685
2008/09R’000
1995,0683,1108,377
2008/09R’000
66
2007/08R’0009,6543,3476,307
939,747
2007/08R’000
19,99449,09169,085
2007/08R’000
81,39418,62921,44126,36831,227
179,059
2007/08R’0004,8491,7106,559
2007/08R’000
13552926
713200
14,73288
16,423
2007/08R’000
12,673-
12,673
2007/08R’000
132,259539
132,798
2007/08R’000
7722,923
62,94166,636
2007/08R’000
--

1 APRIL 2008 - 31 MARCH 2009 83
7. Financial transactions in assets and liabilities
Other material losses written offDebts written offTotal
7.1 Other material losses written off
Nature of lossesOther MaterialTotal
7.2 Debts written off
Nature of debts written offState GuaranteeStudy DebtSupplier DeptSalary DebtTotal
8. Transfers and subsidies
Provinces and municipalitiesDepartmental agencies and accountsUniversities and technikonsForeign governments and international organisationsPublic corporations and private enterprisesNon-profit institutionsHouseholdsTotal
9. Expenditure for capital assets
Tangible assetsBuildings and other fixed structuresMachinery and equipmentLand and subsoil assets Biological or cultivated assets
Software and other intangible assetsOther intangibles
Total
9.1 Analysis of funds utilised to acquire capital assets – 2008/09
Tangible assetsMachinery and equipmentLand and subsoil assets
Total
9.2 Analysis of funds utilised to acquire capital assets – 2007/08
Total assets acquired
Note
7.17.2
Note7
Note7
Note
Annex 1AAnnex 1B
Annex 1DAnnex 1CAnnex 1EAnnex 1F
Note
29.131.1
30.1
Voted funds
R’0001,471,129
50,9401,420,189
1,471,129
Voted funds
R’000916 336
2008/09R’0002,338
232,361
2008/09R’000
2,3382,338
2008/09R’000
-2-
2123
2008/09R’000
2657,306
-1,124
-1,546
3,878,7023,938,704
2008/09R’000
1,471,606-
51,4171,420,189
-
--
1,471,606
Aidassistance
R’000477477
-
477
Aidassistance
R’000-
2007/08R’0003,723
1093,832
2007/08R’000
3,7233,723
2007/08R’000
36223021
109
2007/08R’000
772,351
-1,026
50-
3,829,3453,832,849
2007/08R’000
907,9032,442
63,137832,833
9,491
8,4338,433
916,336
Total
R’0001,471,606
51,4171,420,189
1,471,606
Total
R’000916 336
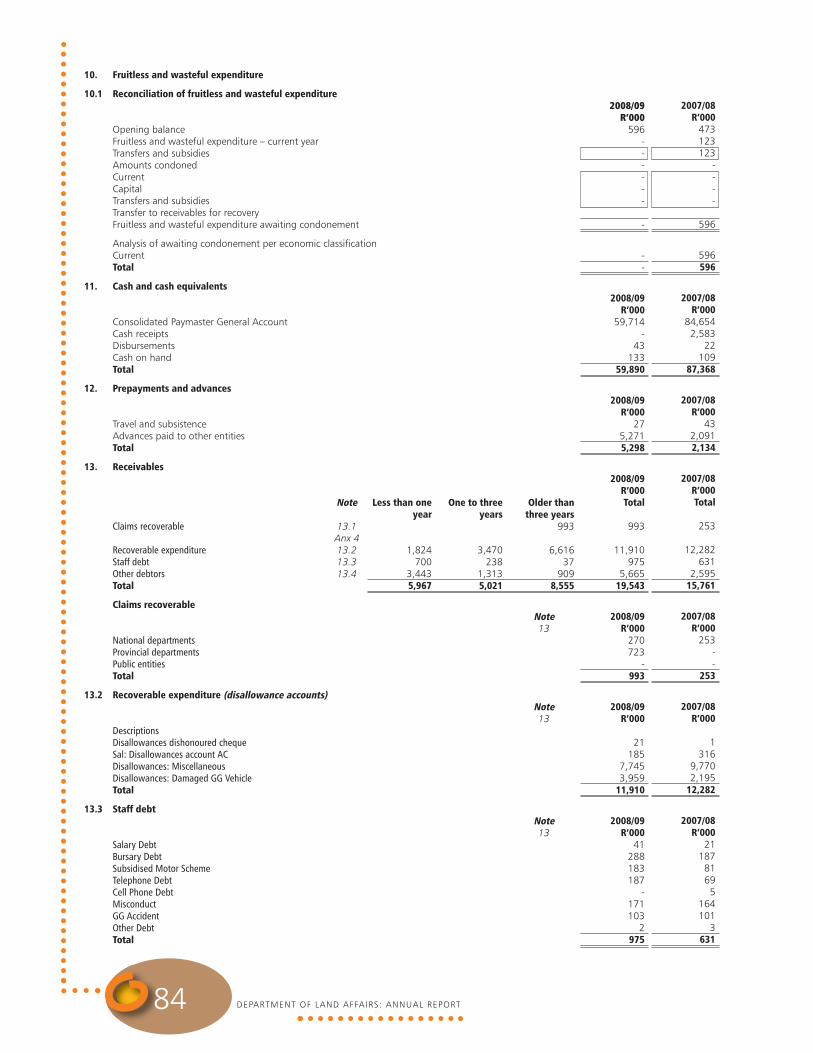
DEPARTMENT OF LAND AFFAIRS: ANNUAL REPORT84
10. Fruitless and wasteful expenditure
10.1 Reconciliation of fruitless and wasteful expenditure
Opening balanceFruitless and wasteful expenditure – current yearTransfers and subsidiesAmounts condonedCurrent CapitalTransfers and subsidiesTransfer to receivables for recoveryFruitless and wasteful expenditure awaiting condonement
Analysis of awaiting condonement per economic classificationCurrentTotal
11. Cash and cash equivalents
Consolidated Paymaster General AccountCash receiptsDisbursementsCash on handTotal
12. Prepayments and advances
Travel and subsistenceAdvances paid to other entitiesTotal
13. Receivables
Claims recoverable
Recoverable expenditureStaff debtOther debtorsTotal
Claims recoverable
National departmentsProvincial departmentsPublic entitiesTotal
13.2 Recoverable expenditure (disallowance accounts)
DescriptionsDisallowances dishonoured chequeSal: Disallowances account ACDisallowances: MiscellaneousDisallowances: Damaged GG VehicleTotal
13.3 Staff debt
Salary DebtBursary DebtSubsidised Motor SchemeTelephone DebtCell Phone DebtMisconductGG AccidentOther DebtTotal
One to threeyears
3,470238
1,3135,021
Less than oneyear
1,824700
3,4435,967
Note
13.1Anx 413.213.313.4
Older thanthree years
993
6,61637
9098,555
Note13
Note13
Note13
2008/09R’000
596------
-
--
2008/09R’000
59,714-
43133
59,890
2008/09R’000
275,2715,298
2008/09R’000Total
993
11,910975
5,66519,543
2008/09R’000
270723
-993
2008/09R’000
21185
7,7453,959
11,910
2008/09R’000
41288183187
-171103
2975
2007/08R’000
473123123
----
596
596596
2007/08R’000
84,6542,583
22109
87,368
2007/08R’000
432,0912,134
2007/08R’000Total
253
12,282631
2,59515,761
2007/08R’000
253--
253
2007/08R’000
1316
9,7702,195
12,282
2007/08R’000
2118781695
164101
3631

1 APRIL 2008 - 31 MARCH 2009 85
13.4 Other debtors
SG DebtorsSupplier DebtE – Staff Salary debtE – Staff Bursary Ex – Staff state Guarantees – HousingEx – Staff Telephone DebtEx – Staff Tax DebtEx – Staff Subsidised Motor Vehicle DebtEx – Staff Cell Phone DebtEx – Staff GG accidentsEx – Staff MisconductOther DebtorsClearing AccountsCriminal debtSal Tax Debt : CATransport suspenseSal Tax Debt : CLTotal
14. Investments
Non-CurrentShares and other equityInala Farms (Pty) LtdTotal
Total non-current
Analysis of non current investmentsOpening balanceClosing balance
15. Voted funds to be surrendered to the Revenue Fund
Opening balanceTransfer from statement of financial performancePaid during the yearClosing balance
16. Departmental revenue to be surrendered to the Revenue Fund
Opening balanceTransfer from Statement of Financial PerformancePaid during the yearClosing balance
17. Payables – current
DescriptionClearing accountsOther payablesTotal
17.1 Clearing accounts
DescriptionRestitution awards not claimed Total
17.2 Other payables
DescriptionSalaries : Pension Fund : CLSalaries : Medical : CLSalaries : Housing : CLSalaries : OverpaymentTransport Suspense AccountsSalaries : Tax DebtTotal
Note13
Note
Note
17.117.2
Note17
Note17
2008/09R’000
2309
1,1022,193
39781917537728
219---
1,141460
5,665
2008/09R’000
16,11216,112
16,112
16,11216,112
2008/09R’000
30,7724,760
(30,772)4,760
2008/09R’0001,949
64,170(63,496)
2,623
2008/09R’000
75,146678
75,824
2008/09R’000
75,14675,146
2008/09R’000
6259-
602-
678
2007/08R’000
2929
61573249386
2652682532
419131101
--
2,595
2007/08R’000
16,11216,112
16,112
16,11216,112
2007/08R’0004,645
30,772(4,645)30,772
2007/08R’0002,227
176,380(176,658)
1,949
2007/08R’000
69,379317
69,696
2007/08R’000
69,37969,379
2007/08R’000
18
291
20771
317

DEPARTMENT OF LAND AFFAIRS: ANNUAL REPORT86
18. Net cash flow available from operating activities
Net surplus/(deficit) as per Statement of Financial PerformanceAdd back non cash/cash movements not deemed operating activities(Increase)/decrease in receivables – current(Increase)/decrease in prepayments and advances(Increase)/decrease in other current assetsIncrease/(decrease) in payables – currentProceeds from sale of capital assetsExpenditure on capital assetsSurrenders to Revenue FundOther non-cash itemsNet cash flow generated by operating activities
19. Reconciliation of cash and cash equivalents for cash flow purposes
Consolidated Paymaster General accountCash receiptsDisbursementsCash on handTotal
2008/09R’000
65,8181,420,930
(3,782)(3,164)
-6,128(963)
1,471,606(94,268)
-1,441,748
2008/09R’000
59,714-
43133
59,890
2007/08R’000
209,002609,457
281,373(123)
(5,172)(2,468)
916,336(181,303)(119,214)
818,459
2007/08R’000
84,6542,583
22109
87,368

1 APRIL 2008 - 31 MARCH 2009 87
20. Contingent liabilities
Liable to NatureMotor vehicle guarantees EmployeesHousing loan guarantees EmployeesClaims against the departmentOther departments (interdepartmental unconfirmed balances) Total
21. Commitments
Current expenditureApproved and contractedApproved but not yet contracted
Capital expenditureApproved and contractedApproved but not yet contracted
Total Commitments
The closing balance as at 31 March 2008 for the Balance of Grant (BOG) commitments have been restated, by R61,6 million fromR443,9 million to R382,4 million as a result of a reconciliation during 2008/09 financial year.
22. Accruals
Listed by economic classification
Compensation of employeesGoods and servicesTransfers and subsidiesMachinery and equipmentLand and subsoil assetsOtherTotal
Listed by programme levelAdministrationSurveys & MappingCadastral ServicesRestitutionLand ReformSpatial Planning & informationTotal
Confirmed balances with other departmentsTotal
The R19,9 million paid after 30 days results in a non compliance; this is due to the augmentation of R54,8 million transferred to the DeedsTrading Account. Refer to the Accounting officers report and Treasury Regulation 19
23. Employee benefits
Leave entitlementThirteenth chequePerformance awardsCapped leave commitmentsTotal
30 Days-
12,025-
193--
12,218
Note
Annex 3AAnnex 3AAnnex 3BAnnex 5
30 Days +-
17,399-
2,585--
19,984
Note Annex 5
2008/09R’000
133291
394,481147
395,502
2008/09R’000
188,694663,941852,635
1,1677,955,9817,957,148
8,809,783
2008/09R’000
Total-
29,424-
2,778--
32,202
2008/09R’000
10,736649
1,0924,289
12,2283,208
32,202
2008/09R’000
16,16616,166
2008/09R’000
20,69718,0667,248
24,20070,211
2007/08R’000
204641
311,044626
312,515
2007/08R’000
116,516394,873511,389
4,5305,674,3225,678,852
6,190,241
2007/08R’000
Total5
31,993-
815136,561
188169,562
2007/08R’000
19,46654
4127,240
142,29793
169,562
2007/08R’0001,2471,247
2007/08R’000
17,29612,3787,141
21,61858,433
vote 27
Disclosure Notes to the Annual Financial Statementsfor the year ended 31 March 2009
These amounts are not recognised in the Annual Financial Statements and are disclosed to enhance the usefulness of the AnnualFinancial Statements.

DEPARTMENT OF LAND AFFAIRS: ANNUAL REPORT88
24. Lease commitmentsOperating leases expenditure2008/09
Not later than 1 yearLater than 1 year and not later than 5 yearsLater than five yearsTotal lease commitments
2007/08
Not later than 1 yearLater than 1 year and not later than 5 yearsTotal lease commitments
Finance leases expenditure**2008/09
Not later than 1 yearLater than 1 year and not later than 5 yearsLater than five yearsTotal lease commitmentsLess: Finance Cost
Total present value of lease liabilities
2007/08
Not later than 1 yearLater than 1 year and not later than 5 yearsTotal lease commitmentsTotal present value of lease liabilities
25. Receivables for departmental revenue
Interest, dividends and rent on landTotal
25.1 Analysis of receivables for departmental revenue
Opening balanceLess: Amounts receivedAdd: Amounts recognisedLess: Amounts written-off/reversed as irrecoverableClosing balance
Opening balance has been restated for interest receivable from conveyancers, state land leases both DLA and PLAS, and SITA credit note.Receivable on rent on land as at 31 March 2009 is R50,878 million, POA is R5,193 million, Interest receivable from conveyancers underRestitution is R30,638 million and SITA credit note is R1,211 million as well as R4,604 million owed to the department for fraud caseW Ruiters
26. Irregular expenditure
26.1 Reconciliation of irregular expenditure
Opening balanceAdd irregular expenditure-relating to prior year Add irregular expenditure-relating to current yearLess: Amounts condonedCurrent expenditureExpenditure for capital assetsIrregular expenditure awaiting condonationAnalysis of awaiting condonation per age classificationCurrent yearPrior yearsTotal
R64,573 million relates to all assets acquired through Pro-active Land Acquisition Strategy from 2006 to mid 2008, the R10,384 million isfor 2008/09 before the amendment of Act 126 of 1993 was approved .
Land
----
Land
---
Land
-----
-
Land
----
Buildings andother fixedstructures
14,019115,280
2,776132,075
Buildings andother fixedstructures
23,37046,74070,110
Buildings andother fixedstructures
-----
-
Buildings andother fixedstructures
----
Machineryand
equipment----
Machineryand
equipment9113
104
Machineryand
equipment11,2506,377
-17,627(1,247)
16,380
Machineryand
equipment2,7212,7725,4935,493
2008/09R’000
92,52492,524
2008/09R’000
64,77732,54460,291
-92,524
2008/09R’000
10,04864,57310,384
(10,048)(10,048)
-74,957
10,38464,57374,957
Total
14,019115,280
2,776132,075
Total
23,46146,75370,214
Total
11,2506,377
-17,627(1,247)
16,380
Total
2,7212,7725,4935,493
2007/08R’000
64,77764,777
2007/08R’000
34,103--
(24,055)21,8032,252
10,048
-10,04810,048

1 APRIL 2008 - 31 MARCH 2009 89
26.2 Details of irregular expenditure condoned
Incident Condoned by (condoning authority)Tender process not followed National TreasuryMismanagement of transferred funds National Treasury
27. Fruitless and wasteful expenditure
27.1 Reconciliation of fruitless and wasteful expenditure
Opening balanceAdd fruitless and wasteful expenditure-relating to prior yearAdd fruitless and wasteful expenditure-relating to current yearLess amount condonedLess: Amounts transferred to receivables for recoveryFruitless and wasteful expenditure awaiting condonementAnalysis of awaiting condonement per economic Current ExpenditureCapital ExpenditureTransfers and subsidiesTotal
Analysis of Current Years Fruitless and Wasteful expenditure
Incident Disciplinary steps taken/criminal proceedings
Purchase of the Gorah Farm market value Responsible officials have already been suspendedPayments made were not in accordance with the intended purpose - Responsible officials have already been suspendedCornucopia project Total
The Department envisage that an amount of R4,863,851.49 will be Fruitless and Wasteful Expenditure.An independent auditing firm was requested by the Department to launch an investigation regarding two projects (Gorah Farm andCornucopia) that were purchased through PLAS. The investigation is still ongoing but a recommendation was done by the independentaudit firm that an amount of R3,650,000 for Gorah Farm and R1,213,851.49 for Cornucopia should be declared in the financialstatements as Fruitless and Wasteful Expenditure.
28. Related party transactions
Ministerial Portfolio Department Schedule Public Entity
Agriculture & Land Affairs Land Affairs 3A Ingonyama Trust Board
3B Inala Farms (Pty) Ltd.
Agriculture 2 Land & Agricultural Bank of South Africa
3A Agricultural Research Council
3A National Agricultural Marketing Council
3A Perishable Products Export Control Board (PTY)
3B Ncera Farms Biological Products
3B Onderstepoort
29. Key management personnel
Political office bearers (provide detail below)Officials:Level 15 to 16Level 14 (incl CFO if at a lower level)Total
30. Provisions
ProvisionsImpairment of investments Irrecoverable other Advance to MunicipalitiesTotal
No. ofIndividuals
1321
2008/09R’0006,0484,000
10,048
2008/09R’000
596596
4,864--
5,460
4734,864
1235,460
2008/09R’000
8,19911,95920,158
2008/09R’000
16,11242,3671,119
59,598
2007/08R’000
473123
---
596
473-
123596
2008/09R’000
3,6501,214
4,864
2007/08R’000
4,82611,94716,773
2007/08R’000
16,11216,9942,091
35,197
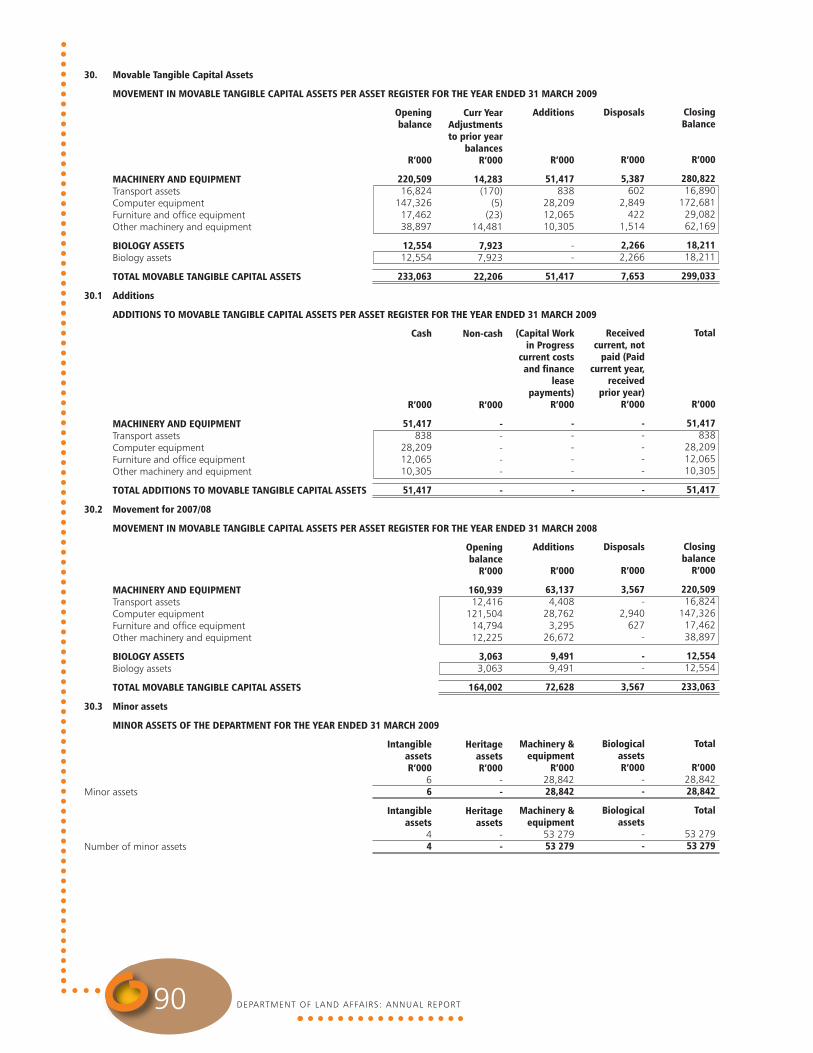
DEPARTMENT OF LAND AFFAIRS: ANNUAL REPORT90
30. Movable Tangible Capital Assets
MOVEMENT IN MOVABLE TANGIBLE CAPITAL ASSETS PER ASSET REGISTER FOR THE YEAR ENDED 31 MARCH 2009
MACHINERY AND EQUIPMENTTransport assetsComputer equipmentFurniture and office equipmentOther machinery and equipment
BIOLOGY ASSETSBiology assets
TOTAL MOVABLE TANGIBLE CAPITAL ASSETS
30.1 Additions
ADDITIONS TO MOVABLE TANGIBLE CAPITAL ASSETS PER ASSET REGISTER FOR THE YEAR ENDED 31 MARCH 2009
MACHINERY AND EQUIPMENTTransport assetsComputer equipmentFurniture and office equipmentOther machinery and equipment
TOTAL ADDITIONS TO MOVABLE TANGIBLE CAPITAL ASSETS
30.2 Movement for 2007/08
MOVEMENT IN MOVABLE TANGIBLE CAPITAL ASSETS PER ASSET REGISTER FOR THE YEAR ENDED 31 MARCH 2008
MACHINERY AND EQUIPMENTTransport assetsComputer equipmentFurniture and office equipmentOther machinery and equipment
BIOLOGY ASSETSBiology assets
TOTAL MOVABLE TANGIBLE CAPITAL ASSETS
30.3 Minor assets
MINOR ASSETS OF THE DEPARTMENT FOR THE YEAR ENDED 31 MARCH 2009
Minor assets
Number of minor assets
Curr YearAdjustmentsto prior year
balancesR’000
14,283(170)
(5)(23)
14,481
7,9237,923
22,206
Non-cash
R’000
-----
-
Openingbalance
R’000
160,93912,416
121,50414,79412,225
3,0633,063
164,002
HeritageassetsR’000
--
Heritageassets
--
Openingbalance
R’000
220,50916,824
147,32617,46238,897
12,55412,554
233,063
Cash
R’000
51,417838
28,20912,06510,305
51,417
IntangibleassetsR’000
66
Intangibleassets
44
Additions
R’000
51,417838
28,20912,06510,305
--
51,417
(Capital Workin Progress
current costsand finance
leasepayments)
R’000
-----
-
Additions
R’000
63,1374,408
28,7623,295
26,672
9,4919,491
72,628
Machinery &equipment
R’00028,84228,842
Machinery &equipment
53 27953 279
Disposals
R’000
5,387602
2,849422
1,514
2,2662,266
7,653
Receivedcurrent, not
paid (Paidcurrent year,
receivedprior year)
R’000
-----
-
Disposals
R’000
3,567-
2,940627
-
--
3,567
BiologicalassetsR’000
--
Biologicalassets
--
ClosingBalance
R’000
280,82216,890
172,68129,08262,169
18,21118,211
299,033
Total
R’000
51,417838
28,20912,06510,305
51,417
Closingbalance
R’000
220,50916,824
147,32617,46238,897
12,55412,554
233,063
Total
R’00028,84228,842
Total
53 27953 279

1 APRIL 2008 - 31 MARCH 2009 91
31. Intangible Capital Assets
MOVEMENT IN INTANGIBLE CAPITAL ASSETS PER ASSET REGISTER FOR THE YEAR ENDED 31 MARCH 2009
COMPUTER SOFTWARETOTAL INTANGIBLE ASSETS
31.1 Movement for 2007/2008
MOVEMENT IN INTANGIBLE CAPITAL ASSETS PER ASSET REGISTER FOR THE YEAR ENDED 31 MARCH 2008
COMPUTER SOFTWARETOTAL
32. Immovable Tangible Capital Assets
MOVEMENT IN IMMOVABLE TANGIBLE CAPITAL ASSETS PER ASSET REGISTER FOR THE YEAR ENDED 31 MARCH 2009
BUILDINGS AND OTHER FIXED STRUCTURESOther fixed structuresLAND AND SUBSOIL ASSETSLand TOTAL IMMOVABLE TANGIBLE CAPITAL ASSETS
32.1 Additions
ADDITIONS TO IMMOVABLE TANGIBLE CAPITAL ASSETS PER ASSET REGISTER FOR THE YEAR ENDED 31 MARCH 2009
LAND AND SUBSOIL ASSETSLandTOTAL ADDITIONS TO IMMOVABLE TANGIBLE CAPITAL ASSETS
32.2 Movement for 2007/2008
MOVEMENT IN IMMOVABLE TANGIBLE CAPITAL ASSETS PER ASSET REGISTER FOR THE YEAR ENDED 31 MARCH 2008
BUILDINGS AND OTHER FIXED STRUCTURESOther fixed structuresLAND AND SUBSOIL ASSETSLandTOTAL IMMOVABLE TANGIBLE CAPITAL ASSETS
32.3 Immovable assets valued at R1
IMMOVABLE ASSETS VALUED AT R1 IN THE ASSET REGISTER FOR 31 MARCH 2009
R1 Immovable assets TOTAL
Current YearAdjustmentsto prior year
balancesR’000
1,9751,975
Openingbalance
R’000
39,31339,313
Current YearAdjustmentsto prior year
balancesR’000
(2,442)-
40,11837,676
Non-cash
R’000
--
Openingbalance
R’000
-
322,518322,518
Heritageassets
R
--
Openingbalance
R’000
47,74647,746
Openingbalance
R’000
2,442
1,155,3511,157,793
Cash
R’000
1,420,1881,420,188
Buildingsand other
fixedstructures
R
--
Additions
R’000
--
Additions
R’000
8,4338,433
Additions
R’000
--
1,420,1881,420,188
(Capital Workin Progress
current costsand finance
leasepayments)
R’000
--
Additions
R’000
2,442
832,833835,275
Land andsubsoil assets
R
35,725 35,725
Disposals
R’000
--
Disposals
R’000
--
Disposals
R’000
----
Receivedcurrent, not
paid (Paidcurrent year,
receivedprior year)
R’000
--
Disposals
R’000
-
--
Investmentproperty
R
--
ClosingBalance
R’000
49,72149,721
Closingbalance
R’000
47,74647,746
ClosingBalance
R’000
--
2,615,6572,615,657
Total
R’000
1,420,1881,420,188
ClosingBalance
R’000
2,442
1,155,3511,157,793
Total
R
35,725 35,725

DEPARTMENT OF LAND AFFAIRS: ANNUAL REPORT92
vote 27
Annexures to the Annual Financial Statementsfor the year ended 31 March 2009
Annexure 1AStatement of Conditional Grants paid to Provinces
NAME OF PRO-VINCE/ GRANT
MunicipalRates & taxesLevies VehicleLicences
TOTAL
Division ofRevenue
Act
R’000
-
-
-
Roll Overs
R’000
-
-
-
Adjust-ments
R'000
-
-
-
Total -Available
R'000
-
-
-
ActualTransfer
R'000
-
26
26
% of Avail-able funds
Trans-ferred
%
-
-
-
Amountreceived
by depart-ment
R'000
-
-
-
Amountspent by
depart-ment
R'000
-
-
-
% ofavailable
fundsspent by
depart-ment
%
-
-
-
Division ofRevenue
Act
R’000
1
76
77
GRANT ALLOCATION TRANSFER SPENT 2007/08
Annexure 1BStatement of Transfers to Departmental Agencies and Accounts
DEPARTMENT/ AGENCY/ ACCOUNT
Ingonyama Trust BoardDeeds Trading Account
TOTAL
AdjustedAppro-
priationAct
R'000
--
-
Roll Overs
R'000
--
-
Adjust-ments
R'000
--
-
TotalAvailable
R'000
--
-
ActualTransfer
R'000
2,49254,814
57,306
% ofAvailable
fundsTrans-ferred
%
--
-
Appro-priation
Act
R'000
2,351-
2,351
TRANSFER ALLOCATION TRANSFER 2007/08
Annexure 1CStatement of Transfers/Subsidies to Public Corporations and Private Enterprises
NAME OF PUBLICCORPORATION/ PRIVATEENTERPRISE
Private EnterprisesNon life insurance premiums
TOTAL
AdjustedAppro-
priationAct
R'000
-
-
Roll Overs
R'000
-
-
Adjust-ments
R'000
-
-
TotalAvailable
R'000
-
-
ActualTransfer
R'000
-
-
% ofAvailable
fundsTrans-ferred
%
-
-
Capital
R'000
-
-
Current
R'000
-
-
Appro-priation
Act
R'000
50
50
TRANSFER ALLOCATION EXPENDITURE 2007/08
Annexure 1DStatement of Transfers to Foreign Government and International Organisations
FOREIGN GOVERNMENT/ INTERNATIONALORGANISATION
Subscriptions : UNIVFOD
TOTAL
AdjustedAppro-
priationAct
R'000
-
-
Roll overs
R'000
-
-
Adjust-ments
R'000
-
-
TotalAvailable
R'000
-
-
ActualTransfer
R'000
1,124
1,124
% ofAvailable
fundsTrans-ferred
%
-
-
Appro-priation
Act
R'000
1,026
1,026
TRANSFER ALLOCATION EXPENDITURE 2007/08

1 APRIL 2008 - 31 MARCH 2009 93
Annexure 1EStatement of Transfers to Non-Profit Institutions
NON-PROFIT INSTITUTIONS
TransfersSouth African Council for PlannersContribution for HIV and AIDS
TOTAL
AdjustedAppro-
priationAct
R'000
--
-
Roll overs
R'000
--
-
Adjust-ments
R'000
--
-
TotalAvailable
R'000
--
-
ActualTransfer
R'000
1,5442
1,546
% ofAvailable
fundsTrans-ferred
%
--
-
Appro-priation
Act
R'000
--
-
EXPENDITURETRANSFER ALLOCATION 2007/08
Annexure 1FStatement of Transfers to Households
HOUSEHOLDS
Restitution Grants (Beneficiaries)Land Reform Grants (Beneficiaries)Social Benefits Bursaries (Non Employees)Households
TOTAL
AdjustedAppro-
priationAct
R'000
----
-
Roll Overs
R'000
----
-
Adjust-ments
R'000
----
-
TotalAvailable
R'000
----
-
ActualTransfer
R'000
2,783,6651,080,507
1,55712,973
3,878,702
% ofAvailable
fundsTrans-ferred
%
----
-
Appro-priation
Act
R'000
3,333,531483,087
7,4004,927
3,829,345
EXPENDITURETRANSFER ALLOCATION 2007/08
Annexure 2AStatement of Investments in and Amounts owing by/to Entities as at 31 March 2009
Name of PublicEntity
Controlled entitiesInala Farms (Pty)Ltd
Total
Nature of business
Land ReformProject
2008/09
-
-
2007/08
16,112
16,112
2008/09
-
-
2007/08
-
-
2008/09
-
-
2007/08
-
-
2008/09
-
-
2007/08
-
-
Net Asset value ofInvestment
R’000
Cost of investment
R’000
Amounts owing toEntitiesR'000
Amounts owing byEntitiesR'000

DEPARTMENT OF LAND AFFAIRS: ANNUAL REPORT94
Annexure 3AStatement of Financial Guarantees issued as at 31 March 2008 – Local
Guarantorinstitution
STANNIC
Subtotal
ABSA BOE (Ltd)First Rand BankFirst Rand Bank FNBSMpumalangaNedbankNedbankincorporated BOEOld MutualStandard BankPeoples Bank LTDFBC
Subtotal
Total
Guaranteein respectof
Motorvehicles
HousingHousing HousingHousingHousingHousing
HousingHousingHousing
Housing
Originalguaranteed
capitalamount
R’000
275
275
------
---
-
-
275
Openingbalance
1 April 2008R’000
204
204
75-
3567
-15
-10
218
-
420
624
Guaranteesdraw
downsduring the
yearR’000
-
-
2516311711
-
118
71
44
234
234
Guaranteesrepay-ments/
cancelled/reduced/released
during theyear
R’000
71
71
17-
50171115
1111
187
44
263
434
Revalua-tionsR’000
-
-
------
---
-
-
-
Closingbalance
31 March2009
R’000
133
133
83161667
--
-7-
102
291
424
Guaranteedinterest foryear ended
31 March2009
R’000
-
-
------
---
-
-
-
Realisedlosses not
recoverablei.e. claims
paid out’000
-
-
------
---
-
-
-

1 APRIL 2008 - 31 MARCH 2009 95
Annexure 3BStatement of Contingent Liabilities as at 31 March 2009
Nature of Liability
Claims against the departmentMulaudzi & Associates – Arbitration matter : Mulaudzi & Associates – Arbitration matter :Mulaudzi & Associates – Arbitration matter :Evelyn Valley Fire ClaimKubisie Fire ClaimCJ Rance Fire Claim 4113/04/Z12, 3472/02/Z33 and3038/05/Z62A MandoloPhela Ophedise Evangelical Lutheran Church Of SARodendaal Pty LtdPrinshoek BoerderyChloe Boedery CCClarke & OthersUniverse Ranch V Regional Land Claims KZNMacassar Land Claims committeeY SolomonW BoothDistrict Six Cape TownA Florence Adam,Moosa,EbrahamMM MeyerMorapedi Howard SeoueShamile CPACNM DlaminiRF CrowwterJSS BallotGoronyaneParsonsDD JacobsAG MacdonaldG JoubertF J Van NierkerkLV MaySS FreightJJ BothWolfaardtSilverline investmentAJ MeintjiesJB SpaumerJ MeintjiesHorseshoe sugar estateFarjasKwabhekithungaS H MjwaraCrown Buildings servicesM SerobeM LethobaDwarsloop Land Restitution ProjectMokhathi ProjectsOutstanding Cases with State Attorneys:KZN
Total
OpeningBalance
01/04/2008
R’000
9444
8764,0006,886
16,783-
1,16446,98718,500
1471,3444,702
542-----------------------------------
7,852
235,759
Liabilitiesincurred
during theyear
R’000
-----
-183
-------
900300600380400
1,50048,000
6598
1095,0001,0003,500
176,000
11,4426,5084,464
47,0002,000
74412614
346423800258
2,782537
12316040
7639-
158,722
Liabilitiespaid/
cancelled/reduced
during theyear
R’000
-----
---------------------------------------------
-
Liabilitiesrecoverable
(Providedetails
hereunder)
R’000
-----
---------------------------------------------
-
ClosingBalance
31/03/2009
R’000
9444
8764,0006,886
16,783 183
1,16446,98718,500
1471,3444,702
542900300600380400
1,50048,000
6598
1095,0001,0003,500
176,000
11,4426,5084,464
47,0002,000
74412614
346423800258
2,782537
12316040
7639
7,852
394,481

DEPARTMENT OF LAND AFFAIRS: ANNUAL REPORT96
Annexure 4Claims Recoverable
GOVERNMENT ENTITY
DEPARTMENTSAgricultureAgriculture: North WestEnvironmental and TourismKZN: Agriculture and EnvironmentTrade and IndustryJusticeSASSASocial DevelopmentStatistics SAKZN: HousingKZN: TransportProvincial and Local GovernmentNW: Provincial AdministrationAgriculture: Free State 107EC Province 11WC Province 12LP Province 33Provincial PWD 5KZN Provincial 1
Other Government EntitiesDeeds Trading Account
Total
31/03/2009R’000
--------------------
-
-
31/03/2008R’000
--------------------
-
-
31/03/2009R’000
18079
328----
1919747------
310
638
993
31/03/2008R’000
-----1
492212
----
10711123351
253
-
253
31/03/2009R’000
18079
328----
1919747------
310
638
993
31/03/2008R’000
-----1
492212
----
10711123351
253
-
253
Confirmed balanceoutstanding
Unconfirmed balanceoutstanding
Total
Annexure 5Inter-Government Payables
GOVERNMENT ENTITY
DEPARTMENTSCurrentForeign AffairsJusticeSASSAWater Affairs and ForestryCorrectional ServicesEnvironmental Affairs & TourismEC HealthEnvironmental Affairs: KZNKZN TransportPublic WorksEC TreasuryAgricultureNational Intelligence AgencySAPS
Subtotal
Total
31/03/2009R’000
-7,167
-------
6,822-
2,13245
-
16,166
16,166
31/03/2008R’000
-1,157
-------
90----
1,247
1,247
31/03/2009R’000
4------------
143
147
147
31/03/2008R’000
63-8
261181275
38-
367---
626
626
31/03/2009R’000
47,167
-------
6,822-
2,13245
143
16,313
16,313
31/03/2008R’000
631,157
8261181275
3890
367---
1,873
1,873
Confirmed balanceoutstanding
Unconfirmed balanceoutstanding
Total

land affairs
1 APRIL 2008 - 31 MARCH 2009 97
R
part4R E P O R T B YT H E A U D I T O R -G E N E R A LO N T H E D E E D SR E G I S T R A T I O NT R A D I N GA C C O U N T
Report bythe Auditor-General onthe Deeds
RegistrationTrading Account
FOR THE YEAR ENDED 31 MARCH 2009
Report of the Auditor-General to Parliament onthe financial statements and performanceinformation of the Deeds Registration TradingAccount for the year ended 31 March 2009
Report on thefinancial statementsIntroduction1. I have audited the accompanying financial
statements of the Deeds RegistrationTrading Account which comprise thestatement of financial position as at 31March 2009, and the statement offinancial performance, the statement ofchanges in net assets and the cash flowstatement for the year then ended, and asummary of significant accounting policiesand other explanatory notes as set out inpages 100 to 113.
The accounting officer’sresponsibility for thefinancial statements2. The accounting officer is responsible for
the preparation and fair presentation ofthese financial statements in accordancewith the South African Statements ofGenerally Accepted Accounting Practice(SA Statements of GAAP) and in themanner required by the Public Finance
Management Act, 1999 (Act No. 1 of1999) (PFMA) and for such internal controlas the accounting officer determines isnecessary to enable the preparation offinancial statements that are free frommaterial misstatement, whether due tofraud or error.
The Auditor-General’sresponsibility3. As required by section 188 of the
Constitution of the Republic of SouthAfrica, 1996 read with section 4 of thePublic Audit Act, 2004 (Act No. 25 of2004) (PAA), my responsibility is to expressan opinion on these financial statementsbased on my audit.
4. I conducted my audit in accordance withthe International Standards on Auditingread with General Notice 616 of 2008,issued in Government Gazette No. 31057of 15 May 2008. Those standards requirethat I comply with ethical requirementsand plan and perform the audit to obtainreasonable assurance about whether thefinancial statements are free from materialmisstatement.
5. An audit involves performing proceduresto obtain audit evidence about theamounts and disclosures in the financialstatements. The procedures selecteddepend on the auditor’s judgement,including the assessment of the risks ofmaterial misstatement of the financial

land a
ffair
s
DEPARTMENT OF LAND AFFAIRS: ANNUAL REPORT98
statements, whether due to fraud or error. In makingthose risk assessments, the auditor considers internalcontrol relevant to the entity’s preparation and fairpresentation of the financial statements in order todesign audit procedures that are appropriate in thecircumstances, but not for the purpose of expressing anopinion on the effectiveness of the entity’s internalcontrol. An audit also includes evaluating theappropriateness of accounting policies used and thereasonableness of accounting estimates made bymanagement, as well as evaluating the overallpresentation of the financial statements.
6. I believe that the audit evidence I have obtained issufficient and appropriate to provide a basis for myaudit opinion.
Opinion 7. In my opinion the financial statements present fairly, in
all material respects, the financial position of the Deeds
Registration Trading Account as at 31 March 2009 andits financial performance and its cash flows for the yearthen ended, in accordance with SA Statements of GAAPand in the manner required by the PFMA.
Governance framework8. The governance principles that impact the auditor’s
opinion on the financial statements are related to theresponsibilities and practices exercised by the accountingauthority and executive management and are reflectedin the key governance responsibilities addressed below:
Key governance responsibilities9. The PFMA tasks the accounting officer with a number of
responsibilities concerning financial and riskmanagement and internal control. Fundamental toachieving this is the implementation of key governanceresponsibilities, which I have assessed as follows:
No. Matter Y N
Clear trail of supporting documentation that is easily available and provided in a timely manner
1. No significant difficulties were experienced during the audit concerning delays or the availability ofrequested information.
Quality of financial statements and related management information
2. The financial statements were not subject to any material amendments resulting from the audit.
3. The annual report was submitted for consideration prior to the tabling of the auditor’s report.
Timeliness of financial statements and management information
4. The annual financial statements were submitted for auditing as per the legislated deadlinessection 40/55 of the PFMA.
Availability of key officials during audit
5. Key officials were available throughout the audit process.
Development and compliance with risk management, effective internal control and governance practices
6. Audit committee
• The entity had an audit committee in operation throughout the financial year.
• The audit committee operates in accordance with approved, written terms of reference.
• The audit committee substantially fulfilled its responsibilities for the year, as set out insection 77 of the PFMA and Treasury Regulation 3.1.10/27.1.8.
7. Internal audit
• The entity had an internal audit function in operation throughout the financial year.
• The internal audit function operates in terms of an approved internal audit plan.
• The internal audit function substantially fulfilled its responsibilities for the year, as set out inTreasury Regulation 3.2/27.2.
8. There are no significant deficiencies in the design and implementation of internal control in respectof financial and risk management.
�
��
�
�
���
��
�
�
�

land a
ffair
s
1 APRIL 2008 - 31 MARCH 2009 99
No. Matter Y N
9. There are no significant deficiencies in the design and implementation of internal control in respectof compliance with applicable laws and regulations.
10. The information systems were appropriate to facilitate the preparation of the financial statements.
11. A risk assessment was conducted on a regular basis and a risk management strategy, which includesa fraud prevention plan, is documented and used as set out in Treasury Regulation 3.2/27.2.
12. Delegations of responsibility are in place, as set out in section 44/56 of the PFMA.
Follow-up of audit findings
13. The prior year audit findings have been substantially addressed.
14. SCOPA/Oversight resolutions have been substantially implemented.
Issues relating to the reporting of performance information
15. The information systems were appropriate to facilitate the preparation of a performance report thatis accurate and complete.
16. Adequate control processes and procedures are designed and implemented to ensure the accuracyand completeness of reported performance information.
17. A strategic plan was prepared and approved for the financial year under review for purposes of monitoring the performance in relation to the budget and delivery by the entity against its mandate, predeterminedobjectives, outputs, indicators and targets Treasury Regulation 29.1/30.1.
18. There is a functioning performance management system and performance bonuses are only paidafter proper assessment and approval by those charged with governance.
�
�
��
��
�
�
�
�
Investigations 10. An investigation is being performed by internal audit in
respect of allegations of corruption at one of the DeedsRegistration’s regional offices. The investigation was stillongoing at the reporting date.
Report on other legal ®ulatory requirementsReport on performanceinformation11. I have reviewed the performance information as set out
on pages 100 to 113 as part of Department of LandAffairs audit. Findings identified will be reported as partof Department of Land Affair’s audit report.
Appreciation12. The assistance rendered by the staff of the Deeds
Registration Trading Account during the audit issincerely appreciated.
Pretoria31 July 2009

DEPARTMENT OF LAND AFFAIRS: ANNUAL REPORT100
vote 27
Statement of Financial Positionfor the year ended 31 March 2009 - Deeds Registration Trading Account
Non-current AssetsProperty, Plant & Equipment
Current AssetsInventoriesTrade and Other ReceivablesCash and cash equivalents
TOTAL ASSETS
Equity and Liabilities
EquityAccumulated Surplus
Non-current LiabilitesFinance Lease ObligationsProvisions
Current LiabilitiesFinance Lease ObligationsTrade and Other PayablesProvisionsDeferred RevenueAmount payable to National Revenue fund
TOTAL EQUITY AND LIABILITIES
Notes
2
456
78
7108
9
Mar-09R‘000
135 606
93 769 924
60 201 32 644
229 375
126 911
17 265 493
16 772
85 199 645
13 492 11 057 1 751
58 254
229 375
Mar-08R'000
Restated
121 690
116 549 1 200
62 070 53 279
238 239
126 911
16 439 713
15 726
94 889 997
25 760 9 878
58 254
238 239

1 APRIL 2008 - 31 MARCH 2009 101
Registration of Deeds and Sale of InformationOther IncomeGrant From Department of Land AffairsOperating Expenses
Operating Surplus
Investment RevenueFinance Costs
Surplus for the year
Notes
22
12
1314
Mar-09R'000
309 779459
53 063(367 684)
(4 383)
4 567(184)
0
Mar-08R'000
Restated
418 989414
(352 277)
67 126
14 169(1 452)
79 843
Statement of Comprehensive Incomefor the year ended 31 March 2009 - Deeds Registration Trading Account
vote 27

DEPARTMENT OF LAND AFFAIRS: ANNUAL REPORT102
Balance at the beginning of the period
Surplus for the year
Balance at the end of the year
Note Mar-09R '000
126 911
-
126 911
Mar-08R '000
Restated
47 068
79 843
126 911
vote 27
Statement of Changes in Net Assetsfor the year ended 31 March 2009 - Deeds Registration Trading Account

1 APRIL 2008 - 31 MARCH 2009 103
CASH FLOWS FROM OPERATING ACTIVITIES
Cash Generated from operationsInvestment RevenueFinance Costs
CASH FLOWS FROM INVESTING ACTIVITIES
Purchase of Property, Plant and EquipmentProceeds on sale of Property, Plant and Equipment
CASH FLOWS FROM FINANCING ACTIVITIES
Finance lease paymentsAmount repaid to National Revenue Fund
TOTAL CASH MOVEMENT FOR THE YEARCash at the beginning of the year
TOTAL CASH AT THE END OF THE YEAR
Note
171314
9
6
Mar-09R'000
15 145
10 7624 567(184)
(35 208)
(35 208)0
(572)
(572)
(20 635)53 279
32 644
Mar-08R'000
Restated
120 990
108 27314 169(1 452)
(41 997)
(42 001)4
(119 793)
(579)(119 214)
(40 800)94 079
53 279
Cash Flow Statementfor the year ended 31 March 2009 - Deeds Registration Trading Account
vote 27

DEPARTMENT OF LAND AFFAIRS: ANNUAL REPORT104
1 ACCOUNTING POLICIES
APPLICABLE LEGISLATION AND REGULATIONS
1.1 The treatment of significant account balances and transactions has been made in terms of the Statements of Generally Accepted AccountingProcedures and in a manner contemplated by the International Accounting Standards.
1.2 Deviations from the Accounting Standards, where applicable, have been disclosed explicitly on the Annual Financial Statements withdetailed explanations for such deviations and the implications on the Annual Financial Statements.
SPECIFIC ACCOUNTING POLICIES
1.3 Basis of preparation of the annual financial statements
The Annual Financial Statements have been prepared in accordance with the South African Statements of Generally Accepted AccountingPractices (GAAP) including any interpretations of such Statements issued by the Accounting Practices Board.
All amounts have been presented in the currency of the South African Rand (R), which is also the functional currency of the entity. Unlessotherwise stated all financial figures have been rounded to the nearest One Thousand Rand (R'000).
In preparing the annual financial statements, management have made estimates and assumptions that affect the amounts presented in theannual financial statements and related disclosures. The use of relevant and reliable available information and the application of judgementsis inherent in the formation of estimates. Actual results in the future could differ from these estimates which may be material to the annualfinancial statements. Significant judgements include:
1.3.1 Fair value estimates
The carrying value less impairment provision of trade receivables and payables have been assumed to approximate their fair values. The fairvalue of financial liabilities for disclosure purposes has been estimated by discounting the future contractual cash flows at the currentmarket interest rate that is available to the entity for similar financial instruments.
1.3.2 Services in kind
Services received free of charge from other organs of state have not been recognised in the financial statements. The disclosure of theirnature and type has however been disclosed by way of note to the financial statements in line with IAS 20. These services may include:
� Administration Services
� Accommodation
� Internal Audit Function
� Information Technology
� Staff Training
All other services that are provided on behalf of the entity and are charged to the entity have been classified normally as expenses in termsof the approved Standard Chart of Accounts (SCOA)
1.3.3 Property Plant and Equipment
Property Plant and Equipment has been stated at cost less accumulated depreciation and impairment losses.
The effective date of depreciation has been the date on which the asset was brought to use. The following estimates have been used indetermining the useful life, residual values and the expected pattern of consumption of the future economic benefits embodied in theassets.
Item Average Useful life
Furniture and Fixtures 15 years
Computer Equipment 5-13 years
Office equipment 5-13 years
Leasehold Fixtures 5-13 years
Photographic and Technical Equipment 13 years
State-owned capital works 25 years
� Work in Progress
Work in progress relates to items purchased but not brought into use and therefore has not be depreciated.
� Leasehold Capital Works
Expenditure on improvement on leasehold buildings has been depreciated over the remaining period of the underlying lease for suchbuilding.
� Finance Leases
Assets under the finance lease agreements have been depreciated over the underlying period of the lease.
1.3.4 Trade and Other Receivables
Trade Receivables have been measured at fair value less provision for impairment. The impairment provision has been deemed to be allamounts that are outstanding beyond 90 days. Assessments for a less impairment provision have been made on individual debtors based onspecific probability of recovery. The fair value includes the initial recognition of the debts plus interest levied at rates approved by the ChiefRegistrar of Deeds. Such interest has been levied on dates when the debt is due and payable but outstanding.
1.3.5 Cash and Cash Equivalents
Cash and cash equivalents comprise cash on hand, demand deposits and other short-term highly liquid investments that are readilyconvertible within 30 days to known amounts of cash with an insignificant risk of changes in value. These are recorded at fair value and areclassified as “held for trading financial assets”.
vote 27
Notes to the Annual Financial Statementsfor the year ended 31 March 2009 - Deeds Registration Trading Account
1 APRIL 2008 - 31 MARCH 2009 105
1.3.6 Inventories
Inventories have been measured at the lower of cost or net realisable value where the cost is assigned using the weighted average costformula.
1.3.7 Impairment of assets
The entity has assessed all assets at balance sheet date for any indication that any asset may be impaired. Where such an indication exists,the estimate of the recoverable amount of the asset has been made and the carrying amount written down to the recoverable amount, thusrecognising an impairment loss.
1.3.8 Employee Benefits
� Short-term employee Benefits
The cost of short term employee benefits, (those payable within 12 months after the service is rendered, e.g. vacation leave, bonuses andmedical care), has been recognised in the period in which the service is rendered and has not been discounted.
� Defined contribution plans
Payments to defined contribution retirement benefit plans have been expensed as they fall due. Payments made to the state planretirement benefit schemes have been dealt with as defined contribution plans where the entity’s obligation under the schemes isequivalent to those arising in a defined contribution retirement benefit plan.
1.3.9 Revenue
Revenue consists of fees charged for property registration and for provision of registration data to customers in accordance with the tariffsprovided for in the Schedule of Fees prescribed by Regulation 84 of the Deeds Registries Act, 1937 (Act 47 of 1937), and approved by theMinister for Agriculture and Land Affairs. Revenue is recognised on execution of the Deeds applications as well as provision of the data thathas been requested.
1.3.10 Provisions
Provisions have been raised when management has determined estimates based on the best information available for the uncertainoutcome of leave and bonus payouts.
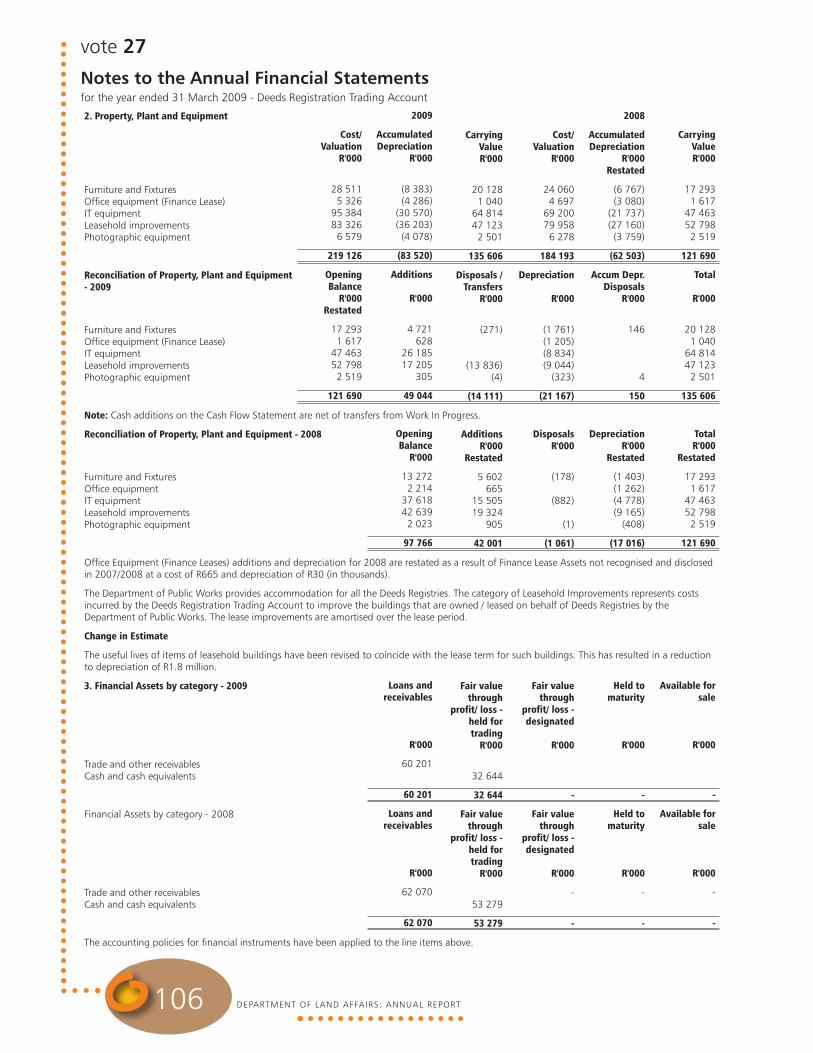
DEPARTMENT OF LAND AFFAIRS: ANNUAL REPORT106
2. Property, Plant and Equipment
Furniture and FixturesOffice equipment (Finance Lease)IT equipmentLeasehold improvementsPhotographic equipment
Reconciliation of Property, Plant and Equipment- 2009
Furniture and FixturesOffice equipment (Finance Lease)IT equipmentLeasehold improvementsPhotographic equipment
Note: Cash additions on the Cash Flow Statement are net of transfers from Work In Progress.
Reconciliation of Property, Plant and Equipment - 2008
Furniture and FixturesOffice equipmentIT equipmentLeasehold improvementsPhotographic equipment
Office Equipment (Finance Leases) additions and depreciation for 2008 are restated as a result of Finance Lease Assets not recognised and disclosedin 2007/2008 at a cost of R665 and depreciation of R30 (in thousands).
The Department of Public Works provides accommodation for all the Deeds Registries. The category of Leasehold Improvements represents costsincurred by the Deeds Registration Trading Account to improve the buildings that are owned / leased on behalf of Deeds Registries by theDepartment of Public Works. The lease improvements are amortised over the lease period.
Change in Estimate
The useful lives of items of leasehold buildings have been revised to coincide with the lease term for such buildings. This has resulted in a reductionto depreciation of R1.8 million.
3. Financial Assets by category - 2009
Trade and other receivablesCash and cash equivalents
Financial Assets by category - 2008
Trade and other receivablesCash and cash equivalents
The accounting policies for financial instruments have been applied to the line items above.
CarryingValueR'000
20 128 1 040
64 814 47 123 2 501
135 606
Disposals /Transfers
R'000
(271)
(13 836)(4)
(14 111)
AdditionsR'000
Restated
5 602 665
15 505 19 324
905
42 001
Fair valuethrough
profit/ loss -held fortrading
R'000
32 644
32 644
Fair valuethrough
profit/ loss -held fortrading
R'000
53 279
53 279
Cost/Valuation
R'000
24 060 4 697
69 200 79 958 6 278
184 193
Depreciation
R'000
(1 761)(1 205)(8 834)(9 044)
(323)
(21 167)
DisposalsR'000
(178)
(882)
(1)
(1 061)
Fair valuethrough
profit/ loss -designated
R'000
-
Fair valuethrough
profit/ loss -designated
R'000
-
-
2008
AccumulatedDepreciation
R'000Restated
(6 767)(3 080)
(21 737)(27 160)(3 759)
(62 503)
Accum Depr.Disposals
R'000
146
4
150
DepreciationR'000
Restated
(1 403)(1 262)(4 778)(9 165)
(408)
(17 016)
Held tomaturity
R'000
-
Held tomaturity
R'000
-
-
CarryingValueR'000
17 293 1 617
47 463 52 798 2 519
121 690
Total
R'000
20 128 1 040
64 814 47 123 2 501
135 606
TotalR'000
Restated
17 293 1 617
47 463 52 798 2 519
121 690
Available forsale
R'000
-
Available forsale
R'000
-
-
Cost/Valuation
R'000
28 511 5 326
95 384 83 326 6 579
219 126
OpeningBalance
R'000Restated
17 293 1 617
47 463 52 798 2 519
121 690
2009
AccumulatedDepreciation
R'000
(8 383)(4 286)
(30 570)(36 203)(4 078)
(83 520)
Additions
R'000
4 721 628
26 185 17 205
305
49 044
OpeningBalance
R'000
13 272 2 214
37 618 42 639 2 023
97 766
Loans andreceivables
R'000
60 201
60 201
Loans andreceivables
R'000
62 070
62 070
vote 27
Notes to the Annual Financial Statementsfor the year ended 31 March 2009 - Deeds Registration Trading Account
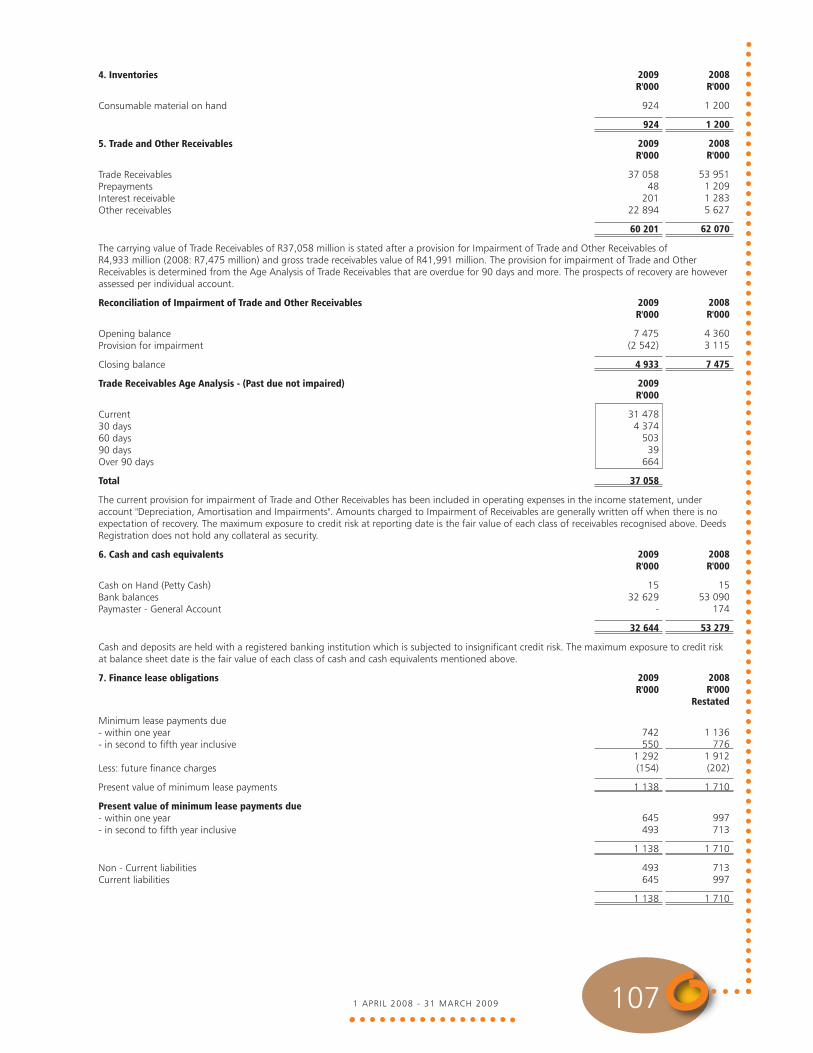
1 APRIL 2008 - 31 MARCH 2009 107
4. Inventories
Consumable material on hand
5. Trade and Other Receivables
Trade ReceivablesPrepaymentsInterest receivableOther receivables
The carrying value of Trade Receivables of R37,058 million is stated after a provision for Impairment of Trade and Other Receivables ofR4,933 million (2008: R7,475 million) and gross trade receivables value of R41,991 million. The provision for impairment of Trade and OtherReceivables is determined from the Age Analysis of Trade Receivables that are overdue for 90 days and more. The prospects of recovery are howeverassessed per individual account.
Reconciliation of Impairment of Trade and Other Receivables
Opening balanceProvision for impairment
Closing balance
Trade Receivables Age Analysis - (Past due not impaired)
Current30 days60 days90 daysOver 90 days
Total
The current provision for impairment of Trade and Other Receivables has been included in operating expenses in the income statement, underaccount "Depreciation, Amortisation and Impairments". Amounts charged to Impairment of Receivables are generally written off when there is noexpectation of recovery. The maximum exposure to credit risk at reporting date is the fair value of each class of receivables recognised above. DeedsRegistration does not hold any collateral as security.
6. Cash and cash equivalents
Cash on Hand (Petty Cash)Bank balancesPaymaster - General Account
Cash and deposits are held with a registered banking institution which is subjected to insignificant credit risk. The maximum exposure to credit riskat balance sheet date is the fair value of each class of cash and cash equivalents mentioned above.
7. Finance lease obligations
Minimum lease payments due- within one year- in second to fifth year inclusive
Less: future finance charges
Present value of minimum lease payments
Present value of minimum lease payments due- within one year- in second to fifth year inclusive
Non - Current liabilitiesCurrent liabilities
2009R'000
924
924
2009R'000
37 058 48
201 22 894
60 201
2009R'000
7 475 (2 542)
4 933
2009R'000
31 478 4 374
503 39
664
37 058
2009R'000
15 32 629
-
32 644
2009R'000
742550
1 292(154)
1 138
645493
1 138
493645
1 138
2008R'000
1 200
1 200
2008R'000
53 951 1 209 1 283 5 627
62 070
2008R'000
4 360 3 115
7 475
2008R'000
15 53 090
174
53 279
2008R'000
Restated
1 136776
1 912(202)
1 710
997713
1 710
713997
1 710

DEPARTMENT OF LAND AFFAIRS: ANNUAL REPORT108
8. Provisions
Reconciliation of provisions - 2009
Leave pay provisionBonus Provision
Reconciliation of provisions - 2008
Leave pay provisionBonus Provision
Non - Current liabilitiesCurrent liabilities
9. Amount payable to the National Revenue Fund
Balance at the end of the year
The amount payable to the National Revenue Fund represents amounts outstanding and due to the fund as a result of accumulated surpluses bythe Trading Account which are not committed for projects.
10. Trade and Other Payables
Trade payablesUnallocated CashSundry accrualsDeposits receivedOther Payables
Unallocated cash represents money deposited at the bank but not yet identified and allocated to Trade Receivables at the end of the financial year.
11. Financial liabilities by category
The accounting policy for financial instruments have been applied to the lineitems below:
2009
Trade and other payables
2008
Trade and other payables
Openingbalance
R'000
20 963 4 641
25 604
Openingbalance
R '000
20 691 4 142
24 833
Financialliabilities at
amortisedcosts
R'000
13 492
Financialliabilities at
amortisedcosts
R'000
25 760
Additions
R'000
2 251 9 739
11 990
Additions
R '000
1 409 8 446
9 855
Fair valuethrough
profit or loss- held for
tradingR'000
-
Fair valuethrough
profit or loss- held for
tradingR'000
-
Utilisedduring the
yearR'000
(942)(8 823)
(9 765)
Utilisedduring the
year R '000
(1 137)(7 947)
(9 084)
2009R'000
16 772 11 057
27 829
2009R'000
58 254
2009R'000
7 725 540
3 694 -
1 533
13 492
Fair valuethrough
profit or loss- designated
R'000
-
Fair valuethrough
profit or loss- designated
R'000
-
CarryingValue
R'000
22 272 5 557
27 829
CarryingValue
R '000
20 963 4 641
25 604
2008R'000
15 726 9 878
25 604
2008R'000
58 254
2008R'000
10 526 462
14 326 176 270
25 760
Total
R'000
13492
Total
R'000
25 760

1 APRIL 2008 - 31 MARCH 2009 109
12. Operating surplus
Operating surplus for the year is stated after accounting for the following:
Operating Lease charges:Equipment - contractual amount (GL Account 8050)Parking - contractual amount (GL Account 8359)
Loss on sale of property, plant and equipmentImpairment on trade and other receivablesDepreciation on property, plant and equipmentEmployee costs
13. Investment Revenue
Bank (Financial asset - held for trading)Interest charged on trade and other receivablesOther interest
14. Finance costs
Trade and other payables (Financial liability at amortised cost)Finance LeasesOther interest paid
15. Auditors' remuneration
External audit feesInternal audit fees
16. Operating Leases
The following amounts are due in future financial years due to contractual obligations:
Minimum Lease payments due:Payable within 1 yearPayable within 2nd to fifth year
17. Cash generated from operations
Surplus for the year
Adjustment for:Depreciation and amortisationLoss on sale of assetsInterest receivedFinance costs
Impairment lossesMovements in provisions
Changes in working capital:InventoriesDeferred revenueTrade and other receivablesTrade and other payables
2009R'000
20 911 1 000
21 911
(125)(2 542)21 167
204 949
2009R'000
4 120 353 94
4 567
2009R'000
- 181
3
184
2009R'000
1 968 13
1 981
2009R'000
7 108 765
7 873
2009R'000
-
21 167125
(4 567)184
(2 542)2 225
2761 7514 411
(12 268)
10 762
2008R'000
Restated
16 227 471
16 698
(1 057)3 116
17 016195 267
2008R'000
12 560 1 608
1
14 169
2008R'000
Restated
278 201 973
1 452
2008R'000
781 1 680
2 461
2008R'000
923 -
923
2008R'000
Restated
79 843
17 0161 057
(14 169)1 452
3 116771
(61)-
6 85212 396
108 273

DEPARTMENT OF LAND AFFAIRS: ANNUAL REPORT110
18. Contingent Liabilities
The Department of Land Affairs provides housing guarantees at R682 as at 31 March 2009 (2008: R763) to financial institutions, in the likely eventof employees unable to honour their commitments to these institutions for the purchase of housing.
The trading entity is currently investigating an incorrect registration of a deed. The investigation was not finalised as at the date of sign off of theannual financial statements. Although the amount cannot be quantified, and probability remote, the possibility of a litigation against the Entityexists. As such financial statements have not been adjusted to reflect this
19. Related Parties
Relationship
National Departments
Major National Public Entities
Other National Public Entities
Related Party Balances
Amounts included in Trade Receivables Department of AgricultureDepartment of HousingDepartment of Land AffairsDepartment of Public WorksDepartment of Provincial and Local GovernmentDepartment of Water Affairs and ForestryDepartment of EducationDepartment of TransportDepartment of Minerals and EnergyDepartment of Justice and Constitutional DevelopmentLand and Agricultural Bank of South AfricaEskomCouncil for Scientific and Industrial ResearchSouth African Police ServicesSouth African Revenue ServicesSpecial Investigating UnitNational Intelligence AgencyState Information Technology AgencyTransnet
Amounts included in Trade PayablesDepartment of Land AffairsDepartment of Minerals and EnergyDepartment of Water Affairs and ForestryDepartment of HousingSouth African Bureau of StandardsSouth African Revenue ServicesState Information Technology AgencyTelkom SA
Department
Department of Land AffairsDepartment of AgricultureDepartment of EducationDepartment of HealthDepartment of HousingDepartment of Justice and Constitutional DevelopmentDepartment of Minerals and EnergyDepartment of Provincial and Local GovernmentDepartment of Public WorksDepartment of Trade and IndustryDepartment of TransportDepartment of Social DevelopmentDepartment of Water Affairs and ForestryNational Intelligence AgencySouth African Police ServicesSouth African Secret Service
Statistics South AfricaEskomIndustrial Development Corporation of South AfricaLand and Agricultural Bank of South AfricaSouth African Revenue ServicesTelkom SATransnet
Special Investigating UnitState Information Technology AgencySouth African Post Office
2009R'000
1 859
7 45
147 -1
16 3
56 74
- - 1
3 2
21 390 18
(248)-
(7)(12)(24)(5)
-(123)
2008R'000
2259
3 376 63
167 13
- - - -
102 3 4 1 1 3 -- -
----
(39)(43)
(3 419)(141)
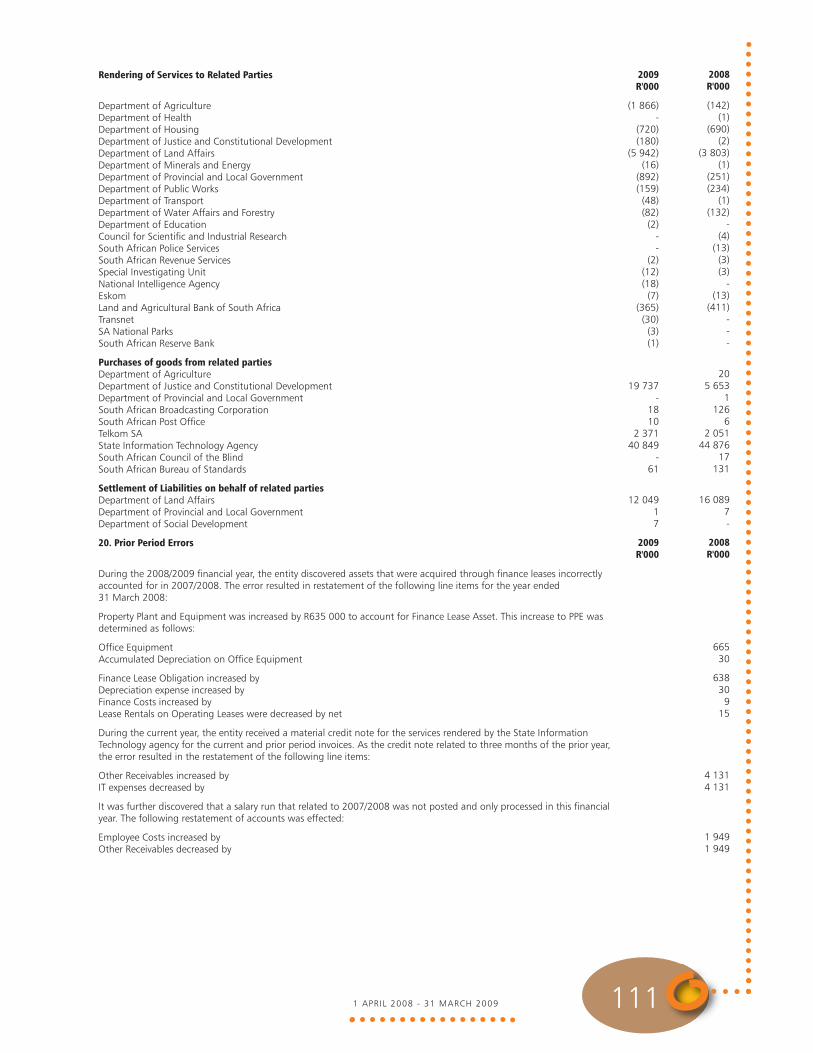
1 APRIL 2008 - 31 MARCH 2009 111
Rendering of Services to Related Parties
Department of AgricultureDepartment of HealthDepartment of HousingDepartment of Justice and Constitutional DevelopmentDepartment of Land AffairsDepartment of Minerals and EnergyDepartment of Provincial and Local GovernmentDepartment of Public WorksDepartment of TransportDepartment of Water Affairs and ForestryDepartment of EducationCouncil for Scientific and Industrial ResearchSouth African Police ServicesSouth African Revenue ServicesSpecial Investigating UnitNational Intelligence AgencyEskomLand and Agricultural Bank of South AfricaTransnetSA National ParksSouth African Reserve Bank
Purchases of goods from related partiesDepartment of AgricultureDepartment of Justice and Constitutional DevelopmentDepartment of Provincial and Local GovernmentSouth African Broadcasting CorporationSouth African Post OfficeTelkom SAState Information Technology AgencySouth African Council of the BlindSouth African Bureau of Standards
Settlement of Liabilities on behalf of related partiesDepartment of Land AffairsDepartment of Provincial and Local GovernmentDepartment of Social Development
20. Prior Period Errors
During the 2008/2009 financial year, the entity discovered assets that were acquired through finance leases incorrectlyaccounted for in 2007/2008. The error resulted in restatement of the following line items for the year ended31 March 2008:
Property Plant and Equipment was increased by R635 000 to account for Finance Lease Asset. This increase to PPE wasdetermined as follows:
Office EquipmentAccumulated Depreciation on Office Equipment
Finance Lease Obligation increased byDepreciation expense increased by Finance Costs increased byLease Rentals on Operating Leases were decreased by net
During the current year, the entity received a material credit note for the services rendered by the State InformationTechnology agency for the current and prior period invoices. As the credit note related to three months of the prior year,the error resulted in the restatement of the following line items:
Other Receivables increased by IT expenses decreased by
It was further discovered that a salary run that related to 2007/2008 was not posted and only processed in this financialyear. The following restatement of accounts was effected:
Employee Costs increased by Other Receivables decreased by
2009R'000
(1 866)-
(720)(180)
(5 942)(16)
(892)(159)(48)(82)(2)
--
(2)(12)(18)(7)
(365)(30)(3)(1)
19 737 -
18 10
2 371 40 849
- 61
12 049 1 7
2009R'000
2008R'000
(142)(1)
(690)(2)
(3 803)(1)
(251)(234)
(1)(132)
-(4)
(13)(3)(3)
-(13)
(411)---
20 5 653
1 126
6 2 051
44 876 17
131
16 089 7 -
2008R'000
665 30
638309
15
4 1314 131
1 9491 949

DEPARTMENT OF LAND AFFAIRS: ANNUAL REPORT112
21. Risk Management
The Trading Account Activity exposes it to currency risk, fair value interest rate risk, cash flow interest rate risk, credit risk and liquidity risk.
Liquidity RiskThis risk is as a result of funds available to cover future commitments. The entity manages the liquidity risk through ongoing review of futurecommitments.
The table below analyses the Trading Account financial liabilities and net-settled derivative financial liabilities into relevant maturity groupings basedon the remaining period at balance sheet date to the contractual maturity date. Balances due within 12 months equal their carrying balances as theimpact of discounting is not significant.
At 31 March 2009
Trade and Other Payables
At 31 March 2008
Trade and Other Payables
Interest Rate RiskThe Trading Account has no significant interest bearing assets and the income and operating cash flows are substantially independent of changes inthe market interest rates.
Deposits attract interest at rates that vary with prime. The Trading Account policy is to manage interest rate risk such that fluctuations in rate do nohave a material impact on surplus or deficit. At year end, the financial instruments exposed to interest rate risk were balances with banks.
Credit RiskCredit risk consists mainly of cash deposits, cash equivalents and trade debtors. The entity only deposits cash with a major bank with high qualitycredit standing and limits exposure to any one counter-party. Trade receivables comprise a widespread customer base. Management evaluatedcredit risk relating to customers on an ongoing basis.
Financial assets exposed to risk at year end included:
Deposits with BanksTrade Receivables (gross)
22. Services in Kind
Administrative Services in kindDeeds Trading Account falls under the administration of the Department of Land Affairs. The executive of the department spend some of their timeon the affairs of the Trading Account. Furthermore, the department provides the services of internal audit function, information technology andstaff training. There is no cost charged by the department in this regard.
Other Income on the Statement of Comprehensive Income includes a grant received from the Department of Land Affairs of R54.8 million. Thisgrant was to compensate for lost revenue as a result of a reduction in deeds registrations. Since the Trading Account posted a surplus of R1.7million at year end, this was disclosed as deferred revenue in the Balance Sheet.
Other Services in kindThe Department of Public Works provides accommodation for some of the Deeds Registries.
23. Fruitless and Wasteful Expenditure
Opening balanceAdd: Fruitless and wasteful expenditure – current yearLess: Fruitless and wasteful expenditure condoned
Less: Transfers to receivables for recovery (amounts not condoned)Less: Amounts not recoverable (not condoned)Fruitless and wasteful expenditure awaiting condonation
Analysis of expenditure awaiting condonation per age classification:
Current YearPrior YearsTotal
Details of Fruitless and Wasteful Expenditure:
IncidentThe wasteful and fruitless expenditure accounted for in 2008 was the interestpaid to SARS for the late payment of PAYE.
COMMENTSAwaiting condonement from the Accounting Officer
R'000Less than 1
year
13 492
Less than 1year
25 760
R'0001 to 2 years
1 to 2 years
R'0002 to 5 years
2 to 5 years
2009R'000
32 629 37 058
2009R'000
972--
-
972
-972972
R'000Over 5 years
Over 5 years
2008R'000
53 090 53 951
2008R'000
-972
-
-
972
972-
972
Disciplinary steps taken/criminal proceedings"An investigation is being conducted on this matter anddisplinary steps against relevant official/s will be taken uponreceiving a final report. An application for condonement wasmade to the Accounting Officer. This was recognised as anexpense in 2008."

1 APRIL 2008 - 31 MARCH 2009 113
Revenue
Registration of deeds and sale of informationOther IncomeGrant from Department of Land AffairsInvestment Revenue
Operating expenses
AdvertisingAuditors remunerationBad DebtsBank ChargesCleaningConsumablesDepreciation, amortisation and impairmentsEmployee costsEntertainmentIT ExpensesLease rental on operating leasesLegal expensesLoss on disposal of assetsOther consulting and professional feesOther expensesPrinting and stationeryRepairs and maintenanceSecurityStaff welfareSubscriptionsTelephone and faxTrainingTransport and freightTravel - local
Finance Costs
Surplus for the year
Note
2213
15
12
14
Mar-09R '000
367 868
309 779 459
53 063 4 567
367 684
254 1 981 3 316
187 2 755
979 18 625
204 949 2 082
35 723 21 911 19 757
125 15 306
26 7 164 9 001 3 027
95 777
3 802 1 140 6 272 8 430
184
-
Mar-08R '000
Restated
433 572
418 989 414
-14 169
352 277
128 2 461
40 168
2 348 1 349
20 132 195 267
1 707 49 709 16 698 5 187 1 057
21 765 204
6 597 6 941 2 846
239 424
3 023 726
6 541 6 720
1 452
79 843
vote 27
Detailed Statement of Comprehensive Incomefor the year ended 31 March 2009 - Deeds Registration Trading Account

land
aff
airs
5P A R T 5 H U M A N
R E S O U R C EM A N A G E M E N T
land affairs
1 APRIL 2008 - 31 MARCH 2009 115
part5H U M A NR E S O U R C EM A N A G E M E N T
OversightReport
NATIONAL DEPARTMENT OF LAND AFFAIRS2008/2009
Table 1.1 - Main services provided &standards
Table 1.2 - Consultation arrangements withcustomers
Table 1.3 - Service Delivery Access SystemTable 1.4 - Service Information ToolTable 1.5 - Complaint MechanismTable 2.1 - Personnel Cost by ProgrammeTable 2.2 - Personnel Costs by Salary BandsTable 2.3 - Salaries, Overtime, Housing
Allowance & Medical Assistanceby Programme
Table 2.4 - Salaries, Overtime, HousingAllowance & Medical Assistanceby Salary Band
Table 3.1 - Employment & Vacancies byProgramme
Table 3.2 - Employment & Vacancies bySalary Band
Table 3.3 - Employment & Vacancies byCritical Occupation
Table 4.1 - Job EvaluationTable 4.2 - Profile of Employees whose salary
positions were upgraded due totheir posts being upgraded
Table 4.3 - Employees whose salary levelexceed the grade determined byJob Evaluation
Table 4.4 - Profile of Employees whose salarylevel exceed the grade determinedby Job Evaluation
Table 5.1 - Annual Turnover rates by SalaryBand
Table 5.2 - Annual Turnover rates by CriticalOccupation
Table 5.3 - Reasons why staff are leaving theDepartment
Table 5.4 - Promotions by Salary BandTable 5.5 - Promotions by Critical OccupationTable 6.1 - Total number of employees in
each of the following categories(SASCO)
Table 6.2 - Total number of employees ineach of the followingoccupational bands
Table 6.3 - RecruitmentTable 6.4 - PromotionsTable 6.5 - TerminationsTable 6.6 - Disciplinary ActionTable 6.7 - Skills Development (%)Table 7.1 - Performance Rewards by race,
gender & disabilityTable 7.2 - Performance Rewards by Salary
Band below SMSTable 7.3 - Performance Rewards By Critical
OccupationTable 7.4 - Performance Rewards by Salary
Band for SMSTable 8.1 - Foreign Workers by Salary BandTable 8.2 - Foreign Workers by Major
OccupationTable 9.1 - Sick Leave, 1 January 2008 to
31 December 2008Table 9.2 - Incapacity Leave, 1 January 2008
to 31 December 2008Table 9.3 - Annual Leave, 1 January 2008 to
31 December 2008Table 9.4 - Capped Leave, 1 January 2008 to
31 December 2008Table 9.5 - Leave PayoutsTable 10.1 - Steps taken to reduce the risk of
occupational exposureTable 10.2 - Details of Health Promotion and
HIV/AIDS ProgrammesTable 11.1 - Collective AgreementsTable 11.2 - Misconduct & Discipline Hearings
finalisedTable 11.3 - Types of misconduct addressed at
Disciplinary HearingsTable 11.4 - Grievances lodgedTable 11.5 - Disputes lodged with CouncilsTable 11.6 - Strike ActionsTable 11.7 - Precautionary SuspensionsTable 12.1 - Training Needs IdentifiedTable 12.2 - Training ProvidedTable 13.1 - Injury on DutyTable 14.1 - Report on consultant
appointments using appropriatedfunds
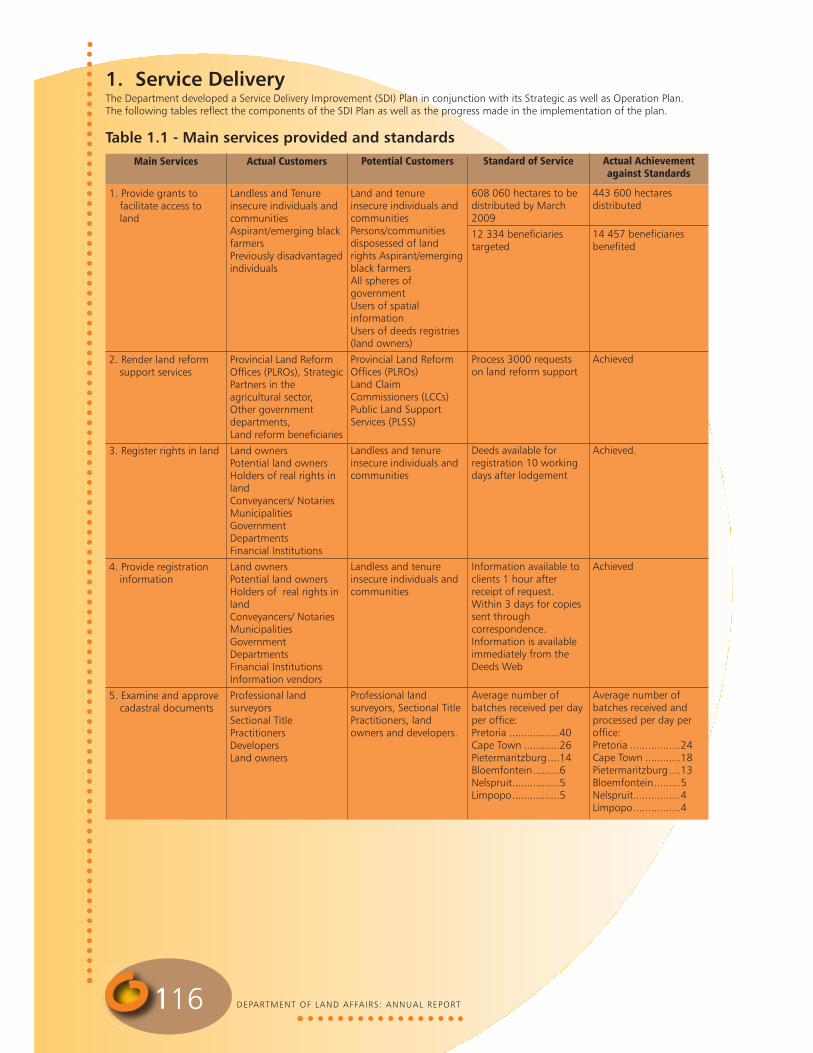
DEPARTMENT OF LAND AFFAIRS: ANNUAL REPORT116
1. Service DeliveryThe Department developed a Service Delivery Improvement (SDI) Plan in conjunction with its Strategic as well as Operation Plan.The following tables reflect the components of the SDI Plan as well as the progress made in the implementation of the plan.
Table 1.1 - Main services provided and standardsMain Services
1. Provide grants tofacilitate access toland
2. Render land reformsupport services
3. Register rights in land
4. Provide registrationinformation
5. Examine and approvecadastral documents
Actual Customers
Landless and Tenureinsecure individuals andcommunitiesAspirant/emerging blackfarmersPreviously disadvantagedindividuals
Provincial Land ReformOffices (PLROs), StrategicPartners in theagricultural sector,Other governmentdepartments,Land reform beneficiaries
Land ownersPotential land ownersHolders of real rights inlandConveyancers/ NotariesMunicipalitiesGovernmentDepartmentsFinancial Institutions
Land ownersPotential land ownersHolders of real rights inlandConveyancers/ NotariesMunicipalitiesGovernmentDepartmentsFinancial InstitutionsInformation vendors
Professional landsurveyors Sectional TitlePractitioners DevelopersLand owners
Potential Customers
Land and tenureinsecure individuals andcommunitiesPersons/communitiesdisposessed of landrights Aspirant/emergingblack farmersAll spheres ofgovernmentUsers of spatialinformationUsers of deeds registries(land owners)
Provincial Land ReformOffices (PLROs)Land ClaimCommissioners (LCCs)Public Land SupportServices (PLSS)
Landless and tenureinsecure individuals andcommunities
Landless and tenureinsecure individuals andcommunities
Professional landsurveyors, Sectional TitlePractitioners, landowners and developers.
Standard of Service
608 060 hectares to bedistributed by March2009
12 334 beneficiariestargeted
Process 3000 requestson land reform support
Deeds available forregistration 10 workingdays after lodgement
Information available toclients 1 hour afterreceipt of request.Within 3 days for copiessent throughcorrespondence.Information is availableimmediately from theDeeds Web
Average number ofbatches received per dayper office:Pretoria .................40Cape Town ............26Pietermaritzburg....14Bloemfontein.........6Nelspruit................5Limpopo................5
Actual Achievementagainst Standards
443 600 hectaresdistributed
14 457 beneficiariesbenefited
Achieved
Achieved.
Achieved
Average number ofbatches received andprocessed per day peroffice:Pretoria .................24Cape Town ............18Pietermaritzburg....13Bloemfontein.........5Nelspruit................4Limpopo................4

1 APRIL 2008 - 31 MARCH 2009 117
Table 1.1 - Main services provided and standards (continued)Main Services
6. Supply cadastrerelated information
7. Produce and supplymaps {topographic,ortho-photos andaeronautic charts}aerial photographsand digitaltopographicinformation
8. Maintain the NationalControl SurveyNetwork(trigonometric station& town survey marks)
9. Provide SpatialPlanning Services
10. Provide andmaintain a businessinformation andtechnologyarchitecture
11. Provide ICT ServiceManagement(OperationalSupport)
12. Provide support inthe developmentand structuring ofthe Department’sestablishment.
Actual Customers
Professional LandSurveyorsSectional TitlePractitionersConveyancersOther GovernmentDepartmentsProvincial DepartmentsLocal AuthoritiesOrgans of StateGeneral Public
The Public AviationsectorCommercial Clients(Vendors, agents,resellers, recreational,and professional users),Potential Map Users.NGOs
Survey industry
MunicipalitiesProvincial departmentsEducational institutionsTown and regionalplannersLand Reform and LandRestitution
All DLA employees DLA beneficiaries andLand InformationConsumers
All DLA Components
All DLA staff
Potential Customers
Professional landsurveyors, Sectional TitlePractitioners,Conveyancers, Othergovernmentdepartments, ProvincialDepartments, LocalAuthorities, Organs ofState, General Public
NGOs, communityleaders, educators
Anyone requiringaccurate positioning inrelation to the nationalreference framework
NGOs and civil society atlarge
All DLA employees DLA beneficiaries andLand InformationConsumers
All DLA Components
All DLA staff
Standard of Service
Average number ofrequests for cadastrerelated informationreceived per dayRequests received:Public counter: 56 800Telephone: 28 600E-mail: 17 700Auto E-mailer: 252 000Faxes: 9 200Letters: 1 000Bulk data: 240Database extracts: 1 420Products supplied:Images 10.7 mPaper copies: 281 600Turnaround time:15 working days onaverage
• Digital imagery impactquantified by March2009
• 20% increase
100 clients for VirtualReference Stations (VRS)
3 000 requestsprocessed annually
Develop strategies andmaintain businessinformation andtechnology architecture
Service level agreementsdeveloped with allcomponents by March2010, and consistentperformance of 98%attainment of servicelevels
Average of 30 requestsper annum
Actual Achievementagainst Standards
Average number ofrequests for cadastrerelated informationreceived and processedper dayPublic counter: 52 500Telephone: 31 300E-mail: 15 400Auto E-mailer: 232 000Faxes: 8 150Letters: 1 200Bulk data: 220Database extracts: 1 250Products suppliedImages: 12.3mPaper copies: 27 000Turnaround time:18 days
Achieved. 163 688 km2
acquired by March 2009
Achieved. 215 clientsused the system
Achieved. More than3 000 requests wereprocessed for the pastfinancial year
MSP review wascompleted end March2009, and the ICTstrategy for the next 5years has beendeveloped
Partially achieved. SLA'sdeveloped with SITAGCCN Services, SITAMainframe hostingservices, SITAComprehensive e-Printing services as wellas HR Computek. SLA'swere developed withCD: Deeds and CD:Cadastral Surveys. SLA'swith Consulting Housesare in the process ofbeing finalised
No ad hoc investigationsundertaken due to thefinalisation of theAmended Structure

DEPARTMENT OF LAND AFFAIRS: ANNUAL REPORT118
Table 1.1 - Main services provided and standards (continued)Main Services
13. Evaluate and gradeposts
14. Provide guidanceand support on theimplementation ofthe Batho PeleRevitalisationStrategy.
15. Provide guidanceand support onmainstreaming ofdisability and youthstrategies.
16. Recruit, select andappoint staff
17. Provide training toLand Reformbeneficiaries
18. Provide bursaries foremployees andprospective bursaryholders
19. Provide training anddevelopment services
20. Provide internships,experiential trainingand graduatetraining
Actual Customers
All DLA staff
All DLA employees.
Disability sectorDLA employees withDisabilitiesYouth SectorDLA Employees
Job applicantsLine managers
LRAD beneficiariesProvincial land reformimplementers
DLA employees Matriculants
DLA employees
Graduates
Potential Customers
All DLA staff
All DLA employees.
Disability sectorDLA employees withDisabilitiesYouth SectorDLA Employees
Job applicantsLine managers
LRAD beneficiariesProvincial land reformimplementers
DLA employees Matriculants
DLA employees
Graduates
Standard of Service
Process and average of250 JEs per annum
Coordinate and facilitateBatho Pele projects andactivities
Coordinate and facilitateYouth and Disabilityprojects and activities
Recruitment completedwithin 43 days ofadvertisement
500 beneficiariestargeted
200 for the prospectivebursary holders
2 500 employees trainedand certified
200 interns and 200graduates placed
Actual Achievementagainst Standards
Completed jobevaluation on 866 jobtitles which represented4 576 posts
440 employees weretrained on customercare as well as 153 oncomplaints handlingand management
Participated in Youth inAgriculture and RuralDevelopment to improveinvolvement of theyouth in Land andAgrarian Reform,Co-ordinated theDepartmentalInternational Day forPersons with DisabilitiesCelebration inBloemfontein in 2008
Not achieved. Standardnot achieved due todelays in the shortlistingprocess and red tape inthe recruitment process
Partially achieved. 203beneficiaries weretrained and 90 receivedcertificates fromUniversity of Fort Hare
Achieved. 260 part-timebursaries awarded and221 prospectiveemployees placed onthe programme. Careerexhibitions held atKimberley, Giyani,Pietermaritzburg andthe Durban University ofTechnology, UNISA,Tshwane University ofTechnology. Other careerexhibitions were held inSoweto and at theYouth in Agriculture andRural Development inWestern Cape. 40prospective employeeswere awarded newbursaries and 33 placedon experiential training
Achieved. 2 800employees trained
Partially achieved. 246interns and 128graduates were placed

1 APRIL 2008 - 31 MARCH 2009 119
Table 1.1 - Main services provided and standards (continued)Main Services
21. Provision of goodsand services -Logistics - PolicyPerformance andRisk Management,Customer RelationsManagement andAsset Management
22. Conduct InternalAudits
Actual Customers
All DLA OfficialsNational TreasuryAuditor-General
Internal Clients:MinisterDeputy MinisterDGDLA Top ManagementDLA Senior ManagementDLA EmployeesExternal Clients:DLA Audit CommitteeAuditor GeneralPSCScorpions
Potential Customers
All DLA OfficialsNational TreasuryAuditor-General
Internal Clients:MinisterDeputy MinisterDGDLA Top ManagementDLA Senior ManagementDLA EmployeesExternal Clients:DLA Audit CommitteeAuditor GeneralPSCScorpions
Standard of Service
Ten requisitionsprocessed by officials perday
All the audit projects onthe 2008 -2011Strategic 3-year RollingInternal Audit Plan
Actual Achievementagainst Standards
All the requisitionssubmitted to SCMprocessed within 24 hrsof receipt.
All the audit projects onthe 2008/09 AnnualInternal Audit Plan ontrack for completion bythe target date of 30September 2009.
Table 1.2 - Consultation arrangements with CustomersType of Arrangement
Consultative meetings conductedas per achievement of milestoneswith effect from June 2008Customer satisfaction surveyconducted quarterly with effectfrom July 2008Suggestion boxes placed in alloffices by July 2008CLaRA workshops held perprovince by March 2009
Consultation on the grantsincrease by March 2009
Personal interviews withconveyancers dailyTelephone interviews with allservice beneficiaries dailyClient satisfaction surveyconducted quarterlyConsultative stakeholder forumsheld with beneficiaries quarterly
Quarterly Joint Liaison Committeemeetings initiated in SGs BFN,Limpopo & MpumalangaClient satisfaction surveyconducted annuallyAll offices to initiate aconsultation slot in GIS forummeetings by October 2008Installed suggestion boxes in alloffices by June 2008
Actual Achievements
Consultative meetings held inLimpopo, North West, as well asin Western Cape. Quarterlycustomer satisfaction surveysconducted in North WestProvincial Land Reform Office
All stakeholders were consulted
Achieved
Partially achieved. Some officeshave initiated Quarterly JointLiaison meetings and initiatedconsultation slots in GIS forummeetings. Suggestion boxesinstalled in all Surveyor-GeneralOffices and a client satisfactionsurvey was conducted
Actual Customer
Landless and Tenure insecureindividuals and communitiesAspirant/emerging blackfarmersPreviously disadvantagedindividuals
Provincial Land ReformOffices (PLROs), Strategic Partners in theAgricultural Sector,Other governmentdepartments, land reformbeneficiaries
Land ownersPotential land owners Holders of real rights in landConveyancers/NotariesMunicipalitiesGovernment DepartmentsFinancial Institutions
Professional land surveyorsSectional Title PractitionersDevelopersLand owners
Potential Customer
Land and tenure insecureindividuals and communitiesPersons/communitiesdisposed of land rightsAspirant/emerging blackfarmersAll spheres of governmentUsers of spatial informationUsers of deeds registries(land owners)
Provincial Land ReformOffices (PLROs)Land Claims Commissioners(LCCs)Public Land Support Services(PLSS)
Landless and tenure insecureindividuals and communities
Professional land surveyors,Sectional Title Practitioners,land owners and developers

DEPARTMENT OF LAND AFFAIRS: ANNUAL REPORT120
Table 1.2 - Consultation arrangements with Customers (continued)Type of Arrangement
Participate in 8 exhibitions in 6provincesMonthly formal interactionsconducted with stakeholdersWorkshops facilitated(MapAware) in the public andNGO sectors by March 2009 Workshops facilitated todetermine user needs by March2009
Bi- Monthly Departmental ICTCommittee meetings Annual customer satisfactionsurvey conducted
Evaluation and structural designconducted in consultation withmanagers and job holdersJE Panel meetings to be plannedwith effect from April 08 for theyear
Customer satisfaction surveyconducted quarterly with effectfrom July 2008
Conduct consultative meetingswith the disability and youthsector in 5 provinces by March2009
Project specific training e.g.poultry farming developed byMarch 2009
Feedback sessions held withstakeholders
Multi-disciplinary working teamsestablished by March 2009
Survey on the performance of theSCM conducted by March 2009Monthly consultation meetingswith ManagersAsset verification conductedannually
Actual Achievements
Achieved. 44 workshops onMapAware facilitated
Partially achieved. ICT RiskManager appointed
Achieved. Managers givenregular feedback on theirrecruitment progress andrecruitment plans
Questionnaires distributed to linefunctions for administration tocustomers
Not achieved due to financialconstraints
Achieved. Dairy productioncourse was developed as well asFarm business management,Project time management,Project scope management andProject communicationmanagement
Achieved. Workshops regardingtraining matters were held withTraining Committees in allprovinces
Verification of assets and spotchecks were doneMonthly reporting was done andforwarded to the (A) CFO whowill in turn forward the report tothe MinisterThe survey has been deferred toMarch 2010 as the target dateInduction programme wasconducted to a minimum due tocapacity challengesQuarterly Supply ChainManagement Performance Surveywas conducted in July 2008.Thehelp desk is fully functionalManagers were invited to give anindication for such meetings andonly a few Directorates haveshown interest/responded to theinvitation
Survey target date deferred toMarch 2010. Consultationmeetings with managers had apoor turnout
Actual Customer
The Public Aviation sectorCommercial Clients (Vendors,agents, resellers, recreational,and professional users),Potential Map Users.NGOs
All DLA employeesDLA beneficiaries Land Information consumers
All DLA staff
All DLA staff
Disability sectorDLA employees withdisabilitiesYouth SectorDLA employees
LRAD beneficiaries Provincial land reformimplementers
DLA employees
Programme andResponsibility ManagersNational TreasuryAuditor-General
All DLA OfficialsNational TreasuryAuditor-General
Potential Customer
NGOs, community leaders,educators
All DLA employeesDLA beneficiaries Land Information consumers
All DLA staff
All DLA staff
Disability sectorDLA employees withdisabilitiesYouth SectorDLA employees
LRAD beneficiaries Provincial land reformimplementers
DLA employees
Programme andResponsibility ManagersNational TreasuryAuditor-General
All DLA OfficialsNational TreasuryAuditor-General

1 APRIL 2008 - 31 MARCH 2009 121
Table 1.2 - Consultation arrangements with Customers (continued)Type of Arrangement
Discussed annual audit planswith top management Engagement letters issued toaudit feesEntrance meetings conducted
Actual Achievements
Achieved
Actual Customer
Internal Clients:MinisterDeputy MinisterDGDLA Top ManagementDLA Senior ManagementDLA EmployeesExternal Clients:DLA Audit CommitteeAuditor GeneralPSCScorpions
Potential Customer
Internal Clients:MinisterDeputy MinisterDGDLA Top ManagementDLA Senior ManagementDLA EmployeesExternal Clients:DLA Audit CommitteeAuditor GeneralPSCScorpions
Table 1.3 - Service Delivery Access StrategyAccess Strategy
Casewise Repository by March 2009Service Desk integrated with telephony to reduce call drop rateby March 2009Collaborative self service portal – March 2009Federated call centres in regions by March 2009Multi-media electronic communication by March 2009Deeds Registry Office established in Limpopo by March 2009Accessibility for the disabled improved in Vryburg office byMarch 2009Simplified application procedures by July 2008Access via e-mail, telephone, cell phone, memorandumsregarding requests for audits and investigations as these are ofconfidential natureAssistive device guidelines developed by December 2008.Checklist for accessible venues developed by December 2008Vacant Posts advertised in the media
Signage improved in all Provincial Land Reform Offices by March2009 and access for disabled persons improved.Business cards provided to project managers for distribution tocustomers with effect from July 2009.
• Establish call centre for HRD related needs• Establish partnerships with NGOs, CBOs relevant land and
agrarian tertiary institutions in the provinces by March 2009• Training conducted in 9 provinces by March 2009
• Services provided in 8 SG offices (The new North West officeis to be fully operational by March 2009)
• Digital lodgement (subject to revival of e-Cadastre Project) byMarch 2009
• Telephone lists circulated via e-mail to Land Surveyors in all SGoffices by March 2009
• Methods of payment improved in all SG offices by March 2009• Web site query functions extended by March 2009• Helpdesks established in all SG offices by March 2009• Signage provided in all SG offices by October 2008Organisational and establishment structure of the Departmentpublished on the Intranet by 31 March 2009Provincial/District/Satellite offices used to increase access toservicesE-mails and telephoneOutlets established within every 150 km range, excluding theNorthern Cape where the range is 250 km by March 2009
Actual Achievements
Partially achieved. Ongoing, utilised mainly by HRM
Limpopo office not yet established and the Vryburg officeproject registered with DPW.
Achieved.
Achieved. Draft assistive guidelines available (in consultationprocess)Achieved. Adverts are placed in the national media, networkmessenger and DPSA circularsPartially achieved. KwaZulu-Natal, Free State, Northern Cape,Mpumalanga and North West PLRO's except for Bophirima,North West, have erected signage as well as upgradedinfrastructure to increase accessibility to disabled customers.Eastern Cape still to improve accessibility for disabled customers.Signage has been completed. Business cards are issued toproject managers for distribution to customers.Achieved• Held meetings with Potchefstroom and Cedara colleges of
Agriculture• Held meetings with ARC and NCT forestry cooperatives• Currently in contact with Citrus Academy with the view of
training beneficiaries6 SG Offices. East London satellite office established. Helpdesksnot yet established in all offices. Signage not erected in all SGoffices
Amended structure not yet approved therefore could not bepublishedThe recently introduced VPN to ensure greater accessibilitythrough increased bandwidth
Achieved

DEPARTMENT OF LAND AFFAIRS: ANNUAL REPORT122
Table 1.4 - Service Information ToolTypes of Information Tool
• Monthly campaigns on ICT Policy and Governance e.g.Information Security Awareness
• Compliance monitoring and reporting on abuse• Multi-Media electronic communication
Daily, Weekly and Monthly Service Desk Statistics Trends AnalysisReportsProactive awareness and training programmesICT problems and incidents linked to low e-Literacy levelsMonthly campaigns on ICT policy and Governance
Disability and youth reports published on the website with effectfrom July 2008.
Deeds Registry staff trained on sign language by March 2009.Radio talk shows held in all official languages on propertyregistration bi-annuallyDeeds Registry pamphlets distributed
Information booklets and pamphlets distributed to customersquarterly. Annual workshops held in support of land reformimplementers and stakeholders per province. Informationsessions held with customers annually.
Workshops held quarterlyInformation sessions held annually
• Media shows• Updating information quarterly on the Intranet.• Develop and distribute posters for Land Reform offices by
March 2009
• Information on costs, formats and delivery times posted onnotice boards, leaflets and website by June 2008
• Booklet on the cadastral system, products and servicespublished by March 2009
• Conduct the structural design, technologies and approachesby March 2009.
• Promote awareness on JE Policy by 31 March 2009.
Posters on Surveys and Mapping products and services posted inpublic areas and government institutions quarterly
Actual Achievements
Not achieved. To be addressed in the 2009/2010 financial year
To be addressed in the 2009/2010 financial year
• Achieved.• Disability and youth empowerment strategies available on
website• DDF newsletter published.• DDF newsletter available
Partially achieved. Deeds Registry pamphlets distributed duringPublic Service Week and other awareness events
Achieved. Information booklets and brochures distributed duringcelebrations such as the Africa Public Service day and PublicService Week, quarterly meetings, exhibitions (Pretoria ShowGrounds) and izimbizo's
Workshops on land reform support were held regularly
Partially achieved.Required documentation submitted to Information Technology
Not achieved
Not achieved
Achieved

1 APRIL 2008 - 31 MARCH 2009 123
Table 1.5 - Complaint MechanismComplaints Mechanism
• Quarterly Service Level Review meetings• Complaints are noted and addressed via service managers• Fully compliant with Departmental Complaint Handling Policy
from July 2008
• More proactive preventative support through trend analysisand availability tools
• Improved Service Desk with integrated telephone to reducecall drop rates - March 2009.
• “Federated” call centres in Regions – March 2009.
• MSP Reviewed Annually• Comply with DPSA regulations and standards on MSPs and
Enterprise Architecture• Recruit and sustain architecture and business analysis expertise
- March 2009.• Develop and Implement SDLC policies, procedures and
standards – March 2009.
Evaluation forms for auditor to complete after each audit. Inaudit engagement letters define contact details of people in andoutside of Internal Audit to contact with complaints. Once acomplaint is received, it is immediately acknowledged andinvestigated. Feedback is provided within 2 weeks maximum.
• Telephonic queries responded to immediately• Written queries responded within 5 working days
Departmental complaints handling policy implemented witheffect from July 2008.Staff trained on handling of complaints by March 2009
Fully functional customer relations servicesTraining to CRM staff to handle complaintsComplaints register (monthly statistics)
Appeals addressed in accordance with Appeals Process asprescribed in JE Policy
Actual Achievements
Ongoing and being improved
Ongoing and being improved
• Reviewed MSP• Developed ICT Strategy, being reviewed• 2 Business Analysts were appointed, to commence duty in
March/April 09
100% achieved to date in audit projects.
Achieved
Departmental Complaints Policy and Procedure manualapproved in June 2008. 153 employees trained on complaintsand customer feedback management. Training on complaintsmanagement continued as part of customer care training. 440employees trained on customer care.
Fully operationalIn-house training is conducted on regular basis.
Standard maintained

DEPARTMENT OF LAND AFFAIRS: ANNUAL REPORT124
2. ExpenditureThe Department budgeted in terms of clearly defined programmes. The following tables summarise the final audited expenditureby programme (Table 2.1) and by salary bands (Table 2.2). In particular, it provides an indication of the amount spent on personnelcosts in terms of each of the programmes or salary bands within the Department.
Table 2.1 - Personnel Costs by ProgrammeProgramme
Administration
Surveys & Mapping
Cadastral Surveys
Restitution
Land Reform
Spatial Planning
Deeds Registration
Total
TotalExpenditure
(R'000)
126 489
27 851
70 000
171 705
127 095
22 015
661 166
1 206 321
PersonnelExpenditure
(R'000)
103 595
27 601
70 000
146 830
102 560
21 173
131 021
602 780
Professional &SpecialServices(R'000)
13 765
64
-
24 782
24 454
629
416 468
480 162
Personnel Cost% of Total
Expenditure
17.19
4.58
11.61
24.36
17.01
3.51
21.74
100.00
AveragePersonnel Costper Employee
(R'000)
165
148
135
167
134
271
121
146
TrainingExpenditure
(R'000)
9 124
186
-
93
81
214
113 677
123 375
Table 2.2 - Personnel Costs by Salary BandsSalary Band
Lower skilled (1 - 2)
Skilled (3 - 5)
Highly skilled production (6 - 8)
Highly skilled supervision (9 - 12)
SMS (Level 13-16)
Total
Personnel Expenditure(R'000)
8 332
69 119
212 328
256 683
56 318
602 780
Percentage of TotalPersonnel Cost
1.38
11.47
35.22
42.58
9.34
100.00
Average Personnel Cost perEmployee ( R )
134
100
94
250
536
146
Table 2.3 - Salaries, Overtime, Housing Allowance and Medical Assistanceby Programme
Programme
Administration
Surveys and Mapping
Cadastral Surveys
Restitution
Land Reform
Spatial Planning
Deeds Registration
Total
Amount
91 981
24 773
62 176
135 233
94 419
19 551
116 703
544 836
%
16.88
4.55
11.41
24.82
17.33
3.59
21.42
90.39
Amount
2 969
12
1 260
1 008
486
13
334
6 082
%
48.82
0.20
20.72
16.57
7.99
0.21
5.49
1.01
Amount
2 824
775
1 954
3 698
2 217
580
4 532
16 580
%
17.03
4.67
11.79
22.30
13.37
3.50
27.33
2.75
Amount
5 821
2 041
4 609
6 892
5 438
1 029
9 452
35 282
%
16.50
5.78
13.06
19.53
15.41
2.92
26.79
5.85
Salaries Overtime Housing Allowance Medical Assistance
Table 2.4 - Salaries, Overtime, Housing Allowance and Medical Assistanceby Salary Band
Salary Band
Lower skilled (1 - 2)
Skilled (3 - 5)
Highly skilled production (6 - 8)
Highly skilled supervision (9 - 12)
SMS (Level 13-16)
Total
Amount
8 988
61 462
198 652
220 878
54 856
544 836
%
1.65
11.28
36.46
40.54
10.07
90.39
Amount
59
753
3 841
1 429
-
6 082
%
0.97
12.38
63.15
23.50
-
1.01
Amount
852
3 834
7 703
3 529
662
16 580
%
5.14
23.12
46.46
21.28
3.99
2.75
Amount
1 558
7 637
15 586
9 433
1 068
35 282
%
4.42
21.65
44.18
26.74
3.03
5.85
Salaries Overtime Housing Allowance Medical Assistance

1 APRIL 2008 - 31 MARCH 2009 125
3. Employment and Vacancies The following tables summarise the number of posts on the establishment, the number of employees, the vacancy rate, andwhether there are any staff that are additional to the establishment. The vacancy rate reflects the percentage of posts that are notfilled.
Table 3.1 - Employment and Vacancies by ProgrammeProgramme
Administration
Surveys and Mapping
Cadastral Surveys
Restitution
Land Reform
Spatial Planning
Deeds Registration
Total
Number of posts
763
249
587
1 144
929
99
1 194
4 965
Number of postsfilled
628
187
517
881
766
78
1 079
4 136
Vacancy Rate %
17.69
24.90
11.93
22.99
17.55
21.21
9.63
16.70
Additional filledposts
6
-
38
6
185
10
7
252
Critical Occupations
Architects
Cartographic, Surveying
Cartographic and Surveyors
Community Development Workers
General Legal Administration
Legal Related
Social Sciences
Other
Total
Number of posts
37
219
368
1 052
989
137
129
2 034
4 965
Number of postsfilled
30
179
302
825
873
128
106
1 693
4 136
Vacancy Rate %
18.92
18.26
17.93
21.58
11.73
6.57
17.83
16.76
16.70
Additional filledposts
1
-
37
165
10
2
11
26
252
Salary Band
Lower skilled (1 - 2)
Skilled (3 - 5)
Highly skilled production (6 - 8)
Highly skilled supervision (9 - 12)
SMS (Level 13-16)
Total
Number of posts
63
747
2 716
1 314
125
4 965
Number of postsfilled
62
692
2 249
1 028
105
4 136
Vacancy Rate %
1.59
7.36
17.19
21.77
16.00
16.70
Additional filledposts
-
44
181
25
2
252
Table 3.2 - Employment and Vacancies by Salary Band
Table 3.3 - Employment and Vacancies by Critical Occupation

DEPARTMENT OF LAND AFFAIRS: ANNUAL REPORT126
4. Job EvaluationThe Public Service Regulations, 2001 introduced job evaluation (JE) as a way of ensuring that work of equal value is remuneratedequally. The jobs evaluated in the Department are more than the posts approved on the current establishment as the Departmenthas realigned its posts. The recommended amended structure for implementation over a period of 5 years are 7219.
Table 4.1 - Job EvaluationSalary Band
Lower skilled (1 - 2)
Skilled (3 - 5)
Highly skilled production(6 - 8)
Highly skilled supervision(9 - 12)
SMS (Band A)
SMS (Band B)
SMS (Band C)
SMS (Band D)
Total
Number of Posts
63
747
2 716
1 314
88
22
13
2
4 965
Number of JobsEvaluated
316
1 503
3 514
1 724
111
42
8
1
7 219
% of Postsevaluated bySalary Band
501.59
201.20
129.38
131.20
126.14
190.91
61.54
50.00
145.40
Number
316
1 503
3 498
1 720
111
42
8
1
7 199
%
100.00
100.00
99.54
99.77
100.00
100.00
100.00
100.00
99.72
Number
-
-
16
4
-
-
-
-
20
%
-
-
0.46
0.23
-
-
-
-
0.28
Posts Upgraded Posts Downgraded
Table 4.2 - Profile of Employees whose salary positions were upgraded dueto their posts being upgraded
Beneficiaries
Female
Male
TotalEmployees with a disability
African
261
192
453
Coloured
53
15
68
Indian
6
5
11
White
10
9
19
Total
330
221
5511
Table 4.3 - Employees whose salary level exceed the grade determinedby Job Evaluation
Occupation
Messengers, Porters and Deliverers
Administrative Related
Artisans
Architects, Town and Regional Planners
Auxiliary and Related Workers
Cartographers and Surveyors
Cartographic Surveying and RelatedTechnicians
Community Development Workers
Computer System Designer and Analyst
Finance and Related Professionals
Finance and Related Professionals
Finance and Related Professionals
General Legal
General Legal
General Legal
Human Resources
Human Resources
Language Practitioners
Reason for Deviation
Amended Structure
Amended Structure
Amended Structure
Restructuring
Vhatsutsumi
Protective Promotions
Amended Structure
Protective Promotions
Amended Structure
Protective Promotions
Protective Promotions
Amended Structure
OSD Implementation
OSD Implementation
OSD Implementation
Amended Structure
Protective Promotions
Amended Structure
Number ofEmployees
4
2
7
1
15
7
6
15
1
1
1
7
10
41
11
7
1
2
Remune-ration Level
3
11
8
13
6
9
6
11
12
13
12
9
8
10
12
6
13
12
JobEvaluation
Level
4
10
6
12
5
8
5
10
10
12
10
8
7
8
10
5
12
10

1 APRIL 2008 - 31 MARCH 2009 127
Table 4.3 - Employees whose salary level exceed the grade determinedby Job Evaluation (continued)
Occupation
Librarian and Related Professionals
Material Recording and Transport Clerks
Other Administrative and Related Clerks
Other Administrative and Related Clerks
Other Administrative and Related Clerks
Other Administrative and Related Clerks
Other Administrative and Related Clerks
Other Information Technology Personnel
Secretaries and other KeyboardOperating Clerks
Secretaries and other KeyboardOperating Clerks
Senior Managers
Senior Managers
Social Science Related
Statisticians and Related Professionals
TotalEmployees with a disability
Reason for Deviation
Higher Salary Award
Amended Structure
Amended Structure
Vhatsutsumi
Restructuring
Amended Structure
Amended Structure
Downgrade
Amended Structure
Amended Structure
Higher Salary Award
Higher Salary Award
Higher Salary Award
Amended Structure
Number ofEmployees
1
2
4
5
1
3
3
4
2
12
2
1
1
1
1795
Remune-ration Level
9
9
7
6
13
10
9
10
9
7
14
15
13
10
JobEvaluation
Level
8
7
6
3
8
8
8
8
7
6
13
14
12
9
Table 4.4 - Profile of Employees whose salary level exceed the grade determinedby Job Evaluation
Beneficiaries
Female
Male
TotalEmployees with a disability
African
48
76
124
Coloured
4
8
12
Indian
2
3
5
White
22
16
38
Total
76
103
1795
5. Employment ChangesTurnover rates provide an indication of trends in the employment profile of the Department. The following tables provide asummary of turnover rates by salary band (Table 5.1) and by critical occupations (Table 5.2).
Table 5.1 - Annual Turnover rates by Salary BandSalary Band
Lower skilled (1 - 2)
Skilled (3 - 5)
Highly skilled production (6 - 8)
Highly skilled supervision (9 - 12)
SMS (Level 13-16)
Total
Number ofEmployees on1 April 2008
194
904
1 512
838
91
3 539
Appointments andTransfers into the
Dept
32
310
1 462
147
9
960
Terminations andTransfers out of the
Dept
9
61
167
108
12
357
Turnover Rate
4.64
6.75
11.04
12.89
13.19
10.09

DEPARTMENT OF LAND AFFAIRS: ANNUAL REPORT128
Table 5.2 - Annual Turnover rates by Critical OccupationCritical Occupation
Architects
Cartographic, Surveying
Cartographic and Surveyors
Community Development Workers
General Legal Administration
Legal Related
Social Sciences
Other
Total
Number ofEmployees on1 April 2008
12
261
161
629
352
58
78
1 988
3 539
Appointments andTransfers into the
Dept
3
69
118
21
127
32
195
395
960
Terminations andTransfers out of the
Dept
1
3
12
22
13
9
19
278
357
Turnover Rate%
8.33
1.15
7.45
3.50
3.69
15.52
24.36
13.98
10.09
Table 5.3 - Reasons why staff are leaving the DepartmentTermination Type
Death
Resignation
Expiry of Contract
Dismissal - operational changes
Dismissal - misconduct
Dismissal - inefficiency
Discharged due to ill-health
Severance Packages
Retirement
Transfer to other Departments
Total
Total number of employees who left as a % of the total employment
Number
15
173
80
-
5
-
1
14
19
50
357
Percentage of Total Resignations
4.20
48.46
22.41
-
1.40
-
0.28
3.92
5.32
14.01
100.00
10.09
Table 5.4 - Promotions by Salary BandSalary Band
Lower skilled(1 - 2)
Skilled (3 - 5)
Highly skilled production(6 - 8)
Highly skilled supervision(9 - 12)
SMS (Level 13 - 16)
Total
Employees as at1 April 2008
194
904
1 512
838
91
3 539
Promotions toanother salary
level
2
180
431
331
13
957
Salary levelpromotions as a %
of employees
1.03
19.91
28.51
39.50
14.29
27.04
Progressions toanother notch
within salary level
96
436
618
306
29
1 485
Notchprogressions as %of employees by
occupation
49.48
48.23
40.87
36.52
31.87
41.96

1 APRIL 2008 - 31 MARCH 2009 129
Table 5.5 - Promotions by Critical OccupationPromotions toanother salary
level
3
44
38
163
43
11
35
620
957
Salary Band
Architects
Cartographic, Surveying
Cartographic andSurveyors
Community DevelopmentWorkers
General LegalAdministration
Legal Related
Social Sciences
Other
Total
Employees as at1 April 2008
12
261
161
629
352
58
78
1 988
3 539
Salary levelpromotions as a %
of employees
25.00
16.86
23.60
25.91
12.22
18.97
44.87
31.19
27.04
Progressions toanother notch
within salary level
6
83
151
153
178
23
23
891
1 508
Notchprogressions as %of employees by
occupation
50.00
31.80
93.79
24.32
50.57
39.66
29.49
44.82
42.61
6. Employment EquityThe tables in this section are based on the formats prescribed by the Employment Equity Act,1998 (Act No. 55 of 1998).
Table 6.1 - Total number of employees in each of the following categories (SASCO)Occupational Categories
Legislators, Senior Officials andManagers
Professionals
Technicians and AssociatedProfessionals
Clerks
Service and Sales Workers
Craft and related trades workers
Elementary Occupations
TotalEmployees with a disability
African
38
840
249
327
11
21
68
1 55424
Coloured
2
82
25
24
3
2
6
1446
Indian
3
28
3
5
-
1
-
402
Total Black
43
950
277
356
14
24
74
1 738 32
White
14
178
13
13
6
5
1
23020
Total
57
1 128
290
369
20
29
75
1 96852
Male
Occupational Categories
Legislators, Senior Officials andManagers
Professionals
Technicians and AssociatedProfessionals
Clerks
Service and Sales Workers
Craft and related trades workers
Elementary Occupations
TotalEmployees with a disability
African
27
691
214
506
4
3
53
1 498 18
Coloured
2
91
37
58
1
2
13
2044
Indian
3
32
12
11
-
-
-
581
Total Black
32
814
263
575
5
5
66
1 760 23
White
5
203
98
97
2
3
-
40819
Total
37
1 017
361
672
7
8
66
2 16842
Female
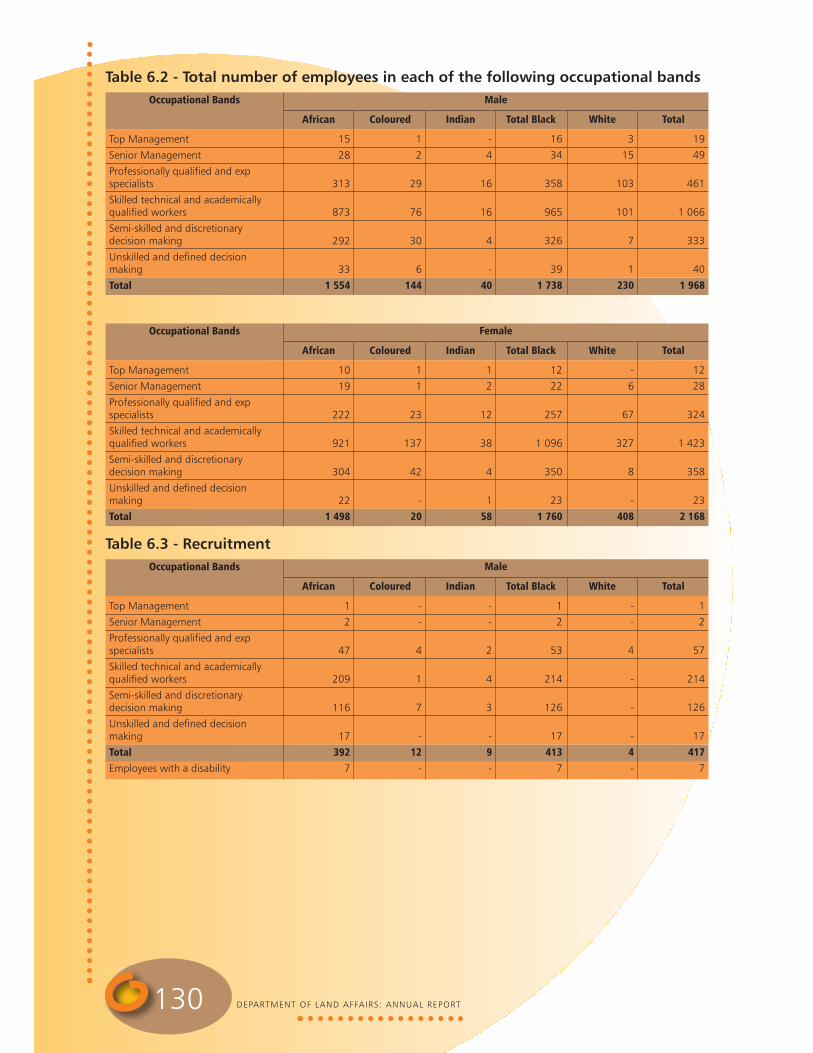
DEPARTMENT OF LAND AFFAIRS: ANNUAL REPORT130
Occupational Bands
Top Management
Senior Management
Professionally qualified and expspecialists
Skilled technical and academicallyqualified workers
Semi-skilled and discretionarydecision making
Unskilled and defined decisionmaking
Total
African
15
28
313
873
292
33
1 554
Coloured
1
2
29
76
30
6
144
Indian
-
4
16
16
4
-
40
Total Black
16
34
358
965
326
39
1 738
White
3
15
103
101
7
1
230
Total
19
49
461
1 066
333
40
1 968
Male
Occupational Bands
Top Management
Senior Management
Professionally qualified and expspecialists
Skilled technical and academicallyqualified workers
Semi-skilled and discretionarydecision making
Unskilled and defined decisionmaking
Total
African
10
19
222
921
304
22
1 498
Coloured
1
1
23
137
42
-
20
Indian
1
2
12
38
4
1
58
Total Black
12
22
257
1 096
350
23
1 760
White
-
6
67
327
8
-
408
Total
12
28
324
1 423
358
23
2 168
Female
Table 6.2 - Total number of employees in each of the following occupational bands
Occupational Bands
Top Management
Senior Management
Professionally qualified and expspecialists
Skilled technical and academicallyqualified workers
Semi-skilled and discretionarydecision making
Unskilled and defined decisionmaking
TotalEmployees with a disability
African
1
2
47
209
116
17
3927
Coloured
-
-
4
1
7
-
12-
Indian
-
-
2
4
3
-
9-
Total Black
1
2
53
214
126
17
4137
White
-
-
4
-
-
-
4-
Total
1
2
57
214
126
17
4177
Male
Table 6.3 - Recruitment

1 APRIL 2008 - 31 MARCH 2009 131
Occupational Bands
Top Management
Senior Management
Professionally qualified and expspecialists
Skilled technical and academicallyqualified workers
Semi-skilled and discretionarydecision making
Unskilled and defined decisionmaking
TotalEmployees with a disability
African
-
2
23
143
118
13
2993
Coloured
-
-
2
5
5
-
12-
Indian
-
-
1
2
-
-
3-
Total Black
-
2
26
150
123
13
3143
White
-
-
1
1
1
-
3-
Total
-
2
27
151
124
13
3173
Female
Occupational Bands
Top Management
Senior Management
Professionally qualified and expspecialists
Skilled technical and academicallyqualified workers
Semi-skilled and discretionarydecision making
Unskilled and defined decisionmaking
TotalEmployees with a disability
African
1
3
139
133
85
-
3616
Coloured
-
-
9
24
16
-
493
Indian
-
-
4
2
-
-
6-
Total Black
1
3
152
159
101
-
4169
White
-
2
17
10
6
-
352
Total
1
5
169
169
107
-
45111
Male
Occupational Bands
Top Management
Senior Management
Professionally qualified and expspecialists
Skilled technical and academicallyqualified workers
Semi-skilled and discretionarydecision making
Unskilled and defined decisionmaking
TotalEmployees with a disability
African
-
6
97
144
63
2
3126
Coloured
-
-
13
38
9
-
602
Indian
-
1
8
9
-
-
18-
Total Black
-
7
118
191
72
2
3908
White
-
-
44
71
1
-
1165
Total
-
7
162
262
73
2
50613
Female
Table 6.4 - Promotions

DEPARTMENT OF LAND AFFAIRS: ANNUAL REPORT132
Occupational Bands
Top Management
Senior Management
Professionally qualified and expspecialists
Skilled technical and academicallyqualified workers
Semi-skilled and discretionarydecision making
Unskilled and defined decisionmaking
TotalEmployees with a disability
African
2
-
43
38
15
4
102-
Coloured
-
2
4
7
5
-
18-
Indian
-
-
-
3
-
-
3-
Total Black
2
2
47
48
20
4
123-
White
-
1
7
14
-
-
22-
Total
2
3
54
62
20
4
145-
Male
Occupational Bands
Top Management
Senior Management
Professionally qualified and expspecialists
Skilled technical and academicallyqualified workers
Semi-skilled and discretionarydecision making
Unskilled and defined decisionmaking
TotalEmployees with a disability
African
-
5
22
45
20
2
94-
Coloured
-
-
5
2
5
-
12-
Indian
-
-
4
2
-
-
6-
Total Black
-
5
31
49
25
2
112 -
White
-
-
4
43
3
-
50-
Total
-
5
35
92
28
2
162-
Female
Table 6.5 - Terminations
Disciplinary Action
Correctional Counseling
Verbal Warning
Written Warning
Serious Written Warning
Final Written Warning
Suspended without pay
Fine
Demotion
Dismissal
Not guilty
Case withdrawn
TotalEmployees with a disability
African
1
-
-
-
1
-
-
-
1
-
-
3 -
Coloured
-
-
-
-
-
-
-
-
-
-
-
--
Indian
-
-
-
-
-
-
-
-
-
-
-
- -
Total Black
1
-
-
-
1
-
-
-
1
-
-
3-
White
-
-
-
-
-
-
-
-
-
-
-
- -
Total
1
-
-
-
1
-
-
-
1
-
-
3-
Male
Table 6.6 - Disciplinary Action
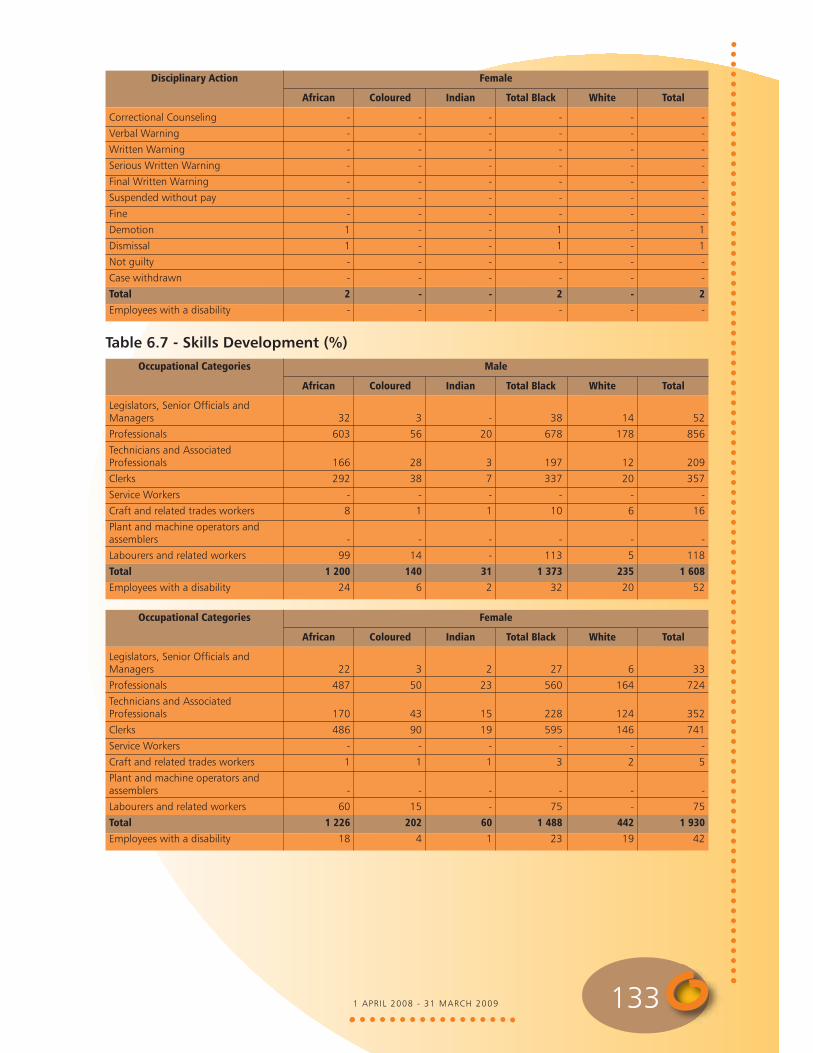
1 APRIL 2008 - 31 MARCH 2009 133
Disciplinary Action
Correctional Counseling
Verbal Warning
Written Warning
Serious Written Warning
Final Written Warning
Suspended without pay
Fine
Demotion
Dismissal
Not guilty
Case withdrawn
TotalEmployees with a disability
African
-
-
-
-
-
-
-
1
1
-
-
2-
Coloured
-
-
-
-
-
-
-
-
-
-
-
- -
Indian
-
-
-
-
-
-
-
-
-
-
-
- -
Total Black
-
-
-
-
-
-
-
1
1
-
-
2 -
White
-
-
-
-
-
-
-
-
-
-
-
- -
Total
-
-
-
-
-
-
-
1
1
-
-
2-
Female
Table 6.7 - Skills Development (%)Occupational Categories
Legislators, Senior Officials andManagers
Professionals
Technicians and AssociatedProfessionals
Clerks
Service Workers
Craft and related trades workers
Plant and machine operators andassemblers
Labourers and related workers
TotalEmployees with a disability
African
32
603
166
292
-
8
-
99
1 200 24
Coloured
3
56
28
38
-
1
-
14
1406
Indian
-
20
3
7
-
1
-
-
312
Total Black
38
678
197
337
-
10
-
113
1 373 32
White
14
178
12
20
-
6
-
5
23520
Total
52
856
209
357
-
16
-
118
1 60852
Male
Occupational Categories
Legislators, Senior Officials andManagers
Professionals
Technicians and AssociatedProfessionals
Clerks
Service Workers
Craft and related trades workers
Plant and machine operators andassemblers
Labourers and related workers
TotalEmployees with a disability
African
22
487
170
486
-
1
-
60
1 226 18
Coloured
3
50
43
90
-
1
-
15
202 4
Indian
2
23
15
19
-
1
-
-
601
Total Black
27
560
228
595
-
3
-
75
1 488 23
White
6
164
124
146
-
2
-
-
442 19
Total
33
724
352
741
-
5
-
75
1 93042
Female

DEPARTMENT OF LAND AFFAIRS: ANNUAL REPORT134
7. Performance RewardsTo encourage excellent performance, the Department has granted the following performance rewards during the year under review.The information is presented in terms of race, gender and disability (Table 7.1), salary bands (Table 7.2) and critical occupations(Table 7.3).
Table 7.1 - Performance Rewards by race, gender and disability
Average Costper Employee
14.134
16.167
21.222
12.056
15.082
20.000
14.739
16.634
25.150
37.533
19.81018.079
Cost(R'000)
4 862
4 834
573
217
1 463
1 320
6 898
6 371
6 891
4 504
24 664687
% of Total withingroup
22.14
19.96
18.75
8.82
242.50
113.79
26.93
21.76
119.13
29.41
30.1040.43
Total number ofemployees
1 554
1 498
144
204
40
58
1 738
1 760
230
408
4 136 94
Number ofBeneficiaries
344
299
27
18
97
66
468
383
274
120
1 24538
Race, Gender and Disability
African Male
African Female
Coloured Male
Coloured Female
Indian Male
Indian Female
Total Blacks, Male
Total Blacks, Female
White Male
White Female
TotalEmployees with disabilities
Beneficiary Profile Cost
Average Costper Employee
45.000
26.369
11.737
19.061
24.087
81.971
34.864
14.577
20.362
Cost(R'000)
135
2 716
1 338
2 192
7 515
2 787
767
7 901
25 351
% of Total withingroup
10.00
57.54
37.75
13.94
35.74
26.56
20.75
32.01
30.10
Total number ofemployees
30
179
302
825
873
128
106
1 693
4 136
Number ofBeneficiaries
3
103
114
115
312
34
22
542
1 245
Critical Occupations
Architects
Cartographic, Surveying
Cartographic and Surveyors
Community Development Workers
General Legal Administration
Legal Related
Social Sciences
Other
Total
Beneficiary Profile Cost
Average Costper Employee
8.636
9.317
15.217
36.226
19.697
Cost(R'000)
95
1 733
11 443
11 882
25 153
% of Total withingroup
17.74
26.88
33.44
31.91
31.68
Total number ofemployees
62
692
2 249
1 028
4 031
Number ofBeneficiaries
11
186
752
328
1 277
Salary Bands
Lower skilled (1 - 2)
Skilled (3 - 5)
Highly skilled production (6 - 8)
Highly skilled supervision (9 - 12)
Total
Beneficiary Profile Cost
Table 7.2 - Performance Rewards by Salary Band below SMS
Table 7.3 - Performance Rewards by Critical Occupations
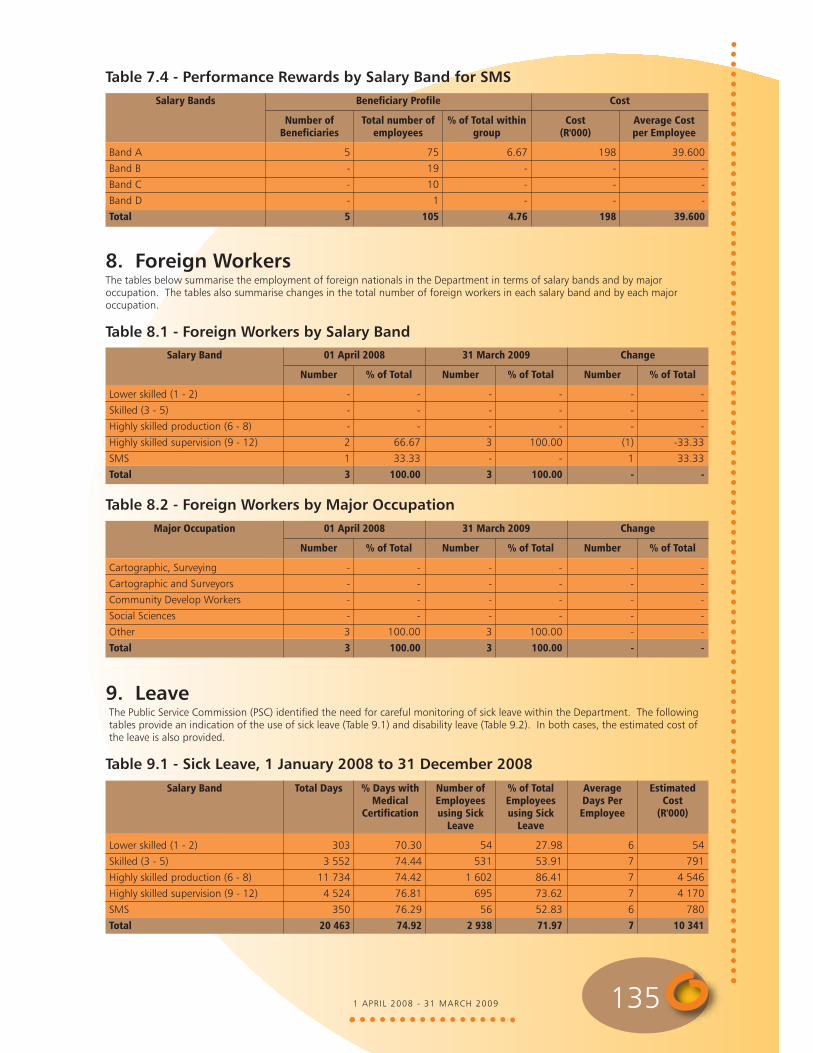
1 APRIL 2008 - 31 MARCH 2009 135
Average Costper Employee
39.600
-
-
-
39.600
Cost(R'000)
198
-
-
-
198
% of Total withingroup
6.67
-
-
-
4.76
Total number ofemployees
75
19
10
1
105
Number ofBeneficiaries
5
-
-
-
5
Salary Bands
Band A
Band B
Band C
Band D
Total
Beneficiary Profile Cost
Table 7.4 - Performance Rewards by Salary Band for SMS
8. Foreign Workers The tables below summarise the employment of foreign nationals in the Department in terms of salary bands and by majoroccupation. The tables also summarise changes in the total number of foreign workers in each salary band and by each majoroccupation.
Table 8.1 - Foreign Workers by Salary BandSalary Band
Lower skilled (1 - 2)
Skilled (3 - 5)
Highly skilled production (6 - 8)
Highly skilled supervision (9 - 12)
SMS
Total
Number
-
-
-
2
1
3
% of Total
-
-
-
66.67
33.33
100.00
Number
-
-
-
3
-
3
% of Total
-
-
-
100.00
-
100.00
Number
-
-
-
(1)
1
-
% of Total
-
-
-
-33.33
33.33
-
01 April 2008 31 March 2009 Change
Major Occupation
Cartographic, Surveying
Cartographic and Surveyors
Community Develop Workers
Social Sciences
Other
Total
Number
-
-
-
-
3
3
% of Total
-
-
-
-
100.00
100.00
Number
-
-
-
-
3
3
% of Total
-
-
-
-
100.00
100.00
Number
-
-
-
-
-
-
% of Total
-
-
-
-
-
-
01 April 2008 31 March 2009 Change
Table 8.2 - Foreign Workers by Major Occupation
9. LeaveThe Public Service Commission (PSC) identified the need for careful monitoring of sick leave within the Department. The followingtables provide an indication of the use of sick leave (Table 9.1) and disability leave (Table 9.2). In both cases, the estimated cost ofthe leave is also provided.
Table 9.1 - Sick Leave, 1 January 2008 to 31 December 2008Salary Band
Lower skilled (1 - 2)
Skilled (3 - 5)
Highly skilled production (6 - 8)
Highly skilled supervision (9 - 12)
SMS
Total
Total Days
303
3 552
11 734
4 524
350
20 463
% Days withMedical
Certification
70.30
74.44
74.42
76.81
76.29
74.92
Number ofEmployeesusing Sick
Leave
54
531
1 602
695
56
2 938
% of TotalEmployeesusing Sick
Leave
27.98
53.91
86.41
73.62
52.83
71.97
AverageDays PerEmployee
6
7
7
7
6
7
EstimatedCost
(R'000)
54
791
4 546
4 170
780
10 341

DEPARTMENT OF LAND AFFAIRS: ANNUAL REPORT136
Salary Band
Lower skilled (1 - 2)
Skilled (3 - 5)
Highly skilled production (6 - 8)
Highly skilled supervision (9 - 12)
SMS
Total
Total Days
-
63
892
315
37
1 307
% Days withMedical
Certification
-
100.00
100.00
100.00
100.00
100.00
Number ofEmployeesusing Sick
Leave
-
4
19
16
4
43
% of TotalEmployeesusing Sick
Leave
-
0.41
1.02
1.69
3.77
1.05
AverageDays PerEmployee
-
16
47
20
9
30
EstimatedCost
(R'000)
-
15
374
234
29
652
Table 9.2 - Incapacity Leave, 1 January 2008 to 31 December 2008
Table 9.3 - Annual Leave, 1 January 2008 to 31 December 2008Salary Band
Lower skilled (1 - 2)
Skilled (3 - 5)
Highly skilled production (6 - 8)
Highly skilled supervision (9 - 12)
SMS
Total
Total Days
980
12 119
44 474
21 225
2 108
80 906
Average Days Per Employee
5
12
24
22
20
20
Total number of employeesin salary band
193
985
1 854
944
105
4 081
Salary Band
Lower skilled (1 - 2)
Skilled (3 - 5)
Highly skilled production (6 - 8)
Highly skilled supervision (9 - 12)
SMS
Total
Total Days of Capped Leavetaken
5
149
604
213
45
1 016
Average number of daystaken per employee
5.00
7.45
5.08
4.26
4.09
5.05
Total number of employeeswho took Capped Leave
1
20
119
50
11
201
Table 9.4 - Capped Leave, 1 January 2008 to 31 December 2008
Table 9.5 - Leave PayoutsReason
Capped leave payouts on termination of service for 2007/2008
Current leave payouts on termination of service for 2007/2008
Total
Averagepayment per
Employee
17.147
10.957
15.825
Number ofEmployees
265
101
366
Total Amount
2 502
759
3 261

1 APRIL 2008 - 31 MARCH 2009 137
10. HIV/AIDS and Health Promotion ProgrammesTable 10.1 - Steps taken to reduce the risk of occupational exposure
Units/categories of employees identified to be at high risk of contracting HIV & relateddiseases (if any)
None
Key steps taken to reduce the risk
None
Table 10.2 - Details of Health Promotion and HIV/Aids Programmes(tick the applicable boxes and provide required information)
Question
1. Has the department designated a member of the SMSto implement the provisions contained in Part VI E ofChapter 1 of the Public Service Regulations, 2001? Ifso, provide her/his name and position.
2. Does the Department have a dedicated unit or haveyou designated specific staff members to promote thehealth and well being of your employees? If so,indicate the number of employees who are involved inthis task and the annual budget that is available forthis purpose.
3. Has the Department introduced an EmployeeAssistance or Health Promotion Programme for youremployees? If so, indicate the key elements/services ofthis Programme.
4. Has the Department established (a) committee(s) ascontemplated in Part VI E.5 (e) of Chapter 1 of thePublic Service Regulations, 2001? If so, please providethe names of the members of the committee and thestakeholder(s) that they represent.
5. Has the Department reviewed the employmentpolicies and practices of your Department to ensurethat these do not unfairly discriminate againstemployees on the basis of their HIV status? If so, listthe employment policies/practices so reviewed.
6. Has the Department introduced measures to protectHIV-positive employees or those perceived to be HIV-positive from discriminations? If so, list the keyelements of these measures.
7. Does the Department encourage its employees toundergo Voluntary Counseling and Testing? If so, listthe results that have been achieved.
8. Has the Department developed measures/indicatorsto monitor and evaluate the impact of your healthpromotion programme? If so, list thesemeasures/indicators.
Detail, if yes
Mr T Mogashoa, Director: HRM
Employee Wellness Subdirectorate: Deputy Director,2 Assistant Directors and 1 Admin Officer.
Employee Wellness Programme: Policy has beendeveloped, Psycho-social services, Health Promotion:Wellness days & Flu vaccine, Life skills: Stress & Change,Financial Fitness and HIV & AIDS
9 Provincial HIV/AIDS Committees have beenestablished.
Performance management, Labour Relations, LeavePolicy, Recruitment & Selection, Basic conditions ofService, HIV/AIDS & Employee Wellness Policies.
HIV/AIDS Programme is being implemented, and HIVtraining conducted to staff and managers. Applicationof reasonable accommodation allowing access topsycho-social and medical services.
This is incorporated with Wellness day events every yearResults from 9 Provinces indicated 30% uptake.
Monthly Statistical reports, Quarterly Reports. Clientfeedback surveys.Road-shows give employees an opportunity to givefeedback on interventions.
Yes
X
X
X
X
X
X
X
X
No

DEPARTMENT OF LAND AFFAIRS: ANNUAL REPORT138
11. Labour Relations The following tables summarise the outcome of disciplinary hearings conducted within the Department for the year under review.
Table 11.1 - Collective Agreements
Subject Matter
None
Total collective agreements
Date
Table 11.2 - Misconduct and Discipline Hearings finalisedOutcomes of Disciplinary Hearings
Correctional Counseling
Verbal Warning
Written Warning
Final Written Warning
Suspended without pay
Fine
Demotion
Dismissal
Not guilty
Case withdrawn
Total
Number
1
-
-
1
-
-
1
2
-
-
5
% of Total
20.00
-
-
20.00
-
-
20.00
40.00
-
-
100.00
Table 11.3 - Types of misconduct addressed at Disciplinary HearingsType of misconduct
Abuse of state vehicle
Assault/Foul Language
Theft/Fraud
Abuse of internet
Unauthorised absenteeism/Late coming
Drunk on Duty
Unauthorised remunerative work outside Public Service
Failure to adhere to Travel Policy
Total
Number
-
-
4
-
-
1
-
-
5
% of Total
-
-
80.00
-
-
20.00
-
-
100.00
Table 11.4 - Grievances lodgedGrievances
Number of grievances resolved
Number of grievances not resolved
Total number of grievances lodged
Number
30
8
38
% of Total
78.95
21.05
100.00
Table 11.5 - Disputes lodged with CouncilsDisputes
Number of disputes upheld
Number of disputes dismissed
Total number of disputes lodged
Number
8
6
14
% of Total
57.14
42.86
100.00

1 APRIL 2008 - 31 MARCH 2009 139
Table 11.6 - Strike Actions
Total
-
-
-
Strike Actions
Total number of person working days lost
Total cost (R'000) of working days lost
Amount recovered as a result of no work no pay
Table 11.7 - Precautionary Suspensions
Total
7
6
42
125
Precautionary Suspensions
Number of people suspended
Number of people whose suspension exceeded 30 days
Average number of days suspended
Cost (R'000)
12. Skills DevelopmentThis section highlights the efforts of the Department with regard to skills development for the year under review.
Table 12.1 - Training Needs Identified
Occupational Categories
Legislators, Senior Officials andManagers
Professionals
Technicians and associatedProfessionals
Clerks
Service and Sales Workers
Craft and related trade workers
Plant and machine operators &assemblers
Elementary occupations
Sub Total
Total
Gender
Female
Male
Female
Male
Female
Male
Female
Male
Female
Male
Female
Male
Female
Male
Female
Male
Female
Male
Number ofEmployees
01 April 2008
33
52
724
857
352
209
741
357
0
0
5
16
0
0
75
118
1 930
1 609
3 539
Learnerships
-
-
-
-
-
-
-
-
-
-
-
-
-
-
-
-
-
-
-
SkillsProgrammes &short courses
30
65
730
650
365
602
839
714
0
0
0
3
0
0
87
123
2 051
2 157
4 208
Other forms ofTraining
-
-
-
-
-
-
-
-
-
-
-
-
-
-
-
-
-
-
-
Total
30
65
730
650
365
602
839
714
0
0
0
3
0
0
87
123
2 051
2 157
4 208
Training needs identified at start of Reporting Period

DEPARTMENT OF LAND AFFAIRS: ANNUAL REPORT140
Occupational Categories
Legislators, Senior Officials andManagers
Professionals
Technicians and associatedProfessionals
Clerks
Service and Sales Workers
Craft and related trade workers
Plant and machine operators &assemblers
Elementary occupations
Sub Total
Total
Gender
Female
Male
Female
Male
Female
Male
Female
Male
Female
Male
Female
Male
Female
Male
Female
Male
Female
Male
Number ofEmployees
01 April 2008
33
52
724
857
352
209
741
357
0
0
5
16
0
0
75
118
1 930
1 609
3 539
Learnerships
-
-
-
-
-
-
-
-
-
-
-
-
-
-
-
-
-
-
-
SkillsProgrammes &short courses
30
65
730
650
365
602
839
714
0
0
0
3
0
0
87
123
2 051
2 157
4 208
Other forms ofTraining
-
-
-
-
-
-
-
-
-
-
-
-
-
-
-
-
-
-
-
Total
30
65
730
650
365
602
839
714
0
0
0
3
0
0
87
123
2 051
2 157
4 208
Training needs identified at start of Reporting Period
Table 12.2 - Training Provided
13. Injury on DutyThe following table provides the basic information on injury on duty for the Department in the year under review.
Table 13.1 - Injury on DutyNature of injury on duty
Required basic medical attention only
Temporary Total Disablement
Permanent Disablement
Fatal
Total
Number
12
-
-
-
12
% of Total
100.00
-
-
-
100.00

1 APRIL 2008 - 31 MARCH 2009 141
14. Utilisation of ConsultantsTable 14.1 - Report on consultant appointments using appropriated funds
Project Title
Advertisement
Advisory Consulting Services
Appointment of Service Providers
Appointment of a Specialist
Appointment of Temporary Workers
Catering Services
Development of Land Reform Framework
Electrical Repairs
Extension of Storage with Relocation
Extension of Contract
Land Surveys
Legal Representative
Mentorship
Office Cleaning Services
Personnel Agency Fees
Projector's Maintenance Fee
Equipment
Request for additional quantities
Security Guarding Services
Update Valuation Reports
Valuations of Land
TOTAL
Total number ofConsultants thatworked on the
Project
1
74
16
1
214
2
1
2
1
3
2
1
2
1
2
1
3
2
1
5
546
881
Contract Value inRand('000)
11
6,010
3,796
354
9,152
4
45
16
13
159
55
6
713
2
87
23
71
50
93
261
15,217
36,138
In addition to the above, the Department also made use of:
� Business advisory services .......................................R74,763,439.54
� Contractors ............................................................R13,253,465.17; and
� Agency and Support/Outsourced Services ...............R48,157,673.82

land
aff
airs
DEPARTMENT OF LAND AFFAIRS: ANNUAL REPORT142
abbreviations& acronyms
AFREF - African Geodetic ReferenceFrame
AgriSETA - Agricultural Sector EducationTraining Authority
AMR - Asset Management ReformsARC - Agricultural Research Council
BLM - BloemfonteinBoG - Balance of GrantBPRS - Batho-Pele Revitalisation
StrategyBSc - Bachelor of Science
CBO - Community BasedOrganisation
CCTV - Closed-Circuit Television CEC - Committee for Environmental
Coordination CEIMP - Consolidated Environmental
Implementation ManagementPlan
CLaRA - Communal Land Rights ActCOMG - Commonage GrantCOO - Chief Operations OfficerCRM - Client Relations ManagementCT - Cape TownCTH - Cheadle Thompson and
Haysom
DBSA - Development Bank ofSouthern Africa
DCS - Document Copy SystemDDF - Departmental Disability Forum DLA - Department of Land AffairsDPSA - Department of Public Service
and Admnistration
EC - Eastern CapeECPLRO - Eastern Cape Provincial Land
Reform Office
EWP - Employee WellnessProgramme
EXP - Experienced
FICA - Financial Intelligence CentreAct
FSPLRO - Free State Provincial LandReform Office
GAAP - General Accepted AccountingPractice
GCCN - Government CommonControlled Network
GCIS - Government CommunicationsInformation System
GIS - Geographic InformationSystems
GPLRO - Gauteng Provincial LandReform Office
GPS - Global Positioning System
HIV - Human Immune Virus HIV/AIDS - Human Immune Virus/
Acquired Immune DeficiencySyndrome
HR - Human ResourceHRD - Human Resource
DevelopmentHRM - Human Resource
Management
ICS - Image Copy SystemICT - Information and
Communication TechnologiesIDP - Integrated Development Plan
JE - Job EvaluationJHB - Johannesburg

land a
ffair
s
1 APRIL 2008 - 31 MARCH 2009 143
KAPP - Knowledge, Attitude, Perceptions andPractice
Km2 - Square KilometreKWT - King Williams TownKZN - KwaZulu-Natal KZNPLRO - KwaZulu-Natal Provincial Land Reform Office
LARP - Land and Agrarian Reform ProgrammeLCC - Land Claims CommissionerLPLRO - Limpopo Provincial Land Reform OfficeLRAD - Land Redistribution for Agricultural
DevelopmentLUMA - Land Use Management ActLUMB - Land Use Management Bill
M&E - Monitoring and Evaluation MISS - Minimum Information Security StandardMPLRO - Mpumalanga Provincial Land Reform OfficeMSP - Master Systems PlanMTEF - Medium Term Expenditure Framework
NCPLRO - Northern Cape Provincial Land Reform OfficeNEPAD - New Partnership for Africa’s DevelopmentNGO - Non Governmental OrganisationNWPLRO - North West Provincial Land Reform Office
ODG - Office of the Director-GeneralOHS - Occupational Health and Safety
PFMA - Public Finance Management ActPLAS - Pro-active Land Acquisition StrategyPLOF - Policy on Land Ownership by ForeignersPLRO - Provincial Land Reform OfficePLSS - Public Land Support ServicesPLST&ST - Professional Land Surveyors in Training and
Surveyor Technicians PMB - PietermaritzburgPPP - Private Public PartnershipPSC - Public Service Commission
RCMRD - Regional Centre for Mapping of Resource forDevelopment
RFP - Request For ProposalRFQ - Request for Qualification
SACPLAN - South African Council for PlannersSADC - South African Development CommunitySADT - South African Development TrustSAPS - South African Police ServiceSASSA - South African Social Security AgencySCM - Supply Chain ManagementSCOPA - Standing Committee on Public AccountsSDF - Spatial Development FrameworkSDI - Spatial Data Infrastructure Act SDIP - Service Delivery Improvement Plans SG - Surveyor GeneralSGP - Settlement Growth PatternsSITA - State Information Technology Agency SLA - Service Level AgreementSLAG - Settlement Land Acquisition GrantSMD - Spatial MetaData Discovery SMS - Senior Management ServicesSPLAG - Settlement and Production Land Acquisition
Grant
TRANCRAA - Transformation of Certain Rural Areas ActTUT - Tshwane University of Technology
UNISA - University of South Africa
VPN - Virtual Private Network
WAN - Wide Area NetworkWC - Western CapeWCPLRO - Western Cape Provincial Land Reform Office
YARD - Youth in Agriculture and Rural Development

N O T E S
Related Documents