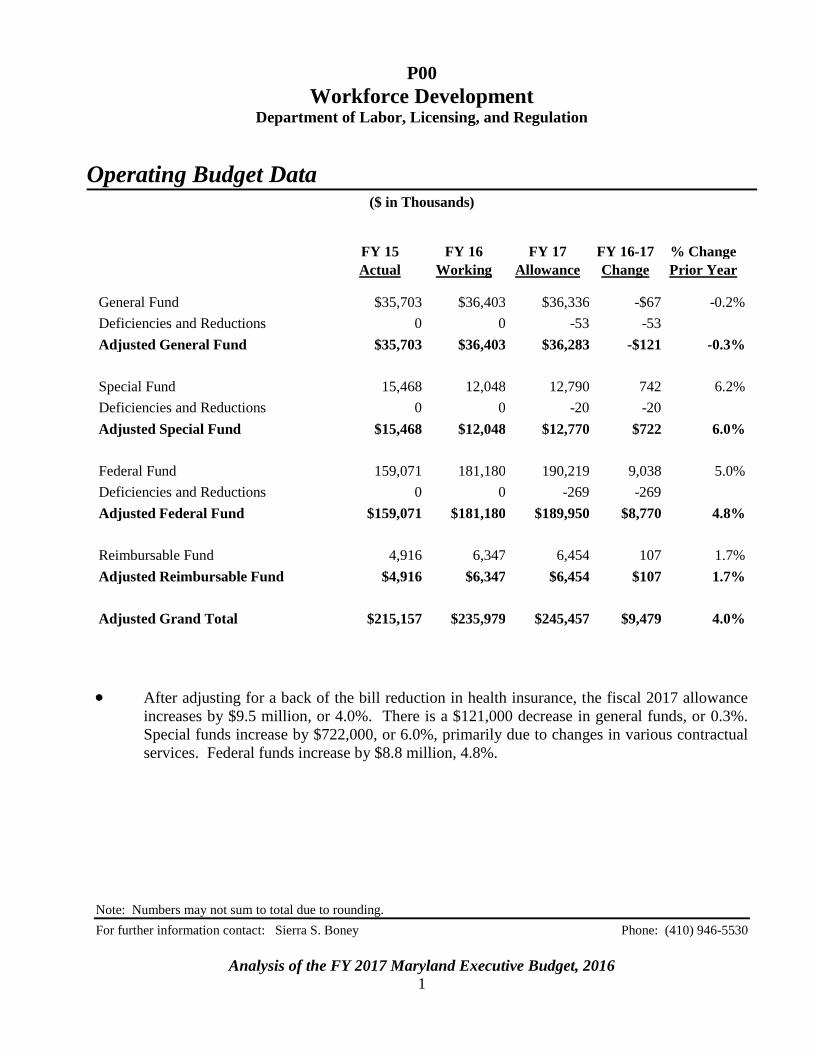
P00 Workforce Development Department of Labor, Licensing, and Regulation Note: Numbers may not sum to total due to rounding. For further information contact: Sierra S. Boney Phone: (410) 946-5530 Analysis of the FY 2017 Maryland Executive Budget, 2016 1 Operating Budget Data ($ in Thousands) FY 15 FY 16 FY 17 FY 16-17 % Change Actual Working Allowance Change Prior Year General Fund $35,703 $36,403 $36,336 -$67 -0.2% Deficiencies and Reductions 0 0 -53 -53 Adjusted General Fund $35,703 $36,403 $36,283 -$121 -0.3% Special Fund 15,468 12,048 12,790 742 6.2% Deficiencies and Reductions 0 0 -20 -20 Adjusted Special Fund $15,468 $12,048 $12,770 $722 6.0% Federal Fund 159,071 181,180 190,219 9,038 5.0% Deficiencies and Reductions 0 0 -269 -269 Adjusted Federal Fund $159,071 $181,180 $189,950 $8,770 4.8% Reimbursable Fund 4,916 6,347 6,454 107 1.7% Adjusted Reimbursable Fund $4,916 $6,347 $6,454 $107 1.7% Adjusted Grand Total $215,157 $235,979 $245,457 $9,479 4.0% After adjusting for a back of the bill reduction in health insurance, the fiscal 2017 allowance increases by $9.5 million, or 4.0%. There is a $121,000 decrease in general funds, or 0.3%. Special funds increase by $722,000, or 6.0%, primarily due to changes in various contractual services. Federal funds increase by $8.8 million, 4.8%.

Welcome message from author
This document is posted to help you gain knowledge. Please leave a comment to let me know what you think about it! Share it to your friends and learn new things together.
Transcript
P00
Workforce Development Department of Labor, Licensing, and Regulation
Note: Numbers may not sum to total due to rounding. For further information contact: Sierra S. Boney Phone: (410) 946-5530
Analysis of the FY 2017 Maryland Executive Budget, 2016 1
Operating Budget Data
($ in Thousands)
FY 15 FY 16 FY 17 FY 16-17 % Change
Actual Working Allowance Change Prior Year
General Fund $35,703 $36,403 $36,336 -$67 -0.2%
Deficiencies and Reductions 0 0 -53 -53
Adjusted General Fund $35,703 $36,403 $36,283 -$121 -0.3%
Special Fund 15,468 12,048 12,790 742 6.2%
Deficiencies and Reductions 0 0 -20 -20
Adjusted Special Fund $15,468 $12,048 $12,770 $722 6.0%
Federal Fund 159,071 181,180 190,219 9,038 5.0%
Deficiencies and Reductions 0 0 -269 -269
Adjusted Federal Fund $159,071 $181,180 $189,950 $8,770 4.8%
Reimbursable Fund 4,916 6,347 6,454 107 1.7%
Adjusted Reimbursable Fund $4,916 $6,347 $6,454 $107 1.7%
Adjusted Grand Total $215,157 $235,979 $245,457 $9,479 4.0%
After adjusting for a back of the bill reduction in health insurance, the fiscal 2017 allowance
increases by $9.5 million, or 4.0%. There is a $121,000 decrease in general funds, or 0.3%.
Special funds increase by $722,000, or 6.0%, primarily due to changes in various contractual
services. Federal funds increase by $8.8 million, 4.8%.

P00 – DLLR – Workforce Development
Analysis of the FY 2017 Maryland Executive Budget, 2016 2
Personnel Data
FY 15 FY 16 FY 17 FY 16-17
Actual Working Allowance Change
Regular Positions
1,251.19
1,246.19
1,232.09
-14.10
Contractual FTEs
141.26
221.36
79.08
-142.28
Total Personnel
1,392.45
1,467.55
1,311.17
-156.38
Vacancy Data: Regular Positions
Turnover and Necessary Vacancies, Excluding New
Positions
45.27
3.68%
Positions and Percentage Vacant as of 12/31/15
22.00
1.77%
Regular positions decrease by a net of 14.10 in fiscal 2017. Position abolitions include
5.0 regular positions in the Office of Budget and Fiscal Services; 1.0 position in the Office of
Human Resources; and 10.10 regular positions in the Division of Unemployment Insurance
(DUI). This reduction was slightly offset by the addition of 2.0 regular positions in the
Workforce Development Program.
In fiscal 2017, there are 142.28 contractual full-time equivalents abolished with the most
significant decreases in the Workforce Development Program and DUI.
After accounting for the position abolitions, there are only 8.0 vacant positions. The fiscal 2017
budget requires 45.0 vacancies to meet turnover. It should be noted that the Department of
Labor, Licensing, and Regulation disputes the number of vacancy positions (saying it is higher).
Vacancy data is as received from the Department of Budget and Management.

P00 – DLLR – Workforce Development
Analysis of the FY 2017 Maryland Executive Budget, 2016 3
Analysis in Brief
Major Trends
Adult Basic Education Students’ Advancement: In fiscal 2014, there was a decrease in the number
of general educational development (GED) test takers and high school diploma recipients through the
Adult Basic Education program. This is likely due to the new more rigorous, computerized GED test.
Unemployment Cases Evaluated by Appeals Board: There was a decline in the number of
unemployment insurance cases pending before the Board of Appeals in fiscal 2015.
Issues
Progress of the Employment Advancement Right Now Program: The Maryland Employment
Advancement Right Now (EARN) program awarded 29 implementation grants in June 2014. The
average grant was $179,302. The EARN program was established by Chapter 1 of 2013 and at this
point should have quantifiable data available to assess the success of the program. The Department
of Legislative Services (DLS) recommends that the EARN 2016 annual report include retention
data for programs where it is available, a breakdown of the quantifiable measures used to
determine efficiency and effectiveness of strategic partnerships, and quantitative employment
data received from each partnership. DLS also recommends that the Business Economic and
Community Outreach Network report that provided a performance evaluation of the program
be submitted to the General Assembly.
Recommended Actions
1. Concur with Governor’s allowance.
Updates
Unemployment Insurance Modernization: DUI is taking steps to modernize the technology associated
with its three largest functions – benefits, contributions, and appeals. Maryland is currently
collaborating with West Virginia to develop the new system. This update provides a progress report
on the current status of this project.
Unemployment Insurance: With the continued relatively favorable employment picture in the State
and lower claims activity, the balance of the Unemployment Insurance Trust Fund is at a level that
allows Maryland employers to pay from the lowest cost table in calendar 2016, a decrease from
calendar 2015 tax rates. Maryland’s unemployment rate improved to 5.1% from 6.3% a year ago.

P00 – DLLR – Workforce Development
Analysis of the FY 2017 Maryland Executive Budget, 2016 4
New Computer-based GED Testing: In January 2014, the GED Testing Service rolled out a new
assessment test to allow adult learners to earn high school credentials. The new GED test aligns with
the new Common Core State Standards and the Office of Career, Technical, and Adult Education
recommendations. The 2015 Joint Chairmen’s Report requested a report on new GED testing options
and implementation. This update summarizes the findings in the report.
P00
Workforce Development Department of Labor, Licensing, and Regulation
Analysis of the FY 2017 Maryland Executive Budget, 2016 5
Operating Budget Analysis
Program Description
The Department of Labor, Licensing, and Regulation (DLLR) includes many of the State’s
agencies and boards responsible for licensing and regulating various businesses, professions, and
trades. The department also administers a variety of employment service and adult learning programs.
This analysis focuses on the department’s administrative and workforce development units.
The administrative offices include the Office of the Secretary, legal services, equal opportunity and
program evaluation, the Governor’s Workforce Investment Board, appeals, budget and fiscal services,
general services, information technology, and personnel.
The bulk of the department’s funding and personnel are within the following divisions:
Division of Workforce Development and Adult Learning (DWDAL) that operates
workforce development programs including job services, Workforce Investment Act, and labor
market information programs. It also manages the newly aligned adult education programs
including adult literacy programs and skills training for correctional institutions. Its mission is
to support the State’s economic growth though a workforce development, education, and
training system that is responsive to the needs of adult learners, job seekers, employers, and all
system partners.
Division of Unemployment Insurance (DUI) that operates the federally funded
unemployment insurance (UI) programs. Its mission is to provide prompt, temporary, partial
wage replacement to eligible individuals who are unemployed, help facilitate their return to
work, and collect unemployment insurance tax contributions from employers.
A separate analysis discusses business regulation and occupational licensing functions.
Performance Analysis: Managing for Results
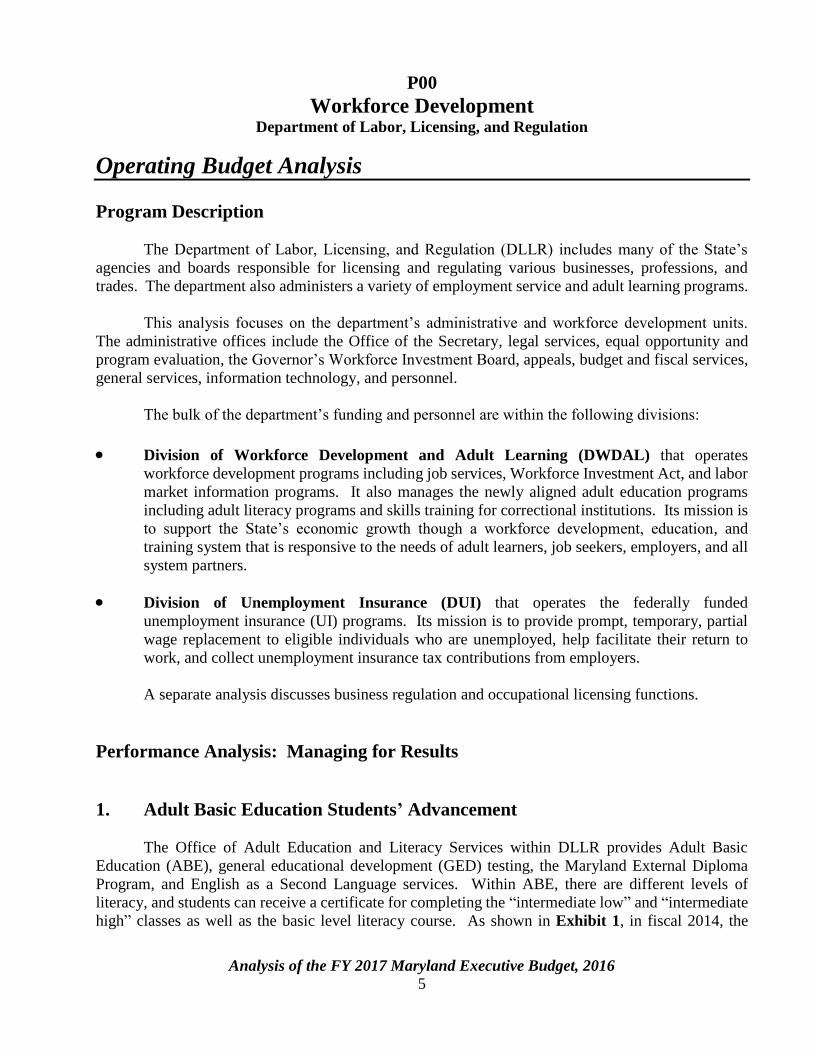
1. Adult Basic Education Students’ Advancement
The Office of Adult Education and Literacy Services within DLLR provides Adult Basic
Education (ABE), general educational development (GED) testing, the Maryland External Diploma
Program, and English as a Second Language services. Within ABE, there are different levels of
literacy, and students can receive a certificate for completing the “intermediate low” and “intermediate
high” classes as well as the basic level literacy course. As shown in Exhibit 1, in fiscal 2014, the
P00 – DLLR – Workforce Development
Analysis of the FY 2017 Maryland Executive Budget, 2016 6
percentage of ABE students receiving a high school diploma, passing the GED, or advancing from
one literacy level to another all fell compared to prior years. This decline coincided with the
implementation of the new more rigorous GED testing format. While the number of high school
diplomas issued decreased in fiscal 2015, the GED pass rate has increased while literacy level
advancement dropped slightly.
Exhibit 1
Students GED, High School Diploma, and Advancing Literacy Level Rate Fiscal 2011-2017 Est.
GED: general educational development
Source: Department of Budget and Management
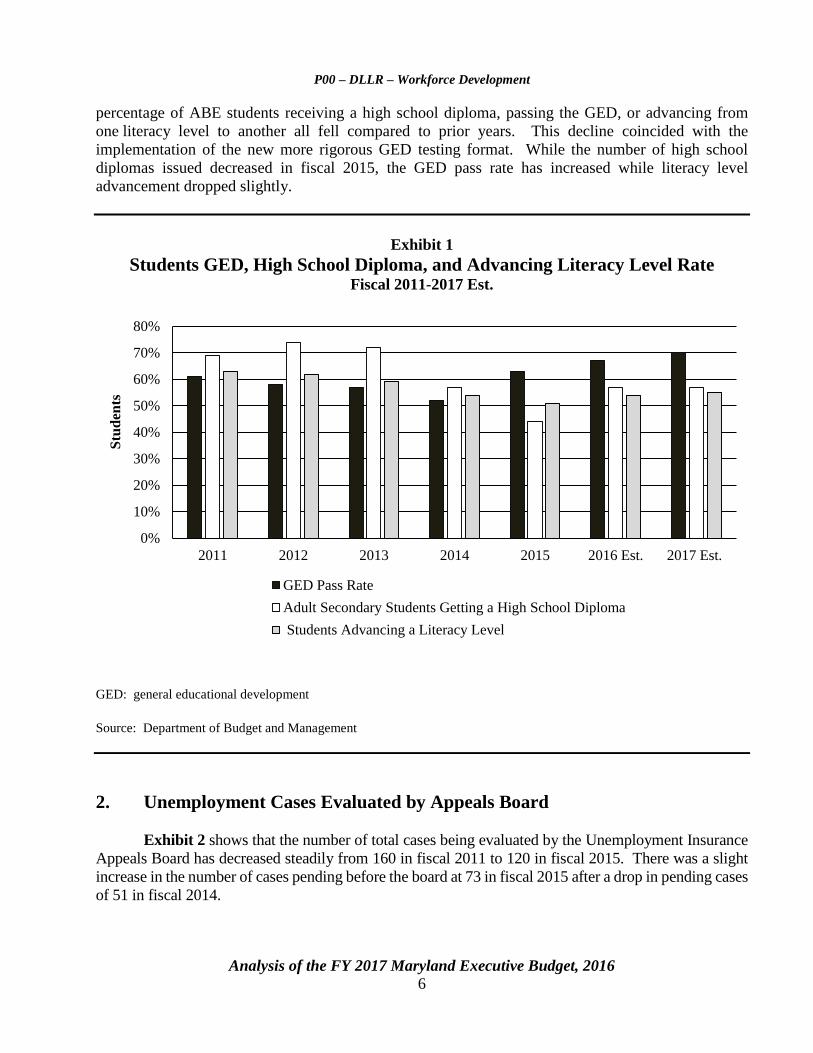
2. Unemployment Cases Evaluated by Appeals Board
Exhibit 2 shows that the number of total cases being evaluated by the Unemployment Insurance
Appeals Board has decreased steadily from 160 in fiscal 2011 to 120 in fiscal 2015. There was a slight
increase in the number of cases pending before the board at 73 in fiscal 2015 after a drop in pending cases
of 51 in fiscal 2014.
0%
10%
20%
30%
40%
50%
60%
70%
80%
2011 2012 2013 2014 2015 2016 Est. 2017 Est.
Stu
den
ts
GED Pass Rate
Adult Secondary Students Getting a High School Diploma
Students Advancing a Literacy Level
P00 – DLLR – Workforce Development
Analysis of the FY 2017 Maryland Executive Budget, 2016 7
Exhibit 2
Cases Evaluated and Pending Fiscal 2011-2017 Est.
Source: Department of Budget and Management
Fiscal 2016 Actions
Cost Containment
The Administration’s fiscal 2016 cost containment strategy included a 2% across-the-board
reduction in general funds. The 2016 cost containment reduction for DLLR Workforce Development
is $832,402, which includes:
$107,509 to the Employment Advancement Right Now (EARN) grants;
$225,000 due to the elimination of the Maryland Center for Construction Education and
Innovation as a result of consolidation with the Governor’s Workforce Investment Board;
$328,256 in personnel costs; and
$171,637 in GED subsidies that parallels the decline in test takers in fiscal 2016.
0
20
40
60
80
100
120
140
160
180
2011 2012 2013 2014 2015 2016 Est. 2017 Est.
Average Cases Pending Before the Board Cases Evaluated

P00 – DLLR – Workforce Development
Analysis of the FY 2017 Maryland Executive Budget, 2016 8
Proposed Budget
As seen in Exhibit 3, after adjusting for a back of the bill health insurance reduction, the
fiscal 2017 allowance increased by $9.5 million from the current working appropriation. There is a
$722,000 increase in special funds and an $8.8 million increase in federal funds that drive the increase.
Exhibit 3
Proposed Budget DLLR – Workforce Development
($ in Thousands)
How Much It Grows:
General
Fund
Special
Fund
Federal
Fund
Reimb.
Fund
Total
Fiscal 2015 Actual $35,703 $15,468 $159,071 $4,916 $215,157
Fiscal 2016 Working Appropriation 36,403 12,048 181,180 6,347 235,979
Fiscal 2017 Allowance 36,283 12,770 189,950 6,454 245,457
Fiscal 2016-2017 Amount Change -$121 $722 $8,770 $107 $9,479
Fiscal 2016-2017 Percent Change -0.3% 6.0% 4.8% 1.7% 4.0%
Where It Goes:
Personnel Expenses
Retirement ....................................................................................................................... $1,994
Employee and retiree health insurance ............................................................................ 1,517
Turnover .......................................................................................................................... 657
New positions (2.0 full-time equivalents (FTE)) ............................................................. 199
Unemployment ................................................................................................................ 162
Other fringe benefit adjustments ..................................................................................... 54
Abolished positions (16.0 FTEs) ..................................................................................... -1,186
Regular earnings .............................................................................................................. -3,235
Division of Unemployment Insurance
Unemployment Insurance Modernization Project .......................................................... 14,568
Software licenses and maintenance ................................................................................. 756
Training and consulting services .................................................................................... 267
Grants............................................................................................................................... -66
Materials and supplies .................................................................................................... -275
Processing equipment ..................................................................................................... -463
Statewide cost allocation ................................................................................................. -634
Postage ............................................................................................................................. -910
Contractual employees ................................................................................................... -3,513
P00 – DLLR – Workforce Development
Analysis of the FY 2017 Maryland Executive Budget, 2016 9
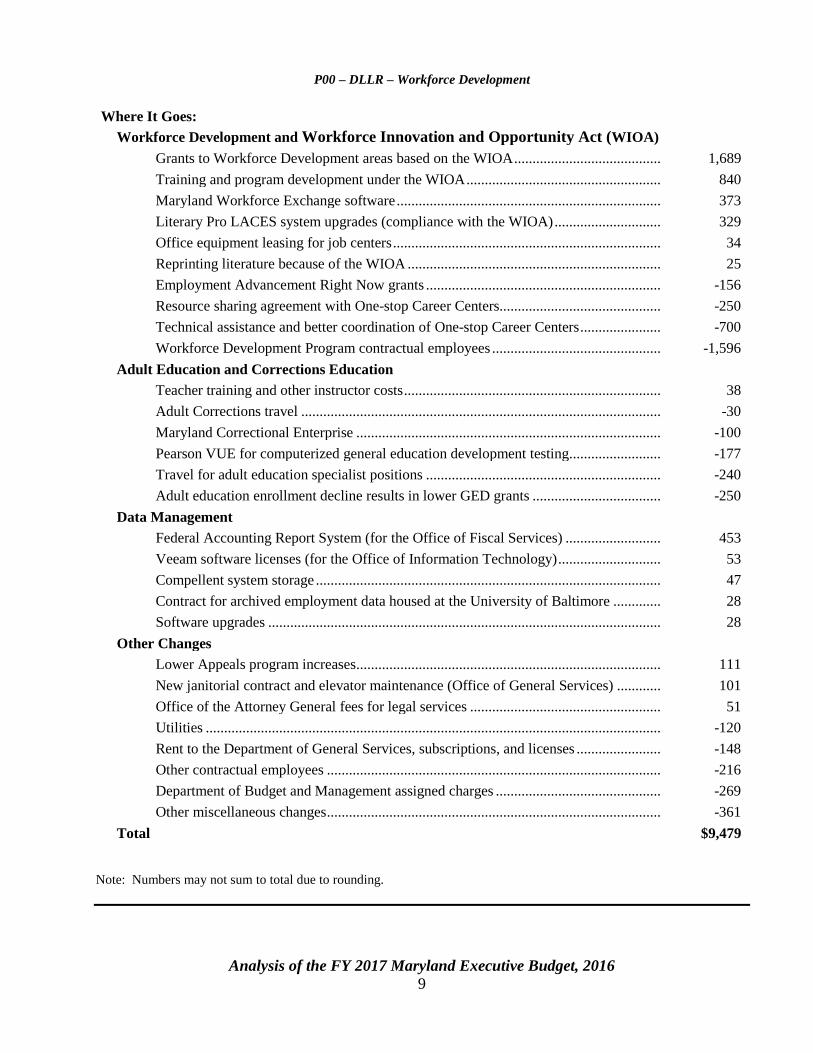
Where It Goes:
Workforce Development and Workforce Innovation and Opportunity Act (WIOA)
Grants to Workforce Development areas based on the WIOA ........................................ 1,689
Training and program development under the WIOA ..................................................... 840
Maryland Workforce Exchange software ........................................................................ 373
Literary Pro LACES system upgrades (compliance with the WIOA) ............................. 329
Office equipment leasing for job centers ......................................................................... 34
Reprinting literature because of the WIOA ..................................................................... 25
Employment Advancement Right Now grants ................................................................ -156
Resource sharing agreement with One-stop Career Centers............................................ -250
Technical assistance and better coordination of One-stop Career Centers ...................... -700
Workforce Development Program contractual employees .............................................. -1,596
Adult Education and Corrections Education
Teacher training and other instructor costs ...................................................................... 38
Adult Corrections travel .................................................................................................. -30
Maryland Correctional Enterprise ................................................................................... -100
Pearson VUE for computerized general education development testing ......................... -177
Travel for adult education specialist positions ................................................................ -240
Adult education enrollment decline results in lower GED grants ................................... -250
Data Management
Federal Accounting Report System (for the Office of Fiscal Services) .......................... 453
Veeam software licenses (for the Office of Information Technology) ............................ 53
Compellent system storage .............................................................................................. 47
Contract for archived employment data housed at the University of Baltimore ............. 28
Software upgrades ........................................................................................................... 28
Other Changes
Lower Appeals program increases ................................................................................... 111
New janitorial contract and elevator maintenance (Office of General Services) ............ 101
Office of the Attorney General fees for legal services .................................................... 51
Utilities ............................................................................................................................ -120
Rent to the Department of General Services, subscriptions, and licenses ....................... -148
Other contractual employees ........................................................................................... -216
Department of Budget and Management assigned charges ............................................. -269
Other miscellaneous changes ........................................................................................... -361
Total $9,479
Note: Numbers may not sum to total due to rounding.
P00 – DLLR – Workforce Development
Analysis of the FY 2017 Maryland Executive Budget, 2016 10
Across-the-board Reductions
The fiscal 2017 budget bill includes an across-the-board reduction for employee health
insurance, based on a revised estimate of the amount of funding needed. This agency’s share of these
reductions is $72,985 in general funds, $82,890 in special funds, and $282,858 in federal funds. There
is an additional across-the-board reduction to abolish positions statewide, but the amounts have not
been allocated by agency.
Personnel and Regular Positions
There is a 14.10 reduction in regular positions in fiscal 2017 that results in savings of almost
$1.0 million. Position reductions include 5.0 positions in the Office of Budget and Fiscal Services;
1.0 position in the Office of Human Resources; and 10.10 positions in DUI. All 16.1 abolished
positions were vacant. The Workforce Development Program added 2.0 regular positions. These
positions are largely responsible for the management of the Maryland Eligible Training Provider List,
which is maintained as a requirement of the Workforce Innovation and Opportunity Act (WIOA).
Aside from abolished positions, there is also a $3.2 million decrease in regular earnings due to
positions becoming vacant and being reclassified back to base levels.
DUI
Because there has been a decline in the number of claimants for unemployment, DUI has also
reduced program costs to reflect current need. In addition to the 10.10 reduction in regular employees,
there is a 91.28 full-time equivalent reduction in contractual employees. The reduction in contractual
employees translates into a $3.5 million decrease in costs. The contractual positions were also unfilled.
There is also a $463,000 decrease in equipment, a $275,000 decrease in costs for supplies and materials,
and a $910,000 reduction in postage. More than offsetting these reductions is a $14.6 million increase
in federal funds for the UI Modernization project, which will upgrade and consolidate current
UI processes. Additional information in this project is provided under the Updates section of this
analysis.
Workforce Development and the WIOA
The WIOA is federal law that aligns the services provided by state and local governments in
adult education, workforce development, and other employment centered services. To better align with
the standards of the WIOA, there is a $1.7 million increase in grants to local workforce development
sites, an $840,000 increase for training and program development, a $329,000 increase for upgrades to
the Literacy Pro LACES system, and a $25,000 increase for printing to update literature. There was
also a $373,000 increase for upgrades to the Maryland Workforce Exchange website. Part of the
transition to the WIOA standards includes a better coordination of the One-stop Career Centers, which
results in a $250,000 decrease due to resource sharing, and a $700,000 decrease in technical assistance.
More specifically, this reduction in cost is due to the closure of the One-stop Career Center in
downtown Baltimore. This center’s resources were transitioned to the two centers located in east and

P00 – DLLR – Workforce Development
Analysis of the FY 2017 Maryland Executive Budget, 2016 11
west Baltimore. These is also a $1.6 million decrease in contractual employees because of the
expiration of projects and decrease in funding associated with Wagner-Peyser, which is the original
legislation that created national employment offices. The EARN program had a decrease of $156,000,
which is a decrease in the distributed grant amounts for each of the partnerships. This leaves
$4.1 million for EARN grantees in fiscal 2017. The Department of Legislative Services (DLS)
recommends that DLLR explain the decision to cut funding for the EARN program.
Adult Education and Corrections Education
Adult Education experienced a decline in enrollment that parallels the improvement of the
economy, which is a common historical trend. As a result, there is a decrease of $250,000 in adult
education grants for GED participants. There is also a decrease of $240,000 for travel and $177,000
for the computerized GED testing.
Data Management and Other Changes
There is a $453,000 increase in the Office of Budget and Fiscal Services for the new Federal
Accounting Report System, which is data warehousing and financial reporting hardware and software.
There is also a $216,000 decrease in contractual employees.
P00 – DLLR – Workforce Development
Analysis of the FY 2017 Maryland Executive Budget, 2016 12
Issues
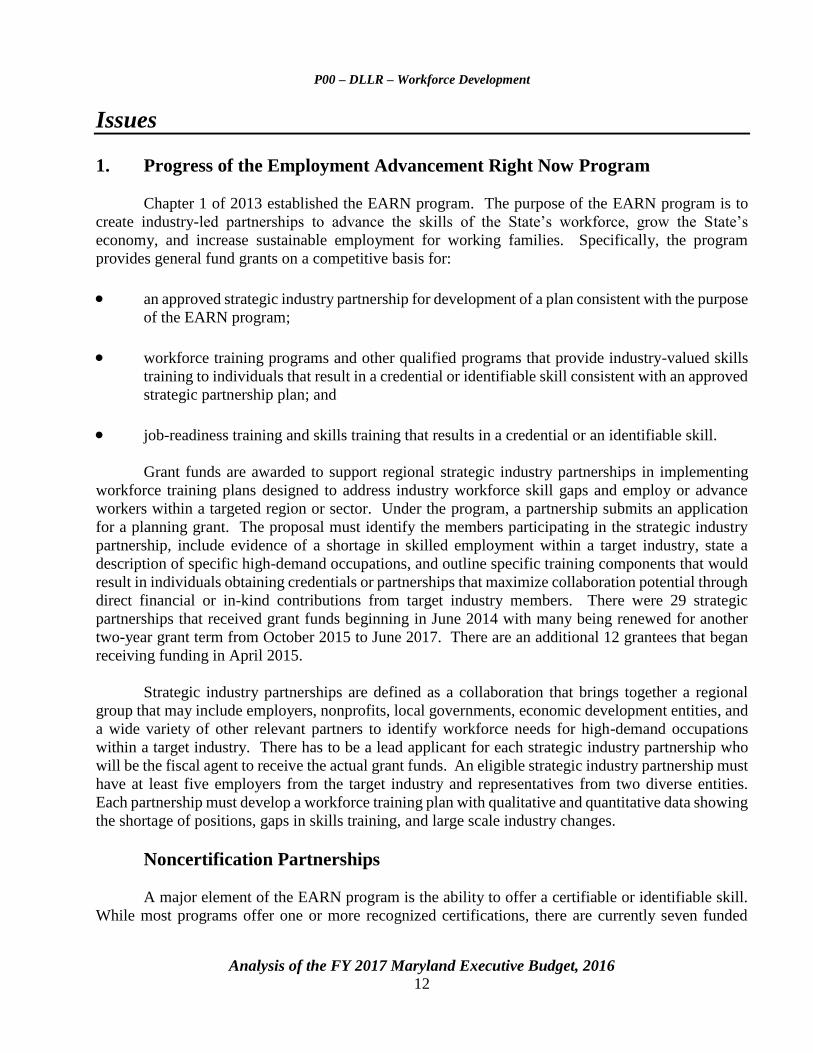
1. Progress of the Employment Advancement Right Now Program
Chapter 1 of 2013 established the EARN program. The purpose of the EARN program is to
create industry-led partnerships to advance the skills of the State’s workforce, grow the State’s
economy, and increase sustainable employment for working families. Specifically, the program
provides general fund grants on a competitive basis for:
an approved strategic industry partnership for development of a plan consistent with the purpose
of the EARN program;
workforce training programs and other qualified programs that provide industry-valued skills
training to individuals that result in a credential or identifiable skill consistent with an approved
strategic partnership plan; and
job-readiness training and skills training that results in a credential or an identifiable skill.
Grant funds are awarded to support regional strategic industry partnerships in implementing
workforce training plans designed to address industry workforce skill gaps and employ or advance
workers within a targeted region or sector. Under the program, a partnership submits an application
for a planning grant. The proposal must identify the members participating in the strategic industry
partnership, include evidence of a shortage in skilled employment within a target industry, state a
description of specific high-demand occupations, and outline specific training components that would
result in individuals obtaining credentials or partnerships that maximize collaboration potential through
direct financial or in-kind contributions from target industry members. There were 29 strategic
partnerships that received grant funds beginning in June 2014 with many being renewed for another
two-year grant term from October 2015 to June 2017. There are an additional 12 grantees that began
receiving funding in April 2015.
Strategic industry partnerships are defined as a collaboration that brings together a regional
group that may include employers, nonprofits, local governments, economic development entities, and
a wide variety of other relevant partners to identify workforce needs for high-demand occupations
within a target industry. There has to be a lead applicant for each strategic industry partnership who
will be the fiscal agent to receive the actual grant funds. An eligible strategic industry partnership must
have at least five employers from the target industry and representatives from two diverse entities.
Each partnership must develop a workforce training plan with qualitative and quantitative data showing
the shortage of positions, gaps in skills training, and large scale industry changes.
Noncertification Partnerships
A major element of the EARN program is the ability to offer a certifiable or identifiable skill.
While most programs offer one or more recognized certifications, there are currently seven funded
P00 – DLLR – Workforce Development
Analysis of the FY 2017 Maryland Executive Budget, 2016 13
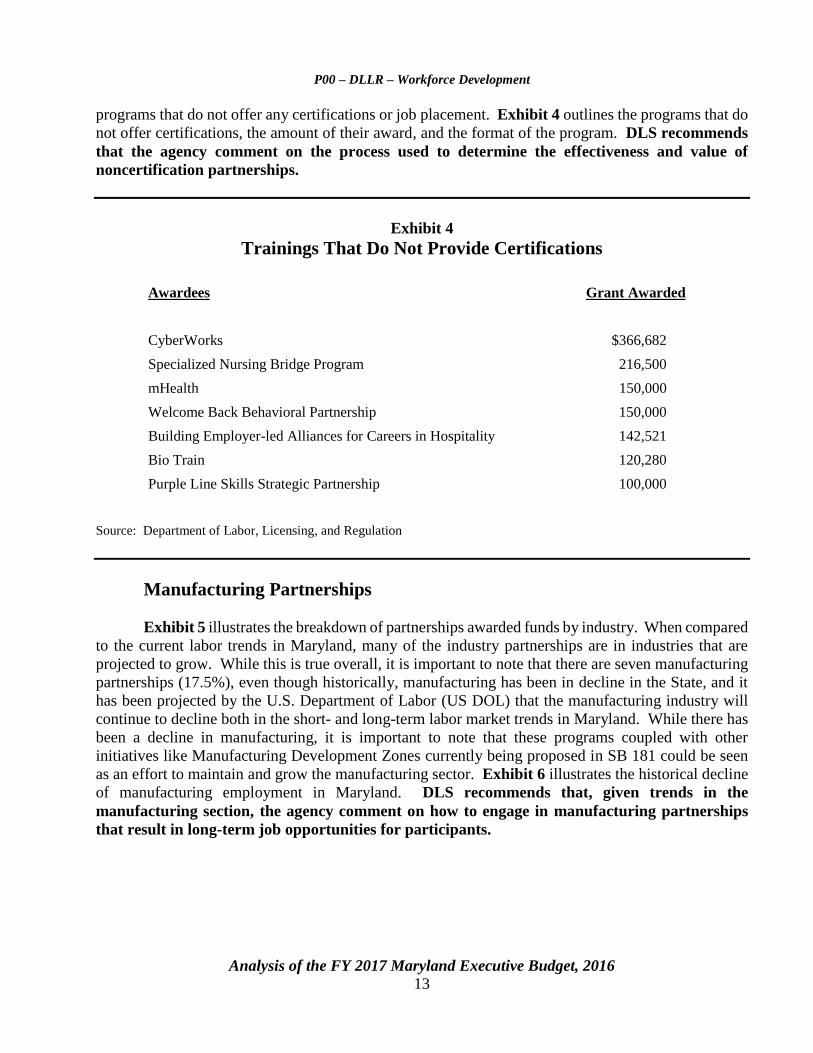
programs that do not offer any certifications or job placement. Exhibit 4 outlines the programs that do
not offer certifications, the amount of their award, and the format of the program. DLS recommends
that the agency comment on the process used to determine the effectiveness and value of
noncertification partnerships.
Exhibit 4
Trainings That Do Not Provide Certifications
Awardees Grant Awarded
CyberWorks $366,682
Specialized Nursing Bridge Program 216,500
mHealth 150,000
Welcome Back Behavioral Partnership 150,000
Building Employer-led Alliances for Careers in Hospitality 142,521
Bio Train 120,280
Purple Line Skills Strategic Partnership 100,000
Source: Department of Labor, Licensing, and Regulation
Manufacturing Partnerships
Exhibit 5 illustrates the breakdown of partnerships awarded funds by industry. When compared
to the current labor trends in Maryland, many of the industry partnerships are in industries that are
projected to grow. While this is true overall, it is important to note that there are seven manufacturing
partnerships (17.5%), even though historically, manufacturing has been in decline in the State, and it
has been projected by the U.S. Department of Labor (US DOL) that the manufacturing industry will
continue to decline both in the short- and long-term labor market trends in Maryland. While there has
been a decline in manufacturing, it is important to note that these programs coupled with other
initiatives like Manufacturing Development Zones currently being proposed in SB 181 could be seen
as an effort to maintain and grow the manufacturing sector. Exhibit 6 illustrates the historical decline
of manufacturing employment in Maryland. DLS recommends that, given trends in the
manufacturing section, the agency comment on how to engage in manufacturing partnerships
that result in long-term job opportunities for participants.

P00 – DLLR – Workforce Development
Analysis of the FY 2017 Maryland Executive Budget, 2016 14
Exhibit 5
EARN Partnerships by Industry
EARN: Employment Advancement Right Now
Source: Department of Labor, Licensing, and Regulation
Exhibit 6
Manufacturing Jobs in Maryland Fiscal 2005-2015
(Numbers in Thousands)
Source: U.S. Department of Labor, Bureau of Labor Statistics
Construction
5
Health
10
Management
4Hospitality
2
Manufacturing
7
Technology
3
Transportation
4
Other
5
0
20
40
60
80
100
120
140
160
2005 2006 2007 2008 2009 2010 2011 2012 2013 2014 2015
Em
plo
yees

P00 – DLLR – Workforce Development
Analysis of the FY 2017 Maryland Executive Budget, 2016 15
Certified Nursing Assistant Partnerships
The EARN program currently has the highest number of partnerships in health, which appears
to be appropriate as the health care industry has grown significantly in the last 10 years and is projected
to continue to do so, as shown in Exhibit 7. Half of the health partnerships are Certified Nursing
Assistant (CNA) programs. Within the five partnerships, there is significant variation in the amount
spent per student. Exhibit 8 shows the significant variance in the cost per student for the programs.
While it is the case that some of the programs offer additional certifications coupled with the CNA and
Geriatric Nursing Assistant (GNA) that may increase the overall cost of the program, it is not evident
from the provided data that the programs with additional certifications have increased costs that parallel
the addition of certifications offered. A random sample of CNA programs approved by the Maryland
Board of Nursing have an average cost of $1,171 per student with many programs costing $1,000
including books and uniform. DLS recommends that the agency comment on the variance in cost
of the programs that provide CNA and GNA training.
Exhibit 7
Health Care Positions in Maryland Fiscal 2005-2015
(Numbers in Thousands)
Source: U.S. Department of Labor, Bureau of Labor Statistics
0
50
100
150
200
250
300
350
400
2005 2006 2007 2008 2009 2010 2011 2012 2013 2014 2015

P00 – DLLR – Workforce Development
Analysis of the FY 2017 Maryland Executive Budget, 2016 16
Exhibit 8
Variance in the Cost Per Student for CNA/GNA Programs
Awardee Certificates Offered
Award
Amount Participants
Cost Per
Student
Healthcare Mentorship Baltimore CNA, GNA $150,000 18 $8,333
Ready to Care CNA, GNA, Mental
Health, First Aid
140,598 30 4,687
Southern Maryland Healthcare Alliance CNA, GNA 150,000 36 4,167
Healthcare Partnership of
Prince Georges and Charles Counties
CNA, GNA, PCT 148,708 36 4,131
Baltimore Healthcare Partnership CNA, GNA, PCT 368,868 216 1,708
CNA: Certified Nursing Assistant
GNA: Geriatric Nursing Assistant
PCT: Patient Care Technician
Note: Ready to Care trained 62 incumbents in mental health and first aid, which may slightly lower the cost per student.
Source: Department of Labor, Licensing, and Regulation
Annual Report and Quantifiable Data
Chapter 1 required the reporting of outcome measures to determine the impact and success of
the program. These quantifiable measures have been outlined to the partnerships in their Solicitation
for Implementation Grant Proposal guidelines. All grantees are required to track and report on:
training participant outcomes;
industry return on investment metrics;
demography; and
training participants’ employment and wage status.
In addition, the EARN program, in partnership with Salisbury University (SU), developed a
reporting outcome template. SU also worked to provide a third-party audit of the EARN program
through their Business Economic and Community Outreach Network (BEACON), which is housed in
the Perdue School of Business.

P00 – DLLR – Workforce Development
Analysis of the FY 2017 Maryland Executive Budget, 2016 17
The EARN program submitted a 2015 annual report to the General Assembly on
December 31, 2015, but the report does not include any quantifiable data that would illustrate the
information received from the entry and exit templates that each partnership uses or feedback from the
BEACON audit that could appropriately illustrate the strengths and challenges of the program.
To date, a request for this information has been made to the agency, and the information has
not been received. DLS recommends that the EARN 2016 annual report include retention data
for programs where it is available, a breakdown of the quantifiable measures used to determine
efficiency and effectiveness of strategic partnerships, quantitative employment data received
from each partnership. DLS also recommends that the BEACON report that provided a
performance evaluation of the program be submitted to the General Assembly.

P00 – DLLR – Workforce Development
Analysis of the FY 2017 Maryland Executive Budget, 2016 18
Recommended Actions
1. Concur with Governor’s allowance.
P00 – DLLR – Workforce Development
Analysis of the FY 2017 Maryland Executive Budget, 2016 19
Updates
1. Unemployment Insurance Modernization
To accommodate the high number of unemployment benefit recipients, during the Great
Recession, special measures were taken at the national level to maintain payment to families in need.
This became a serious problem in Maryland because the technology currently being used for UI was
not capable of making quick changes in UI formulas, payment dates, and other variables that were
experienced as a part of those national actions. Updates that effected the recipients of weekly UI took
weeks and hundreds of man hours from highly specialized technicians to facilitate. This adversely
impacted UI recipients and their ability to receive proper payment in a timely fashion.
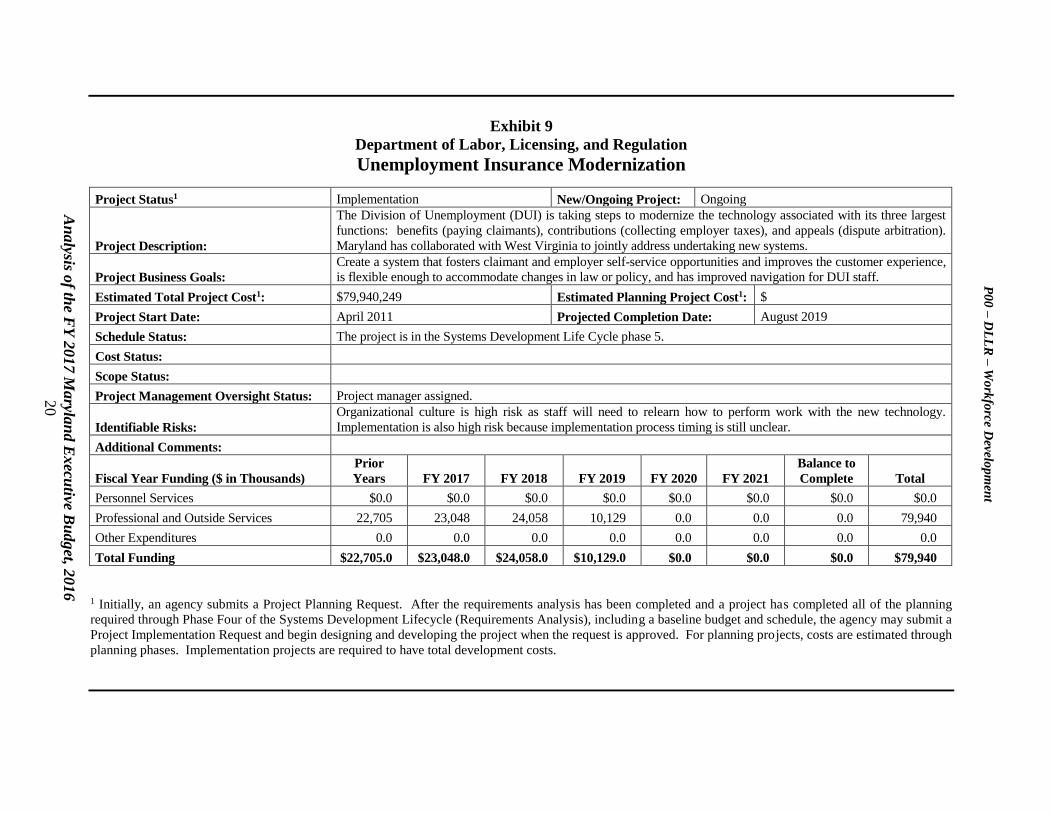
To circumvent any other unforeseen complications in payment and to update a 30-year-old
system, DUI is taking steps to modernize the technology associated with its three largest functions –
benefits, contributions, and appeals. Maryland is currently collaborating with West Virginia to develop
the new system. This UI Modernization project is funded in large part by US DOL with $23 million in
federal funds for fiscal 2017. There is also $500,000 in special funds in the fiscal 2017 allowance for
UI. The contract for the new system was awarded in September 2015 with an expected implementation
of the system by September 2019. The new system would integrate the three systems that are currently
used for benefits, contributions, and appeals. The system would also allow for paperless processing of
documents, enhanced security features, and a user friendly interface for employers, claimants, and
appellants. As shown in Exhibit 9, the fiscal 2016 cost was projected at $8,479,870 with a fiscal 2017
allowance is $23 million.
P0
0 –
DL
LR
– W
ork
force
Deve
lop
men
t
An
alysis o
f the F
Y 2
017 M
aryla
nd E
xecu
tive Bu
dget, 2
016
20
Exhibit 9
Department of Labor, Licensing, and Regulation
Unemployment Insurance Modernization
Project Status1 Implementation New/Ongoing Project: Ongoing
Project Description:
The Division of Unemployment (DUI) is taking steps to modernize the technology associated with its three largest
functions: benefits (paying claimants), contributions (collecting employer taxes), and appeals (dispute arbitration).
Maryland has collaborated with West Virginia to jointly address undertaking new systems.
Project Business Goals:
Create a system that fosters claimant and employer self-service opportunities and improves the customer experience,
is flexible enough to accommodate changes in law or policy, and has improved navigation for DUI staff.
Estimated Total Project Cost1: $79,940,249 Estimated Planning Project Cost1: $
Project Start Date: April 2011 Projected Completion Date: August 2019
Schedule Status: The project is in the Systems Development Life Cycle phase 5.
Cost Status:
Scope Status:
Project Management Oversight Status: Project manager assigned.
Identifiable Risks:
Organizational culture is high risk as staff will need to relearn how to perform work with the new technology.
Implementation is also high risk because implementation process timing is still unclear.
Additional Comments:
Fiscal Year Funding ($ in Thousands)
Prior
Years FY 2017 FY 2018 FY 2019 FY 2020 FY 2021
Balance to
Complete Total
Personnel Services $0.0 $0.0 $0.0 $0.0 $0.0 $0.0 $0.0 $0.0
Professional and Outside Services 22,705 23,048 24,058 10,129 0.0 0.0 0.0 79,940
Other Expenditures 0.0 0.0 0.0 0.0 0.0 0.0 0.0 0.0
Total Funding $22,705.0 $23,048.0 $24,058.0 $10,129.0 $0.0 $0.0 $0.0 $79,940
1 Initially, an agency submits a Project Planning Request. After the requirements analysis has been completed and a project has completed all of the planning
required through Phase Four of the Systems Development Lifecycle (Requirements Analysis), including a baseline budget and schedule, the agency may submit a
Project Implementation Request and begin designing and developing the project when the request is approved. For planning projects, costs are estimated through
planning phases. Implementation projects are required to have total development costs.
P00 – DLLR – Workforce Development
Analysis of the FY 2017 Maryland Executive Budget, 2016 21
2. Unemployment Insurance
UI provides temporary, partial wage replacement benefits to persons who are unemployed
through no fault of their own and who are willing to work, able to work, and actively seeking employment.
Funding for the program is provided by employers through UI taxes paid to both the federal government
for administrative expenses and to the states for deposit in their respective UI Trust Funds.
The UI Trust Fund and Outlook for Employer Taxes in Calendar 2016
Legislation enacted in Maryland in 2005 altered Maryland’s UI charging and taxation system
by creating a series of experience tax rate tables that are based on the balance in the Maryland UI Trust
Fund. An employer’s unemployment experience determines the rate charged within each table. If the
balance of the UI Trust Fund exceeds 5% of total taxable wages in the State (as measured on
September 30 of the current year), the lowest tax rate table (Table A) is used to calculate employer
rates for the following calendar year. In Table A, employers pay a minimum of 0.3% (on the first
$8,500 of annual wages of each employee) and a maximum of 7.5% ($25.50 to $637.50 per employee).
The highest tax table (Table F) is used when the balance of the UI Trust Fund is not in excess of 3.0%
of the total taxable wages. In Table F, employers pay a minimum of 2.2% and a maximum of 13.5%
($187 to $1,147.50 per employee).
The federal unemployment tax under the Federal Unemployment Tax Act (FUTA) is assessed
on the first $7,000 of annual wages of each employee. The standard FUTA tax rate for employers is
6.0%, but the rate is subject to an offset credit of up to 5.4% for employers who pay their state
unemployment taxes on time. Employers in states that have received but not repaid loans from the
federal government (called “credit reduction states”) receive a lower offset credit and pay higher FUTA
taxes. Employers in Maryland (Maryland does not have an outstanding loan) receive the full 5.4%
offset credit and pay a FUTA tax of 0.6%, which means that the maximum FUTA tax per employee
per year is $42.00. States are required to have their state taxable wage base at a level that is at least the
same or higher than the federal taxable wage base. States are also required to be in compliance with
other federal requirements. To the extent that the federal government increases the federal taxable
wage base above $8,500, as has been discussed at the federal level, the General Assembly would have
to increase the State taxable wage base and would likely have to make corresponding statutory
adjustments to the tax tables.
The balance of the State’s UI Trust Fund has fluctuated over the years, growing in good
economic times to over $1 billion in each of calendar 2006 and 2007, and diminishing in bad economic
times to a level that required the UI Trust Fund to borrow $133.8 million from the federal government
in February 2010. Despite an infusion of $126.8 million of federal modernization incentive funds in
May 2010, with the repayment of the borrowed funds by December 2010, the balance of the UI Trust
Fund remained at a level that required Maryland employers to pay from the highest tax table from 2010
through 2012. Due to the more favorable employment picture in the State and lower claims activity
(resulting in a significantly increased balance of the UI Trust Fund), employers paid from Table C in
calendar 2013, Table A in calendar 2014, and Table B in calendar 2015. The September 30, 2015
balance in the UI Trust Fund was approximately $984.0 million, meaning that employers will return to
paying from Table A in calendar 2016.
P00 – DLLR – Workforce Development
Analysis of the FY 2017 Maryland Executive Budget, 2016 22
It is worth noting that many other states were also required to borrow funds from the
federal government to ensure solvency of their trust funds; at its peak, the outstanding balance reached
as high as $41 billion across 29 states. Although Maryland was able to repay its loan within a single
fiscal year, many states required several years for repayment, and four states still owe a combined
$6.8 billion on loans received in calendar 2008 or 2009.
The State’s unemployment rate rose from 3.4% at year-end 2007 to 7.6% at year-end 2009,
from which it has declined each year. As of September 2015, Maryland’s unemployment rate
was 5.1%. Initial claims grew from about 222,000 in calendar 2007 (18,500 monthly average) to a high
of over 416,000 in calendar 2009 (35,000 monthly average). Initial claims began to fall in
calendar 2010. By fiscal 2015 (calendar year data not yet available), initial claims fell to about 219,000,
for an approximately 18,250 monthly average.
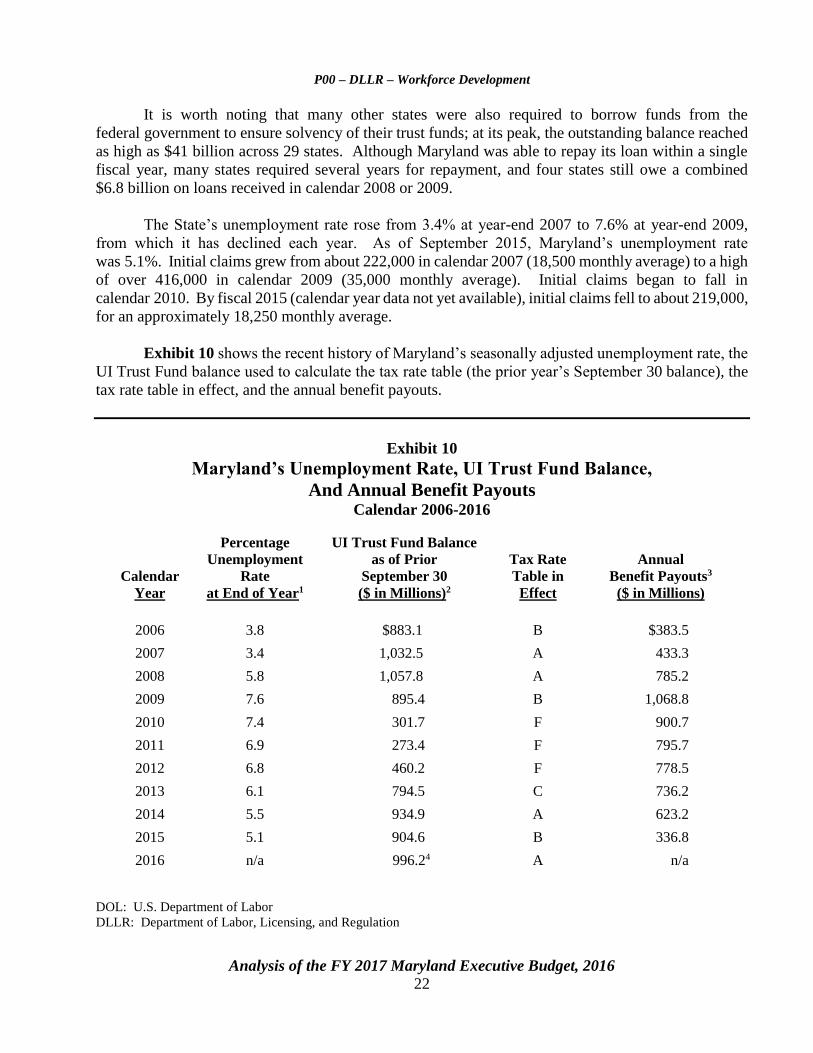
Exhibit 10 shows the recent history of Maryland’s seasonally adjusted unemployment rate, the
UI Trust Fund balance used to calculate the tax rate table (the prior year’s September 30 balance), the
tax rate table in effect, and the annual benefit payouts.
Exhibit 10
Maryland’s Unemployment Rate, UI Trust Fund Balance,
And Annual Benefit Payouts Calendar 2006-2016
Calendar
Year
Percentage
Unemployment
Rate
at End of Year1
UI Trust Fund Balance
as of Prior
September 30
($ in Millions)2
Tax Rate
Table in
Effect
Annual
Benefit Payouts3
($ in Millions)
2006 3.8 $883.1 B $383.5
2007 3.4 1,032.5 A 433.3
2008 5.8 1,057.8 A 785.2
2009 7.6 895.4 B 1,068.8
2010 7.4 301.7 F 900.7
2011 6.9 273.4 F 795.7
2012 6.8 460.2 F 778.5
2013 6.1 794.5 C 736.2
2014 5.5 934.9 A 623.2
2015 5.1 904.6 B 336.8
2016 n/a 996.24 A n/a
DOL: U.S. Department of Labor
DLLR: Department of Labor, Licensing, and Regulation
P00 – DLLR – Workforce Development
Analysis of the FY 2017 Maryland Executive Budget, 2016 23
1 Data is from DOL: Unemployment rate as of December of each year, 2015 is as of August 2015.
2 Data is from DLLR: Calendar 2010 includes $133.8 million in borrowed funds (February 2010) and $126.8 million in
federal modernization funds (May 2010); borrowed funds were repaid in full by December 2010.
3 Data is from DOL: 2015 payout amount is through July 31.
4 Preliminary cash balance. Final reconciliation is not complete as of October 8, 2015.
Note: The historic high unemployment rate for Maryland was 8.3% in August 1982, and the historical low was 3.3%, which
has occurred several times.
Source: U.S. Department of Labor; Department of Labor, Licensing, and Regulation
3. New Computer-based GED Testing
DWDAL is responsible for maintaining updates for GED testing in Maryland. The 2015 Joint
Chairmen’s Report required that a report be issued outlining GED testing and testing options to
illustrate the changes that have taken place as a result of the recent updates. The report was submitted
on December 3, 2015.
Until January 2014, the GED test had only been available in a pencil and paper delivery format.
The transition to a computerized format occurred because the national GED Testing Service began a
new venture with the for-profit Pearson VUE. There was concern that the addition of a for-profit
partner would negatively impact the cost of GED testing and that the new format and more rigorous
test would be problematic for the adult education community. While the test is arguably more difficult,
the increase in rigor coincides with the adoption of Common Core State Standards.
While it is difficult to compare direct costs from state to state because of the decentralized
Adult Education model that many states use, the cost in Maryland has increased from $102 per test
(with the student paying $45 and the State paying $57) under the paper and pencil method to $120 (with
the student cost remaining the same and the State cost of $75 per test taker). There was also a reduction
in administrative costs because computerization reduced the need for test examiners and cut the cost
associated with the transmission of answer sheets for scoring.
The increased difficulty of the new GED test coupled with the increased cost has been cited as
cause for states to explore other testing options to determine high school equivalency. Both HiSET and
the Test Assessing Secondary Completion (TASC) have been used by some states to test high school
equivalency. Both tests are relatively new and have been aligned to some degree with Common Core
Standards. Both tests also have lower associated costs than the new GED test. The HiSET test costs
between $50 and $52 per test taker for the test and scoring, but states have been charging students $90 to
also cover administrative costs. TASC also costs about $52 without accounting for administrative costs.
While there is comparative data showing which states use which tests and the associated costs, more
research would need to be done to develop a cost benefit analysis to determine the potential use of HiSET
or TASC instead of, or in conjunction with, the current computerized GED test.

P00 – DLLR – Workforce Development
Analysis of the FY 2017 Maryland Executive Budget, 2016 24
Appendix 1
Current and Prior Year Budgets
Fiscal 2015
Legislative
Appropriation $35,786 $11,220 $169,815 $12,431 $229,252
Deficiency
Appropriation 0 0 0 0 0
Cost
Containment -751 0 0 0 -751
Budget
Amendments 700 5,151 19,276 -5,768 19,359
Reversions and
Cancellations -32 -903 -30,020 -1,747 -32,701
Actual
Expenditures $35,703 $15,468 $159,071 $4,916 $215,157
Fiscal 2016
Legislative
Appropriation $35,513 $11,968 $178,144 $6,347 $231,972
Budget
Amendments 891 80 3,036 0 4,007
Working
Appropriation $36,403 $12,048 $181,180 $6,347 $235,979
Current and Prior Year Budgets
Fund FundFund
Reimb.
Fund Total
($ in Thousands)
Department of Labor, Licensing, and Regulation – Workforce Development
General Special Federal
Note: The fiscal 2016 working appropriation does not include deficiencies or reversions. Numbers may not sum to total
due to rounding.
P0
0 –
DL
LR
Wo
rkfo
rce D
evelo
pm
ent
Appen
dix
1
P00 – DLLR – Workforce Development
Analysis of the FY 2017 Maryland Executive Budget, 2016 25
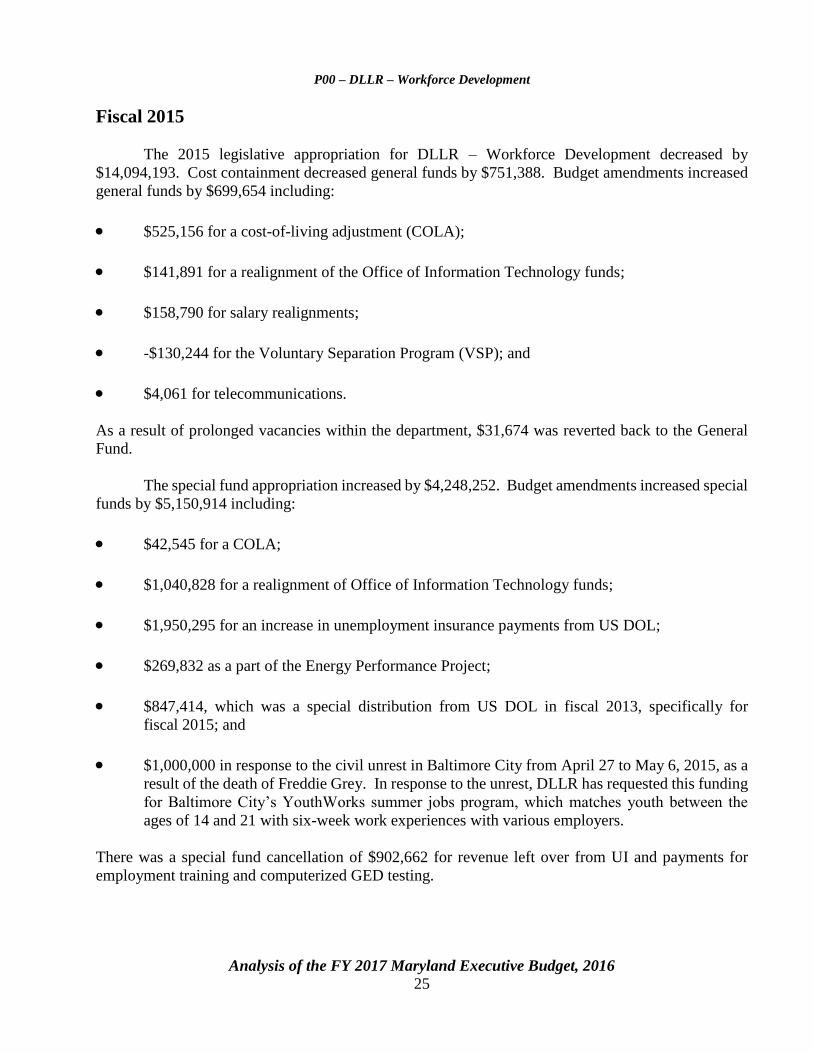
Fiscal 2015
The 2015 legislative appropriation for DLLR – Workforce Development decreased by
$14,094,193. Cost containment decreased general funds by $751,388. Budget amendments increased
general funds by $699,654 including:
$525,156 for a cost-of-living adjustment (COLA);
$141,891 for a realignment of the Office of Information Technology funds;
$158,790 for salary realignments;
-$130,244 for the Voluntary Separation Program (VSP); and
$4,061 for telecommunications.
As a result of prolonged vacancies within the department, $31,674 was reverted back to the General
Fund.
The special fund appropriation increased by $4,248,252. Budget amendments increased special
funds by $5,150,914 including:
$42,545 for a COLA;
$1,040,828 for a realignment of Office of Information Technology funds;
$1,950,295 for an increase in unemployment insurance payments from US DOL;
$269,832 as a part of the Energy Performance Project;
$847,414, which was a special distribution from US DOL in fiscal 2013, specifically for
fiscal 2015; and
$1,000,000 in response to the civil unrest in Baltimore City from April 27 to May 6, 2015, as a
result of the death of Freddie Grey. In response to the unrest, DLLR has requested this funding
for Baltimore City’s YouthWorks summer jobs program, which matches youth between the
ages of 14 and 21 with six-week work experiences with various employers.
There was a special fund cancellation of $902,662 for revenue left over from UI and payments for
employment training and computerized GED testing.

P00 – DLLR – Workforce Development
Analysis of the FY 2017 Maryland Executive Budget, 2016 26
The federal fund appropriation decreased by $10,744,343. Budget amendments increased
federal funds by $19,275,103 including:
$595,739 for a COLA;
$38,628 for the realignment of Office of Information Technology funds;
$233,976 for the Second Chance Act Technology Careers Training Project Awards;
$8,093,271 for an increase in UI payouts; and
$10,314,059 for the newly awarded Job Driven National Emergency Grant, which enhances
services to Maryland’s long-term unemployed dislocated workers.
There was a federal fund cancellation of $17,234,075 from the VSP and an overestimation for legal
services, DWDAL, the Office of the Secretary, the Office of Employment Training, the Adult and
Literacy Program, and UI.
The reimbursable fund decreased by $7.5 million: $5,767,823 through budget amendment
because of a reduction of funds for the Office of Information Technology and $1.7 million in
cancellations.
Fiscal 2016
To date, the 2016 legislative appropriation has increased by $4,006,884 including a general fund
increase of $890,795, a special fund increase of $79,752, and a federal fund increase of $3,036,337 to
restore the 2% pay cut.
P00 – DLLR – Workforce Development
Analysis of the FY 2017 Maryland Executive Budget, 2016 27
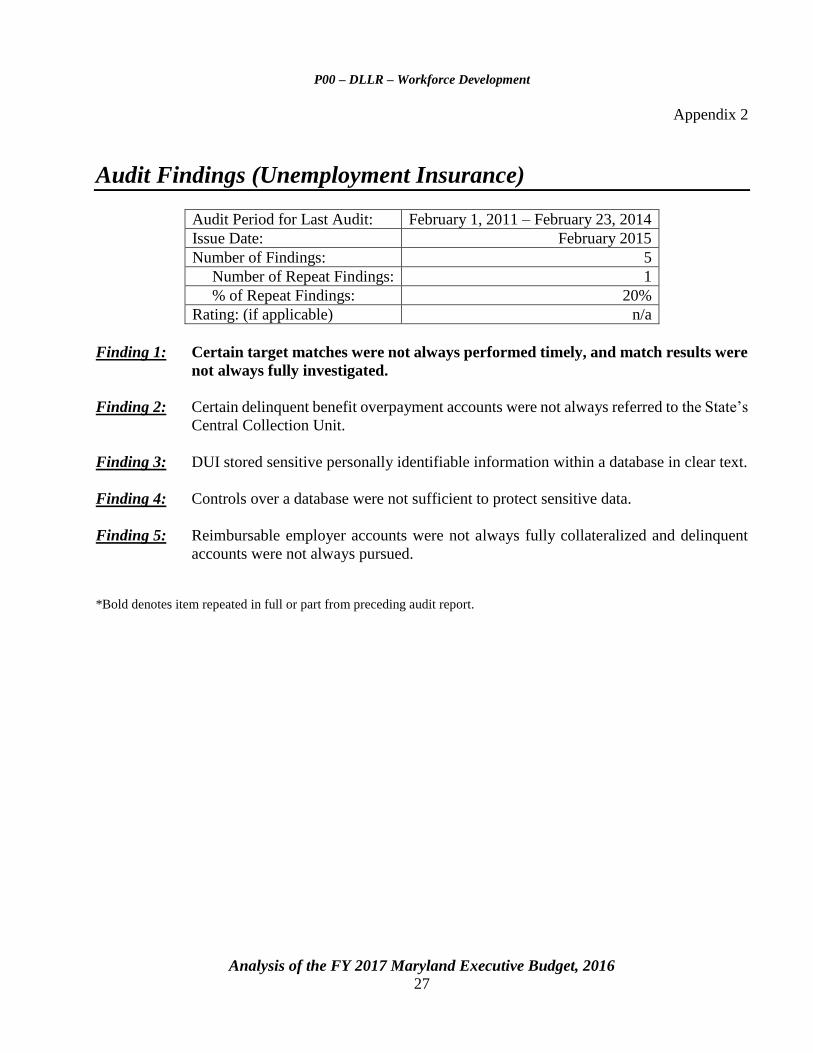
Appendix 2
Audit Findings (Unemployment Insurance)
Audit Period for Last Audit: February 1, 2011 – February 23, 2014
Issue Date: February 2015
Number of Findings: 5
Number of Repeat Findings: 1
% of Repeat Findings: 20%
Rating: (if applicable) n/a
Finding 1: Certain target matches were not always performed timely, and match results were
not always fully investigated.
Finding 2: Certain delinquent benefit overpayment accounts were not always referred to the State’s
Central Collection Unit.
Finding 3: DUI stored sensitive personally identifiable information within a database in clear text.
Finding 4: Controls over a database were not sufficient to protect sensitive data.
Finding 5: Reimbursable employer accounts were not always fully collateralized and delinquent
accounts were not always pursued.
*Bold denotes item repeated in full or part from preceding audit report.

An
alysis o
f the F
Y 2
017 M
aryla
nd E
xecu
tive Bu
dget, 2
016
28
Object/Fund Difference Report
DLLR – Workforce Development
FY 16
FY 15 Working FY 17 FY 16 - FY 17 Percent
Object/Fund Actual Appropriation Allowance Amount Change Change
Positions
01 Regular 1,251.19 1,246.19 1,232.09 -14.10 -1.1%
02 Contractual 141.26 221.36 79.08 -142.28 -64.3%
Total Positions 1,392.45 1,467.55 1,311.17 -156.38 -10.7%
Objects
01 Salaries and Wages $ 98,399,427 $ 106,622,490 $ 107,126,160 $ 503,670 0.5%
02 Technical and Spec. Fees 5,950,660 8,931,812 3,607,462 -5,324,350 -59.6%
03 Communication 4,055,915 5,128,922 3,897,966 -1,230,956 -24.0%
04 Travel 484,660 1,037,276 696,539 -340,737 -32.8%
06 Fuel and Utilities 909,919 1,016,908 897,157 -119,751 -11.8%
07 Motor Vehicles 261,324 228,494 240,095 11,601 5.1%
08 Contractual Services 18,462,875 31,652,996 47,333,770 15,680,774 49.5%
09 Supplies and Materials 1,383,541 1,766,086 1,476,664 -289,422 -16.4%
10 Equipment – Replacement 589,269 453,369 719,088 265,719 58.6%
11 Equipment – Additional 335,875 498,430 74,246 -424,184 -85.1%
12 Grants, Subsidies, and Contributions 80,711,832 74,188,368 75,145,945 957,577 1.3%
13 Fixed Charges 3,612,195 4,453,563 4,584,247 130,684 2.9%
Total Objects $ 215,157,492 $ 235,978,714 $ 245,799,339 $ 9,820,625 4.2%
Funds
01 General Fund $ 35,702,750 $ 36,403,372 $ 36,336,105 -$ 67,267 -0.2%
03 Special Fund 15,467,761 12,047,938 12,790,103 742,165 6.2%
05 Federal Fund 159,070,922 181,180,492 190,218,781 9,038,289 5.0%
09 Reimbursable Fund 4,916,059 6,346,912 6,454,350 107,438 1.7%
Total Funds $ 215,157,492 $ 235,978,714 $ 245,799,339 $ 9,820,625 4.2%
Note: The fiscal 2016 working appropriation does not include deficiencies or reversions. The fiscal 2017 allowance does not include contingent
reductions.
P0
0 –
DL
LR
– W
ork
force
Deve
lop
men
t
Appen
dix
3
An
alysis o
f the F
Y 2
017 M
aryla
nd E
xecu
tive Bu
dget, 2
016
29
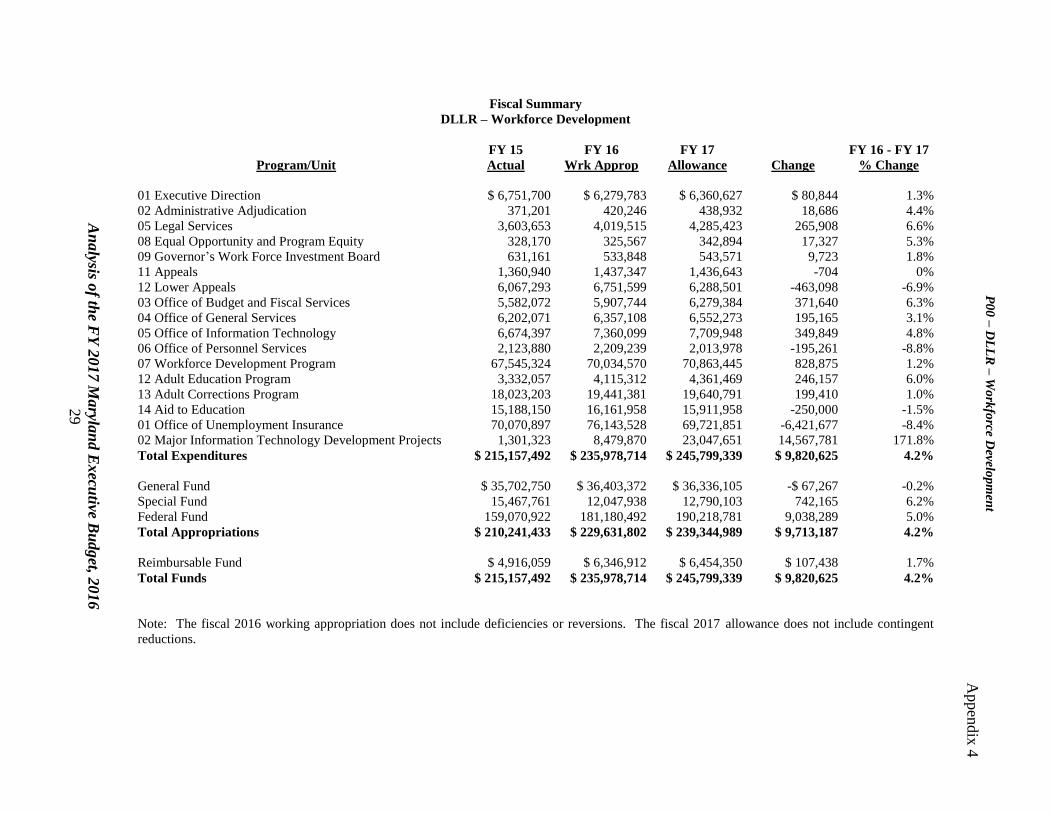
Fiscal Summary
DLLR – Workforce Development
FY 15 FY 16 FY 17 FY 16 - FY 17
Program/Unit Actual Wrk Approp Allowance Change % Change
01 Executive Direction $ 6,751,700 $ 6,279,783 $ 6,360,627 $ 80,844 1.3%
02 Administrative Adjudication 371,201 420,246 438,932 18,686 4.4%
05 Legal Services 3,603,653 4,019,515 4,285,423 265,908 6.6%
08 Equal Opportunity and Program Equity 328,170 325,567 342,894 17,327 5.3%
09 Governor’s Work Force Investment Board 631,161 533,848 543,571 9,723 1.8%
11 Appeals 1,360,940 1,437,347 1,436,643 -704 0%
12 Lower Appeals 6,067,293 6,751,599 6,288,501 -463,098 -6.9%
03 Office of Budget and Fiscal Services 5,582,072 5,907,744 6,279,384 371,640 6.3%
04 Office of General Services 6,202,071 6,357,108 6,552,273 195,165 3.1%
05 Office of Information Technology 6,674,397 7,360,099 7,709,948 349,849 4.8%
06 Office of Personnel Services 2,123,880 2,209,239 2,013,978 -195,261 -8.8%
07 Workforce Development Program 67,545,324 70,034,570 70,863,445 828,875 1.2%
12 Adult Education Program 3,332,057 4,115,312 4,361,469 246,157 6.0%
13 Adult Corrections Program 18,023,203 19,441,381 19,640,791 199,410 1.0%
14 Aid to Education 15,188,150 16,161,958 15,911,958 -250,000 -1.5%
01 Office of Unemployment Insurance 70,070,897 76,143,528 69,721,851 -6,421,677 -8.4%
02 Major Information Technology Development Projects 1,301,323 8,479,870 23,047,651 14,567,781 171.8%
Total Expenditures $ 215,157,492 $ 235,978,714 $ 245,799,339 $ 9,820,625 4.2%
General Fund $ 35,702,750 $ 36,403,372 $ 36,336,105 -$ 67,267 -0.2%
Special Fund 15,467,761 12,047,938 12,790,103 742,165 6.2%
Federal Fund 159,070,922 181,180,492 190,218,781 9,038,289 5.0%
Total Appropriations $ 210,241,433 $ 229,631,802 $ 239,344,989 $ 9,713,187 4.2%
Reimbursable Fund $ 4,916,059 $ 6,346,912 $ 6,454,350 $ 107,438 1.7%
Total Funds $ 215,157,492 $ 235,978,714 $ 245,799,339 $ 9,820,625 4.2%
Note: The fiscal 2016 working appropriation does not include deficiencies or reversions. The fiscal 2017 allowance does not include contingent
reductions.
P0
0 –
DL
LR
– W
ork
force
Deve
lop
men
t
Appen
dix
4
Related Documents