Department of Education INDIAN EDUCATION Fiscal Year 2017 Budget Request CONTENTS Appropriations Language ........................................................................................................ E-1 Analysis of Language Provisions and Changes....................................................................... E-2 Appropriation, Adjustment, and Transfers ............................................................................... E-3 Authorizing Legislation ............................................................................................................ E-4 Appropriations History ............................................................................................................. E-5 Summary of Request .............................................................................................................. E-6 Activities: Grants to local educational agencies .................................................................................. E-9 Special programs for Indian children................................................................................. E-17 National activities.............................................................................................................. E-22 State Table* * State tables reflecting final 2015 allocations and 2016 and 2017 estimates are posted on the Department’s Web page at: http://www2.ed.gov/about/overview/budget/statetables/index.html

Welcome message from author
This document is posted to help you gain knowledge. Please leave a comment to let me know what you think about it! Share it to your friends and learn new things together.
Transcript

Department of Education
INDIAN EDUCATION
Fiscal Year 2017 Budget Request
CONTENTS
Appropriations Language ........................................................................................................ E-1 Analysis of Language Provisions and Changes....................................................................... E-2 Appropriation, Adjustment, and Transfers ............................................................................... E-3 Authorizing Legislation ............................................................................................................ E-4 Appropriations History ............................................................................................................. E-5 Summary of Request .............................................................................................................. E-6 Activities:
Grants to local educational agencies .................................................................................. E-9 Special programs for Indian children ................................................................................. E-17 National activities .............................................................................................................. E-22
State Table*
* State tables reflecting final 2015 allocations and 2016 and 2017 estimates are posted on the Department’s Web page at: http://www2.ed.gov/about/overview/budget/statetables/index.html

INDIAN EDUCATION
Appropriations Language
For expenses necessary to carry out, to the extent not otherwise provided, title [VII]VI, part
A of the ESEA, [$143,939,000]$174,939,000, of which $67,993,000 shall be for subpart 2 of part
A of title VI and $6,565,000 shall be for subpart 3 of part A of title VI.1 (Department of Education
Appropriations Act, 2016.)
NOTE
Each language provision that is followed by a footnote reference is explained in the Analysis of Language Provisions and Changes document which follows the appropriation language.
E-1

INDIAN EDUCATION
Analysis of Language Provisions and Changes
Language Provision Explanation
1 … of which $67,993,000 shall be for subpart 2 of part A of title VI and $6,565,000 shall be for subpart 3 of part A of title VI..
This language specifies the funding level for the Special Programs for Indian Children and National Activities programs.
E-2

INDIAN EDUCATION
Appropriation, Adjustment, and Transfers
(dollars in thousands)
Appropriation/Adjustments/Transfers 2015 2016 2017
Discretionary:
Discretionar y Appropriation ........................................................... $123,939 $143,939 $173,939
E-3

INDIAN EDUCATION
Authorizing Legislation
(dollars in thousands)
Activity 2016
Authorized
footnote
2016 Estimate
footnote 2017
Authorized
footnote 2017
Request
Grants to local educational agencies (ESEA VI-A-1) 0 1 $100,381 $100,381 $100,381 Special programs for Indian children
(ESEA VI-A-2-6121 & 6122) 0 1 37,993 17,993 67,993
National activities (ESEA VI-A-3-6131) 0 1 5,565 5,565 6,565
Total definite authorization 0 123,939
Total appropriation 143,939 174,939 Portion of request authorized 30,000
1 The GEPA extension expired September 30, 2008; reauthorizing language is sought for FY 2016.
E-4
E-4
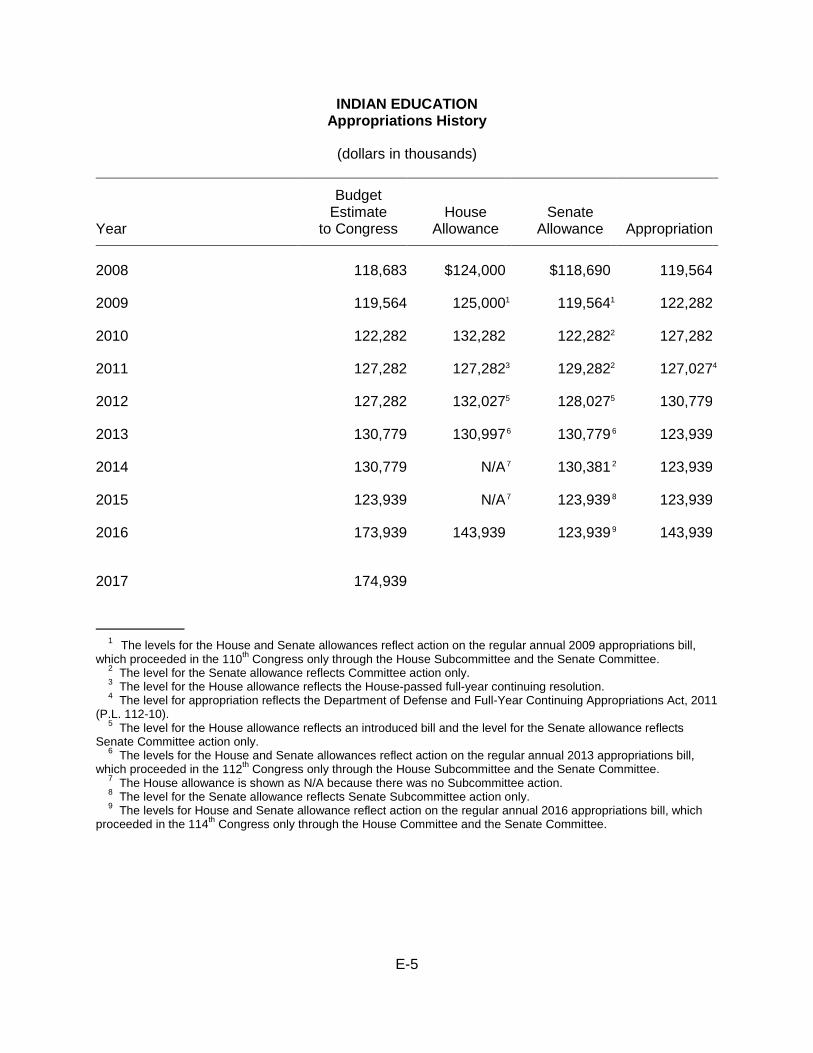
INDIAN EDUCATION Appropriations History
(dollars in thousands)
Year
Budget Estimate
to Congress House
Allowance Foot- note
Senate Allowance Foot
- note Appropriation Foot
- note
2008 118,683 $124,000 $118,690 119,564
2009 119,564 125,000 1 119,564 1 122,282
2010 122,282 132,282 122,282 2 127,282
2011 127,282 127,282 3 129,282 2 127,027 4
2012 127,282 132,027 5 128,027 5 130,779
2013 130,779 130,997 6 130,779 6 123,939
2014 130,779 N/A 7 130,381 2 123,939
2015 123,939 N/A 7 123,939 8 123,939
2016 173,939 143,939 123,939 9 143,939
2017 174,939
1 The levels for the House and Senate allowances reflect action on the regular annual 2009 appropriations bill,
which proceeded in the 110th Congress only through the House Subcommittee and the Senate Committee. 2 The level for the Senate allowance reflects Committee action only. 3 The level for the House allowance reflects the House-passed full-year continuing resolution. 4 The level for appropriation reflects the Department of Defense and Full-Year Continuing Appropriations Act, 2011
(P.L. 112-10). 5 The level for the House allowance reflects an introduced bill and the level for the Senate allowance reflects
Senate Committee action only. 6 The levels for the House and Senate allowances reflect action on the regular annual 2013 appropriations bill,
which proceeded in the 112th Congress only through the House Subcommittee and the Senate Committee. 7 The House allowance is shown as N/A because there was no Subcommittee action. 8 The level for the Senate allowance reflects Senate Subcommittee action only. 9 The levels for House and Senate allowance reflect action on the regular annual 2016 appropriations bill, which
proceeded in the 114th Congress only through the House Committee and the Senate Committee.
E-5

Summary of R equ
est
DEPARTMENT OF EDUCATION FISCAL YEAR 2017 PRESIDENT'S BUDGET(in thousands of dollars)
Click here for accessible version
Amount Percent
Indian Education (ESEA VI)
1. Grants to local educational agencies (Part A-1) D 100,381 100,381 100,381 0 0.00%2. Special programs for Indian children (Part A-2) D 17,993 37,993 67,993 30,000 78.96%3. National activities (Part A-3) D 5,565 5,565 6,565 1,000 17.97%
Total D 123,939 143,939 174,939 31,000 21.54%
NOTES: D = discretionary program; M = mandatory program; FY = fiscal year
Detail may not add to totals due to rounding.
2017 President's BudgetCompared to 2016 Appropriation2016
AppropriationAccount, Program and ActivityCategory
Code2015
Appropriation2017 President's
Budget
E-6
E-6
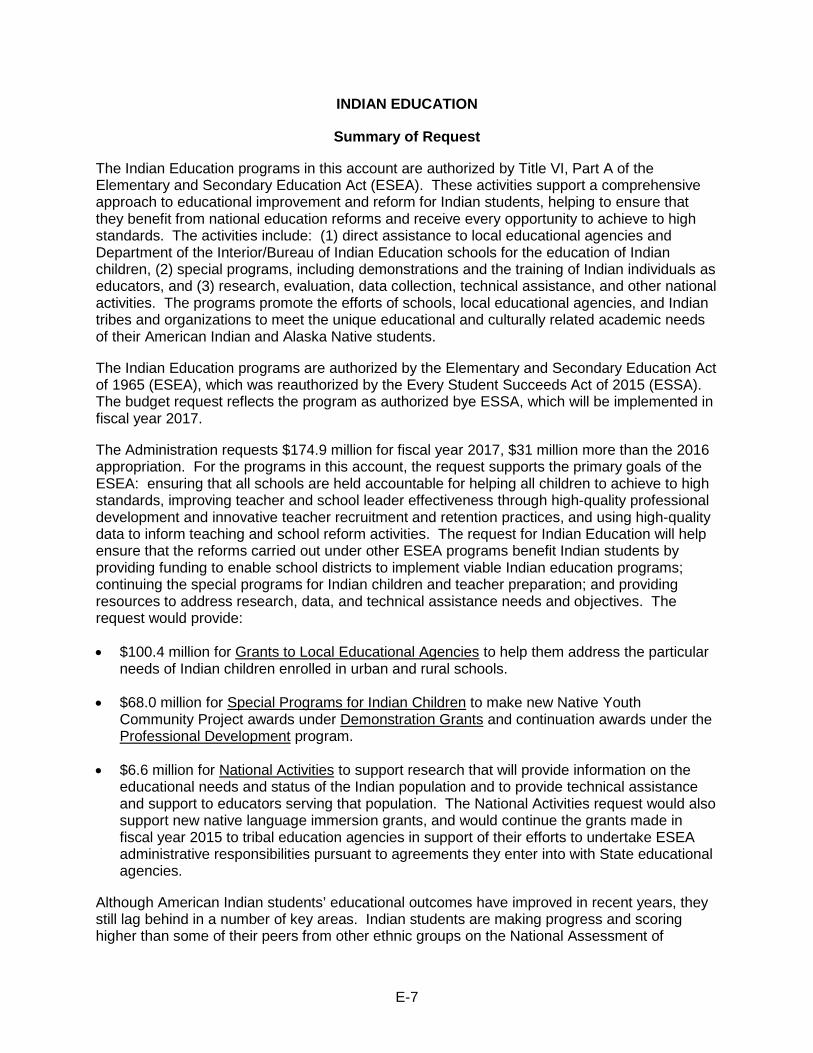
INDIAN EDUCATION
Summary of Request
The Indian Education programs in this account are authorized by Title VI, Part A of the Elementary and Secondary Education Act (ESEA). These activities support a comprehensive approach to educational improvement and reform for Indian students, helping to ensure that they benefit from national education reforms and receive every opportunity to achieve to high standards. The activities include: (1) direct assistance to local educational agencies and Department of the Interior/Bureau of Indian Education schools for the education of Indian children, (2) special programs, including demonstrations and the training of Indian individuals as educators, and (3) research, evaluation, data collection, technical assistance, and other national activities. The programs promote the efforts of schools, local educational agencies, and Indian tribes and organizations to meet the unique educational and culturally related academic needs of their American Indian and Alaska Native students.
The Indian Education programs are authorized by the Elementary and Secondary Education Act of 1965 (ESEA), which was reauthorized by the Every Student Succeeds Act of 2015 (ESSA). The budget request reflects the program as authorized bye ESSA, which will be implemented in fiscal year 2017.
The Administration requests $174.9 million for fiscal year 2017, $31 million more than the 2016 appropriation. For the programs in this account, the request supports the primary goals of the ESEA: ensuring that all schools are held accountable for helping all children to achieve to high standards, improving teacher and school leader effectiveness through high-quality professional development and innovative teacher recruitment and retention practices, and using high-quality data to inform teaching and school reform activities. The request for Indian Education will help ensure that the reforms carried out under other ESEA programs benefit Indian students by providing funding to enable school districts to implement viable Indian education programs; continuing the special programs for Indian children and teacher preparation; and providing resources to address research, data, and technical assistance needs and objectives. The request would provide:
• $100.4 million for Grants to Local Educational Agencies to help them address the particular needs of Indian children enrolled in urban and rural schools.
• $68.0 million for Special Programs for Indian Children to make new Native Youth Community Project awards under Demonstration Grants and continuation awards under the Professional Development program.
• $6.6 million for National Activities to support research that will provide information on the educational needs and status of the Indian population and to provide technical assistance and support to educators serving that population. The National Activities request would also support new native language immersion grants, and would continue the grants made in fiscal year 2015 to tribal education agencies in support of their efforts to undertake ESEA administrative responsibilities pursuant to agreements they enter into with State educational agencies.
Although American Indian students’ educational outcomes have improved in recent years, they still lag behind in a number of key areas. Indian students are making progress and scoring higher than some of their peers from other ethnic groups on the National Assessment of
E-7

INDIAN EDUCATION
Summary of Request
Educational Progress, but an achievement gap remains between their performance and that of students in general. Although the number of Indian students enrolling in colleges and universities has more than doubled in the last three decades, the dropout rate for Indian high school students is above the overall national average. In addition, Indian students continue to be subject to significant risk factors that threaten their ability to improve their academic achievement and their general well-being. This population continues to need support from Federal programs that address their specific educational needs.
E-8

INDIAN EDUCATION
Activities:
Grants to local educational agencies (Elementary and Secondary Education Act of 1965, Title VI, Part A, Subpart 1)
(dollars in thousands)
FY 2017 Authorization: $100,381
Budget Authority:
2016 2017 Change
$100,381 $100,381 0
PROGRAM DESCRIPTION
Title VI, Part A, Subpart 1 of the Elementary and Secondary Education Act (ESEA), as reauthorized by the Every Student Succeeds Act (ESSA) of 2015, authorizes formula grants that provide assistance to elementary and secondary schools for programs serving Indian students, including preschool children. Local educational agencies (LEAs), Department of the Interior/Bureau of Indian Education (BIE)-operated schools, and other BIE-supported schools are eligible for grants to help meet the unique cultural, language, and educational needs of such students and ensure that all students meet challenging State academic standards. The program also makes awards to Indian tribes or Indian organizations whose members are 50 percent or more of the children in the schools of an LEA that does not apply for funding. In fiscal year 2015, 24 tribes received such awards.
While allocations are determined by a statutory formula (described below), each applicant must annually develop and submit to the Department a comprehensive plan for meeting the needs of Indian children. Applicants must develop this plan in collaboration with a local committee comprised primarily of parents of Indian children and must include student performance goals, a description of professional development activities that the applicant will carry out, and an explanation of how it will assess students’ progress toward meeting its goals and will provide the results of this assessment to the parent committee and community.
The program makes formula allocations only to LEAs or BIE schools in which the number of American Indian/Alaska Native (AI/AN) children is at least 10 or constitutes at least 25 percent of total enrollment. LEAs in California, Alaska, and Oklahoma, and those located on or near reservations, are exempt from this requirement. The grant amount is determined by multiplying the number of Indian children in an LEA by the average per-pupil expenditure in the LEA’s State or 80 percent of the average per-pupil expenditure in the U.S., whichever is greater. Grants are then ratably reduced to fit within the available appropriation. In addition, the statute requires that each participating LEA receive at least $3,000.
E-9
INDIAN EDUCATION
Grants to local educational agencies
Funding levels for the past 5 fiscal years were:
Fiscal Year (dollars in thousands) 2012 ............................... ........................... $105,921 2013 ............................... ............................. 100,381 2014 ............................... ............................. 100,381 2015 ............................... ............................. 100,381 2016 ............................... ............................. 100,381
FY 2017 BUDGET REQUEST
For fiscal year 2017, the Administration requests $100.4 million for the Indian Education Grants to Local Educational Agencies program, the same as the fiscal year 2016 level and the level authorized by the ESSA. This funding would provide services to a disadvantaged population that is heavily affected by poverty and low educational attainment. The request would provide an estimated per-pupil payment of $215, based on the 2015 count of 467,784 eligible American Indian and Alaska Native (AI/AN) elementary and secondary students nationwide.
This program is the Department's largest vehicle to support local efforts to address the particular academic needs of AI/AN children in public schools. Grants supplement the regular school program, helping AI/AN children sharpen their academic skills and participate in enrichment programs that would otherwise be unavailable. Funds support such activities as after-school programs, tutoring, counseling, and dropout prevention. Approximately three-quarters of American Indian/Alaska Native students enrolled in public schools attend schools that receive funds from the program. In accordance with Executive Order 13592, the Department is participating in the Interagency Working Group on American Indian and Alaska Native Education with the Department of the Interior’s Bureau of Indian Education. The Working Group is in the process of developing and implementing goals, benchmarks, and key activities for improving educational outcomes for American Indian and Alaska Native students, in part through more effective use of Indian Education Grants to LEAs.
The AI/AN student population continues to be subject to significant risk factors that negatively affect their academic achievement and general well-being. AI/AN students are more likely to receive special education services under the Individuals with Disabilities Education Act (IDEA) than students from any other racial/ethnic group. While IDEA served 8.5 percent of all U.S. children ages 3 to 21 in 2013, it served 13.3 percent of AI/ANs of the same age. Further, absenteeism rates for AI/AN students are higher than for other students, with 2009 data showing that 65 percent of AI/AN students reported at least one absence in the preceding month, compared to 55 percent for all students. Absenteeism translates into less time for classroom instruction and learning.
These risk factors help explain why data from the 2015 National Assessment of Education Progress (NAEP) reading and mathematics assessments consistently show that across subjects and grade levels, the achievement of AI/AN students has not improved since 2005, while the achievement of all other racial/ethnic groups has improved in all subjects and grade levels. For example, the average “scale score” for AI/AN students in 4th grade reading was 204 in 2005 and 205 in 2015, and the 8th grade reading scale score was 249 in 2005 and 252 in 2015, reflecting
E-10

INDIAN EDUCATION
Grants to local educational agencies
a statistically insignificant change over a period in which all other groups had statistically significant increases. Similarly, 4th grade AI/AN students’ average mathematics scale scores did not show a statistically significant change between the 2005 and 2015 assessments, moving from 226 in 2005 to 227 in 2015. All other racial/ethnic groups showed statistically significant gains during the same period.
AI/AN students also are less likely than those in other racial or ethnic groups to take advanced courses in high school or to attend schools offering advanced academic coursework. According to the latest available NCES report, “Status and Trends in the Education of American Indians and Alaska Natives: 2008,” 21 percent of AI/AN students graduating in 2004 had taken advanced English courses (compared to a national average of 33 percent), 22 percent had taken advanced mathematics courses (compared to 50 percent), and 48 percent had taken advanced science courses (compared to 68 percent).
High school graduation rate and dropout rate data demonstrate the challenges facing AI/AN students, but also point to signs of progress that we must build on. While the AI/AN graduation rate is the lowest among all racial/ethnic groups at 69.6 percent in the 2013-2014 school year, that rate has increased from 65 percent in 2010-2011. The “status” dropout rate (which represents the proportion of non-institutionalized young people ages 16 through 24 who are out of school and who have not earned a high school credential) for AI/AN high school students was 15 percent in 2006, compared to the overall national average of 10 percent. Still, AI/AN high school seniors had the lowest proportion of those expecting to go to college (79 percent) in 2004, well below the national average (87 percent). And while the long-term trend in AI/AN student enrollment in postsecondary education is positive, it dropped from 2009 to 2012 and remains well below the rate for all students.
The data described above collectively demonstrate the importance of providing continued supplemental funding to LEAs serving AI/AN students, as well as Federal, State, and local efforts to use that funding more effectively to improve outcomes for these students.
E-11

INDIAN EDUCATION
Grants to local educational agencies
PROGRAM OUTPUT MEASURES (dollars in thousands)
Output Measures 2015 2016 2017
Number of awards Number to LEAs 1,130 1,130 1,130 Number to Tribes 24 24 24 Number to BIE- grant/contract schools 81 81 81 Number to BIE- operated schools 48 48 48
Total Number of awards 1,283 1,283 1,283
Distribution of funds Distribution LEAs $92,767 $92,767 $92,767 Distribution Tribes 1,151 1,151 1,151 Distribution BIE- grant/contract schools 4,244 4,244 4,244 Distribution BIE- operated schools 2,219 2,219 2,219
Distribution Total 100,381 100,381 100,381
Number of eligible students Students i n LEAs 428,987 428,987 428,987 Students i n Tribes 5,440 5,440 5,440 Students i n BIE- grant/contract schools 21,399 21,399 21,399 Students i n BIE- operated schools 11,958 11,958 11,958
Total number of s tudents 467,784 467,784 467,784
Range of awards (whole dollars) Highest award $3,144,787 $3,144,787 $3,144,787 Lowest awar d 4,000 4,000 4,000 Average allocation 78,213 78,213 78,213 Average payment per eligible
student 215 215 215
_________________
NOTE: Appropriations language for fiscal years 2015 and 2016 authorized the Department to pool evaluation funds reserved under section 9601 of the ESEA and use those pooled funds to evaluate any ESEA program. Similar authority was included in the ESEA as reauthorized by the Every Student Succeeds Act of 2015 (section 8601) and would provide the same flexibility in fiscal year 2017. While the Department did not reserve funds from the Indian Education Grants to LEAs program under this authority in fiscal year 2015, it may reserve funds for ESEA evaluation activities in fiscal years 2016 and 2017.
PROGRAM PERFORMANCE INFORMATION
Performance Measures
This section presents selected program performance information, including, for example, GPRA goals, objectives, measures, and performance targets and data; and an assessment of the progress made toward achieving program results. Achievement of program results is based on the cumulative effect of the resources provided in previous years and those requested in fiscal
E-12

INDIAN EDUCATION
Grants to local educational agencies
year 2017 and future years, as well as the resources and efforts invested by those served by this program.
The current performance indicators for this program use data from the National Assessment of Education Progress (NAEP) and State assessments to track Indian students’ educational status. Since the 2005 NAEP, the Department has oversampled AI/AN students in the NAEP 4th-grade and 8th-grade reading and math assessments in order to generate reliable, national-level data on AI/AN students’ performance. After the 2011 assessment, the Department began oversampling AI/AN students on NAEP only every other cycle. AI/AN students were oversampled for the 2015 assessment and will next be oversampled in 2019..
Goal: To help American Indian and Alaska Native children achieve to the same challenging standards expected of all students by supporting access to programs that meet their unique educational and culturally related academic needs.
Objective: American Indian and Alaska Native students served by LEAs receiving Indian education formula grants will progress at rates similar to those for all students in achievement to standards, promotion, and graduation.
Measure: The percentage of American Indian and Alaska Native students in grade 4 who score at or above the basic level in reading on NAEP.
Year Target Actual – AI/AN Actual – All Students 2009 52% 52% 67% 2011 54 49 67 2013 56 51 68 2015 58 52 69 2017 60
Measure: The percentage of American Indian and Alaska Native students in grade 8 who score at or above the basic level in reading on NAEP.
Year Target Actual – AI/AN Actual – All Students 2009 63% 63% 75% 2011 65 64 76 2013 67 62 78 2015 69 63 76 2017 71
E-13
INDIAN EDUCATION
Grants to local educational agencies
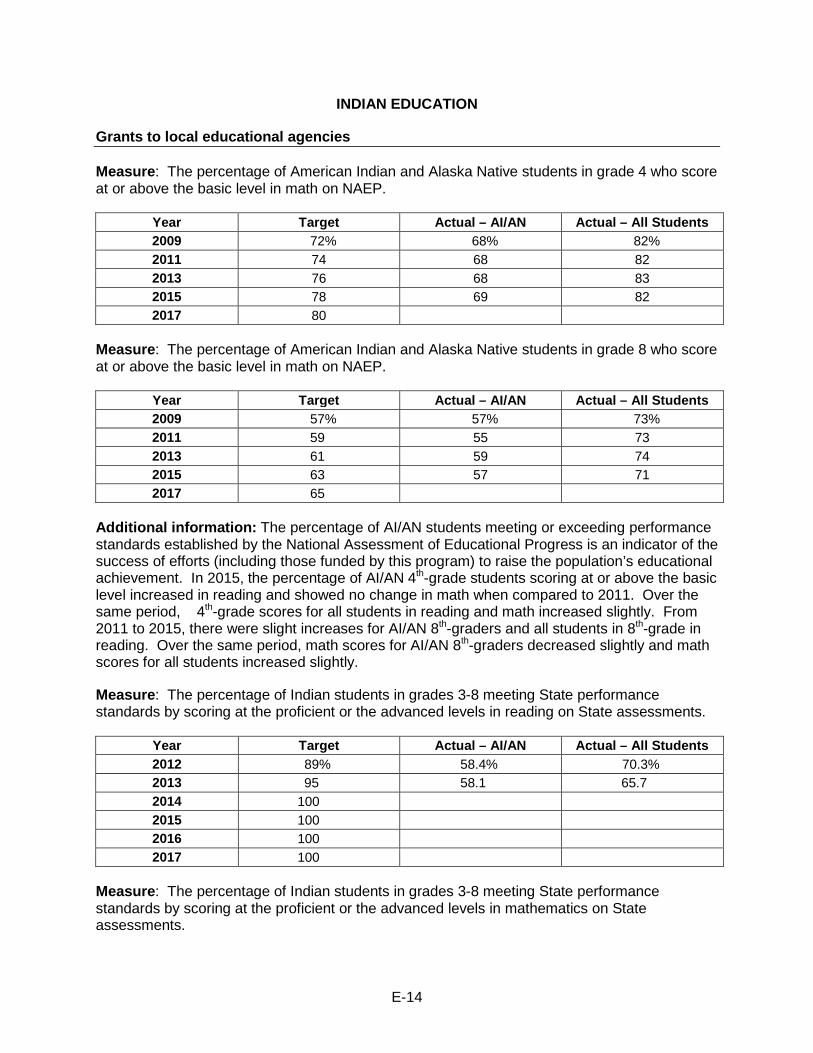
Measure: The percentage of American Indian and Alaska Native students in grade 4 who score at or above the basic level in math on NAEP.
Year Target Actual – AI/AN Actual – All Students 2009 72% 68% 82% 2011 74 68 82 2013 76 68 83 2015 78 69 82 2017 80
Measure: The percentage of American Indian and Alaska Native students in grade 8 who score at or above the basic level in math on NAEP.
Year Target Actual – AI/AN Actual – All Students 2009 57% 57% 73% 2011 59 55 73 2013 61 59 74 2015 63 57 71 2017 65
Additional information: The percentage of AI/AN students meeting or exceeding performance standards established by the National Assessment of Educational Progress is an indicator of the success of efforts (including those funded by this program) to raise the population’s educational achievement. In 2015, the percentage of AI/AN 4th-grade students scoring at or above the basic level increased in reading and showed no change in math when compared to 2011. Over the same period, 4th-grade scores for all students in reading and math increased slightly. From 2011 to 2015, there were slight increases for AI/AN 8th-graders and all students in 8th-grade in reading. Over the same period, math scores for AI/AN 8th-graders decreased slightly and math scores for all students increased slightly.
Measure: The percentage of Indian students in grades 3-8 meeting State performance standards by scoring at the proficient or the advanced levels in reading on State assessments.
Year Target Actual – AI/AN Actual – All Students 2012 89% 58.4% 70.3% 2013 95 58.1 65.7 2014 100 2015 100 2016 100 2017 100
Measure: The percentage of Indian students in grades 3-8 meeting State performance standards by scoring at the proficient or the advanced levels in mathematics on State assessments.
E-14

INDIAN EDUCATION
Grants to local educational agencies
Year Target Actual – AI/AN Actual – All Students 2012 89% 53.2% 68.2% 2013 95 52.1 62.9 2014 100 2015 100 2016 100 2017 100
Additional information: In 2006, the Department added annual performance indicators that focus on proficiency on State assessments aligned to the State academic standards used to guide instruction in schools. In addition, the State assessments provide the basis for school and LEA accountability under ESEA Title I. The Department established a baseline in 2004 and targets for reaching 100 percent proficiency by 2014, the ESEA objective. From 2008 through 2013, reading and mathematics proficiency among AI/AN students were both below the respective targets. Data for 2014 will be available in spring 2016. Performance measures based on proficiency rates will be changed in future years based on the reauthorized ESEA.
Measure: The difference between the percentage of Indian students in grades 3-8 scoring at the proficient or advanced levels in reading on State assessments and the percentage of all students scoring at those levels.
Year Target Actual 2012 2.7% 5.0% 2013 1.3 11.6 2014 0.0 2015 0.0 2016 0.0 2017 0.0
Measure: The difference between the percentage of Indian students in grades 3-8 scoring at the proficient or advanced levels in mathematics on State assessments and the percentage of all students scoring at those levels.
Year Target Actual 2012 2.9% 11.0% 2013 1.4 12.9 2014 0.0 2015 0.0 2016 0.0 2017 0.0
Additional information: The Department established indicators to measure the achievement gap between AI/AN students’ performance and all students’ performance on State assessments in reading and math. The targets reflect the ESEA goal of eliminating the achievement gap
E-15

INDIAN EDUCATION
Grants to local educational agencies
between AI/AN students and all students by 2014. The Department expects to have 2014 data in spring 2016.
Measure: Percentage of Indian students who graduate from high school.
Year Target Actual 2012 86.2% 66.9% 2013 86.2 69.0 2014 86.2 2015 86.2 2016 86.2 2017 86.2
Additional information: The final effectiveness measure the Department has established for this program is the percentage of Indian students who graduate from high school. This measure is calculated as the simple average among the States, by dividing the sum of the State AI/AN graduation rates reported on their Consolidated State Performance Reports (CSPR) by the number of States reporting AI/AN graduation rates. Each State’s rate should be reported on the CSPR as the number of students who graduate from public high school with a regular diploma (not including a GED or any other diploma not fully aligned with the State's academic standards) in the standard number of years divided by the number of students who began high school that number of years ago, or by an alternative method developed by the State and approved by the Secretary that avoids counting dropouts as transfers. However, since States report percentages rather than the number of students graduating and the size of the cohort, the Department’s calculation as a simple average of the State percentages is not an accurate measure of the actual Indian graduation rate. Data for 2014 will be available in spring 2016.
Efficiency Measure
Measure: The percentage of funds used by grantees prior to award close-out.
Year Target Actual 2012 100.0% 100.0% 2013 100.0 95.0 2014 100.0 97.4 2015 100.0 2016 100.0 2017 100.0
Additional information: The proportion of program funds used by grantees has fluctuated in recent years. However, grantees met the target in 2012 and 2013. Since the timing of close-out can vary even among a single fiscal year’s grantees, this measure is calculated as the proportion of the program appropriation that has been paid to grantees just prior to the cancellation of the appropriation. Therefore, data for 2012 correspond to fiscal year 2007 grants. Data for 2015, corresponding to fiscal year 2010 grants, will be available in spring 2016.
E-16
INDIAN EDUCATION
Special programs for Indian children
(Elementary and Secondary Education Act of 1965, Title VI, Part A, Subpart 2)
(dollars in thousands)
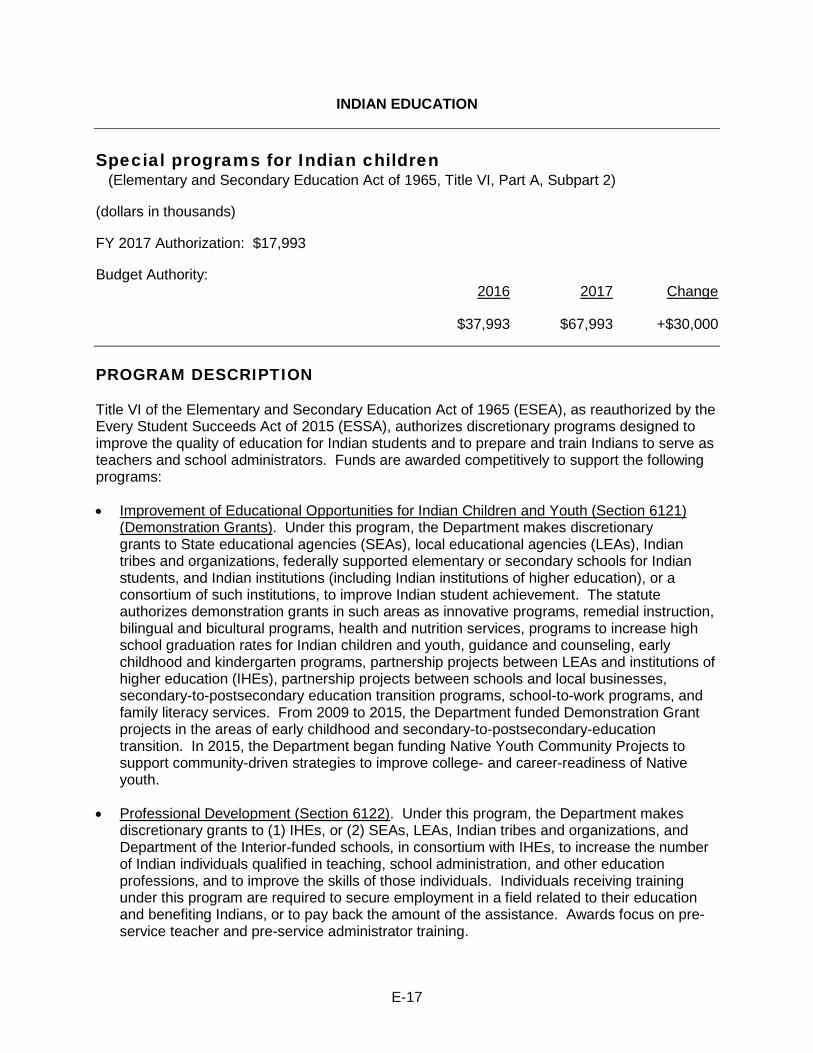
FY 2017 Authorization: $17,993
Budget Authority: 2016 2017 Change
$37,993 $67,993 +$30,000
PROGRAM DESCRIPTION
Title VI of the Elementary and Secondary Education Act of 1965 (ESEA), as reauthorized by the Every Student Succeeds Act of 2015 (ESSA), authorizes discretionary programs designed to improve the quality of education for Indian students and to prepare and train Indians to serve as teachers and school administrators. Funds are awarded competitively to support the following programs:
• Improvement of Educational Opportunities for Indian Children and Youth (Section 6121) (Demonstration Grants). Under this program, the Department makes discretionary grants to State educational agencies (SEAs), local educational agencies (LEAs), Indian tribes and organizations, federally supported elementary or secondary schools for Indian students, and Indian institutions (including Indian institutions of higher education), or a consortium of such institutions, to improve Indian student achievement. The statute authorizes demonstration grants in such areas as innovative programs, remedial instruction, bilingual and bicultural programs, health and nutrition services, programs to increase high school graduation rates for Indian children and youth, guidance and counseling, early childhood and kindergarten programs, partnership projects between LEAs and institutions of higher education (IHEs), partnership projects between schools and local businesses, secondary-to-postsecondary education transition programs, school-to-work programs, and family literacy services. From 2009 to 2015, the Department funded Demonstration Grant projects in the areas of early childhood and secondary-to-postsecondary-education transition. In 2015, the Department began funding Native Youth Community Projects to support community-driven strategies to improve college- and career-readiness of Native youth.
• Professional Development (Section 6122). Under this program, the Department makes discretionary grants to (1) IHEs, or (2) SEAs, LEAs, Indian tribes and organizations, and Department of the Interior-funded schools, in consortium with IHEs, to increase the number of Indian individuals qualified in teaching, school administration, and other education professions, and to improve the skills of those individuals. Individuals receiving training under this program are required to secure employment in a field related to their education and benefiting Indians, or to pay back the amount of the assistance. Awards focus on pre-service teacher and pre-service administrator training.
E-17
INDIAN EDUCATION
Special programs for Indian children Funding levels for the past 5 fiscal years were:
Fiscal Year (dollars in thousands) 2012 ................................ ........................... $18,986 2013 ................................ ............................. 17,993 2014 ................................ ............................. 17,993 2015 ................................ ............................. 17,993 2016 ................................ ............................. 37,993
FY 2017 BUDGET REQUEST
The Administration’s 2017 Budget Request includes $68.0 million for Special Programs for Indian Children, $30 million more than the 2016 level. The request includes appropriations language overriding the authorized funding level in ESSA for this program. The additional funding would support an expansion of the Native Youth Community Projects (NYCP), first funded in fiscal year 2015 and increased in 2016, as an integral part of the Administration’s overall efforts through “Generation Indigenous” to support improved educational and life opportunities for Native youth. The President’s “Generation Indigenous” initiative takes a comprehensive, culturally appropriate approach to help improve the lives and opportunities for Native youth. Through new and increased investments at multiple agencies, the request would support Federal agencies’ collaborative work with tribes to implement education reforms and address issues facing Native youth.
NYCP is designed to support community-driven strategies to improve college- and career-readiness of Native youth by focusing on the unique educational needs of American Indian and Alaska Native (AI/AN) children. The additional funds would help address longstanding, unmet needs demonstrated in part by the educational outcome data described elsewhere in this account under Indian Education Grants to LEAs. In the fiscal year 2015 competition, the Department received 39 eligible applications and was only able to make awards to 12 grantees. While the program received a significant increase in fiscal year 2016, the additional funds requested for 2017 would support increased grant sizes needed to fund more comprehensive interventions involving a broader continuum of services in more high-need AI/AN communities.
For fiscal year 2017, the Department would use about $53.5 million for new and continuing NYCP awards under the Demonstration Grants authority. The Department launched this initiative in fiscal year 2015 by making 12 relatively small (e.g., $500,000) new NYCP awards to eligible entities to support culturally relevant coordinated strategies that are informed by evidence and data and address the greatest in- and out-of-school barriers to student college- and career-readiness. In fiscal year 2016, the Department plans to make larger awards to support more comprehensive services in an estimated 26 additional communities. The Department would use funds from the National Activities program in the Indian Education account to support technical assistance to build the capacity of NYCP grantees to implement their projects. Tribes, during Department-led consultations on NYCP in 2014, identified the need for culturally-relevant technical assistance to help with things like conducting needs assessments, collecting and analyzing data, and identifying best practices and additional resources.
E-18

INDIAN EDUCATION
Special programs for Indian children For the Professional Development program, the Department would use about $10.6 million for new and continuation awards to IHEs and other eligible entities to effectively train Indian students as teachers and school administrators to work in schools with concentrations of Indian children and youth. Grants support teacher training programs at IHEs, including tribal colleges and universities, and support efforts to recruit students that are likely to remain in teaching and administration positions in schools with a high proportion of Indian students, and provide comprehensive services, including support for tuition and living expenses for the students as well as program development and operational costs for the institutions.
PROGRAM OUTPUT MEASURES (dollars in thousands)
Output Measures 2015 2016 2017
Demonstration Grants
NYCP Grants Demonstr ati on Grants – NYC P - Funding for new awards $3,015 $17,425 $30,413 Demonstr ati on Grants – NYC P - Funding for continuation
awards 0 5,465 23,039 Total 3,015 22,890 53,452
Demonstr ati on Grants – NYC P - Number of new awards 12 26 30 Demonstr ati on Grants – NYC P - Number of continuation
awards 0 12 38
Other Demonstration Grants Demonstr ati on Grants Funding for new awards 0 0 0 Demonstr ati on Grants Funding for continuing
awards $10,076 $6,512 $3,537 Total: Demonstration 10,076 6,512 3,537
Demonstr ati on Grants Number of new awards 0 0 0 Demonstr ati on Grants Number of continuing
awards 35 23 17
E-19

INDIAN EDUCATION
Special programs for Indian children
Output Measures 2015 2016 2017
Professional Development
Professi onal D evelopment Funding for new awards: Professional Devel opment 0 $3,665 $6,000 Professi onal D evelopment Funding for continuation
awards: Professi onal D evelopment $4,722 1,909 4,634 Total: Professional Devel opment 4,722 5,061 10,634
Professi onal D evelopment Number of new awards: Professional Devel opment 0 11 17 Professi onal D evelopment Number of continuation
awards: Professi onal D evelopment 21 12 23
Peer Review of new award applications $180 $380 $370
NOTES: Appropriations language for fiscal years 2015 and 2016 authorized the Department to pool evaluation funds reserved under section 9601 of the ESEA and use those pooled funds to evaluate any ESEA program. Similar authority was included in the ESEA as reauthorized by the Every Student Succeeds Act of 2015 (section 8601) and would provide the same flexibility in fiscal year 2017. While the Department did not reserve funds from the Special programs for Indian children program under this authority in fiscal year 2015, it may reserve funds for ESEA evaluation activities in fiscal years 2016 and 2017.
Approximately $1.2 million from the Fund for the Improvement of Education programs of national significance in the Innovation and Improvement account was used to support NYCP grants in fiscal year 2015.
PROGRAM PERFORMANCE INFORMATION
Performance Measures
This section presents selected program performance information, including, for example, GPRA goals, objectives, measures, and performance targets and data; and an assessment of the progress made toward achieving program results. Achievement of program results is based on the cumulative effect of the resources provided in previous years and those requested in fiscal year 2017 and future years, as well as the resources and efforts invested by those served by this program.
For the Demonstration Grants, the indicators for early childhood projects measure the percentage of preschool students who gain school readiness skills as evidenced by pre- and post-test scores on an approved assessment. Indicators for the secondary-to-postsecondary-education transition projects measure the percentage of participating AI/AN students successfully completing at least 3 years of challenging core courses (English, mathematics, science, and social studies) by the end of their fourth year in high school, and the percentage of students who graduate with their incoming 9th grade class. For the 2009 cohort of grantees, 71 percent of 3- and 4-year-old AI/AN children made language and communication development gains, 62 percent made gains on assessments of cognitive skills and conceptual knowledge, and 55 percent made gains on assessments of social development. On the secondary-to-postsecondary indicators, 61 percent of participating AI/AN students successfully completed at
E-20

INDIAN EDUCATION
Special programs for Indian children least 3 years of challenging core courses and 77 percent graduated with their incoming 9th grade class. For the 2010 cohort, 82 percent of 3- and 4-year-old AI/AN children made language and communication development gains, 80 percent made gains on assessments of cognitive skills and conceptual knowledge, and 75 percent made gains on assessments of social development. On the secondary-to-postsecondary indicators, 67 percent of participating AI/AN students successfully completed at least 3 years of challenging core courses and 75 percent graduated with their incoming 9th grade class.
The indicators for the Professional Development Grants measure (1) the percentage of program participants who become school administrators and teachers, respectively, in local educational agencies (LEAs) with 5 percent or more Native American students, (2) the percentage of Teacher Corps participants who receive full State licensure, and (3) the percentage of program participants who complete their service requirement on schedule. New efficiency measures will track the cost per individual who successfully completes an administrator or teacher preparation program. For the 2010 cohort, 13 percent of program participants became school administrators and 27 percent became teachers in LEAs with 5 percent or more Native American Students. Twenty-five percent of Teacher Corps participants received full State licensure, and 28 percent of participants completed their service requirement on schedule. The cost per individual who successfully completed a teacher preparation program was $61,020. Because only two grantees funded students in administrator preparation programs, the Department was not able to calculate the cost per individual for administrator preparation programs.
The Department developed the following performance measures for the NYCP program: (1) the percentage of the annual measurable objectives, as described in the application, that are met by grantees; and (2) the percentage of grantees that report a significant increase in community collaborative efforts that promote college- and career-readiness of Indian children. Initial data for these measures will be available for the first (FY 2015) cohort of NYCP grantees in 2016.
E-21

INDIAN EDUCATION
National activities
(Elementary and Secondary Education Act of 1965, Title VI, Part A, Subpart 3)
(dollars in thousands)
FY 2017 Authorization: $5,656
Budget Authority: 2016 2017 Change
$5,565 $6,565 +1,000
PROGRAM DESCRIPTION
Title VI of the Elementary and Secondary Education Act (ESEA), as reauthorized by the Every Student Succeeds Act of 2015 (ESSA), authorizes Indian Education National Activities that support three activities: (1) research, evaluation, and data collection to provide information on the educational status of the Indian population and on the effectiveness of Indian Student Education programs; (2) grants to support native language immersion schools and programs; and (3) grants to tribes for education administrative planning, development, and coordination. These activities help the Department to improve the national knowledge base on the educational status and needs of Indians, to identify and disseminate information on best practices for serving this population, help maintain, preserve, and restore Native languages and cultural traditions, and promote tribal self-determination in education as well as the coordination and cooperation between tribes and State educational agencies (SEAs) and local educational agencies (LEAs).
The Department has used program funds to augment broader research and statistical activities to ensure that they include significant coverage of the Indian population and provide data that can be used to track the educational progress of Indians over time and to compare the status of Indians with that of other groups. For example, the Department has gathered and disseminated data on the academic achievement, enrollment, graduation rates, and English-speaking ability of Indian students; characteristics of teachers and principals serving those students; and other areas of concern and interest. This research program also responds to Executive Order 13592, on American Indian and Alaska Native Educational Opportunities and Strengthening Tribal Colleges and Universities, which requires the Secretary of Education to study and collect information on the education of American Indian and Alaska Native students.
The ESSA established two new authorities within National Activities. The first formally authorizes a program for tribal education agencies (TEAs) to build their capacity in administering education programs and promote increased collaboration with SEAs. In 2012, the Department made pilot awards to four TEAs to work with SEAs to assume certain SEA responsibilities for the administration of ESEA programs and made additional new awards in fiscal year 2015. The second new authority establishes a grant program to enable grantees to develop and maintain, or improve and expand, programs that supports schools using native
E-22

INDIAN EDUCATION
National Activities language as the primary languages of instruction. The Department will make Native language immersion grants beginning in fiscal year 2017.
Funding levels for the past 5 fiscal years were:
Fiscal Year (dollars in thousands) 2012 ................................ ............................ $5,872 2013 ................................ .............................. 5,565 2014 ................................ .............................. 5,565 2015 ................................ .............................. 5,565 2016 ................................ .............................. 6,565
FY 2017 BUDGET REQUEST
For fiscal year 2017, the Administration requests $6.6 million for Indian Education National Activities, $1 million more than the 2016 level. The request includes appropriations language overriding the authorized funding level for this program.
Historically, the Department has used National Activities funds for three purposes aimed at supporting efforts to improve American Indian and Alaska Native (AI/AN) student academic achievement: (1) research and data collection on the educational status of the Indian population and on the effectiveness of Indian student education programs, including the identification of promising interventions in the field; (2) technical assistance to entities implementing programs for Indian students; and (3) logistical support for Department-sponsored tribal consultations and meetings and for improved implementation of Indian student education programs.
With the additional authorities under the reauthorized ESEA, the Department would use fiscal year 2017 funds for the following activities:
• $1.8 million for grants to tribal educational agencies (TEAs). The fiscal year 2012 Appropriations Act included funding for a pilot program, known as the State-Tribal Education Partnership (STEP) program, which makes grants to TEAs to build their capacity by entering into agreements to assume certain SEA responsibilities for the administration of ESEA programs. The Department would use fiscal year 2017 funds to continue a second cohort of STEP awards first funded in fiscal year 2015.
• $1.2 million for a new Native American and Alaska Native Language Immersion program to maintain and promote the use of Native languages, support Native language education and development, and provide professional development for teachers. These grants will support efforts to improve educational opportunities and outcomes for all AI/AN students, and to support AI/AN students’ efforts to learn their Native languages and maintain and revitalize their Native cultures.
• $1.3 million for the sixth National Indian Education Study (NIES), which has two components: (1) oversampling American Indian and Alaska Native students in the National Assessment of Educational Progress (NAEP), and (2) a survey to collect information on the
E-23

INDIAN EDUCATION
National Activities
educational experiences of American Indian/Alaska Native students and the role of Indian culture in their education. As discussed under the Grants to Local Educational Agencies (LEAs) program, this oversampling provides the Department and the public with comprehensive and timely national and State-level information on American Indian/Alaska Native student achievement in reading and mathematics. The 2017 budget request would support the 2019 administration of the NAEP reading and mathematics assessments, as well as the educational experiences survey. Since 2011 the Department has conducted the NIES, which includes the NAEP oversampling, every other biennial NAEP cycle (rather than for each cycle) in order to devote more Indian Education National Activities resources to other high-priority areas, such as research on promising practices and technical assistance.
The Department released two reports as the culmination of the 2011 NIES in July 2012; the full report is available at http://nces.ed.gov/nationsreportcard/nies/.
• $1.2 million for technical assistance for State educational agencies (SEAs), LEAs, other entities eligible for the Department’s programs, including tribal educational agencies. SEAs and LEAs do not always have the experience necessary to address the needs of AI/AN students or incorporate Indian culture into classroom instruction. According to the 2011 NIES, only one third of AI/AN 8th-graders had reading or language arts teachers who reported that they integrated Indian culture into assignments once a month or more. Technical assistance activities might include helping SEAs and LEAs better understand the issues and challenges facing Indian students and integrate elements of native culture into curriculum, as well as assistance on identifying and incorporating promising practices into the education of Indian students. Fiscal year 2017 funds will also be used to support technical assistance activities for NYCP and STEP grantees.
• $1.0 million for logistical support for the Department to continue tribal consultations and forums to help inform the Department’s policies and decision-making process. Previous experience suggests that these consultations can help improve education for AI/AN students, and the Department is committed to continuing tribal consultation and strengthening the government-to-government relationship between the United States and Indian tribes.
E-24

INDIAN EDUCATION
National Activities PROGRAM OUTPUT MEASURES
(dollars in thousands)
Output Measures 2015 2016 2017
Grants to tribal education agencies
Grants to tribal education agenci es New awards $1,950 0 0 Grants to tribal education agenci es Continuation awards 0 $1,800 $1,800 Native language immersion
grants 0 0 1,194
National Indian Education Study
1,300 1,300 1,300
Other research 0 0 0
Technical assistance 1,274 1,200 1,200
Technical and logistical support
991 1,265 952
Peer review of new award applications
50 0 119
NOTE: Appropriations language for fiscal years 2015 and 2016 authorized the Department to pool evaluation funds reserved under section 9601 of the ESEA and use those pooled funds to evaluate any ESEA program. Similar authority was included in the ESEA as reauthorized by the Every Student Succeeds Act of 2015 (section 8601) and would provide the same flexibility in fiscal year 2017. While the Department did not reserve funds from the Indian Education National Activities program under this authority in fiscal year 2015, it may reserve funds for ESEA evaluation activities in fiscal years 2016 and 2017.
PROGRAM PERFORMANCE INFORMATION
Performance Measures
This section presents selected program performance information, including, for example, GPRA goals, objectives, measures, and performance targets and data; and an assessment of the progress made toward achieving program results. Achievement of program results is based on the cumulative effect of the resources provided in previous years and those requested in fiscal year 2017 and future years, as well as the resources and efforts invested by those served by this program.
The Department established two performance measures for the STEP program to assess grantees’ progress in implementing collaborative agreements with SEAs: (1) the number of funded projects for which the TEA assumes State-level functions by the beginning of the second grant period; and (2) the number of funded projects that, at the end of the project period, report that the project has resulted in creation of an arrangement under which the TEA will continue to
E-25

INDIAN EDUCATION
National Activities be responsible for the State-level functions delineated in its TEA-SEA agreement after Federal funding ends. At the beginning of the second grant period, all four STEP pilot grantees, the Chickasaw Nation (Oklahoma), the Navajo Nation (New Mexico), the Nez Perce Tribe (Idaho), and the Confederated Tribes of the Umatilla Indian Reservation (Oregon) had assumed at least one State-level function, with two grantees assuming two functions, for a total of six State-level functions. Information on the second performance measure will be available later in 2016 once grantees complete their projects under the terms of a 1-year, no-cost extension.
The Department will develop new performance measures for the Native language immersion grants.
E-26

State Table
E-27
Related Documents