Department of Defense Legacy Resource Management Program Project # 14-750 Cooperative Agreement # W9132T-14-2-0024 Demonstrating How Vulnerability Assessments Can Support Military Readiness NatureServe and Arizona Heritage Program Task #4 Management Recommendations Report for the Fort Huachuca Military Reservation October 1, 2015

Welcome message from author
This document is posted to help you gain knowledge. Please leave a comment to let me know what you think about it! Share it to your friends and learn new things together.
Transcript

Department of Defense Legacy Resource Management Program
Project # 14-750
Cooperative Agreement # W9132T-14-2-0024
Demonstrating How Vulnerability Assessments Can Support Military
Readiness
NatureServe and Arizona Heritage Program
Task #4 Management Recommendations Report for the Fort Huachuca Military Reservation
October 1, 2015
i
1 TABLE OF CONTENTS
2 Introduction .................................................................................................................................................... 1
3 Methods .......................................................................................................................................................... 1
3.1.1 Predictive Species Distribution Modeling Methods ........................................................................ 1
3.1.2 Vulnerability Assessment Methods ................................................................................................. 3
3.1.3 Approaches for Identifying Conservation Management Strategies ................................................ 4
4 Species Modeling and Vulnerability Assessment Results, and Management Recommendations ................. 6
4.1 Species #1: Lilium parryi .......................................................................................................................... 6
4.1.1 Results of Predictive Modeling ........................................................................................................ 8
4.1.2 Results of Vulnerability Assessment ............................................................................................. 11
4.1.3 Management Recommendations .................................................................................................. 13
4.2 Species #2: Lilaeopsis schaffneriana ssp. recurva ................................................................................. 14
4.2.1 Results of Predictive Modeling: .................................................................................................... 16
4.2.2 Results of Vulnerability Assessment ............................................................................................. 19
4.2.3 Management Recommendations .................................................................................................. 21
4.3 Species #3: Crotalus willardi.................................................................................................................. 23
4.3.1 Results of Predictive Modeling ...................................................................................................... 25
4.3.2 Results of Vulnerability Assessment ............................................................................................. 28
4.3.3 Management Recommendations .................................................................................................. 30
4.4 Species #4: Hyla Wrightorum (Huachuca/Canelo Hills Pop.) ................................................................ 31
4.4.1 Results of Predictive Modeling ...................................................................................................... 33
4.4.2 Results of Vulnerability Assessment ............................................................................................. 36
4.4.3 Management Recommendations .................................................................................................. 38
4.5 Species #5: Pyrgulopsis thompsoni ....................................................................................................... 39
4.5.1 Results of Predictive Modeling ...................................................................................................... 41
4.5.2 Results of Vulnerability Assessment ............................................................................................. 44
4.5.3 Management Recommendations .................................................................................................. 46
5 Conclusions ................................................................................................................................................... 46
6 Key Terms ...................................................................................................................................................... 47
7 Literature Cited ............................................................................................................................................. 48
1
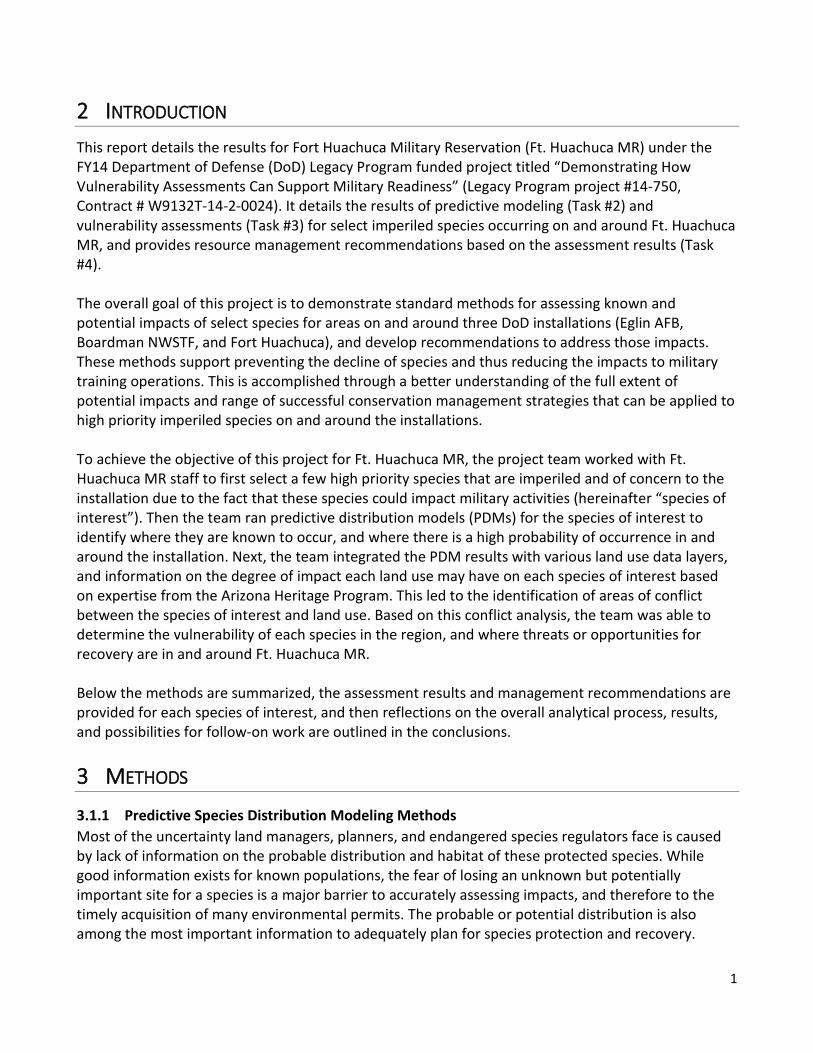
2 INTRODUCTION This report details the results for Fort Huachuca Military Reservation (Ft. Huachuca MR) under the FY14 Department of Defense (DoD) Legacy Program funded project titled “Demonstrating How Vulnerability Assessments Can Support Military Readiness” (Legacy Program project #14-750, Contract # W9132T-14-2-0024). It details the results of predictive modeling (Task #2) and vulnerability assessments (Task #3) for select imperiled species occurring on and around Ft. Huachuca MR, and provides resource management recommendations based on the assessment results (Task #4). The overall goal of this project is to demonstrate standard methods for assessing known and potential impacts of select species for areas on and around three DoD installations (Eglin AFB, Boardman NWSTF, and Fort Huachuca), and develop recommendations to address those impacts. These methods support preventing the decline of species and thus reducing the impacts to military training operations. This is accomplished through a better understanding of the full extent of potential impacts and range of successful conservation management strategies that can be applied to high priority imperiled species on and around the installations. To achieve the objective of this project for Ft. Huachuca MR, the project team worked with Ft. Huachuca MR staff to first select a few high priority species that are imperiled and of concern to the installation due to the fact that these species could impact military activities (hereinafter “species of interest”). Then the team ran predictive distribution models (PDMs) for the species of interest to identify where they are known to occur, and where there is a high probability of occurrence in and around the installation. Next, the team integrated the PDM results with various land use data layers, and information on the degree of impact each land use may have on each species of interest based on expertise from the Arizona Heritage Program. This led to the identification of areas of conflict between the species of interest and land use. Based on this conflict analysis, the team was able to determine the vulnerability of each species in the region, and where threats or opportunities for recovery are in and around Ft. Huachuca MR. Below the methods are summarized, the assessment results and management recommendations are provided for each species of interest, and then reflections on the overall analytical process, results, and possibilities for follow-on work are outlined in the conclusions.
3 METHODS
3.1.1 Predictive Species Distribution Modeling Methods Most of the uncertainty land managers, planners, and endangered species regulators face is caused by lack of information on the probable distribution and habitat of these protected species. While good information exists for known populations, the fear of losing an unknown but potentially important site for a species is a major barrier to accurately assessing impacts, and therefore to the timely acquisition of many environmental permits. The probable or potential distribution is also among the most important information to adequately plan for species protection and recovery.

DoD Legacy Project #14-750: Management Recommendations Report for Ft. Huachuca MR
2
NatureServe and the Natural Heritage Network currently provide consistent, nationwide information on the locations of at-risk species in the U.S. However, most information on at-risk and federally or state listed species locations currently exists in the form of known observations or element occurrences1, instead of habitat type and predicted distributions. Known species locations are highly sensitive information and, as a result, are not easily shared with management or planning agencies or the public. In addition, observation data is usually shown and distributed with buffers that reflect the accuracy or certainty of the individual occurrence. This means that the less accurate or certain the location of a species observation the larger the buffer. As a result, the older, less accurate data shows up as large polygons that include a large buffer, while more recent and accurate observations are often represented by small polygons, except for the rare confirmed observation, which are known to cover a large area on the ground. While this data works fine for individuals who understand how to interpret and use the data and who do project review by looking at the maps, it works poorly with predictive species modeling and electronic decision support tools. In addition, known locations or observations of species, does not assist in identifying where species might occur outside of known or historic locations.
To address this issue, the NatureServe network is now committed to creating consistent range-wide species distribution maps that show the probability of finding federally listed species in any area. The network has identified programs across the country with modeling expertise, developed methods, and tested them in a number of pilots in areas around the country. This legacy project has assisted in moving this predictive species modeling effort forward.
Predictive Distribution Modeling (PDM) is a statistical model that relies on spatial data to produce predictive maps of where species are likely to occur and probably do not occur. Under this project, we used the PDM to predict areas that currently have some probability of occurring as well as potential shifts in the distribution under different land-use scenarios. The probability of occurrence is quantified and is directly related to underlying environmental variables (e.g., vegetation, soils, and landform) and the locations of known occurrences (provided by the three state NatureServe member programs in Arizona, Florida, and Oregon).
PDM maps were produced through following steps:
1. Compiling spatial data associated with the target elements and the environment in the area of interest.
2. Building a statistical model associating the element to environmental variables (e.g., vegetation, soils, landform, and elevation) at sites of known occurrence.
3. Mapping that model across the area of interest.
4. Review and input on probability cut off value for predictive species distribution maps by NatureServe member program species experts.
The team used an inductive species modeling approach using Random Forest, which is a boosted regression tree method (Buechling and Tobalske 2011, Williams et al. 2009). Inductive species
1 An element occurrence (EO) is an area of land and/or water in which a species or native plant community is, or was, present. An EO should have practical conservation value.

DoD Legacy Project #14-750: Management Recommendations Report for Ft. Huachuca MR
3
distribution models provide rich information about where species are likely found, and what spatial data is most important in informing this distribution. Several NatureServe member programs have been able to ground truth the results using Random Forest and found it to be very accurate.
Random Forest compares presence points with background or negative points to create classification trees (CART) based on environmental layers, and then randomly uses a subset of the environmental layers and a subset of the points each time in order to build hundreds of trees, and compare results among trees. Final output reports the probability that the environmental conditions match the conditions where the target element is known to occur.
Internal and external model validation metrics can be extracted in order to assess the accuracy of the maps. We evaluated our models and maps through four different steps: 1) characterizing overall strength for discerning presence and background points, 2) visual review of mapped products with biological experts, and probability cutoff value, 3) assessing the error structure of the binary transformation of the model predictions, and 4) tabulating the area identified as habitat within the binary maps.
Under this project, the team wrote a journal article detailing the approach used for the species distribution modeling. The approach is one that works best for rare species, where the number of known sites can be very limited.
For the Ft. Huachuca Project, the Arizona portion of Apache Highlands Ecoregion (The Nature Conservancy 2004) was selected as the area of interest which the models covered, and for which the vulnerability of the targeted species was assessed. This ecoregion includes the extent of the Madrean Evergreen Woodland habitat (mountainous areas of Huachuca Mountains) and Semidesert Grassland habitats in the flats and foothills surrounding the Huachuca Mountains. Both habitats support one or all of the species occurring on the Ft. Huachuca MR.
3.1.2 Vulnerability Assessment Methods The purpose of the vulnerability assessment is to provide an understanding of: 1) the current vulnerability status of conservation elements of interest, 2) which stressors are primarily responsible for current status and where, and 3) the potential future status of the conservation features in relation to projections of stressors into the future. Status is a measure of the condition or quality of the species habitats as depicted in the modeled distributions as well as their element occurrences from the natural heritage programs’ databases. Understanding where stressors or other features appear to be currently compromising species habitats (hereafter referred to as conservation elements, abbreviated as CEs), as well as the location and degree of potential future impacts, can inform the development of conservation strategies designed to eliminate or mitigate such impacts.
The approach used in this project to assess vulnerability has been utilized by NatureServe in multiple projects throughout the Western Hemisphere: the Ecological Integrity Assessment Framework (Faber-Langendoen et al. 2006, Unnasch et al. 2009). The framework outlines “key ecological attributes” (KEAs) and indicators for assessing the vulnerability status of a CE within a geographic area (Rocchio and Crawford 2011, Unnasch et al. 2009). The vulnerability status of a CE is the current condition of the CE, as determined by relevant indicators. The indicators provide either direct or indirect measures of the condition of the KEAs. The assessment of vulnerability status then seeks to determine if these indicators are within an “ecologically acceptable range of variation.”

DoD Legacy Project #14-750: Management Recommendations Report for Ft. Huachuca MR
4
Given the difficulty of specifying an exact critical range of variation for each indicator, the status assessment instead measures each indicator on a gradient, ranging from mostly intact or “reference” conditions, to highly altered conditions. Reference conditions for a KEA and its indicators are ones that display or support the full range of biological diversity, productivity, and ecological functions expected for that KEA, based on the best available knowledge. Where the CE’s status is closer to reference conditions, it is considered less vulnerable; where it is highly altered, the CE is considered more vulnerable.
While the most accurate measure of vulnerability status requires field-based measurement of many factors, that approach is infeasible in a large landscape assessment like we are conducting in this project. Instead, this approach relies on existing, primarily remotely-sensed data on stressors and other factors as indication of status. For example, presence of roads can fragment the size of CE patches/occurrences; presence of invasive species reduces biotic diversity; and dams on streams reduce aquatic connectivity. Such features, without other evidence, can indicate level of vulnerability.
For this project, spatial data sets reflecting stressors or other features affecting the condition of the CEs were aggregated into KEA indicator “scenarios.” For example, numerous spatial datasets representing roads, mine locations, transmission lines, oil and gas development, landfills, agricultural cropland, and others were combined into a single KEA indicator scenario for the development indicator. These scenarios were compiled and evaluated in NatureServe Vista, using NatureServe’s Landscape Condition Model (LCM) (Comer and Faber-Langendoen 2013, Comer and Hak 2009), to score the indicators for each species and characterize its vulnerability status. A “response model” characterizing how a species responds to each of the stressors or other features reflected in the scenarios was a key input into the LCM. For example, a species may have a very negative response to major roads, but only a moderately negative response to low density urban land use. For each stressor-based scenario (e.g., development, invasives, fire, etc.), the LCM generates a raster reflecting the condition score for each of the CE’s indicators. Vista was then used to generate a raster characterizing the overall vulnerability status of the CE, by combining the individual indicator results. Scores for vulnerability status are on a continuous scale ranging from 0 to 1, with 0 being the most highly altered, and 1 being closest to reference conditions.
3.1.3 Approaches for Identifying Conservation Management Strategies The results of a vulnerability status assessment can be used to inform the development of appropriate conservation strategies. Conservation strategies identify where conservation actions could be taken and what mitigation or management actions may be effective for reaching retention goals for the species in light of the vulnerability assessment results.
Developing complete, implementable conservation strategies is a complex endeavor that can take considerable time and resources. As a pilot project, strategy development was limited to descriptive recommendations. The following section describes two different strategy contexts and proposed approaches for developing conservation solutions that could be implemented in follow on work.
The use of decision support tools (NatureServe’s Vista and Marxan) could be used to generate spatially explicit conservation solutions from sites to entire landscapes.
There are two general situations under which conservation strategies are developed:
DoD Legacy Project #14-750: Management Recommendations Report for Ft. Huachuca MR
5
• Limited conflict: in these cases, a sufficiently small number of impacted occurrences of the CEs (those falling below the condition threshold) are identified where individual investigation and responses can be formulated to meet the conservation (or retention) goals for the species. This can address onsite and off-site mitigation of stressors and conservation.
• Systemic conflicts: in these cases, conflicts are widespread in the assessment area, making it impractical to investigate each species occurrence individually and formulate an efficient strategy for reaching retention goals. An optimization model is needed to quickly identify efficient sets of occurrences to focus on. Note, however, that when goals are set to 100% (e.g., for highly imperiled species), optimization is unnecessary because all occurrences must be included in reaching the retention goal.
Depending on whether conflict is limited or systemic, different approaches for identifying strategies are used. Where conflict is limited, Vista’s “Conflict Compatibility” map is used to iteratively identify sites preventing the achievement of species’ conservation or retention goals. Vista’s Site Explorer function is used to identify which stressors (from the KEA indicator scenarios) are affecting the CEs at the site, and land ownership may be viewed to determine what kind of strategies may be feasible and appropriate. Based on the stressors affecting the species at the site, and the land ownership, relevant conservation strategies (e.g., “invasive species treatment” or “REPI easement”) are selected and applied in Vista to test how their application will affect the goal achievement for the species. These steps are repeated site by site and strategy by strategy until the desired level of mitigation and goal retention is attained. The identified strategies are then combined into an alternative scenario in Vista, and the LCM is run to confirm that CE viability and representation goals are reached or to reveal additional areas for action. Where conflict is systemic, the optimization model Marxan is used in conjunction with Vista to identify appropriate strategies. Vista has an interoperation wizard to package the inputs for Marxan which is then run and results are imported back to Vista to guide development of a network of conservation solutions. The Marxan tool runs millions of iterations to hone in on a “near optimal” spatial solution of units capable of meeting CE representation goals subject to other criteria specified by the user such as cost limits and how clumped the solution needs to be. The “sum of runs” output informs what percent of the runs a particular site is selected for the solution that provides a measure of how “irreplaceable” that site is for meeting CE representation goals. Marxan, however, does not guide specification of what to do on each site nor what implementation mechanism to use; those attributes are developed within Vista’s Site Explorer. Vista should also be used to evaluate the Marxan solution for CE viability; because Marxan abstracts the CE distribution data to site units (e.g., 100 ha hexagons), the result may not capture viable occurrences. Vista can be used to refine the spatial design to ensure full, viable CE occurrences are captured along with other objectives such as habitat adjacency and connectivity for species life history needs.
In this project, the team completed the vulnerability assessment and then made some general conservation strategy recommendations based on expertise of the team and the assessment results. These recommended strategies would need to be further fleshed out and spatially defined in Vista to see how various conservation strategies might affect the overall vulnerability status of the species included in the analyses. Since NatureServe will be making the Vista software and data used in the analyses available to the installations, with some additional support the installations staff could use
DoD Legacy Project #14-750: Management Recommendations Report for Ft. Huachuca MR
6
Vista to support consideration and implementation of various conservation strategies in collaboration with partners in and around the installation.
4 SPECIES MODELING AND VULNERABILITY ASSESSMENT RESULTS, AND
MANAGEMENT RECOMMENDATIONS
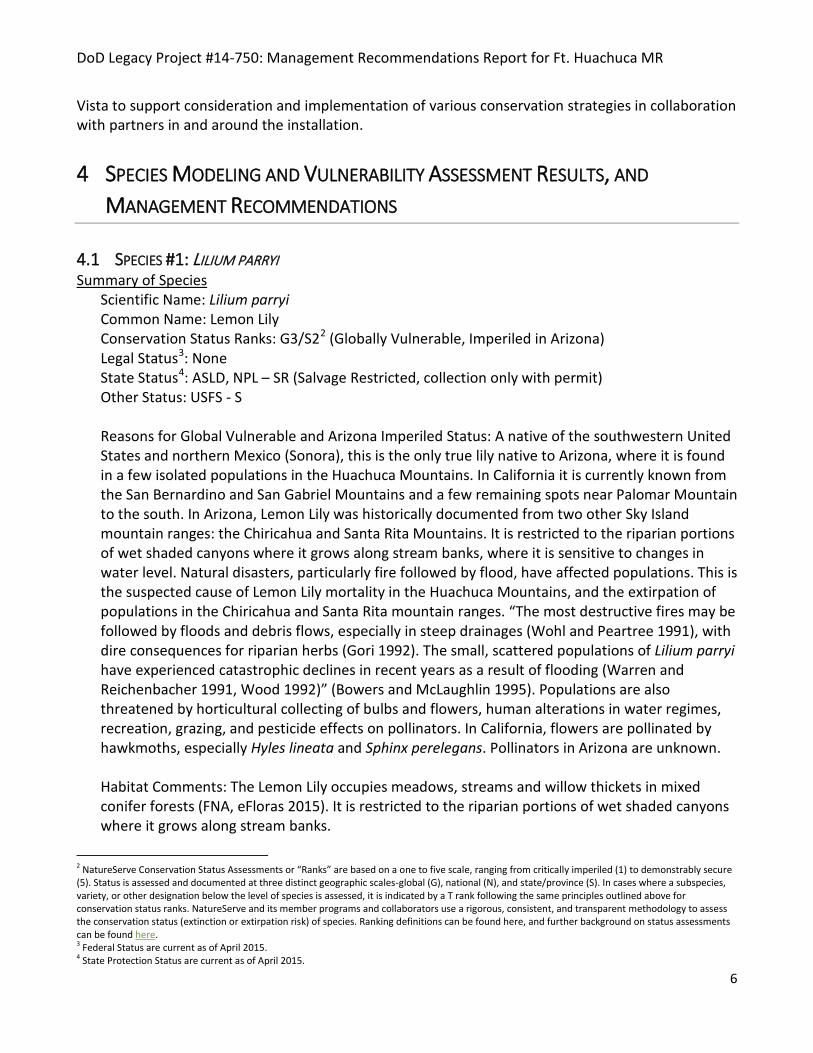
4.1 SPECIES #1: LILIUM PARRYI Summary of Species
Scientific Name: Lilium parryi Common Name: Lemon Lily Conservation Status Ranks: G3/S22 (Globally Vulnerable, Imperiled in Arizona) Legal Status3: None State Status4: ASLD, NPL – SR (Salvage Restricted, collection only with permit) Other Status: USFS - S
Reasons for Global Vulnerable and Arizona Imperiled Status: A native of the southwestern United States and northern Mexico (Sonora), this is the only true lily native to Arizona, where it is found in a few isolated populations in the Huachuca Mountains. In California it is currently known from the San Bernardino and San Gabriel Mountains and a few remaining spots near Palomar Mountain to the south. In Arizona, Lemon Lily was historically documented from two other Sky Island mountain ranges: the Chiricahua and Santa Rita Mountains. It is restricted to the riparian portions of wet shaded canyons where it grows along stream banks, where it is sensitive to changes in water level. Natural disasters, particularly fire followed by flood, have affected populations. This is the suspected cause of Lemon Lily mortality in the Huachuca Mountains, and the extirpation of populations in the Chiricahua and Santa Rita mountain ranges. “The most destructive fires may be followed by floods and debris flows, especially in steep drainages (Wohl and Peartree 1991), with dire consequences for riparian herbs (Gori 1992). The small, scattered populations of Lilium parryi have experienced catastrophic declines in recent years as a result of flooding (Warren and Reichenbacher 1991, Wood 1992)” (Bowers and McLaughlin 1995). Populations are also threatened by horticultural collecting of bulbs and flowers, human alterations in water regimes, recreation, grazing, and pesticide effects on pollinators. In California, flowers are pollinated by hawkmoths, especially Hyles lineata and Sphinx perelegans. Pollinators in Arizona are unknown. Habitat Comments: The Lemon Lily occupies meadows, streams and willow thickets in mixed conifer forests (FNA, eFloras 2015). It is restricted to the riparian portions of wet shaded canyons where it grows along stream banks.
2 NatureServe Conservation Status Assessments or “Ranks” are based on a one to five scale, ranging from critically imperiled (1) to demonstrably secure (5). Status is assessed and documented at three distinct geographic scales-global (G), national (N), and state/province (S). In cases where a subspecies, variety, or other designation below the level of species is assessed, it is indicated by a T rank following the same principles outlined above for conservation status ranks. NatureServe and its member programs and collaborators use a rigorous, consistent, and transparent methodology to assess the conservation status (extinction or extirpation risk) of species. Ranking definitions can be found here, and further background on status assessments can be found here. 3 Federal Status are current as of April 2015. 4 State Protection Status are current as of April 2015.
DoD Legacy Project #14-750: Management Recommendations Report for Ft. Huachuca MR
7
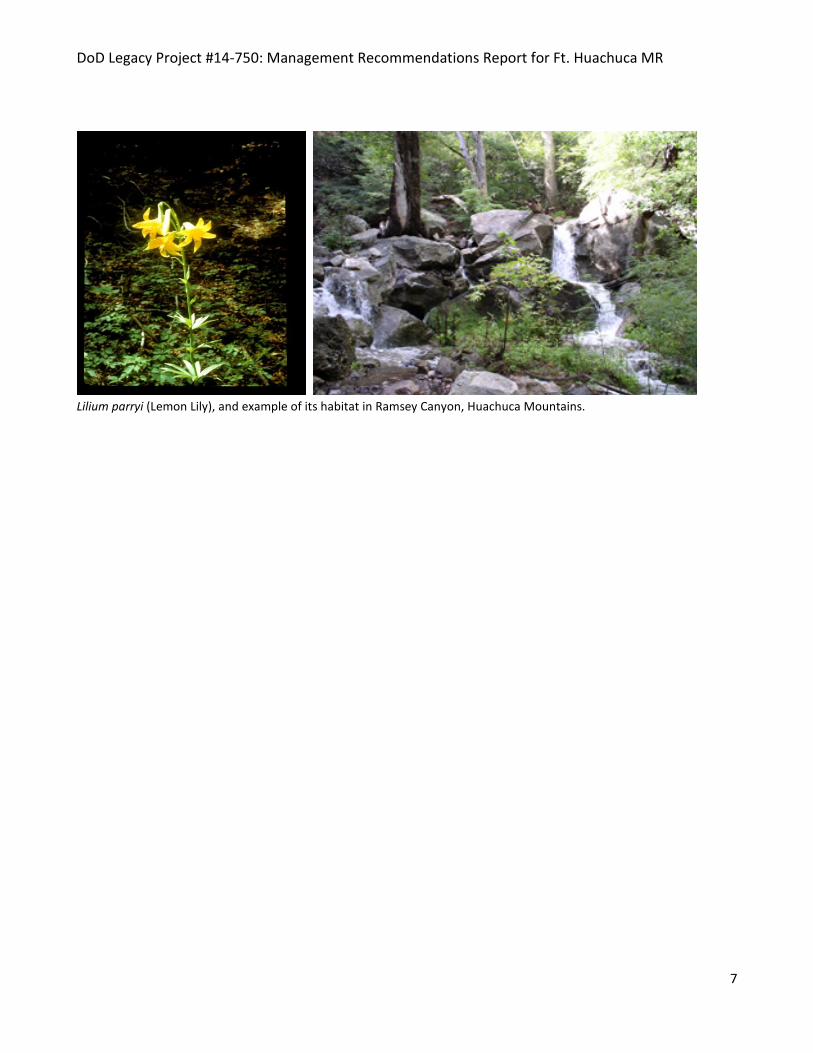
Lilium parryi (Lemon Lily), and example of its habitat in Ramsey Canyon, Huachuca Mountains.
DoD Legacy Project #14-750: Management Recommendations Report for Ft. Huachuca MR
8
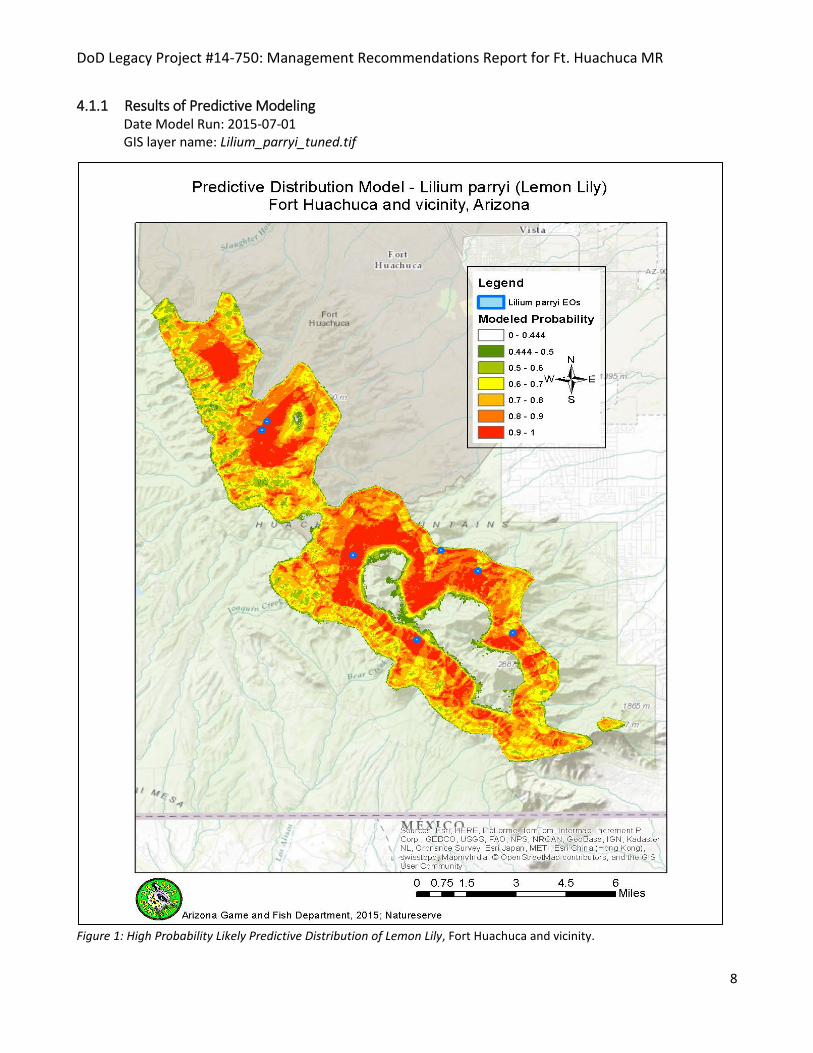
4.1.1 Results of Predictive Modeling Date Model Run: 2015-07-01 GIS layer name: Lilium_parryi_tuned.tif
Figure 1: High Probability Likely Predictive Distribution of Lemon Lily, Fort Huachuca and vicinity.

DoD Legacy Project #14-750: Management Recommendations Report for Ft. Huachuca MR
9
Figure 2. High probability Likely Predictive Distribution of Lemon Lily, Arizona. The following information accompanies and describes the model and validation measures used to assess the species distribution model for Lilium parryi. The model was built using 140 input points from 11 polygons for Lilium parryi (“presence” points) and 132 background, or “absence” points within the species range in Arizona. The environmental conditions at these points, based on 37 environmental variables (Appendix A), were analyzed using the random forests analytic routine, a powerful machine learning algorithm (Breiman 2001), in the R statistical environment (R Development Core Team 2009). This algorithm is especially effective when modeling rare species (Williams et al 2009, Buechling and Tobalske 2011, Royle et al 2012), and provides information on which attributes are the most important in explaining each species’ distribution patterns. The final random forest model used 30 of the original 37 variables (Figure 4). Model accuracy was tested using a cross-validation procedure where a model is built with all but one element occurrence (EO), tested to see if it can predict suitable habitat at that location, and then run and tested again with sequentially different sub-populations held out. Figure 3.a. shows the averaged results of this cross validation. The area under the ROC curve (AUC) provides a numeric summary of

DoD Legacy Project #14-750: Management Recommendations Report for Ft. Huachuca MR
10
prediction strength. An AUC value of 0.5 represents a model no better than random; values close to one show high prediction accuracy. The AUC value in this model was 1.0 as indicated in Figure 3 .b. below.
Figure 3.a. (left) Receiver-operator curve (ROC), illustrating the strength of the cross-validated prediction. This graph estimates the capacity for making accurate predictions for new locations that were not included in the test model. 3.b. (right) Receiver-operator curve (ROC), illustrating the strength of the final model prediction. This graph shows the model’s accuracy at predicting the original input data. Additional accuracy metrics provided in this graph describe the accuracy of a binary prediction generated by applying the cutoff value to the raw model probability prediction. To produce the most effective model, a final model is constructed using all input points. The ROC curve for this final model is provided in Figure 3.b. Expert review was used to determine the most appropriate probability cutoff value for depicting habitat as suitable or not suitable based on the model. The probability cutoff chosen is 0.44 and was based on comparison with known species locations (EOs) and suitable environmental variables, including various temperature and precipitation covers, landform, soils, etc. (Appendix A). Additional validation measures (listed in Figure 3.b.) were completed and confirmed the accuracy of the final model using this selected probability cutoff value (Fielding and Bell 1997). These included: Accuracy (% correctly classified), Sensitivity (How good is the model at detecting known positives? Does it catch all presences, or does it fail to predict some known presences), Specificity (How good is the model at not making false-positive predictions? When it predicts species presence, is the species actually there?), TSS (“True Skill Statistic” This metric combines Sensitivity and Specificity into another formulation of overall accuracy), Kappa (This is yet another way at looking at overall accuracy, addressing whether the model’s confusion matrix indicates that a prediction is ‘better than random’). The environmental variables informing the final model and the relative importance of each for classifying suitable vs. not-suitable habitat are depicted in Figure 4 below. The most important of these included Temperature Seasonality, Temperature Annual Range, Precipitation in Wettest Month, Precipitation in Wettest Quarter, Precipitations in Warmest Quarter, az_landform-30m (landform), Precipitation in Coldest Quarter, Annual Precipitation, Mean Diurnal Range, Precipitation in Driest Quarter, Mean Temperature Warmest Quarter, Mean Temperature Wettest Quarter, Mean

DoD Legacy Project #14-750: Management Recommendations Report for Ft. Huachuca MR
11
Temperature Coldest Quarter. The rest of the variables included 2 precipitations, 4 temperatures, 5 foliage imageries (LandSat8), elevation, 4 soils and 1 climate (see figure 4 below).
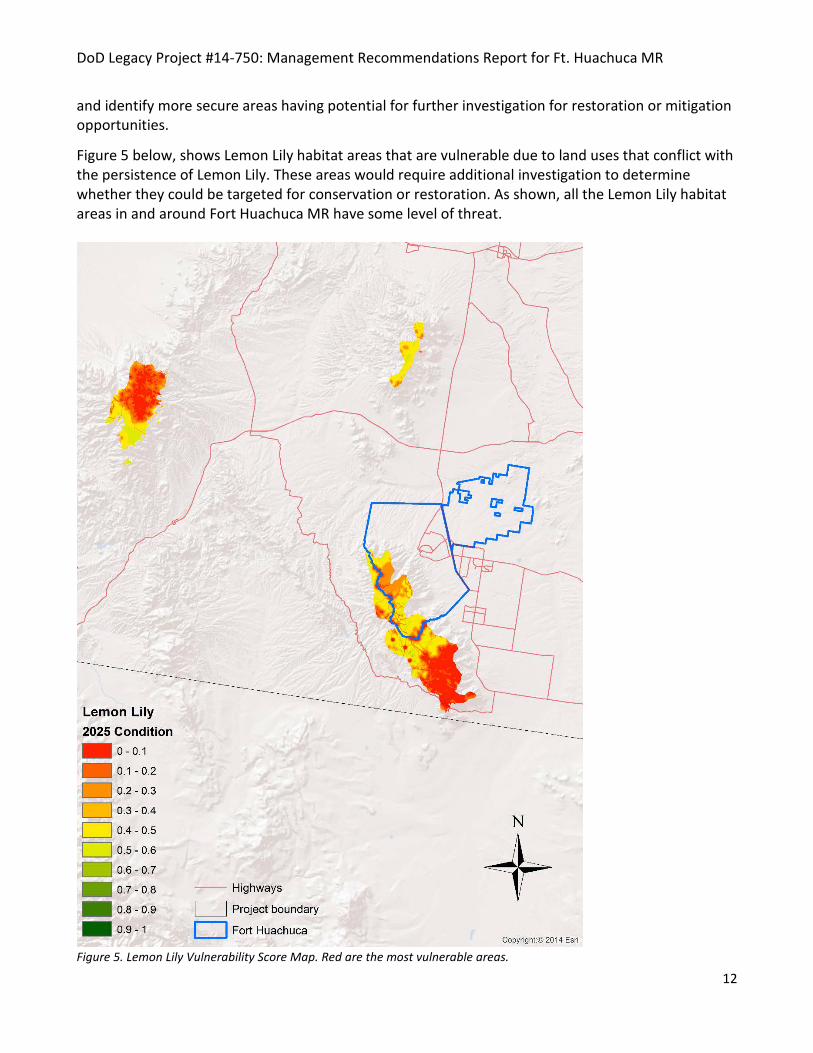
Figure 4. Relative importance of the environmental variables used for the final model. The top variable was most important, the bottom variable, least. 4.1.2 Results of Vulnerability Assessment The Vista vulnerability assessment for the Lemon Lily addressed the major threats to the species in the study area, their interactions, and potential links to management at Ft. Huachuca MR. The goal was to address the vulnerability of potential off-site areas which might be needed for mitigation of unavoidable impacts occurring or proposed to occur on the military reservation. It was hoped the assessment would also help address other impacts to the lily in the study area that might increase its significance on Ft. Huachuca MR. Objectives of the assessment were to highlight high conflict areas
DoD Legacy Project #14-750: Management Recommendations Report for Ft. Huachuca MR
12
and identify more secure areas having potential for further investigation for restoration or mitigation opportunities.
Figure 5 below, shows Lemon Lily habitat areas that are vulnerable due to land uses that conflict with the persistence of Lemon Lily. These areas would require additional investigation to determine whether they could be targeted for conservation or restoration. As shown, all the Lemon Lily habitat areas in and around Fort Huachuca MR have some level of threat.
Figure 5. Lemon Lily Vulnerability Score Map. Red are the most vulnerable areas.
DoD Legacy Project #14-750: Management Recommendations Report for Ft. Huachuca MR
13
4.1.3 Management Recommendations Due to small population numbers and size of the Lemon Lily in Arizona, any factors that affect the quality and condition of the watershed, will likewise affect the populations shown in these maps. Thus short-term management goals should aim to eliminate impact to Lemon lilies at any site.
Any management on Fort Huachuca to improve habitat conditions and leads to stable populations of Lemon lily, could mitigate the impacts for this species off the Fort, e.g. southern Huachuca Mountains and the Santa Rita Mountains where they are thought to be extirpated.
The following management recommendations could be considered.
o Controlled Burns: Controlled burning would eliminate large fuel loads due to fire suppression and would prevent the extensive damage that results from severe fires (Heitlinger et al. 1989, in Encyclopedia of Life 2015).
o Stream Barriers: At key sites a log and stone stream barrier could be placed to increase sedimentation and reducing downcutting of the streambed during flood events.
o Reduce Direct Human Impact: Moving roads and trails away from known sites would decrease direct human impact on the plants. In addition, fencing around plants would prevent damage due to trampling.
o Monitoring: An established monitoring program is necessary to managing Lemon lilies, by determining population size and structure, and trends and threats, and necessary emergency management of populations if sudden declines are detected.
• Monitoring could pick up sudden declines in population size due to a drop in water levels, and providing the opportunity to put in place a supplementary water source to prevent against drying. This could be as simple as adding irrigation spaghetti tubing.
• Monitoring occurs regularly in Ramsey Canyon, where plants are censused by stem counts. The size, number of plants, number of leaves and number of fruits per plant are ascertained yearly (since 1985).
• On Forest Service land in the Huachuca Mountains and Santa Rita Mountains, plants have been monitored yearly since 1989.
o Seed Production and Storage: The Coronado National Forest and The Nature Conservancy (TNC) are collaborating on management of the Ramsey Canyon population. Seeds, produced by the hand pollination of two flowers from one plant on TNC property and further up from a plant on Forest Service property, were collected. Seed stock were kept separate and planted in several groups on the preserve. Dehydration and freezer storage of seeds, is being tested for future seed banking at The Arboretum at Flagstaff.
o Propagation: Propagation studies are being conducted, and cross-pollination of wild plants and the collection of the resulting seeds are being performed on the Ramsey Canyon population.
o Research: • The current knowledge about pollinators of the Lemon Lily in Arizona is lacking, including
what the pollinators are and how they are doing.

DoD Legacy Project #14-750: Management Recommendations Report for Ft. Huachuca MR
14
• Subterranean information on Lemon Lily is lacking, although the plant is reputed to have both tubes and rhizomes. The importance of vegetative versus sexual reproduction needs to be elucidated.
• Hydrological studies may reveal important characteristics of the watershed, and an understanding of the natural dynamics of the habitat, including natural frequencies of fires and floods, and the effect of these disturbances on the community constituents is important.
• Intra- and inter-population genetic variability information is important in understanding population cycles and consequences of small population size, such as found in Arizona.
4.2 SPECIES #2: LILAEOPSIS SCHAFFNERIANA SSP. RECURVA Summary of Species
Scientific Name: Lilaeopsis schaffneriana ssp. recurva Common Name: Huachuca Water-umbel Conservation Status Ranks: G4T2/S2 (Imperiled in Arizona) Legal Status: US – LE with Designated Critical Habitat State Status: ASLD NPL - HS (Highly Safeguarded, no collection allowed) Reasons for Imperiled Status: A native of southern Arizona and northern Mexico (Sonora), Lilaeopsis schaffneriana ssp. recurva has been documented at several new sites, has been transplanted to several sites, and has disappeared from several others. There are 30 known naturally occurring locations in the United States and 21 in Sonora, Mexico, that currently support or have historically supported this taxon within the Santa Cruz, San Pedro, Rio Yaqui, Rio Sonora, and Rio Concepcion watersheds. There is potential for this taxon to occur farther south and west into Sonora. Although many more occurrences of this taxon are known in both the United States and in Mexico, there are no occurrences that appear to be increasing in size and many are reported from single patches among competing vegetation or in aquatic habitat that is in danger of being lost to groundwater pumping or drought. On Fort Huachuca in 2013, it was found in Garden Canyon (2 occurrences of scattered patches), Sawmill Canyon (1 occurrence of 1 patch), McClure Canyon (1 occurrence, 1 patch), and Huachuca Canyon (1 occurrence, unknown number of patches). Many occurrences have not been relocated in many years and are believed extirpated due to changes in suitability of habitat. (USFWS, 5-year Review, 2014a). “Lilaeopsis schaffneriana ssp. recurva is a semi-aquatic to fully aquatic herbaceous perennial in the carrot family (Apiaceae). The root system is comprised of both long horizontal rhizomes and connected shorter vertical rhizomes. Hollow linear leaves that taper to a point are produced singly or in clusters at the top of short rhizomes.” Typically shorter leaves are found in dryer environments and longer when submerged in water. Umbels are born on stalks shorter than the leaves and contain three to ten 1.0 to 2.0 mm wide perfect flowers with five white to slightly maroon tinted petals and maroon anthers. Fruits are spherical and dry, with five distinct spongy ribs that make the seed buoyant and easily dispersed in water. Pollinators are not known, though the formica ant is suspected (Radke, pers comm. 2014, in USFWS, 5-year Review, 2014). Germination occurs one to two weeks after seed dispersal (Gori 1995, in USFWS, 5-year Review, 2014a).

DoD Legacy Project #14-750: Management Recommendations Report for Ft. Huachuca MR
15
Habitat Comments: The Huachuca Water-umber is restricted to cienegas, rivers, streams, and springs in permanently wet (or nearly so) muddy or silty substrates with some organic material (64FR 37441, in USFWS, 5-year Review, 2014a). It is generally found in shallow and slow-flowing waters that are relatively stable, or in active stream channels containing refugial sites where plants can escape the effect of scouring floods (64FR 665, USFWS, 5-year Review, 2014a).
Huachuca Water-umbel (Lilaeopsis schaffneriana ssp. recurva)
Garden Canyon, Huachuca Mountains

DoD Legacy Project #14-750: Management Recommendations Report for Ft. Huachuca MR
16
4.2.1 Results of Predictive Modeling: Date model run: 2015-07-01 GIS layer name: Lilaeopsis_schaffneriana_tuned.tif
Figure 6. Predictive Distribution of Huachuca Water-umbel in the Apache Highlands and Sonoran Desert Ecoregions of Arizona.

DoD Legacy Project #14-750: Management Recommendations Report for Ft. Huachuca MR
17
Figure 7. Predictive Distribution of Huachuca Water-umbel, Arizona. The following information accompanies and describes the model and validation measures used to assess the species distribution model for Lilaeopsis schaffneriana ssp. recurva. The model was built using 2,963 input points from 39 polygons for Lilaeopsis schaffneriana ssp. recurva (“presence” points) and 5,315 background, or “absence” points within the species range in Arizona. The environmental conditions at these points, based on 37 environmental variables (Appendix A), were analyzed using the random forests analytic routine, a powerful machine learning algorithm (Breiman 2001), in the R statistical environment (R Development Core Team 2009). This algorithm is especially effective when modeling rare species (Williams et al 2009, Buechling and Tobalske 2011, Royle et al 2012), and provides information on which attributes are the most important in explaining each species’ distribution patterns. The final random forest model used 30 of the original 37 variables (shown in Figure 9). Model accuracy was tested using a cross-validation procedure where a model is built with all but one element occurrence (EO), tested to see if it can predict suitable habitat at that location, and then run and tested again with sequentially different sub-populations held out. Figure 8.a. shows the averaged results of this cross validation. The area under the ROC curve (AUC) provides a numeric summary prediction strength. An AUC value of 0.5 indicates a prediction that is no better than random, while

DoD Legacy Project #14-750: Management Recommendations Report for Ft. Huachuca MR
18
values close to one show high prediction accuracy. The AUC value in this model was 1.0 as indicated in Figure 8 below.
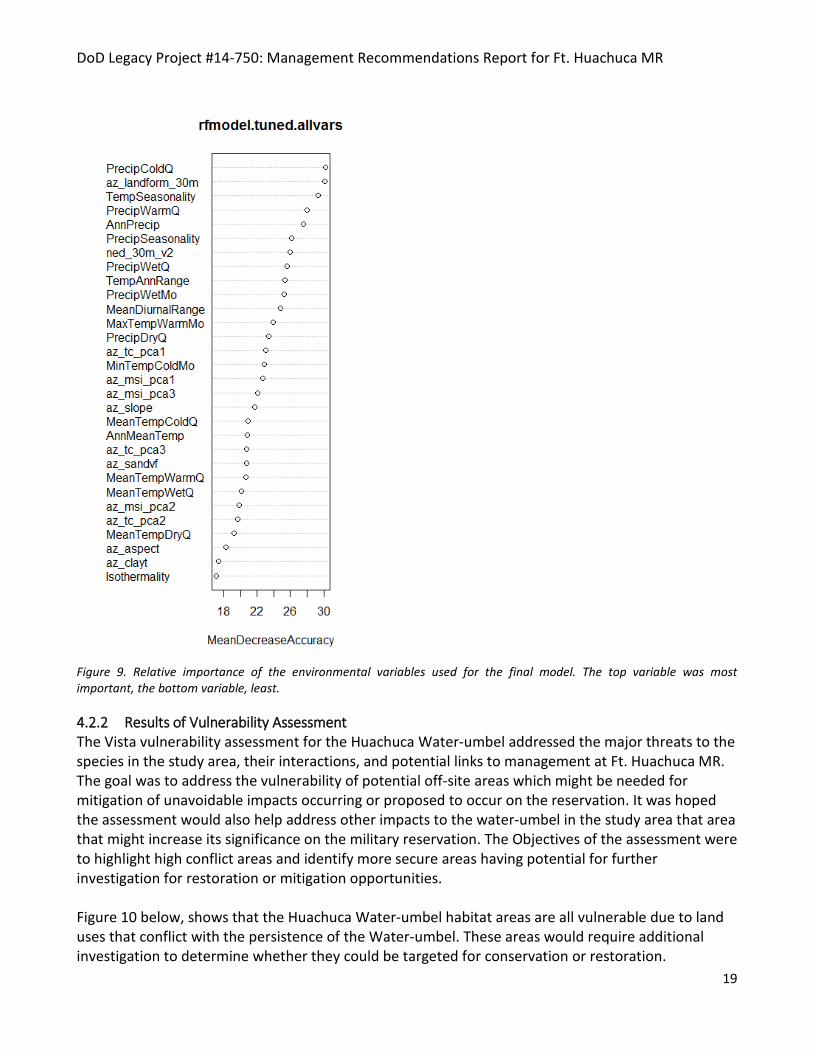
Figure 8.a. (left) Receiver-operator curve (ROC), illustrating the strength of the cross-validated prediction. This graph estimates the capacity for making accurate predictions for new locations that were not included in the test model. 8.b. (right) Receiver-operator curve (ROC), illustrating the strength of the final model prediction. This graph shows the model’s accuracy at predicting the original input data. Additional accuracy metrics provided in this graph describe the accuracy of a binary prediction generated by applying the cutoff value to the raw model probability prediction. To produce the most effective model, a final model is constructed using all input points. The ROC curve for this final model is provided in Figure 8.b. Expert review was used to determine the most appropriate probability cutoff value for depicting habitat as suitable or not suitable based on the model. The probability cutoff chosen is 0.4 and was based on comparison with known species locations (EOs) and suitable environmental variables, including various temperature and precipitation covers, landform, soils, etc. (Appendix A). Additional validation measures (listed in Figure 8.b.) were completed and confirmed the accuracy of the final model using this selected probability cutoff value (Fielding and Bell 1997). These included: Accuracy (% correctly classified), Sensitivity (How good is the model at detecting known positives? Does it catch all presences, or does it fail to predict some known presences), Specificity (How good is the model at not making false-positive predictions? When it predicts species presence, is the species actually there?), TSS (“True Skill Statistic” This metric combines Sensitivity and Specificity into another formulation of overall accuracy), Kappa (This is yet another way at looking at overall accuracy, addressing whether the model’s confusion matrix indicates that a prediction is ‘better than random’). The environmental variables informing the final model and the relative importance of each for classifying suitable vs. not-suitable habitat are depicted in Figure 9 below. Precipitation in Coldest Quarter, az_landform_30m (landform), Temperature Seasonality, Precipitation Warm Quarter, Annual Precipitation were the most important variables, followed by the remainder including elevation, 4 precipitation and 9 temperature variables, 2 soil and 2 landform variables, and 6 foliage imagery variables (LandSat8).
DoD Legacy Project #14-750: Management Recommendations Report for Ft. Huachuca MR
19
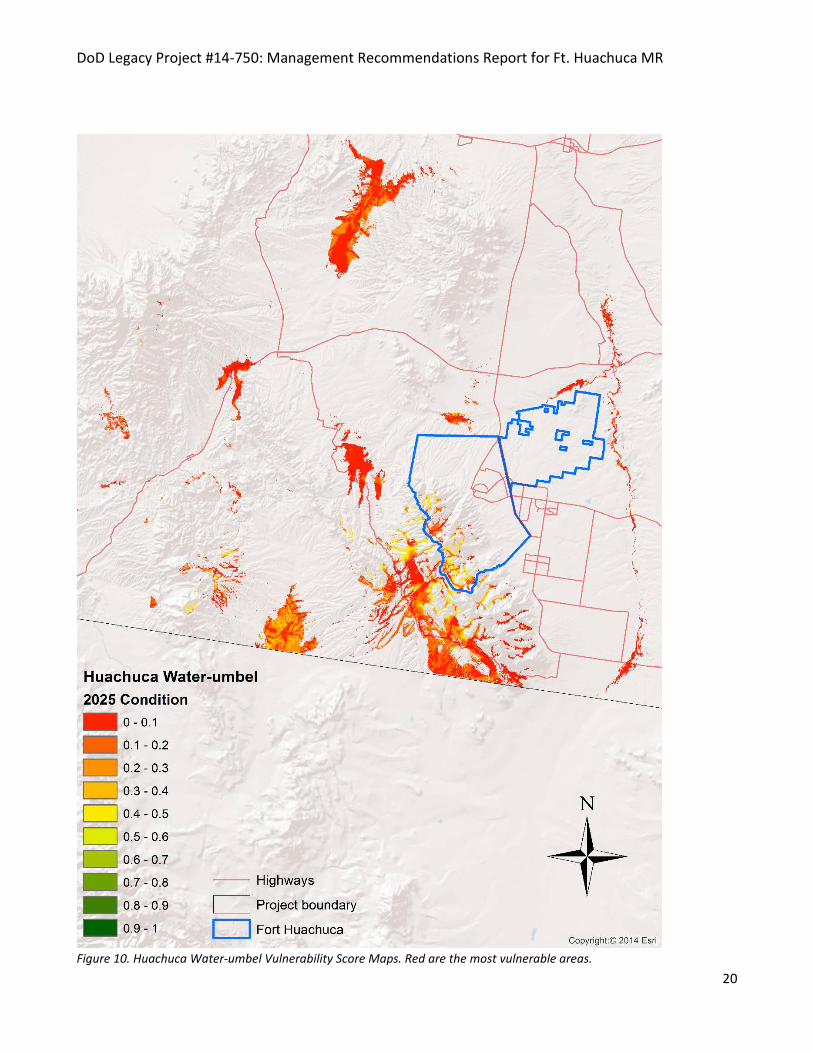
Figure 9. Relative importance of the environmental variables used for the final model. The top variable was most important, the bottom variable, least. 4.2.2 Results of Vulnerability Assessment The Vista vulnerability assessment for the Huachuca Water-umbel addressed the major threats to the species in the study area, their interactions, and potential links to management at Ft. Huachuca MR. The goal was to address the vulnerability of potential off-site areas which might be needed for mitigation of unavoidable impacts occurring or proposed to occur on the reservation. It was hoped the assessment would also help address other impacts to the water-umbel in the study area that area that might increase its significance on the military reservation. The Objectives of the assessment were to highlight high conflict areas and identify more secure areas having potential for further investigation for restoration or mitigation opportunities. Figure 10 below, shows that the Huachuca Water-umbel habitat areas are all vulnerable due to land uses that conflict with the persistence of the Water-umbel. These areas would require additional investigation to determine whether they could be targeted for conservation or restoration.
DoD Legacy Project #14-750: Management Recommendations Report for Ft. Huachuca MR
20
Figure 10. Huachuca Water-umbel Vulnerability Score Maps. Red are the most vulnerable areas.

DoD Legacy Project #14-750: Management Recommendations Report for Ft. Huachuca MR
21
4.2.3 Management Recommendations Due to the high level of vulnerability of the Huachuca Water-umbel, any management on Fort Huachuca MR to improve habitat conditions that leads to productive stable populations of Huachuca Water-umbel, could mitigate the impacts for this species off the Fort, e.g. southern Huachuca Mountains, San Rafael Valley, Canelo Hills, and Las Cienegas Natural Area. In addition, any multi-agency collaborative efforts to implement regional habitat protection and watershed management strategies could support the survival of this species.
• Water Conservation: Known populations are largely isolated from other waterways, due to surface and groundwater development which has disrupted aquatic habitat connectivity. Fort Huachuca participates in water conservation efforts, effluent reuse or recharge by the recent construction of retention ponds on the East Range, the purchase of conservation easements along the Babocomari and San Pedro Rivers, and storm water recharge.
• Invasive Species Reduction: Competition from invasive exotics such as Nasturtium officinale (watercress) in Garden Canyon should be addressed. Much of the Canyon contains high cover of bunchgrasses and marshland species, including watercress, making detection difficult and some historical occurrences have not been relocated in recent years. Cover of invasive exotics such as N. officinale and Cynodon dactylon (Bermudagrass) in the streams of the Huachucas Mountains, and along banks and within San Pedro pose a threat to the Huachuca Water-umbel (Vernadero Group 2009, in USFWS 2014a 5-year review).
• Reduction of Fuel Loads: Flood events, such as in 2014 which removed 2 of the 14 monitored populations from Garden Canyon (Brewer per. comm. 2014, in USFWS 2014a 5-year review), can be exasperated by high intensity fires, which remove upland vegetation sending floodwaters down slope scouring riparian habitats. Reduction of fuel loads can change the fire regime to cool low intensity fires, protecting the upland vegetation and reducing catastrophic floods. Fort Huachuca is involved with coordinating prescribed burns and thinning efforts along with the Coronado National Forest and Coronado National Memorial through the Huachuca FireScape project, established in 2009. In addition, Fort Huachuca’s Integrated Wildfire Management Plan (Gebow and Hessil 2006, entire, in USFWS 2014a 5-year review), provides a planning framework for reducing the risk of fire and fire suppression effects on listed species.
• Cultivation: Cultivation of this taxon for transplantation to new acceptable sites, have been attempted successfully. The small patch in Huachuca Canyon observed in 2013, likely dispersed from transplanted plugs. In all, 6 locations within Huachuca Creek, McClure Canyon, and Cave Spring received 64 plugs, and as of 2013 monitoring, all but one of these locations showed continued expansion of occupied habitat. The Huachuca Canyon Creek location showed a decrease in occupied habitat since 2012. Continued introduction of cultivated material should be performed in acceptable habitat.
• Reduce Direct Human Impact: Moving trails and roads away from known occupied riparian areas can reduce the alteration of desired habitat by reducing scouring of streamside habitat.
• Reduce Stream Erosion & Improve Retainment of Water: Reduction of stream erosion using check-dams (to improve sedimentation and water retention), and watershed treatment

DoD Legacy Project #14-750: Management Recommendations Report for Ft. Huachuca MR
22
measures to retain water and protect riparian habitats from the drying effects of Climate Change (drought) and prevent the decrease in groundwater levels.
DoD Legacy Project #14-750: Management Recommendations Report for Ft. Huachuca MR
23
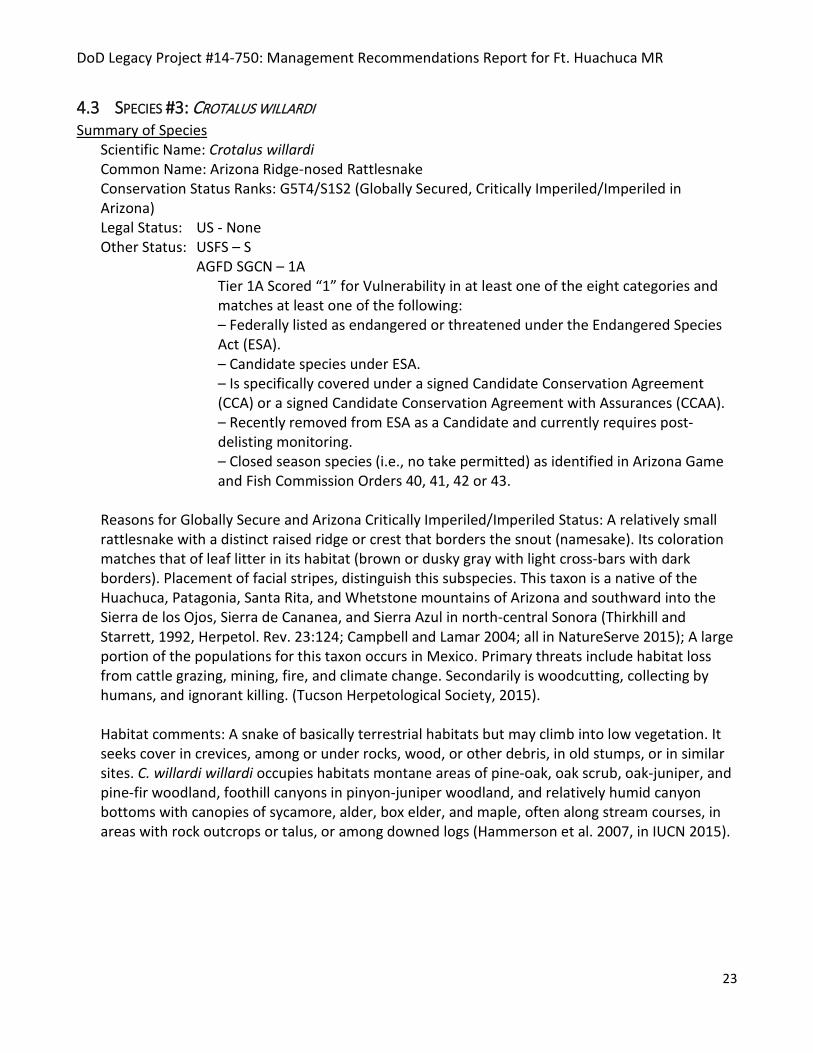
4.3 SPECIES #3: CROTALUS WILLARDI Summary of Species
Scientific Name: Crotalus willardi Common Name: Arizona Ridge-nosed Rattlesnake Conservation Status Ranks: G5T4/S1S2 (Globally Secured, Critically Imperiled/Imperiled in Arizona) Legal Status: US - None Other Status: USFS – S
AGFD SGCN – 1A Tier 1A Scored “1” for Vulnerability in at least one of the eight categories and matches at least one of the following: – Federally listed as endangered or threatened under the Endangered Species Act (ESA). – Candidate species under ESA. – Is specifically covered under a signed Candidate Conservation Agreement (CCA) or a signed Candidate Conservation Agreement with Assurances (CCAA). – Recently removed from ESA as a Candidate and currently requires post-delisting monitoring. – Closed season species (i.e., no take permitted) as identified in Arizona Game and Fish Commission Orders 40, 41, 42 or 43.
Reasons for Globally Secure and Arizona Critically Imperiled/Imperiled Status: A relatively small rattlesnake with a distinct raised ridge or crest that borders the snout (namesake). Its coloration matches that of leaf litter in its habitat (brown or dusky gray with light cross-bars with dark borders). Placement of facial stripes, distinguish this subspecies. This taxon is a native of the Huachuca, Patagonia, Santa Rita, and Whetstone mountains of Arizona and southward into the Sierra de los Ojos, Sierra de Cananea, and Sierra Azul in north-central Sonora (Thirkhill and Starrett, 1992, Herpetol. Rev. 23:124; Campbell and Lamar 2004; all in NatureServe 2015); A large portion of the populations for this taxon occurs in Mexico. Primary threats include habitat loss from cattle grazing, mining, fire, and climate change. Secondarily is woodcutting, collecting by humans, and ignorant killing. (Tucson Herpetological Society, 2015).
Habitat comments: A snake of basically terrestrial habitats but may climb into low vegetation. It seeks cover in crevices, among or under rocks, wood, or other debris, in old stumps, or in similar sites. C. willardi willardi occupies habitats montane areas of pine-oak, oak scrub, oak-juniper, and pine-fir woodland, foothill canyons in pinyon-juniper woodland, and relatively humid canyon bottoms with canopies of sycamore, alder, box elder, and maple, often along stream courses, in areas with rock outcrops or talus, or among downed logs (Hammerson et al. 2007, in IUCN 2015).

DoD Legacy Project #14-750: Management Recommendations Report for Ft. Huachuca MR
24
Arizona Ridge-nosed Rattlesnake (Crotalus willardi willardi)
Example of Crotalus willardi willardi habitat, Miller Peak, Huachuca Mountains
DoD Legacy Project #14-750: Management Recommendations Report for Ft. Huachuca MR
25
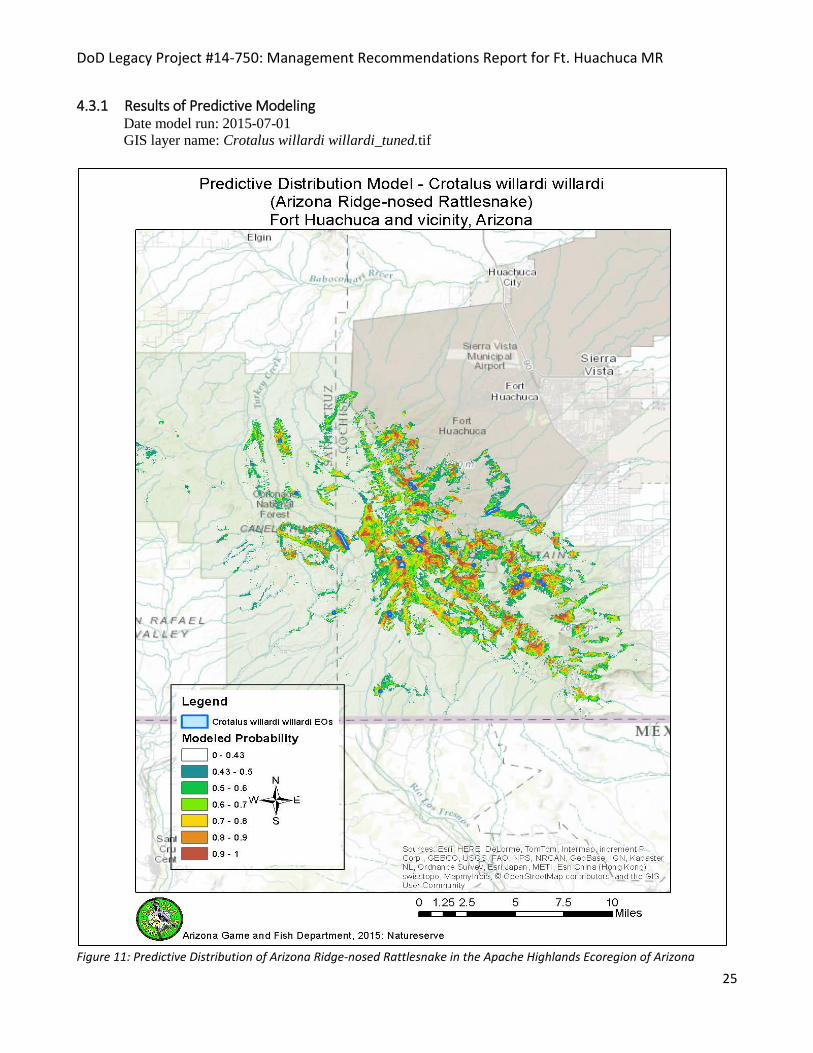
4.3.1 Results of Predictive Modeling Date model run: 2015-07-01 GIS layer name: Crotalus willardi willardi_tuned.tif
Figure 11: Predictive Distribution of Arizona Ridge-nosed Rattlesnake in the Apache Highlands Ecoregion of Arizona
DoD Legacy Project #14-750: Management Recommendations Report for Ft. Huachuca MR
26
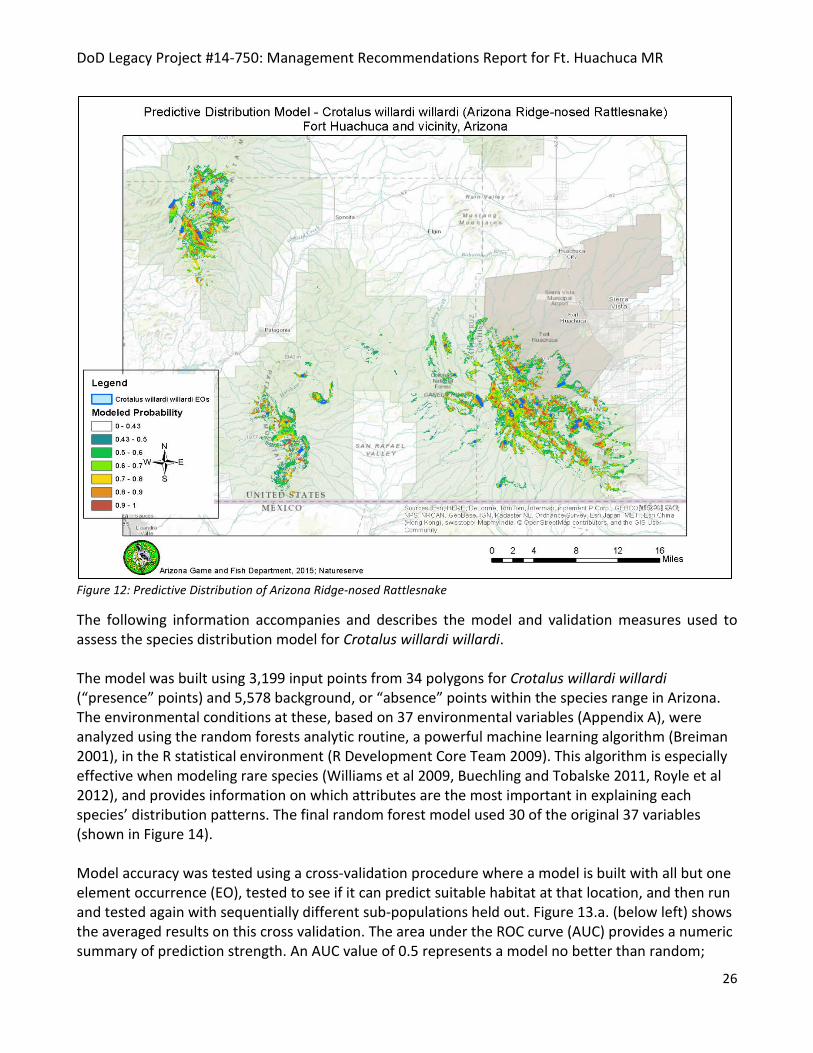
Figure 12: Predictive Distribution of Arizona Ridge-nosed Rattlesnake
The following information accompanies and describes the model and validation measures used to assess the species distribution model for Crotalus willardi willardi. The model was built using 3,199 input points from 34 polygons for Crotalus willardi willardi (“presence” points) and 5,578 background, or “absence” points within the species range in Arizona. The environmental conditions at these, based on 37 environmental variables (Appendix A), were analyzed using the random forests analytic routine, a powerful machine learning algorithm (Breiman 2001), in the R statistical environment (R Development Core Team 2009). This algorithm is especially effective when modeling rare species (Williams et al 2009, Buechling and Tobalske 2011, Royle et al 2012), and provides information on which attributes are the most important in explaining each species’ distribution patterns. The final random forest model used 30 of the original 37 variables (shown in Figure 14). Model accuracy was tested using a cross-validation procedure where a model is built with all but one element occurrence (EO), tested to see if it can predict suitable habitat at that location, and then run and tested again with sequentially different sub-populations held out. Figure 13.a. (below left) shows the averaged results on this cross validation. The area under the ROC curve (AUC) provides a numeric summary of prediction strength. An AUC value of 0.5 represents a model no better than random;

DoD Legacy Project #14-750: Management Recommendations Report for Ft. Huachuca MR
27
values close to one show high prediction accuracy. The AUC value for this model is 0.99 as indicated in Figure 13.b. below.
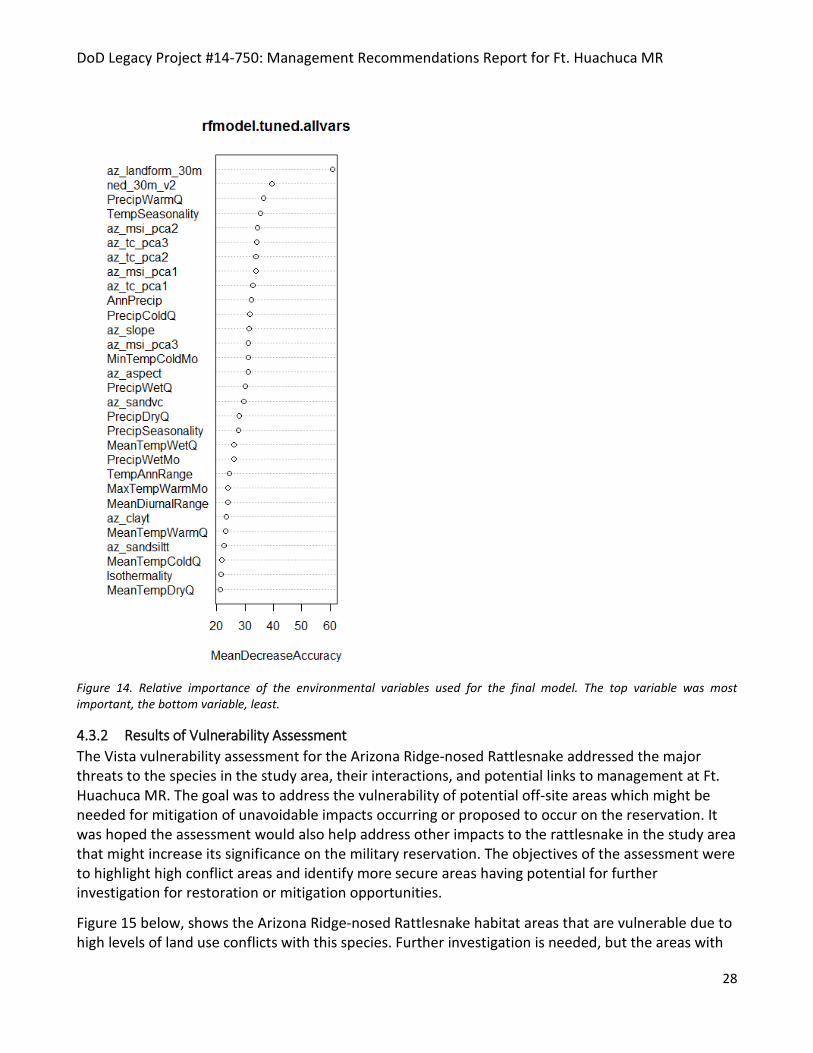
Figure 13.a. (left) Receiver-operator curve (ROC), illustrating the strength of the cross-validated prediction. This graph estimates the capacity for making accurate predictions for new locations that were not included in the test model. 13.b. (right) Receiver-operator curve (ROC), illustrating the strength of the final model prediction. This graph shows the model’s accuracy at predicting the original input data. Additional accuracy metrics provided in this graph describe the accuracy of a binary prediction generated by applying the cutoff value to the raw probability prediction. To produce the most effective model, a final model is constructed using all input points. The ROC curve for this final model is provided in Figure 13.b. Expert review was used to determine the most appropriate probability cutoff value for depicting habitat as suitable or not suitable based on the model. The probability cutoff chosen is 0.43 and was based on comparison with known species locations (EOs) and suitable environmental variables, including various temperature and precipitation covers, landform, soils, etc. (Appendix A). Additional validation measures (listed in Figure 13.b.) were completed and confirmed the accuracy of the final model using this selected probability cutoff value (Fielding and Bell 1997). These included: Accuracy (% correctly classified), Sensitivity (How good is the model at detecting known positives? Does it catch all presences, or does it fail to predict some known presences), Specificity (How good is the model at not making false-positive predictions? When it predicts species presence, is the species actually there?), TSS (“True Skill Statistic” This metric combines Sensitivity and Specificity into another formulation of overall accuracy), Kappa (This is yet another way at looking at overall accuracy, addressing whether the model’s confusion matrix indicates that a prediction is ‘better than random’). The environmental variables informing the final model and the relative importance of each for classifying suitable vs. not-suitable habitat are depicted in Figure 14 below. By far the most important variable was landform, followed by seven moderate variable of importance including: elevation, precipitation in warmest quarter, temperature seasonality and 4 foliage imageries (LandSat8). The rest of the variables used in the model included 6 precipitation, 8 temperature, 2 landscape, 3 soils, 2 foliage and 1 climate.
DoD Legacy Project #14-750: Management Recommendations Report for Ft. Huachuca MR
28
Figure 14. Relative importance of the environmental variables used for the final model. The top variable was most important, the bottom variable, least.
4.3.2 Results of Vulnerability Assessment The Vista vulnerability assessment for the Arizona Ridge-nosed Rattlesnake addressed the major threats to the species in the study area, their interactions, and potential links to management at Ft. Huachuca MR. The goal was to address the vulnerability of potential off-site areas which might be needed for mitigation of unavoidable impacts occurring or proposed to occur on the reservation. It was hoped the assessment would also help address other impacts to the rattlesnake in the study area that might increase its significance on the military reservation. The objectives of the assessment were to highlight high conflict areas and identify more secure areas having potential for further investigation for restoration or mitigation opportunities.
Figure 15 below, shows the Arizona Ridge-nosed Rattlesnake habitat areas that are vulnerable due to high levels of land use conflicts with this species. Further investigation is needed, but the areas with

DoD Legacy Project #14-750: Management Recommendations Report for Ft. Huachuca MR
29
the least amount of conflict (green) could potentially be targeted for conservation, whereas the areas with the most conflict (yellow and red) could be targeted for restoration.
Figure 15. Arizona Ridge-nosed Rattlesnake Vulnerability Score Map. Red are the most vulnerable areas.

DoD Legacy Project #14-750: Management Recommendations Report for Ft. Huachuca MR
30
4.3.3 Management Recommendations Any management on Fort Huachuca to improve habitat conditions that support productive stable populations of Arizona Ridge-nosed Rattlesnakes, could mitigate the impacts for this species off the Fort, e.g. southern and western Huachuca Mountains. The following are some management recommendations for consideration.
• Watershed-Scale Habitat Conservation: Deep and narrow canyons that provided more mesic conditions than surrounding habitats apparently are especially important for the survival of ridge-nosed populations in the northern and arid parts of the species’ range (USFWS 1985). Loss of habitat due to wildfire, improperly conducted prescribed fire, and other land management actions that contribute to degraded watersheds have adverse effects to the rattlesnake. Actions that would improve and preserve these habitats are important. In addition, Local habitats and dispersal corridors should be maintained.
• Prescribed Burns: Reduction of habitat fuel loads both in canyon and upland habitats by prescribed burns and woodcutting, can decrease frequency and intensity of wildfires and their effects on these habitats. Cool season burns are recommended, especially near riparian habitats.
• Reduce and Prevent Invasive Species: Non-native species (mainly vegetative) in habitats should be managed as follows:
o Eradicate or remove introduced species by removing them. If eradication is not feasible, control introduced species near occupied habitat by active removal.
o Monitor sites without non-natives for early detection of colonization. • Reduce Water Contamination: Contaminants to waters from local activities including vehicles
use, land, wildlife and fire management, and military training exercises should be managed in order to avoid changes in the baselines chemistry of water.
• Monitoring: Sites should be monitored for increases in sedimentation because surface runoff can alter the permanency of riparian/canyon systems. As stated above, monitoring could also include early detection of invasive species.
• Erosion Control: Install erosion control structures in drainages above and/or below heavy OHV use area.
• Reduce Direct Human Impacts: Reduce potential for negative interaction with recreationists, especially OHV users in aquatic systems by:
o Restricting vehicular access to only include major recreational destinations (i.e. camp and picnic ground in Garden and Huachuca canyons).
o Block access to habitats where species are present by installing large boulders, fences or other cover around the perimeter of the area.
o Implement a permit system for areas remaining open to OHV use. o Develop and install educational signs or literature detailing environmental damage
irresponsible recreational/OHV use inflicts on the landscape, especially aquatic systems.
DoD Legacy Project #14-750: Management Recommendations Report for Ft. Huachuca MR
31
4.4 SPECIES #4: HYLA WRIGHTORUM (HUACHUCA/CANELO HILLS POP.) Summary of Species
Scientific Name: Hyla wrightorum (Huachuca/Canelo Hills Pop.) Common Name: Arizona Treefrog (Huachuca/Canelo Hills DPS) Conservation Status Ranks: G4T2/S1S2 Legal Status: US – Candidate (Huachuca/Canelo DPS) Other Status: USFS - S
AGFD SGCN – 1A Tier 1A Scored “1” for Vulnerability in at least one of the eight categories and matches at least one of the following: – Federally listed as endangered or threatened under the Endangered Species Act (ESA). – Candidate species under ESA. – Is specifically covered under a signed conservation agreement (CCA) or a signed conservation agreement with assurances (CCAA). – Recently removed from ESA and currently requires post-delisting monitoring. – Closed season species (i.e., no take permitted) as identified in Arizona Game and Fish Commission Orders 40, 41, 42 or 43.
Reasons for Globally Imperiled and Arizona Critically Imperiled/Imperiled Status: There are fewer than 20 known localities of this species, and only small numbers of adults have been found at each breeding location (NatureServe 2015). Major threats in the area to this species include habitat loss or degradation and direct mortality due to catastrophic fire; loss of populations due to drought or floods, which may be exacerbated by climatic extremes; predation by introduced non-native species; habitat degradation caused by livestock grazing, off-highway vehicles, and environmental contamination. The effects of these threats are worsened by small population sizes and low genetic diversity (USFWS 2007).
Habitat Comments: They can usually be found on the ground or in shrubs and trees near ponds, pools and streams, usually in coniferous forest but is also known from Madrean oak woodland and savanna or pine-oak woodland at elevations between 3,000 and 9,500 feet (915 – 2898 m). During the nonbreeding season, frogs may climb high into trees or may occur on the ground in wet meadows or other damp places (Brennan and Holycross 2006; J. Rorabough in http://www.reptilesofaz.org/amphibians.html accessed 2015). Breeding sites usually are in temporary waters, including shallow flooded areas and stream pools, but eggs may be deposited in permanent waters as well (Gergus et al. 2004). Egg masses are attached to vegetation just below the water surface (Behler and Kind 1979).

DoD Legacy Project #14-750: Management Recommendations Report for Ft. Huachuca MR
32
Arizona TreeFrog (Hyla wrightorum – Huachuca/Canelo Hills Pop.)
Garden Canyon, Huachuca Mountains, AZ
DoD Legacy Project #14-750: Management Recommendations Report for Ft. Huachuca MR
33
4.4.1 Results of Predictive Modeling
Data model run: 2015-07-01 GIS layer name: Hyla wrightorum_tuned.tif
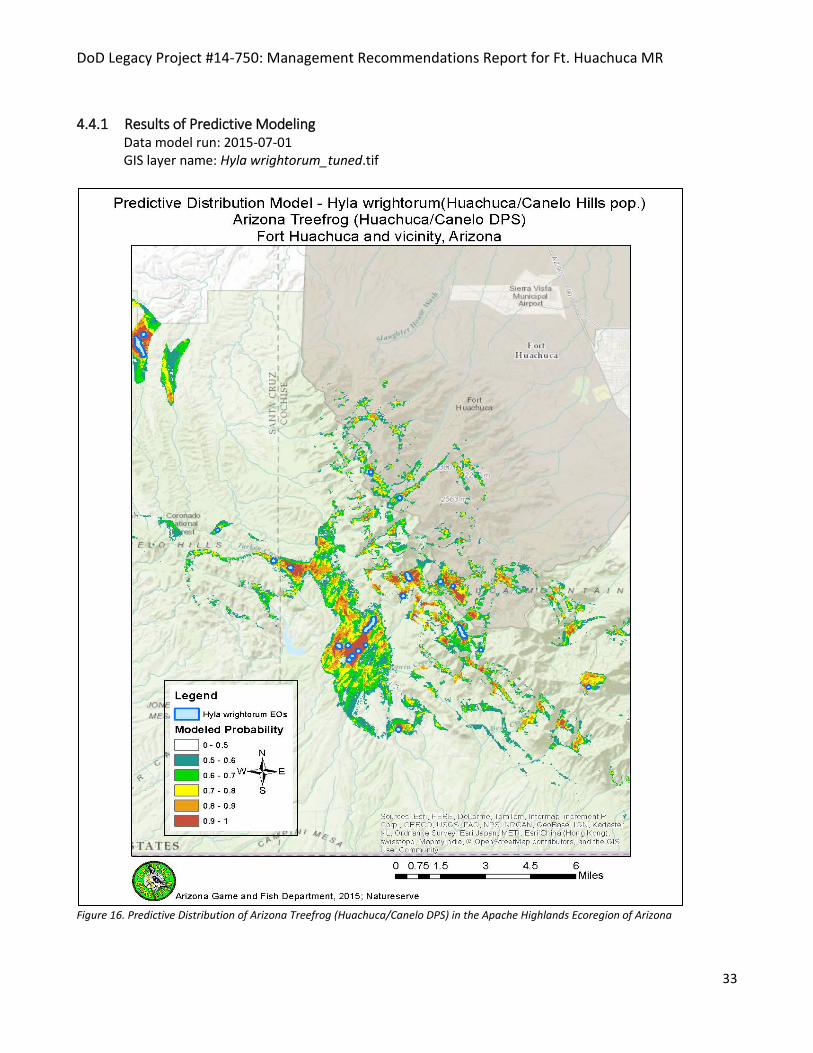
Figure 16. Predictive Distribution of Arizona Treefrog (Huachuca/Canelo DPS) in the Apache Highlands Ecoregion of Arizona

DoD Legacy Project #14-750: Management Recommendations Report for Ft. Huachuca MR
34
Figure 17: Predictive Distribution of Arizona Treefrog (Huachuca/Canelo DPS). The following information accompanies and describes the model and validation measures used to assess the species distribution model for Hyla wrightorum (Huachuca/Canelo Hills Pop.). The model was built using 820 input points from 21 polygons for Hyla wrightorum (“presence” points) and 665 background, or “absence” points within the species range in Arizona. The environmental conditions at these points, based on 37 environmental variables (Appendix A), were analyzed using the random forests analytic routine, a powerful machine learning algorithm (Breiman 2001), in the R statistical environment (R Development Core Team 2009). This algorithm is especially effective when modeling rare species (Williams et al 2009, Buechling and Tobalske 2011, Royle et al 2012), and provides information on which attributes are the most important in explaining each species’ distribution patterns. The final random forest model used 30 of the original 37 variables (shown in Figure 19).
DoD Legacy Project #14-750: Management Recommendations Report for Ft. Huachuca MR
35
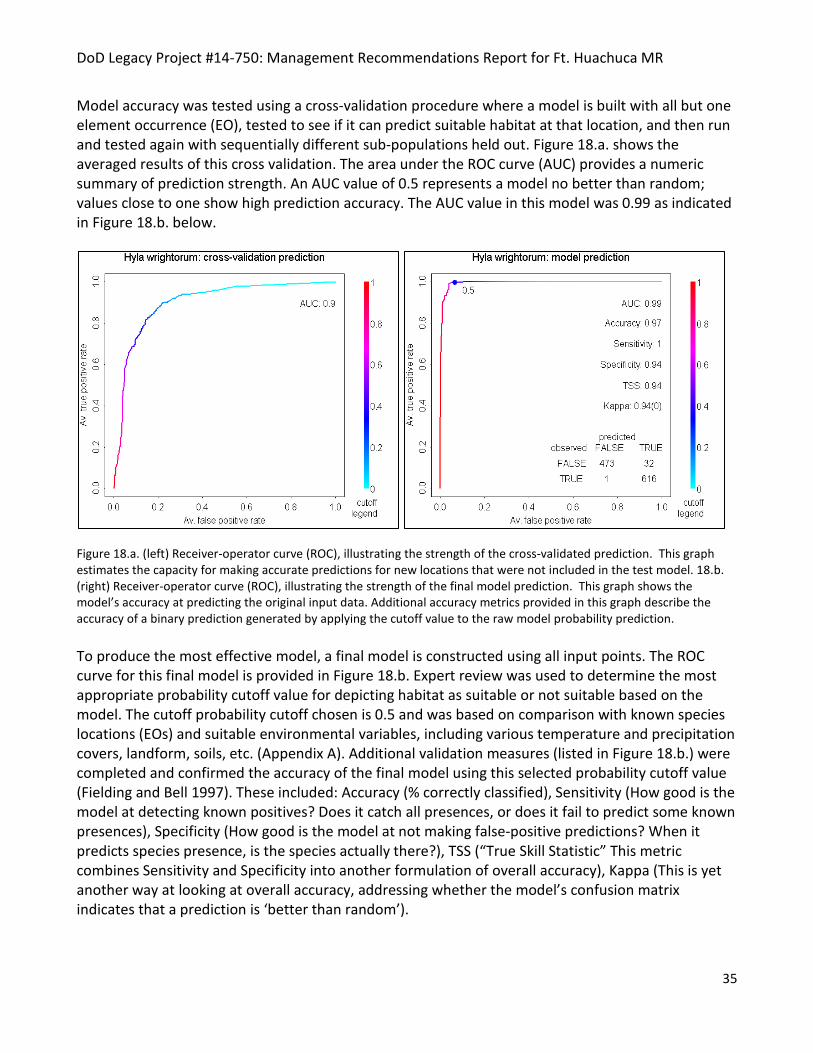
Model accuracy was tested using a cross-validation procedure where a model is built with all but one element occurrence (EO), tested to see if it can predict suitable habitat at that location, and then run and tested again with sequentially different sub-populations held out. Figure 18.a. shows the averaged results of this cross validation. The area under the ROC curve (AUC) provides a numeric summary of prediction strength. An AUC value of 0.5 represents a model no better than random; values close to one show high prediction accuracy. The AUC value in this model was 0.99 as indicated in Figure 18.b. below.
Figure 18.a. (left) Receiver-operator curve (ROC), illustrating the strength of the cross-validated prediction. This graph estimates the capacity for making accurate predictions for new locations that were not included in the test model. 18.b. (right) Receiver-operator curve (ROC), illustrating the strength of the final model prediction. This graph shows the model’s accuracy at predicting the original input data. Additional accuracy metrics provided in this graph describe the accuracy of a binary prediction generated by applying the cutoff value to the raw model probability prediction. To produce the most effective model, a final model is constructed using all input points. The ROC curve for this final model is provided in Figure 18.b. Expert review was used to determine the most appropriate probability cutoff value for depicting habitat as suitable or not suitable based on the model. The cutoff probability cutoff chosen is 0.5 and was based on comparison with known species locations (EOs) and suitable environmental variables, including various temperature and precipitation covers, landform, soils, etc. (Appendix A). Additional validation measures (listed in Figure 18.b.) were completed and confirmed the accuracy of the final model using this selected probability cutoff value (Fielding and Bell 1997). These included: Accuracy (% correctly classified), Sensitivity (How good is the model at detecting known positives? Does it catch all presences, or does it fail to predict some known presences), Specificity (How good is the model at not making false-positive predictions? When it predicts species presence, is the species actually there?), TSS (“True Skill Statistic” This metric combines Sensitivity and Specificity into another formulation of overall accuracy), Kappa (This is yet another way at looking at overall accuracy, addressing whether the model’s confusion matrix indicates that a prediction is ‘better than random’).
DoD Legacy Project #14-750: Management Recommendations Report for Ft. Huachuca MR
36
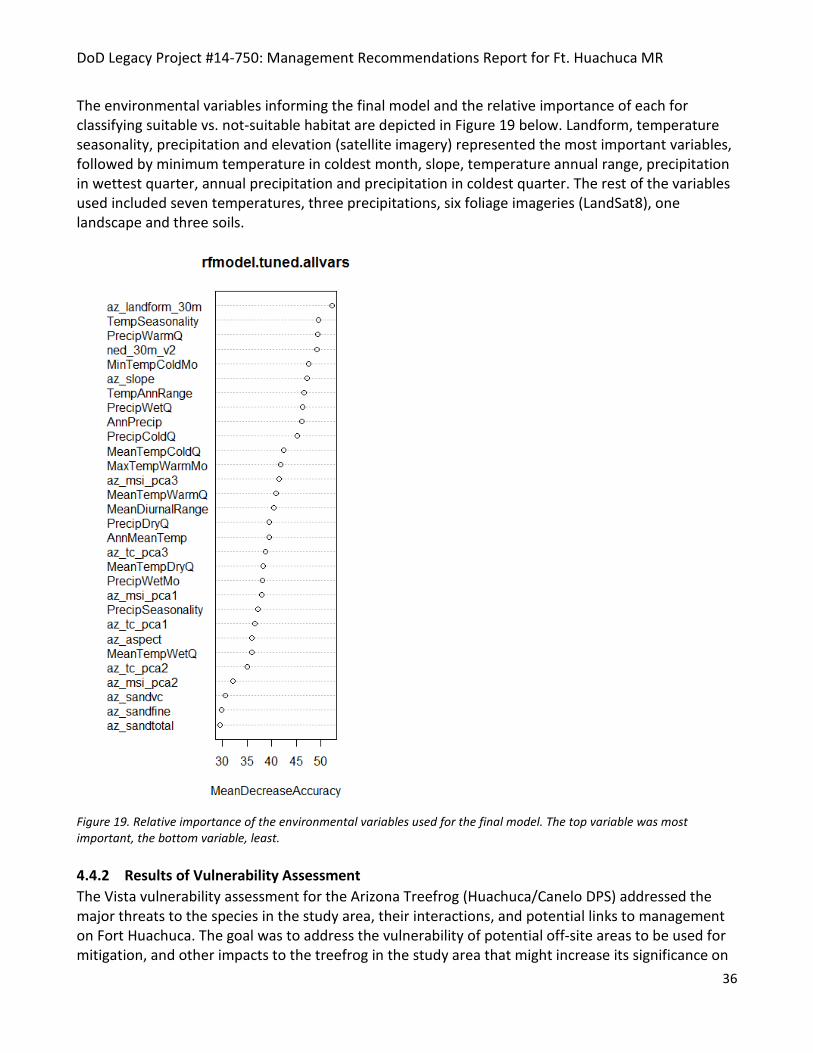
The environmental variables informing the final model and the relative importance of each for classifying suitable vs. not-suitable habitat are depicted in Figure 19 below. Landform, temperature seasonality, precipitation and elevation (satellite imagery) represented the most important variables, followed by minimum temperature in coldest month, slope, temperature annual range, precipitation in wettest quarter, annual precipitation and precipitation in coldest quarter. The rest of the variables used included seven temperatures, three precipitations, six foliage imageries (LandSat8), one landscape and three soils.
Figure 19. Relative importance of the environmental variables used for the final model. The top variable was most important, the bottom variable, least. 4.4.2 Results of Vulnerability Assessment The Vista vulnerability assessment for the Arizona Treefrog (Huachuca/Canelo DPS) addressed the major threats to the species in the study area, their interactions, and potential links to management on Fort Huachuca. The goal was to address the vulnerability of potential off-site areas to be used for mitigation, and other impacts to the treefrog in the study area that might increase its significance on
DoD Legacy Project #14-750: Management Recommendations Report for Ft. Huachuca MR
37
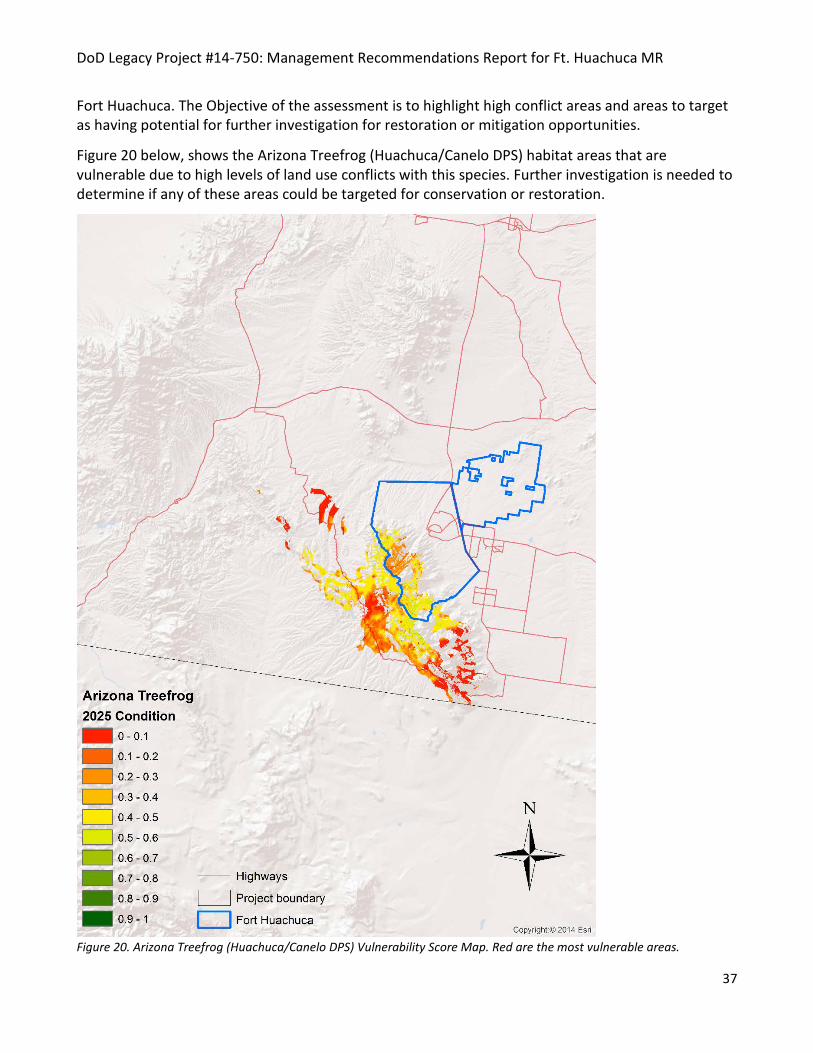
Fort Huachuca. The Objective of the assessment is to highlight high conflict areas and areas to target as having potential for further investigation for restoration or mitigation opportunities.
Figure 20 below, shows the Arizona Treefrog (Huachuca/Canelo DPS) habitat areas that are vulnerable due to high levels of land use conflicts with this species. Further investigation is needed to determine if any of these areas could be targeted for conservation or restoration.
Figure 20. Arizona Treefrog (Huachuca/Canelo DPS) Vulnerability Score Map. Red are the most vulnerable areas.
DoD Legacy Project #14-750: Management Recommendations Report for Ft. Huachuca MR
38
4.4.3 Management Recommendations Any management on Fort Huachuca MR to improve habitat conditions that support productive stable populations of Arizona Treefrogs, could mitigate the impacts for this species off the Fort, e.g. southern and western Huachuca Mountains and the Canelo Hills. The following are some management approaches for consideration on and around Fort Huachuca MR.
• Reduce Fuel Load: Important bankside vegetation can be lost during fires. Reduction of habitat fuel load by prescribed burns and woodcutting, can decrease frequency and intensity of wildfires and their effects on bankside habitats. During prescribed burns, aquatic habitat should be buffered wherever possible by conducting a cool season burn around the area. DeBano and Near (1996) recommend a buffer strip determined using the following formula: buffer strip width = 9m + (0.46 x percent slope).
• Local habitats and dispersal corridors should be maintained: Manmade aquatic habitats are often used as breeding sites and it is recommended that the maintenance or enhancement of earthen cattle tanks should accompany the renovation of natural aquatic systems.
• Reduce Non-native (Invasive) species: o Eradicate or remove introduced species by removing them or by draining ponds. If
eradication is not feasible, control introduced species near sites with sensitive amphibians by passive trapping or active removal.
o Monitor sites without non-native for early detection of colonization. • Reduce Water Contaminants: Contaminants to waters from local activities including vehicle
use, land, wildlife and fire management, and military training exercises should be managed in order to avoid changes in the baselines chemistry of water.
• Monitoring: Sites should be monitored for increases in sedimentation because surface runoff can alter the permanency of aquatic systems. A baseline of pond basin size should be documented in order to recognize reductions in volume over time. In addition, as stated above monitoring to support early detection of invasive species could be implemented.
• Reduce Erosion: Install erosion control structures in drainages above ponds with sensitive species and/or below heavy OHV use area.
• Reduce Direct Human Impacts: Reduce potential for negative interaction with recreationists, especially OHV users in aquatic systems by:
o Restricting vehicular access to only include major recreational destinations (i.e. camp and picnic ground in Garden and Huachuca canyons).
o Block access to ponds where species is present by installing large boulders or fences. o Implement a permit system for areas remaining open to OHV use. o Develop and install educational signs or literature detailing environmental damage
irresponsible recreational/OHV use inflicts on the landscape, especially aquatic systems. (Sredl and Wallace 2000)

DoD Legacy Project #14-750: Management Recommendations Report for Ft. Huachuca MR
39
4.5 SPECIES #5: PYRGULOPSIS THOMPSONI Summary of Species
Scientific Name: Pyrgulopsis thompsoni Common Name: Huachuca Springsnail Conservation Status Rank: G2/S2 Legal Status: US – Candidate Other Status: BLM – S
USFS - S AGFD SGCN – 1A
Tier 1A Scored “1” for Vulnerability in at least one of the eight categories and matches at least one of the following: – Federally listed as endangered or threatened under the Endangered Species Act (ESA). – Candidate species under ESA. – Is specifically covered under a signed conservation agreement (CCA) or a signed conservation agreement with assurances (CCAA). – Recently removed from ESA and currently requires post-delisting monitoring. – Closed season species (i.e., no take permitted) as identified in Arizona Game and Fish Commission Orders 40, 41, 42 or 43.
Reasons for Imperilment Status: Locally abundant and known from 13-16 sites (conflicting literature) but few/very few are thought to have good viability because appropriate habitat within each cienega is generally limited. Springs and cienega wetland habitat loss or degradation is a substantial threat. Destruction of these fragile habitats has historically been caused by livestock overgrazing, groundwater pumping, channel incision, water diversions and other spring developments, timber harvest, drought, mining, recreation and catastrophic fire resulting from altered fire regimes. Many potential suitable sites in the southern half of the Huachuca Mountains have not yet been surveyed for Huachuca springsnail, other potentially suitable unsurveyed habitats exist within the range of the species (USFWS 2001). Because populations are isolated, once extirpated, sites are unlikely to be recolonized without active management. Small populations are also subject to genetic deterioration and demographic variability, which increases the likelihood of extinction. Habitat Comments: Springs and cienegas inhabited by the snail are typically marshy areas characterized by various aquatic and emergent plant species that occur within plains grasslands, oak and pine-oak woodlands, and coniferous forest vegetation communities. The snail typically occupies shallower areas within the cienega, which are often very limited. It is often found in the rocky seep areas at the spring source.

DoD Legacy Project #14-750: Management Recommendations Report for Ft. Huachuca MR
40
Huachuca Springsnail (Pyrgulopsis thompsoni) Spring site, Huachuca Mountains
Scotia Canyon, Huachuca Mountains

DoD Legacy Project #14-750: Management Recommendations Report for Ft. Huachuca MR
41
4.5.1 Results of Predictive Modeling Date model run: 2015-07-01 GIS layer name Pyrgulopsis_thompsoni_tuned.tif
Figure 21. Predictive Distribution of the Huachuca Springsnail in the Apache Highlands Ecoregion of Arizona

DoD Legacy Project #14-750: Management Recommendations Report for Ft. Huachuca MR
42
Figure 22: Predictive Distribution of Huachuca Springsnail The following information accompanies and describes the model and validation measures used to assess the species distribution model for Pyrgulopsis thompsoni. The model was built using 259 input points from 13 polygons for Pyrgulopsis thompsoni (“presence” points) and 204 background, or “absence” points within the species range in Arizona. The environmental conditions at these points, based on 37 environmental variables (Appendix A), were analyzed using the random forests analytic routine, a powerful machine learning algorithm (Breiman 2001), in the R statistical environment (R Development Core Team 2009). This algorithm is especially effective when modeling rare species (Williams et al. 2009, Buechling and Tobalske 2011, Royle et al. 2012), and provides information on which attributes are the most important in explaining each species’ distribution patterns. Our final random forest model used 30 of the original 37 variables (shown in Figure 24). Model accuracy was tested using a cross-validation procedure where a model is built with all but one element occurrence (EO), tested to see if it can predict suitable habitat at that location, and then run and tested again with sequentially different sub-populations held out. Figure 23.a. below shows the

DoD Legacy Project #14-750: Management Recommendations Report for Ft. Huachuca MR
43
averaged results of this cross validation. The area under the ROC curve (AUC) provides a numeric summary of prediction strength. An AUC value of 0.5 indicates a prediction that is no better than random, while values close to one show high prediction accuracy. The AUC value in this model was 1.0 as indicated in Figure 23.b. below.
Figure 23.a. (left) Receiver-operator curve (ROC), illustrating the strength of the cross-validated prediction. This graph estimates the capacity for making accurate predictions for new locations that were not included in the test model. 23.b. (right) Receiver-operator curve (ROC), illustrating the strength of the final model prediction. This graph shows the model’s accuracy at predicting the original input data. Additional accuracy metrics provided in this graph describe the accuracy of a binary prediction generated by applying the cutoff value to the raw model probability prediction. To produce the most effective model, a final model is constructed using all input points. The ROC curve for this final model is provided in Figure 23.b. Expert review was used to determine the most appropriate probability cutoff value for depicting habitat as suitable or not suitable based on the model. The probability cutoff chosen is 0.4 and was based on comparison with known species locations (EOs) and suitable environmental variables, including various temperature and precipitation covers, landform, soils, etc. (Appendix A). Additional validation measures (listed in Figure 23.b.) were completed and confirmed the accuracy of the final model using this selected probability cutoff value (Fielding and Bell 1997). These included: Accuracy (% correctly classified), Sensitivity (How good is the model at detecting known positives? Does it catch all presences, or does it fail to predict some known presences), Specificity (How good is the model at not making false-positive predictions? When it predicts species presence, is the species actually there?), TSS (“True Skill Statistic” This metric combines Sensitivity and Specificity into another formulation of overall accuracy), Kappa (This is yet another way at looking at overall accuracy, addressing whether the model’s confusion matrix indicates that a prediction is ‘better than random’). The environmental variables informing the final model and the relative importance of each for classifying suitable vs. not-suitable habitat are depicted in Figure 24 below. Temperature annual range, landform, temperature seasonality and elevation represented the four most important variables, followed by precipitation wettest quarter, mean diurnal range, annual precipitation,
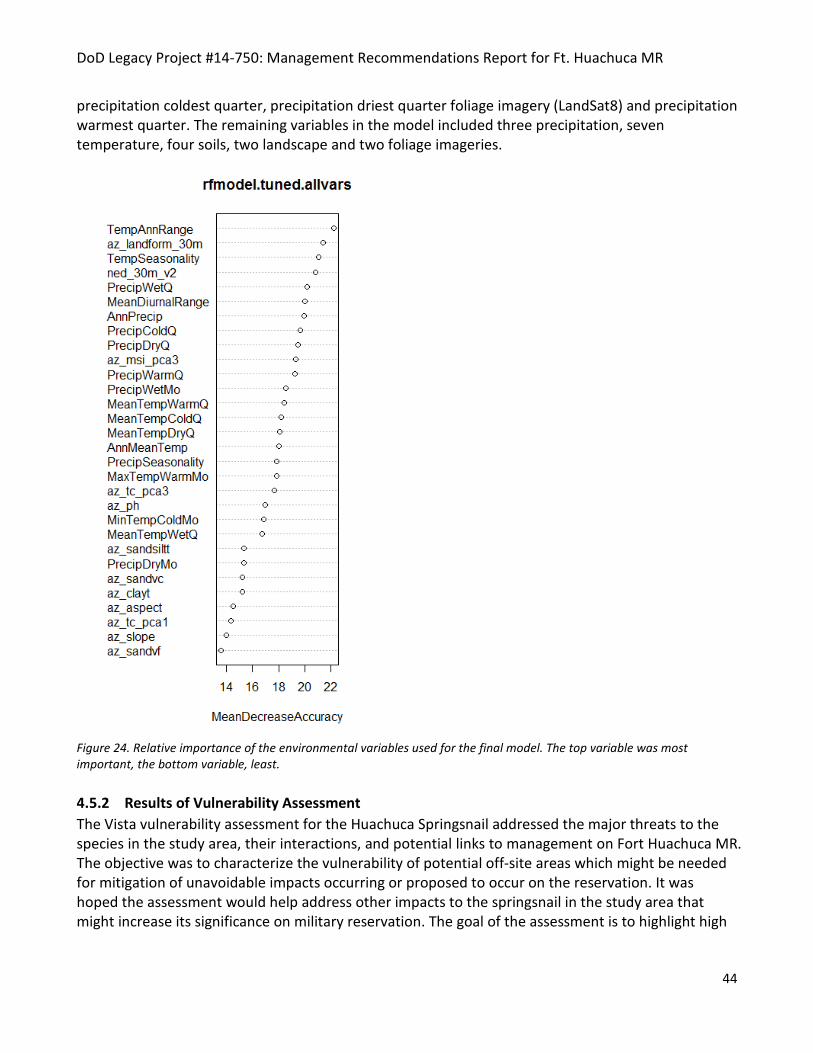
DoD Legacy Project #14-750: Management Recommendations Report for Ft. Huachuca MR
44
precipitation coldest quarter, precipitation driest quarter foliage imagery (LandSat8) and precipitation warmest quarter. The remaining variables in the model included three precipitation, seven temperature, four soils, two landscape and two foliage imageries.
Figure 24. Relative importance of the environmental variables used for the final model. The top variable was most important, the bottom variable, least. 4.5.2 Results of Vulnerability Assessment The Vista vulnerability assessment for the Huachuca Springsnail addressed the major threats to the species in the study area, their interactions, and potential links to management on Fort Huachuca MR. The objective was to characterize the vulnerability of potential off-site areas which might be needed for mitigation of unavoidable impacts occurring or proposed to occur on the reservation. It was hoped the assessment would help address other impacts to the springsnail in the study area that might increase its significance on military reservation. The goal of the assessment is to highlight high
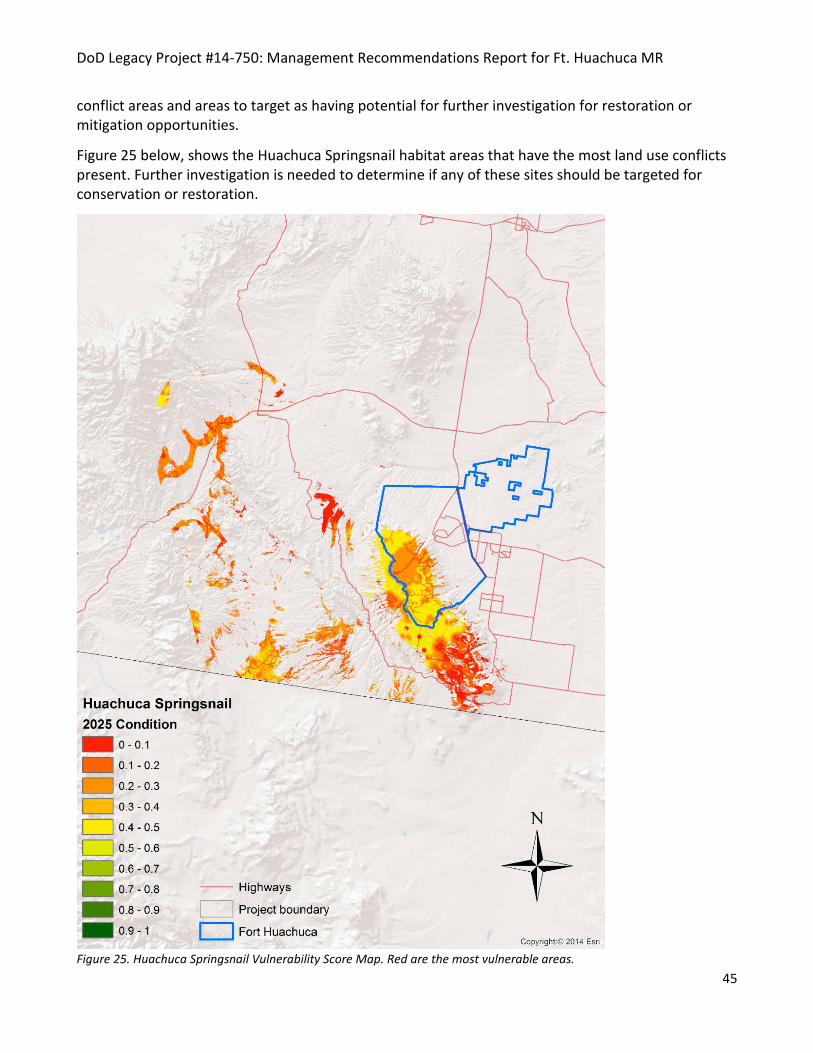
DoD Legacy Project #14-750: Management Recommendations Report for Ft. Huachuca MR
45
conflict areas and areas to target as having potential for further investigation for restoration or mitigation opportunities.
Figure 25 below, shows the Huachuca Springsnail habitat areas that have the most land use conflicts present. Further investigation is needed to determine if any of these sites should be targeted for conservation or restoration.
Figure 25. Huachuca Springsnail Vulnerability Score Map. Red are the most vulnerable areas.

DoD Legacy Project #14-750: Management Recommendations Report for Ft. Huachuca MR
46
4.5.3 Management Recommendations Any management on Fort Huachuca to improve habitat conditions that support productive stable populations of Huachuca Springsnails, could mitigate the impacts for this species off the Fort, e.g. southern and western Huachuca Mountains, Canelo Hills, and San Rafael Valley. The following are some management approaches that could be considered on and around the Fort.
• Maintain inhabited spring-fed wetland habitat: o Reducing the impacts of human activity on wetland vegetation, and ensuring bank
stability and water quality o Protecting the aquifer sources of these wetlands from groundwater pumping, water
diversion, and pollution o Preventing erosion and incision of the stream channel through good land-use practices
or construction of erosion-control structures (NatureServe Explorer 2015) o Maintain suitable firm (rocky) substrates such as pebble, gravel, cobble, and woody
debris • Implement USFWS conservation strategy: USFWS recommends mapping the current
landscape distribution with GIS and further define habitat characteristics, conduct genetic work to clarify the taxonomic relationship between and among all occupied sites, assess threats at finer landscape scales, develop conservation measures to protect habitat, and monitor the species through a comprehensive CCA (USFWS 2014b).
5 CONCLUSIONS
Over the last two decades, there has been an extensive amount of research and inventory of the natural features and important species that occur on the Ft. Huachuca MR.
This project clearly demonstrates that developing range-wide or ecoregion-wide species distribution models (SDMs) can significantly inform both restoration and mitigation opportunities, as well as areas which potentially need to be inventoried for at-risk species. The SDMs can support the REPI program by helping to identify a number of potential off-base mitigation sites, as well as to assist other wildlife and resource agencies in locating sites that can support multiple species of interest. In addition, the vulnerability assessment aids in evaluating long-term threats and viability of target species both on the installation, and more relevantly, for potential off-base areas.
The vulnerability maps help further clarify species habitat areas that have high vulnerability due to incompatible land uses and other stressors, and could be explored for potential locations for conservation, translocation, or restoration. Ft. Huachuca has spent a considerable amount of money to protect the Huachuca water umbel. The vulnerability maps can show if these areas will still have habitat in the future and if additional measures need to be done elsewhere. The Vista decision support system (DSS) has functions to support investigating individual sites and testing proposed actions for benefits and conflicts. Integrating the SDMs and vulnerability assessment into a decision support system that can be used by installation staff has the potential to make assessments relatively simple and routine and also support a number of additional applications as described further below.

DoD Legacy Project #14-750: Management Recommendations Report for Ft. Huachuca MR
47
• Within-installation assessment and management can be supported by proposing site-based actions (either training or land management for example) and receiving immediate reports of conflicts and benefits.
• Complete Installation Resource Management Plans can be created in the DSS that can facilitate meeting training and stewardship objectives while avoiding conflicts between them.
• Offsite/landscape assessments and planning can be conducted to support the Fort’s Sentinel Landscape program and component programs such as Joint Land Use Study and Readiness, Environmental Protection Integration (REPI), and regional multi-agency conservation land use programs.
• While the pilot study did not integrate climate change impacts, the data developed, both in the SDMs and in the NatureServe Vista DSS provide the Army with the opportunity to relatively quickly integrate and explore potential climate change vulnerability of the critical species and the habitats that support them. This can include phased planning to retain viable species populations in their present locations and using mitigation funds to retain climate refugia areas in the future.
The software used in the project to develop the SDM is open source and in the public domain, and Vista is a freely available extension to ArcGIS. These tools can be used for any future assessment and planning needs of the natural resources staff at the Ft. Huachuca MR. SDM models, data, and Vista ArcMap project have been provided to the Ft. Huachuca MR staff, and training in the use of the Vista DSS is available.
6 KEY TERMS The following are key terms and abbreviations used throughout this document.
Conservation Element (CE): This is the generic term used in the decision support system that was used for the vulnerability assessment and conservation strategies. In the case of this project, it refers to the species that were modeled and assessed.
Condition: used interchangeably with Status (see below)
Condition threshold: the minimum condition score an occurrence must achieve to be considered of viable quality.
Indicator: Specific, measurable indicators are used to assess the status of KEAs, and therefore of Conservation Elements
Key Ecological Attribute (KEA): A KEA is a characteristic of a species’ or ecosystem’s biology, ecology, or physical environment that is critical to the resource’s persistence in the face of both natural and human-caused disturbance. The combined condition of KEAs for a species or ecosystem together determine the ecological status of the species or system.
Minimum occurrence size: the area a patch/occurrence must be to be considered viable, subject to condition threshold.
DoD Legacy Project #14-750: Management Recommendations Report for Ft. Huachuca MR
48
Retention goal: this is the amount (percent or quantity) of a species’ distribution that should be retained to maintain a viable amount of habitat in the assessment area, subject to minimum occurrence size and condition threshold.
Scenario or KEA indicator scenario: The aggregation of spatial datasets containing distributions of stressors that, combined, are indicators for the KEAs. Scenarios can also contain features that maintain CE status such as protected areas with conservation land use or compatible management.
Status: ecological status or condition of areas of a conservation element’s distribution based on presumed effects of change agents on the CE
Stressor: These are the features or processes that can negatively impact Conservation Elements (and in some cases can have neutral or beneficial effects on certain Conservation Elements).
Viable/Viability: in this assessment, viability for a species is defined as meeting the retention goal (quantity) of habitat that meets minimum patch/occurrence size requirements and meets or exceeds the condition threshold.
7 LITERATURE CITED Arizona Game and Fish Department. 2012. Arizona’s State Wildlife Action Plan: 2012-2022, SGCN Species of Greater Conservation Need. Arizona Game and Fish Department, Phoenix, Arizona. (http://www.azgfd.gov/w_c/swap.shtml) Arizona Revised Statutes, Chapter 7. 1999. Arizona Native Plant Law. Appendix A. Behler, J.L. and F.W. King. 1979 (reprint 1992). The Audubon Society Field Guide to North American Reptiles and Amphibians. Alfred A. Knopf, Inc. New York. pp 406-407, pl 150. Breiman, L. 2001. Random forests. Machine Learning 45:5-32. Brennan, T.C., A. T. Holycross, 2006. A Field Guide to Amphibians and Reptiles in Arizona. Arizona Game and Fish Department, Phoenix. 152 pp. Buechling, A. and C. Tobalske. 2011. Predictive habitat modeling of rare plant species in Pacific Northwest Forests. Western Journal of Applied Forestry 26 (2): 71-81. Comer, P.J. and J. Hak. 2009. NatureServe Landscape Condition Model. Technical documentation for NatureServe Vista decision support software engineering. NatureServe, Boulder CO. Comer, P. and D. Faber-Langendoen. 2013. Assessing Ecological Integrity of Wetlands from National to Local Scales: Exploring the Predictive Power, and Limitations, of Spatial Models. National Wetlands Newsletter Special Issue on Wetland Mapping and Assessment. Environmental Law Institute. Washington DC. Vol. 35 No. 3 May/June 2013.
DoD Legacy Project #14-750: Management Recommendations Report for Ft. Huachuca MR
49
DeBano, L.H. and D.G. Neary. 1996. Effects of fire on riparian systems. In: Folliott, P.F., L.F. DeBano, M.B. Baker, Jr., G.J. Gottfried, G. Solis-Garza, C.B. Edminster, D.G. Neary, L.S. Allen, and R.H. Hamre, technical coordinators. Effects of Fire on Madrean Province Ecosystems: A Symposium Proceedings. USDA Forest Service, General Technical Report RM-GTR-289, pp. 69-76. Encyclopedia of Life. Available from http://www.eol.org. Accessed 8 Apr 2014. Fielding, A. H. and J. F. Bell. 1997. A review of methods for the assessment of prediction errors in conservation presence/absence models. Environmental Conservation 24:38-49. Flora of North America Editorial Committee, eds. 1993+. Flora of North America North of Mexico. 18+ vols. New York and Oxford. eFloras, http://www.efloras.ofg. Gergus, Erik W., A. Gergus, Tod W. Reeder, Brian K. Sullivan, and M. E. Douglas (2004) Geographic Variation in Hyla wrightorum: Advertisement Calls, Allozymes, mtDNA, and Morphology. Copeia: December 2004, Vol. 2004, No. 4, pp. 758-769. The IUCN Red List of Threatened Species. Version 2014.3. <www.iucnredlist.org>. Downloaded on 8 April 2015. NatureServe. 2015. NatureServe Explorer: An online encyclopedia of life [web application]. Version 7.1. NatureServe, Arlington, Virginia. Available http://explorer.natureserve.org. (Accessed: April 8, 2015). R Development Core Team. 2009. R: A language and environment for statistical computing. 2009. R Foundation for Statistical Computing, Vienna, Austria. ISBN 3-900051-07-0, URL http://www.R-project.org. Royle, J.A., R.B. Chandler, C. Yackulic, and J.D. Nichols. 2012. Likelihood analysis of species occurrence probability from presence-only data for modeling species distributions. Methods in Ecology and Evolution. Wiley: Bognor Egis. ISSN 2041-2096. 10 pp. Sredl, M.J. and E.J. Wallace. 2000. Draft-Management of amphibians on Fort Huachuca, Cochise County Arizona. Nongame and Endangered Wildlife Program Draft Technical Report. Arizona Game and Fish Department, Phoenix, AZ. Tucson Herpetological Society. Accessed 2015 at https://tucsonherpsociety.org/the-inhabitants/ USDA, Forest Service Region 3. 2013. Regional Forester’s Sensitive Species List. USDI, Fish and Wildlife Service. 1985. Endangered and Threatened Wildlife and Plants; Review of Vertebrate Wildlife; Notice of Review. Federal Register 50(181):37963.
DoD Legacy Project #14-750: Management Recommendations Report for Ft. Huachuca MR
50
USDI, Fish and Wildlife Service. 1996. Endangered and Threatened Wildlife and Plants: Review of Plant and Animal Taxa that are Candidates for Listing as Endangered or Threatened Species. Federal Register 61(40): 7596-7613. USDI, Fish and Wildlife Service. 1997. Endangered and Threatened Wildlife and Plants; Determination of Endangered Status for Three Wetland Species Found in Southern Arizona and Northern Sonora, Mexico. Final Rule. Federal Register 62(3): 665-689. USDI, Fish and Wildlife Service. 2007. Endangered and Threatened Wildlife and Plants; Review of Native Species That Are Candidates for Listing as Endangered or Threatened; Annual Notice of Findings on Resubmitted Petitions; Annual Description of Progress on Listing Actions; Notice of Review; Proposed Rules. Federal Register 72(234): 69034-69106. U.S. Fish and Wildlife Service. 2014a. Huachuca water umbel (Lilaeopsis schaffneriana ssp. recurva) 5-Year Review: Summary and Evaluation. Arizona Ecological Services Tucson Sub-Office, Tucson, Arizona. pp 1-59. U.S. Fish and Wildlife Service. 2014b. U.S. Fish and Wildlife Service Species Assessment and Listing Priority Assignment Form. Pp 1-17. Williams, J.N, C. Seo, J. Thorne, J.K. Nelson, S. Erwin, J.M. O’Brien, and M.W. Schwartz. 2009. Using species distribution models to predict new occurrences for rare plants. Diversity and Distributions 15: 565-576.

DoD Legacy Project #14-750: Management Recommendations Report for Ft. Huachuca MR
51
Appendix A. Environmental variables tested in the Random Forest Models Input Source type MeaningAnnMeanTemp.tif Worldclim climate Annual Mean TempAnnPrecip.tif Worldclim climate Annual Precipitationaz_aspect.tif 10m DEM landscape Aspectned_30m_v2.tif 10m DEM landscape Elevationaz_landform_30m.tif 10m DEM landscape LandForm *az_Slope.tif 10m DEM landscape Slopeaz_clayt.tif SSURGO Soil total percent clayaz_silt.tif SSURGO Soil totla percent siltaz_ph.tif SSURGO Soil average phaz_sandc.tif SSURGO Soil total percent coarse sandaz_sandfine.tif SSURGO Soil total percent fine sandaz_sandtotal.tif SSURGO Soil total percent sandaz_sandvc.tif SSURGO Soil total percent very coarse sandaz_sandvf.tif SSURGO Soil total percent very fine sandaz_msi_pca1.tif LandSat8 Imagery 1st priniple component leaf off/green up/leaf on Landsat 8az_msi_pca2.tif LandSat8 Imagery 2nd priniple component leaf off/green up/leaf on Landsat 8az_msi_pca3.tif LandSat8 Imagery 3rd priniple component leaf off/green up/leaf on Landsat 8Isothermality.tif Worldclim climate Isothermality (P2/P7) (* 100)MaxTempWarmMo.tif Worldclim climate Maximum temp warmest monthMeanDiurnalRange.tif Worldclim climate Mean Diurnal Range (Mean of monthly (max temp - min temp))MeanTempColdQ.tif Worldclim climate Mean temp coldest quarterMeanTempDryQ.tif Worldclim climate Mean temp Dryest quarterMeanTempWarmQ.tif Worldclim climate Mean Temp Warmest QuarterMeanTempWetQ.tif Worldclim climate Mean Temp Westest QuarterMinTempColdMo.tif Worldclim climate Minimum Temp Coldest MonthPrecipColdQ.tif Worldclim climate Precipitation Coldest MonthPrecipDryQ.tif Worldclim climate Precipitation Dryest QuarterPrecipDryMo.tif Worldclim climate Precipitation Dryest MonthPrecipSeasonality.tif Worldclim climate Precipitation Seasonality (Coefficient of Variation)PrecipWarmQ.tif Worldclim climate Precipiation Warmest QuarterPrecipWetQ.tif Worldclim climate Precipitation Westest QuarterPrecipWetMo.tif Worldclim climate Precipitation Westest Monthaz_tc_pca1.tif LandSat8 Imagery Tassled Cap PCA1 - leaf off/green up/leaf on Landsat 8az_tc_pca2.tif LandSat8 Imagery Tassled Cap PCA2 - leaf off/green up/leaf on Landsat 8az_tc_pca3.tif LandSat8 Imagery Tassled Cap PCA3 - leaf off/green up/leaf on Landsat 8TempAnnRange.tif Worldclim climate Tempreture Annual RangeTempSeasonality.tif Worldclim climate Temperature Seasonality (standard deviation *100)
* Landform: 1-canyons, deep incised streams, 2-Midslopes, 3-upland drainages, headwaters, 4-u-shaped valleys, 5-plains, 6-open slopes, 7-upper slips, mesas, 8-local ridges, hills in valleys, 9-midslope ridges, small
Related Documents