Department of Chemical and Process Engineering „Engineering from Molecules‟ Catherine A. Biggs Henriette S. Jensen Microbiology in sewer systems

Welcome message from author
This document is posted to help you gain knowledge. Please leave a comment to let me know what you think about it! Share it to your friends and learn new things together.
Transcript

Department of Chemical and Process Engineering
„Engineering from Molecules‟
Catherine A. Biggs
Henriette S. Jensen
Microbiology in sewer systems

Interdisciplinary approach:
Chemical Engineering, Civil Engineering & Microbiology
Funding:
EU FP6 Marie Curie Transfer of Knowledge grant (42444)
Project investigators:
Catherine A. Biggs, Joby B. Boxall, Simon Tait & A. Mark Osborn
Post doctoral fellows:
Sekar Raju, Peter Deines & Henriette S. Jensen
Microbiology in Urban Water Systems (MUWS)
Project


Conveyance system
Public Health

Sewer atmosphere
Bulk water/wastewater
Sewer “wet” biofilm
Sewer “dry” biofilm
Both conveyance system and
ecosystem
Different sewer
ecosystems

Changing nutrient
environment
multicellular
structures
biofilm
planktonic cells
UWS - an Ecosystem
• Complex environment– Biodiversity – who is there, the good, bad and ugly?
– Spatial distribution – where are they? (biofilms, wastewater, solids)
• Internal processes– Cell-cell and cell-environment interactions – what are they doing, who are they
doing it with, group ><individual behaviour?
• External drivers– How do changes in operation (e..g hydraulic conditions, temperature, nutrient
loads) influence biological activity?

Both conveyance system and
ecosystem
Component Concentration Unit
COD 740 gCOD m-3
BOD 350 gBOD m-3
BOD dissolved 70 gBOD m-3
Total Nitrogen 80 g N m-3
Ammonia 50 g N m-3
Nitrate+Nitrite 0.5 g N m-3
Organic Nitrogen 30 g N m-3
Total phosphorous 14 g P m-3
Ortho phosphate 10 g P m-3
Organic Phosphorous 4 g P m-3
Henze et al., 2000

Key Research Questions -Changes in
biodiversity, spatial distribution and
behaviour in engineering context?
Do we have the right
tools?
MUWS

Developing our portfolio of Tools Measurements Techniques

Bacterial type 1
Bacterial type 2
Bacterial type 3Bacterial type 4
Bacterial type 5
Culture based techniques

Habitat Culturability (%)a
Seawater 0.001 - 0.1
Freshwater 0.25
Mesotrophic lake 0.1 - 1
Unpolluted estuarine waters 0.1 - 3
Activated sludge 1 - 15
Sediments 0.25
Soil 0.3
a Culturable bacteria are measured as colony forming units (CFU)
Amann et al. Micro. Rev. (1995)
Culturable bacteria in comparison with
total (microscopic) cell counts

Analytical approaches
Sewer
SolidsBiofilmsWastewater
Community analysis
DNA extraction
T-RFLP DGGE FISH
DNA extraction
Substrate utilization
Overall
Community
profile
Biolog
EcoPlatesTM
Specialised
reactor setups
Detailed
community
composition
Cell counts
identification
Carbon
source
screening
Kinetics and
stoichiometry for
specific substrates

DNA based techniques
DNA extraction kit

Microbial profiling method
High throughput
Reproducible
Semi-quantitative analysis of
the diversity
Overall community profile
Fragment length
Flu
ore
scence inte
nsity
Terminal restriction fragment length polymorphism
(T-RFLP)

Electrophoresis separation method
Possible to get sequences
Provides detailed community
structure and composition
Samples
Denaturing Gradient Gel Electrophoresis (DGGE)
1 2 3 4 5 6

Fluorescence in situ hybridization (FISH)
Amann & Fuchs, (2008)

Analytical approaches
Sewer
SolidsBiofilmsWastewater
Community analysis
DNA extraction
T-RFLP DGGE FISH
DNA extraction
Substrate utilization
Overall
Community
profile
Biolog
EcoPlatesTM
Specialised
reactor setups
Detailed
community
composition
Cell counts
identification
Carbon
source
screening
Kinetics and
stoichiometry for
specific substrates

Substrate Utilisation

Carbon
Category Carbon sources Well
designation
Reference well Water ( no carbon) A1
Carbohydrates β- Methyl-D-Glucoside
i-Erythritol
D-Mannitol
D-Cellobiose
α- D- Lactose
N-Acetyl-D-Glucosamine
D-Xylose
A2
C2
D2
G1
H1
E2
B2
Polymers Tween 40
Tween 80
α- Cyclodextrin
Glycogen
C1
D1
E1
F1
Carboxylic
acids
D-Galactonic Acid Lactone
D- Galacturonic Acid
γ- Hydroxybutyric Acid
D-Glucosaminic Acid
Itaconic Acid
α- Ketobutyric Acid
D-Malic Acid
2- Hydroxybenzoic Acid
4-Hydrxy Benzoic Acid
A3
B3
E3
F2
F3
G3
H3
C3
D3
Phosphorylated
chemicals
Glucose-1-Phosphate
D,L-α- Glycerol Phosphate
G2
H2
Amino acids L-Asparagine
L-Phenylalanine
L-Serine
L- Threonine
Glycyl-L-Glutamic Acid
L-Arginine
B4
C4
D4
E4
F4
A4
Amines Phenylethylamine
Putrescine
G4
H4
Esters Pyruvic Acid Methyl Ester B1
Biolog EcoPlatesTM

Reactor setup
Experimental setup
Hydrogen sulfide
sensor
Oxygen sensor

Analytical approaches
Sewer
SolidsBiofilmsWastewater
Community analysis
DNA extraction
T-RFLP DGGE FISH
DNA extraction
Substrate utilization
Overall
Community
profile
Biolog
EcoPlatesTM
Specialised
reactor setups
Detailed
community
composition
Cell counts
identification
Carbon
source
screening
Kinetics and
stoichiometry for
specific substrates

Results and Applications

Community Profiles within Real
Systems

Sampling
Nantes

DGGE profiles

DGGE profiles

Substrate Utilisation in Lab and Field
Studies

Hydrogen sulphide oxidation

Concrete corrosion
H2SH2S
O2O2H2SO4
Ca(OH)2
CaSO4

Determination of reaction pathway
Possible pathways:
O2/S
O2/S = 0.61

Substrate utilization profiles
Biolog EcoPlatesTM

Future Work
Present / future work
Well monitored catchment
Effect of velocity on the
microbial communities
0
0.5
1
1.5
2
2.5
3
3.5
0 5 10 15 20
Time [h]
Ve
loc
ity
[m
/s]
FM001
FM004
FM012
FM019

Implications
..... various microbiological tools which can be applied to
study the microbial ecology in sewer networks and give
new insight....
• In-sewer processes
• which are dominant and which are in control.
• Dynamic Behaviour
• consequence of and response to pertubations
into the effect of in-sewer processes and potentially
improved risk assessment in the event of sewer
faliures.........

All this MUWS work ...
... will facilitate the sustainable operation and
management of urban water systems into the future,
maximizing water quality performance and minimizing
environmental impact.

Thank you!
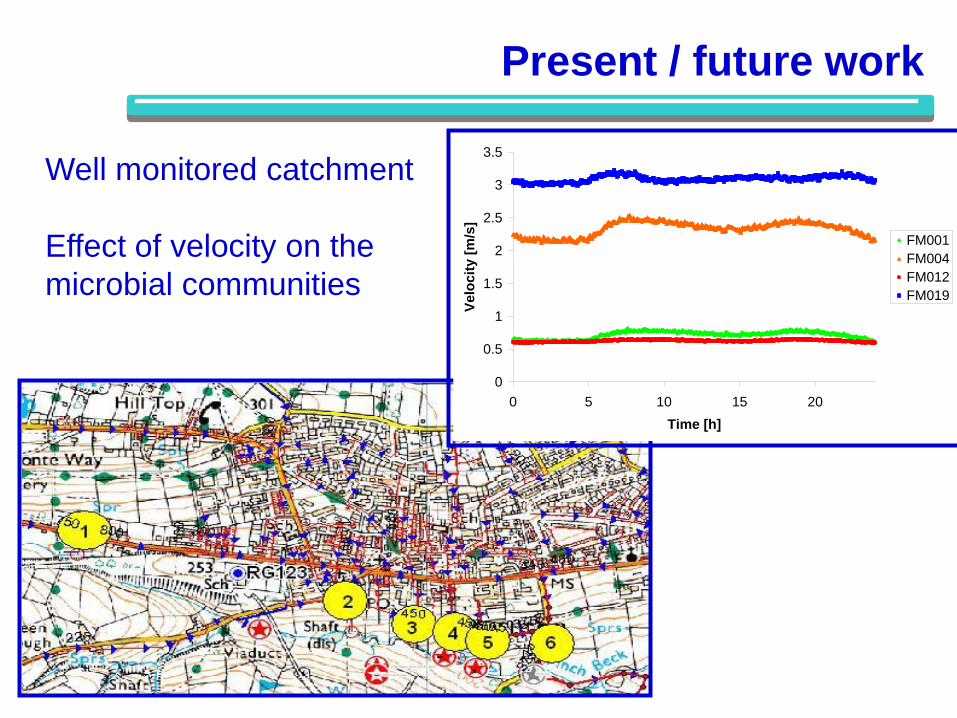
Discussion of
Microbiology in sewer systems
Catherine A. Biggs and Henriette S. Jensen
MUWS is EU funded.
Nutrient concentrations affect in-sewer biological activity. For a catchment with a strong season variation (holiday town or one with a seasonal food processing campaign) the biofilms can take time to acclimate to the changed load, which can in turn affect the dose required for septicity control. Traditional sampling and plating and culture methods find fewer than 1% of the species in most media and at best 15% (page 11), whereas DNA techniques enable understanding or a much broader spectrum of those present.
There was greater similarity of species profile at a site than between site (page 25) but there was difference between sampling times at a particular site. Species profiles at the intertidal zone and the dry zone of a sewer were different.
There is clearly a lot we do not know about in-sewer processes. It is certain that what goes into sewers is not necessarily the same as what arrives at the WwTW, but we do not yet have the knowledge to estimate the dynamics.
____________
Tim Evans presented supporting data that demonstrate the importance of in-sewer microbiology. The municipality reported that there had been no change in septicity or in sewer corrosion. Each sampling event was mid-week so there was no week-day / weekend bias. The paper is currently going through peer review. Recently he has learnt that anammox bacteria have been found in sewer films where they are presumably “protected” by layers of nitrifying bacteria (Nitrosomonas) just as they are in the granular biomass used in the ANAMMOX® catabolic ammonia-denitrification process.

y = -0.0323x + 1600.7R² = 0.0624
0
200
400
600
800
1000
1200
1400
1600
Infl
ue
nt
BO
D7
kg/d
ay
Monthly samples and 12-sample moving average kgBOD/day
y = -0.078x + 7491.9R² = 0.0022
0
4000
8000
12000
16000
20000
Inco
min
g fl
ow
m3/d
ay4-weekly samples and moving 12-sample average flow m3/day
FW
D in
sta
llatio
n
sta
rted
y = -0.0579x + 3225.1R² = 0.0283
0
500
1000
1500
2000
2500
3000
3500
4000
Infl
ue
nt
kgC
OD
/day
y = 12.456x - 24519R² = 0.6996
300
350
400
450
500
550
600
1995 1997 1999 2001 2003 2005 2007 2009
Ave
rage
an
nu
al b
ioga
s m
3/d
ay
FW
D in
sta
llatio
n
sta
rted
WwTW influent monitoring data from Surahammar SE – 4-weekly 24-hour composite samples and the 13 period moving average from Jan’95 to Apr’09. In May 1997 the city offered food waste disposers as one of 3 options for kitchen food waste, by 1998 30% of households had installed FWD, by 2009 50% of households used FWD. There has been no significant change in trade effluent or in domestic population. Flow has not increased nor have the loads of BOD or COD but biogas has increased by more than 40%.

y = -0.0014x + 159.19R² = 0.004
0
50
100
150
200
250
300
Infl
ue
nt
kgN
tot/
day
Monthly samples and moving 12-sample average kgN/day
y = 0.0007x + 42.238R² = 0.0023
0.0
20.0
40.0
60.0
80.0
100.0
120.0
140.0
160.0
Inco
min
g am
mo
nia
lo
ad k
gNH
4/d
ay
y = -0.001x + 51.738R² = 0.0691
0
5
10
15
20
25
30
35
40
45
50
Infl
ue
nt
kgP
tot/
day
The loads of total-N and ammoniacal-N have not increased. The load of P has decreased which is probably because of the contemporaneous phasing out of P in domestic laundry and other products.Results of statistical analysis (Student’s T-test) comparing different periods would be consistent with gradual acclimation of sewer microbiology to the changing sewage composition.(paper in press)
Related Documents