Department of Business Administration I-Shou University Master Thesis The relationship of service quality and the customer satisfaction with ATM service at Vietcombank Advisor : Ph.D CHIAO-PING BAO Advisor : D. NGUYEN QUANG VINH Graduate Student : LE NGOC VU July 2016

Welcome message from author
This document is posted to help you gain knowledge. Please leave a comment to let me know what you think about it! Share it to your friends and learn new things together.
Transcript

Department of Business Administration
I-Shou University
Master Thesis
The relationship of service quality and the customer
satisfaction with ATM service at Vietcombank
Advisor : Ph.D CHIAO-PING BAO
Advisor : D. NGUYEN QUANG VINH
Graduate Student : LE NGOC VU
July 2016

i
ii
Acknowledgement
In fact, my success is contributed by help from teachers, family and friends. With the
deepestgratitude, I would like to thank teachers in the International Department of Hanoi
business and technology University, doctors and professors of I-Shou university who gave
priceless knowledge to us during our study at the University. I would like to thank Mr Pham
Quang Vinh, my teacher and professor Chiao Ping Bao who guided me through my
graduation paper. Without their advices the graduation paper cannot be completed. The essay
“The relationship of service quality and the customer satisfaction with ATM service at
Vietcombank” was fulfilled in 3 months. Due to the limits in my knowledge, mistakes are
inevitable therefore I would like to listen to contributions of teachers and friends to perfect
my knowledge.
iii
Abstract
The purpose of this study is to analysis the relationship of servqual model and
customer satisfaction. There are 369 customers were conducted survey. The regression model
indicates that two variables do not have positive r elationship with customer satisfaction
includes Responsiveness (RS), Assurance (AS) So in this research deleted them in the
regression moll. The other three variables remaining factors have a positive relationship with
customer satisfaction: Reliability, Empathy and Tangible. Also the overall service quality has
a positive relationship with the the customer satisfaction. Beside the study also shows that
there is not significant difference between male and female in customer satisfaction, result
also indicates that customer age, experience and education group do not have different level
of satisfaction. However, The result indicates that customer in different job status and income
have different level of satisfaction.
Keywords: Service quality, Servqual model, Customer satisfaction, Vietcombank

iv
Table of Contents
Acknowledgement .................................................................................................................... ii
Abstract ..................................................................................................................................... ii
Table of Contents .................................................................................................................... iv
List of Tables ........................................................................................................................... vi
List of Figures ......................................................................................................................... vii
Chapter I INTRODUCTION .................................................................................................. 1
1.1 Background .................................................................................................................... 1
1.2 Research objective ......................................................................................................... 2
1.3 Research question .......................................................................................................... 2
1.4 Implication of research ................................................................................................. 3
Chapter II. LITERATURE REVIEW ................................................................................... 4
2.1 Overview of service quality .......................................................................................... 4
2.1.1. Service concept ....................................................................................................... 4
2.1.2 The characteristics of the service: ........................................................................... 4
2.2 ATM Banking service ................................................................................................... 5
2.2.1 Concept of ATM service ......................................................................................... 5
2.2.2. Classification of payment cards .............................................................................. 5
2.2.3. Bank card services .................................................................................................. 6
2.3 Service Quality and customer satisfaction in ATM banking service........................ 6
2.3.1 Service quality concept ............................................................................................ 6
2.3.2 The concept of service quality of ATM card ........................................................... 7
2.4 The relationship between service quality and customer satisfaction ....................... 7
2.5 Service Quality model ................................................................................................... 8
2.6 Research model and hypothesis ................................................................................... 8
Chapter 3: RESEARCH METHODOLOGY ...................................................................... 10
3.1. Research design .......................................................................................................... 10
3.1.1. Selection of research models ................................................................................ 10
3.1.2. Questionnaire Design Process .............................................................................. 10
3.1.3. Variable construct ................................................................................................. 10
3.2. Sample ......................................................................................................................... 12
3.3 Methods of analysis ..................................................................................................... 12

v
3.3.1. Descriptive statistics ............................................................................................. 12
3.3.2. Scaling .................................................................................................................. 12
3.5.3. Factor analysis ...................................................................................................... 12
3.3.4. Analysis of variance ............................................................................................. 13
Chapter IV DATA ANALYSIS ............................................................................................ 14
4.1 Respondent profile. ..................................................................................................... 14
4.2. Reliability Analysis ..................................................................................................... 15
4.3 Factor analysis ............................................................................................................. 16
4.4 Variables correlation................................................................................................... 18
4.5 Regression .................................................................................................................... 20
4.5.1 The impact of service quality factors on customer satisfaction............................. 20
4.5.2 The impact of overall service quality factors on customer satisfaction ................ 23
4.6 Anova – t-test result .................................................................................................... 24
Chapter V CONCLUSION AND RECOMMENDATION ............................................... 29
5.1 Conclusion .................................................................................................................... 29
5.2 Recommendation ......................................................................................................... 30
5.3 Implication of research ............................................................................................... 31
5.4 Limitation and future research .................................................................................. 31
Reference ................................................................................................................................ 33
Appendix:................................................................................................................................ 35

vi
List of Tables
Table 3.1 Variables and items. .............................................................................................. 10
Table 4.1: Respondent profile ............................................................................................... 14
Table 4.2 Cronbach's Alpha result ....................................................................................... 15
Table 4.3. KMO and Bartlett's Test for the independent variables .................................. 16
Table 4.4. Factor analysis results of the independent variables ........................................ 16
Table 4.5 Rotated factor matrix of the independent variables ......................................... 18
Table 4.6 Variable correlation .............................................................................................. 19
Table 4.7. Model summary variable regression .................................................................. 20
Table 4.8. ANOVA result of Multiple variable regression model ..................................... 20
Table 4.9 Multiple variable result ........................................................................................ 21
Table 4.10 Model Summary .................................................................................................. 21
Table 4.11 ANOVA ................................................................................................................ 22
Table 4.12 Multiple variable result ...................................................................................... 22
Table 4.10 the summary of regression model of overall service quality and customer
satisfaction .............................................................................................................................. 23
Table 4.11. ANOVA of overall service quality and customer satisfaction ........................ 23
Table 4.12 The regression of overall service quality and customer satisfaction .............. 24
Table 4.13 Differences between gender and customer satisfaction ................................... 25
Table 4.14 The differnent of customer satisfaction among age group .............................. 25
Table 4.15 The differnent of customer satisfaction among Experience in using ATM .. 26
Table 4.16 The differnent of customer satisfaction among Education level ..................... 26
Table 4.17 The differnent of customer satisfaction among job status .............................. 26
Table 4.18 Post hoc test of differnent of customer satisfaction among job status .......... 27
Table 4.19 The differnent of customer satisfaction among income per month ................ 27
Table 4.18 Post hoc test of differnent of customer satisfaction among income ............... 28

vii
List of Figures
Figure 2.1 Research frame work ............................................................................................ 9

1
Chapter I INTRODUCTION
1.1 Background
In terms of the current economic integration, the development of high quality services has
created superiority and tremendous competitive advantage. All sectors themselves are huge
transformation economy before such conditions integration. Previously a number of sectors in
the economy have not paid adequate attention to develop their own competitive advantages,
the day before individual conditions of each enterprise integration need to find a foothold in
the minds of consumers to be able to continue to stand firm in the competitive environment of
economic integration. In order to have a foothold in the consumer's mind the need for
enterprise business strategy of their own. One thing is undeniable though businesses operating
in the manufacturing or commercial enterprise, the service issue a very important issue as well
as a decision on the status of the business to customers. Especially for those companies that
are operating in the financial sector such as banking industry because of this huge decision for
the development of the economy.
The activities of non-cash payments in Vietnam have been many positive changes; have a
faster growth rates; creating a change in awareness, habits of citizens and businesses; meet the
needs of economic development (Adger, 2010). Notably, active bank card payments are
increasingly important contribution, is favored by usability and convenience brought. More
than 10 years ago, ATM is still a new payment facility to customers in Vietnam (Trung,
2011). However now a day, there are a big number of cards issued in the bank. According to
statistics of the State Bank (2015), as of June 2014, more than 50 organizations registered
credit card issuer with more than 70 million cards issued. As assessed by a market research
company Research & Markets in US, Vietnam card market is the most dynamic market in the
world and is entering the race to win the market competition between domestic banks and the
banks out. According to Blecher, Liber, Ross and Birckmayer, (2013), the Vietnam card
market will maintain growth of two digits in the next year. This is confirmed the quality of
ATM services will be the determining factor of success or failure of e-commerce.
Bank cards continue to be a multi-purpose means of payment, utilities, being commercial
banks (CBs) focused on development, with rapid growth. By the end of the month 03/2013,
there were 52 organizations registered to issue cards, the number of cards issued by 48
organizations reach over 57.1 million cards (up 38.5% compared to end of 2011) with about
378 card brands, including most of the debit card (accounting for 93.6%), credit cards (3.1%);
Bank card services help banks develop more channels to raise capital and develop more
2
value-added services with many different utilities provided to customers (State Bank, 2015).
Besides the development of the number of cards, commercial banks increasingly interested in
improving the quality of services by increasing the ability to pay for cardholders through the
issuance of co-branded payment cards and multi-application links with other organizations,
such as schools, taxi companies, airlines ...; focus on increased safety, security of payment
cards such as chip technology applications and the issuance of payment cards, such as issuing
and accepting EMV chip card payment.
In recent years, some research has focused research on substances ATM services. It is
constantly researching the following: The study "Quality of service, satisfaction and loyalty of
clients at the private bank in Ethiopia" (Banking service quality, customer satisfaction &
loyality in Banking Sector Ethiopian) of the author Sata Mesay Shanka conducted in Ethiopia
in 2012. The aim of the study is to measure the service quality of private banks in Ethiopia,
while investigating the relationship between service quality and satisfaction, loyalty the
client's. In the Journal of Business Science from the University of Commerce, the study
"Assessing the quality of retail services of commercial banks and customer satisfaction based
on the model Servperf". The authors Pham and , Nguyen (2014), University of Economics -
National University, have used the model as the basis Servperf to build the scale and find out
the relationship between service quality and employee satisfaction. However, studies have
focused research on service quality or overall retail service quality rather than insist on a
specific aspect of ATM service quality. In addition, This paper studies a different problem is
the quality of service at VietcombankATM cards and use SERVQUAL model for developing
the research model.
1.2 Research objective
On the theoretical of service, quality of service, the service model, these factors should affect
the customer satisfaction, this study have the flowing objective:
- Identification of factors that measure the quality of service measurement of
VietcombankATM card and the satisfaction of the customers using the ATM services.
- Building a model research quality of VietcombankATM services.
- Construction and adjustment scale of VietcombankATM services.
- Evaluation of customer satisfaction about service quality of VietcombankATM
1.3 Research question
To obtain the research objective the research questions (RQ) were listed in below.
- Is there any relationship between tangible factor and customer satisfaction about
service quality of VietcombankATM
3
- Is there any relationship between reliability factor and customer satisfaction about
service quality of VietcombankATM
- Is there any relationship between responses factor and customer satisfaction about
service quality of VietcombankATM
- Is there any relationship between assurance factor and customer satisfaction about
service quality of VietcombankATM
- Is there any relationship between empathy factor and customer satisfaction about
service quality of VietcombankATM
- Is there any relationship between overall service quality and customer satisfaction
about service quality of VietcombankATM
- Are there any difference among customer demographic with the level of customer
satisfaction about service quality of VietcombankATM ?
1.4 Implication of research
This research will help to complete of defining a full and accurate the factors that impact
on the quality of the ATM services, from this research result the bank will have the right
to improve the service quality and customer satisfaction. In addition, on the basis of the
study, the authors propose a number of measures to improve the quality of
VietcombankATM services.
4
Chapter II. LITERATURE REVIEW
2.1 Overview of service quality
2.1.1. Service concept
According to Zeithaml (2000): "Service is the act, process, and how to perform a certain task
in order to create value for customer to satisfy the needs and expectations of customers ".
According to Kotler and Armstrong (2004): "Services are activities or benefits that businesses
can offer to customers to establish, strengthen and extend the relations and long-term
cooperation with customers";
In summary, there are many concepts of speech services under different angles but overall
achievements are: Service operation is intended to meet certain needs of man. Characteristics
of the service is non-existent in specific product types (tangible) such goods directly but it
serves certain needs of society.
2.1.2 The characteristics of the service:
Service has features that distinguish compared to commodities. That is the characteristic:
invisibility, emptiness separation between supplier and consumer calculated uneven quality, not
spare, no change of ownership calculation as noted in the research of Schulz and Brenner, (2010).
- Invisible
Goods with shape, size, color and even smell. Customers can review, evaluate whether it is
appropriate for my needs. Conversely, identifiable intangible service, making the customer's
senses are not aware of before purchasing service. This is a big problem when selling a
service considering selling a tangible commodity, because service demanding customers try
before buying, feel the quality is difficult, hard to choose
- Integral between supplier and consumer
Goods are produced concentrated in one place, and then transported to where they are needed.
When out of the production line, the merchandise is complete. Such, manufacturers can
achieve economies of scale by concentrating production, batch, quality management and
product focus. Manufacturers also can produce when convenient, and then stored in
warehouses and sell them when the need arises. Therefore, they are easy to implement supply-
demand balance. But the process of providing the service: Service providers and customers
have contact with each other to provide and consumer in the place and time that works for
both parties. For some of the Services, the customer must be present during the process of
providing service.

5
- Uneven in quality
Service cannot be provided in bulk, concentrated as commodity production. Therefore,
suppliers difficult quality control according to a uniform standard. On the other hand, the
customer's perception of service quality strongly affected by the skills, attitudes provide.
Health, the enthusiasm of the staff in the morning and the afternoon may vary. Therefore,
difficult to achieve uniformity in quality within a day.
- Non-reserve
Service only exists at the time it is offered. Therefore, service cannot mass production to take
on stocks, while market demand is for sale.
2.2 ATM Banking service
2.2.1 Concept of ATM service
Currently, the world has a lot of the concept of payment cards, each different wording to
highlight a certain content of payment cards in Vietnam, the concept of payment cards
stipulated in Article 2 Regulation issuing, billing, usage and service providers supporting agro
bank cards, issued together with decision No. 20/2007 / QD-NHNN dated 15/05/2007 of the
Governor of the State Bank Vietnam countries, namely: bank cards are those issued by issuers
of cards issued to perform card transactions under the conditions and terms agreed by the
parties. From the perspective of consideration, the different studies were presented with the
concept of different cards. But in short, the natures of the card as a means of payment,
payment of which the user can use to meet the needs of its consumers, including cash
withdrawals or use it as a tool to implement the automated services by banks or other credit
institutions provide. Card is the currency incomplete; it is a symbol of the commitment of the
bank or issuer of payment protection funds used by the cardholder's bank cash card holder's
loan or the card holder was deposited in the bank (Sullivan, 2002).
Thus, in view of the thesis can summarize the concept of the card as a means of non-cash
payments are issued by banks, financial institutions or companies. Card is used to pay for
goods and services without using cash. NE card is also used to withdraw cash at
correspondent banks or automated teller machines. The amount of payments or draw to stay
within the balance in deposit accounts or credit limit granted under the agreement signed
between the bank that issued the card and the cardholder. Besides, the card is also used to
perform useful services through automated trading systems at ATMs.
2.2.2. Classification of payment cards
As research of Inotay, Parragh, Barkoczy, Kokovai, Fuko, Kapitany, and Lipcsei, (2003)
payment cards is cassified in to 03 categories: 1) Embossing Card; Magnetic Stripe; EMV
chip card standards (abbreviated as chip cards - smart cards). 2) Divided by entities issuing 02
6
Category: Cards issued by banks and held by non-card-issuing bank. 3)Classification
according to the territorial scope of use there are 02 kinds of cards: Debit Card and Card
International NIA. 3) Analysis on the nature of payment cards in 03 categories: Credit card;
Debit Card and Prepaid Card
2.2.3. Bank card services
In the research of Bounie, and François, (2006), bank card services are considered the
possibility of a customer can perform payment transactions, transfers, withdrawals, statement
printing, at any automated teller machine of the bank that customers without having to deal
with bank employees. Characteristics of bank card services include: Card Services is based on
a modern technology platform, Bank card service is a package of products and services, thus
requiring the bank to regularly supplement and improve service quality. Bank card services
include: Withdraw cash, Transfer, Payment and Paying via account
In addition to the most basic services, when customers use ATMs, banks also provide other
services such as query account information, check balances, transaction statement printing, ...
2.3 Service Quality and customer satisfaction in ATM
banking service
2.3.1 Service quality concept
Zeithaml (1988) explains: The quality of services is customer appreciation for the great super
Vietnam and the whole of an entity. It is a kind of attitude and the result from a comparison
between what was expected and our perception of things get. Lewis and Booms said service is a
measure of the level of service given to the customer matches the expectations of customers. The
creation of a quality service to meet the expectations means customers a uniform way. According
Lehinen (1982): Quality of service must be assessed on two aspects: (1) the process of providing
services, (2) the results of the service. Grönroos (1984) also suggested that the two aspects of
quality of service: (1) the technical quality and (2) functional quality. Related technical quality of
what should be the quality of service and voice functions are served like.
Zeithaml, Berry and Parasuraman (1988) the security quality of service means that the gap
expected product and customer service awareness, sense when using their products and
services through the hatch. Parasuraman, Berry, and Zeithaml, (1991) explains that to know
the predictions of the best customers is to identify and understand their expectations. The
development of system-defined expectations is essential. And right after that we have a
quality strategy for effective service. This can be considered as the most general concept,
covers the full meaning of service customer standpoint, the customer is the center.

7
The evaluation of quality of service to be a difficult problem because the service is invisible,
they together heterogeneous and they are inseparable. For a long time, many researchers have
tried to define and measure service quality, so there are many different approaches to the
quality of service. There authors suggest that the quality of service that meets the needs and
expectations of customers. Meanwhile, other researchers believe that customer satisfaction is
the main difference between the consumer feel that service and their expectations prior to the
service. And Parasuraman, Zeithaml, and Berry, (1988) argued that "Quality of service is the
gap between customer expectations and their perception when used through service". This is a
concept widely accepted.
In the research scope of this study with a view towards quality customer service is meant to
meet the expectations of customers, satisfy customer needs. Therefore, quality of service is
determined by the customer when service providers meet the needs of customers.
2.3.2 The concept of service quality of ATM card
Quality of service is the ability to respond cards ATM services to the expectations of
customers using ATMs, or in other words it is the entire operation, the added benefit that
the bank gives customers to establish, consolidate and expand long-term partnerships with
customers through creating customer satisfaction (Passas, Paskalis, Vali and
Merakos,1997).
The track, to fund implementation, maintenance, maintenance of bank ATM was done more
often; time troubleshooting, process and answer inquiries complaint be shortened; ATM
networks more reasonable allocation; reduce overcrowding at the ATM ... Card Services helps
banks develop retail banking services, giving people the ability to access and use the utility's
financial services and banking contributing to the development-oriented non-cash payments.
2.4 The relationship between service quality and customer
satisfaction
Many practical study of the relationship between service quality and customer satisfaction.
Cronin and Taylor (1992) has tested this relationship and concluded that the perceived quality
of service leads to customer satisfaction. Studies have concluded that the quality of service is
the money to the satisfaction (Cronin and Taylor, 1992; Spreng and Mackoy, 1996) and is the
main factor affecting satisfaction compression.
Motto of the company is to satisfy the business needs of the customer because the customer is
the source of revenue and profits of the company. When customers are satisfied with the
services or goods of the company, the ability to continue shopping they buy high. Moreover,
when they meet, they tend to speak well of the company's services to other customers.

8
Satisfaction of consumers for services is emotional for companies providing services based on
each contact or transaction with that company (Bitner and Hubbert, 1994).
Quality of service and satisfaction, but two different concepts, but closely related to each
other in the study of service (Parasuraman et.al , 1988). The former make research showed
that quality of service is the cause of satisfaction (eg Cronin & Taylor, 1992). The reason is
related to the quality of the service provided while satisfaction evaluation only after the use of
such services. If quality entertainment experience improved but not based on the needs of the
customer, the customer will never be satisfied with the service. Therefore, when using the
service, if customers perceive high quality services, they will be satisfied with the service.
Conversely, if customers perceive low quality services, then the dissatisfied will appear.
2.5 Service Quality model
SERVQUAL model (Parasuraman, 1988) is a model of service quality research dissemination
and application of most of the EFA marketing research. According to Parasuraman, quality of
services in general cannot identify which depends on the customer's perception of service and
the feeling that this is a review of many factors. SERVQUAL hard carriage model built on
quality of service perspective feel that the comparison between the expected value,
expectation (expectation) and the value customers perceive (Perception).
SERVQUAL consider two main aspects of service quality service is the result (outcome) and
service providers (process) was studied through twenty two scales of five criteria: credibility
(reliability) , efficiency in service (responsiveness), the tangible (tangibles), assurance
(assurance) and sympathy (empathy).
2.6 Research model and hypothesis
This chapter presents the theoretical basis of the ATM, service quality and customer
satisfaction when using ATMs of Vietcombank. Quality of service depends on the distance
between the level of internal customer expectations with service and their perceived level of
service. There are many models of quality of service measurement: SERVQUAL model
consists of five major components, such as component reliability, efficiency in service
sectors, tangible media components, component service capability, component sympathy.
Quality of service modeled technical quality and functional quality has two components:
technical quality and functional quality. Based on studies of model quality banking services,
the authors come up with research models VietcombankATM services.

9
Reliability
Responsiveness
Tangibles
Assurance
Empathy
Customer
satisfaction
Customers demographic
H1
H2
H3
H4
H5 H7
Figure 2.1 Research frame work
To obtain the research questions this thesis develops the hypothesis were listed in below.
- H1: there is a relationship between tangible factor and customer satisfaction about
service quality of VietcombankATM
- H2: there is a relationship between reliability factor and customer satisfaction about
service quality of VietcombankATM
- H3: there is a relationship between responses factor and customer satisfaction about
service quality of VietcombankATM
- H4: there is a relationship between assurance factor and customer satisfaction about
service quality of VietcombankATM
- H5: there is a relationship between empathy factor and customer satisfaction about
service quality of VietcombankATM
- H6: there is a relationship between overall service quality and customer satisfaction
about service quality of VietcombankATM
- H7: there are differences among customer demographic with the level of customer
satisfaction about service quality of VietcombankATM .
10
Chapter 3: RESEARCH METHODOLOGY
3.1. Research design
3.1.1. Selection of research models
To make a survey, the authors selected models perceived service quality was building based
on SERVQUAL model (Parasuraman et al, 1985).
3.1.2. Questionnaire Design Process
The design phase questionnaire:
The questionnaire was designed and tested through a number of stages to ensure that the
information needed to collect reliable service of process data analysis. Develop questionnaire-
based raw information to be collected in the theoretical model and the relevant prior studies.
In this step the author also consult experts.
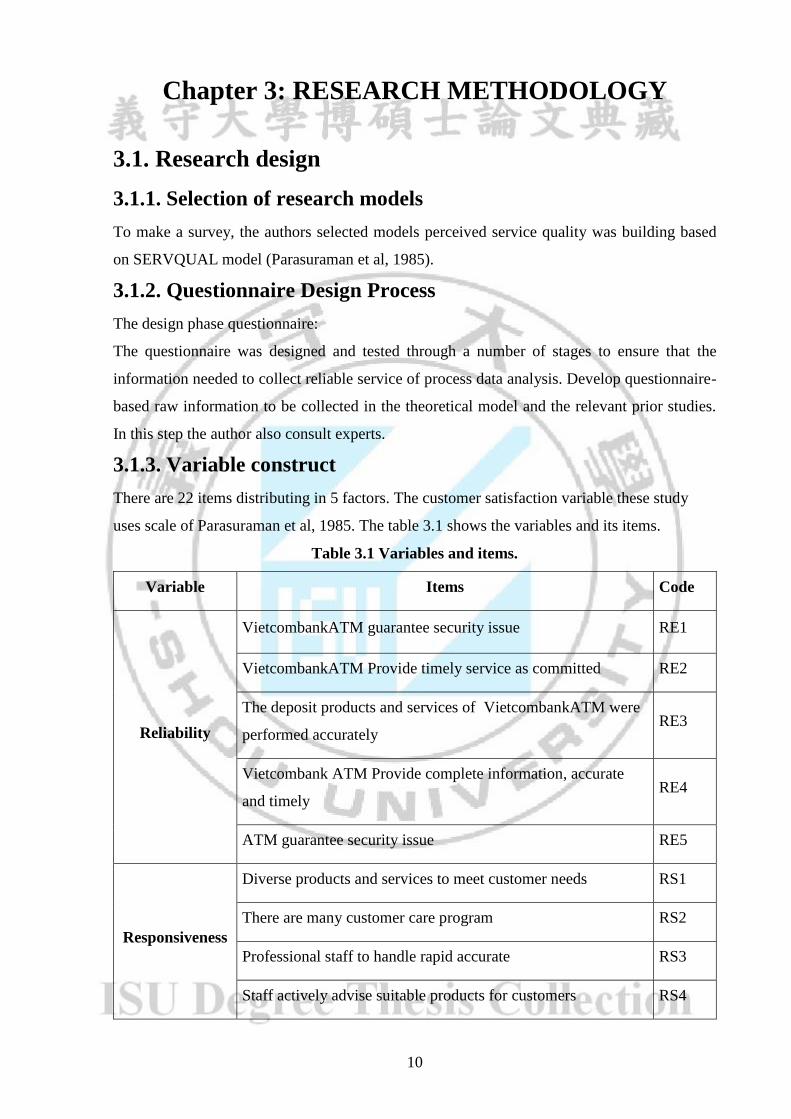
3.1.3. Variable construct
There are 22 items distributing in 5 factors. The customer satisfaction variable these study
uses scale of Parasuraman et al, 1985. The table 3.1 shows the variables and its items.
Table 3.1 Variables and items.
Variable Items Code
Reliability
VietcombankATM guarantee security issue RE1
VietcombankATM Provide timely service as committed RE2
The deposit products and services of VietcombankATM were
performed accurately RE3
Vietcombank ATM Provide complete information, accurate
and timely RE4
ATM guarantee security issue RE5
Responsiveness
Diverse products and services to meet customer needs RS1
There are many customer care program RS2
Professional staff to handle rapid accurate RS3
Staff actively advise suitable products for customers RS4

11
Variable Items Code
Assurance
Staff ready to serve and assist customers AS1
Resolve complaints quickly and rational AS2
Guide to procedures for clients fully understandable AS3
The staff is professional and qualifications AS4
Empathy
Enthusiastic, considerate and fun staffs EM1
Employees interested in the individual requirements of the
customer EM2
Always listen to customers EM3
Always polite, friendly customer EM4
Tangible
The location of transaction is convenience and in accordance
with customer needs TA1
Spacious transaction, using modern technology TA2
Nice layout of the counter, identifiable for Customers
reasonable TA3
The staff dresses polite TA4
Paper forms to be used in transactions were designed easily TA5
Customer
satisfaction
VietcombankATM offers more benefits than my cost CS1
VietcombankATM is the best among competing banks CS2
VietcombankATM is much better than what I expected CS3
Overall I satisfied with service of Vietcombank CS4
Likert scale was used to measure the perceived level of customer and their satisfaction about
the quality of ATM services, which from 1 "strong disagree ' to 5 “'strong agree”. The survey
was conducted customers during the period from May to July, 2015 in Hanoi.

12
3.2. Sample
Population: The purpose of the study was to assess the level of customer satisfaction of with
ATM of Vietcombank. So the study sample was identified as customer who are using ATM
service of Vietcombank
First samples taken at random from 200 to 400 samples, then based on the standard deviation
and inference to determine the samples to be taken. Within the scope of this study with
resource limitations, the authors selected sample size was 400 The questionnaire will be
delivered to customers .
3.3 Methods of analysis
The data collected are cleaned and analyzed with the aid of SPSS software using analytical
methods. Include:
3.3.1. Descriptive statistics
Samples collected will be conducted in accordance with the statistical classification variables.
The basis for classification include: Gender, age, education, work placements and work
experience. Also scoring average, maximum value, minimum value and standard deviation of
the answers in the questionnaires collected.
3.3.2. Scaling
Factors inspection is done by Cronbach`s Alpha scales. These variations are observed not
guarantee minimum reliability will be removed from the scale and does not appear in the
analysis of factors. In this study, Cronbach's alpha coefficient was taken as the minimum at
0.6. Variables Cronbach's alpha coefficient of less than 0.3 is considered junk variable.
3.5.3. Factor analysis
After the observed variables were tested using Cronbach's Alpha scale, they will be included
in the explore factor analysis (EFA). Factor analysis will help authors observed variables
collapsed into more significant variables in explaining the research model.
Some standards apply when analyzing EFA research as follows:
- Inspection of the suitability of factor analysis of sample data via the KMO. If
greater than 0.5, the KMO factor analysis is appropriate, whereas if the value is
less than 0.5 KMO factor analysis method is not appropriate.
- The number of factors: The number of factors that are determined based on the
index eigenvalue represent the fraction of variation explained by each factor.
- The Explained variance criteria: Total variance extracted must be greater than 50%.
- Criticized coefficient method Principal components factor with Varimax rotation to ensure
that the amount is the smallest factor.
13
3.3.4. Analysis of variance
For the test of the difference between the overall research expertise this study use T-test and
analysis of variance (ANOVA), testing is also used to directly compare the value p-
corresponding value. To consider the difference occurs in the category involving three or
more groups are using Post Hoc Test by Tukey to assess value.
To test the relationship among factors and job satisfaction of employees in the research
model, this study is using methods of correlated with the correlation coefficient "Pearson
correlation coefficient", that is denoted by "r ". Values in the range between -1 ≤ r ≤ 1.
If r> 0 expressed positively correlated. Conversely, r <0 represents the inverse correlation.
Value r = 0 indicates that the two variables do not have a linear relationship.
1: The relationship between the two variables tighter
0: the relationship between two variables as weak
The level of significance "sig" of the correlation coefficient, as follows:
- <5%: fairly tight correlation
- <1%: very tight correlation
The next step, using methods of multiple linear regression to determine the meaning and
linear correlation of the variables in the model.

14
Chapter IV DATA ANALYSIS
4.1 Respondent profile.
Total number of questionnaires to be given under the sample size is 400 votes, earning 380
votes, of which 369 valid votes (97%); there were 11 Invalid questionnaires (3%) due to lack
of information. Valid questionnaires reached 97% rate of the sample size.
Data collected after the design, coding and data entry via SPSS 22.0 software. Table 4.1
shows the Respondent profile
Table 4.1: Respondent profile
Frequency Percent
Valid
Percent
Cumulative
Percent
Gender Male 198 53.7 53.7 53.7
Female 171 46.3 46.3 100.0
Total 369 100.0 100.0
age > 20 year old 15 4.1 4.1 4.1
20 - 35 year old 138 37.4 37.4 100.0
36 - 50 year old 176 47.7 47.7 62.6
< 50 year old 40 10.8 10.8 14.9
Total 369 100.0 100.0
Experience >1 year 69 18.7 18.7 18.7
1 - 5 year 111 30.1 30.1 48.8
< 5 year 189 51.2 51.2 100.0
Total 369 100.0 100.0
Education Master or more 31 8.4 8.4 8.4
Bachelor 193 52.3 52.3 60.7
Below bachelor 145 39.3 39.3 100.0
Total 369 100.0 100.0
Job status officer 202 54.7 54.7 54.7
Business 142 38.5 38.5 93.2
retire 25 6.8 6.8 100.0
Total 369 100.0 100.0
Income <250 USD 5 1.4 1.4 1.4
250 - 500 USD 37 10.0 10.0 11.4
501-750 USD 161 43.6 43.6 55.0
751-1000 USD 131 35.5 35.5 90.5
> 1000 USD 35 9.5 9.5 100.0
Total 369 100.0 100.0
From the table 4.1 the result shows that, there are 53.7 % customer in this study is male and
15
female is 46.3%. Related to age of customer, the result shows that customers below 20 year
old is 4.1% , from 20 - 35 year old is 37.4, 36 - 50 year old is 47.7 count for the young age of
customer in this study and customer who is over 50 year old is 10.8%.
In this study, the ATM card using experience of customer is also asked, the result indicate that
customer who have lest than 1-year experience is 18.7%, from 1- 5 years experience is 30.1%
and the biggest number is belong to more than 5 year with 51.2% indicates long time
experience of customer in this study.
Related to education of customer, this study shows that people who have Master or more is
8.4%, customers who have Bachelor degree is 52.3% and Below bachelor degree is 39.3%.
Total 369 customer who is surveyed, there are 54.7% is officer, customer who is working in
business area is 38.5% and customer who is retired counted for 6.8%
This study also conduct the survey related to customer income per month, from the table 4.1
show that customer who has < USD is 250 just 1.4%, from USD 250 - 500 is 10%, the
biggest number in this study is customer who has USD 501-750 and the second is customer
who get income per month with USD 751-1000 counted for 35.5% and > 1000 USD 9.5%. is
4.2. Reliability Analysis
According to Nunnally and Bernstein (1994), the scale research should be a preliminary
assessment by Cronbach's alpha coefficient. Cronbach's alpha coefficient of variation value in
the range [0-1]. Cronbach's alpha coefficient as high as possible, however if Cronbach's alpha
coefficient is too large (> 0.95) showed more variation in scale no different from each other.
Scale reliability Cronbach's Alpha well as variability in the range of 0.70 to 0.80. If
Cronbach's Alpha is > = 0.60 is acceptable scale in terms of reliability. The variables used
Cronbach's alpha measure correlation coefficient of total variable> = 0.30 is satisfactory, if a
variable has a correlation coefficient of total variation <0.30, the variable measuring
unsatisfactory.
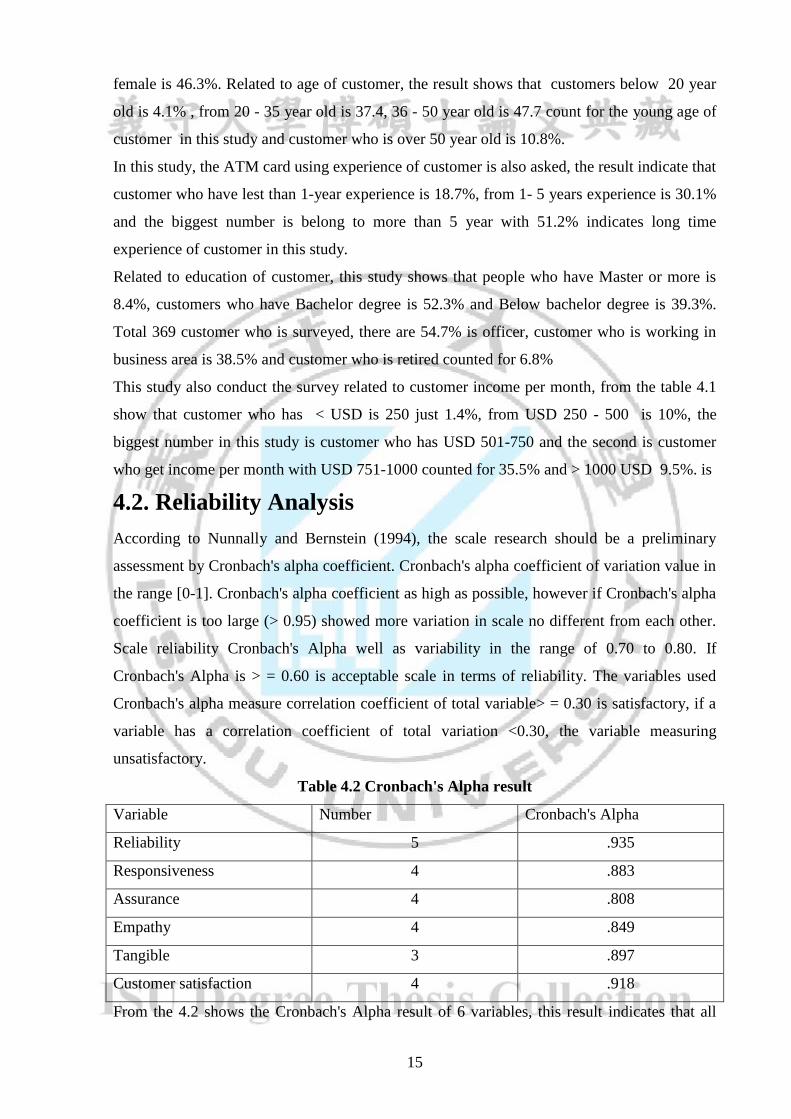
Table 4.2 Cronbach's Alpha result
Variable Number Cronbach's Alpha
Reliability 5 .935
Responsiveness 4 .883
Assurance 4 .808
Empathy 4 .849
Tangible 3 .897
Customer satisfaction 4 .918
From the 4.2 shows the Cronbach's Alpha result of 6 variables, this result indicates that all
16
variable (Reliability, Responsiveness, Assurance, Empathy, Tangible, Customer satisfaction)
Have good internal consistent with Cronbach's Alpha from .808 to .936.
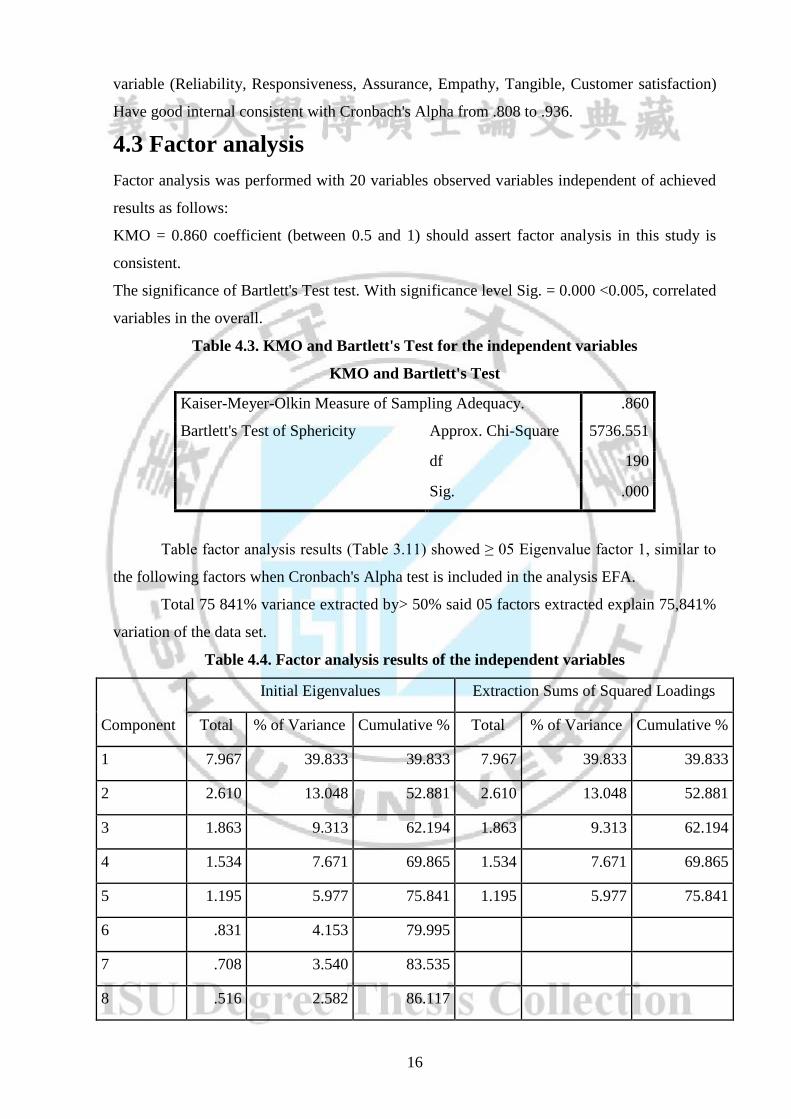
4.3 Factor analysis
Factor analysis was performed with 20 variables observed variables independent of achieved
results as follows:
KMO = 0.860 coefficient (between 0.5 and 1) should assert factor analysis in this study is
consistent.
The significance of Bartlett's Test test. With significance level Sig. = 0.000 <0.005, correlated
variables in the overall.
Table 4.3. KMO and Bartlett's Test for the independent variables
KMO and Bartlett's Test
Kaiser-Meyer-Olkin Measure of Sampling Adequacy. .860
Bartlett's Test of Sphericity Approx. Chi-Square 5736.551
df 190
Sig. .000
Table factor analysis results (Table 3.11) showed ≥ 05 Eigenvalue factor 1, similar to
the following factors when Cronbach's Alpha test is included in the analysis EFA.
Total 75 841% variance extracted by> 50% said 05 factors extracted explain 75,841%
variation of the data set.
Table 4.4. Factor analysis results of the independent variables
Component
Initial Eigenvalues Extraction Sums of Squared Loadings
Total % of Variance Cumulative % Total % of Variance Cumulative %
1 7.967 39.833 39.833 7.967 39.833 39.833
2 2.610 13.048 52.881 2.610 13.048 52.881
3 1.863 9.313 62.194 1.863 9.313 62.194
4 1.534 7.671 69.865 1.534 7.671 69.865
5 1.195 5.977 75.841 1.195 5.977 75.841
6 .831 4.153 79.995
7 .708 3.540 83.535
8 .516 2.582 86.117

17
Component
Initial Eigenvalues Extraction Sums of Squared Loadings
Total % of Variance Cumulative % Total % of Variance Cumulative %
9 .441 2.203 88.320
10 .374 1.872 90.193
11 .327 1.637 91.829
12 .321 1.607 93.436
13 .272 1.359 94.795
14 .220 1.098 95.893
15 .183 .916 96.808
16 .176 .880 97.688
17 .135 .677 98.365
18 .125 .624 98.989
19 .112 .561 99.550
20 .090 .450 100.000
Rotated Component Matrixa removed the variable with loading factor coefficient less than
0.5. The remaining factors are factor loaded > 0.5: ensure the practical implications of EFA.
Looking at the table 4.5 we see the influence of 05 factors were extracted from the observed
variables of the scale components.
Factor 1 is the sum of 05 observed variables are RE1, RE2, RE3, RE4 RE5 of Reliability
scale (RE).
Factor 2 is the sum of 04 observed variables are RS1, RS2, RS3 RS4 of , Responsiveness
scale (RS).
Factor 3 is the sum of 04 observed variables are AS1, AS2, AS3, AS4 of the Assurance scale
(AS).
Factor 4 is the sum of 04 observed variables are EM1, EM2, EM3, EM4
of Empathy scale (EM).
Factor 5 is the sum of 03 observed variables is TA1, TA2 TA3 of Tangible scale (TA)
Thus, after analyzing the factors explored EFA, with all 05 factors were extracted based on 20
variables observed similarities with the elements after testing was included in the analysis
EFA. 05 factors will be included in the regression

18
Table 4.5 Rotated factor matrix of the independent variables
Rotated Component Matrixa
Component
1 2 3 4 5
RE1 .710
RE2 .856
RE3 .862
RE4 .835
RE5 .705
RS1 .797
RS2 .824
RS3 .750
RS4 .782
AS1 .893
AS2 .877
AS3 .593
AS4 .843
EM1 .748
EM2 .782
EM3 .770
EM4 .658
TA1 .867
TA2 .884
TA3 .851
Extraction Method: Principal Component Analysis.
Rotation Method: Varimax with Kaiser Normalization.
a. Rotation converged in 6 iterations.
4.4 Variables correlation
Pearson correlation analysis to determine the linear relationship between the
dependent variable and the independent variables before conducting regression analysis.
Correlation analysis was performed between the dependent variable is customer satisfaction
(CS) and the independent variables are: Reliability scale (RE), Responsiveness scale (RS),
Assurance scale (AS), Empathy scale (EM) and Tangible scale (TA)
19
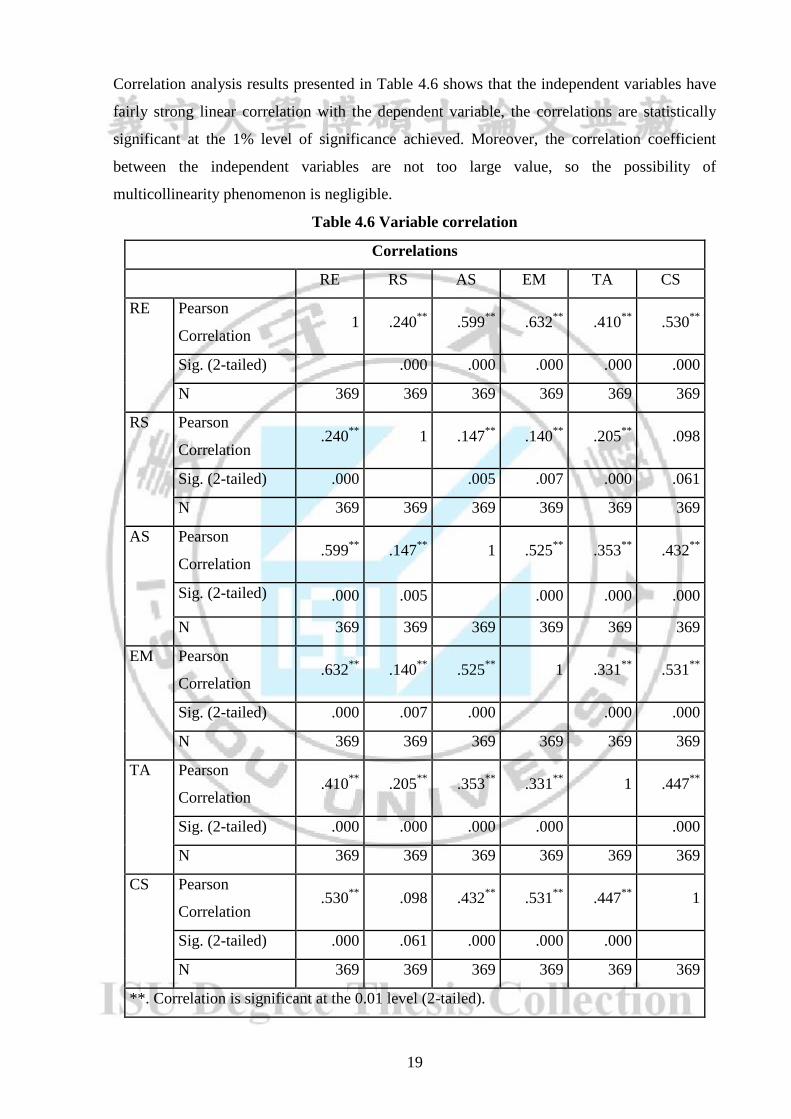
Correlation analysis results presented in Table 4.6 shows that the independent variables have
fairly strong linear correlation with the dependent variable, the correlations are statistically
significant at the 1% level of significance achieved. Moreover, the correlation coefficient
between the independent variables are not too large value, so the possibility of
multicollinearity phenomenon is negligible.
Table 4.6 Variable correlation
Correlations
RE RS AS EM TA CS
RE Pearson
Correlation 1 .240
** .599
** .632
** .410
** .530
**
Sig. (2-tailed) .000 .000 .000 .000 .000
N 369 369 369 369 369 369
RS Pearson
Correlation .240
** 1 .147
** .140
** .205
** .098
Sig. (2-tailed) .000 .005 .007 .000 .061
N 369 369 369 369 369 369
AS Pearson
Correlation .599
** .147
** 1 .525
** .353
** .432
**
Sig. (2-tailed) .000 .005 .000 .000 .000
N 369 369 369 369 369 369
EM Pearson
Correlation .632
** .140
** .525
** 1 .331
** .531
**
Sig. (2-tailed) .000 .007 .000 .000 .000
N 369 369 369 369 369 369
TA Pearson
Correlation .410
** .205
** .353
** .331
** 1 .447
**
Sig. (2-tailed) .000 .000 .000 .000 .000
N 369 369 369 369 369 369
CS Pearson
Correlation .530
** .098 .432
** .531
** .447
** 1
Sig. (2-tailed) .000 .061 .000 .000 .000
N 369 369 369 369 369 369
**. Correlation is significant at the 0.01 level (2-tailed).
20
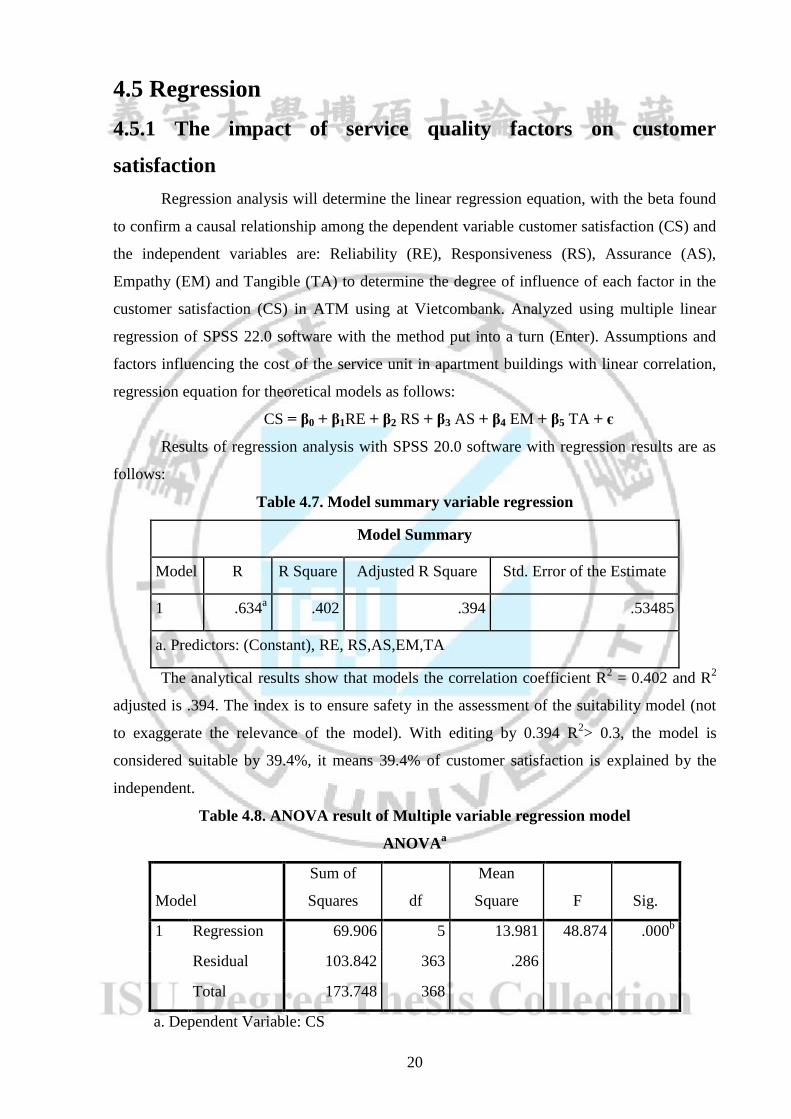
4.5 Regression
4.5.1 The impact of service quality factors on customer
satisfaction
Regression analysis will determine the linear regression equation, with the beta found
to confirm a causal relationship among the dependent variable customer satisfaction (CS) and
the independent variables are: Reliability (RE), Responsiveness (RS), Assurance (AS),
Empathy (EM) and Tangible (TA) to determine the degree of influence of each factor in the
customer satisfaction (CS) in ATM using at Vietcombank. Analyzed using multiple linear
regression of SPSS 22.0 software with the method put into a turn (Enter). Assumptions and
factors influencing the cost of the service unit in apartment buildings with linear correlation,
regression equation for theoretical models as follows:
CS = β0 + β1RE + β2 RS + β3 AS + β4 EM + β5 TA + є
Results of regression analysis with SPSS 20.0 software with regression results are as
follows:
Table 4.7. Model summary variable regression
Model Summary
Model R R Square Adjusted R Square Std. Error of the Estimate
1 .634a .402 .394 .53485
a. Predictors: (Constant), RE, RS,AS,EM,TA
The analytical results show that models the correlation coefficient R2 = 0.402 and R
2
adjusted is .394. The index is to ensure safety in the assessment of the suitability model (not
to exaggerate the relevance of the model). With editing by 0.394 R2> 0.3, the model is
considered suitable by 39.4%, it means 39.4% of customer satisfaction is explained by the
independent.
Table 4.8. ANOVA result of Multiple variable regression model
ANOVAa
Model
Sum of
Squares df
Mean
Square F Sig.
1 Regression 69.906 5 13.981 48.874 .000b
Residual 103.842 363 .286
Total 173.748 368
a. Dependent Variable: CS

21
b. Predictors: (Constant), RE, RS,AS,EM,TA
ANOVA analysis showed that F is significant at 0.000 level, suggesting that building
the regression model is consistent with the data collected and the factors are statistically
significant at the 5% significance. Thus, the factors for the independent variable in the model
with factors related to the dependent variable.
Table 4.9 Multiple variable result
Coefficientsa
Model
Unstandardized
Coefficients
Standardized
Coefficients
t Sig. B Std. Error Beta
1 (Constant) 1.229 .222 5.537 .000
RE .211 .057 .221 3.726 .000
RS -.059 .044 -.056 -1.339 .181
AS .069 .049 .074 1.409 .160
EM .286 .056 .278 5.139 .000
TA .248 .045 .250 5.492 .000
a. Dependent Variable: CS
From the table 4.9 shows total five variables that affect the customer satisfaction are
included in the regression model, deeming that there are two variables are not significance
affected on customer satisfaction with P- value> 0.05 (Responsiveness (RS), Assurance (AS)
so we deleted them in the regression model. The three remaining factors have impacted on
customer satisfaction: Reliability (Beta = .221), Empathy (Beta =.278) and Tangible scale
(Beta =.250) with the P value significant at <0.05 level.
Since two factors of Responsiveness and Assurance are not accepted by the model so
this study removed that two factors and conducted the regression again
Table 4.10 Model Summary
Model R R Square Adjusted R Square
Std. Error of the
Estimate
1 .629a .396 .391 .53618
a. Predictors: (Constant), TA, EM, RE
The analytical results show that models the correlation coefficient R2 = 0.396 and R
2
adjusted is .391. The index is to ensure safety in the assessment of the suitability model (not
to exaggerate the relevance of the model). With editing by 0.391 R2> 0.3, the model is
considered suitable by 39.1%, it means 39.1% of customer satisfaction is explained by the
22
independent.
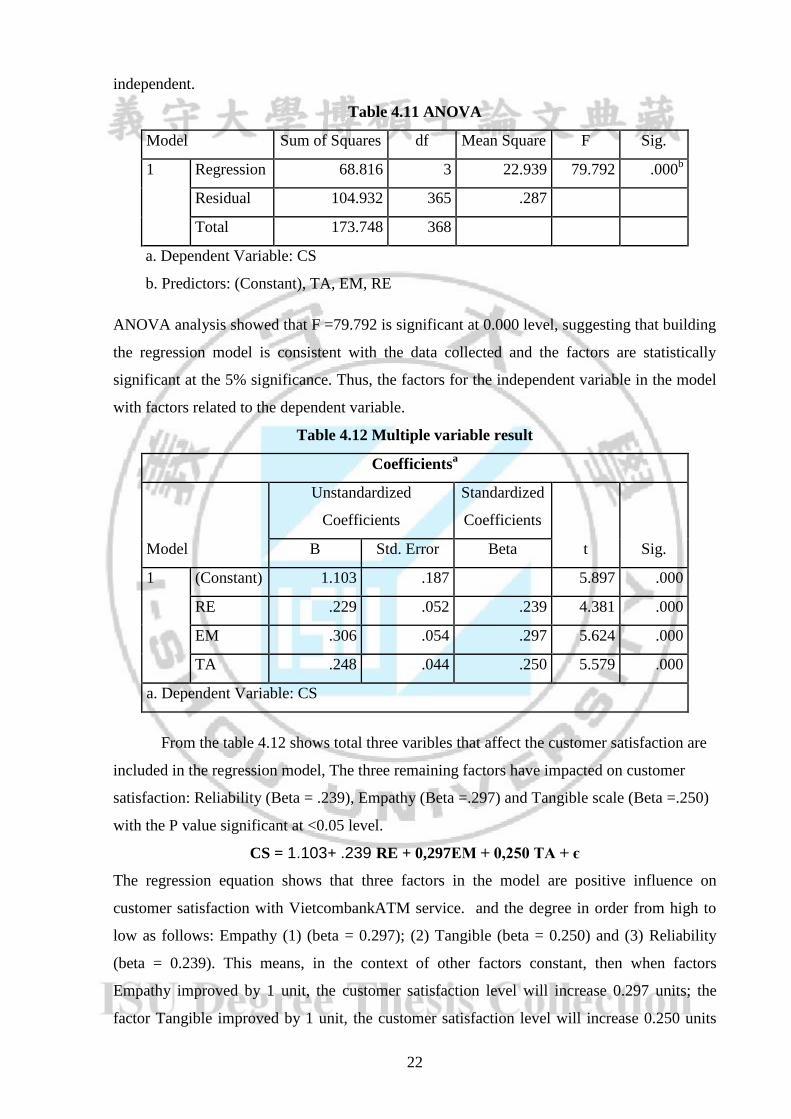
Table 4.11 ANOVA
Model Sum of Squares df Mean Square F Sig.
1 Regression 68.816 3 22.939 79.792 .000b
Residual 104.932 365 .287
Total 173.748 368
a. Dependent Variable: CS
b. Predictors: (Constant), TA, EM, RE
ANOVA analysis showed that F =79.792 is significant at 0.000 level, suggesting that building
the regression model is consistent with the data collected and the factors are statistically
significant at the 5% significance. Thus, the factors for the independent variable in the model
with factors related to the dependent variable.
Table 4.12 Multiple variable result
Coefficientsa
Model
Unstandardized
Coefficients
Standardized
Coefficients
t Sig. B Std. Error Beta
1 (Constant) 1.103 .187 5.897 .000
RE .229 .052 .239 4.381 .000
EM .306 .054 .297 5.624 .000
TA .248 .044 .250 5.579 .000
a. Dependent Variable: CS
From the table 4.12 shows total three varibles that affect the customer satisfaction are
included in the regression model, The three remaining factors have impacted on customer
satisfaction: Reliability (Beta = .239), Empathy (Beta =.297) and Tangible scale (Beta =.250)
with the P value significant at <0.05 level.
CS = 1.103+ .239 RE + 0,297EM + 0,250 TA + є
The regression equation shows that three factors in the model are positive influence on
customer satisfaction with VietcombankATM service. and the degree in order from high to
low as follows: Empathy (1) (beta = 0.297); (2) Tangible (beta = 0.250) and (3) Reliability
(beta = 0.239). This means, in the context of other factors constant, then when factors
Empathy improved by 1 unit, the customer satisfaction level will increase 0.297 units; the
factor Tangible improved by 1 unit, the customer satisfaction level will increase 0.250 units

23
and when factor Reliability improved by 1 unit, the customer satisfaction level will increase
0.234 units. So this study indicates that hypothesis H1 ; H4 and H5 are supported by the
model while H2 and H3 are not supported.
4.5.2 The impact of overall service quality factors on customer
satisfaction
For testing the H6, this study is conducted the single regression between overall service
quality and customer satisfaction. Table 4.10 shows the summary of regression model
Table 4.10 the summary of regression model of overall service quality and customer
satisfaction
Model Summary
Model R R Square Adjusted R Square Std. Error of the Estimate
1 .586a .343 .342 .55758
a. Predictors: (Constant), SQ
The analytical results show that the correlation coefficient R2 = 0.343 and R
2 adjusted
is .342. The index is to ensure safety in the assessment of the suitability model (not to
exaggerate the relevance of the model). With editing by 0.343, the model is considered
suitable by 34.3%, it means 34.3% of customer satisfaction is explained by the independent
variable (overall service quality).
Table 4.11. ANOVA of overall service quality and customer satisfaction
ANOVAa
Model Sum of Squares df Mean Square F Sig.
1 Regression 59.651 1 59.651 191.871 .000b
Residual 114.097 367 .311
Total 173.748 368
a. Dependent Variable: CS
b. Predictors: (Constant), SQ
ANOVA analysis showed that F = 59.651 is significant at 0.000 level, suggesting that the
regression model is consistent with the data collected and the factors are statistically
significant at the 5% significance. Thus, the factors for the independent variable in the model
with factors related to the dependent variable.

24
Table 4.12 The regression of overall service quality and customer satisfaction
Coefficientsa
Model
Unstandardized Coefficients
Standardized
Coefficients
t Sig. B Std. Error Beta
1 (Constant) .985 .215 4.582 .000
SQ .826 .060 .586 13.852 .000
a. Dependent Variable: CS
From the table 4.12 shows that overall service quality affect the customer satisfaction
with bate = .586 ( P<0.05). So it can be concluded that the overall service quality have strong
impact on customer satisfaction ( H6 is supported)
4.6 Anova – t-test result
For testing the hypothesis H7: there are differences among customer demographic with the
level of customer satisfaction about service quality of VietcombankATM , t-test and Anova is
used to test the differences between Socio-demographics (gender, age, education, experience,
job status and income) and customer satisfaction with VietcombankATM.
To apply or perform a one−way ANOVA, certain assumptions (or conditions) need to exist. If
any of the conditions are not satisfied, the results from the use of ANOVA techniques may be
unreliable. The assumptions are:
- Each sample is an independent random sample
- The distribution of the response variable follows a normal distribution
- The population variances are equal across responses for the group levels. This can
be evaluated by using the following rule of thumb: if the largest sample standard
deviation divided by the smallest sample standard deviation is not greater than
two, then assume that the population variances are equal.
Given that you are comparing independent groups, the null and alternative hypotheses are:
H0: 1 - 2 = 0
H1: 1 = 2 # 0
In other words, the null hypothesis is that at all of the groups' population means are equal.
The alternative is that they are not all equal; there are at two population means that are not
equal to one another.
+ The differences between gender and employee loyalty
To test the The differences between gender and customer satisfaction, t-test is used. Using the
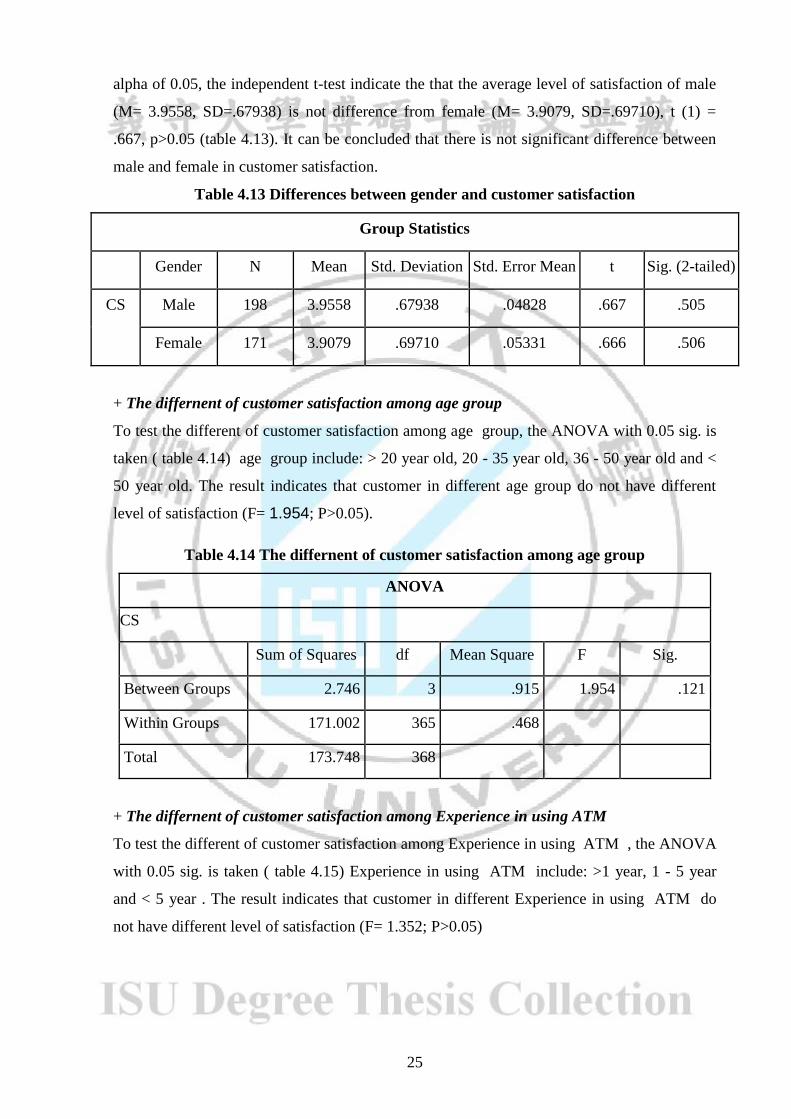
25
alpha of 0.05, the independent t-test indicate the that the average level of satisfaction of male
(M= 3.9558, SD=.67938) is not difference from female (M= 3.9079, SD=.69710), t (1) =
.667, p>0.05 (table 4.13). It can be concluded that there is not significant difference between
male and female in customer satisfaction.
Table 4.13 Differences between gender and customer satisfaction
Group Statistics
Gender N Mean Std. Deviation Std. Error Mean t Sig. (2-tailed)
CS Male 198 3.9558 .67938 .04828 .667 .505
Female 171 3.9079 .69710 .05331 .666 .506
+ The differnent of customer satisfaction among age group
To test the different of customer satisfaction among age group, the ANOVA with 0.05 sig. is
taken ( table 4.14) age group include: > 20 year old, 20 - 35 year old, 36 - 50 year old and <
50 year old. The result indicates that customer in different age group do not have different
level of satisfaction (F= 1.954; P>0.05).
Table 4.14 The differnent of customer satisfaction among age group
ANOVA
CS
Sum of Squares df Mean Square F Sig.
Between Groups 2.746 3 .915 1.954 .121
Within Groups 171.002 365 .468
Total 173.748 368
+ The differnent of customer satisfaction among Experience in using ATM
To test the different of customer satisfaction among Experience in using ATM , the ANOVA
with 0.05 sig. is taken ( table 4.15) Experience in using ATM include: >1 year, 1 - 5 year
and < 5 year . The result indicates that customer in different Experience in using ATM do
not have different level of satisfaction (F= 1.352; P>0.05)

26
Table 4.15 The differnent of customer satisfaction among Experience in using ATM
ANOVA
CS
Sum of Squares df Mean Square F Sig.
Between Groups 1.274 2 .637 1.352 .260
Within Groups 172.474 366 .471
Total 173.748 368
+ The differnent of customer satisfaction among Education level
To test the different of customer satisfaction among Education level, the ANOVA with 0.05
sig. is taken ( table 4.16) Education level include: Master or more, Bachelor and Below
bachelor . The result indicates that customer in different Education level do not have different
level of satisfaction (F= 1.772; P>0.05)
Table 4.16 The differnent of customer satisfaction among Education level
ANOVA
CS
Sum of Squares df Mean Square F Sig.
Between Groups 1.666 2 .833 1.772 .172
Within Groups 172.082 366 .470
Total 173.748 368
The differnent of customer satisfaction among job status
To test the different of customer satisfaction among job status , the ANOVA with 0.05 sig. is
taken ( table 4.17) job status include: Officer, Business and Retire.The result indicates that
customer in different job status have different level of satisfaction (F= 3.106; P<0.05)
Table 4.17 The differnent of customer satisfaction among job status
ANOVA
CS
Sum of Squares df Mean Square F Sig.
Between Groups 2.900 2 1.450 3.106 .046
Within Groups 170.848 366 .467
Total 173.748 368
To find the detail of different of customer satisfaction among job status, post hoc test with
LSD - method is used. The result indicates that customer who are Retire group have more
satisfaction than other groups ( P<0.05). This may come from the frequency of using, the Officer
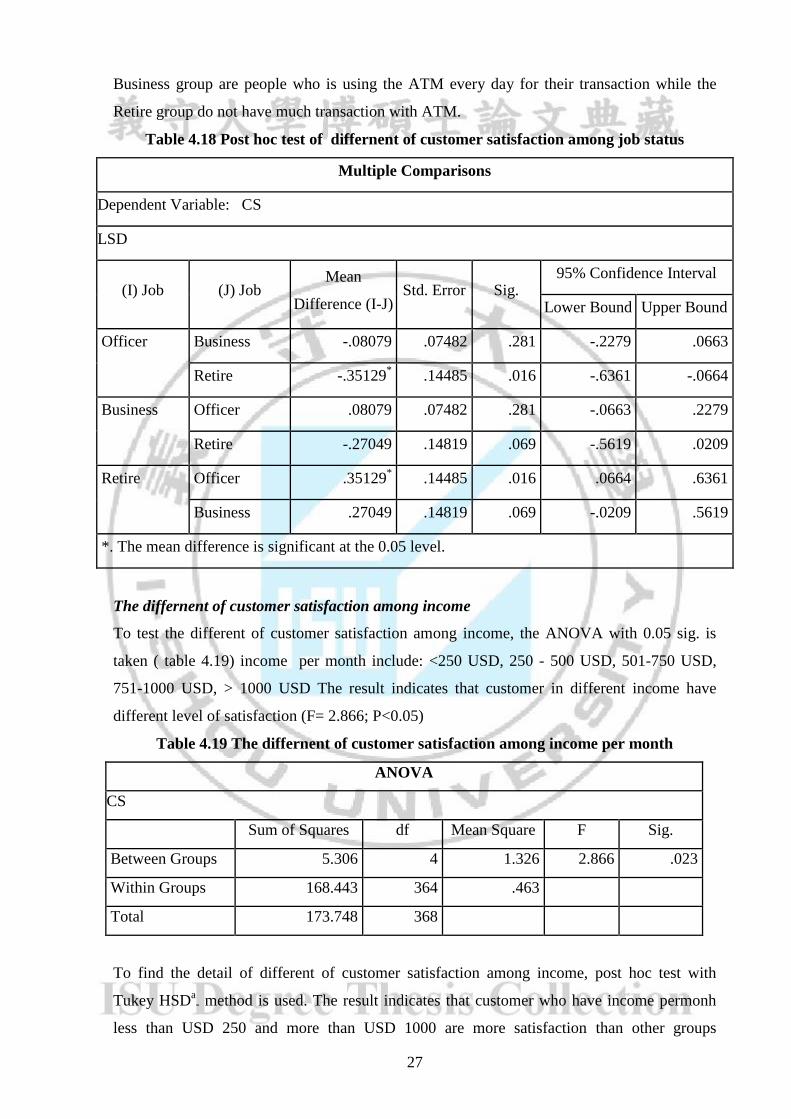
27
Business group are people who is using the ATM every day for their transaction while the
Retire group do not have much transaction with ATM.
Table 4.18 Post hoc test of differnent of customer satisfaction among job status
Multiple Comparisons
Dependent Variable: CS
LSD
(I) Job (J) Job Mean
Difference (I-J) Std. Error Sig.
95% Confidence Interval
Lower Bound Upper Bound
Officer
Business -.08079 .07482 .281 -.2279 .0663
Retire -.35129* .14485 .016 -.6361 -.0664
Business Officer .08079 .07482 .281 -.0663 .2279
Retire -.27049 .14819 .069 -.5619 .0209
Retire
Officer .35129* .14485 .016 .0664 .6361
Business .27049 .14819 .069 -.0209 .5619
*. The mean difference is significant at the 0.05 level.
The differnent of customer satisfaction among income
To test the different of customer satisfaction among income, the ANOVA with 0.05 sig. is
taken ( table 4.19) income per month include: <250 USD, 250 - 500 USD, 501-750 USD,
751-1000 USD, > 1000 USD The result indicates that customer in different income have
different level of satisfaction (F= 2.866; P<0.05)
Table 4.19 The differnent of customer satisfaction among income per month
ANOVA
CS
Sum of Squares df Mean Square F Sig.
Between Groups 5.306 4 1.326 2.866 .023
Within Groups 168.443 364 .463
Total 173.748 368
To find the detail of different of customer satisfaction among income, post hoc test with
Tukey HSDa- method is used. The result indicates that customer who have income permonh
less than USD 250 and more than USD 1000 are more satisfaction than other groups
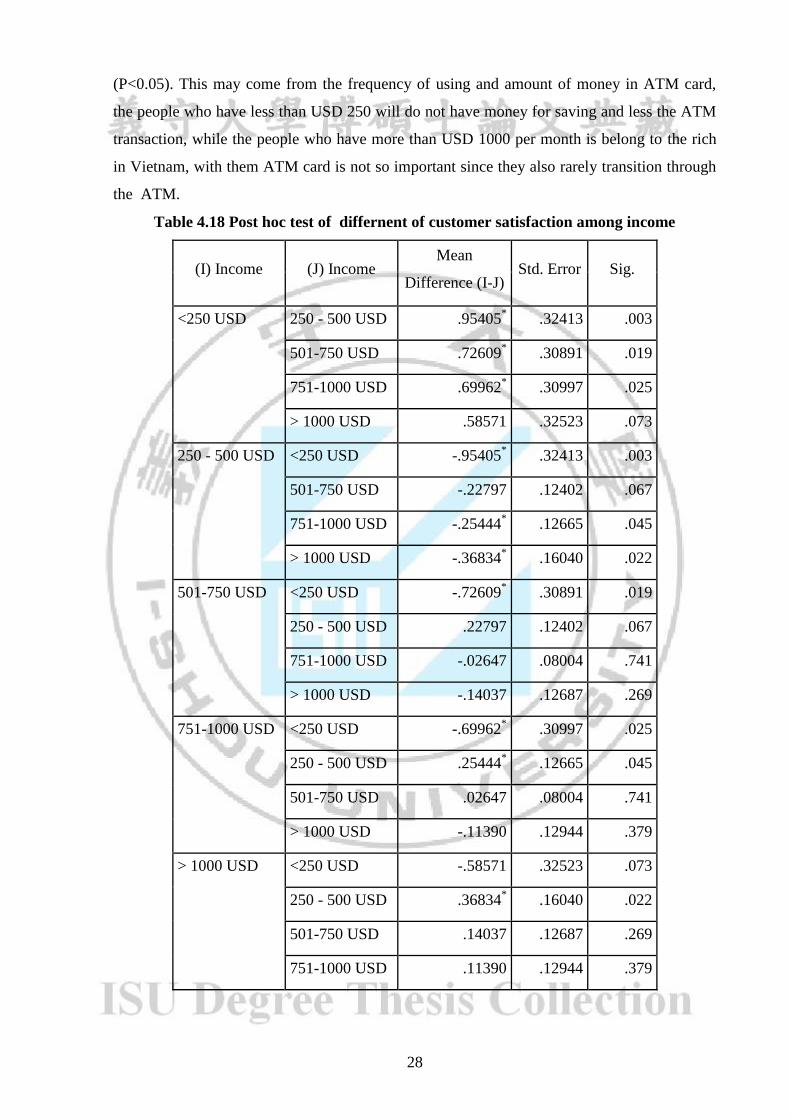
28
(P<0.05). This may come from the frequency of using and amount of money in ATM card,
the people who have less than USD 250 will do not have money for saving and less the ATM
transaction, while the people who have more than USD 1000 per month is belong to the rich
in Vietnam, with them ATM card is not so important since they also rarely transition through
the ATM.
Table 4.18 Post hoc test of differnent of customer satisfaction among income
(I) Income (J) Income Mean
Difference (I-J) Std. Error Sig.
<250 USD 250 - 500 USD .95405* .32413 .003
501-750 USD .72609* .30891 .019
751-1000 USD .69962* .30997 .025
> 1000 USD .58571 .32523 .073
250 - 500 USD <250 USD -.95405* .32413 .003
501-750 USD -.22797 .12402 .067
751-1000 USD -.25444* .12665 .045
> 1000 USD -.36834* .16040 .022
501-750 USD <250 USD -.72609* .30891 .019
250 - 500 USD .22797 .12402 .067
751-1000 USD -.02647 .08004 .741
> 1000 USD -.14037 .12687 .269
751-1000 USD <250 USD -.69962* .30997 .025
250 - 500 USD .25444* .12665 .045
501-750 USD .02647 .08004 .741
> 1000 USD -.11390 .12944 .379
> 1000 USD <250 USD -.58571 .32523 .073
250 - 500 USD .36834* .16040 .022
501-750 USD .14037 .12687 .269
751-1000 USD .11390 .12944 .379

29
Chapter
V CONCLUSION AND RECOMMENDATION
5.1 Conclusion
The aim of this study is to analysis the factor affects on customer satisfaction, this
study uses the Servequal model to validate the satisfaction level of customer while using
the ATM service. There are 369 customers were conducted survey. The result shows that
05 factors that affect the customer satisfaction are included Reliability, Responsiveness,
Assurance, Empathy and Tangible. The regression model indicates that 02 factors are not
significance affected on customer satisfaction with P- value> 0.05 (Responsiveness (RS),
Assurance (AS)). The three remaining factors have impacted on customer satisfaction:
Reliability (Beta = .221), Empathy (Beta =.278) and Tangible (Beta =.250) with the P
value significant at <0.05 level. Also the overall service quality affect the customer
satisfaction with bate = .586 ( P<0.05). So it can be concluded that the overall service
quality has strong impact on customer satisfaction (H1 is supported). This result
consistent with the study of Lee and Hwan (2005), their study has used models in their
research SERVPERF of banking services in Taiwan. The result was confirmed Hwan Lee
and reliability are of this model and detect termites are the relationship between service
quality, customer satisfaction and profitability at banks. In Vietnam, most notably the
study of Nguyen, Chaipoopirutana and Howard (2011) assess the quality of banking
services in Vietnam using SERVQUAL model. This study was conducted on 400
customers in Vietnam and shown that customer loyalty to the bank with the same
dimensional relationship to the quality of service they receive, besides, quality of banking
services is also an important role for building the image of the bank.
Beside the study also shows that there is not significant difference between male and
female in customer satisfaction, result indicates that customer in different age group do
not have different level of satisfaction, the result indicates that customer in different
Experience in using ATM do not have different level of satisfaction. The result indicates
that customer in different education level do not have different level of satisfaction.
However, The result indicates that customer in different job status have different level of
satisfaction and also The result indicates that customer in different income have different
level of satisfaction

30
5.2 Recommendation
With the goal of building a Vietcombankto be the largest modern banking group with leading
in reliability, quality and efficiency, the bank should do as flowing :1) Expand the network
and upgrade the banking channels in the province along with the rapid development of
products and services of the bank on the basis of modern technologies.
Proactive, positive application of advanced technology in governance, innovation creativity
private businessman, ... Advance the branch operation in particular and contribute to the
activities of VietcombankAdvance the closer to domestic standards and internationally. 2)
Continue to develop the model of branch mix includes wholesale banking and retail, and
strengthen cooperation linkages to maintain supremacy in the province and in the system.3)
Strengthen training, retraining and recruiting new staff for the branch, to create a high-quality
human resources of the branch, to meet the development needs and improve the quality of
business operations of the branch as well as meet the requirements of integration and the
possibility of friction with the fiercely competitive environment.4) Continue to improve
environmental, professional working style and modernity, associated benefits of workers with
professional work to provide psychological stability and a level playing field to attract talent.
5) Building modern trading space, spacious, continuous improvement, advanced technology
application in management and banking business in order to diversify the products and
services of the branch and customer diversification. 6) Restructuring the organization and
management system modeled to customer orientation and according to the standards of
modern banking. Healthy financial system and moving towards achieving the targets under
international rules on banking. 7) Perception becomes clearer direction on client objectives,
the next time, the branch continues to conduct research on customer satisfaction with
customer care programs periodically to improve and enhance the quality volume of services,
and strengthen relationships with customers, especially large customers.
Complete and further improve the information infrastructure to meet the volume of
transactions, account quantity increases more and more, to minimize network congestion due
to overload. Also regularly upgrade machinery informatics systems meet standards: modern,
fast processing speed, matching orientation modernize banking technologies.
Promote the local banking services especially internet banking, e-banking to the bank can
provide information to customers as quickly as possible. Customers can perform their
transactions at the workplace. Also pay attention to the quality of data safety and security of
IT systems, severely dealt with cases of delay in providing services to customers.
Construction work culture "business performance of our customers is the goal of the banking
activities" in the collective awareness of the bank. Changing perceptions, perspectives of sales

31
for the purpose of "complete business results and achieve higher profits" to the goal of
"maximum satisfaction of customer needs so that complete business plan, growth profit".
Consolidate the good image of the bank in customer. Such as: building a good image in the
customer's mind, unity of brochures, layout counters, convenient parking as well as the type,
quality of service, working style ... ; Respect the commitments with customers; Promoting
social contributions and community for the implementation of programs such as fundraising for
scholarships, organizing sports activities for the purpose of charity, funded public projects ...
Look at the factors affecting customer satisfaction on service quality
Regularly organize promotional programs such as bonus interest rates for older customers,
bonus interest rate for customers with high deposit the balance, gifts, lucky draw bonus, the
bonus awarded in interest and foreign tourism ...
Increase the customer service facilities. Because of the rush hour, customers often have to
wait long until your session is unavoidable, so affiliates should increase the installation of
additional amenities such as televisions with rich canal system, alarm magazine updated
daily, drinking water serving customers ... to create a sense of comfort to the customer over
a period of waiting.
5.3 Implication of research
This research meets the objective evaluation of customer satisfaction through the construction
of analytical models and thereby determining factors are affecting customer satisfaction. With
the results of which will make banks evaluated the providers of their unit, from which view of
making measures to improve customer satisfaction using the service.
5.4 Limitation and future research
The survey has contributed positively to the bank customer in understanding and recognizing
its position, but also has a certain number of limitations:
Due to limitations on the ability to research conducted on only 400 customers (369 valid
question) and individual customers are not yet able to assess the full overview of customer
transactions at Vietcombank. So to repeat the study with a larger sample size,
diversification of target customers, not just individual customers to generalize the typical
components of the scale.
Study only consider using banking services and transactions, not yet understand all the
customer satisfaction in relation to the business, financial potential, ethnic factors…
Research focuses on the use of customer service at Vietcombankin Hanoi should not yet be
assessed on customers in the whole country and other local in as the prospect unused banking

32
services. So to repeat the study with a larger scale for a better overview of customer
satisfaction for the quality of banking services.
Through regression analysis in chapter 4, the regression model adjusting coefficient R2 = .394
means that .39.4% of variation customer satisfaction be explained by three independent
variables above, while others variation customer satisfaction be explained by other factors not
included in the model. Therefore there should be further studies on customer satisfaction on
the quality of banking services, which, in addition to the components in Servqual scale,
researchers need additional explanatory variables into the model to model regression with
higher relevance.

33
Reference
- Adger, W. N. (2010). Social capital, collective action, and adaptation to climate
change. In Der klimawandel (pp. 327-345). VS Verlag für Sozialwissenschaften.
- Bitner, M. J., & Hubbert, A. R. (1994). Encounter satisfaction versus overall
satisfaction versus quality. Service quality: New directions in theory and practice, 34,
72-94.
- Blecher, E., Liber, A., Ross, H., & Birckmayer, J. (2013). Euromonitor data on the
illicit trade in cigarettes. Tobacco control, tobaccocontrol-2013.
- Bounie, D., & François, A. (2006). Cash, check or bank card? The effects of
transaction characteristics on the use of payment instruments. Telecom Paris
Economics and Social Sciences Working Paper No. ESS-06-05.
- Cronin Jr, J. J., & Taylor, S. A. (1992). Measuring service quality: a reexamination
and extension. The journal of marketing, 55-68.
- Grönroos, C. (1984). A service quality model and its marketing implications.
European Journal of marketing, 18(4), 36-44.
- Inotay, B., Parragh, G., Barkoczy, B. H., Kokovai, F., Fuko, L., Kapitany, A., ... &
Lipcsei, G. (2003). U.S. Patent Application No. 10/503,803.
- Kotler, P., Armstrong, G., Nistor, S., & Crişan, C. (2004). Principiile marketingului.
Teora.
- Lee, M. C., & Hwan, S. (2005). Relationships among service quality, customer
satisfaction and profitability in the Taiwanese banking industry. International journal
of management, 22(4), 635.
- Lehinen, U., & Lehtinen, J. R. (1982). Service Quality: A Study of Quality
Dimensions, Paper of the Second Word Marketing Congress. University of Sttirling,
Scotland.
- Nguyen, Q. C., Chaipoopirutana, S., & Combs, H. W. (2011). A SERVPERF Model of
the Vietnamese Banking Industry. Journal of Business and Behavioral Sciences, 198.
- Nunnally, J. C., & Bernstein, I. H. (1994). The assessment of reliability. Psychometric
theory, 3(1), 248-292.
- Parasuraman, A., Berry, L. L., & Zeithaml, V. A. (1991). Understanding customer
expectations of service. Sloan Management Review, 32(3), 39-48.
- Parasuraman, A., Zeithaml, V. A., & Berry, L. L. (1988). Servqual. Journal of
retailing, 64(1), 12-40.
34
- Parasuraman, A., Zeithaml, V. A., & Berry, L. L. (1988). Servqual. Journal of
retailing, 64(1), 12-40.
- Passas, N., Paskalis, S., Vali, D., & Merakos, L. (1997). Quality-of-service oriented
medium access control for wireless ATM networks. IEEE Communications Magazine,
35(11), 42-50.
- Schulz, V., & Brenner, W. (2010). Characteristics of shared service centers.
Transforming Government: People, Process and Policy, 4(3), 210-219.
- Shanka, M. S. (2012). Bank service quality, customer satisfaction and loyalty in
Ethiopian banking sector. Journal of Business Administration and Management
Sciences Research, 1(1), 001-009.
- Spreng, R. A., & Mackoy, R. D. (1996). An empirical examination of a model of
perceived service quality and satisfaction. Journal of retailing, 72(2), 201-214.
- State Bank (2015), Banking statistics reports
- Sullivan, K. (2002). U.S. Patent No. 6,386,444. Washington, DC: U.S. Patent and
Trademark Office.
- Trung, N. L. (2011). Research on the Benefits of E-Business to the Joint Stock
Commercial Bank for Industry and Trade, Nam Dinh Province, Viet Nam.
- Wolman, M. G. (1954). A method of sampling coarse river‐bed material. EOS,
Transactions American Geophysical Union, 35(6), 951-956.
- Zeithaml, V. A. (1988). Consumer perceptions of price, quality, and value: a means-
end model and synthesis of evidence. The Journal of marketing, 2-22.
- Zeithaml, V. A. (2000). Service quality, profitability, and the economic worth of
customers: what we know and what we need to learn. Journal of the academy of
marketing science, 28(1), 67-85.

35
Appendix:
Appendix: Questionnaire (English Version)
I am a Vietnamese graduate student of International Master of Business of Administration
program I-Shou University, Taiwan. My master thesis is about “The study of factors affecting the
customer satisfaction with ATM service at Vietcombank.” Please take about 10 to 15 minutes to
answer all of the questions in my survey. The answers will only be used for academic purposes
and will be strictly confidential. Thank you in advance for your time and help.
Part A: Please read each item carefully and circle the appropriate number that indicates
HOW MUCH YOU AGREE OR DISAGREE with each of the sections below:
Statement
Strongly
Disagree Disagree Neutral Agree
Strongly
Agree
1 2 3 4 5
1. Vietcombankguarantee security issue
2. VietcombankProvide timely service as
committed
3. The deposit products and services of
Vietcombankwere performed accurately
4. VietcombankProvide complete
information, accurate and timely
5. Bank guarantee security issue
6. Diverse products and services to meet
customer needs
7. There are many customer care program
8. Professional staff to handle rapid
accurate
9. Staff actively advise suitable products
for customers
10. Staff ready to serve and assist customers
11. Resolve complaints quickly and rational
12. Guide to procedures for clients fully

36
Statement
Strongly
Disagree Disagree Neutral Agree
Strongly
Agree
1 2 3 4 5
understandable
13. The staff is professional and
qualifications
14. Enthusiastic, considerate and fun staffs
15. Employees interested in the individual
requirements of the customer
16. Always listen to customers
17. Always polite, friendly customer
18. The location of transaction is
convenience and in accordance with
customer needs
19. Spacious transaction, using modern
technology
20. Nice layout of the counter, identifiable
for Customers
21. The staff dresses polite
22. Paper forms to be used in transactions
were designed easily
23. Vietcombankoffers more benefits than
costs me money
24. Vietcombankis the best among
competing banks
25. Vietcombankis much better than what I
expected
26. Ready to become long-term customers of
banks
27. Ready to introduce family and friends
28. If there are minor issues and comments
will continue to use the services of the
bank

37
Part B: Demographic Information
Your Gender: Male
Your age > 20 year old 20 - 35 year old
36 - 50 year old < 50 year old
Experience: >1 year 1 - 5 year < 5 year
Education: Master or more Bachelor
Below bachelor
Job status: officer Business retire
Income: <250 USD 250 - 500 USD
501-750 USD 751-1000 USD > 1000 USD
Thank you for filling the survey!
Related Documents