College of Pharmacy-University of Mustansiriyah 5Th. Year- Practical advance pharmaceutical analysis – 2015 - 1 University of Mustansiriyah College of Pharmacy Ali Rasool Albakaa Practical advance pharmaceutical analysis – 2015 – 5Th. Year Dep. of pharmaceutical chemistry

Welcome message from author
This document is posted to help you gain knowledge. Please leave a comment to let me know what you think about it! Share it to your friends and learn new things together.
Transcript
College of Pharmacy-University of Mustansiriyah 5Th. Year- Practical advance pharmaceutical analysis – 2015 -
1
University of Mustansiriyah
College of Pharmacy
Ali Rasool Albakaa
Practical advance pharmaceutical analysis
– 2015 –
5Th. Year
Dep. of pharmaceutical chemistry
College of Pharmacy-University of Mustansiriyah 5Th. Year- Practical advance pharmaceutical analysis – 2015 -
2
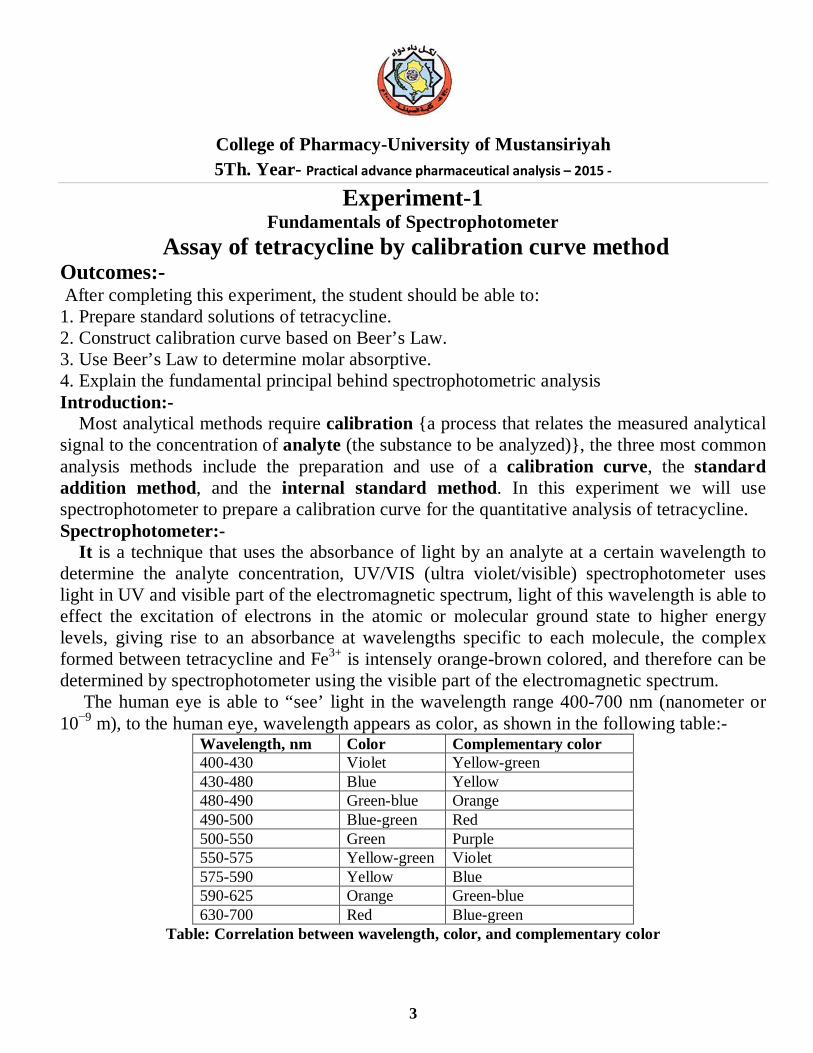
CONTENTS
No. Method Experiment PAGE 1 UV-Vis.
Spectroscopy Fundamentals of Spectrophotometer
Assay of tetracycline by calibration curve method 3
2 UV-Vis. Spectroscopy
Spectrophotometric determination of Aspirin in tablets By standard addition method
8
3 IR Spectroscopy Fundamentals of Infrared Spectroscopy Sold and liquid
11
4 IR Spectroscopy Application of IR Spectroscopy in the Analysis of Pharmaceutical Substances
16
5 Electrochemical Analysis
Titration of the ascorbic acid (vitamin C) in tablets By pH meter used first and 2nd derivatives
18
6 Determination of Mixtures by UV-Vis. Spectroscopy
Multi-Component Analysis of a Vitamin B Mixture by UV-Vis. Spectroscopy
20
7 Determination of Mixtures by UV-Vis. Spectroscopy
Determination of Caffeine and Acetylsalicylic Acid in an Analgesic Tablet
25
8 UV-Vis. Spectroscopy Calibration
UV-Vis. Spectroscopy Calibration 28
9 Determination of metal ion by UV-Vis. Spectroscopy
Spectrophotometric Determination of Iron in a Vitamin Tablet
31
College of Pharmacy-University of Mustansiriyah 5Th. Year- Practical advance pharmaceutical analysis – 2015 -
3
Experiment-1 Fundamentals of Spectrophotometer
Assay of tetracycline by calibration curve method Outcomes:- After completing this experiment, the student should be able to: 1. Prepare standard solutions of tetracycline. 2. Construct calibration curve based on Beer’s Law. 3. Use Beer’s Law to determine molar absorptive. 4. Explain the fundamental principal behind spectrophotometric analysis Introduction:- Most analytical methods require calibration {a process that relates the measured analytical signal to the concentration of analyte (the substance to be analyzed)}, the three most common analysis methods include the preparation and use of a calibration curve, the standard addition method, and the internal standard method. In this experiment we will use spectrophotometer to prepare a calibration curve for the quantitative analysis of tetracycline. Spectrophotometer:- It is a technique that uses the absorbance of light by an analyte at a certain wavelength to determine the analyte concentration, UV/VIS (ultra violet/visible) spectrophotometer uses light in UV and visible part of the electromagnetic spectrum, light of this wavelength is able to effect the excitation of electrons in the atomic or molecular ground state to higher energy levels, giving rise to an absorbance at wavelengths specific to each molecule, the complex formed between tetracycline and Fe3+ is intensely orange-brown colored, and therefore can be determined by spectrophotometer using the visible part of the electromagnetic spectrum. The human eye is able to “see’ light in the wavelength range 400-700 nm (nanometer or 10−9 m), to the human eye, wavelength appears as color, as shown in the following table:-
Wavelength, nm Color Complementary color 400-430 Violet Yellow-green 430-480 Blue Yellow 480-490 Green-blue Orange 490-500 Blue-green Red 500-550 Green Purple 550-575 Yellow-green Violet 575-590 Yellow Blue 590-625 Orange Green-blue 630-700 Red Blue-green
Table: Correlation between wavelength, color, and complementary color
College of Pharmacy-University of Mustansiriyah 5Th. Year- Practical advance pharmaceutical analysis – 2015 -
4
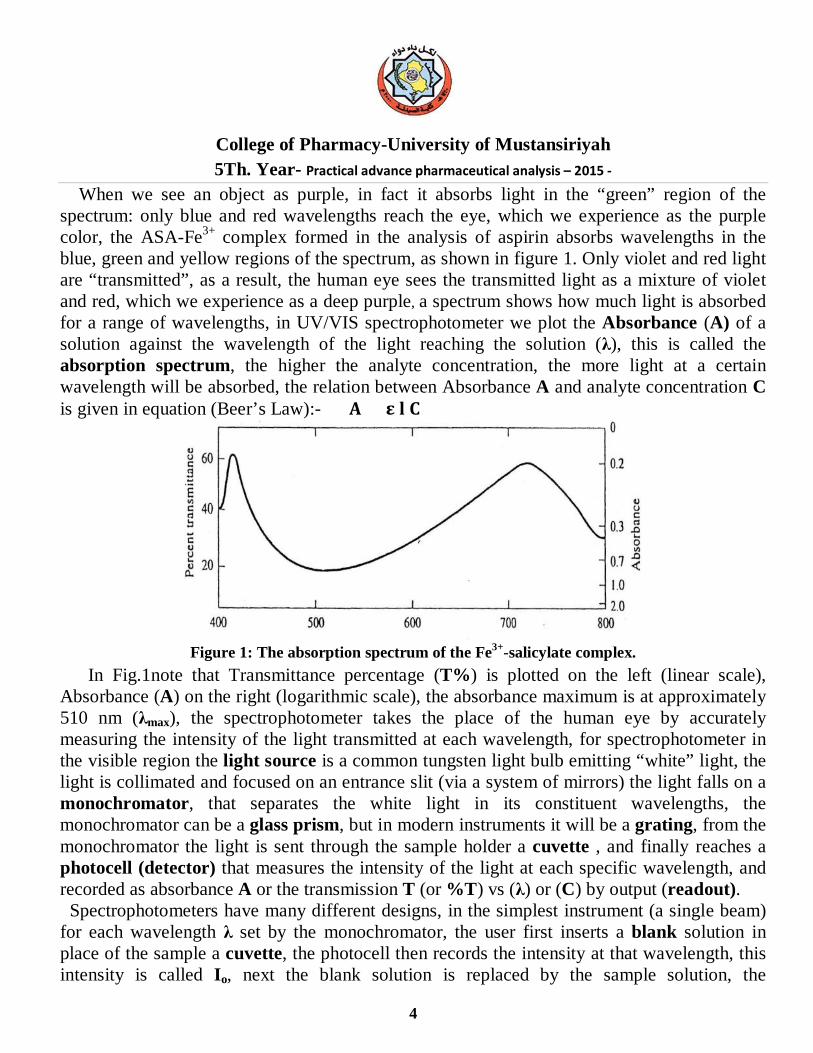
When we see an object as purple, in fact it absorbs light in the “green” region of the spectrum: only blue and red wavelengths reach the eye, which we experience as the purple color, the ASA-Fe3+ complex formed in the analysis of aspirin absorbs wavelengths in the blue, green and yellow regions of the spectrum, as shown in figure 1. Only violet and red light are “transmitted”, as a result, the human eye sees the transmitted light as a mixture of violet and red, which we experience as a deep purple, a spectrum shows how much light is absorbed for a range of wavelengths, in UV/VIS spectrophotometer we plot the Absorbance (A) of a solution against the wavelength of the light reaching the solution (λ), this is called the absorption spectrum, the higher the analyte concentration, the more light at a certain wavelength will be absorbed, the relation between Absorbance A and analyte concentration C is given in equation (Beer’s Law):- 𝐀 = 𝛆 𝐥 𝐂
Figure 1: The absorption spectrum of the Fe3+-salicylate complex.
In Fig.1note that Transmittance percentage (T%) is plotted on the left (linear scale), Absorbance (A) on the right (logarithmic scale), the absorbance maximum is at approximately 510 nm (λmax), the spectrophotometer takes the place of the human eye by accurately measuring the intensity of the light transmitted at each wavelength, for spectrophotometer in the visible region the light source is a common tungsten light bulb emitting “white” light, the light is collimated and focused on an entrance slit (via a system of mirrors) the light falls on a monochromator, that separates the white light in its constituent wavelengths, the monochromator can be a glass prism, but in modern instruments it will be a grating, from the monochromator the light is sent through the sample holder a cuvette , and finally reaches a photocell (detector) that measures the intensity of the light at each specific wavelength, and recorded as absorbance A or the transmission T (or %T) vs (λ) or (C) by output (readout). Spectrophotometers have many different designs, in the simplest instrument (a single beam) for each wavelength λ set by the monochromator, the user first inserts a blank solution in place of the sample a cuvette, the photocell then records the intensity at that wavelength, this intensity is called Io, next the blank solution is replaced by the sample solution, the
College of Pharmacy-University of Mustansiriyah 5Th. Year- Practical advance pharmaceutical analysis – 2015 -
5
photometer measures the new intensity called I, the transmittance (T) is then displayed on the screen or spectrophotometer output: T = 𝐈
𝐈𝐨 or T% = 𝐈
𝐈𝐨𝐱𝟏𝟎𝟎
This procedure is then repeated for a number of wavelengths; more sophisticated instruments “scan” the spectrum over the required wavelength range automatically, and record the transmittance as a function of wavelength, in a double beam scanning spectrophotometer, part of the light is reflected to a separate blank cell (intensities “Io”) and sample cell (intensities “I”) are measured simultaneously at each wavelength, and automatically compared to yield a direct output of T vs λ, another modern form of the UV/VIS spectrophotometer is the “Diode Array” spectrophotometer, in this instrument the photocell, which measures light intensity at one wavelength at a time, is replaced by a CCD detector (charge-coupled device) similar to the detector in your digital camera, and the instrument can record the spectrum over the full wavelength range (typically 200−700 nm) within one second! In each fractional layer of the sample the intensity of the incoming light will decrease proportionally to the concentration of the analyte, as a result, the Transmittance (T) decreases exponentially with increasing path-length l, this is expressed in the Beer Lambert law, which states: -log 𝐈
𝐈𝐨= 𝛆 𝐥 𝐂
ε is called the “Molar Absorptivity” absorption factor of the compound, it is a function of wavelength specific for each molecule, with the path-length l normally given in cm, and C in Molarity units, mol/L ε has the units L.mol−1cm−1, if alternatively C is in mol/mL, then ε will have the units cm2mol−1. The Absorbance (A) is defined as:- 𝐀 = −𝐥𝐨𝐠 𝐈
𝐈𝐨
Thus, the Beer-Lambert law, more commonly called Beer’s law, can be written as: 𝐀 = 𝛆 𝐥 𝐂 Finally, the relation between A and T are given by: 𝐀 = −𝐥𝐨𝐠𝐓 Note that A is a dimensionless quantity, because A is directly proportional to the analyte concentration, it is more often used than T or T%, most spectrometers can record either A, T, or T% for a given wavelength. The absorption spectrum:- We place a cuvette filled with sample solution in the cell holder (blank solution than sample solution), the instrument will record light intensity and absorbance relative to the light intensity passes through blank solution alone (the Absorbance to zero), this must be repeated at different wavelengths to obtain the spectrum of the dissolved solute (A vs. λ) absorption spectrum, from absorption spectrum we find the wavelength with the highest absorbance, the wavelength of the absorption peak (λmax), at this wavelength the spectrophotometric
College of Pharmacy-University of Mustansiriyah 5Th. Year- Practical advance pharmaceutical analysis – 2015 -
6
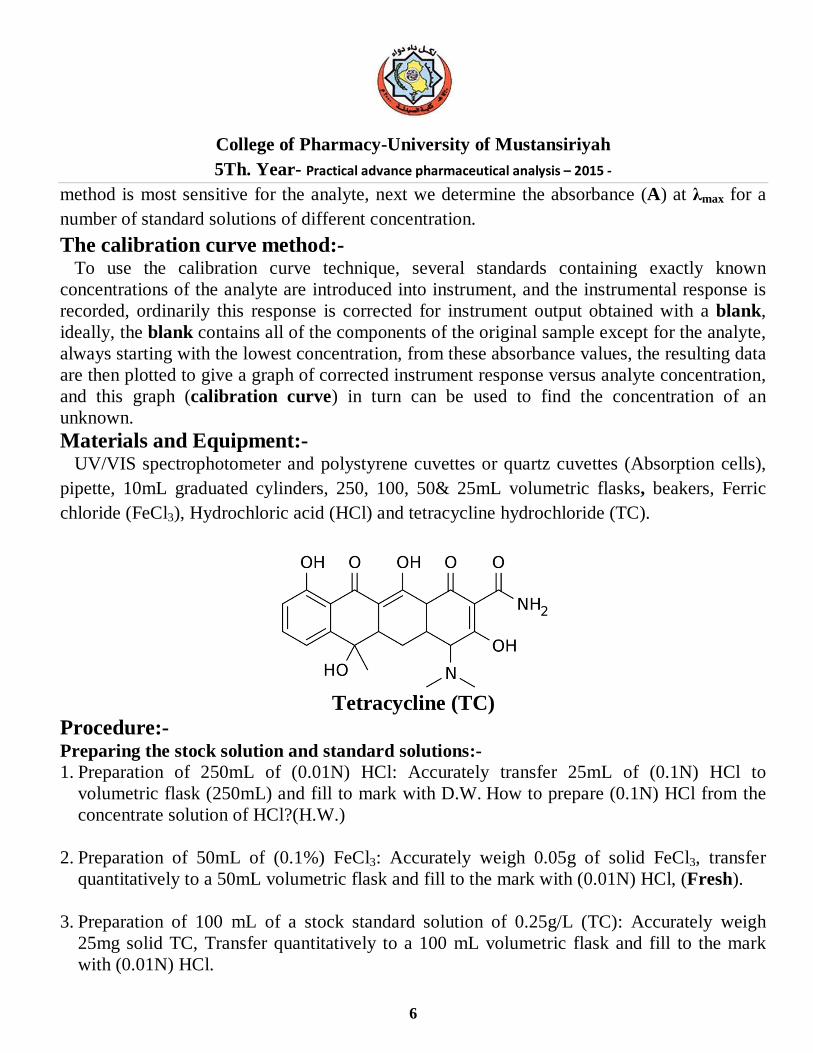
method is most sensitive for the analyte, next we determine the absorbance (A) at λmax for a number of standard solutions of different concentration. The calibration curve method:- To use the calibration curve technique, several standards containing exactly known concentrations of the analyte are introduced into instrument, and the instrumental response is recorded, ordinarily this response is corrected for instrument output obtained with a blank, ideally, the blank contains all of the components of the original sample except for the analyte, always starting with the lowest concentration, from these absorbance values, the resulting data are then plotted to give a graph of corrected instrument response versus analyte concentration, and this graph (calibration curve) in turn can be used to find the concentration of an unknown. Materials and Equipment:- UV/VIS spectrophotometer and polystyrene cuvettes or quartz cuvettes (Absorption cells), pipette, 10mL graduated cylinders, 250, 100, 50& 25mL volumetric flasks, beakers, Ferric chloride (FeCl3), Hydrochloric acid (HCl) and tetracycline hydrochloride (TC).
Tetracycline (TC)
Procedure:- Preparing the stock solution and standard solutions:- 1. Preparation of 250mL of (0.01N) HCl: Accurately transfer 25mL of (0.1N) HCl to
volumetric flask (250mL) and fill to mark with D.W. How to prepare (0.1N) HCl from the concentrate solution of HCl?(H.W.)
2. Preparation of 50mL of (0.1%) FeCl3: Accurately weigh 0.05g of solid FeCl3, transfer quantitatively to a 50mL volumetric flask and fill to the mark with (0.01N) HCl, (Fresh).
3. Preparation of 100 mL of a stock standard solution of 0.25g/L (TC): Accurately weigh
25mg solid TC, Transfer quantitatively to a 100 mL volumetric flask and fill to the mark with (0.01N) HCl.
College of Pharmacy-University of Mustansiriyah 5Th. Year- Practical advance pharmaceutical analysis – 2015 -
7
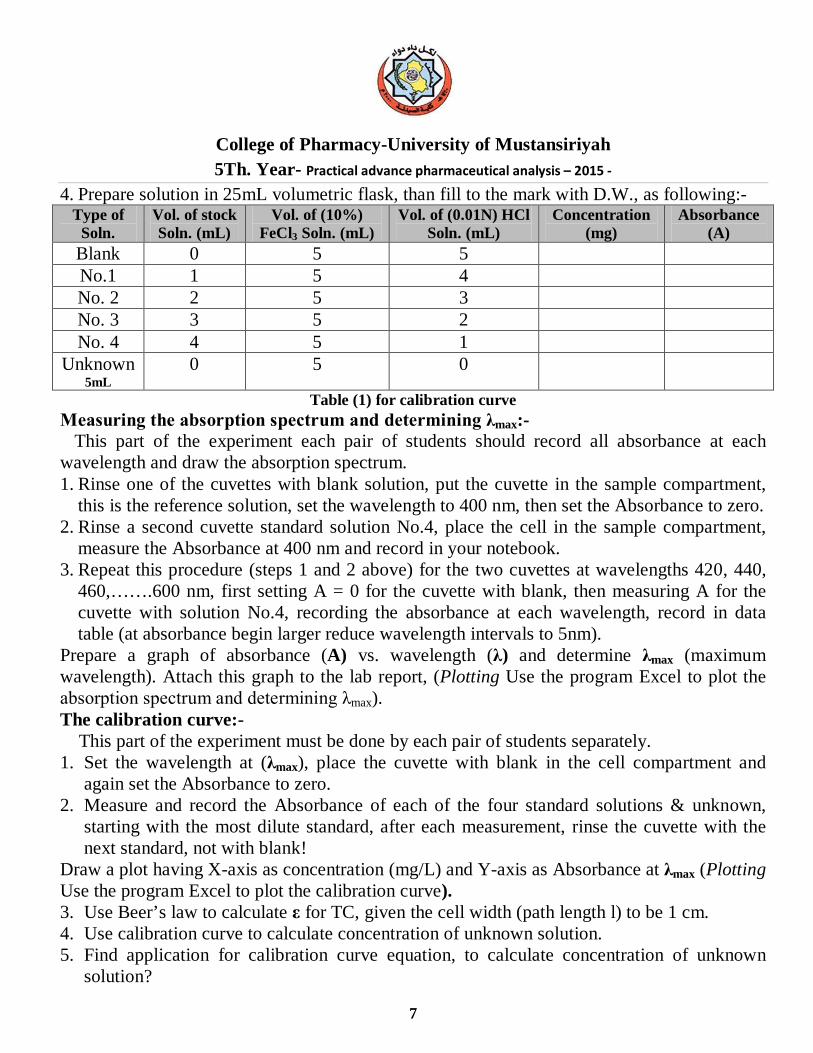
4. Prepare solution in 25mL volumetric flask, than fill to the mark with D.W., as following:- Type of
Soln. Vol. of stock Soln. (mL)
Vol. of (10%) FeCl3 Soln. (mL)
Vol. of (0.01N) HCl Soln. (mL)
Concentration (mg)
Absorbance (A)
Blank 0 5 5 No.1 1 5 4 No. 2 2 5 3 No. 3 3 5 2 No. 4 4 5 1
Unknown 5mL
0 5 0
Table (1) for calibration curve Measuring the absorption spectrum and determining λmax:- This part of the experiment each pair of students should record all absorbance at each wavelength and draw the absorption spectrum. 1. Rinse one of the cuvettes with blank solution, put the cuvette in the sample compartment,
this is the reference solution, set the wavelength to 400 nm, then set the Absorbance to zero. 2. Rinse a second cuvette standard solution No.4, place the cell in the sample compartment,
measure the Absorbance at 400 nm and record in your notebook. 3. Repeat this procedure (steps 1 and 2 above) for the two cuvettes at wavelengths 420, 440,
460,…….600 nm, first setting A = 0 for the cuvette with blank, then measuring A for the cuvette with solution No.4, recording the absorbance at each wavelength, record in data table (at absorbance begin larger reduce wavelength intervals to 5nm).
Prepare a graph of absorbance (A) vs. wavelength (λ) and determine λmax (maximum wavelength). Attach this graph to the lab report, (Plotting Use the program Excel to plot the absorption spectrum and determining λmax). The calibration curve:- This part of the experiment must be done by each pair of students separately. 1. Set the wavelength at (λmax), place the cuvette with blank in the cell compartment and
again set the Absorbance to zero. 2. Measure and record the Absorbance of each of the four standard solutions & unknown,
starting with the most dilute standard, after each measurement, rinse the cuvette with the next standard, not with blank!
Draw a plot having X-axis as concentration (mg/L) and Y-axis as Absorbance at λmax (Plotting Use the program Excel to plot the calibration curve). 3. Use Beer’s law to calculate ε for TC, given the cell width (path length l) to be 1 cm. 4. Use calibration curve to calculate concentration of unknown solution. 5. Find application for calibration curve equation, to calculate concentration of unknown
solution?
College of Pharmacy-University of Mustansiriyah 5Th. Year- Practical advance pharmaceutical analysis – 2015 -
8
Experiment-2 Spectrophotometric determination of Aspirin in tablets
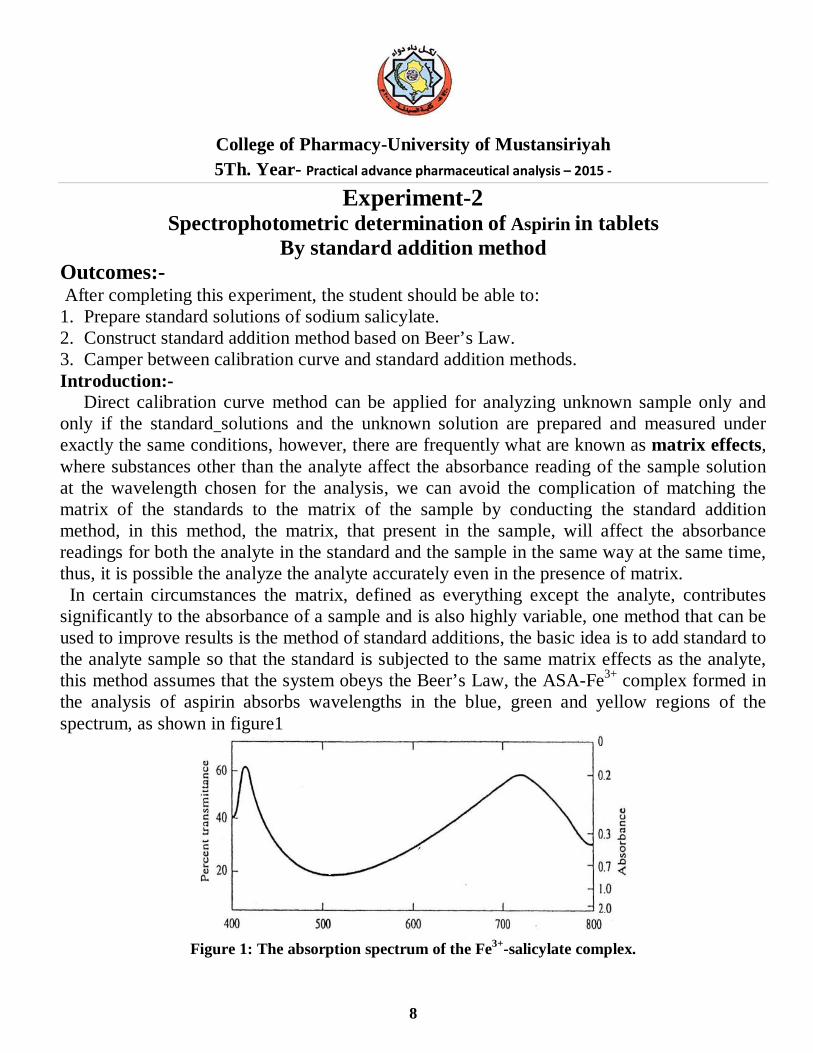
By standard addition method Outcomes:- After completing this experiment, the student should be able to: 1. Prepare standard solutions of sodium salicylate. 2. Construct standard addition method based on Beer’s Law. 3. Camper between calibration curve and standard addition methods. Introduction:- Direct calibration curve method can be applied for analyzing unknown sample only and only if the standard solutions and the unknown solution are prepared and measured under exactly the same conditions, however, there are frequently what are known as matrix effects, where substances other than the analyte affect the absorbance reading of the sample solution at the wavelength chosen for the analysis, we can avoid the complication of matching the matrix of the standards to the matrix of the sample by conducting the standard addition method, in this method, the matrix, that present in the sample, will affect the absorbance readings for both the analyte in the standard and the sample in the same way at the same time, thus, it is possible the analyze the analyte accurately even in the presence of matrix. In certain circumstances the matrix, defined as everything except the analyte, contributes significantly to the absorbance of a sample and is also highly variable, one method that can be used to improve results is the method of standard additions, the basic idea is to add standard to the analyte sample so that the standard is subjected to the same matrix effects as the analyte, this method assumes that the system obeys the Beer’s Law, the ASA-Fe3+ complex formed in the analysis of aspirin absorbs wavelengths in the blue, green and yellow regions of the spectrum, as shown in figure1
Figure 1: The absorption spectrum of the Fe3+-salicylate complex.
College of Pharmacy-University of Mustansiriyah 5Th. Year- Practical advance pharmaceutical analysis – 2015 -
9
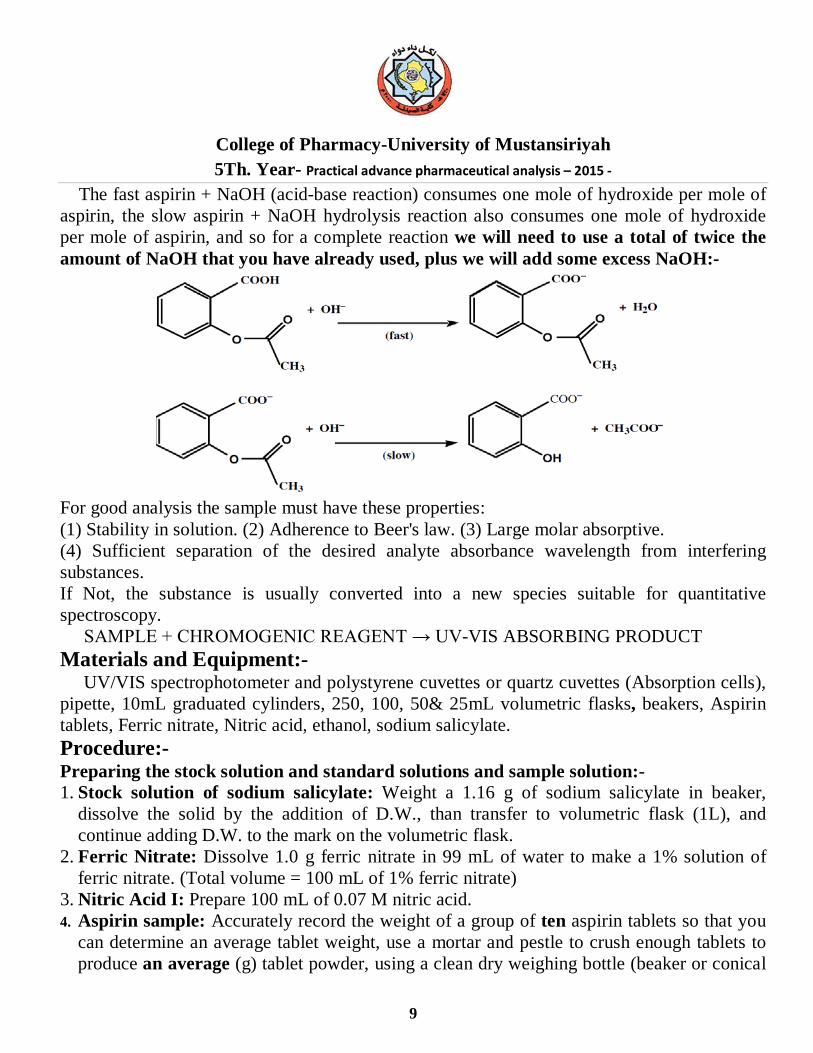
The fast aspirin + NaOH (acid-base reaction) consumes one mole of hydroxide per mole of aspirin, the slow aspirin + NaOH hydrolysis reaction also consumes one mole of hydroxide per mole of aspirin, and so for a complete reaction we will need to use a total of twice the amount of NaOH that you have already used, plus we will add some excess NaOH:-
For good analysis the sample must have these properties: (1) Stability in solution. (2) Adherence to Beer's law. (3) Large molar absorptive. (4) Sufficient separation of the desired analyte absorbance wavelength from interfering substances. If Not, the substance is usually converted into a new species suitable for quantitative spectroscopy.
SAMPLE + CHROMOGENIC REAGENT → UV-VIS ABSORBING PRODUCT Materials and Equipment:- UV/VIS spectrophotometer and polystyrene cuvettes or quartz cuvettes (Absorption cells), pipette, 10mL graduated cylinders, 250, 100, 50& 25mL volumetric flasks, beakers, Aspirin tablets, Ferric nitrate, Nitric acid, ethanol, sodium salicylate. Procedure:- Preparing the stock solution and standard solutions and sample solution:- 1. Stock solution of sodium salicylate: Weight a 1.16 g of sodium salicylate in beaker,
dissolve the solid by the addition of D.W., than transfer to volumetric flask (1L), and continue adding D.W. to the mark on the volumetric flask.
2. Ferric Nitrate: Dissolve 1.0 g ferric nitrate in 99 mL of water to make a 1% solution of ferric nitrate. (Total volume = 100 mL of 1% ferric nitrate)
3. Nitric Acid I: Prepare 100 mL of 0.07 M nitric acid. 4. Aspirin sample: Accurately record the weight of a group of ten aspirin tablets so that you
can determine an average tablet weight, use a mortar and pestle to crush enough tablets to produce an average (g) tablet powder, using a clean dry weighing bottle (beaker or conical
College of Pharmacy-University of Mustansiriyah 5Th. Year- Practical advance pharmaceutical analysis – 2015 -
10
flask), add 20 mL of ethanol (measure by graduated cylinder), swirl gently to dissolve. (Aspirin is not very soluble in water, the ethanol helps the aspirin dissolve, note that an aspirin tablet contains other compounds in addition to aspirin, some of these are not very soluble, and the solution will be cloudy due to insoluble components of the tablet), add 75mL of NaOH (0.1N) than heat in a water bath to speed up the hydrolysis reaction, avoid boiling, because the sample may decompose, while heating, swirl the beaker occasionally, after 15 minutes, remove sample from the water bath and cool for 5 minutes, than filtered the solution.
Student Preparations: 1. Standard solution: Transfer 5.00 mL of stock solution to a volumetric flask (100mL),
than dilute with D.W. to mark (Its concentration is …… mg/L). 2. Dilute Ferric Nitrate: Mix 5 mL of 1% ferric nitrate with 4 mL of 0.07 M HNO3 (nitric
acid I) and label the container “dilute ferric nitrate.” 3. Unknown solution: Transfer 5.00 mL of Aspirin sample solution to a volumetric flask
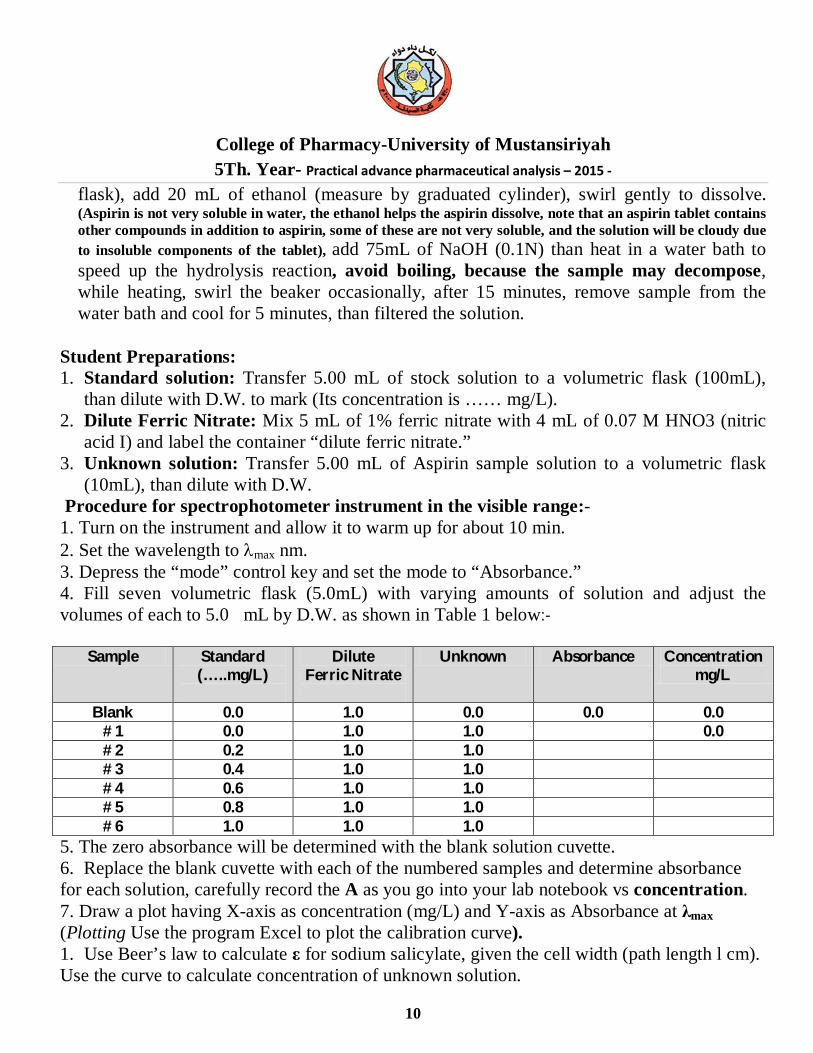
(10mL), than dilute with D.W. Procedure for spectrophotometer instrument in the visible range:- 1. Turn on the instrument and allow it to warm up for about 10 min. 2. Set the wavelength to λmax nm. 3. Depress the “mode” control key and set the mode to “Absorbance.” 4. Fill seven volumetric flask (5.0mL) with varying amounts of solution and adjust the volumes of each to 5.0 mL by D.W. as shown in Table 1 below:-
Sample Standard (…..mg/L)
Dilute Ferric Nitrate
Unknown Absorbance Concentration mg/L
Blank 0.0 1.0 0.0 0.0 0.0 # 1 0.0 1.0 1.0 0.0 # 2 0.2 1.0 1.0 # 3 0.4 1.0 1.0 # 4 0.6 1.0 1.0 # 5 0.8 1.0 1.0 # 6 1.0 1.0 1.0
5. The zero absorbance will be determined with the blank solution cuvette. 6. Replace the blank cuvette with each of the numbered samples and determine absorbance for each solution, carefully record the A as you go into your lab notebook vs concentration. 7. Draw a plot having X-axis as concentration (mg/L) and Y-axis as Absorbance at λmax (Plotting Use the program Excel to plot the calibration curve). 1. Use Beer’s law to calculate ε for sodium salicylate, given the cell width (path length l cm). Use the curve to calculate concentration of unknown solution.
College of Pharmacy-University of Mustansiriyah 5Th. Year- Practical advance pharmaceutical analysis – 2015 -
11
Experiment- 3 Infrared Spectroscopy Experiment
Outcomes:- After completing this experiment, the student should be able to:
The basic principles of vibration spectroscopy. Determine the relationship between molecular structural features and absorptions in
the IR spectrum. Mull technique and disc technique of solid pharmaceutical substance. Calibration of IR spectroscopy.
Introduction:- The infrared spectrum provides the largest number of characteristic properties of a compound. It also serves as a powerful ‘analytical tool’ for the extensive and intensive study of molecular structure, in fact, infrared absorption spectra are due to changes in vibration energy accompanied by changes in rotation energy, broadly speaking, the range in the electromagnetic spectrum that extends from (0.8 -200 µm) is referred to as the infrared region. In usual practice, however, either the wavelength (λ) or the wavenumber (ΰ=cm–1) is employed to measure the position of a given infrared absorption, more precisely, the infrared regions may be categorized into three distinct zones based on their respective wavenumber and wavelength as stated below:-
S. No. Region Wavenumber(cm-1) Wavelength(µm) 1. Near I.R. 12500-4000 0.8-2.5 2. Ordinary I.R. 4000-667 2.5-15 3. Far I.R. 667-50 15-200
Besides, the infrared region is found to be normally rich in peaks by virtue of the fact that there exist a number of vibration modes (3n-6 for any nonlinear molecule, 3n-5 for any linear molecule, where, n = number of atoms). Another school of thought advocates that there are two general regions in the infrared spectrum, namely:-
(a) Group frequency region:- Having a wavelength ranging from (2.5-8µm) and a wavenumber from (4000-1300cm–1) Here, the stretching and bending vibration bonds associated with specific structure or function groups are observed frequently. Example : The C = O stretching vibration is about 1700 cm–1; whereas the C—H stretching vibration is about 3000 cm–1 and both of them are almost independent of the rest of the molecule as depicted:- Stretching vibration found in Group Frequency Region
College of Pharmacy-University of Mustansiriyah 5Th. Year- Practical advance pharmaceutical analysis – 2015 -
12
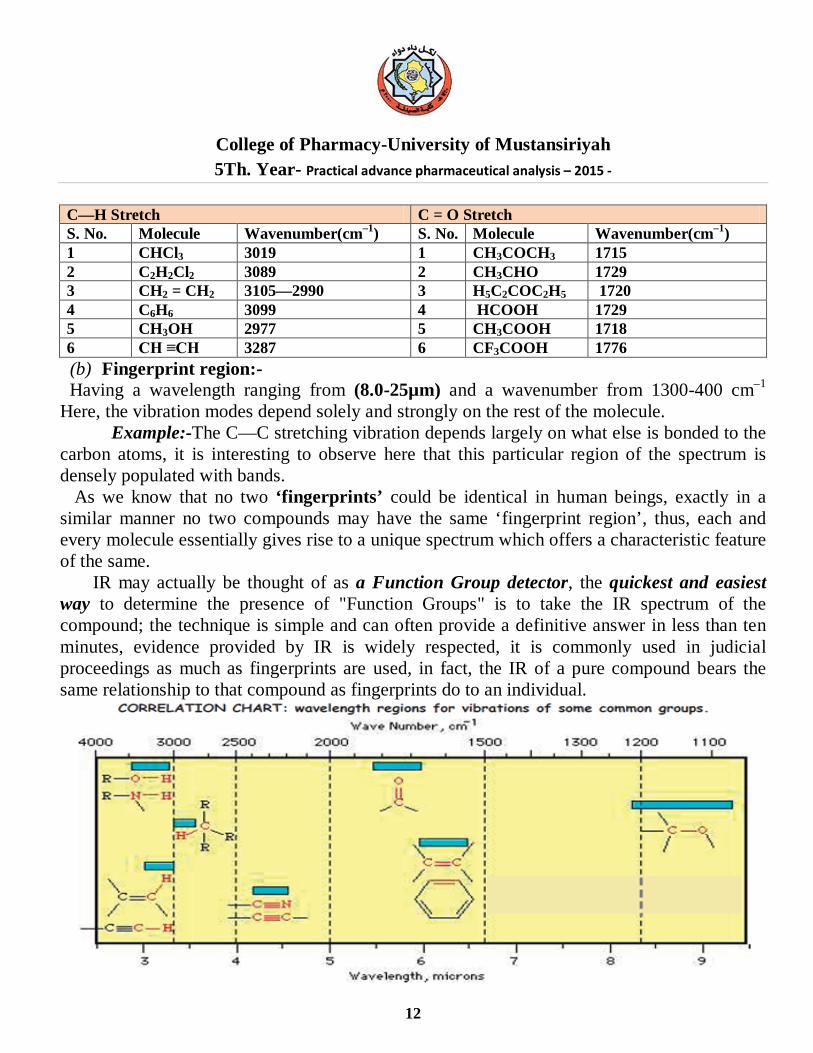
C—H Stretch C = O Stretch S. No. Molecule Wavenumber(cm–1) S. No. Molecule Wavenumber(cm–1) 1 CHCl3 3019 1 CH3COCH3 1715 2 C2H2Cl2 3089 2 CH3CHO 1729 3 CH2 = CH2 3105—2990 3 H5C2COC2H5 1720 4 C6H6 3099 4 HCOOH 1729 5 CH3OH 2977 5 CH3COOH 1718 6 CH ≡CH 3287 6 CF3COOH 1776 (b) Fingerprint region:-
Having a wavelength ranging from (8.0-25µm) and a wavenumber from 1300-400 cm–1
Here, the vibration modes depend solely and strongly on the rest of the molecule. Example:-The C—C stretching vibration depends largely on what else is bonded to the carbon atoms, it is interesting to observe here that this particular region of the spectrum is densely populated with bands. As we know that no two ‘fingerprints’ could be identical in human beings, exactly in a similar manner no two compounds may have the same ‘fingerprint region’, thus, each and every molecule essentially gives rise to a unique spectrum which offers a characteristic feature of the same. IR may actually be thought of as a Function Group detector, the quickest and easiest way to determine the presence of "Function Groups" is to take the IR spectrum of the compound; the technique is simple and can often provide a definitive answer in less than ten minutes, evidence provided by IR is widely respected, it is commonly used in judicial proceedings as much as fingerprints are used, in fact, the IR of a pure compound bears the same relationship to that compound as fingerprints do to an individual.
College of Pharmacy-University of Mustansiriyah 5Th. Year- Practical advance pharmaceutical analysis – 2015 -
13
Calculation of Vibration Frequencies:- The vibration frequency may be calculated with fairly remarkable accuracy by the help of Hooke’s Law “The vibration frequency of a bond is expected to increase when the bond strength increases, and also when the reduced mass of the system decreases”, and is expressed
as: ʋ = 𝟏𝟐ᴫ �
𝑲 µ
& μ = 𝒎𝟏𝒎𝟐
𝒎𝟏+𝒎𝟐
ʋ Frequency, K Force constant of the bond, m1 and m2 = Masses of two atoms, μ the reduced mass of the bond system. Example: Calculate the approximate frequency of the C—H stretching vibration from the following data: K = 500 Nm–1 = 5.0 × 10⁵ g s–2 (since 1 Newton = 103 gm.s–2); mC = mass of the carbon atom = 20 × 10–24 g ; How?(H.W.) mH = mass of the hydrogen atom = 1.6 × 10⁻²⁴ g ; How?(H.W.) Solution:-
μ = 𝒎𝟏𝒎𝟐
𝒎𝟏+𝒎𝟐 = 20 × 10–24 g x1.6 × 10–24 g
20 × 10–24 g +1.6 × 10⁻²⁴ g = 1.48 x10⁻²⁴ g
ʋ = 𝟏𝟐ᴫ �
𝑲 µ
= 𝟕𝟐 𝒙 𝟐𝟐
� 𝟓.𝟎 × 𝟏𝟎𝟓 𝐠.𝐬−𝟐 𝟏.𝟒𝟖 𝐱 𝟏𝟎−𝟐𝟒 𝒈
=9.247 x 10¹³ s-1
c = ƛ ʋ , 𝟏ƛ = ʋ
𝒄 = ύ (wavenumber)
ύ = 𝟗.𝟐𝟒𝟕 𝐱 𝟏𝟎𝟏𝟑 𝒔−𝟏
𝟐.𝟗𝟗𝟖𝒙𝟏𝟎𝟏𝟎𝒄𝒎.𝒔−𝟏= 3084 cm-1
Infrared spectroscopy measures the frequencies of IR light absorbed by a sample and the intensities of the absorptions, the vibration frequencies depend on the nature of the vibration (bending & stretching), bond strengths, and the masses of the atoms involved in the vibration, the intensities depend on the change in dipole moment that accompanies the vibration as well as the number of bonds involved. The energy of infrared radiation is sufficient to change the vibration energy states of a molecule, if the dipole moment of a molecule changes as it vibrates, infrared radiation can interact with the molecule. When the frequency of the radiation matches the frequency of a particular vibration, energy is transferred to the molecule, increasing the amplitude of the vibration. One observes the transfer of energy because light equal in energy to the molecular vibration is absorbed from the beam of incident infrared light. The important point is that the energy involved in a vibration is inversely related to the masses of the atoms involved, that is, the heavier the atoms involved, the lower the energy, What are the relating between ʋ, ύ and λ with mass of atom? (H.W.)
College of Pharmacy-University of Mustansiriyah 5Th. Year- Practical advance pharmaceutical analysis – 2015 -
14
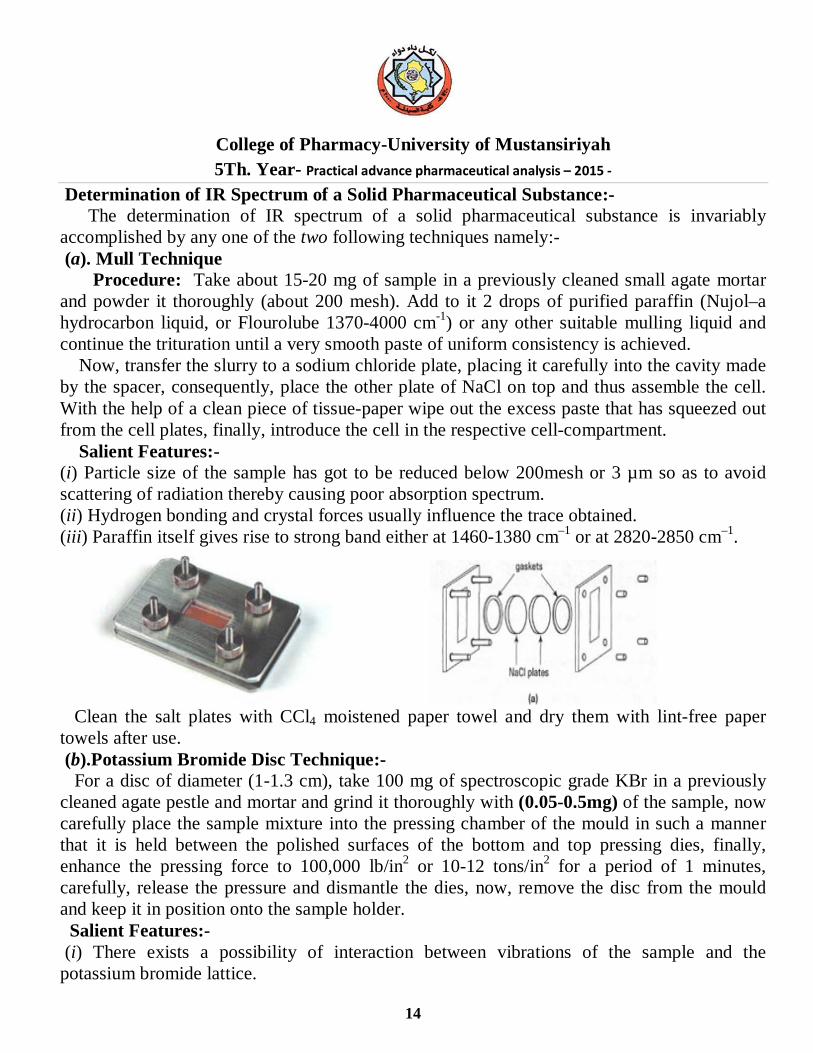
Determination of IR Spectrum of a Solid Pharmaceutical Substance:- The determination of IR spectrum of a solid pharmaceutical substance is invariably accomplished by any one of the two following techniques namely:- (a). Mull Technique Procedure: Take about 15-20 mg of sample in a previously cleaned small agate mortar and powder it thoroughly (about 200 mesh). Add to it 2 drops of purified paraffin (Nujol–a hydrocarbon liquid, or Flourolube 1370-4000 cm-1) or any other suitable mulling liquid and continue the trituration until a very smooth paste of uniform consistency is achieved. Now, transfer the slurry to a sodium chloride plate, placing it carefully into the cavity made by the spacer, consequently, place the other plate of NaCl on top and thus assemble the cell. With the help of a clean piece of tissue-paper wipe out the excess paste that has squeezed out from the cell plates, finally, introduce the cell in the respective cell-compartment. Salient Features:- (i) Particle size of the sample has got to be reduced below 200mesh or 3 µm so as to avoid scattering of radiation thereby causing poor absorption spectrum. (ii) Hydrogen bonding and crystal forces usually influence the trace obtained. (iii) Paraffin itself gives rise to strong band either at 1460-1380 cm–1 or at 2820-2850 cm–1.
Clean the salt plates with CCl4 moistened paper towel and dry them with lint-free paper towels after use. (b).Potassium Bromide Disc Technique:- For a disc of diameter (1-1.3 cm), take 100 mg of spectroscopic grade KBr in a previously cleaned agate pestle and mortar and grind it thoroughly with (0.05-0.5mg) of the sample, now carefully place the sample mixture into the pressing chamber of the mould in such a manner that it is held between the polished surfaces of the bottom and top pressing dies, finally, enhance the pressing force to 100,000 lb/in2 or 10-12 tons/in2 for a period of 1 minutes, carefully, release the pressure and dismantle the dies, now, remove the disc from the mould and keep it in position onto the sample holder. Salient Features:- (i) There exists a possibility of interaction between vibrations of the sample and the potassium bromide lattice.
College of Pharmacy-University of Mustansiriyah 5Th. Year- Practical advance pharmaceutical analysis – 2015 -
15
(ii) It is considered to be the most suitable method for other screening of very minute quantities of substances being eluted from the columns in Gas Liquid Chromatography (GLC), in actual practice, about 300 mg of the spectroscopic grade KBr is placed in a short column immediately after the detector. Consequently, the solid is powdered, pressed into a disc in the normal procedure and ultimately the absorption spectrum of the trapped substance is studied. (iii) It enjoys the advantage of producing spectra absolutely free from any solvent peaks (unlike Mull Technique) and hence it is employed extensively in routine analysis. Internal Standard for KBr-Disc Technique: In quantitative analysis it is essential to examine absolutely uniform discs of identical weights, to achieve this, known weights of both KBr and analyte are required in the preparation of the KBr-disc and finally from the absorption data a calibration-curve may be obtained, in this process, it is a must to weigh the discs and also to measure their thickness at different points Calibration of Infrared Spectroscopy:- The wavelength (or wavenumber) scale calibration of infrared spectroscopy is usually carried out with the aid of a strip of polystyrene film fixed on a frame; it consists of several sharp absorption bands, the wavelengths of which are known accurately and precisely. Basically, all IR-spectroscopes need to be calibrated periodically as per the specific instructions so as to ascertain their accuracy and precision.
College of Pharmacy-University of Mustansiriyah 5Th. Year- Practical advance pharmaceutical analysis – 2015 -
16
Experiment- 4 Applications of IR Spectroscopy
in the Analysis of the Pharmaceutical Substances Determination of Aspirin, Phenacetin and Caffeine in Tablets
Outcomes:- After completing this experiment, the student should be able to:
Explain the IR spectrum of some pharmaceutical substances. Identification of some pharmaceutical substances by IR spectrum.
Introduction:- A host of pharmaceutical substances can be identified and critically examined with the help of infrared spectroscopy; hence, the latest versions of British Pharmacopoeia (BP) and United States Pharmacopoeia (USP) contain the complete IR-spectrum of such pure pharmaceutical substances that are essentially included in the respective official compendium. Example: The infrared absorption spectrum of the following pharmaceutical substances, namely: Ampicillin sodium; Amylobarbitone; Betamethasone; Betamethasone valerate; Carbenicillin disodium; Chloroquine phosphate; Chloroquine sulphate; Cemetidine; Clofazimine; Clofibrate; Clonidine hydrochloride; Cloxacilline sodium; Colchicine Cyclophosphamide; Cyproheptadine hydrochloride; Dexamethasone; Activated dimethicone; Diphenylpyraline hydrochloride; Erythromycin ; Ethambutol hydrochloride; Ethirylestradiol; Ethiosuximide; Fludrocortisone acetate; Fluphenazine hydrochloride; Iburprofen; Diluted isosorbide dinitrate; Lincomycin hydrochloride; Mebendazole; Metoformin hydrochloride; Methdilazine hydrochloride; Methotrexate; Nalidixic acid; Nandrolone decanoate; Nandrolone phenylpropionate; Niclosamide; Nitrofurantoin; Nitrofurazone ; Norethisterone; Oxprenololhy drochloride; Pentazocine hydrochloride; Pentolamine hydrochloride; Phentolamine mesylate; Primidone; Prochlorperazine mesylate; Proguanil hydrochlorde; Pyrazinamide; Pyrimethamine; Rifampicin; Spironolactone; Stilbosterol diphosphate; Sulphadimethoxine; Sulphalene; Sulphamethizole; Testosterone propionate; Thiabendazole; Trifluoperazine hydrochloride; Triflupromazine hydrochloride. The quantity is solely based on the intensities of the carbonyl bands at 1764, 1511 and 1665 cm–1 for aspirin, phenacetin and caffeine respectively. Materials and Equipment: APC-Tablets; Chloroform and IR Spectroscopy. Procedure:
College of Pharmacy-University of Mustansiriyah 5Th. Year- Practical advance pharmaceutical analysis – 2015 -
17
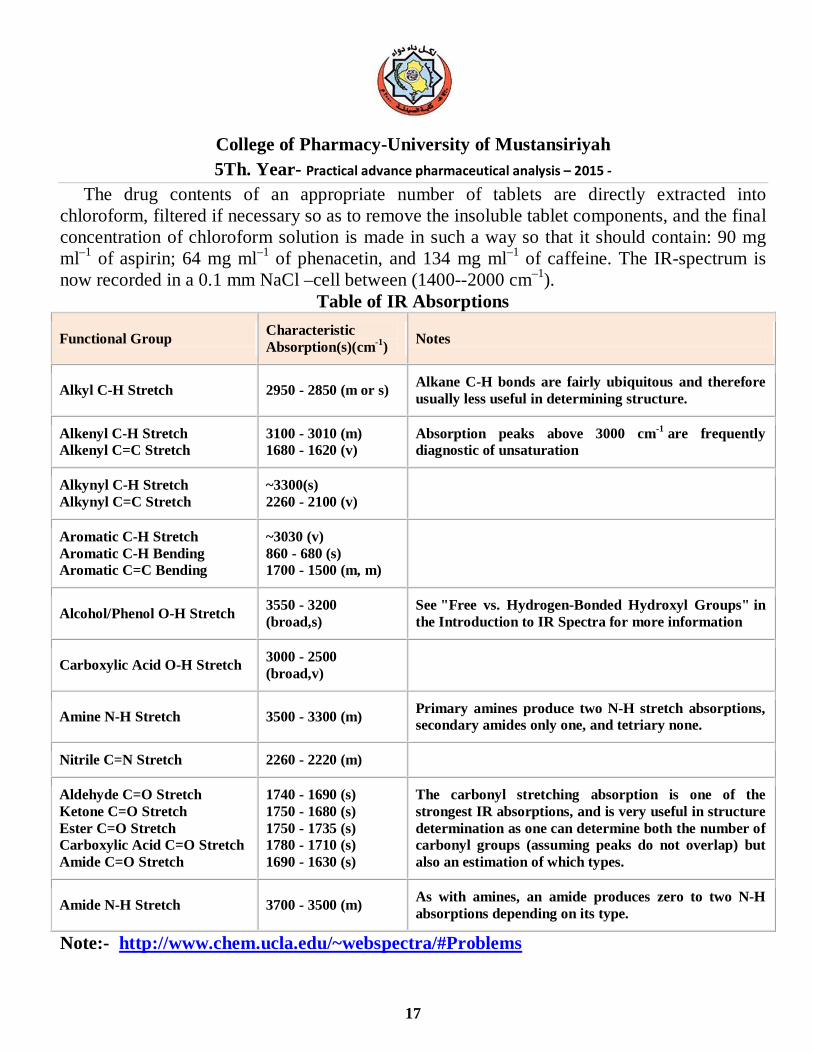
The drug contents of an appropriate number of tablets are directly extracted into chloroform, filtered if necessary so as to remove the insoluble tablet components, and the final concentration of chloroform solution is made in such a way so that it should contain: 90 mg ml–1 of aspirin; 64 mg ml–1 of phenacetin, and 134 mg ml–1 of caffeine. The IR-spectrum is now recorded in a 0.1 mm NaCl –cell between (1400--2000 cm–1).
Table of IR Absorptions
Functional Group Characteristic Absorption(s)(cm-1) Notes
Alkyl C-H Stretch 2950 - 2850 (m or s) Alkane C-H bonds are fairly ubiquitous and therefore usually less useful in determining structure.
Alkenyl C-H Stretch Alkenyl C=C Stretch
3100 - 3010 (m) 1680 - 1620 (v)
Absorption peaks above 3000 cm-1 are frequently diagnostic of unsaturation
Alkynyl C-H Stretch Alkynyl C=C Stretch
~3300(s) 2260 - 2100 (v)
Aromatic C-H Stretch Aromatic C-H Bending Aromatic C=C Bending
~3030 (v) 860 - 680 (s) 1700 - 1500 (m, m)
Alcohol/Phenol O-H Stretch 3550 - 3200 (broad,s)
See "Free vs. Hydrogen-Bonded Hydroxyl Groups" in the Introduction to IR Spectra for more information
Carboxylic Acid O-H Stretch 3000 - 2500 (broad,v)
Amine N-H Stretch 3500 - 3300 (m) Primary amines produce two N-H stretch absorptions, secondary amides only one, and tetriary none.
Nitrile C=N Stretch 2260 - 2220 (m)
Aldehyde C=O Stretch Ketone C=O Stretch Ester C=O Stretch Carboxylic Acid C=O Stretch Amide C=O Stretch
1740 - 1690 (s) 1750 - 1680 (s) 1750 - 1735 (s) 1780 - 1710 (s) 1690 - 1630 (s)
The carbonyl stretching absorption is one of the strongest IR absorptions, and is very useful in structure determination as one can determine both the number of carbonyl groups (assuming peaks do not overlap) but also an estimation of which types.
Amide N-H Stretch 3700 - 3500 (m) As with amines, an amide produces zero to two N-H absorptions depending on its type.
Note:- http://www.chem.ucla.edu/~webspectra/#Problems
College of Pharmacy-University of Mustansiriyah 5Th. Year- Practical advance pharmaceutical analysis – 2015 -
18
Experiment-5 Titration of the ascorbic acid (vitamin C) in tablets
By pH meter used first and 2nd derivatives Outcomes:- After completing this experiment, the student should be able to:
o Calibration of pH meter. o Calculation of first and 2nd derivatives. o Calculate the Ka of weak acid.
Introduction:- In this experiment students analyze a tablet of Vitamin C (or other drug containing this compound) and calculate the percentage of ascorbic acid, H2C6H6O6, present in it.
Vitamin C (ascorbic acid)
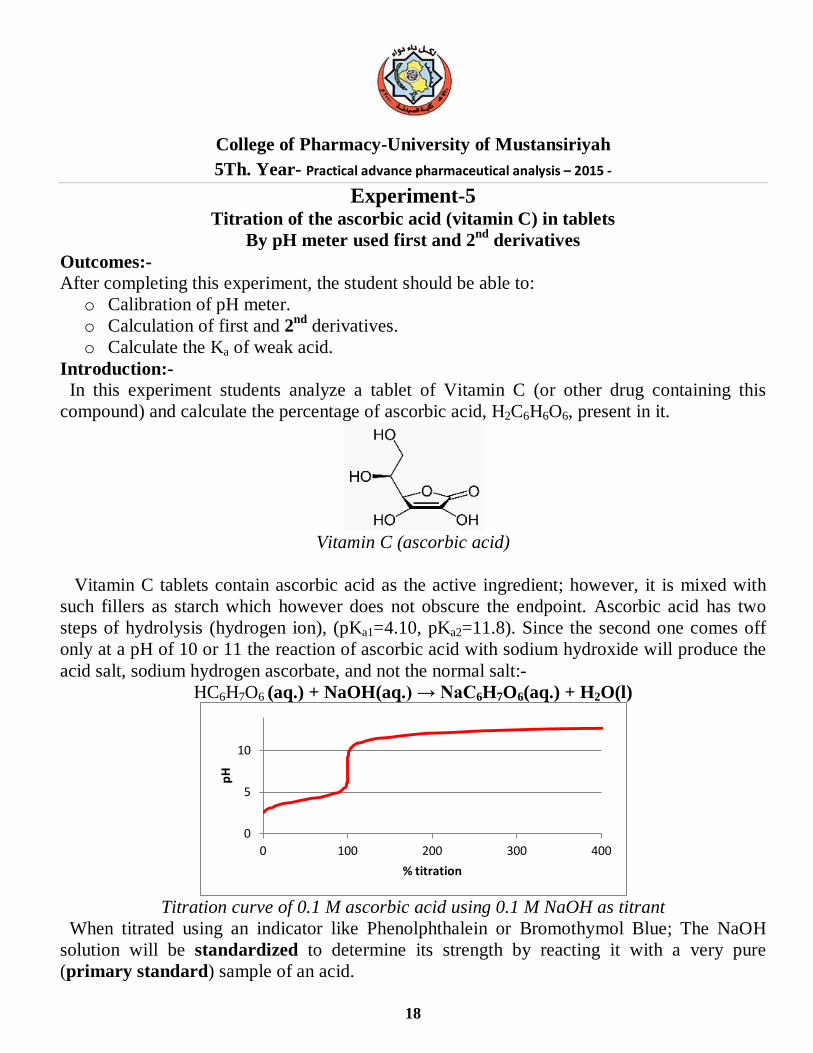
Vitamin C tablets contain ascorbic acid as the active ingredient; however, it is mixed with such fillers as starch which however does not obscure the endpoint. Ascorbic acid has two steps of hydrolysis (hydrogen ion), (pKa1=4.10, pKa2=11.8). Since the second one comes off only at a pH of 10 or 11 the reaction of ascorbic acid with sodium hydroxide will produce the acid salt, sodium hydrogen ascorbate, and not the normal salt:-
HC6H7O6 (aq.) + NaOH(aq.) → NaC6H7O6(aq.) + H2O(l)
Titration curve of 0.1 M ascorbic acid using 0.1 M NaOH as titrant
When titrated using an indicator like Phenolphthalein or Bromothymol Blue; The NaOH solution will be standardized to determine its strength by reacting it with a very pure (primary standard) sample of an acid.
0
5
10
0 100 200 300 400
pH
% titration
College of Pharmacy-University of Mustansiriyah 5Th. Year- Practical advance pharmaceutical analysis – 2015 -
19
Materials and Equipment:- pH meter, buratte, pipette, beker, Vitamin C tablet, Sodium hydroxide, Indicator. Procedure: Place a tablet of Vitamin C in an Erlenmeyer flask, add about 50 mL of warm distilled water, and crush the tablet with a glass stirring rod. Cool down the solution. Add two or three drops of indicator to the flask and titrate with sodium hydroxide solution until the endpoint is reached. Make two independent titrations at least. Result calculation: As seen in the titration curve, vitamin C behaves as mono-protic acid when titrated using Phenolphthalein as indicator. This means that the number of moles of NaOH in titration is equal to the number of moles of the ascorbic acid. Calculate the mass of acid for two titrations and, finally, calculate the arithmetic average of these two results. Compare the result with the factory value. Note:- that since this is a quantitative lab exercise all measurements to be used in calculations must be recorded to the proper number of significant digits. Molecular mass of ascorbic acid is 176.13 g/mol. Record all the numbers obtained and the name of indicator used, as well as the calculations made. Procedure (pH-metric titration)
1. Place a tablet of Vitamin C in an Erlenmeyer flask, add about 50 mL of warm distilled water, and crush the tablet with a glass stirring rod. Cool down the solution.
2. Dilute the sample in your volumetric flask to the total volume of 100-150 mL with distilled water.
3. Place the beaker on magnetic stirrer insert the magnet in it, as well as pH-electrode. Ask the assistant to control the correctness of the installation and some advices.
4. Measure and note pH; Repeat this adding small portions of the titrant base (few drops each), noting also the actual volume of titrant added (total). Finish titration when pH exceeds 12.
Processing the results Using a computer data-sheet, plot the titration curve obtained and determine as exactly as possible the volume of titrant corresponding to the inflection point. For more aspiring students :- The preciseness of determination of the inflection point can be very improved if calculating the second derivative of the titration curve. Record all the numbers obtained, as well as the calculations made.
Note your observation concerning the comparison of your result with the factory value.
College of Pharmacy-University of Mustansiriyah 5Th. Year- Practical advance pharmaceutical analysis – 2015 -
20
Experiment-6 Determination of Mixtures by UV-Vis. Absorption Spectroscopy
Multi-Component Analysis of a Vitamin B Mixture by UV-Vis. Spectroscopy
Outcomes:- After completing this experiment, the student should be able to: 1. Prepare standard solutions of mixture. 2. Prepare 1% of HCl from 36% HCl. 3. The conditions of accurate multi-component determination by UV-Vis. spectroscopy
requires on Beer’s Law. 4. The calculations of determination of Mixtures by UV. Vis. Absorption Spectroscopy. Introduction:- The analysis of a number of components in a sample or mixture is of importance in a number of industries such as pharmaceutical, food, dye and paint manufacturing, quite often these industries are subject to strict rules and regulations regarding safety and quality during product manufacture, there is considerable interest in developing methods to test the final products accurately and reliably whilst reducing the time and cost of testing, many analysis of multi-component systems involve time-consuming sample preparation, as each component of interest needs to be extracted, separated, chemically transformed and purified. Alternatively, they may require different methods of analysis for each component; often the simultaneous analysis of complex multi-component mixtures is not possible; however, multi-component analysis by UV-Vis. spectrometry can be a cheaper and faster alternative to these methods, whilst still providing a high level of accuracy. A UV-Vis. multi-component analysis mathematically separates each component of the sample; this requires the measurement of spectra for known standards of all the components which are present at any significant level in the sample. The mathematical method attempts to minimize the sum of the squares of the residual spectrum; this is done by constructing a matrix of the cross-products of each pair of standard scans, and then solving this with respect to the cross-product of the standard scans with the sample scan, the final step is to calculate the actual sample component concentrations from the known concentrations in each standard. Accurate multi-component determination by UV-Visible spectroscopy requires that the following conditions are met:
1. All components of the mixture can be identified, and absorb within the wavelength range of the instrument.
2. The absorbances of the components in the mixture follow Beer’s law.
College of Pharmacy-University of Mustansiriyah 5Th. Year- Practical advance pharmaceutical analysis – 2015 -
21
3. There is some degree of spectral difference between the components, the greater the similarity between the spectra of the individual components the more difficult the analysis.
4. The spectrum of the mixture is the sum of components, i.e., the components must not interact to cause photometric or wavelength shifts.
5. There should be no interaction between components and the solvent. 6. Very large or very small absorbances should be avoided. 7. There should be no absorbances in the analytical wavelength region due to impurities. If any of these assumptions do not hold, then the multi-component analysis is invalid; in this experiment study, a specific software application program for double beam UV-Vis. spectroscopy was used to calculate concentrations in a Vitamin B group mixture consisting of Vitamin B1 (Thiamine HCl), Vitamin B2 (Riboflavin) and Vitamin B6 (Pyridoxine HCl). A UV-Vis. Spectroscopy running Multi-component software has been used to quantitatively determine the components of a Vitamin B group mixture. The range of double beam UV-Vis. spectroscopy combined with suitable accessories provides a simple and versatile means for the determination of individual component concentrations in a multi-component system. The % differences between the calculated and expected values show that the Multi-component software can be used to quantitatively measure complex mixtures. The application of this software is not limited to determining multi-component mixtures of vitamins; it can be used in a variety of applications provided that the seven conditions given in the introduction are met, and instrument and calculation parameters are optimized for a given application; a double beam UV-Vis. spectroscopy running Multi-component application software was used in this experiment study, the Multi-component software allows full spectral data acquisition, display of graphical and tabular results, and storage and recall of methods and data. Components may be determined from pure or mixed standards using whole scans, a selected scan range or selected wavelengths from the wavelength scans; derivatives (up to the 4th order) of the collected scan may also be used for component determination. Experimental:- Reagents/Materials Stock solutions of vitamins B1 (1000 mg/L), B2 (50 mg/L) and B6 (1000 mg/L) were prepared by dissolving weighed amounts in 100 mL of 1% hydrochloric acid, the stock solutions were used for preparing calibration standards and sample mixtures, the concentrations of the standards and four sample mixtures are given in Table1, the concentrations of the standards were selected to approximate the concentrations of the components in commercial mixtures. A baseline was recorded on 1% hydrochloric acid and the spectra of the standards and mixtures measured over the wavelength range 210 nm to 550 nm; the instrument operating parameters are given in Table2
College of Pharmacy-University of Mustansiriyah 5Th. Year- Practical advance pharmaceutical analysis – 2015 -
22
Table1:- Standard and sample mixture concentrations. Type of Solution
Vitamin B1 (mg/L)
Vitamin B2 (mg/L)
Vitamin B6 (mg/L)
Standard 1 10.0 0.0 0.0 Standard 2 0.0 10.0 0.0
Standard 3 0.0 0.0 10.0 Sample 1 10.0 10.0 10.0
Sample 2 10. 0 10.0 1.0 Sample 3 10. 0 1.0 10.0 1Sample 4 1. 0 10.0 10.0
Table2:- Instrument operating parameters. The reference standards that you prepare will be measured on the UV-Vis. spectroscopy and will give you the following spectra:
At (λ)1 :- AB1(λ1) = εB1(λ1) b CB1S; AB6(λ1) = εB6(λ1) b CB6S; AB12(λ1) = εB12(λ1) b CB12S At (λ)2 :- AB1(λ2) = εB1(λ2) b CB1S; AB6(λ2) = εB6(λ2) b CB6S; AB12(λ2) = εB12(λ2) b CB12S At (λ)3 :- AB1(λ3) = εB1(λ3) b CB1S; AB6(λ3) = εB6(λ3) b CB6S; AB12(λ3) = εB12(λ3) b CB12S
The three equations are taken from absorbances at three different wavelengths: λ1, λ2, λ3 for multi-vitamins mixture solution:- AM(λ1) = εB1(λ)1 b CB1+ εB2(λ)1 b CB2 + εB6(λ)1 b CB6
AM(λ2) = εB1(λ)2 b CB1+ εB2(λ)2 b CB2 + εB6(λ)2 b CB6 AM(λ3) = εB1(λ)3 b CB1+ εB2(λ)3 b CB2 + εB6(λ)3 b CB6
Since ‘b’ is the same in all cases and =1 cm: A1 = εB1(λ)1 CB1+ εB2(λ)1 CB2 + εB6(λ)1 CB6 A2 = εB1(λ)2 CB1+ εB2(λ)2 CB2 + εB6(λ)2 CB6 A3 = εB1(λ)3 CB1+ εB2(λ)3 CB2 + εB6(λ)3 CB6
Upper Wavelength 550 nm Lower Wavelength 210 nm Scan Speed 500 nm/min Wavelength Step 0.21 nm Slit Width 2 nm Beam Mode Double Beam Lamp Change Wavelength 350 nm D2 Lamp On When Necessary
College of Pharmacy-University of Mustansiriyah 5Th. Year- Practical advance pharmaceutical analysis – 2015 -
23
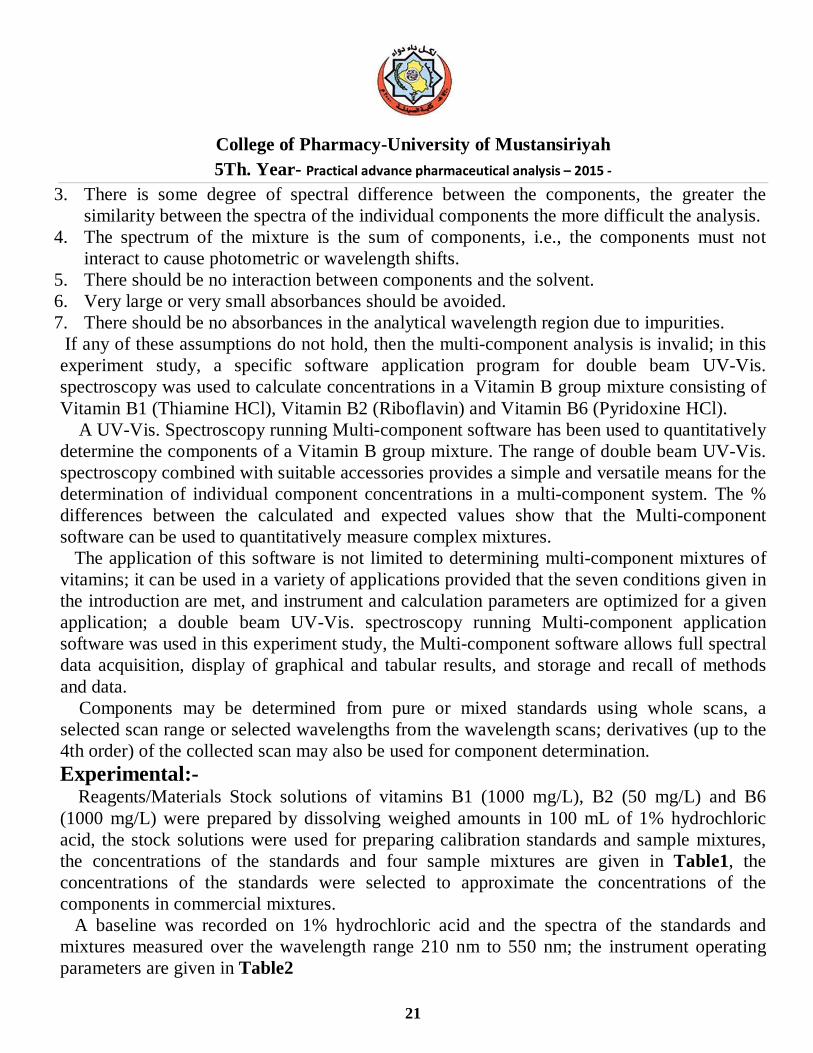
Figure1
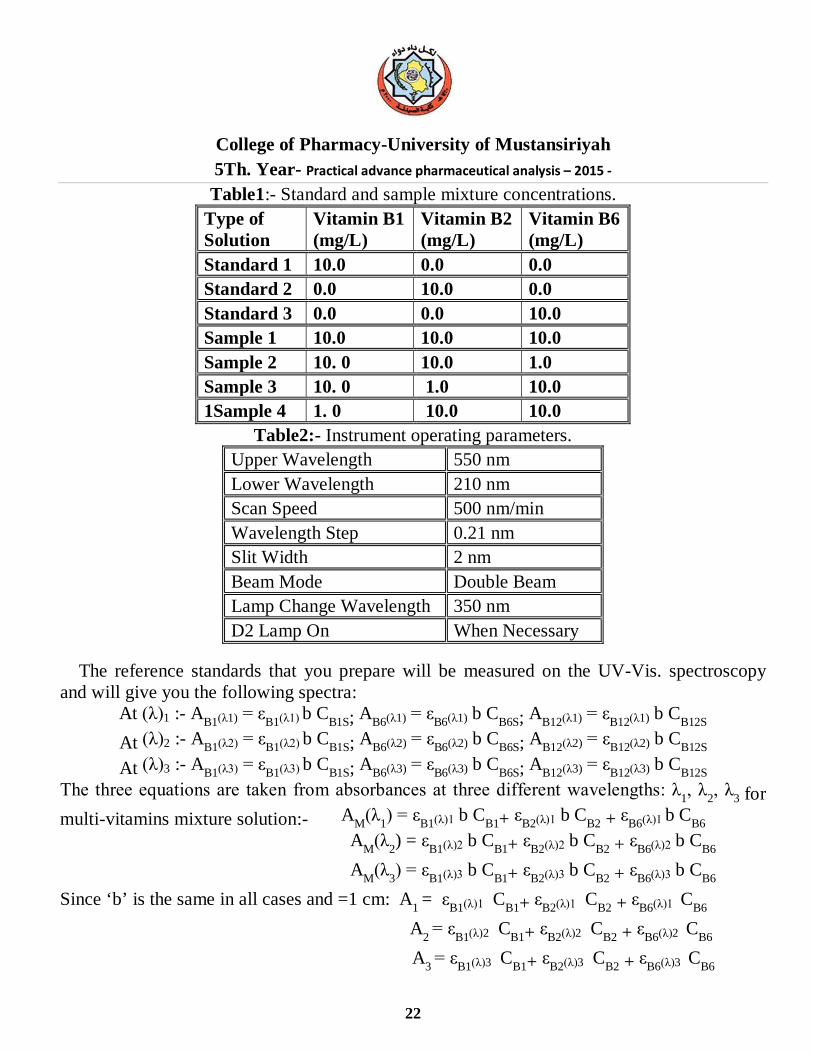
Figure 2
Results:- The spectra of the standards are shown in Figure1; all three components can be quantified, as there is a large degree of spectral difference between the components; Vitamin B2 is the only component that absorbs in the region 300 to 500 nm and has a strong absorption band at 266 nm; Vitamin B6 has a strong absorption band at 290 nm and Vitamin B1 has a strong absorption band at 245 nm:- Figure 2 shows the wavelength scans for samples 1 and 3 as representative examples; the multi-component analysis of the Vitamin B system was optimized by limiting the calculation range to between 225 nm and 500 nm; in the region above 500 nm there is no absorbance from any component, and in the region below 225 nm the spectra of the components have little structure; The results of the multi-component analysis using this reduced wavelength range are shown in Table3; the simplest way to validate the selected method of calculation is to re-measure the standards as samples and check the accuracy of results; as can be seen in Table3, the comparison of the calculated and expected results for the standards re-measured shows
College of Pharmacy-University of Mustansiriyah 5Th. Year- Practical advance pharmaceutical analysis – 2015 -
24
agreement to within 1.5%, thus validating the selected data collection and calculation parameters; the results in table3 for samples 1 to 4 show that the multi-component calculations are accurate for the chosen calculation parameters (compare with Table 1). For samples with relatively high concentrations of a component the calculated results are within 5% of the expected results. However, the % difference between the expected and calculated values increases slightly as the concentrations of individual components decreases. Generally, sample concentrations can be calculated to within 2–5%.
Table3. Printout of multi-component analysis using wavelength range 225 to 500 nm Standard Type Pure Components
Component Conc. mg/L Vitamin B1 10.0 Vitamin B2 10.0 Vitamin B6 10.0
Sample Component Conc. mg/L 1 9.52 9.78 9.96 2 5.17 4.81 5.25 3 9.93 10.13 1.13 4 9.60 0.98 9.64 5 0.87 10.07 10.24
College of Pharmacy-University of Mustansiriyah 5Th. Year- Practical advance pharmaceutical analysis – 2015 -
25
Experiment-7
Determination of Caffeine and Acetylsalicylic Acid in an Analgesic Tablet by UV-Vis. Spectroscopy
Outcomes:- After completing this experiment, the student should be able to: 1. The calculations of determination of Caffeine and Acetylsalicylic Acid in an Analgesic
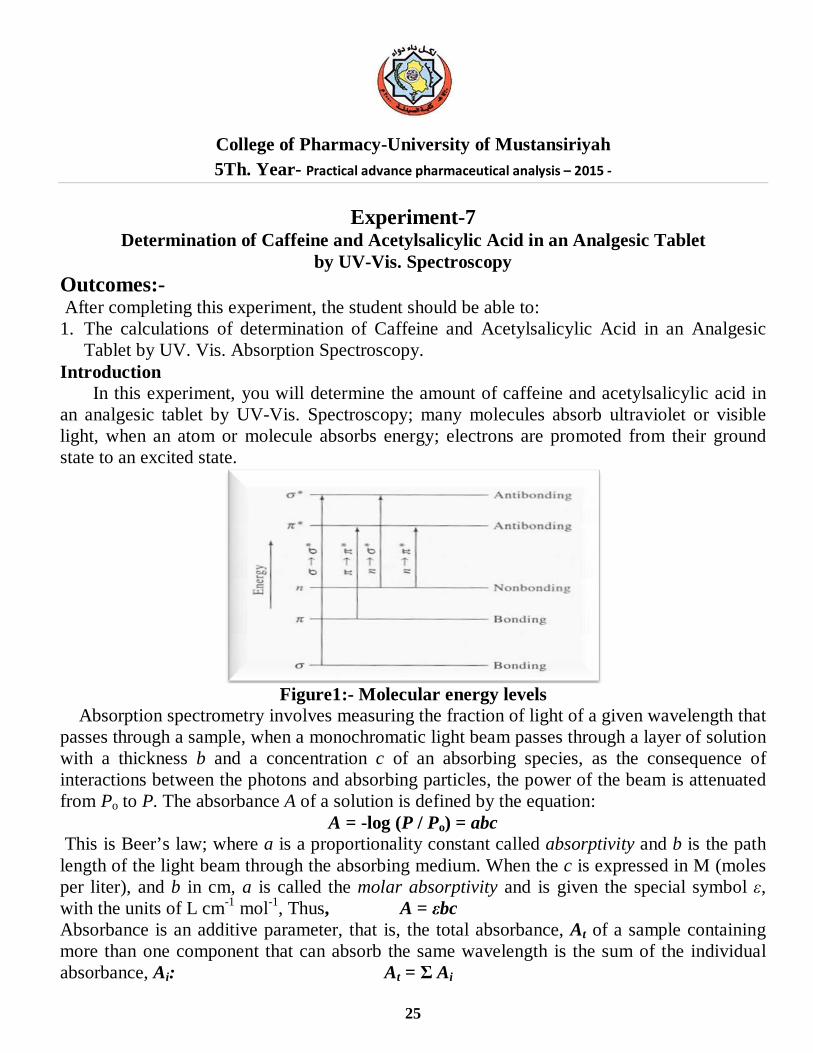
Tablet by UV. Vis. Absorption Spectroscopy. Introduction In this experiment, you will determine the amount of caffeine and acetylsalicylic acid in an analgesic tablet by UV-Vis. Spectroscopy; many molecules absorb ultraviolet or visible light, when an atom or molecule absorbs energy; electrons are promoted from their ground state to an excited state.
Figure1:- Molecular energy levels
Absorption spectrometry involves measuring the fraction of light of a given wavelength that passes through a sample, when a monochromatic light beam passes through a layer of solution with a thickness b and a concentration c of an absorbing species, as the consequence of interactions between the photons and absorbing particles, the power of the beam is attenuated from Po to P. The absorbance A of a solution is defined by the equation:
A = -log (P / Po) = abc This is Beer’s law; where a is a proportionality constant called absorptivity and b is the path length of the light beam through the absorbing medium. When the c is expressed in M (moles per liter), and b in cm, a is called the molar absorptivity and is given the special symbol ε, with the units of L cm-1 mol-1, Thus, A = εbc Absorbance is an additive parameter, that is, the total absorbance, At of a sample containing more than one component that can absorb the same wavelength is the sum of the individual absorbance, Ai: At = Σ Ai
College of Pharmacy-University of Mustansiriyah 5Th. Year- Practical advance pharmaceutical analysis – 2015 -
26
The additive characteristic of A enables absorption measurement to be applicable to multi-component analysis without separation of the components using simultaneous equations to determine the concentrations, in this case it is necessary that the absorptivity of the substances be different at various wavelengths but not necessary zero for one of the components. In this experiment, there are two components caffeine and acetylsalicylic acid in the analgesic tablet; you will first determine the molar absorptivity ε of each component by constructing a calibration curve (absorbance vs. concentration) with standard solutions; then by measuring absorbance of the tablet solution at maximum absorption wavelength of both components, you will be able to figure out the amount of each component in the tablet. Reagent:-
Methanol, reagent grade; Caffeine; Acetylsalicylic acid; and Analgesic tablet Preparation of solutions
1. Caffeine stock solution – Dissolve 0.024 g of caffeine in 50 mL volumetric flask with methanol and dilute to the mark.
2. Acetylsalicylic acid (ASA) stock solution – Dissolve 0.024 g of ASA in 50 mL volumetric flask with methanol and dilute to the mark.
3. Analgesic sample solution – Dissolve 0.06~0.09 g of an analgesic tablet or the content of an analgesic capsule with 20 mL of methanol in 50 mL volumetric flask with methanol and dilute to the mark. Make three sample solutions out of three tablets.
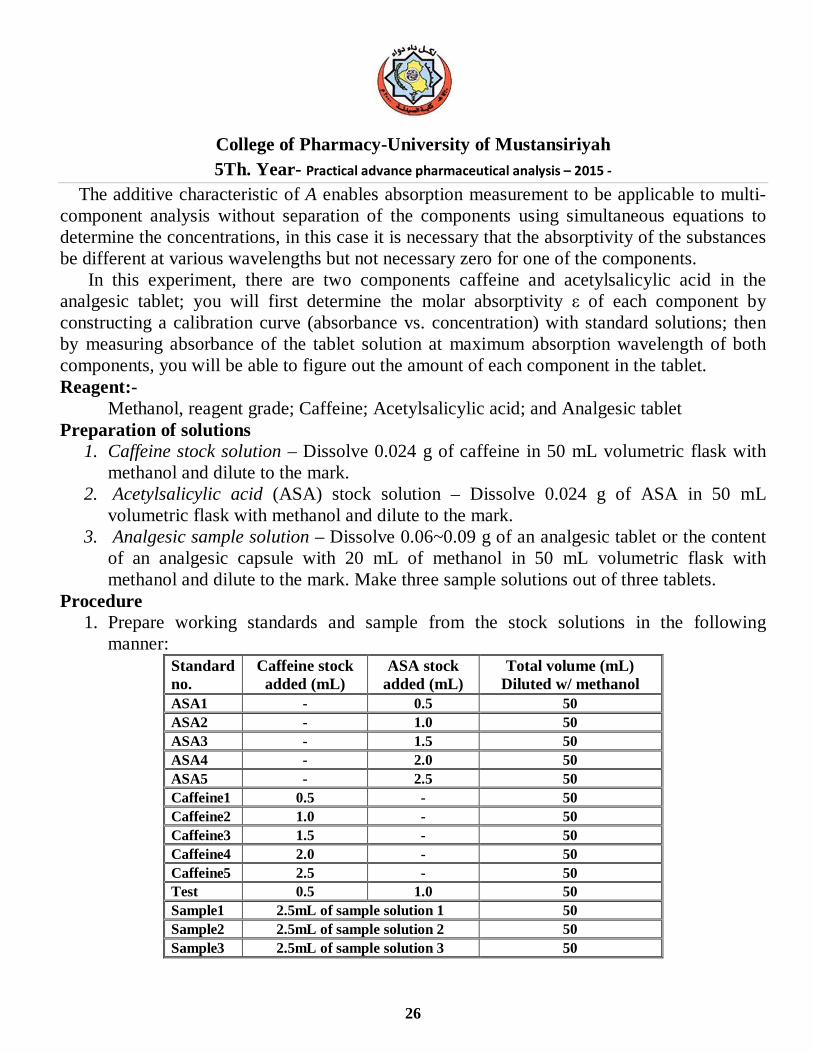
Procedure 1. Prepare working standards and sample from the stock solutions in the following
manner: Standard no.
Caffeine stock added (mL)
ASA stock added (mL)
Total volume (mL) Diluted w/ methanol
ASA1 - 0.5 50 ASA2 - 1.0 50 ASA3 - 1.5 50 ASA4 - 2.0 50 ASA5 - 2.5 50 Caffeine1 0.5 - 50 Caffeine2 1.0 - 50 Caffeine3 1.5 - 50 Caffeine4 2.0 - 50 Caffeine5 2.5 - 50 Test 0.5 1.0 50 Sample1 2.5mL of sample solution 1 50 Sample2 2.5mL of sample solution 2 50 Sample3 2.5mL of sample solution 3 50
College of Pharmacy-University of Mustansiriyah 5Th. Year- Practical advance pharmaceutical analysis – 2015 -
27
2. Run the spectra for ASA5 and Caffeine5; determine the wavelength of maximum absorbance (λmax) for each chemical.
3. For each solution in the table, measure the absorbance at the two selected wavelengths. Data Treatment
1. Tabulate the absorbance at the two selected wavelengths and concentration for the ASA and caffeine standard solutions.
2. Plot absorbance vs. concentration (M) for both caffeine and ASA at the two selected wavelengths. Determine molar absorptivity for each component at those two wavelengths from the calibration curve.
3. Calculate the expected absorbance for test at each wavelength and compare to that of the experimental values.
4. Determine the weight percent of each component in the original analgesic tablets and report the standard deviation.
5. Compare your result with the amount labeled on the bottle and report the precision of your results.
Questions 1. Would benzene be a satisfactory solvent for the analysis? 2. If a pharmaceutical mixture has three components with different maximum absorbance, comment the possibility of determining all three components simultaneously. 3. Would it be more desirable to use spectra grade methanol for the blank solution? Justify your answer. Note
1. If at any time any sampling variable changes including integration time, averaging, boxcar smoothing, distance from light source to sample, etc. you must store a new reference and dark spectrum.
2. Turn the light source power on. The switch is located at the back on the cuvette holder. Allow half an hour for the lamp to warm up before the experiment starts.
College of Pharmacy-University of Mustansiriyah 5Th. Year- Practical advance pharmaceutical analysis – 2015 -
28
Experiment-8 UV-Vis. Spectroscopy Calibration
Outcomes:- After completing this experiment, the student should be able to: 1. Calibration of the UV-VIS instrument. 2. Use of multichannel absorption spectrophotometers. Introduction:- Absorption of light by solution is one of the oldest and still one of the more useful instrumental methods. The wavelength of light that a compound will absorb is characteristic of its chemical structure. Specific regions of the electromagnetic spectrum are absorbed by exciting specific types of molecular and atomic motion to higher energy levels. Absorption of microwave radiation is generally due to excitation of molecular rotational motion. Infrared absorption is associated with vibration motions of molecules. Absorption of visible and ultraviolet (UV) radiation is associated with excitation of electrons, in both atoms and molecules, to higher energy states. All molecules will undergo electronic excitation following absorption of light, but for most molecules very high energy radiation (in the vacuum ultraviolet, <200 nm) is required. For molecules containing conjugated electron systems however, light in the UV-visible region is adequate (e.g., benzene absorbs in the 260 nm region). As the degree of conjugation increases, the spectrum shifts to lower energy. Thus naphthalene absorbs light up to 300 nm, and anthracene absorbs to about 400 nm. Because absorption spectra are characteristic of molecular structure, they can be used to qualitatively identify atomic and molecular species. The amount of light, I, transmitted through a solution of an absorbing chemical in a transparent solvent can be related to its concentration by Beers Law: A= ε b C Where A is the absorbance (a defined quantity, also referred to as the optical density, or OD), b is the cell path length in cm, C is the solution concentration in moles/liter, and ε λ is the molar Absorptivity, (also referred to as the molar extinction coefficient) which has units of liter/mole.cm (i.e., A is a unit less quantity). Notice that ελ is a function of wavelength, and it is the quantity which represents the spectrum of the solution, when its value is stated, it must be stated for a particular wavelength (e.g. ε532), the only exception to this is when its value at the peak of the spectrum is given, in which case it may be denoted as ε max, thus absorption spectroscopy can be used to quantify the amount of chemical present in an unknown solution. Instrumentation Currently, research grade UV-VIS absorption instruments come in two configurations. The first is called a scanning spectrophotometer because it measures the intensity of transmitted light of a narrow band pass, and scans the wavelength in time in order to collect a spectrum,
College of Pharmacy-University of Mustansiriyah 5Th. Year- Practical advance pharmaceutical analysis – 2015 -
29
because absorption is a ratio metric measurement, these instruments generally require the user to measure two spectra, one sample and one blank, the blank should be identical to the sample in every way except that the absorbing species of interest is not present, this can be done either consecutively with a single beam instrument followed by the ratio calculation, or simultaneously with a dual beam instrument, the dual beam method is faster, and has the added advantage that lamp drift and other slow intensity fluctuations are properly accounted for in the ratio calculation, collecting spectra with scanning spectrophotometers is slow, but the instruments often have very high resolving power owing to the use of photomultiplier tube detectors, which can be used with very narrow slit widths. Preliminary Preparations Before turn the instrument so that the light sources have a chance to warm up and stabilize. Next prepare or gather all of the samples which you will need to perform the experiment. Solutions which students need to prepare are marked with:- 1. a) Use 50 ml volumetric flasks to prepare 4 solutions containing 0.04, 0.03, 0.02, and 0.01
g/L of K2CrO4 in 0.05 N KOH prepared from stock solutions provided. (0.1 g/L K2CrO4 and 0.5 N KOH). b) A 0.05 N KOH blank.
2. a) Solutions containing 25, 50, and 75 ppm of phenol in water from a stock solution of 250 ppm phenol in water. b) A distal water blank.
I. Calibration of a UV-Vis Spectrometer A. Wavelength Calibration Solutions of rare earth ions exhibit very narrow absorption bands, the wavelengths of which are well known. Holmium has many peaks well spaced in wavelength which provide convenient calibration points, you will calibrate the wavelength of the spectroscopy with a sample of Holmium oxide immobilized in a polymer block, measure the spectrum of the solution using the UV-Vis Photodiode Array Spectrometer. Check the apparent wavelength of the absorption peaks which should be at 287.0, 361.1, 450.8, 537.0, and 640.4 nm. Use the Peak/Spectrum function to annotate each peak, and then print the entire spectrum and the wavelength report to determine the exact wavelength maxima. B. Photometric Calibration Basic potassium chromate is recommended as a photometric standard by the National Bureau of Standards, you have been given a solution containing 0.1 g/L of K2CrO4 and a solution 0.5 N in KOH, from which you prepared solutions containing 0.04, 0.03, 0.02 and 0.01 g/L K2CrO4 in 0.05 N KOH. Measure the spectra of these solutions on the spectroscopy and read the absorbance at 370 nm. Use FIXED WAVELENGTH under METHOD then specify the wavelength.
College of Pharmacy-University of Mustansiriyah 5Th. Year- Practical advance pharmaceutical analysis – 2015 -
30
To save time and paper, all the spectra can be overlaid then printed. Be sure to correct the wavelength as needed according to the results in part I.A. Check for linearity of response and also for proper slope in the response curve. The absorbance of your most concentrated solution should be 0.9914. Any relative deviation of over 1% from linearity or from the proper slope is cause for concern. Calculate the molar Absorptivity for K2CrO4 from the slope of a plot of absorbance versus concentration, and compare it with the accepted value of 4790 liter/mole/cm.
College of Pharmacy-University of Mustansiriyah 5Th. Year- Practical advance pharmaceutical analysis – 2015 -
31
Experiment-9 Spectrophotometric
Determination of Iron in a Vitamin Tablet Outcomes:- After completing this experiment, the student should be able to:
Determine the mass of iron contained in a commercially available vitamin tablet. Introduction:- The element that is found in the fourth greatest abundance in the earth’s crust is also encountered everywhere in biological systems, these two facts about iron are not unrelated as nature has found it logical to adapt this plentiful element to perform a variety of functions, the fact that iron has two readily accessible oxidation states, Fe (II) and Fe(III), also contributes to its usefulness as an active component of proteins. The average adult human body contains 4-6 g of iron, in human beings, the majority of iron present is found in the blood in a protein called hemoglobin, the function of this protein is to transport oxygen from the lungs to the various tissues in the body where it is used to produce energy, one of the byproducts of this metabolism, carbon dioxide, is then transported back to the lungs by hemoglobin. Humans obtain the iron necessary for the formation of hemoglobin from their diet in foods such as meat and leafy, green vegetables, when the dietary intake is deficient in iron, a condition called anemia results, someone who is anemic exhibits a lack of energy and often unusually pale skin tone (the red color of blood is also a result of the presence of iron in hemoglobin). Dietary supplements of iron in the form of vitamin tablets can be administered to help alleviate this condition, the tablets you will examine contain iron in the form of ferrous fumarate [Fe(II)(C4H2O4
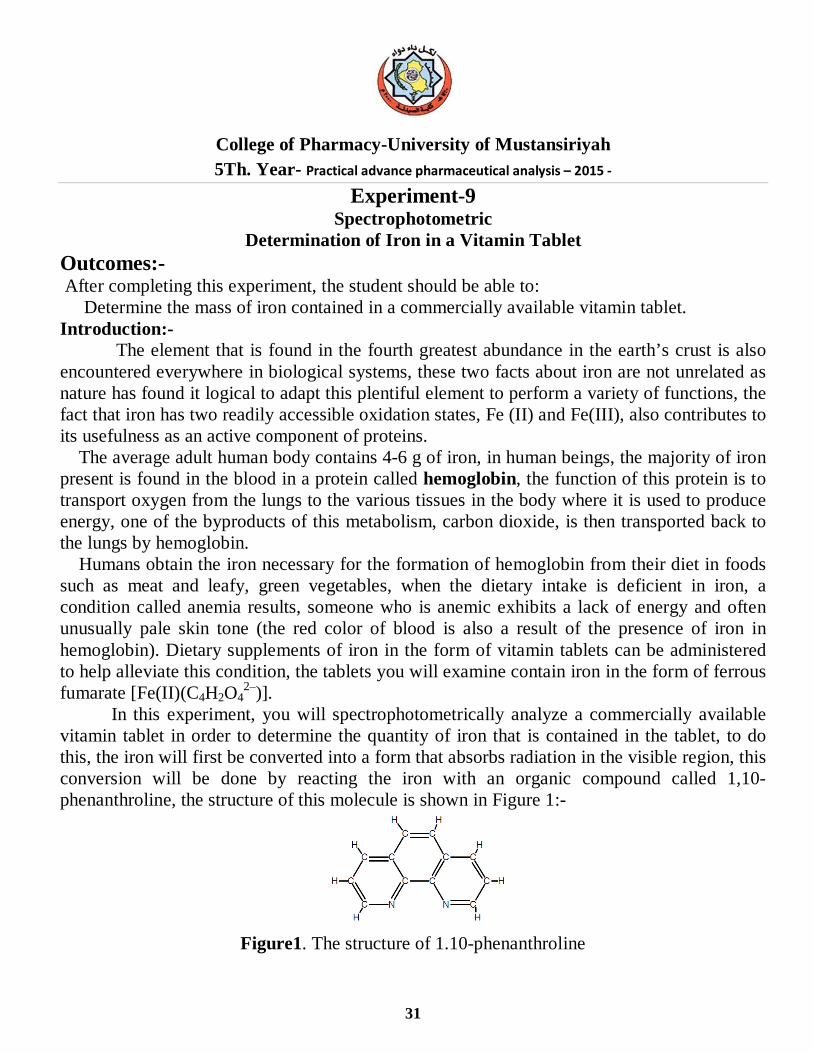
2–)]. In this experiment, you will spectrophotometrically analyze a commercially available vitamin tablet in order to determine the quantity of iron that is contained in the tablet, to do this, the iron will first be converted into a form that absorbs radiation in the visible region, this conversion will be done by reacting the iron with an organic compound called 1,10-phenanthroline, the structure of this molecule is shown in Figure 1:-
Figure1. The structure of 1.10-phenanthroline
College of Pharmacy-University of Mustansiriyah 5Th. Year- Practical advance pharmaceutical analysis – 2015 -
32
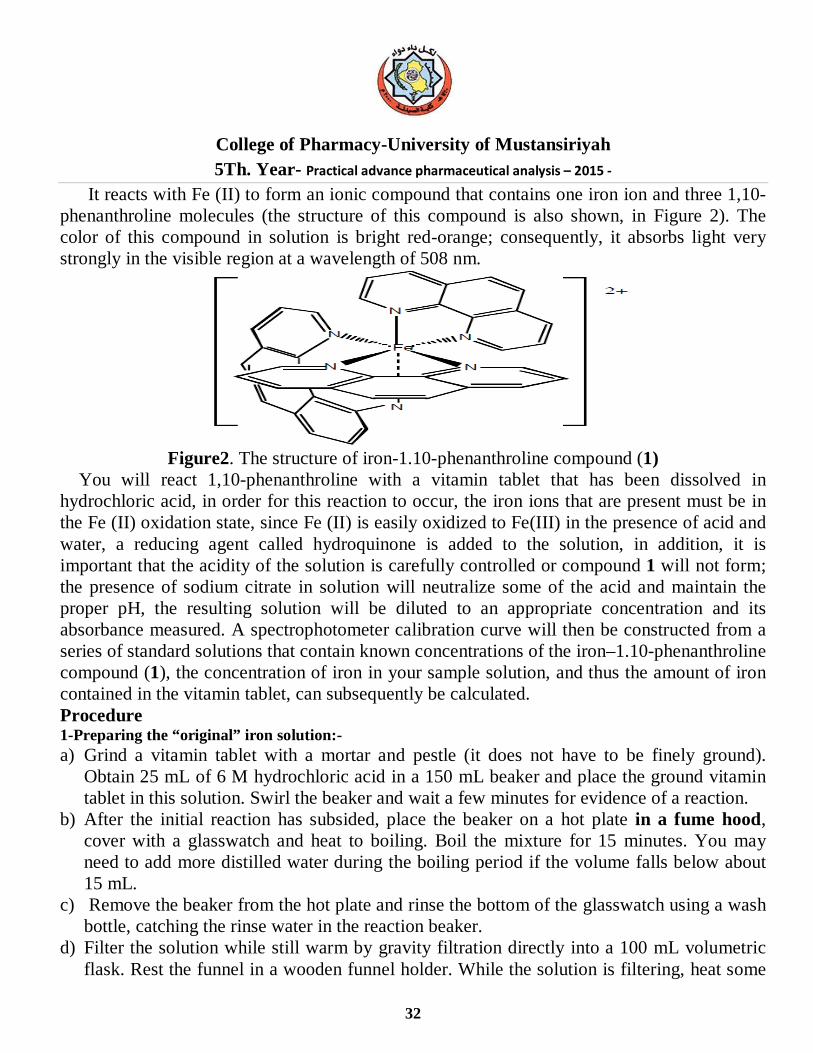
It reacts with Fe (II) to form an ionic compound that contains one iron ion and three 1,10-phenanthroline molecules (the structure of this compound is also shown, in Figure 2). The color of this compound in solution is bright red-orange; consequently, it absorbs light very strongly in the visible region at a wavelength of 508 nm.
Figure2. The structure of iron-1.10-phenanthroline compound (1)
You will react 1,10-phenanthroline with a vitamin tablet that has been dissolved in hydrochloric acid, in order for this reaction to occur, the iron ions that are present must be in the Fe (II) oxidation state, since Fe (II) is easily oxidized to Fe(III) in the presence of acid and water, a reducing agent called hydroquinone is added to the solution, in addition, it is important that the acidity of the solution is carefully controlled or compound 1 will not form; the presence of sodium citrate in solution will neutralize some of the acid and maintain the proper pH, the resulting solution will be diluted to an appropriate concentration and its absorbance measured. A spectrophotometer calibration curve will then be constructed from a series of standard solutions that contain known concentrations of the iron–1.10-phenanthroline compound (1), the concentration of iron in your sample solution, and thus the amount of iron contained in the vitamin tablet, can subsequently be calculated. Procedure 1-Preparing the “original” iron solution:- a) Grind a vitamin tablet with a mortar and pestle (it does not have to be finely ground).
Obtain 25 mL of 6 M hydrochloric acid in a 150 mL beaker and place the ground vitamin tablet in this solution. Swirl the beaker and wait a few minutes for evidence of a reaction.
b) After the initial reaction has subsided, place the beaker on a hot plate in a fume hood, cover with a glasswatch and heat to boiling. Boil the mixture for 15 minutes. You may need to add more distilled water during the boiling period if the volume falls below about 15 mL.
c) Remove the beaker from the hot plate and rinse the bottom of the glasswatch using a wash bottle, catching the rinse water in the reaction beaker.
d) Filter the solution while still warm by gravity filtration directly into a 100 mL volumetric flask. Rest the funnel in a wooden funnel holder. While the solution is filtering, heat some
College of Pharmacy-University of Mustansiriyah 5Th. Year- Practical advance pharmaceutical analysis – 2015 -
33
distilled water in a 250 mL beaker on a hot plate. When the filtration is completed, use small amounts of this hot water to rinse out the beaker, pouring the rinse water on the solid residue contained in the filter paper such that it filters into the 100 mL volumetric flask. Then use small amounts of the hot water to wash the residue two more times. Be careful not to overshoot the mark on the volumetric flask with these rinses. Turn off the hot plate. Allow the solution in the volumetric flask to cool to room temperature, then dilute to the mark with distilled water and mix. Be sure to add the final amount of water to the volumetric flask with a dropper so that you do not overshoot the calibration mark! This solution in the volumetric flask is what we will call the “original” iron solution. Pour this solution into a clean, dry 250 mL Erlenmeyer flask, label it with the words “Original Iron Solution” and set aside. Rinse the volumetric flask three times with small portions of distilled water, discarding the rinses into the sink.
The first dilution Obtain a 5 mL volumetric pipet and rinse it two or three times with small portions of the solution contained in the Erlenmeyer flask , Pipet 5 mL of the iron solution into the volumetric flask, dilute to the mark with water and mix. Label the volumetric flask "Flask A". [Set aside the Original Iron Solution in case you make a mistake during the dilution procedures. When you are finished with the experiment, pour this solution into the Laboratory Byproducts jar labeled Iron + HCl.] Determining the amount of sodium citrate required to maintain the proper pH Obtain a 10 mL volumetric pipet and rinse it two or three times with small portions of the solution contained in Flask A (the volumetric flask). Label a clean, dry 125 mL Erlenmeyer flask "Flask B", then pipet 10 mL of the solution in Flask A into Flask B. Obtain about 8 mL of sodium citrate solution in a graduated cylinder and a strip of indicator paper. Add the sodium citrate solution dropwise to the solution in Flask B, counting the drops as you add them. After you have added 10 drops, test the solution with the indicator paper. The paper should turn yellow-green, indicating that a pH between 3 and 4 has been reached (a color chart will be available for comparison purposes). If a pH lower than 3 is indicated, continue to add sodium citrate solution drop wise, checking the solution with the indicator paper after every four or five drops until the proper color is reached. If a pH higher than 4 is indicated, start over with a new 10 mL aliquot of the solution from Flask A, and add less than 10 drops of sodium citrate before testing the pH. Record the total number of drops of sodium citrate that were required to reach a pH of 3 to 4 in your notebook. The second dilution and conversion of iron to the iron-1,10-phenanthroline compound Label a clean, dry 250 mL Erlenmeyer flask "Flask C". Pour the contents of Flask A into Flask C and set aside. Rinse the volumetric flask (Flask A) with distilled water (discard the rinses in the sink).
College of Pharmacy-University of Mustansiriyah 5Th. Year- Practical advance pharmaceutical analysis – 2015 -
34
Pipette 10 mL of the solution in Flask C into the volumetric flask. Add the same number of drops of sodium citrate that were required to properly neutralize the solution (the number recorded in your notebook). Then add 2 mL of hydroquinone solution and 3 mL of 1,10-phenanthroline solution to the volumetric flask and swirl. Dilute to the mark with distilled water and mix thoroughly. Let this solution stand for at least 15 minutes before measuring the absorbance. [You may discard the contents of Flasks B and C in the sink.] Preparing the calibration curve and measuring the absorbance of the sample solution Note: never put acetone into a cuvette as it will “cloud” the plastic. The standard solutions contain the iron- 1,10-phenanthroline compound, 1, in water at the following concentrations: 0.500 x 10⁻⁵ M; 1.00 x 10⁻⁵ M; 2.00 x 10⁻⁵ M; 3.00 x 10⁻⁵ M; 5.00 x 10⁻⁵ M . Rinse the cuvette with three small portions of the solution you wish to measure, then fill the cuvette and place it in spectroscopy. Repeat until you have measured the absorbances for all the standard solutions, when you have acquired an absorbance reading for each standard solution, calibration curve. Questions 1. The presence of a dirty fingerprint on the cuvette during measurement of the sample solution resulted in the number of milligrams of iron per tablet being reported incorrectly. Do you think the number reported was too high or too low? Explain why. 2. Can you think of other metals, besides iron, that are essential for human life? Name at least three. What are some dietary sources of these other metals? 3. List the important sources of error in this experiment and what effect each would have on the results. Discuss in particular any errors that you may have made. In the determination of iron we convert it into iron(III)-thiocyanate complex, distinguished red color. We follow the procedure: 1. Pipet 5 mL of the stock Fe+3 solution (~0.001 M) and 3 mL of saturated NH4SCN into a
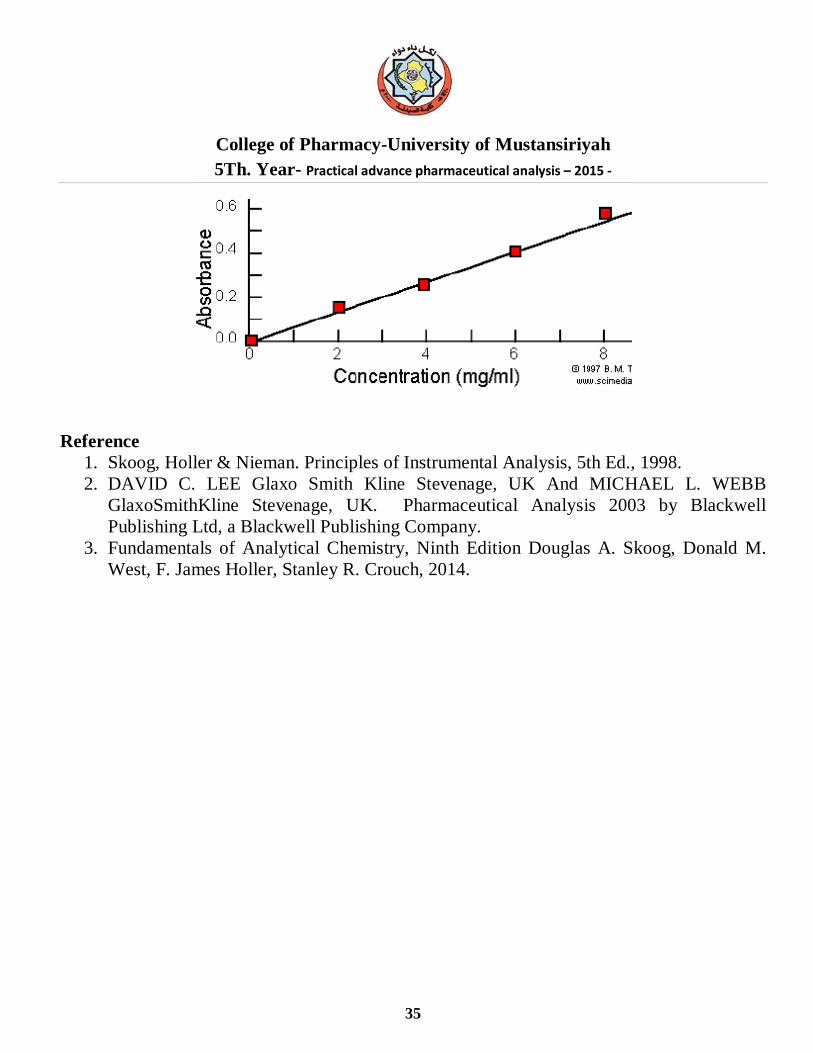
clean 100 mL volumetric flask and dilute to volume. 2. Place some of the solution in the cuvette of the UV/Vis; 3. Scan the solution with the UV-VIS (Change the wavelength at certain speed). 4. Record the wavelength of maximum absorbance. 5. Measure the absorbance, 6. Make 4 - 5 standard concentration solutions of Fe(III) (1.0 X 10⁻³ M to 1.0 X 10⁻⁵ M and
measure absorbance at the wavelength of maximum absorbance. 7. Plot absorbance versus concentration. 8. Treat unknown sample solutions in the same way (Thiocyanate); 9. Measure the absorbance of unknown sample solutions. 10. Refer these absorbance values to their related concentrations in the calibration graph.
College of Pharmacy-University of Mustansiriyah 5Th. Year- Practical advance pharmaceutical analysis – 2015 -
35
Reference
1. Skoog, Holler & Nieman. Principles of Instrumental Analysis, 5th Ed., 1998. 2. DAVID C. LEE Glaxo Smith Kline Stevenage, UK And MICHAEL L. WEBB
GlaxoSmithKline Stevenage, UK. Pharmaceutical Analysis 2003 by Blackwell Publishing Ltd, a Blackwell Publishing Company.
3. Fundamentals of Analytical Chemistry, Ninth Edition Douglas A. Skoog, Donald M. West, F. James Holler, Stanley R. Crouch, 2014.
College of Pharmacy-University of Mustansiriyah 5Th. Year- Practical advance pharmaceutical analysis – 2015 -
36
Related Documents