Denver Metropolitan Area and North Front Range 8-Hour Ozone State Implementation Plan Emissions Inventory DRAFT FINAL October 29, 2008

Welcome message from author
This document is posted to help you gain knowledge. Please leave a comment to let me know what you think about it! Share it to your friends and learn new things together.
Transcript
Denver Metropolitan Area and North Front Range 8-Hour Ozone State Implementation Plan
Emissions Inventory
DRAFT FINAL October 29, 2008


DRAFT FINAL - Denver Metro Area/North Front Range 8-hr Ozone SIP – Emission Inventory
i
Table of Contents
1 Introduction to the Emission Inventory ...................................................................... 1 2 Summary of Emission Inventory for 2006 and 2010 Base Case ................................ 2 3 Summary of Emission Inventory for 2010 Control Case............................................ 9 4 VOC and NOx Motor Vehicle Emission Budgets .................................................... 13
4.1 Proposed 2010 Emissions Budgets for the Denver Metro and North Front Range 8-Hour Ozone Subareas..................................................................................... 15
5 Highway Vehicle Sources......................................................................................... 17 5.1 Ethanol Marketshare Assumptions ................................................................... 21 5.2 2006 Base Year Input to the Mobile Model for Adams, Arapahoe, Boulder, Broomfield, Denver, Douglas and Jefferson Counties ................................................. 22 5.3 2006 Base Year Input to the Mobile Model for Larimer and Weld Counties . 23 5.4 2010 Base Year Input to the Mobile Model for Adams, Arapahoe, Boulder, Broomfield, Denver, Douglas and Jefferson Counties ................................................. 23 5.5 2010 Base Year Input to the Mobile Model for Larimer and Weld Counties .. 24 5.6 2010 Control Case Input to the Mobile Model for Adams, Arapahoe, Boulder, Broomfield, Denver, Douglas, and Jefferson Counties ................................................ 25 5.7 2010 Control Case Input to the Mobile Model for Larimer and Weld Counties 26
6 Non-Road Mobile Sources........................................................................................ 27 6.1 Locomotive Emissions...................................................................................... 28 6.2 Aircraft and Airport Emissions – Denver International Airport....................... 28
7 Stationary Sources .................................................................................................... 29 7.1 Area Sources (Non-Oil and Gas) ...................................................................... 29 7.2 Point Source Emissions..................................................................................... 30
7.2.1 Electrical Generation Utilities (EGUs) ..................................................... 30 7.3 Oil and Gas Emissions ...................................................................................... 32
7.3.1 Calculation of Emission Reductions From the Oil and Gas Industry....... 33 8 References................................................................................................................. 39
DRAFT FINAL - Denver Metro Area/North Front Range 8-hr Ozone SIP – Emission Inventory
ii
List of Tables
Table 1. Demographic Data ............................................................................................... 3 Table 2. Base Case Inventories for 8-Hour Ozone DMA/NFR NAA ................................ 8 Table 3. VOC Base Case and Control Case Emission Inventory ..................................... 11 Table 4. NOx Base Case and Control Case Emission Inventory...................................... 12 Table 5. Subarea and Nonattainment Area-Wide 2010 Motor Vehicle Emission Budgets
................................................................................................................................... 15 Table 6. Distribution of VMT between the Budget Subareas (2010) ............................... 16 Table 7. Emissions summary for July 11 -17 Period from CAMx Ozone Modeling ....... 19 Table 8. 2006 Emissions Modeling Comparison.............................................................. 20 Table 9. 2010 Emissions Modeling Comparison.............................................................. 20 Table 10. 2006 Base Year NONROAD Model Input ....................................................... 27 Table 11. 2010 Base Year and Control Case NONROAD Model Input .......................... 27 Table 12. Non-Oil and Gas Area Sources - Comparison of 2002 and 2005 NEI ............ 29 Table 13. Reconstructed Count of Small Tanks with VOC Emissions Less than 5 Tons
per Year..................................................................................................................... 35 Table 14. Small Condensate Tanks................................................................................... 36 Table 15. Large Condensate Tanks................................................................................... 37 Table 16. Nonattainment Area Pneumatic Devices Emissions......................................... 38
List of Figures
Figure 1. Denver Metro Area and North Front Range 8-Hour Ozone Emission Budget
Subareas .................................................................................................................... 14 Figure 2. Number of Large Tanks by Emission Rate ....................................................... 34
DRAFT FINAL - Denver Metro Area/North Front Range 8-hr Ozone SIP – Emission Inventory
1
1 Introduction to the Emission Inventory This portion of the Technical Support Document (TSD) provides greater detail and
technical information to supplement the description of the Emission Inventory presented
in other Denver Metro Area and North Front Range 8-hour ozone state implementation
plan (SIP) documents.
For additional detail on the emission inventory, see:
• Morris R., E. Tai, Tanarit Sakulyanontvittaya, D. McNally and C. Loomis. 2008a.
“2010 Ozone Attainment Demonstration Modeling for the Denver 8-Hour Ozone
State Implementation Plan Control Strategy.” ENVIRON International
Corporation, Novato, California. Prepared for Denver Regional Air Quality
Council (RAQC), Denver, Colorado. September 22, 2008.
<http://www.colorado.gov/airquality/documents/deno308/Denver_2010ControlStr
at_Draft_Sep22_2008.pdf>
• Morris R., E. Tai, Tanarit Sakulyanontvittaya, D. McNally and C. Loomis. 2008b.
“Model Performance Evaluation for the June-July 2006 Ozone Episode for the
Denver 8-Hour Ozone State Implementation Plan.” ENVIRON International
Corporation, Novato, California. Prepared for Denver Regional Air Quality
Council (RAQC), Denver, Colorado. August 29, 2008.
<http://www.colorado.gov/airquality/documents/deno308/Denver_2006MPE_Draf
tFinal_Aug29_2008.pdf

DRAFT FINAL - Denver Metro Area/North Front Range 8-hr Ozone SIP – Emission Inventory
2
2 Summary of Emission Inventory for 2006 and 2010 Base Case This section presents emissions inventories for the SIP nonattainment area, 2006 base
case, and the 2010 base case used in the modeling scenarios. Inventories for the 8-hour
ozone control area 2010 control case modeling are presented later in this document and
include the additional control measures that are included in the attainment
demonstration for the 8-hour ozone National Ambient Air Quality Standard (NAAQS). All
of the base and control case inventories are for the 8-hour ozone nonattainment area
(NAA), which includes the counties of Denver, Jefferson Douglas, Broomfield, Boulder,
Adams, Arapahoe, and portions of Weld1 and Larimer2 counties. These inventories in
tons per summer day (tpsd) represent emissions estimates for an average episode day
during the peak summer ozone season (May through September).
The emission estimates were developed based on the most recent vehicle miles traveled
(VMT) estimates contained in: 1) Denver Regional Council of Government’s (DRCOG)
conformity analysis for the updated fiscally constrained element of the 2035 Regional
Transportation Plan; 2) North Front Range Transportation and Air Quality Planning
Council’s (NFRTAQPC) 2035 Regional Transportation Plan; 3) the Air Pollution Control
Division (APCD) estimates of VMT derived from data provided by the Colorado
Department of Transportation (CDOT); and 4) Population estimates from the State
Demographer. Demographic data are presented in Table 1.
1 That portion of Weld County that lies south of a line described as follows: Beginning at a point on Weld County’s eastern boundary and Logan County’s western boundary intersected by 40 degrees, 42 minutes, 47.1 seconds north latitude, proceed west on 40 degrees, 42 minutes, 47.1 seconds north latitude until this line intersects Weld County’s western boundary and Larimer County’s eastern boundary. 2 That portion of Larimer County (including part of Rocky Mountain National Park) that lies south of a line described as follows: Beginning at a point on Larimer County’s eastern boundary and Weld County’s western boundary intersected by 40 degrees, 42 minutes, and 47.1 seconds north latitude, proceed west to a point defined by the intersection of 40 degrees, 42 minutes, 47.1 seconds north latitude and 105 degrees, 29 minutes, and 40.0 seconds west longitude, thence proceed south on 105 degrees, 29 minutes, 40.0 seconds west longitude to the intersection with 40 degrees, 33 minutes and 17.4 seconds north latitude, thence proceed west on 40 degrees, 33 minutes, 17.4 seconds north latitude until this line intersects Larimer County’s western boundary and Grand County’s eastern boundary.
DRAFT FINAL - Denver Metro Area/North Front Range 8-hr Ozone SIP – Emission Inventory
3
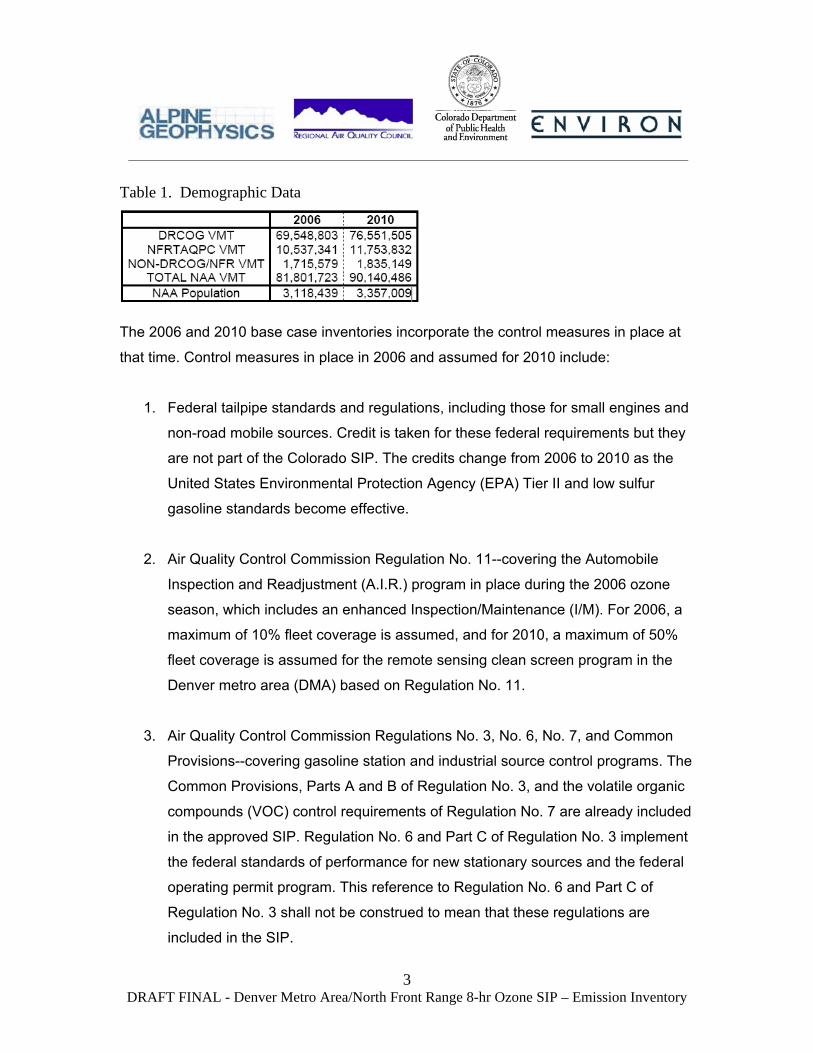
Table 1. Demographic Data
The 2006 and 2010 base case inventories incorporate the control measures in place at
that time. Control measures in place in 2006 and assumed for 2010 include:
1. Federal tailpipe standards and regulations, including those for small engines and
non-road mobile sources. Credit is taken for these federal requirements but they
are not part of the Colorado SIP. The credits change from 2006 to 2010 as the
United States Environmental Protection Agency (EPA) Tier II and low sulfur
gasoline standards become effective.
2. Air Quality Control Commission Regulation No. 11--covering the Automobile
Inspection and Readjustment (A.I.R.) program in place during the 2006 ozone
season, which includes an enhanced Inspection/Maintenance (I/M). For 2006, a
maximum of 10% fleet coverage is assumed, and for 2010, a maximum of 50%
fleet coverage is assumed for the remote sensing clean screen program in the
Denver metro area (DMA) based on Regulation No. 11.
3. Air Quality Control Commission Regulations No. 3, No. 6, No. 7, and Common
Provisions--covering gasoline station and industrial source control programs. The
Common Provisions, Parts A and B of Regulation No. 3, and the volatile organic
compounds (VOC) control requirements of Regulation No. 7 are already included
in the approved SIP. Regulation No. 6 and Part C of Regulation No. 3 implement
the federal standards of performance for new stationary sources and the federal
operating permit program. This reference to Regulation No. 6 and Part C of
Regulation No. 3 shall not be construed to mean that these regulations are
included in the SIP.

DRAFT FINAL - Denver Metro Area/North Front Range 8-hr Ozone SIP – Emission Inventory
4
4. Since 2004, gasoline sold in the Denver metro area during the summer Reid
Vapor Pressure (RVP) ozone season (June 1 to September 15) has been subject
to a national RVP limit of 7.8 pounds per square inch (psi) to reduce fuel
volatility. For ethanol-blended fuels, the RVP limit is 8.8 psi due to the federal 1.0
psi RVP waiver for ethanol.
Since 1991, gasoline sold in the Larimer and Weld area during the summer
ozone season (June 1 to September 15) has been subject to a national RVP limit
of 9.0 psi to reduce fuel volatility. For ethanol-blended fuels, the RVP limit is 10.0
psi due to the federal 1.0 psi RVP waiver for ethanol.
For 2006, the RVP of gasoline for the Denver metropolitan portion of
nonattainment area was determined by survey to be at 8.2 psi, with an ethanol
market share of 60%, and for the Larimer and Weld portion of the nonattainment
area the RVP was determined to be 8.4 psi with the same ethanol share of 60%.
For purposes of the base case 2010 mobile source inventory, the RVP of the
base gasoline is assumed to be 7.8 psi for the Denver metropolitan portion of
nonattainment area, with an ethanol market share of 85%, and for the Larimer
and Weld portion of the nonattainment area the RVP was assumed to be 9.0 psi
with an ethanol share of 25%.
5. The EPA approved the EAC Ozone Action Plan (OAP) on August 19, 2005. The
OAP included an amendment to Regulation No. 7 requiring the reduction of flash
emissions of volatile organic compounds from condensate collection, storage,
processing and handling operations by May 1, 2005. This initial rule required the
installation of air pollution control technology to achieve a system-wide 47.5%
reduction from uncontrolled emissions of volatile organic compounds from new
and existing oil and gas exploration and production operations located within the
8-hour ozone nonattainment area designated by EPA for operators with total
emissions greater than 30 tons per year. The 2006 base case estimate was

DRAFT FINAL - Denver Metro Area/North Front Range 8-hr Ozone SIP – Emission Inventory
5
developed from actual reported emissions based on the system-wide 47.5%
reduction requirement.
6. In February 13, 2008, the EPA approved revisions to Regulation No. 7 to require
the system-wide reduction of condensate tank flash VOC emissions of 75% for
the 2007 ozone season by May 1, 2007 and 78% reduction for the 2012 ozone
season, with technology that achieves a 95% reduction in VOC emissions. The
2010 base case emissions estimate assumes the 75% system-wide reduction
requirement.
7. The effect of EPA final locomotive Tier 3 standards were considered and
included, where appropriate, in the 2010 area source estimates. Tier 4
locomotive standards do not go into effect until 2015 and therefore were not
included in the 2010 inventories.
All of the inventories in this 8-hour Ozone Attainment SIP were developed using EPA
approved emissions modeling methods, including EPA’s MOBILE6 model and local VMT
data for on-road mobile source emissions, EPA’s non-road model and local demographic
information for area and off-road sources, and reported actual emissions for point
sources. Estimates for future emissions are based on the above-mentioned tools and the
EPA’s Economic Growth and Analysis System (EGAS) model for estimating future point
sources activity, VMT growth for on-road mobile sources, and 2010 and 2012
demographic data for off-road and area sources. The technical support document
contains detailed information on model assumptions and parameters for each source
category.
Highway mobile source emissions are from the ENVIRON Consolidated Community
Emissions Processing Tool (CONCEPT) model inventory, which is based on DRCOG
VMT data and MOBILE6 input data provided by APCD and expanded to the entire NAA
based on VMT from the North Front Range Transportation and Air Quality Planning
Council and CDOT.

DRAFT FINAL - Denver Metro Area/North Front Range 8-hr Ozone SIP – Emission Inventory
6
Non-road source emissions are from the EPA Non-Road Model. This model includes the
impact of future controls on non-road engines, which is used in equipment such as lawn
and garden equipment and construction equipment. Oil and gas source emissions are
from the revised Independent Petroleum Association of Mountain States (IPAMS)
inventory, and were projected to 2010 using the methodology in the IPAMS projection
methodology document. The IPAMS inventory was sponsored by the IPAMS and is
Phase III of a regional oil and gas emission inventory for the Inter-Mountain West jointly
with the Western Regional Air Partnership (WRAP).
Non-oil and gas area source emissions (including heating, consumer solvent use,
aircraft and railroads, etc.) are from the 2002 EPA National Emissions Inventory (NEI),
grown to 2006 and 2010 by population growth from data from the State Demographer.
Consumer solvent emission reductions based on 75% of the per-person reductions listed
in the EPA May 30, 2007 Emission Reduction Credit Memo were applied to the
projected 2010 non-oil and gas area source inventory. A check on the non-oil and gas
area sources estimates comparing the recently available 2005 NEI emissions data is
shown later in this document. An inventory completed in 2005 for Denver International
Airport (DIA) was used for aircraft and airport non-road source emissions from DIA for
both 2006 and 2010.
Non-oil and gas point source emissions were grown to 2010 by the EPA EGAS
economic model, and by adding sources for which permits have been issued.
Emissions of VOC and nitrogen oxides (NOx) from biogenic sources have been
generated by the Model of Emissions of Gases and Aerosols from Nature (MEGAN)
Biogenic Emissions Model using land cover data base of biomass type and density and
hourly meteorology data. The National Center of Atmospheric Research (NCAR) has
produced a global data base of land use data, the MEGAN Driving Variable Database
Version 1.2, for use with MEGAN. Surface temperatures are provided by the Mesoscale
Meteorological Model (MM5) modeling.
DRAFT FINAL - Denver Metro Area/North Front Range 8-hr Ozone SIP – Emission Inventory
7
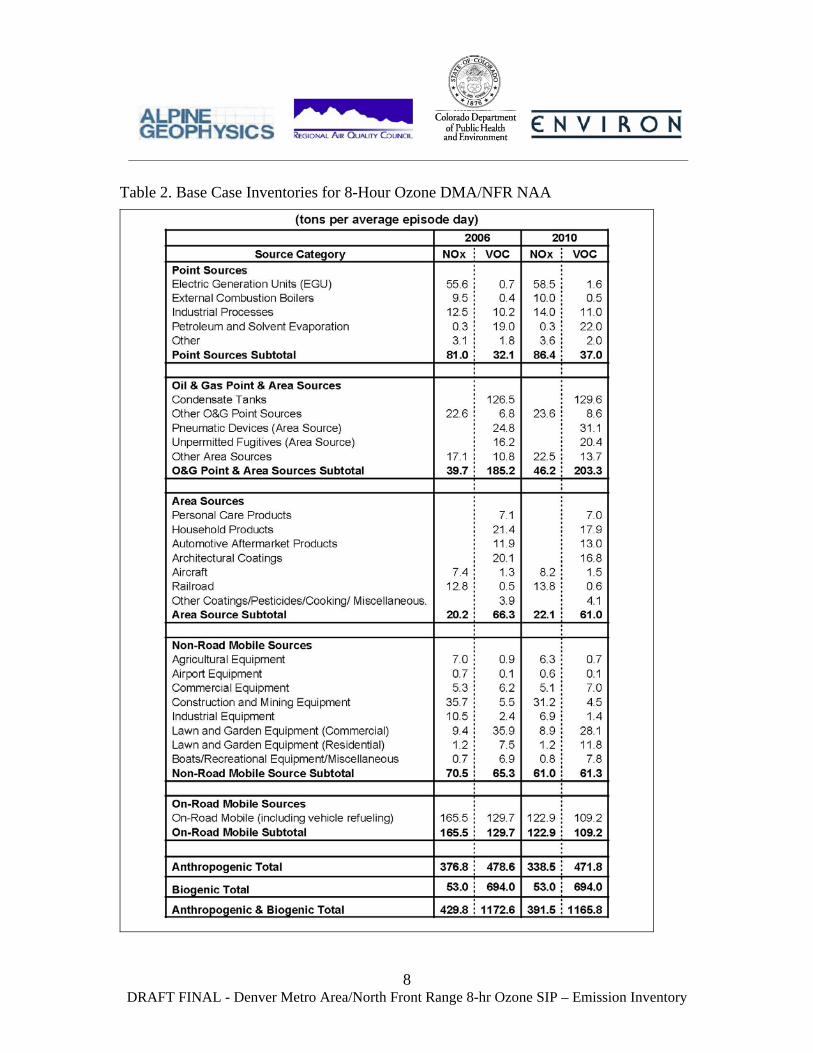
Summaries of the VOC and NOx base case inventories for the nonattainment area for
2006 and 2010 are presented in Table 2. Emissions of NOx and VOCs are in tons per
average episode day. Additional detail on the categories of emissions can be found in
the TSD.
Wildfire emissions, though not included in tables, have been considered for the
background ozone concentrations in the modeling effort. Wildfire emissions can vary
significantly on a day-to-day basis depending on conditions.
DRAFT FINAL - Denver Metro Area/North Front Range 8-hr Ozone SIP – Emission Inventory
8
Table 2. Base Case Inventories for 8-Hour Ozone DMA/NFR NAA
DRAFT FINAL - Denver Metro Area/North Front Range 8-hr Ozone SIP – Emission Inventory
9
3 Summary of Emission Inventory for 2010 Control Case Reductions from the control measures described in the “Denver Metro Area & North
Front Range 8-Hour Ozone Attainment Plan” have been applied to the 2010 base case
emissions inventories to provide an additional safety margin as follows:
• Reid Vapor Pressure of base gasoline to be 7.8 pounds per square inch (psi)
(maintains 1.0 psi waiver for ethanol-blended gasoline at 85% market share) in
North Front Range--estimated 3 tons per day (tpd) VOC reduction to direct
onroad mobile source emissions and in refueling (gas station) emissions.
• Controls on new condensate tanks ≥ 2 tons per year (tpy) and existing tanks ≥10
tpy--estimated 24 tpd reduction in VOC based on an assumed Rule Effectiveness
adjustment of 0.83 applied to the calculated actual emissions reduction.
• New and existing pneumatic control devices required to be low-bleed devices--
approximately 19 tpd VOC reduction based on an assumed Rule Effectiveness
adjustment of 0.83.
• Tighten Regulation No. 11 I/M cut-points--1 tpd VOC, 3 tpd NOx and 13 tpd CO.
• Additional Regulation No. 3 and No. 7 changes--no additional credit assumed.
Rule Effectiveness (RE) reflects the actual ability of a regulatory program for controlled
point sources or source categories to achieve the emissions reductions required by
regulation. During the Air Quality Control Commission (AQCC) 2006 rule making on
Regulation No. 7 revisions related to controls on condensate tank emissions, new EPA
guidance on RE was reviewed. In consultation with EPA Region 8 staff, an RE of 0.83
was established for the oil and gas industry facilities. This essentially discounts the
calculated reduction estimates by 17%. The previously agreed upon RE of 0.83 was
assumed for condensate tank controls and pneumatic devices for the purposes of
facilitating the 2010 base case and control case modeling.
The APCD has recently analyzed both the weekly compliance rate through reporting and
compliance rate of random inspections on condensate controls for the 2007 peak ozone
DRAFT FINAL - Denver Metro Area/North Front Range 8-hr Ozone SIP – Emission Inventory
10
season for each of the companies with total system wide VOC emissions of 30 tpy. The
analysis indicates an 83% compliance rate based on weekly reporting and a 91%
compliance rate based on random inspections. Based on this analysis and the proposed
revisions to strengthen Regulation No. 7, the State believes a rule effectiveness factor of
at least 0.83 is still valid. Analysis supporting the final RE used in modeling is found in a
separate TSD.
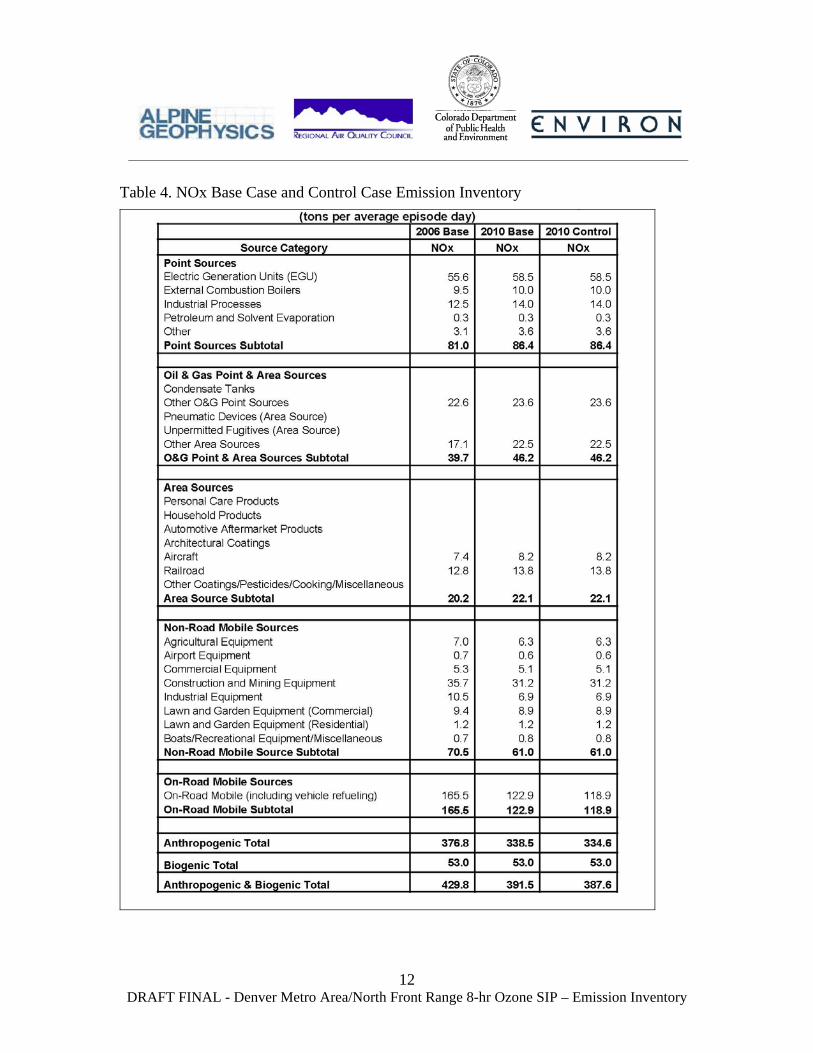
The total emission reduction, compared to the 2006, for these control strategies
(together with the federal and existing state controls assumed for the 2010 base case) is
approximately 47 tpd VOC and 3 tpd NOx in the 8-hour nonattainment area (However,
the total VOC reduction could be as great as 70 tpd without the rule effectiveness
reduction.). The resulting 2010 control inventory based on the total control package
noted above is presented in Table 3 (VOC) and Table 4 (NOx) for the 8-hour
nonattainment area. All inventories presented as tons per summer day (tpsd) in this
section represent a typical average episode day. In the photochemical modeling, all
anthropogenic source categories are varied by day of the week, time of day,
temperature, location, speciation and other factors. Biogenic sources are varied by
differing meteorological conditions and diurnally varied by temperature.

DRAFT FINAL - Denver Metro Area/North Front Range 8-hr Ozone SIP – Emission Inventory
11
Table 3. VOC Base Case and Control Case Emission Inventory
DRAFT FINAL - Denver Metro Area/North Front Range 8-hr Ozone SIP – Emission Inventory
12
Table 4. NOx Base Case and Control Case Emission Inventory
DRAFT FINAL - Denver Metro Area/North Front Range 8-hr Ozone SIP – Emission Inventory
13
4 VOC and NOx Motor Vehicle Emission Budgets According to EPA regulations and guidance, the SIP may establish a budget or budgets
that apply to the entire nonattainment area, and/or subarea budgets for each
metropolitan planning organization or subarea within the nonattainment area.
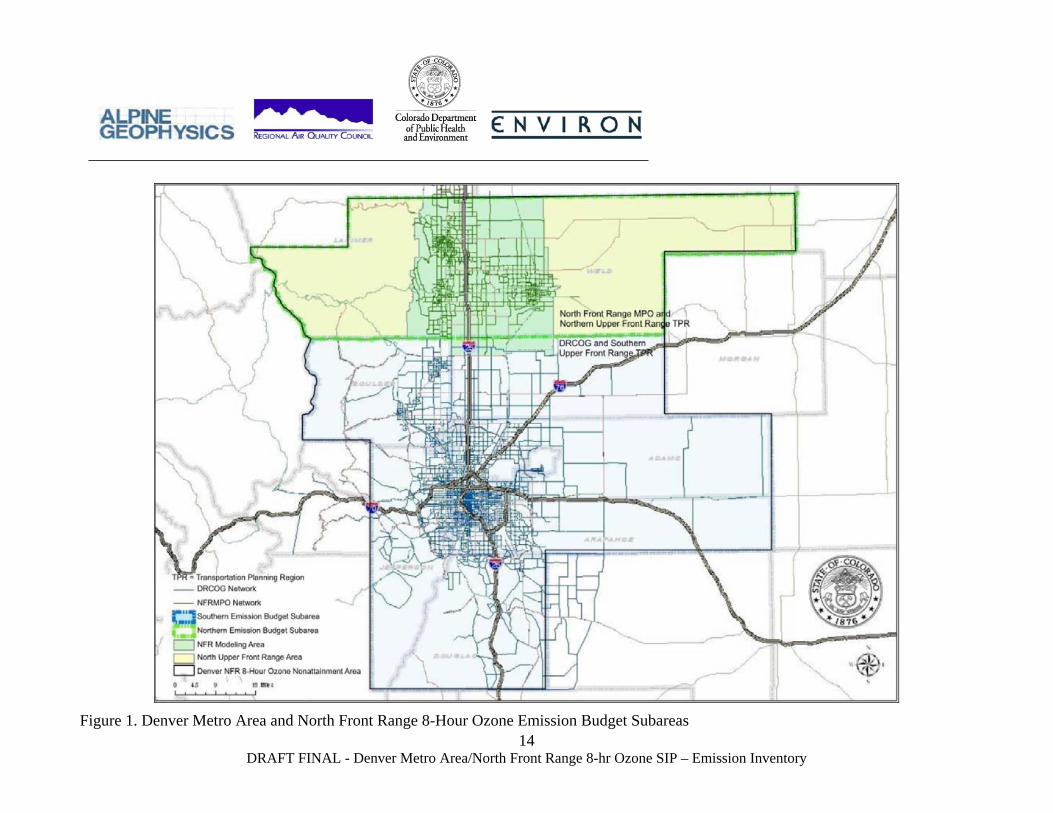
For purposes of this SIP, motor vehicle emissions budgets for VOC and NOx are
established for the 2010 attainment year. Budgets are specifically established for two
sub-regional areas and for the entire nonattainment area for purposes of transportation
conformity. The two subareas are defined as follows and shown in Figure 1:
• Southern Subarea - Area denoted by the ozone nonattainment area south of the
Boulder County northern boundary and extended through southern Weld County
to the Morgan County line. This area includes the nonattainment portion of
DRCOG’s’ regional planning area and the southern Weld County portion of the
Upper Front Range Transportation Planning Region (TPR).
• Northern Subarea - Area denoted by the ozone nonattainment area north of the
Boulder County northern boundary and extended through southern Weld County
to the Morgan County line. This area includes the North Front Range
Transportation and Air Quality Planning Council transportation planning area as
well as the northern ozone nonattainment area portion the Upper Front Range
TPR in Larimer and Weld counties.
When subarea budgets are created in the SIP, the sum of the subarea budgets must
equal the total allowable emissions the area can have from the transportation sector and
still lead to attainment of the standard. If each subarea meets its motor vehicle emission
budgets or if the total emissions for the entire nonattainment area (the sum of the
subareas) are less than or equal to the budget for the entire nonattainment area, then
the entire area will meet the total SIP’s purpose of attaining the relevant standard.
DRAFT FINAL - Denver Metro Area/North Front Range 8-hr Ozone SIP – Emission Inventory
14Figure 1. Denver Metro Area and North Front Range 8-Hour Ozone Emission Budget Subareas

DRAFT FINAL - Denver Metro Area/North Front Range 8-hr Ozone SIP – Emission Inventory
15
4.1 Proposed 2010 Emissions Budgets for the Denver Metro and North
Front Range 8-Hour Ozone Subareas Table 5 shows both the regional motor vehicle emissions budgets and the separate
motor vehicle emissions budgets for the ozone precursors VOC and NOx for the two
subareas discussed above.
Table 5. Subarea and Nonattainment Area-Wide 2010 Motor Vehicle Emission Budgets
The 2010 VMT estimates were used with 2010 emission factors obtained from the EPA
MOBILE6.2 Emission Factor Model to calculate emissions. The two subarea budgets
presented in the table add to the sum of the total 2010 motor vehicle emissions for the
entire nonattainment area in the 2010 base case inventory (See Table 2), which
demonstrates attainment of the standard.
For the underlying transportation modeling, the roadway and transit links in DRCOG’s
2005 and 2015 Cycle 2 (2007) networks were truncated to include only the portion of the
network within the 8-hour ozone nonattainment area. VMT estimates from these
networks were interpolated to obtain 2006 and 2010 baseline VMT estimates for
purposes of developing the SIP emissions inventories. Likewise, the 2005 and 2015
(2007) networks from the North Front Range MPO were truncated to include only the

DRAFT FINAL - Denver Metro Area/North Front Range 8-hr Ozone SIP – Emission Inventory
16
portion of the network within the 8-hour ozone nonattainment area. The VMT estimates
were interpolated to obtain 2006 and 2010 baseline VMT estimates. Where there was
overlap between the North Front Range (NFR) and DRCOG networks in Weld County,
the DRCOG network was used. In areas where there was no MPO network, the Federal
Highway Authority (FHWA) Highway Performance Management System (HPMS) and
Colorado Department of Transportation (CDOT) networks, plus a growth factor, were
used to calculate VMT.
Table 6 summarizes the VMT estimates for each of the budget subareas. The total VMT
is identical to the 2010 base case VMT estimates in Table 2.
Table 6. Distribution of VMT between the Budget Subareas (2010)
The 2006 and 2010 VMT estimates were used with emission factors obtained from the
EPA Mobile 6.2 Emission Factor Model to calculate emissions. Emissions were
calculated on a link-by-link basis. Speeds were obtained from the MPO transportation
networks and the roadway speed limit was used for CDOT links. The ambient
temperatures for the regional emissions analysis were derived from the meteorological
modeling performed for the attainment demonstration for a typical ozone episode period.
The motor vehicle mix was obtained from the CDOT automated traffic counters.
DRAFT FINAL - Denver Metro Area/North Front Range 8-hr Ozone SIP – Emission Inventory
17
5 Highway Vehicle Sources Emissions modeling was conducted using two systems, the Sparse Matrix Operating
Kernel Emissions (SMOKE) model (Coats, 1996) and the Consolidated Community
Emissions Processing Tool (CONCEPT) (Loomis et al., 2005). The CONCEPT link-
based mobile emissions modeling system was used to generate the on-road mobile
source emissions the Denver Regional Council of Governments (DRCOG) portion of the
8-hour ozone nonattainment area (NAA). The SMOKE emissions modeling system does
not generate link-based mobile source emissions and was used for the less critical areas
of the NAA. SMOKE used countywide vehicle miles traveled (VMT) data from Larimer
and Weld Counties not covered by the DRCOG transportation network. It used VMT
from the North Front Range Transportation and Air Quality Planning Council (NFR) and
Colorado Department of Transportation (CDOT), together with spatial surrogates.
SMOKE assumes a constant speed across all VMT of the same roadway type.
The CONCEPT MV emissions model estimates and grids link-level emissions using the
output from DRCOG Transportation Demand Model (TDM). The TDM provides VMT or
volume for multi-hour periods, and CONCEPT uses temporal allocation factors and VMT
mix fractions to estimate hourly emissions for each vehicle class for each roadway Type
and speed.
EPA’s EPA Mobile 6.2 Emission Factor Model (MOBILE6) is executed within CONCEPT
to generate the gram/mile (for running emissions) and gram/trip (for trip start and trip
ends) emission factors. The emission factors depend on meteorological data
(temperature and humidity), which are obtained from MM5 meteorological modeling runs
for every grid cell in the modeling domain, and the speeds associated with each link.
CONCEPT then estimates emissions for each emissions mode by multiplying the activity
data (VMT or trips by vehicle class) by the appropriate MOBILE6 emission factors. For
each hour of each episode day, for each link in each grid cell, CONCEPT uses the grid
DRAFT FINAL - Denver Metro Area/North Front Range 8-hr Ozone SIP – Emission Inventory
18
cell ID, county, temperature increase bin, road type, and speed to determine the correct
emission factor for each vehicle class, pollutant and (non-start) emission mode.
Emissions for each vehicle class, emission type, and pollutant are estimated as the
product of the emission factor and the VMT on that link associated with the vehicle class
and speed.
Both CONCEPT and SMOKE use temporal adjustments to adjust VMT for the day of
week. Both models also speciate the emissions as required for input to an air quality
model. The result of both CONCEPT and SMOKE was an hourly, gridded, speciated
inventory for a two-month period ready for input to the Comprehensive Air-quality Model
with extensions (CAMx) air quality model (ENVIRON, 2008).
For the SIP summary inventory tables (Table 2, Table 3, and Table 4) and for the Motor
Vehicle Emissions Budgets in Table 5, a single number for highway vehicle emissions is
needed. The basic technique used in the CONCEPT model was used to calculate
emissions for the SIP and the Emission Budgets. The principal difference was that
emissions were calculated on a daily basis instead of an hourly basis.
The 2006 and 2010 VMT estimates were used with emission factors obtained from the
EPA Mobile 6.2 Emission Factor Model to calculate emissions. Emissions were
calculated on a link-by-link basis. Speeds were obtained from the MPO transportation
networks and the roadway speed limit was used for CDOT links. The ambient
temperatures for the regional emissions analysis were derived from the meteorological
modeling performed for the attainment demonstration for a typical ozone episode period.
The motor vehicle mix was obtained from the CDOT automated traffic counters.
For the CONCEPT area modeling (Adams. Arapahoe, Boulder, Broomfield, Denver,
Douglas, Jefferson and a portion of Weld counties), the ambient temperature used for
modeling is: MIN/MAX TEMPERATURE: 42.6 101.2.

DRAFT FINAL - Denver Metro Area/North Front Range 8-hr Ozone SIP – Emission Inventory
19
For the SMOKE area modeling (Larimer, and most of Weld counties), the ambient
temperature used for modeling is: MIN/MAX TEMPERATURE: 59.0 89.0.
Table 7 presents a summary of the CONCEPT and SMOKE highway vehicle modeling
used in the CAMx ozone modeling for the July 11-17 period for the base case in 2006
and 2010.
Table 7. Emissions summary for July 11 -17 Period from CAMx Ozone Modeling
July11-17 Emissions Summary for July 11 –17 Ozone Modeling (tons/day) weekday
CONCEPT 2006 Fri Sat Sun Mon Tue Wed Thu averageNOX 139.4 102.8 85.2 119.6 120.9 130.9 137.7 129.7TOG 115.2 88.6 78.5 90.9 87.4 97.1 108.1 99.7CO 934.2 750.7 663.5 801.8 806.8 862.7 890.1 859.1
CONCEPT 2010
NOX 104.0 77.1 64.1 89.3 90.3 97.7 102.7 96.8TOG 94.4 74.8 66.8 74.7 71.8 79.3 88.6 81.8CO 751.9 604.6 532.7 642.5 653.3 697.9 716.4 692.4
SMOKE 2010 NOx 26.2 22.4 20.4 24.0 23.5 23.8 25.7 24.7TOG 16.1 15.2 14.5 15.3 14.4 14.7 15.6 15.2CO 192.5 169.9 155.1 174.9 182.4 180.4 190.2 184.1
TOTAL 2010 NOx 130.2 99.5 84.4 113.3 113.8 121.6 128.4 121.4TOG 110.5 90.0 81.2 90.0 86.2 94.0 104.3 97.0CO 944.4 774.5 687.9 817.4 835.7 878.3 906.6 876.5
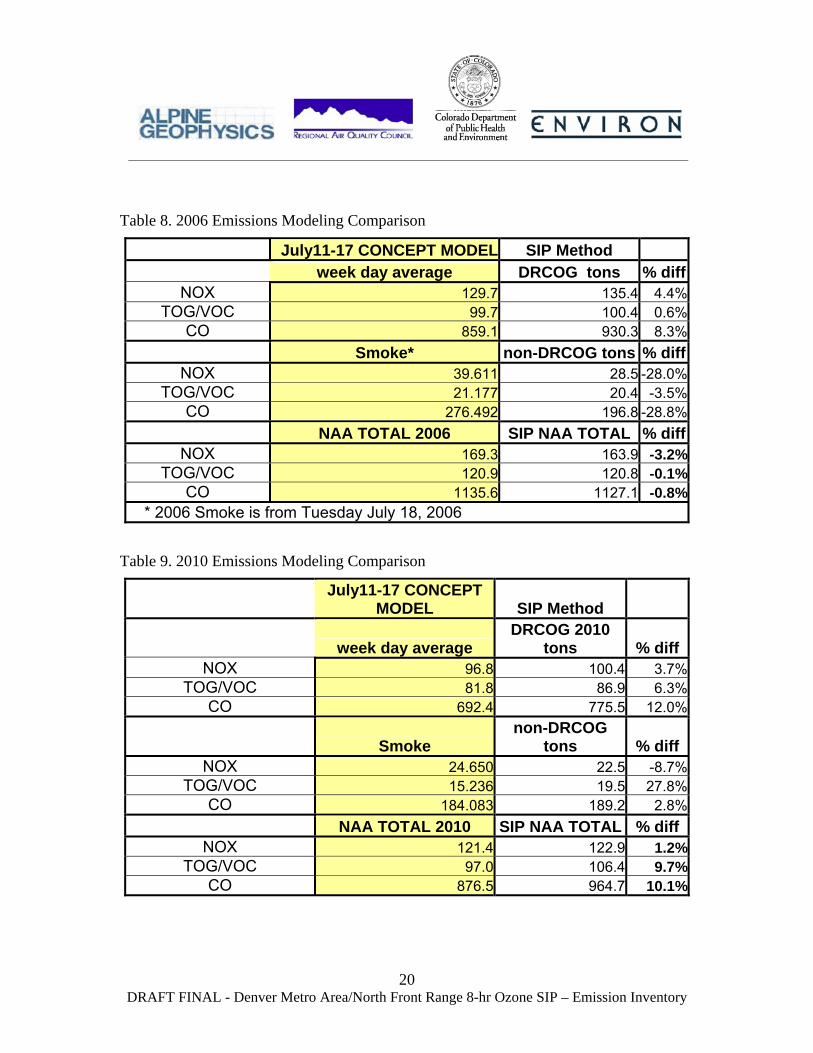
Table 8 and Table 9 compare the CONCEPT and SMOKE output summary on a
weekday average basis with the single number used in summary Table 2, Table 3, and
Table 4 and in the Motor Vehicle Emissions Budgets in Table 5. As can be seen, the
single numbers calculated for the SIP and Emission Budgets are a reasonable
representation of the emissions used in the ozone modeling.
DRAFT FINAL - Denver Metro Area/North Front Range 8-hr Ozone SIP – Emission Inventory
20
Table 8. 2006 Emissions Modeling Comparison
July11-17 CONCEPT MODEL SIP Method week day average DRCOG tons % diff
NOX 129.7 135.4 4.4%TOG/VOC 99.7 100.4 0.6%
CO 859.1 930.3 8.3% Smoke* non-DRCOG tons % diff
NOX 39.611 28.5 -28.0%TOG/VOC 21.177 20.4 -3.5%
CO 276.492 196.8 -28.8% NAA TOTAL 2006 SIP NAA TOTAL % diff
NOX 169.3 163.9 -3.2%TOG/VOC 120.9 120.8 -0.1%
CO 1135.6 1127.1 -0.8% * 2006 Smoke is from Tuesday July 18, 2006
Table 9. 2010 Emissions Modeling Comparison
July11-17 CONCEPT
MODEL SIP Method
week day average DRCOG 2010
tons % diffNOX 96.8 100.4 3.7%
TOG/VOC 81.8 86.9 6.3%CO 692.4 775.5 12.0%
Smoke non-DRCOG
tons % diffNOX 24.650 22.5 -8.7%
TOG/VOC 15.236 19.5 27.8%CO 184.083 189.2 2.8%
NAA TOTAL 2010 SIP NAA TOTAL % diffNOX 121.4 122.9 1.2%
TOG/VOC 97.0 106.4 9.7%CO 876.5 964.7 10.1%

DRAFT FINAL - Denver Metro Area/North Front Range 8-hr Ozone SIP – Emission Inventory
21
5.1 Ethanol Marketshare Assumptions The 2006 60% ethanol marketshare for Denver is based on actual sampling. The
increase in 2010 accounts for marketshare trends, most notably actual sampling in 2005
and 2007 showing an 85% ethanol marketshare. Actual sampling was also used to
calculate the 60% NFR marketshare for 2006. However, because over the years prior to
2008 the NFR sampling has been done on a smaller scale, and sample locations have
not been as rigorously selected, the Division did not feel as comfortable projecting out a
marketshare to 2010, and accordingly, conservatively estimated that the 2010
marketshare in the NFR would be 25% consistent with the marketshare utilized in the
EAC modeling. In retrospect, the Division agrees that for consistency sake, the same
projecting out methodology used in Denver should have been used for the NFR,
notwithstanding the smaller sample set. Nevertheless, based on the ethanol sensitivity
tests for 2010, 0% vs 100% ethanol market penetration for the entire NAA area does not
change the outcome of the ozone modeling attainment demonstration at the key
monitors (e.g., Rocky Flats North and Fort Collins West). Therefore, it can be concluded
that changing the ethanol market penetration for the NFR from 25% to a higher
percentage based on projecting out from a limited sample set would have a negligible
effect on ozone.
DRAFT FINAL - Denver Metro Area/North Front Range 8-hr Ozone SIP – Emission Inventory
22
5.2 2006 Base Year Input to the Mobile Model for Adams, Arapahoe,
Boulder, Broomfield, Denver, Douglas and Jefferson Counties REBUILD EFFECTS : 0.10 EXPAND EVAPORATIVE : EXPAND EXHAUST : I/M PROGRAM : 1 1982 2050 2 T/O 2500/IDLE I/M MODEL YEARS : 1 1982 2050 I/M VEHICLES : 1 11111 22222222 2 I/M STRINGENCY : 1 10.0 (Set to min. allowed, pre 81 stringency not applicable) I/M COMPLIANCE : 1 95.0 I/M WAIVER RATES : 1 .00 .57 (Pre 81 rate n/a, post 80 rates from insp. year 2001) I/M GRACE PERIOD : 1 5 I/M PROGRAM : 2 1982 2050 2 T/O IM240 I/M MODEL YEARS : 2 1982 2050 I/M CUTPOINTS : 2 06CUTPC.D I/M VEHICLES : 2 21111 11111111 1 I/M STRINGENCY : 2 10.0 (Set to min. allowed, pre 81 stringency not applicable) I/M COMPLIANCE : 2 95.0 I/M WAIVER RATES : 2 .00 .64 (Pre 81 rate n/a, post 80 rates from insp. year 2001) I/M GRACE PERIOD : 2 5 I/M PROGRAM : 3 1982 2050 2 T/O IM240 I/M MODEL YEARS : 3 1982 2050 I/M CUTPOINTS : 3 06CUTPT.D I/M VEHICLES : 3 12222 11111111 1 I/M STRINGENCY : 3 10.0 (Set to min. allowed, pre 81 stringency not applicable) I/M COMPLIANCE : 3 95.0 I/M WAIVER RATES : 3 .00 .91 (Pre 81 rate n/a, post 80 rates from insp. year 2001) I/M GRACE PERIOD : 3 5 I/M PROGRAM : 4 1998 2050 2 T/O GC I/M MODEL YEARS : 4 1982 2050 I/M VEHICLES : 4 22222 11111111 1 I/M COMPLIANCE : 4 94.8 (Compliance data from insp. year 2001) I/M WAIVER RATES : 4 .00 .91 (Pre 81 rate n/a, post 80 rates from insp. year 2001) I/M GRACE PERIOD : 4 5 ANTI-TAMP PROG : 82 75 02 22222 22222222 2 12 095. 22111112 FUEL PROGRAM : 4 88.0 116.0 122.0 124.0 74.0 57.0 57.7 30.0 30.0 30.0 30.0 30.0 30.0 30.0 30.0 30.0 1000.0 1000.0 1000.0 1000.0 303.0 303.0 248.0 87.0

DRAFT FINAL - Denver Metro Area/North Front Range 8-hr Ozone SIP – Emission Inventory
23
80.0 80.0 80.0 80.0 80.0 80.0 80.0 80.0 OXYGENATED FUELS : 0.000 0.600 0.000 0.035 2 FUEL RVP : 7.7 REG DIST : REG_MET.D </run> <scenario> ALTITUDE : 2 5.3 2006 Base Year Input to the Mobile Model for Larimer and Weld
Counties REBUILD EFFECTS : 0.10 EXPAND EVAPORATIVE : EXPAND EXHAUST : FUEL PROGRAM : 4 88.0 116.0 122.0 124.0 74.0 57.0 57.7 30.0 30.0 30.0 30.0 30.0 30.0 30.0 30.0 30.0 1000.0 1000.0 1000.0 1000.0 303.0 303.0 248.0 87.0 80.0 80.0 80.0 80.0 80.0 80.0 80.0 80.0 OXYGENATED FUELS : 0.000 0.600 0.000 0.035 2 FUEL RVP : 7.4 REG DIST : REG_LAR.D </run> <scenario> ALTITUDE : 2 5.4 2010 Base Year Input to the Mobile Model for Adams, Arapahoe,
Boulder, Broomfield, Denver, Douglas and Jefferson Counties REBUILD EFFECTS : 0.35 I/M PROGRAM : 1 1982 2050 2 T/O 2500/IDLE I/M MODEL YEARS : 1 1982 2050 I/M VEHICLES : 1 11111 22222222 2 I/M STRINGENCY : 1 10.0 (Set to min. allowed, pre 81 stringency not applicable) I/M COMPLIANCE : 1 95.0 I/M WAIVER RATES : 1 .00 .57 (Pre 81 rate n/a, post 80 rates from insp. year 2001) I/M GRACE PERIOD : 1 5 I/M PROGRAM : 2 1982 2050 2 T/O IM240 I/M MODEL YEARS : 2 1982 2050 I/M CUTPOINTS : 2 10CUTPC.D I/M VEHICLES : 2 21111 11111111 1 I/M STRINGENCY : 2 10.0 (Set to min. allowed, pre 81 stringency not applicable) I/M COMPLIANCE : 2 95.0 I/M WAIVER RATES : 2 .00 .64 (Pre 81 rate n/a, post 80 rates from insp. year 2001) I/M GRACE PERIOD : 2 5

DRAFT FINAL - Denver Metro Area/North Front Range 8-hr Ozone SIP – Emission Inventory
24
I/M PROGRAM : 3 1982 2050 2 T/O IM240 I/M MODEL YEARS : 3 1982 2050 I/M CUTPOINTS : 3 10CUTPT.D I/M VEHICLES : 3 12222 11111111 1 I/M STRINGENCY : 3 10.0 (Set to min. allowed, pre 81 stringency not applicable) I/M COMPLIANCE : 3 95.0 I/M WAIVER RATES : 3 .00 .91 (Pre 81 rate n/a, post 80 rates from insp. year 2001) I/M GRACE PERIOD : 3 5 I/M PROGRAM : 4 1998 2050 2 T/O GC I/M MODEL YEARS : 4 1982 2050 I/M VEHICLES : 4 22222 11111111 1 I/M COMPLIANCE : 4 94.8 (Compliance data from insp. year 2001) I/M WAIVER RATES : 4 .00 .91 (Pre 81 rate n/a, post 80 rates from insp. year 2001) I/M GRACE PERIOD : 4 5 ANTI-TAMP PROG : 82 75 02 22222 22222222 2 12 095. 22111112 FUEL PROGRAM : 3 OXYGENATED FUELS : 0.000 0.850 0.000 0.035 2 FUEL RVP : 7.8 REG DIST : REG_MET.D
5.5 2010 Base Year Input to the Mobile Model for Larimer and Weld Counties
REBUILD EFFECTS : 0.35 EXPAND EVAPORATIVE : EXPAND EXHAUST : FUEL PROGRAM : 3 OXYGENATED FUELS : 0.000 0.250 0.000 0.035 2 FUEL RVP : 9.0 REG DIST : REG_LAR.D </run> <scenario> ALTITUDE : 2 The REBUILD EFFECTS command allows the user to change the Rebuild program
effectiveness rate used to reduce heavy-duty diesel vehicle NOx off-cycle emissions.
The command was used by the contractors in the SIP modeling, and was set to be
consistent with the values used in other SIPs ( those done by NESCAUM and LADCO).
The command reduces the credit assigned to this program from the default effectiveness
rate of 90%.
DRAFT FINAL - Denver Metro Area/North Front Range 8-hr Ozone SIP – Emission Inventory
25
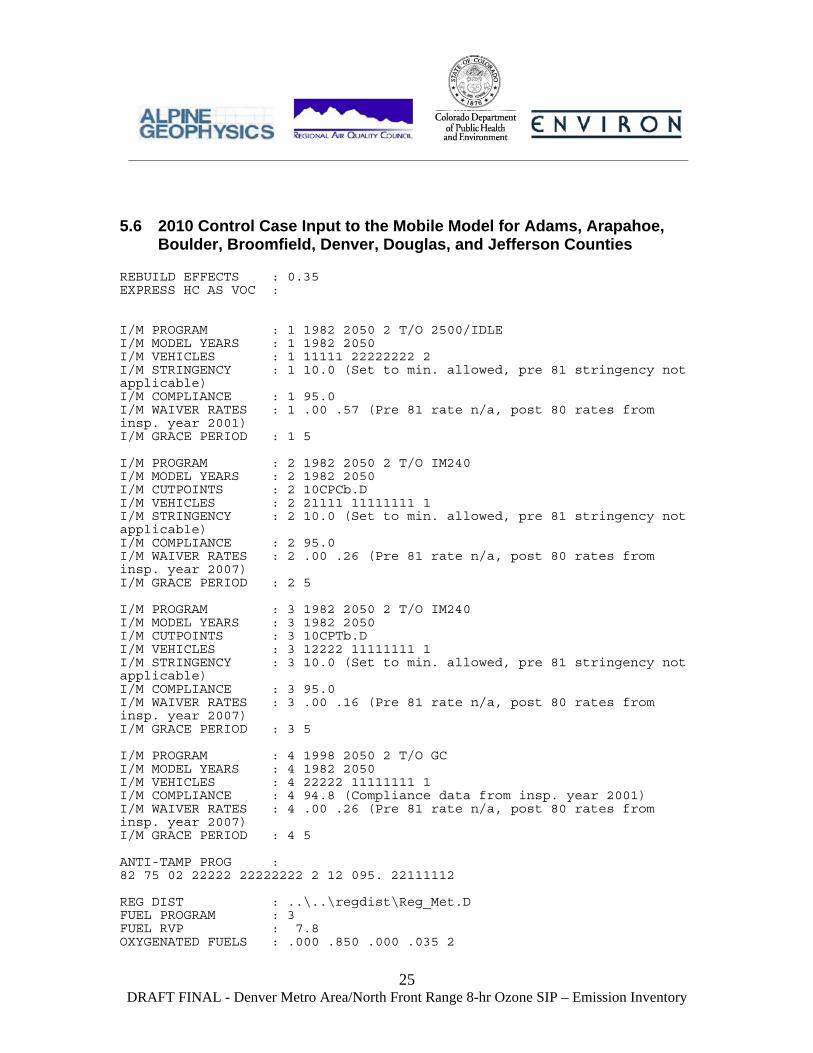
5.6 2010 Control Case Input to the Mobile Model for Adams, Arapahoe,
Boulder, Broomfield, Denver, Douglas, and Jefferson Counties REBUILD EFFECTS : 0.35 EXPRESS HC AS VOC : I/M PROGRAM : 1 1982 2050 2 T/O 2500/IDLE I/M MODEL YEARS : 1 1982 2050 I/M VEHICLES : 1 11111 22222222 2 I/M STRINGENCY : 1 10.0 (Set to min. allowed, pre 81 stringency not applicable) I/M COMPLIANCE : 1 95.0 I/M WAIVER RATES : 1 .00 .57 (Pre 81 rate n/a, post 80 rates from insp. year 2001) I/M GRACE PERIOD : 1 5 I/M PROGRAM : 2 1982 2050 2 T/O IM240 I/M MODEL YEARS : 2 1982 2050 I/M CUTPOINTS : 2 10CPCb.D I/M VEHICLES : 2 21111 11111111 1 I/M STRINGENCY : 2 10.0 (Set to min. allowed, pre 81 stringency not applicable) I/M COMPLIANCE : 2 95.0 I/M WAIVER RATES : 2 .00 .26 (Pre 81 rate n/a, post 80 rates from insp. year 2007) I/M GRACE PERIOD : 2 5 I/M PROGRAM : 3 1982 2050 2 T/O IM240 I/M MODEL YEARS : 3 1982 2050 I/M CUTPOINTS : 3 10CPTb.D I/M VEHICLES : 3 12222 11111111 1 I/M STRINGENCY : 3 10.0 (Set to min. allowed, pre 81 stringency not applicable) I/M COMPLIANCE : 3 95.0 I/M WAIVER RATES : 3 .00 .16 (Pre 81 rate n/a, post 80 rates from insp. year 2007) I/M GRACE PERIOD : 3 5 I/M PROGRAM : 4 1998 2050 2 T/O GC I/M MODEL YEARS : 4 1982 2050 I/M VEHICLES : 4 22222 11111111 1 I/M COMPLIANCE : 4 94.8 (Compliance data from insp. year 2001) I/M WAIVER RATES : 4 .00 .26 (Pre 81 rate n/a, post 80 rates from insp. year 2007) I/M GRACE PERIOD : 4 5 ANTI-TAMP PROG : 82 75 02 22222 22222222 2 12 095. 22111112 REG DIST : ..\..\regdist\Reg_Met.D FUEL PROGRAM : 3 FUEL RVP : 7.8 OXYGENATED FUELS : .000 .850 .000 .035 2

DRAFT FINAL - Denver Metro Area/North Front Range 8-hr Ozone SIP – Emission Inventory
26
MIN/MAX TEMPERATURE: 42.6 101.2 5.7 2010 Control Case Input to the Mobile Model for Larimer and Weld
Counties REBUILD EFFECTS : 0.35 REG DIST : ..\..\regdist\REG_LAR.D FUEL PROGRAM : 3 OXYGENATED FUELS : 0.000 0.850 0.000 0.035 2 FUEL RVP : 7.8 MIN/MAX TEMPERATURE: 42.6 101.2 The control case uses more stringent I/M cutpoints in the Denver area, along with
updated I/M program effectiveness parameters, and 7.8 RVP gasoline in Larimer and
Weld Counties.

DRAFT FINAL - Denver Metro Area/North Front Range 8-hr Ozone SIP – Emission Inventory
27
6 Non-Road Mobile Sources Non-road source emissions are from the EPA NONROAD Model. This model includes
the impact of future controls on non-road engines, which is used in equipment such as
lawn and garden equipment and construction equipment.
Inputs to the NONROAD Model are shown in Table 10 and Table 11.
Table 10. 2006 Base Year NONROAD Model Input
Fuel RVP (psi) : 8.20 Fuel Oxygen weight %: 2.04 Gasoline Sulfur % : 0.0339 Diesel Sulfur % : 0.0500
Marine Diesel Sulfur: 0.0500 LPG/CNG Sulfur % : 0.0030 Minimum Temperature : 58.00 Maximum Temperature : 91.00 Average Ambient Temp: 77.30
Table 11. 2010 Base Year and Control Case NONROAD Model Input
Fuel RVP for gas : 8.8 Oxygen Weight % : 2.97 Gas sulfur % : 0.0011 Diesel sulfur % : .0050
Marine Dsl sulfur %: .0050 CNG/LPG sulfur % : 0.003 Minimum temper. (F): 58.0 Maximum temper. (F): 91.0 Average temper. (F): 77.3
DRAFT FINAL - Denver Metro Area/North Front Range 8-hr Ozone SIP – Emission Inventory
28
6.1 Locomotive Emissions Locomotive emissions from the 2002 NEI were grown by population growth and the
effect of EPA final locomotive Tier 3 standards were considered and included, where
appropriate, in the 2010 area source estimates. The effect of the standards were
calculated based on “Regulatory Impact Analysis: Control of Emissions of Air Pollution
from Locomotive Engines and Marine Compression Ignition Engines Less than 30 Liters
Per Cylinder” (EPA, March 2008).
6.2 Aircraft and Airport Emissions – Denver International Airport An inventory completed in 2005 for Denver International Airport (DIA) was used for
aircraft and airport non-road source emissions from DIA for both 2006 and 2010
(Ricondo & Associates, June 2005).
DRAFT FINAL - Denver Metro Area/North Front Range 8-hr Ozone SIP – Emission Inventory
29
7 Stationary Sources 7.1 Area Sources (Non-Oil and Gas)
Non-oil and gas area source emissions (including heating, consumer solvent use,
pesticides, etc) are from the 2002 EPA National Emissions Inventory (NEI), grown to
2006 and 2010 by population growth from data from the State Demographer. While EPA
now has a 2005 NEI available, it is only a placeholder Inventory because there are major
revisions to the NEI methodology that are to be implemented with the 2008 NEI. For
area sources, the 2002 and 2005 NEIs are identical, as seen in Table 12.
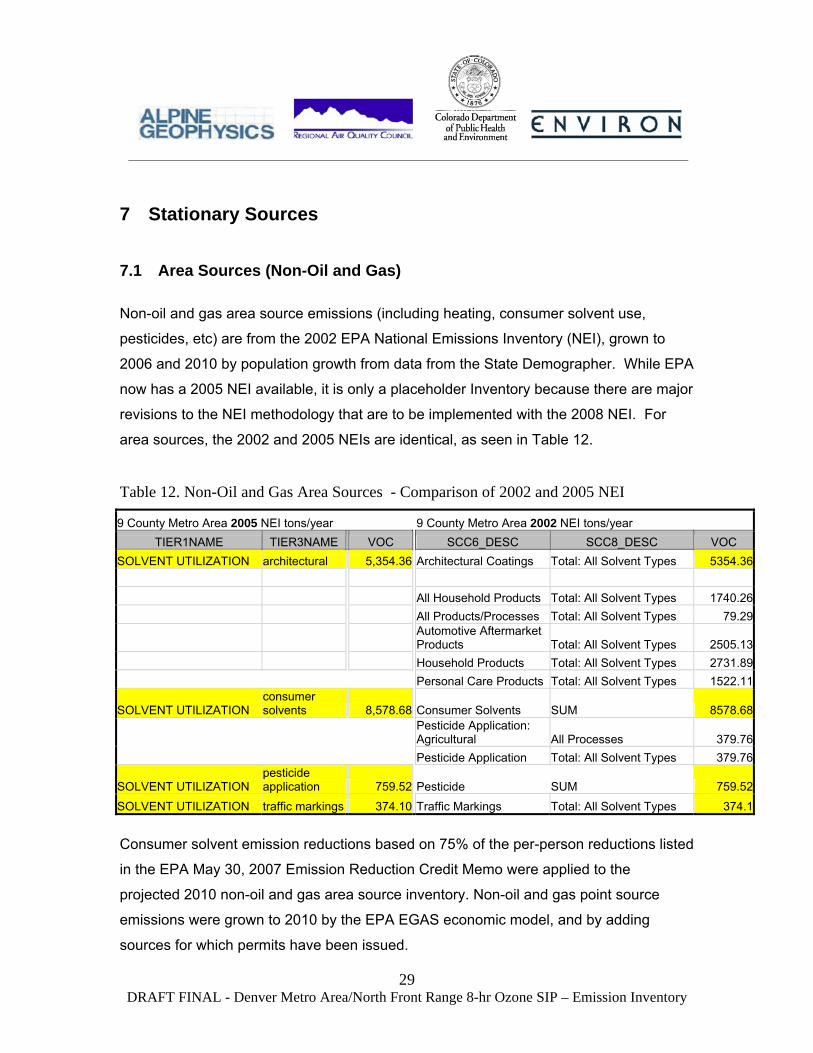
Table 12. Non-Oil and Gas Area Sources - Comparison of 2002 and 2005 NEI
9 County Metro Area 2005 NEI tons/year 9 County Metro Area 2002 NEI tons/year TIER1NAME TIER3NAME VOC SCC6_DESC SCC8_DESC VOC
SOLVENT UTILIZATION architectural 5,354.36 Architectural Coatings Total: All Solvent Types 5354.36 All Household Products Total: All Solvent Types 1740.26 All Products/Processes Total: All Solvent Types 79.29
Automotive Aftermarket Products Total: All Solvent Types 2505.13
Household Products Total: All Solvent Types 2731.89 Personal Care Products Total: All Solvent Types 1522.11
SOLVENT UTILIZATION consumer solvents 8,578.68 Consumer Solvents SUM 8578.68
Pesticide Application: Agricultural All Processes 379.76
Pesticide Application Total: All Solvent Types 379.76
SOLVENT UTILIZATION pesticide application 759.52 Pesticide SUM 759.52
SOLVENT UTILIZATION traffic markings 374.10 Traffic Markings Total: All Solvent Types 374.1 Consumer solvent emission reductions based on 75% of the per-person reductions listed
in the EPA May 30, 2007 Emission Reduction Credit Memo were applied to the
projected 2010 non-oil and gas area source inventory. Non-oil and gas point source
emissions were grown to 2010 by the EPA EGAS economic model, and by adding
sources for which permits have been issued.

DRAFT FINAL - Denver Metro Area/North Front Range 8-hr Ozone SIP – Emission Inventory
30
7.2 Point Source Emissions
Point source emissions were taken from Air Pollution Control Division's (APCD) Air
Pollutant Emission Notice (APEN) database. All sources in Colorado emitting criteria
and/or hazardous air pollutants (HAPs), including those emitting such ozone formation
contributors (OFCs) as volatile organic compounds (VOCs) and criteria pollutants such
as nitrogen oxides (NOx) specifically, are required to submit an APEN. The de minimis
level for reporting criteria pollutants is 1 ton/year (tpy) in nonattainment areas and 2
tons/year in attainment areas (actual uncontrolled emissions). In addition, source
inspections, the active contacting of sources identified from mailing lists, and stricter
permitting requirements contribute to the APCD’s knowledge of potential emissions
sources of OFCs. For HAPs the de minimis levels for reporting vary based on a
combination of the specific HAP's toxicity and scenarios for its release, but can be as
low as 50 pounds/year. Estimates for future emissions are based on the EPA’s
Economic Growth and Analysis System (EGAS) model for estimating future point
sources activity.
7.2.1 Electrical Generation Utilities (EGUs) Continuous Emissions Monitoring (CEM) data for electrical generation utilities (EGUs) in
the vicinity of Denver were used for the 2006 Actual Base Case emissions inventory.
The data were analyzed to also develop point source emissions for the 2006 Typical
Base Case emissions inventory. The CEM data analysis resulted in emissions that were
lower than the reported APEN emissions. Because of this, EGU emissions for 2010
were not grown using EGAS. Instead, the 2006 reported APEN emissions were used.
For the photochemical modeling, actual hourly CEM emission data were modeled for the
2006 model performance evaluation runs. Then, using the CEM data, "typical" temporal
emissions profiles were developed. These temporal profiles were designed to reflect the
expected emissions patterns for the local area and meteorological conditions being
modeled. That is, the temporal profiles derived from the CEM data were used to
DRAFT FINAL - Denver Metro Area/North Front Range 8-hr Ozone SIP – Emission Inventory
31
disaggregate the annual emissions to the daily and hourly estimates required for input to
the photochemical model
To account for growth in EGU emissions from recently permitted emission units that are
not included in the 2006 APEN inventory but expected to be in operation by 2010, case-
by-case review was conducted to determine the actual emissions for 2010. Specifically:
• Comanche Power Plant. The new Unit 3 was permitted subject to netting under
Regulation No. 3. As part of the SIP inventory development process, it was
determined that the actual emissions from all three Comanche units in 2006
would be a reliable estimate of actual emissions in 2010 for NOx and SO2.
However, since the increase in CO and VOC emissions from Unit 3 were not
accounted for in the 2006 emissions estimates from Unit 1 and Unit 2, the
increase in CO and VOC emissions from the new Unit 3 were added to the 2010
inventory.
• Fort Saint Vrain Power Plant. Permitted emission limits for two new turbines were
included in the 2010 inventory.
• Plains End Generating Station. Permitted emission limits for fourteen new
natural-gas fired ICE units were included in the 2010 inventory.
• Platte River Power Authority – Rawhide Power Plant. Permitted emission limits
for a new turbine was included in the 2010 inventory.
• Spindle Hill Energy. Permitted emission limits for new turbines were included in
the 2010 inventory.
• Tri-State Generation Craig Plant. A permit modification at this facility was subject
to netting under Regulation No. 3. It was determined that the actual emissions for
this facility in 2006 are a reliable estimate of actual emissions in 2010.
DRAFT FINAL - Denver Metro Area/North Front Range 8-hr Ozone SIP – Emission Inventory
32
7.3 Oil and Gas Emissions Oil and gas source emissions are based on estimates from the WRAP Phase III oil and
gas emissions inventory development study, which was sponsored by the Independent
Petroleum Association of Mountain States (IPAMS):
http://www.wrapair.org/forums/ssjf/documents/eictts/OilGas/2008-
04_%2706_Baseline_Emissions_DJ_Basin_Technical_Memo_(04-30).pdf
or
http://www.colorado.gov/airquality/documents/deno308/2008-
04_2706_Baseline_Emissions_DJ_Basin_Technical_Memo_(04-30).pdf
WRAP Phase III oil and gas emissions were projected to 2010 using the methodology in
the WRAP Phase III projection methodology document:
http://www.wrapair.org/forums/ssjf/documents/eictts/OilGas/2008-
04_%2710_Projection_Emissions_DJ_Basin_Technical_Memo(04-30).pdf
or
http://www.colorado.gov/airquality/documents/deno308/2008-
04_2710_Projection_Emissions_DJ_Basin_Technical_Memo(04-30).pdf

DRAFT FINAL - Denver Metro Area/North Front Range 8-hr Ozone SIP – Emission Inventory
33
7.3.1 Calculation of Emission Reductions From the Oil and Gas Industry 7.3.1.1 Condensate Tank Emissions Controls Uncontrolled emissions from condensate tanks are from the IPAMS inventory. The
modifications to Regulation 7 would control emissions from all tanks greater than 10 tons
per year by 95% and new and modified small tanks greater than 2 tons per year by 95%.
The basic equation for calculating controlled emissions is as follows.
Equation 1: Controlled emissions = Uncontrolled emissions X (1 – CE x RE x RP) Where CE is the control efficiency (95%), RE is the rule effectiveness (a discount to
account for less than perfect compliance, calculated elsewhere in the TSD as 83% or
0.83) and RP is rule penetration, calculated below.
7.3.1.1.1 Small Tanks (Less than 5 tons per year): The 2007 Air Pollution Emission Notice (APEN) data (the latest complete year) was used
as the basis to calculate the average effectiveness of emissions controls for tanks.
Since only data for units with emissions of more than 5 tons per year were required to be
submitted, the data are essentially nonexistent for small tanks and unreliable. The
APEN data are limited to tanks greater than 5 tons per year within the 8-Hour Ozone
Nonattainment Area (NAA).
Given this, two approaches could be used to estimate the number of small tanks for
each range of emissions (greater than zero to 1 ton per year, greater than 1 to 2 tons per
year, greater than 2 to 3 tons per year, greater than 3 to 4 tons per year, and greater
than 4 to 5 tons per year). One approach would be to assume a statistical distribution
and try to use data from large tanks to infer information about small tanks.. Another
approach is to develop a mathematical model to predict the number of small units.
The Division investigated both approaches and provided some preliminary results to
stakeholders based on the first approach. However, upon further review, the Division
DRAFT FINAL - Denver Metro Area/North Front Range 8-hr Ozone SIP – Emission Inventory
34
decided that the second approach would provide a more technically defensible result
because there is insufficient data to determine the type of statistical distribution to apply
to small tanks.
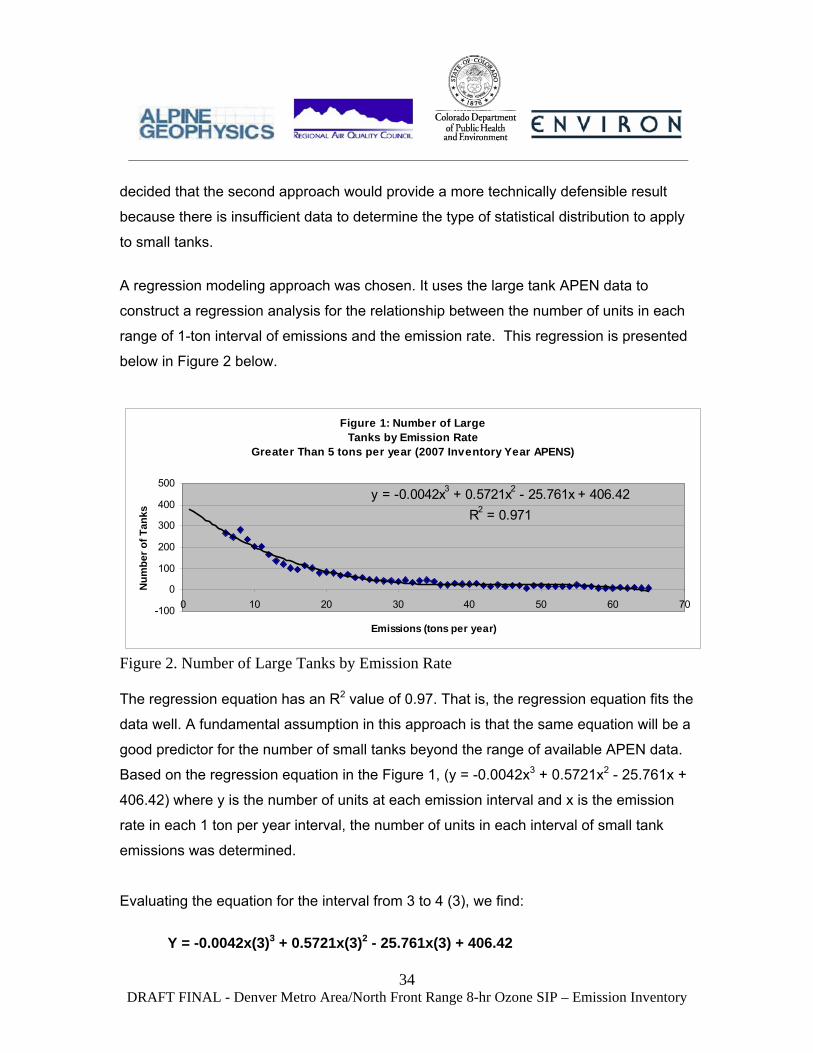
A regression modeling approach was chosen. It uses the large tank APEN data to
construct a regression analysis for the relationship between the number of units in each
range of 1-ton interval of emissions and the emission rate. This regression is presented
below in Figure 2 below.
Figure 1: Number of Large Tanks by Emission Rate
Greater Than 5 tons per year (2007 Inventory Year APENS)
y = -0.0042x3 + 0.5721x2 - 25.761x + 406.42R2 = 0.971
-100
0
100
200
300
400
500
0 10 20 30 40 50 60 7
Emissions (tons per year)
Num
ber o
f Tan
ks
0
Figure 2. Number of Large Tanks by Emission Rate The regression equation has an R2 value of 0.97. That is, the regression equation fits the
data well. A fundamental assumption in this approach is that the same equation will be a
good predictor for the number of small tanks beyond the range of available APEN data.
Based on the regression equation in the Figure 1, (y = -0.0042x3 + 0.5721x2 - 25.761x +
406.42) where y is the number of units at each emission interval and x is the emission
rate in each 1 ton per year interval, the number of units in each interval of small tank
emissions was determined.
Evaluating the equation for the interval from 3 to 4 (3), we find:
Y = -0.0042x(3)3 + 0.5721x(3)2 - 25.761x(3) + 406.42

DRAFT FINAL - Denver Metro Area/North Front Range 8-hr Ozone SIP – Emission Inventory
35
Y = -0.1134 + 5.1489 + -77.283 + 406.42 Y = 334.1525
The results of the reconstructed count and corresponding emissions in tons per year are
given in Table 13 below.
Table 13. Reconstructed Count of Small Tanks with VOC Emissions Less than 5 Tons per Year
ton/year interval Count Total Emissions
0 reconstructed
count (t/y - 0.5) x Count 1 381 191 2 357 536 3 334 835 4 312 1,093 5 291 1,311
The last column of Table 13 is calculated by multiplying the count by the assumed
average emission rate for each interval (assumed to be the midpoint of the interval – that
is 1.5 for the 1 to 2 interval). This column represents the total emissions of all sources in
each interval. So for the interval 3 we have:
emissions = 2.5 x 334 = 835 tons per year
The emissions from 2 to 5 tons per year sum to 3,240 tons (835 + 1093 + 1311). The
emissions from 0 to 5 tons per year sum to 3,966 tons. Dividing 3,240 by 3,966 gives
the fraction of emissions affected by controlling units with emissions greater than 2 tons
per year. This fraction, 0.82, is also called “Rule Penetration” (RP).

DRAFT FINAL - Denver Metro Area/North Front Range 8-hr Ozone SIP – Emission Inventory
36
Table 14 summarizes the results of Equation 1 and the IPAMS inventory for small
condensate tanks.
Table 14. Small Condensate Tanks
County
2006 Uncontrolled Emissions T/Y
Growth Factor
2010 Uncontrolled Emissions T/Y
New Emissions Uncontrolled
OLD Emissions 2010 Uncontrolled CE RP RE
New Emissions 2010 Controlled
OLD Emissions 2010 Controlled
OLD Controlled + NEW Controlled
ADAMS 173.7 0.730 126.86 126.86 0 0.82 0.83 0 126.9 126.86ARAPAHOE 23.9 0.730 17.47 17.47 0 0.82 0.83 0 17.5 17.47BOULDER 56.6 0.730 41.32 41.32 0 0.82 0.83 0 41.3 41.32BROOMFLD 13.6 0.730 9.92 9.92 0 0.82 0.83 0 9.9 9.92DENVER 6.3 0.730 4.58 4.58 0 0.82 0.83 0 4.6 4.58LARIMER 36.5 0.730 26.63 26.63 0 0.82 0.83 0 26.6 26.63WELD 5,208.8 1.302 6,784.40 393.90 6,390.51 0.95 0.82 0.83 140 6390.5 6,530.70TOTAL 5,519.4 7,011.17 372.94 6,617.27 140 6,617.27 6,757.46Total Tons/Day 15.1 19.2 1.0 18.1 0.4 18.1 18.5

DRAFT FINAL - Denver Metro Area/North Front Range 8-hr Ozone SIP – Emission Inventory
37
7.3.1.1.2 Large Tanks (Greater than 5 tons per year) Table 15 summarizes the results of Equation 1 and the IPAMS inventory for large
condensate tanks. The rule penetration for large tanks was calculated from the APEN
data, and is the fraction of large tanks that have emissions greater than 10 tons per year.
Table 15. Large Condensate Tanks
County
2006 Uncontrolled Emissions T/Y
Growth Factor
2010 Uncontrolled Emissions T/Y
Control Factor RP RE
New Emissions 2010 Controlled
OLD Emissions 2010 Controlled
Controlled 2010 T/Y
ADAMS 2,644.7 0.730 1,930.99 1,930.99 0.95 0.884 0.830 0 584.7 584.74ARAPAHOE 364.2 0.730 265.89 265.89 0.95 0.884 0.830 0 80.5 80.52BOULDER 861.5 0.730 629.02 629.02 0.95 0.884 0.830 0 190.5 190.48BROOMFLD 206.7 0.730 150.93 150.93 0.95 0.884 0.830 0 45.7 45.70DENVER 95.4 0.730 69.65 69.65 0.95 0.884 0.830 0 21.1 21.09LARIMER 555.1 0.730 405.33 405.33 0.95 0.884 0.830 0 122.7 122.74WELD 79,287.7 1.302 103,271.06 5,995.83 97,275.23 0.95 0.884 0.830 1,268 29456.6 30,724.73
TOTAL 84,015.4 1.27028 106,722.87 5,676.88 100,727.03 1,268.12 30,501.88 31,770Total T0ns/Day 230.2 292.4 15.6 276.0 3.5 83.6 87.0
In applying Equation 1 in Table 15, rule penetration is as shown in the table for existing
tanks, but is 1.00 for new and modified tanks, since all new and modified tanks are
controlled.
DRAFT FINAL - Denver Metro Area/North Front Range 8-hr Ozone SIP – Emission Inventory
38
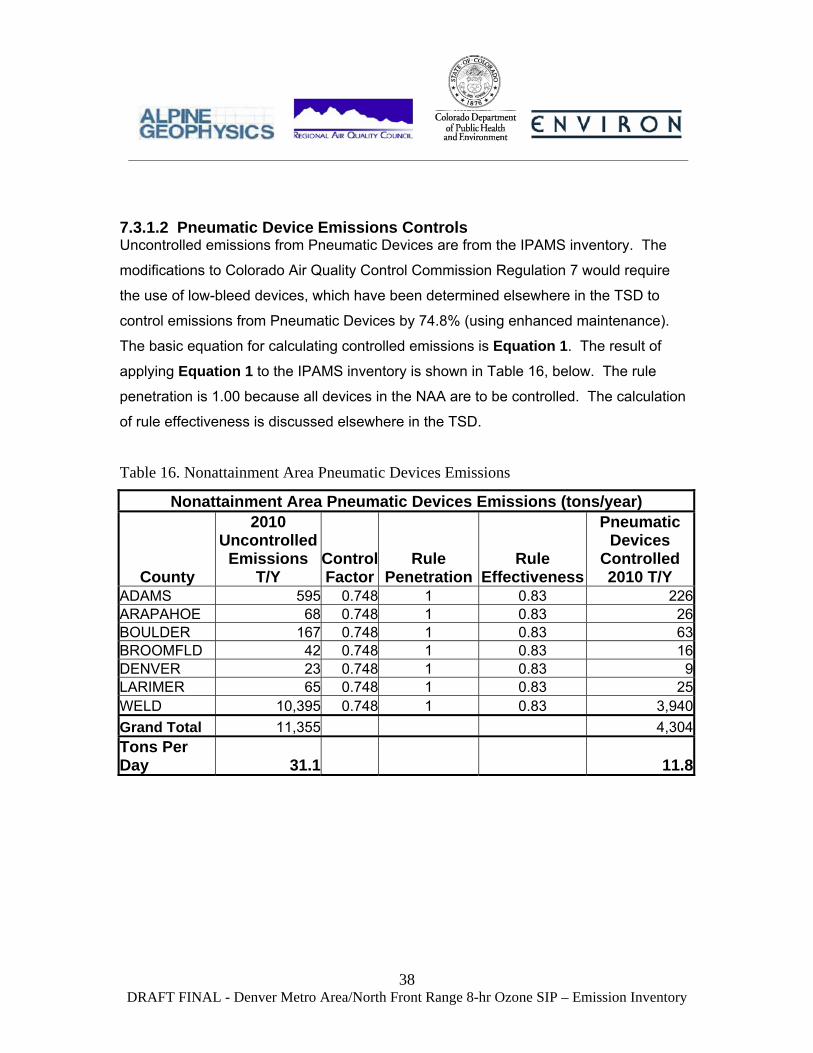
7.3.1.2 Pneumatic Device Emissions Controls Uncontrolled emissions from Pneumatic Devices are from the IPAMS inventory. The
modifications to Colorado Air Quality Control Commission Regulation 7 would require
the use of low-bleed devices, which have been determined elsewhere in the TSD to
control emissions from Pneumatic Devices by 74.8% (using enhanced maintenance).
The basic equation for calculating controlled emissions is Equation 1. The result of
applying Equation 1 to the IPAMS inventory is shown in Table 16, below. The rule
penetration is 1.00 because all devices in the NAA are to be controlled. The calculation
of rule effectiveness is discussed elsewhere in the TSD.
Table 16. Nonattainment Area Pneumatic Devices Emissions
Nonattainment Area Pneumatic Devices Emissions (tons/year)
County
2010 Uncontrolled
Emissions T/Y
Control Factor
Rule Penetration
Rule Effectiveness
Pneumatic Devices
Controlled 2010 T/Y
ADAMS 595 0.748 1 0.83 226ARAPAHOE 68 0.748 1 0.83 26BOULDER 167 0.748 1 0.83 63BROOMFLD 42 0.748 1 0.83 16DENVER 23 0.748 1 0.83 9LARIMER 65 0.748 1 0.83 25WELD 10,395 0.748 1 0.83 3,940Grand Total 11,355 4,304Tons Per Day 31.1 11.8
DRAFT FINAL - Denver Metro Area/North Front Range 8-hr Ozone SIP – Emission Inventory
39
8 References Amnon Bar-Ilan, John Grant, Ron Friesen, Alison K. Pollack, Doug Henderer, Daniel
Pring, Kathleen Sgamma. “Development of Baseline 2006 Emissions from Oil and Gas
Activity in the Denver-Julesburg Basin.” Prepared for Colorado Department of Public
Health and Environment. Prepared by ENVIRON International Corporation, Buys &
Associates, and Independent Petroleum Association of Mountain States (IPAMS). April
30, 2008. <http://www.colorado.gov/airquality/documents/deno308/2008-
04_2706_Baseline_Emissions_DJ_Basin_Technical_Memo_(04-30).pdf>
Amnon Bar-Ilan, John Grant, Ron Friesen, Alison K. Pollack, Doug Henderer, Daniel
Pring, Andrew Bremner. “Development of 2010 Oil and Gas Emissions Projections for
the Denver-Julesburg Basin.” Prepared for Colorado Department of Public Health and
Environment. Prepared by ENVIRON International Corporation, Buys & Associates, and
Independent Petroleum Association of Mountain States (IPAMS). April 30, 2008.
<http://www.colorado.gov/airquality/documents/deno308/2008-
04_2710_Projection_Emissions_DJ_Basin_Technical_Memo(04-30).pdf>
Coats, C.J. Jr. “High-performance algorithms in the Sparse Matrix Operator Kernel
Emissions (SMOKE) modeling system.” Proc. Ninth AMS Joint Conference on
Applications of Air Pollution Meteorology with AWMA. Amer. Meteor. Soc., Atlanta,
GA, 584-588. 1996.
ENVIRON. User’s Guide – Comprehensive Air Quality Model with Extensions –
Version 4.40. ENVIRON International Corporation, Novato, CA http://www.camx.com.
February 2008.
Loomis, C., J. Wilkinson, J. Haasbeek, A. Pollack and M. Jansen. 2005. “ConCEPT –
Consolidated Community Emissions Processing Tool, An Open-Source Tool for the
Emissions Modeling Community.” Presented at the 14th International Emission Inventory
Conference “Transforming Emission Inventories – Meeting Future Challenges Today”,

DRAFT FINAL - Denver Metro Area/North Front Range 8-hr Ozone SIP – Emission Inventory
40
Las Vegas, Nevada, April 11- 14.
<http://www.epa.gov/ttn/chief/conference/ei14/session11/loomis.pdf>
Morris R., E. Tai, Tanarit Sakulyanontvittaya, D. McNally and C. Loomis. 2008a. “2010
Ozone Attainment Demonstration Modeling for the Denver 8-Hour Ozone State
Implementation Plan Control Strategy.” ENVIRON International Corporation, Novato,
California. Prepared for Denver Regional Air Quality Council (RAQC), Denver,
Colorado. September 22, 2008.
<http://www.colorado.gov/airquality/documents/deno308/Denver_2010ControlStrat_Draft
_Sep22_2008.pdf>
Morris R., E. Tai, Tanarit Sakulyanontvittaya, D. McNally and C. Loomis. 2008b. “Model
Performance Evaluation for the June-July 2006 Ozone Episode for the Denver 8-Hour
Ozone State Implementation Plan.” ENVIRON International Corporation, Novato,
California. Prepared for Denver Regional Air Quality Council (RAQC), Denver,
Colorado. August 29, 2008.
<http://www.colorado.gov/airquality/documents/deno308/Denver_2006MPE_DraftFinal_
Aug29_2008.pdf>
Ricondo & Associates. “Airport Emissions Inventory Denver International Airport.” June
29, 2005
U.S. Environmental Protection Agency. “Regulatory Impact Analysis: Control of
Emissions of Air Pollution from Locomotive Engines and Marine Compression Ignition
Engines Less than 30 Liters Per Cylinder.” EPA420-R-08-001, March 2008
Related Documents
![[MS-SIP]: Session Initiation Protocol ExtensionsMS-SIP].pdfSession Initiation Protocol Extensions SIP. . SIP message. .](https://static.cupdf.com/doc/110x72/5e7f8669844925290d6f8357/ms-sip-session-initiation-protocol-extensions-ms-sippdf-session-initiation.jpg)