Phase-field crystal modeling and classical density functional theory of freezing K. R. Elder, 1 Nikolas Provatas, 2 Joel Berry, 1,3 Peter Stefanovic, 2 and Martin Grant 3 1 Department of Physics, Oakland University, Rochester, Michigan 48309-4487, USA 2 Department of Materials Science and Engineering and Brockhouse Institute for Materials Research, McMaster University, Hamilton, Ontario, Canada L8S-4L7 3 Physics Department, McGill University, 3600 rue University, Rutherford Building, Montréal, Québec, Canada H3A 2T8 Received 7 July 2006; revised manuscript received 25 November 2006; published 14 February 2007 In this paper the relationship between the classical density functional theory of freezing and phase-field modeling is examined. More specifically a connection is made between the correlation functions that enter density functional theory and the free energy functionals used in phase-field crystal modeling and standard models of binary alloys i.e., regular solution model. To demonstrate the properties of the phase-field crystal formalism a simple model of binary alloy crystallization is derived and shown to simultaneously model solidification, phase segregation, grain growth, elastic and plastic deformations in anisotropic systems with multiple crystal orientations on diffusive time scales. DOI: 10.1103/PhysRevB.75.064107 PACS numbers: 64.60.My, 05.70.Ln, 64.60.Cn, 81.30.Hd I. INTRODUCTION The formalism for calculating equilibrium states was es- tablished many years ago by Gibbs, Boltzmann, and others. While this formalism has proved remarkably successful there are many systems which never reach equilibrium, mainly due to the existence of metastable or long-lived transient states. This is most apparent in solid materials. For example, it is very unlikely that the reader is sitting in a room containing any single crystals except items produced with considerable effort such as the silicon chips in computers. In fact the vast majority of naturally occurring or engineered materials are not in equilibrium and contain complex spatial structures on nanometer, micron or millimeter length scales. More impor- tantly many material properties electrical, optical, mechani- cal, etc. are strongly influenced by the nonequilibrium struc- tures that form during material processing. For example, the yield strength of a polycrystal varies as the inverse square of the average grain size. The study of nonequilibrium microstructure formation has seen considerable advances through the use of the phase- field approach. This methodology models the dynamics of various continuum fields that collectively characterize micro- structure in phase transformations. For example, phase-field or continuum models have been used to simulate spinodal decomposition, 1 order-disorder transition kinetics, 2 ordering of block-copolymer melts, 3 solidification of pure and binary systems 4–8 and many other systems. In these phenomena the evolution of the appropriate fieldse.g., solute concentra- tion in spinodal decomposition is assumed to be dissipative and driven by minimizing a phenomenological free energy functional. 1 Advances in the phase-field modeling of solidification phenomena have followed a progression of innovations, be- ginning with the development of free energies that capture the thermodynamics of pure materials 4–6 and alloys. 7,8 Sev- eral modifications were then proposed 9–11 to simplify nu- merical simulations and improve computational efficiency. Perhaps the most important innovation was the development of matched asymptotic analysis techniques that directly con- nect phase-field model parameters with the classical Stefan or sharp-interface models for pure materials or alloys. 12–15 These techniques were complimented by new adaptive mesh refinement algorithms, 16,17 whose improved efficiency sig- nificantly increased the length scales accessible by numerical simulations, thus enabling the first experimentally relevant simulations of complex dendritic structures and their interac- tions in organic and metallic alloys. 18–22 A weakness of the traditional phase-field methodology is that it is usually formulated in terms of fields that are spa- tially uniform in equilibrium. This eliminates many physical features that arise due to the periodic nature of crystalline phases, including elastic and plastic deformation, anisotropy and multiple orientations. To circumvent this problem tradi- tional phase-field models have been augmented by the addi- tion of one or more auxiliary fields used to describe the den- sity of dislocations 23–25 continuum stress and strain fields 26,27 and orientation fields. 28–30 These approaches have proven quite useful in various applications such as polycrystalline solidification. 24,28–32 Nevertheless it has proven quite chal- lenging to incorporate elastoplasticity, diffusive phase trans- formation kinetics and anisotropic surface energy effects into a single, thermodynamically consistent model. Very recently a new extension to phase-field modeling has emerged known as the phase-field crystal method PFC. 33–35 This methodology describes the evolution of the atomic den- sity of a system according to dissipative dynamics driven by free energy minimization. In the PFC approach the free en- ergy functional of a solid phase is minimized when the den- sity field is periodic. As discussed in the literature 33–35 the periodic nature of the density field naturally gives rise to elastic effects, multiple crystal orientations and the nucle- ation and motion of dislocations. While these physical fea- tures are included in other atomistic approaches such as mo- lecular dynamics a significant advantage of the PFC method is that, by construction, it is restricted to operate on diffusive time scales not on the prohibitively small time scales associ- ated with atomic lattice vibrations. The approach is similar to the atomic density function theory that was recently pro- posed by Jin and Khachaturyan. 36 In the case of pure mate- rials the PFC approach has been shown 33,34 to model many PHYSICAL REVIEW B 75, 064107 2007 1098-0121/2007/756/06410714 ©2007 The American Physical Society 064107-1

Welcome message from author
This document is posted to help you gain knowledge. Please leave a comment to let me know what you think about it! Share it to your friends and learn new things together.
Transcript

Phase-field crystal modeling and classical density functional theory of freezing
K. R. Elder,1 Nikolas Provatas,2 Joel Berry,1,3 Peter Stefanovic,2 and Martin Grant31Department of Physics, Oakland University, Rochester, Michigan 48309-4487, USA
2Department of Materials Science and Engineering and Brockhouse Institute for Materials Research, McMaster University, Hamilton,Ontario, Canada L8S-4L7
3Physics Department, McGill University, 3600 rue University, Rutherford Building, Montréal, Québec, Canada H3A 2T8�Received 7 July 2006; revised manuscript received 25 November 2006; published 14 February 2007�
In this paper the relationship between the classical density functional theory of freezing and phase-fieldmodeling is examined. More specifically a connection is made between the correlation functions that enterdensity functional theory and the free energy functionals used in phase-field crystal modeling and standardmodels of binary alloys �i.e., regular solution model�. To demonstrate the properties of the phase-field crystalformalism a simple model of binary alloy crystallization is derived and shown to simultaneously modelsolidification, phase segregation, grain growth, elastic and plastic deformations in anisotropic systems withmultiple crystal orientations on diffusive time scales.
DOI: 10.1103/PhysRevB.75.064107 PACS number�s�: 64.60.My, 05.70.Ln, 64.60.Cn, 81.30.Hd
I. INTRODUCTION
The formalism for calculating equilibrium states was es-tablished many years ago by Gibbs, Boltzmann, and others.While this formalism has proved remarkably successful thereare many systems which never reach equilibrium, mainly dueto the existence of metastable or long-lived transient states.This is most apparent in solid materials. For example, it isvery unlikely that the reader is sitting in a room containingany single crystals except items produced with considerableeffort such as the silicon chips in computers. In fact the vastmajority of naturally occurring or engineered materials arenot in equilibrium and contain complex spatial structures onnanometer, micron or millimeter length scales. More impor-tantly many material properties �electrical, optical, mechani-cal, etc.� are strongly influenced by the nonequilibrium struc-tures that form during material processing. For example, theyield strength of a polycrystal varies as the inverse square ofthe average grain size.
The study of nonequilibrium microstructure formation hasseen considerable advances through the use of the phase-field approach. This methodology models the dynamics ofvarious continuum fields that collectively characterize micro-structure in phase transformations. For example, phase-fieldor continuum models have been used to simulate spinodaldecomposition,1 order-disorder transition kinetics,2 orderingof block-copolymer melts,3 solidification of pure and binarysystems4–8 and many other systems. In these phenomena theevolution of the appropriate field�s� �e.g., solute concentra-tion in spinodal decomposition� is assumed to be dissipativeand driven by minimizing a phenomenological free energyfunctional.1
Advances in the phase-field modeling of solidificationphenomena have followed a progression of innovations, be-ginning with the development of free energies that capturethe thermodynamics of pure materials4–6 and alloys.7,8 Sev-eral modifications were then proposed9–11 to simplify nu-merical simulations and improve computational efficiency.Perhaps the most important innovation was the developmentof matched asymptotic analysis techniques that directly con-
nect phase-field model parameters with the classical Stefan�or sharp-interface� models for pure materials or alloys.12–15
These techniques were complimented by new adaptive meshrefinement algorithms,16,17 whose improved efficiency sig-nificantly increased the length scales accessible by numericalsimulations, thus enabling the first experimentally relevantsimulations of complex dendritic structures and their interac-tions in organic and metallic alloys.18–22
A weakness of the traditional phase-field methodology isthat it is usually formulated in terms of fields that are spa-tially uniform in equilibrium. This eliminates many physicalfeatures that arise due to the periodic nature of crystallinephases, including elastic and plastic deformation, anisotropyand multiple orientations. To circumvent this problem tradi-tional phase-field models have been augmented by the addi-tion of one or more auxiliary fields used to describe the den-sity of dislocations23–25 continuum stress and strain fields26,27
and orientation fields.28–30 These approaches have provenquite useful in various applications such as polycrystallinesolidification.24,28–32 Nevertheless it has proven quite chal-lenging to incorporate elastoplasticity, diffusive phase trans-formation kinetics and anisotropic surface energy effects intoa single, thermodynamically consistent model.
Very recently a new extension to phase-field modeling hasemerged known as the phase-field crystal method �PFC�.33–35
This methodology describes the evolution of the atomic den-sity of a system according to dissipative dynamics driven byfree energy minimization. In the PFC approach the free en-ergy functional of a solid phase is minimized when the den-sity field is periodic. As discussed in the literature33–35 theperiodic nature of the density field naturally gives rise toelastic effects, multiple crystal orientations and the nucle-ation and motion of dislocations. While these physical fea-tures are included in other atomistic approaches �such as mo-lecular dynamics� a significant advantage of the PFC methodis that, by construction, it is restricted to operate on diffusivetime scales not on the prohibitively small time scales associ-ated with atomic lattice vibrations. The approach is similar tothe atomic density function theory that was recently pro-posed by Jin and Khachaturyan.36 In the case of pure mate-rials the PFC approach has been shown33,34 to model many
PHYSICAL REVIEW B 75, 064107 �2007�
1098-0121/2007/75�6�/064107�14� ©2007 The American Physical Society064107-1

phenomena dominated by atomic scale elastic and plasticdeformation effects. These include grain boundary interac-tions, epitaxial growth, and the yield strength of nanocrys-tals.
The original PFC model is among the simplest math-ematical descriptions that can selfconsistently combine thephysics of atomic-scale elastoplasticity with the diffusive dy-namics of phase transformations and microstructure forma-tion. Nevertheless, analogously to traditional phase-fieldmodeling of solidification, further work is required to fullyexploit the methodology. More specifically it is important tobe able to generalize the method to more complex situations�binary alloys, faster dynamics, different crystal structures,etc.�, to develop more efficient numerical techniques and tomake a direct connection of the parameters of the model toexperimental systems. Several innovations toward this goalhave already been developed. Goldenfeld et al.37,38 have re-cently derived amplitude equations for the PFC model whichare amenable to adaptive mesh refinement schemes. Thiswork has the potential to enable simulations of mesoscopicphenomena ��m→mm� that are resolved down to theatomic scale and incorporate all the physics discussed above.Another recent advance is the inclusion of higher order timederivatives in the dynamics to simulate “instantaneous” elas-tic relaxation.39 This extension is important for modelingcomplex stress propagation and externally imposed strains.Very recently, Wu et al.40,41 fitted the PFC parameters toexperimental data in iron and were able to show that the PFCmodel gives an accurate description of the anisotropy of thesurface tension. In addition to this work Wu and Karma havealso developed a simple and elegant scheme to extend themethod to other crystal symmetries �i.e., FCC in three di-mensions�.
The purpose of this paper is to link the formalism of clas-sical density functional theory �DFT� of freezing, as formu-lated by Ramakrishnan and Yussouff42 �and also reviewed bymany other authors, such as Singh43� with the PFC methodand to exploit this connection to develop a PFC model forbinary alloys. The organization of the paper and a summaryof the remaining sections is as follows.
In Sec. II A the classical density functional theory offreezing of pure and binary systems is briefly outlined. Inthis approach the free energy functional is written in terms ofthe time averaged atomic density field � ��A and �B in binarysystems� and expanded around a liquid reference state exist-ing along the liquid-solid coexistence line. Formally the ex-pansion contains the n-point correlation functions of the liq-uid state. In this work the series expansion of the free energyis truncated at the two-point correlation function, C�r�1 ,r�2�.
Within this framework it is shown in Sec. III A that thePFC model for a pure material can be recovered from DFT ifC�r�1 ,r�2� is parametrized by three constants related to theliquid and solid state compressibilities and the lattice con-stant. The parameters of the PFC model can thus be directlyrelated to the physical constants that enter the DFT of freez-ing and the PFC model can be viewed as a simplified form ofDFT. In Sec. III B a binary system is considered. Similar tothe case of pure materials the free energy expansion of abinary alloy will be truncated at the two-point correlationfunctions which are then characterized by three parameters.
At this level of simplification it is shown that the “regular”solution model used in materials physics for alloys can beobtained directly from DFT. It is shown that the phenomeno-logical nearest-neighbor bond energies that enter the “regu-lar” solution model are equal to the compressibilities thatenter DFT. This section also provides insight into the con-centration dependence of various properties of the crystallinephase of a binary alloy such as the lattice constant, effectivemobilities and elastic constants.
In Sec. III C a simplified version of the binary alloy freeenergy is derived. This is done in order to provide a math-ematically simpler model that can more transparently illus-trate the use of the PFC formalism in simultaneously model-ing diverse processes such as solidification, grain growth,defect nucleation, phase segregation and elastic and plasticdeformation. This section also shows that the free energy ofthe simplified alloy PFC model reproduces two commonphase diagrams associated with typical binary alloys in ma-terials science. Some of the more tedious calculations in thederivation of the simplified model are shown in the Appen-dix.
In Sec. IV dynamical equations of motion that govern theevolution of the solute concentration and density field of abinary alloy are derived. Finally in Sec. V the simplifiedbinary alloy model is used to simulate several important ap-plications involving the interplay of phase transformation ki-netics and elastic and plastic effects. This includes solidifi-cation, epitaxial growth, and spinodal decomposition.
II. CLASSICAL DENSITY FUNCTIONAL THEORY OFFREEZING
In this section free energy functionals of pure and binarysystems as derived from the classical density functionaltheory of freezing are presented. For a rigorous treatment oftheir derivation the reader is referred to the work of Ra-makrishnan and Yussouff42 and numerous other very closelyrelated review articles by Singh,43 Evans,44 and referencestherein.
In DFT the emergence of an ordered phase during solidi-fication can be viewed as a transition to a phase in which theatomic number density, ��r��, is highly nonhomogenous andpossesses the spatial symmetries of the crystal.43 This ap-proach implicitly integrates out phonon modes in favor of astatistical view of the ordered phase that changes on diffu-sive time scales. The free energy functional of a system isexpressed in terms of � and constitutes the starting point ofthe PFC model.
In this work the free energy functional, denoted F���, isexpanded functionally about a density, �=�l, correspondingto a liquid state lying on the liquidus line of the solid-liquidcoexistence phase diagram of a pure material as shown inFig. 1�a�. The expansion is performed in powers of ����−�l.
As shown by others42–44 the free energy density can bewritten as
ELDER et al. PHYSICAL REVIEW B 75, 064107 �2007�
064107-2
Fc/kBT =� dx����r��ln���r��/�l� − ���r���
− n=2
�1
n!�
i=1
n
dr�i���r�i�Cn�r�1,r�2,r�3, . . . ,r�n� , �1�
where Fc is the free energy corresponding to the density ��r��minus that at the constant density �l, and the Cn functions aren-point direct correlation functions of an isotropic fluid. For-mally the correlation functions are defined by
Cn�r�1,r�2,r�3, . . . � ��n�
i=1
i=n
���r�i�
, �2�
where ���� represents the total potential energy of interac-tions between the particles in the material. A particularlysimple proof that � is a functional of � is given in Evans.44
For an alloy involving one or more components the freeenergy functional of a pure material in Eq. �1� is extended tothe form
Fc
kBT=
i� dr���i�r��ln��i�r��/��
i � − ��i�r���
−1
2i,j� dr�1dr�2��i�r�1�Cij�� j�r�2� + ¯ , �3�
where the sums are over the elements in the alloy, ��i��i−��
i and ��i is the value of the number density of component
i on the liquid-side of the liquid-solid coexistence line. Thefunction Cij is the two-point direct correlation function of
between components i and j in an isotropic fluid. As in thecase of pure materials it will be assumed that Cij �Cij��r�1
−r�2��. The next term in the expansion of Eq. �3� contains thethree-point correlation, the next after that, the four point, etc.In this paper only two-point correlations will be considered,but it must be stressed that these higher order correlationsmay be crucial for some systems, such as Si. Before consid-ering the properties of the binary alloy free energy in detail itis instructive to first study the properties of a pure systemand show the connection between this formalism and theoriginal PFC model.
III. ANALYSIS OF FREE ENERGY FUNCTIONALS
A. Pure materials
In this section the free energy functional of a single com-ponent alloy is considered in the limit that the series given inEq. �1� can be truncated at C2, i.e.,
F/kBT =� dr��� ln��/��� − ��� − �1/2� � dr�dr���C�r�,r�����
�4�
where, for convenience, the subscript 2 has been droppedfrom the two-point correlation function as has the subscript cfrom Fc. To understand the basic features of this free energyfunctional it is useful to expand F in the dimensionless de-viation of the density � from its average, �, using the res-caled density
n � �� − ��/� . �5�
Expanding F in powers of n gives
�F�kBT
=� dr��n1 − �C
2n −
n3
6+
n4
12− ¯ , �6�
where �F�F−F0 and F0 is the the free energy functionalat constant density �i.e., �= ��. For simplicity C is an opera-tor defined such that nCn��dr��n�r��C��r�−r����n�r���. Termsthat are linearly proportional to n in the above integral areidentically zero by definition.
To gain insight into the properties of the free energy func-tional in Eq. �6� it is useful to expand the two-point correla-tion function in a Taylor series around k=0, i.e.,
C = C0 + C2k2 + C4k4 + ¯ . �7�
�in real space this corresponds to C= �C0− C2�2+ C4�
4
− ¯ ���r�−r���, where the gradients are with respect to r���.The function C is sketched for a typical liquid in Fig. 1�b�. Inwhat follows only terms up to k4 will be retained. In thismanner the properties of the material are parametrized by the
three variables, C0, C2, and C4. To fit the first peak in C, C0,
C2, and C4 must be negative, positive, and negative, respec-tively. These variables are related to three basic properties ofthe material, the liquid phase isothermal compressibility
FIG. 1. �a� Sample phase diagram. In this figure the shaded areacorresponds to a coexistence region. In the calculations presented inthis paper the correlation functions are taken from points along theliquidus line at density ��. �b� In this figure a typical liquid statetwo-point direct correlation function is sketched. The dashed linerepresents the approximation used in most of the paper.
PHASE-FIELD CRYSTAL MODELING AND CLASSICAL… PHYSICAL REVIEW B 75, 064107 �2007�
064107-3

���1− �C0��, the bulk modulus of the crystal ���C22 / �C4��
and lattice constant ���C2 / �C4��1/2�. In other words the k=0 term is related to the liquid phase isothermal compress-
ibility, the height of the first peak �Cm in Fig. 1�b�� is relatedto the bulk modulus of the crystalline phase and the positionof the first peak determines the lattice constant.
It is important to note that at this level of simplificationthe material is only defined by three quantities which maynot be enough to fully parametrize any given material. Forexample, this simple three parameter model always predictstriangular symmetry in two dimensions and BCC symmetryin three dimensions. Other crystal symmetries can be ob-tained by using more complicated two-point correlationfunctions40,41 or by including higher order correlation func-tions. In addition it is possible that fitting to the width,
height, and position of the first peak in C may lead to a moreaccurate fitting to experimental data.
In two dimensions F is minimized by a triangular latticethat can be represented to lowest order by a one-mode ap-proximation as
n = A�1
2cos�2qy
�3 − cos�qx�cos� qy
��3� � . �8�
Substituting Eq. �8� into Eq. �6� and minimizing with respectto q gives equilibrium wave vector of
qeq = �3C2/�8�C4�� �9�
or in terms of the equilibrium lattice constant aeq=2� /qeq.When q=qeq, �F becomes
�F = 316�BA2 − 1
32A3 + 15512A4 + ¯ , �10�
where �F��F / ��kBTS�, S is the area of a unit cell, �B
�B�−Bs, B��1− �C0, and Bs� ��C2�2 / �4�C4��. The param-eter B� is the dimensionless bulk modulus of the liquid state�i.e., B�=� / ��kBT�, where � is the bulk modulus of a liquid�.The parameter Bs is proportional to the bulk modulus in thecrystalline phase.
Equation �10� indicates that the liquid state is linearlyunstable to the formation of the crystalline phase when �B0. This instability arises from a competition between theelastic energy stored in the liquid and crystalline phases. It isinteresting to note that �B can also be written
�B = ��s − ��/�s, �11�
where �s=1/ Cm and Cm is the height of the first peak of C asshown in Fig. 1. Written in this form �s can be thought of asdefining the effective spinodal density, i.e., the average den-sity at which the liquid becomes linearly unstable to crystal-lization.
Unfortunately it is difficult to obtain the equilibrium state�i.e., by solving d�F /dA=0� without truncating the infiniteseries in Eq. �10�. If only terms to order A4 are retained ananalytic approximation can be obtained for the amplitude�Amin� that minimizes F. In this approximation the solution is
Amin=2�1+�20� / �s−19� /5. Thus solutions for a crystallinestate exist when �19/20�s.
It is also straightforward to calculate the change in energyof the crystalline state upon deformation �i.e., bulk, shear ordeviatoric�. Details of similar calculations are given in theliterature.33,34 The result of these two-dimensional calcula-tions gives the dimensionless bulk modulus, Bc, of the crys-talline phase, i.e.,
Bc =3
32�
�C2�2
�C4�Amin
2 =3
8BsAmin
2 . �12�
In other words the parameter Bs controls the bulk modulus ofthe crystalline phase.
These calculations can be easily extended to three dimen-sions. As discussed previously this particular approximation
for C leads to a BCC crystal in three dimensions which canbe represented in a one mode approximation as, n=A�cos�qx�cos�qy�+cos�qx�cos�qz�+cos�qy�cos�qz��. Sub-stituting this functional form into the free energy and mini-
mizing with respect to q gives, qeq3d=�C2 / �C4�, and the free
energy functional at this q is
�F3d = 38�BA2 − 1
8A3 + 45256A4 + ¯ . �13�
Thus in this instance the spinodal occurs at the same den-sity as in the two-dimensional case. If the series is truncatedat A4 the amplitude that minimizes the free energy is thenAmin
3d =4�1+�15� / �s−14� /15. Thus in this approximationscrystalline �BCC� solutions only exist if �14�s /15. In ad-dition the elastic constants can also be calculated in three-dimensions �3D� in the usual manner. For example, the di-mensionless bulk modulus of the crystalline state is given byBc
3d=3Bs�Amin3d �2. This calculation gives the basic functional
dependence of the �dimensionless� bulk modulus on Bs andthe amplitude. For a more accurate calculation higher orderFourier components and more terms in the powers series in nshould be retained.
Finally it is useful to consider fixing the density and vary-ing the temperature. If the liquidus and solidus lines areroughly linear then, �s can be approximated by a linear func-tion of temperature. In the sample phase diagram shown inFig. 1�a� the liquidus and solidus lines are roughly paralleland it is likely that the spinodal is also roughly parallel tothese lines. In this case �B can be written
�B = ��T , �14�
where �T��T−Ts� /Ts, Ts is the spinodal temperature and���Ts / �s����s /�Ts�, evaluated at �= �.
B. Binary alloys
For a binary alloy made up of A and B atoms the freeenergy functional can be written to lowest order in terms ofthe direct correlation functions as
ELDER et al. PHYSICAL REVIEW B 75, 064107 �2007�
064107-4
FkBT
=� dr���A ln��A
��A − ��A + �B ln��B
��B − ��B�
−1
2� dr�1dr�2���A�r�1�CAA�r�1,r�2���A�r�2�
+ ��B�r�1�CBB�r�1,r�2���B�r�2�
+ 2��A�r�1�CAB�r�1,r�2���B�r�2�� , �15�
where ��A��A−�lA and ��B��B−�l
B. It is assumed here thatall two-point correlation functions are isotropic, i.e.,Cij�r�1 ,r�2�=Cij��r�1−r�2��.
In order to make a connection between the alloy free en-ergy and standard phase-field models it is useful to define thetotal number density, ���A+�B and a local concentrationfield c��A /�. In terms of these fields the atomic densitiescan be written, �A=c� and �B=��1−c�. Furthermore it isuseful to define �=�l+�� where �l��l
A+�lB and �c=1/2
−c. Substituting these definitions into Eq. �15� gives
FkBT
=� dr��� ln��/��� − �� + ��c + F0 −1
2���cCAA + �1
− c�CBB��� + ��c ln�c� + �1 − c�ln�1 − c�� + �c��CAA
+ CBB�/2 − CAB��1 − c��� , �16�
where ���l�CAA−CBB���+�l� /2+� ln���B /��
A� and F0
� � ln��� / ���A��
B�1/2�−CAA /2����A�2+�l /2��l+ ���
−CBB /2����B�2+�l /2��l+ ���.
To illustrate the properties of the model in Eq. �16� ituseful to consider two limiting cases, a liquid phase at con-stant density and a crystalline phase at constant concentra-tion. These calculations are presented in the following twosections.
1. Liquid phase properties
In the liquid phase � is constant on average and in themean field limit can be replaced by �= �. To simplify calcu-lations, the case �= ���� �or ���0� will now be consid-ered. As in the preceding section it is useful to expand thedirect correlation functions in Fourier space, i.e.,
Cij = C0ij + C2
ijk2 + C4ijk4 + ¯ . �17�
where the subscript i and j refer to a particular element.Substituting the real-space counterpart of the Fourier expan-
sion for Cij �to order k2� into Eq. �16� gives
FC
�kBT=� dr��c ln�c� + �1 − c�ln�1 − c� +
��C0
2c�1 − c�
+ ��c +��C2
2��c�2 , �18�
where FC is the total free energy minus a constant that de-pends only on �, �A
l , and �Bl ,
� � �B�BB − B�
AA� + � ln���B/��
A� , �19�
�Cn � CnAA + Cn
BB − 2CnAB, �20�
and B�ij =1− �C0
ij is the dimensionless bulk compressibility.Equation �18� is the regular solution model of a binary alloyin the limit �=0. It is also noteworthy that Eq. �18� impliesa temperature dependence of the gradient energy coefficientwhich is consistent with other theoretical65 andexperimental66 studies.
The coefficient of c�1−c� in Eq. �18� is given by
��C0 = 2B�AB − B�
AA − B�BB. �21�
This result shows that in the liquid state the interaction en-ergies that enter regular solution free energies are simply thecompressibilities �or the elastic energy� associated with theatomic species. The � term is also quite interesting as it isresponsible for asymmetries in the phase diagram. Thus Eq.�19� implies that asymmetries can arise from either differentcompressibilities or different densities.
Expanding Eq. �18� around c=1/2 gives
�FC
�kBT=� dr�� r�
2�c2 +
u
4�c4 + ��c +
K
2��c�2 , �22�
where �FC�FC− �kBT�dr����C0 /8−ln�2��, u�16/3, r�
��4− ��C0�, and K= ��C2. The parameter r� is related onlyto the k=0 part of the two-point correlation function and canbe written
r� = 4 + �B�AA + B�
BB − 2B�AB� . �23�
This result implies that the instability to phase segregation inthe fluid is a competition between entropy �4� and the elasticenergy of a mixed fluid �2B�
AB� with the elastic energy asso-ciated with a phase separated fluid �B�
AA+B�BB�. Replacing the
dimensionless bulk moduli with the dimensional version�i.e., B=� /kBT�, gives the critical point �i.e., rl=0� as
TC� = �2�AB − �BB − �AA�/�4kB� , �24�
where � is the dimensional bulk modulus.The properties of the crystalline phase are more compli-
cated but at the simplest level the only real difference is thatthe elastic energy associated with the crystalline state mustbe incorporated. This is discussed in the next section.
2. Crystalline phase properties
To illustrate the properties of the crystalline state, the casein which the concentration field is a constant is considered.In this limit the free energy functional given in Eq. �16� canbe written in the form
FkBT
�� dr��� ln� �
�� − �� −
1
2��C� �� + G� , �25�
where G is a function of the concentration c and �l and
couples only linearly to ��. The operator C� can be written as
C� � c2CAA + �1 − c�2CBB + 2c�1 − c�CAB. �26�
Thus in the limit that the concentration is constant this freeenergy functional is that of a pure material with an effective
PHASE-FIELD CRYSTAL MODELING AND CLASSICAL… PHYSICAL REVIEW B 75, 064107 �2007�
064107-5
two-point correlation function that is an average over the AA,BB, and AB interactions. In this limit the calculations pre-sented in Sec. III A can be repeated using the same approxi-
mations �i.e., expanding � around ��, expanding C� to �4 andusing a one mode approximation for ��� to obtain predic-tions for the concentration dependence of various quantities.For example, the concentration dependence of the equilib-rium wave vector �or lattice constant, Eq. �9�� and bulk
modulus Eq. �12� can be obtained by redefining Cn=c2CnAA
+ �1−c�2CnBB+2c�1−c�Cn
AB.As a more specific example the equilibrium lattice con-
stant can be expanded around c=1/2 to obtain in two orthree dimensions,
aeq��c� = aeq�0��1 + ��c + ¯ � , �27�
where �c=c−1/2 and � is the solute expansion coefficientgiven by
� = ��C4 − �C2�/2, �28�
where
�Cn � �CnAA − Cn
BB�/Cˆ n �29�
and Cˆ
n� Cn��c=0�= �CnAA+ Cn
BB+2CnAB� /4.
This line of reasoning can also be used to understand theinfluence of alloy concentration on crystallization. Specifi-cally, for the case of an alloy, the terms in Eq. �10� �with Areplaced with Amin� become functions of concentration, since�B and Amin are concentration dependent. Here, �B can beexpanded around c=1/2, i.e.,
�B��c� = �B0 + �B1�c + �B2�c2 + ¯ , �30�
where �B0=B0l −B0
s , �B1=B1l −B1
s , and �B2=B2l −B2
s are de-termined in the Appendix. This would imply that in the crys-talline phase the free energy has a term of the form, rc��c�2,where
rc = r� + 3�B2Amin2 /8 �31�
in two dimensions �in three dimensions the 3/8 factor isreplaced with 3/4�. This result indicates that crystallization�i.e., a nonzero Amin� favors phase segregation, assuming�AA+�BB2�AB. For example, when B2
s =0, the critical tem-perature increases and can be written
TCc = TC
� �1 + 3Amin2 /8� , �32�
or TCc =TC
� �1+3Amin2 /4� in three dimensions.
C. Simple binary alloy model
In this section a simple binary alloy model is proposedbased on a simplification of the free energy in Eq. �16�. Thegoal of this section is to develop a mathematically simplemodel that can be used to simultaneously model graingrowth, solidification, phase segregation in the presence ofelastic and plastic deformation. To simplify calculations it isconvenient to first introduce the following dimensionlessfields:
nA � ��A − �A�/� ,
nB � ��B − �B�/� . �33�
Also, it is convenient to expand in the following two fields:
n = nA + nB,
�N = �nB − nA� +�B − �A
�. �34�
The following calculations will use the field �N instead of�c. Expanding Eq. �16� around �N=0 and n=0 gives a freeenergy of the form
F�kBT
=� dr��n
2�B� + Bs�2R2�2 + R4�4��n +
t
3n3 −
v4
n4
+ �N +w
2�N2 +
u
4�N4 +
L2
2��� �N�2 + ¯ . �35�
Details of this free energy and explicit expressions for B�, Bs,R, , w, and L are given in the Appendix. The variables t, v,and u are constants. For simplicity the calculations presentedin this section are for a two-dimensional system.
The transition from liquid to solid is intimately related to�B=B�−Bs as was the case for the pure material and can bewritten in terms of a temperature difference, i.e., Eq. �14�. Inaddition some of the polynomial terms in n and �N havebeen multiplied by variable coefficients �t, v, and u� eventhough they can be derived exactly as shown in the Appen-dix. For example, the parameter v=1/3 recovers the exactform of the n4 term. This flexibility in the choice of coeffi-cients was done to be able to match the parameters of thefree energy with experimental material parameters. As anexample40,41 showed that adjusting the parameter v can beused to match the amplitude of fluctuations obtained in mo-lecular dynamics simulations. With this fit they are able toaccurately predict the anisotropy of the surface energy of aliquid-crystal interface in iron.
To facilitate the calculation of the lowest order phase dia-gram corresponding to Eq. �35� it is convenient to assumethe concentration field �N varies significantly over lengthscales much larger than the atomic number density field n.As a result, the density field can be integrated out of the freeenergy functional. Also, in the spirit of keeping calculationsas simple as possible without losing the basic physics con-tained in the model, =0 in the free energy. In this instancethe one-mode approximation for the total density, i.e., n=A�cos�2qy /�3� /2−cos�qx�cos�qy�3�� will be used. Substi-tuting this expression into Eq. �35� and minimizing with re-spect to q and A �recalling that �N is assumed constant overthe scale that n varies� gives qeq=�3/ �2R� and Amin=4�t+�t2−15v�B� /15v. The free energy that is minimized withrespect to amplitude and lattice constant is then,
Fsol =w
2�N2 +
u
4�N4 +
3
16�BAmin
2 −t
16Amin
3 +45v512
Amin4 .
�36�
ELDER et al. PHYSICAL REVIEW B 75, 064107 �2007�
064107-6

For mathematical simplicity all further calculations willbe limited to the approximations B�=B0
�+B2���N�2 and Bs
=B0s . In this limit analytic expressions can be obtained for a
number of quantities and the free energy functional is stillgeneral enough to produce for example a eutectic phase dia-gram.
It is relatively simple to calculate the solid-solid coexist-ance curves by expanding Fsol to order ��N�4, which thenyields the solid-solid coexistence concentrations at low tem-peratures according to
�Ncoex = ± ��a�/b , �37�
where a�w+3B2��Amin
0 �2 /8, b�u−6�B2��2Amin
0 / �15vAmin0
−4t� and Amin0 �Amin��N=0� �which is thus a function of
�B0�. The critical temperature, �B0C is determined by setting
�Ncoex=0 and solving for �B0, which gives
�B0c = �15wv − 2t�− 6B2
�w�/�6B2�� . �38�
To obtain the liquid-solid coexistence lines the free en-ergy of the liquid state must be compared to that of the solid.The mean field free energy of the liquid state is obtained bysetting n=0 which gives
Fliq =w
2�N2 +
u
4�N4. �39�
To obtain the solid-liquid coexistence lines it is useful toexpand the free energy of the liquid and solid states aroundthe value of �N at which the liquid and solid states have thesame free energy, i.e., when Fsol=Fliq. This occurs when,�Nls= ±���B0
ls−�B0� /B2�, where �B0�B0
l −B0s and �B0
ls
�8t2 / �135v� is the lowest value of �B0 at which a liquid cancoexist with a solid. To complete the calculations, Fsol andFliq are expanded around �Nls to order ��N−�Nls�2 and Max-well’s equal area construction rule can be used to identify theliquid-solid coexistence lines. The liquid-solidus lines are
�Nliq/�Nls = 1 + G�1 − �bsol/bliq� ,
�Nsol/�Nls = 1 + G�1 − �bliq/bsol� , �40�
where G�−8t2 / �135v�4�B0−3�B0ls��, bliq= �w+3u�Nls
2 � /2and bsol=bliq+2B2
��4�B0−3�B0ls� / �5v�, for �Nliq0, �Nsol
0 and similar results for �Nliq0, �Nsol0, since F is afunction of �N2 in this example. The calculations in thissection and the preceding section are reasonably accuratewhen �B0
ls�B0c, however in the opposite limit a eutectic
phase diagram forms and the accuracy of the calculationsdecreases. This case will be discussed below.
1. Linear elastic constants
As shown in previous literature,33,34 the elastic constantscan be calculated analytically in a one mode approximationby considering changes in F as a function of strain. For thebinary model similar calculations can be made in a constant�N approximation and give
C11/3 = C12 = C44 = 3Bs�Amin�2/16 �41�
�this calculation can be done for arbitrary dependence of Bs
on �N�. As expected the elastic constants are directly propor-tional to the amplitude of the density fluctuations. This im-plies that the elastic constants decrease as the liquid-solidtransition is approached from the solid phase. This resultimplies both a temperature and concentration dependencethrough the dependence of Amin on �B. In addition to thisdependence �which might be considered as a thermodynamicdependence� the magnitude of the elastic constants can bealtered by the constant Bs.
2. Calculation of alloy phase diagrams
To examine the validity of some of the approximations forthe phase diagrams made in the preceding section, numericalsimulations were conducted to determine the properties ofthe solid and liquid equilibrium states. The simulations wereperformed over a range of �N values, three values of �B0�0.07, 0.02, and −0.03� and two values of w �0.088 and−0.04�. The specific values of the other constants that enterthe model are given in the figure caption of Fig. 2.
In general the numerical results for the free energy, F, thelattice constant R and bulk modulus agreed quite well withthe analytic one-mode predictions presented in the precedingsection for all parameters. Comparisons of the analytic andnumerical predictions for the phase diagram are shown inFigs. 2 and 3 for w=0.088 and −0.04, respectively. As seenin these figures the agreement is quite good except near theeutectic point shown in Fig. 3. In this case, the analytic cal-
FIG. 2. Phase diagram of �B0 vs �N for the parameters B0s
=1.00, B1�=0, B2
�=−1.80, t=0.60, v=1.00, w=0.088, u=4.00, L=4.00, =0, R0=1.00, and R1=1.20 �see Eq. �A4� for definitions ofR0 and R1�. The solid line is a numerical solution of the one modeapproximation and the dashed lines are from Eq. �37� for the lowersolid-solid coexistence lines and Eq. �40� for the upper liquid-solidcoexistence lines. The solid points are from numerical solutions forthe minimum free energy functional given in Eq. �35�.
PHASE-FIELD CRYSTAL MODELING AND CLASSICAL… PHYSICAL REVIEW B 75, 064107 �2007�
064107-7
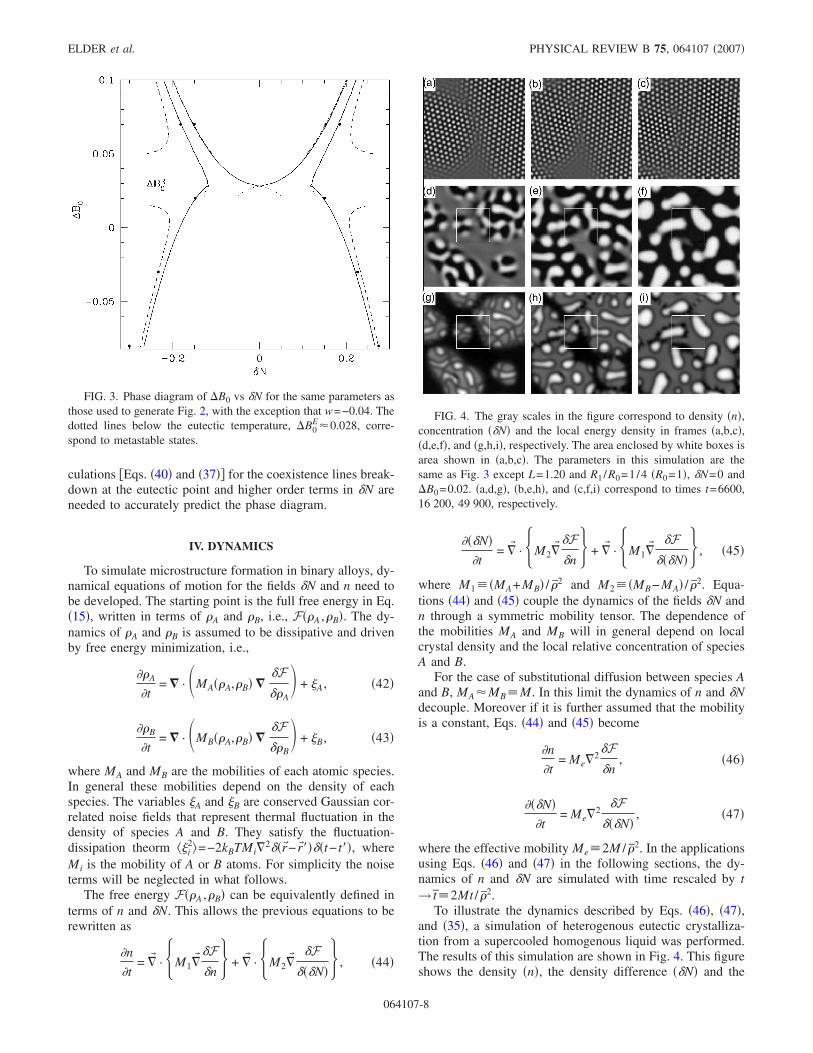
culations �Eqs. �40� and �37�� for the coexistence lines break-down at the eutectic point and higher order terms in �N areneeded to accurately predict the phase diagram.
IV. DYNAMICS
To simulate microstructure formation in binary alloys, dy-namical equations of motion for the fields �N and n need tobe developed. The starting point is the full free energy in Eq.�15�, written in terms of �A and �B, i.e., F��A ,�B�. The dy-namics of �A and �B is assumed to be dissipative and drivenby free energy minimization, i.e.,
��A
�t= � · �MA��A,�B� �
�F��A
+ �A, �42�
��B
�t= � · �MB��A,�B� �
�F��B
+ �B, �43�
where MA and MB are the mobilities of each atomic species.In general these mobilities depend on the density of eachspecies. The variables �A and �B are conserved Gaussian cor-related noise fields that represent thermal fluctuation in thedensity of species A and B. They satisfy the fluctuation-dissipation theorm ��i
2�=−2kBTMi�2��r�−r�����t− t��, where
Mi is the mobility of A or B atoms. For simplicity the noiseterms will be neglected in what follows.
The free energy F��A ,�B� can be equivalently defined interms of n and �N. This allows the previous equations to berewritten as
�n
�t= �� · �M1��
�F�n� + �� · �M2��
�F���N�� , �44�
���N��t
= �� · �M2���F�n� + �� · �M1��
�F���N�� , �45�
where M1��MA+MB� / �2 and M2��MB−MA� / �2. Equa-tions �44� and �45� couple the dynamics of the fields �N andn through a symmetric mobility tensor. The dependence ofthe mobilities MA and MB will in general depend on localcrystal density and the local relative concentration of speciesA and B.
For the case of substitutional diffusion between species Aand B, MA�MB�M. In this limit the dynamics of n and �Ndecouple. Moreover if it is further assumed that the mobilityis a constant, Eqs. �44� and �45� become
�n
�t= Me�
2�F�n
, �46�
���N��t
= Me�2
�F���N�
, �47�
where the effective mobility Me�2M / �2. In the applicationsusing Eqs. �46� and �47� in the following sections, the dy-namics of n and �N are simulated with time rescaled by t→ t�2Mt / �2.
To illustrate the dynamics described by Eqs. �46�, �47�,and �35�, a simulation of heterogenous eutectic crystalliza-tion from a supercooled homogenous liquid was performed.The results of this simulation are shown in Fig. 4. This figureshows the density �n�, the density difference ��N� and the
FIG. 3. Phase diagram of �B0 vs �N for the same parameters asthose used to generate Fig. 2, with the exception that w=−0.04. Thedotted lines below the eutectic temperature, �B0
E�0.028, corre-spond to metastable states.
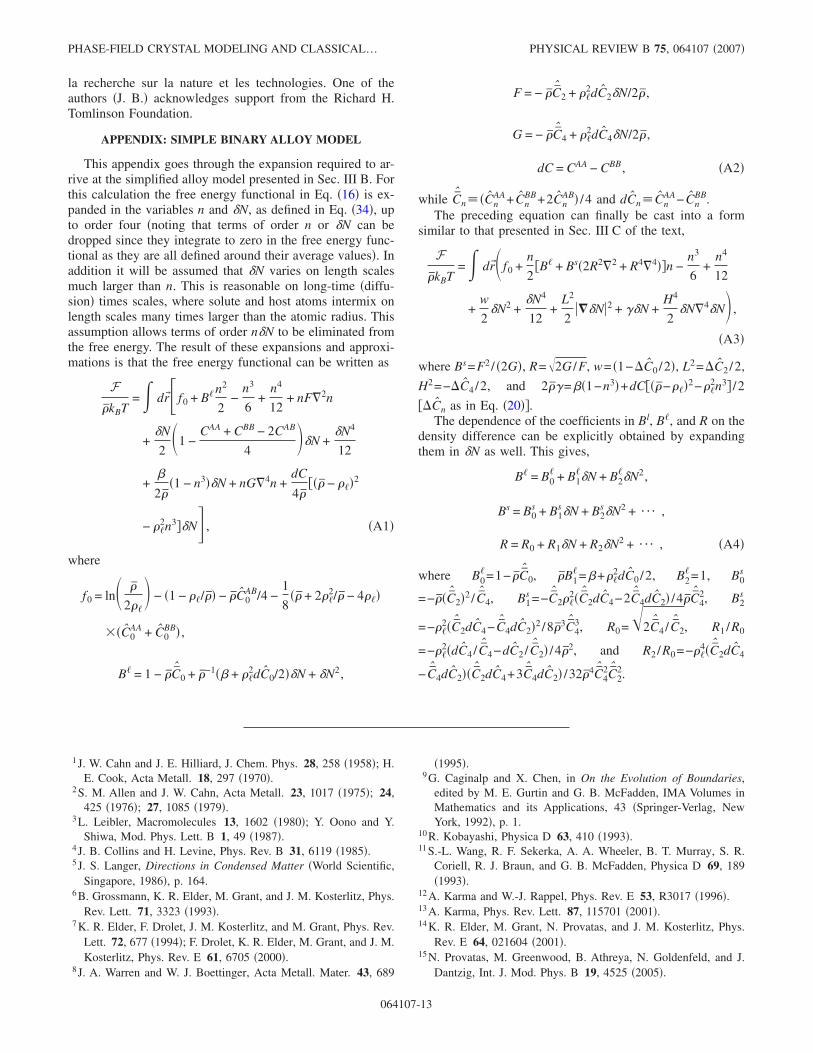
FIG. 4. The gray scales in the figure correspond to density �n�,concentration ��N� and the local energy density in frames �a,b,c�,�d,e,f�, and �g,h,i�, respectively. The area enclosed by white boxes isarea shown in �a,b,c�. The parameters in this simulation are thesame as Fig. 3 except L=1.20 and R1 /R0=1/4 �R0=1�, �N=0 and�B0=0.02. �a,d,g�, �b,e,h�, and �c,f,i� correspond to times t=6600,16 200, 49 900, respectively.
ELDER et al. PHYSICAL REVIEW B 75, 064107 �2007�
064107-8

local energy density at three time steps in the solidificationprocess. These figures show liquid-crystal interfaces, grainboundaries, phase segregation, dislocations and multiplecrystal orientations all in a single numerical simulation of thesimple binary alloy PFC model. In this simulation a simpleEuler algorithm was used for the time derivative and thespherical Laplacian approximation was used. The grid sizewas �x=1.1 and the time step was �t=0.05. Unless other-wise specified all simulations to follow use the same algo-rithm, grid size, and time step.
V. APPLICATIONS
This section applies the simplified PFC model derived inSec. III C, coupled to the dynamical equations of motionderived in Sec. IV, to the study of elastic and plastic effectsin phase transformations. The first application demonstrateshow the PFC alloy model can be used to simulate eutecticand dendritic microstructures. That is followed by a discus-sion of the effects of compressive and tensile stresses in ep-itaxial growth. Finally, simulations demonstrating the effectsof dislocation motion in spinodal decomposition are pre-sented.
A. Eutectic and dendritic solidification
One of the most important applications of the alloy PFCmodel is the study of solidification microstructures. Theseplay a prominent role in numerous applications such as com-mercial casting. Traditional phase-field models of solidifica-tion are typically unable to self-consistently combine bulkelastic and plastic effects with phase transformation kinetics,multiple crystal orientations and surface tension anisotropy.While some of these effects have been included in previousapproaches �e.g., surface tension anisotropy� they are usuallyintroduced phenomenologically. In the PFC formalism, thesefeatures arise naturally from DFT.
To illustrate solidification microstructure formation usingthe PFC formalism, two simulations of Eqs. �46� and �47�were conducted of the growth of a single crystal from asupercooled melt in two dimensions. In the first simulation asmall perturbation in the density field was introduced into asupercooled liquid using the parameters corresponding to thephase diagram in Fig. 3, except L=1.20 and R1 /R0=1/4. Thereduced temperature �B0=0.0248 and average concentration�N=0.0. To reduce computational time the size of the latticewas gradually increased as the seed increased in size. A snap-shot of the seed is shown at t=480 000 in Fig. 5�a�. A similarsimulation was conducted for the growth of a dendrite froma supercooled melt for reduced temperature �B0=0.04 and�N=0.0904, with other parameters corresponding to those inFig. 2, except for L=1.20 and R1 /R0=1/4. A sample den-dritic structure is shown in Fig. 5�b� at t=175 000. It shouldbe noted that the dendrite in Fig. 5�b� is not sixfold symmet-ric about its main trunk because the simulation is influencedby the boundaries of the numerical simulation cell, which arefourfold symmetric. Dendrites nucleated and grown in thecenter of the simulation domain retain their sixfold symme-try. Finally, it should be stressed that the side-branching is
only qualitatively correct in Fig. 5�b� as it was initiated bynumerical grid noise. For a more quantitative simulation ofnucleation and growth of side-branches, thermal fluctuationsneed to included in Eqs. �46� and �47�.
Simulations such as these can play an important role inestablishing various constitutive relations for use in higher-scale finite element modeling �FEM� of elastoplastic effectsin alloys during deformation. In particular, traditional FEMapproaches often employ empirical or experimental constitu-tive models to describe stress-strain response in elementsthat are intended to represent one �or more� grains. Theseconstitutive relations are often limited in their usefulness asthey do not self-consistently incorporate realistic informationabout microstructural properties that develop during solidifi-cation.
FIG. 5. The gray scale in the main portion of both figures showthe concentration field �N. In the insets, the gray-scale shows thedensity field, n, for the small portion of the main figure that isindicated by the white boxes. �a� Eutectic crystal grown from asupercooled liquid at �B0=0.0248 and �N=0.0. The parametersthat enter the model are the same as Fig. 3 except L=1.20 andR1 /R0=1/4 �R0=1�. �b� Dendrite crystal grown from a supercooledliquid at �B0=0.04 and �N=0.0904. The parameters that enter themodel are the same as Fig. 2 except L=1.20 and R1 /R0=1/4. In �b�mirror boundary conditions were used.
PHASE-FIELD CRYSTAL MODELING AND CLASSICAL… PHYSICAL REVIEW B 75, 064107 �2007�
064107-9

B. Epitaxial growth
Another potential application of the PFC model is in thetechnologically important process of thin film growth. Thecase of heteroepitaxy, the growth of a crystalline film exhib-iting atomic coherency with a crystalline substrate of differ-ing lattice constant, has been examined in previous PFCstudies of pure systems.33,34 These initial works focused ontwo of the primary phenomena influencing film quality: �i�morphological instability to buckling or roughening and �ii�dislocation nucleation at the film surface. A third importanteffect in alloy films, �iii� compositional instability �phaseseparation in the growing film�, requires consideration ofmultiple atomic species and their interaction. The purpose ofthis section is to illustrate how the binary PFC model ad-dresses such compositional effects in alloy heteroepitaxy, fo-cusing on the spatial dynamics of phase separation over dif-fusive time scales.
To date, a number of models of single component filmgrowth incorporating surface roughening, dislocation nucle-ation, or both have been proposed,25,45–53 and models of bi-nary film growth incorporating surface roughening and phaseseparation have been proposed as well.54–57 However, no ex-isting models of binary film growth known to the authorshave captured all of the above important phenomena, and itwould be reasonable to expect that new insights into thenature of film growth could be gained through the simulta-neous investigation of all of these growth characteristics. Aunified treatment of this sort is required for the followingreasons. There is clearly a strong link between surface rough-ening and dislocation nucleation, originating from the factthat dislocations nucleate at surface cusps when the film be-comes sufficiently rough. It is also known that phase separa-tion in the film is significantly influenced by local stresses,which are inherently coupled to surface morphology and dis-location nucleation. The dynamics of the growth processmust then be influenced by the cooperative evolution of allthree of these phenomena. In the next paragraph numericalsimulations will be presented to show that the binary PFCmodel produces all of the growth characteristics describedabove, and that each is influenced by misfit strain and atomicsize and mobility differences between species.
Numerical simulations. The physical problem recreated inthese simulations is that of growth of a symmetric �i.e.,50/50 mixture, or average density difference �N0=0� binaryalloy film from a liquid phase or from a saturated vaporphase above the bulk coherent spinodal temperature ��Tc�.Growth at temperatures above the miscibility gap is typicalof experimental conditions and should ensure that phaseseparation is driven by local stresses and is not due to spin-odal decomposition. Initial conditions consisted of a binary,unstrained crystalline substrate, eight atoms in thickness,placed below a symmetric supercooled liquid of componentsA and B. In all the simulations presented, parameters are thesame as in Fig. 2 except for L=1.882 and �B0=0.008 86unless specified in the figure caption. In what follows themisfit strain, �, is defined as �afilm−asub� /asub, where afilm
�aA�1+��N0� if in the constant concentration approxima-tion. For a symmetric mixture of A and B atoms �i.e., �N0=0� afilm= �aA+aB� /2.
Periodic boundary conditions were used in the lateral di-rections, while a mirror boundary condition was applied atthe bottom of the substrate. A constant flux boundary condi-tion was maintained along the top boundary, 120�x abovethe film surface, to simulate a finite deposition rate. Misfitstrain was applied to the system by setting R=1 in the sub-strate and R=1+�+��N in the film. This approach yields afilm and substrate that are essentially identical in nature ex-cept for this shift in lattice parameter in the film. Complexi-ties resulting from differing material properties between thefilm and substrate are therefore eliminated, isolating the ef-fects of misfit strain, solute strain, and mobility differenceson the film growth morphology. The substrate was permittedto strain elastically, but was prevented from decomposingcompositionally except near the film-substrate interface.
A sample simulation is shown in Fig. 6 demonstrating thatthe well-documented buckling or Asaro-Tiller-Grinfeld46,47
instability is naturally reproduced by the PFC model. Thisinstability is ultimately suppressed as a cusplike surface mor-phology is approached, with increasingly greater stress de-veloping in surface valleys. The buckling behavior ceaseswhen the local stress in a given valley imparts on the film agreater energy than that possessed by an equivalent film witha dislocation. At this stage a dislocation is nucleated in thesurface valley and the film surface begins to approach a pla-nar morphology.
The nature of phase separation within the bulk film and atthe film surface was found to vary with model parameters,but a number of generalizations applicable to all systemsstudied have been identified. For the case of equal speciesmobilities �MA=MB� we find that in the presence of misfitand solute strain, the component with greater misfit relativeto the substrate preferentially segregates below surface peaks�see regions marked 1 and 2 in Fig. 7 and Fig. 8�. Larger�smaller� atoms will be driven toward regions of tensile�compressive� stress which corresponds to peaks �valleys� ina compressively strained film and to valleys �peaks� in a filmunder tensile strain. This coupling creates a lateral phase
FIG. 6. Plots of the smoothed local free energy showing theprogression of the buckling instability, dislocation nucleation andclimb towards the film-substrate interface. From �a� to �d� timesshown are t=600, 1050, 1200, and 2550. In this figure �=0.04, �=−1/4, and MA=MB=1.
ELDER et al. PHYSICAL REVIEW B 75, 064107 �2007�
064107-10

separation on the length scale of the surface instability andhas been predicted and verified for binary films54–62 andanalogous behavior has been predicted and verified in quan-tum dot structures.63,64,67
Second, again for the case of equal mobilities, the com-ponent with greater misfit relative to the substrate is driventoward the film surface �see Fig. 8�. This behavior can alsobe explained in terms of stress relaxation and is somewhatanalogous to impurity rejection in directional solidification.The greater misfit component can be viewed as an impuritythat the growing film wishes to drive out toward the inter-face. Experimental evidence from SiGe on Si �Ref. 58� andInGaAs on InP �Refs. 59 and 60� verifies this behavior as anenrichment of the greater misfit component was detected atthe film surface in both systems. Other models54–57 have notled to this type of vertical phase separation possibly due toneglecting diffusion in the bulk films.
The third generalization that can be made is that, in thecase of sufficiently unequal mobilities, the component withgreater mobility accumulates at the film surface �see regionmarked 3 in �Fig. 7�. It was found that when the two com-ponents have a significant mobility difference, typicallygreater than a 2:1 ratio, the effect of mobility is more impor-tant than the combined effects of misfit and solute strains indetermining which component accumulates at the surface.Since Ge is believed to be the more mobile component in theSiGe system, we see that the findings of Walther et al.58 forSiGe on Si provide experimental support for this claim. Theyfind a significant enrichment of Ge at the film surface, aresult that was likely due to a combination of this mobilitydriven effect as well as the misfit driven effect described inthe second generalization. Experimental evidence also indi-cates that segregation of substrate constituents into the filmmay occur during film growth.68,69 We have similarly foundthat a vertical phase separation is produced near the film-
substrate interface and is complimented by a phase separa-tion mirrored in direction near defects. The extent of thisphase separation is controlled largely by the bulk mobilitiesof the two constituents, and to a lesser degree by �. Thecomplimenting phase separation near climbing defects is atransient effect, any traces of which are dulled once the de-fect reaches the film-substrate interface.
C. Dislocation motion in spinodal decomposition
Spinodal decomposition is a nonequilibrium process inwhich a linearly unstable homogenous phase spontaneouslydecomposes into two daughter phases. An example of thisprocess in the solid state occurs during a quench below thespinodal in Fig. 2 when �N=0. During this process domainsof alternating concentration grow and coarsen to a scale oftens of nanometers. Spinodal decomposition is of interest asit is a common mechanism for strengthening alloys, due tothe large number of interfaces that act to impede dislocationmotion.
Solid state strengthening mechanisms, such as spinodaldecomposition, rely critically on the interactions that existbetween dislocations and phase boundaries. Cahn was first tocalculate that the driving force for nucleation of an incoher-ent second phase precipitate is higher on a dislocation than inthe bulk solid.70 A similar result was obtained by Dolins fora coherent precipitate with isotropic elastic properties in thesolid solution.71 Hu et al. confirmed the results of Cahn andDolins using a model that included elastic fields from com-positional inhomogeneities and structural defects.72
Recent studies of spinodal decomposition have usedphase-field models to examine the role of dislocations onalloy hardening.73,74 These phase-field models couple the ef-fects of static dislocations to the kinetics of phase separation.Léonard and Desai were the first to simulate the effect ofstatic dislocations on phase boundaries, showing that thepresence of dislocations strongly favors the phase separationof alloy components.75
Haataja et al. recently introduced mobile dislocations intoa phase-field model that couples two burgers vectors fields tosolute diffusion and elastic strain relaxation. It was shownthat mobile dislocations altered the early and intermediatetime coarsening regime in spinodal decomposition.76,77 Spe-cifically, it was found that coherent strains at phase bound-aries decrease the initial coarsening rate, as they increase thestored elastic energy in the system. As dislocations migratetoward moving interfaces, they relax this excess strain en-ergy, thus increasing the coarsening rate.76 The growth re-gimes predicted by the model in Ref. 76 are in general agree-ment with several experimental studies of deformation onspinodal age hardening.78–81
Numerical simulations. Spinodal decomposition wassimulated using Eqs. �46� and �47�, for an alloy correspond-ing to the phase diagram in Fig. 2. Simulations began with aliquid phase of average dimensionless density difference�N0=0, which first solidified into a polycrystalline solid �al-pha� phase, which subsequently phase separated as the re-duced temperature ��B0� was lowered below the spinodal.Figure 9 shows the concentration and density fields for four
FIG. 7. Plot of the smoothed local concentration field showinglateral phase separation between the surface peaks and valleys.White, component A �large, fast�; black, component B �small,slow�. In this figure �=−0.02, �=0.4, MA=1, MB=1/4, and t=3500. See text for discussion of the numbered arrows.
FIG. 8. Plot of the smoothed local concentration field showingthe nature of the phase separation under opposite signs of �. In �a�and �b� �=0.04 and −0.025, respectively, and in both figures MA
=MB=1 and �=0.25.
PHASE-FIELD CRYSTAL MODELING AND CLASSICAL… PHYSICAL REVIEW B 75, 064107 �2007�
064107-11

time sequences during the spinodal decomposition process.The dots in the figures denote the locations of dislocationcores. Parameters for this simulation are given in the captionof Fig. 9. The spinodal coarsening rate corresponding to thedata of Fig. 9 was found to exhibit an early and intermediatetime regime that is slower that its traditional t1/3 behavior,
while at late times it asymptotically approaches t1/3.The simulations in Fig. 9 contain compositional domain
boundaries and grain boundaries between grains of differentorientations. As a result, the observed dislocation motion isaffected by elastic strain energy due to phase separation andcurvature driven grain boundary motion. To isolate the effectof phase separation on dislocations, Fig. 10 demonstratesdislocation motion near a coherent interface in the alloy. Asin Ref. 76, coherent strain energy built up due to composi-tional differences in the two phases drives the dislocationtoward the compositional boundary.
It is noteworthy that the alloy PFC introduced in this workdoes not incorporate “instantaneous” elastic relaxation. Aproper treatment of rapid relaxation of strain fields requiresthe model to be extended in a manner analogous to Ref. 39.However, because of the asymptotically slow kinetics ofspinodal decomposition and the small length scales betweendomain boundaries, it is expected that this will only influ-ence the time scales over which dislocations interact withdomain boundaries. As a result, the general trends depictedin �9� are expected to be correct.
VI. DISCUSSION AND CONCLUSIONS
In this paper a connection between the density functionaltheory of freezing and phase-field modeling was examined.More specifically it was shown that the phase-field crystalmodel introduced in earlier literature33–35 and the regular so-lution commonly used in material science can be obtainedfrom DFT in certain limits. These calculations relied on pa-rametrizing the direct two-point correlation function that en-ters DFT by three quantities related to the elastic energystored in the liquid and crystalline phases, as well as thelattice constant.
In addition, a simplified binary alloy model was devel-oped that self-consistently incorporates many physical fea-tures inaccessible in other phase-field approaches. The sim-plified alloy PFC model was shown to be able tosimultaneously model solidification, phase segregation, graingrowth, elastic and plastic deformations in anisotropic sys-tems with multiple crystal orientations on diffusive timescales.
It is expected that the alloy PFC formalism and its exten-sions can play an important role in linking material proper-ties to microstructure development in a manner that funda-mentally links the mesoscale to the atomic scale. As such thisformalism, particularly when combined with adaptive meshtechniques in phase amplitude or reciprocal space, can leadthe way to a truly multiscale methodology for predictivemodeling of materials performance.
ACKNOWLEDGMENTS
One of the authors �K. R. E.� acknowledges support fromthe National Science Foundation under Grant No. DMR-0413062. Two of the authors �N. P. and M. G.� would like tothank the National Science and Engineering Research Coun-cil of Canada for financial support. One of the authors �M.G.� also acknowledges support from le Fonds Quebecois de
FIG. 9. Four time sequences in the evolution of the concentra-tion field �gray scale�, superimposed on the corresponding densityfield. Dislocations are labeled by a square on the dislocation coresurrounded by a circle. The time sequence �a�–�d� corresponds tot=12 000, 24 000, 60 000, and 288 000, respectively �in units of�t=0.004�. The system size is 1024�x�1024�x, where �x=� /4.The average density difference �N0=0, while L=2.65, R1 /R0
=1/4 �R0=1� and all other parameters are the same as Fig. 2.
FIG. 10. A dislocation migrates toward a coherent phase bound-ary thus relaxing mismatch strain. An 800�800 �units of �x� por-tion of the actual simulations domain is shown. The data shows fourtime frames in the motion of the dislocation. Parameters of thesimulation are the same as in Fig. 9.
ELDER et al. PHYSICAL REVIEW B 75, 064107 �2007�
064107-12
la recherche sur la nature et les technologies. One of theauthors �J. B.� acknowledges support from the Richard H.Tomlinson Foundation.
APPENDIX: SIMPLE BINARY ALLOY MODEL
This appendix goes through the expansion required to ar-rive at the simplified alloy model presented in Sec. III B. Forthis calculation the free energy functional in Eq. �16� is ex-panded in the variables n and �N, as defined in Eq. �34�, upto order four �noting that terms of order n or �N can bedropped since they integrate to zero in the free energy func-tional as they are all defined around their average values�. Inaddition it will be assumed that �N varies on length scalesmuch larger than n. This is reasonable on long-time �diffu-sion� times scales, where solute and host atoms intermix onlength scales many times larger than the atomic radius. Thisassumption allows terms of order n�N to be eliminated fromthe free energy. The result of these expansions and approxi-mations is that the free energy functional can be written as
F�kBT
=� dr�� f0 + B�n2
2−
n3
6+
n4
12+ nF�2n
+�N
2�1 −
CAA + CBB − 2CAB
4 �N +
�N4
12
+�
2��1 − n3��N + nG�4n +
dC
4���� − ���2
− ��2n3��N� , �A1�
where
f0 = ln� �
2�� − �1 − ��/�� − �C0
AB/4 −1
8�� + 2��
2/� − 4���
��C0AA + C0
BB� ,
B� = 1 − �Cˆ
0 + �−1�� + ��2dC0/2��N + �N2,
F = − �Cˆ
2 + ��2dC2�N/2� ,
G = − �Cˆ
4 + ��2dC4�N/2� ,
dC = CAA − CBB, �A2�
while Cˆ
n��CnAA+ Cn
BB+2CnAB� /4 and dCn� Cn
AA− CnBB.
The preceding equation can finally be cast into a formsimilar to that presented in Sec. III C of the text,
F�kBT
=� dr�� f0 +n
2�B� + Bs�2R2�2 + R4�4��n −
n3
6+
n4
12
+w
2�N2 +
�N4
12+
L2
2���N�2 + �N +
H4
2�N�4�N ,
�A3�
where Bs=F2 / �2G�, R=�2G /F, w= �1−�C0 /2�, L2=�C2 /2,
H2=−�C4 /2, and 2� =��1−n3�+dC���−���2−��2n3� /2
��Cn as in Eq. �20��.The dependence of the coefficients in Bl, B�, and R on the
density difference can be explicitly obtained by expandingthem in �N as well. This gives,
B� = B0� + B1
��N + B2��N2,
Bs = B0s + B1
s�N + B2s�N2 + ¯ ,
R = R0 + R1�N + R2�N2 + ¯ , �A4�
where B0�=1− �C
ˆ0, �B1
�=�+��2dC0 /2, B2
�=1, B0s
=−��Cˆ 2�2 / Cˆ
4, B1s =−C
ˆ2��
2�Cˆ 2dC4−2Cˆ
4dC2� /4�Cˆ
42, B2
s
=−��2�Cˆ 2dC4− C
ˆ4dC2�2 /8�3C
ˆ43, R0=�2C
ˆ4 / C
ˆ2, R1 /R0
=−��2�dC4 / C
ˆ4−dC2 / C
ˆ2� /4�2, and R2 /R0=−��
4�Cˆ 2dC4
− Cˆ
4dC2��Cˆ 2dC4+3Cˆ
4dC2� /32�4Cˆ
42C
ˆ22.
1 J. W. Cahn and J. E. Hilliard, J. Chem. Phys. 28, 258 �1958�; H.E. Cook, Acta Metall. 18, 297 �1970�.
2 S. M. Allen and J. W. Cahn, Acta Metall. 23, 1017 �1975�; 24,425 �1976�; 27, 1085 �1979�.
3 L. Leibler, Macromolecules 13, 1602 �1980�; Y. Oono and Y.Shiwa, Mod. Phys. Lett. B 1, 49 �1987�.
4 J. B. Collins and H. Levine, Phys. Rev. B 31, 6119 �1985�.5 J. S. Langer, Directions in Condensed Matter �World Scientific,
Singapore, 1986�, p. 164.6 B. Grossmann, K. R. Elder, M. Grant, and J. M. Kosterlitz, Phys.
Rev. Lett. 71, 3323 �1993�.7 K. R. Elder, F. Drolet, J. M. Kosterlitz, and M. Grant, Phys. Rev.
Lett. 72, 677 �1994�; F. Drolet, K. R. Elder, M. Grant, and J. M.Kosterlitz, Phys. Rev. E 61, 6705 �2000�.
8 J. A. Warren and W. J. Boettinger, Acta Metall. Mater. 43, 689
�1995�.9 G. Caginalp and X. Chen, in On the Evolution of Boundaries,
edited by M. E. Gurtin and G. B. McFadden, IMA Volumes inMathematics and its Applications, 43 �Springer-Verlag, NewYork, 1992�, p. 1.
10 R. Kobayashi, Physica D 63, 410 �1993�.11 S.-L. Wang, R. F. Sekerka, A. A. Wheeler, B. T. Murray, S. R.
Coriell, R. J. Braun, and G. B. McFadden, Physica D 69, 189�1993�.
12 A. Karma and W.-J. Rappel, Phys. Rev. E 53, R3017 �1996�.13 A. Karma, Phys. Rev. Lett. 87, 115701 �2001�.14 K. R. Elder, M. Grant, N. Provatas, and J. M. Kosterlitz, Phys.
Rev. E 64, 021604 �2001�.15 N. Provatas, M. Greenwood, B. Athreya, N. Goldenfeld, and J.
Dantzig, Int. J. Mod. Phys. B 19, 4525 �2005�.
PHASE-FIELD CRYSTAL MODELING AND CLASSICAL… PHYSICAL REVIEW B 75, 064107 �2007�
064107-13

16 N. Provatas, N. Goldenfeld, and J. Dantzig, Phys. Rev. Lett. 80,3308 �1998�.
17 N. Provatas, J. Dantzig, and N. Goldenfeld, J. Comput. Phys.148, 265 �1999�.
18 N. Provatas, N. Goldenfeld, J. Dantzig, J. C. LaCombe, A. Lu-pulescu, M. B. Koss, M. E. Glicksman, and R. Almgren, Phys.Rev. Lett. 82, 4496 �1999�.
19 N. Provatas, Q. Wang, M. Haataja, and M. Grant, Phys. Rev. Lett.91, 155502 �2003�.
20 C. W. Lan, Y. C. Chang, and C. J. Shih, Acta Mater. 51, 1857�2003�.
21 M. Greenwood, M. Haataja, and N. Provatas, Phys. Rev. Lett. 93,246101 �2004�.
22 C. W. Lan and C. J. Shih, J. Cryst. Growth 2, 472 �2004�.23 Y. U. Wang, Y. M. Jin, A. M. Cuitino, and A. G. Khachaturyan,
Appl. Phys. Lett. 78, 2324 �2001�; Philos. Mag. Lett. 81, 385�2001�; Acta Mater. 49, 1847 �2001�.
24 Y. M. Jin and A. G. Khachaturyan, Philos. Mag. Lett. 81, 607�2001�.
25 M. Haataja, J. Müller, A. D. Rutenberg, and M. Grant, Phys. Rev.B 65, 165414 �2002�.
26 Y. Wang and A. G. Khachaturyan, Acta Metall. Mater. 43, 1837�1995�; Acta Mater. 45, 759 �1997�.
27 L. Q. Chen and A. G. Khachaturyan, Scr. Metall. Mater. 25, 61�1991�.
28 L.-Q. Chen and W. Yang, Phys. Rev. B 50, 15752 �1994�.29 B. Morin, K. R. Elder, M. Sutton, and M. Grant, Phys. Rev. Lett.
75, 2156 �1995�.30 J. A. Warren, W. C. Carter, and R. Kobayashi, Physica A 261,
159 �1998�; J. A. Warren, R. Kobayashi, and W. C. Carter, J.Cryst. Growth 211, 18 �2000�; R. Kobayashi, J. A. Warren, andW. C. Carter, Physica D 140, 141 �2000�.
31 J. A. Warren, R. Kobayashi, A. E. Lobkovsky, and W. C. Carter,Acta Mater. 51, 6035 �2003�.
32 L. Granasy, T. Pusztai, and J. A. Warren, J. Phys.: Condens. Mat-ter 16, R1205 �2004�; L. Granasy, T. Pusztai, T. Borzsonyi, J. A.Warren, B. Kvamme, and P. F. James, Phys. Chem. Glasses 45,107 �2004�.
33 K. R. Elder, M. Katakowski, M. Haataja, and M. Grant, Phys.Rev. Lett. 88, 245701 �2002�.
34 K. R. Elder and M. Grant, Phys. Rev. E 70, 051605 �2004�.35 J. Berry, M. Grant, and K. R. Elder, Phys. Rev. E 73, 031609
�2006�.36 Y. M. Jin and A. G. Khachaturyan, J. Appl. Phys. 100, 013519
�2006�.37 N. Goldenfeld, B. P. Athreya, and J. A. Dantzig, Phys. Rev. E 72,
020601�R� �2005�.38 N. Goldenfeld, B. P. Athreya, and J. A. Dantzig, J. Stat. Phys.
125, 1015 �2006�.39 P. Stefanovic, M. Haataja, and N. Provatas, Phys. Rev. Lett. 96,
225504 �2006�.40 K.-A. Wu, Ph.D. thesis, Northeastern University, 2006.41 K.-A. Wu, A. Karma, J. J. Hoyt, and M. Asta, Phys. Rev. B 73,
094101 �2006�.42 T. V. Ramakrishnan and M. Yussouff, Phys. Rev. B 19, 2775
�1979�.43 Y. Singh, Phys. Rep. 207, 351 �1991�.44 R. Evans, Adv. Phys. 28, 143 �1979�.45 J. W. Matthews and A. E. Blakeslee, J. Cryst. Growth 27, 118
�1974�; J. W. Matthews, J. Vac. Sci. Technol. 12, 126 �1975�.
46 R. J. Asaro and W. A. Tiller, Metall. Trans. 3, 1789 �1972�.47 M. Grinfeld, J. Nonlinear Sci. 3, 35 �1993�; Dokl. Akad. Nauk
SSSR 290, 1358 �1986�; �Sov. Phys. Dokl. 31, 831 �1986��.48 R. People and J. C. Bean, Appl. Phys. Lett. 47, 322 �1985�.49 J. Müller and M. Grant, Phys. Rev. Lett. 82, 1736 �1999�.50 W. H. Yang and D. J. Srolovitz, Phys. Rev. Lett. 71, 1593 �1993�.51 K. Kassner, C. Misbah, J. Müller, J. Kappey, and P. Kohlert,
Phys. Rev. E 63, 036117 �2001�.52 J. Tersoff and F. K. LeGoues, Phys. Rev. Lett. 72, 3570 �1994�.53 H. Gao and W. D. Nix, Annu. Rev. Mater. Sci. 29, 173 �1999�.54 B. J. Spencer, P. W. Voorhees, and J. Tersoff, Phys. Rev. Lett. 84,
2449 2000; Phys. Rev. B 64, 235318 �2001�.55 J. E. Guyer and P. W. Voorhees, Phys. Rev. B 54, 11710 �1996�;
Phys. Rev. Lett. 74, 4031 �1995�; J. Cryst. Growth 187, 150�1998�.
56 Z. F. Huang and R. C. Desai, Phys. Rev. B 65, 195421 �2002�;65, 205419 �2002�.
57 F. Leonard and R. C. Desai, Phys. Rev. B 56, 4955 �1997�; 57,4805 �1998�.
58 T. Walther, C. J. Humphries, and A. G. Cullis, Appl. Phys. Lett.71, 809 �1997�.
59 T. Okada, G. C. Weatherly, and D. W. McComb, J. Appl. Phys.81, 2185 �1997�.
60 F. Peiro, A. Cornet, J. R. Morante, A. Georgakilas, C. Wood, andA. Christou, Appl. Phys. Lett. 66, 2391 �1995�.
61 J. Mirecki Millunchick, R. D. Twesten, D. M. Follstaedt, S. R.Lee, E. D. Jones, Y. Zhang, S. P. Ahrenkiel, and A. Mascaren-has, Appl. Phys. Lett. 70, 1402 �1997�.
62 D. D. Perovic, B. Bahierathan, H. Lafontaine, D. C. Houghton,and D. W. McComb, Physica A 239, 11 �1997�.
63 N. Liu, J. Tersoff, O. Baklenov, A. L. Holmes, Jr., and C. K. Shih,Phys. Rev. Lett. 84, 334 �2000�.
64 J. Tersoff, Phys. Rev. Lett. 81, 3183 �1998�.65 M. Asta and J. J. Hoyt, Acta Mater. 48, 1089 �2000�.66 J. Mainville, Y. S. Yang, K. R. Elder, M. Sutton, K. F. Ludwig, Jr.,
and G. B. Stephenson, Phys. Rev. Lett. 78, 2787 �1997�.67 F. Ratto, F. Rosei, A. Locatelli, S. Cherifi, S. Fontana, S. Heun, P.
D. Szkutnik, A. Sgarlate, M. De Crescenzi, and N. Motta, Appl.Phys. Lett. 84, 4526 �2004�.
68 B. A. Joyce, J. L. Sudijono, J. G. Belk, H. Yamaguchi, X. M.Zhang, H. T. Dobbs, A. Zangwill, D. D. Vvedensky, and T. S.Jones, Jpn. J. Appl. Phys., Part 1 36, 4111 �1997�.
69 M. Krishnamurthy, A. Lorke, M. Wassermeier, D. R. M. Will-iams, and P. M. Petroff, J. Vac. Sci. Technol. B 11, 1384 �1993�.
70 J. W. Cahn, Acta Metall. 5, 169 �1957�.71 C. C. Dolins, Acta Metall. 18, 1209 �1970�.72 S. Y. Hu and L. Q. Chen, Acta Mater. 49, 463 �2001�.73 D. Rodney, Y. Le Bouar, and A. Finel, Acta Mater. 51, 17 �2003�.74 J. W. Cahn, Acta Metall. 11, 1275 �1963�.75 F. Léonard and R. C Desai, Phys. Rev. B 58, 8277 �1998�.76 Mikko Haataja, Jennifer Mahon, Nikolas Provatas, and Francois
Léonard, Appl. Phys. Lett. 87, 251901 �2005�.77 Mikko Haataja and Francois Léonard, Phys. Rev. B 69,
081201�R� �2004�.78 R. R. Bhat and P. P. Rao, Z. Metallkd. 75, 237 �1994�.79 F. T. Helmi and L. Zsoldos, Scr. Metall. 11, 899 �1977�.80 S. Spooner and B. G. Lefevre, Metall. Trans. A 11A, 1085
�1975�.81 J. T. Plewes, Metall. Trans. A 6A, 537 �1975�.
ELDER et al. PHYSICAL REVIEW B 75, 064107 �2007�
064107-14
Related Documents