Density distribution of the India plate beneath the Tibetan plateau: Geophysical and petrological constraints on the kinetics of lower-crustal eclogitization György Hetényi a, ⁎ , Rodolphe Cattin a , Fabrice Brunet a , Laurent Bollinger b , Jérôme Vergne a , John L. Nábělek c , Michel Diament d a Laboratoire de Géologie, Ecole Normale Supérieure, CNRS - UMR 8538, 24 rue Lhomond, 75005 Paris, France b Laboratoire de Détection et de Géophysique, CEA, BP12, 91680 Bruyères-le-Châtel, France c College of Oceanic and Atmospheric Sciences, Oregon State University, Corvallis OR 97331, USA d Institut de Physique du Globe de Paris, 4 place Jussieu, 75252 Paris, France Received 22 May 2007; received in revised form 14 September 2007; accepted 25 September 2007 Editor: C.P. Jaupart Available online 6 October 2007 Abstract We combine seismological and Bouguer anomaly data with thermo-kinematic and petrological modelling to constrain the extent and kinetics of the eclogitization process in the Indian lower crust underthrusting Tibet. Based on Airy-type isostasy gravity modelling, we show that the presence of denser material (eclogites) is required beneath the Tibetan Plateau. Using the geometries of main crustal interfaces constrained by seismological experiments along three profiles perpendicular to the Himalayan arc, multilayer density-models suggest that eclogitization of the Indian lower crust is completed where the maximal depth of its descent is reached. In an integrated geophysical and petrological approach, the temperature field of the studied area is determined and realistic pressure–temperature–density grids are calculated assuming different hydration levels for the Indian lower crust. The derived density profiles are used to forward model Bouguer anomalies and to compare them to the observations. It appears that eclogitization of the Indian lower crust is delayed compared to where it is expected to occur from phase equilibria. The results show that neither dry nor fully hydrated (free water in excess) lower-crust models are satisfactory. A hydration level of ca. 1 wt.% H 2 O, consistent with a lower crust having experienced amphibolitic conditions, is more realistic and yields better results. On this basis, the densification delay of the Indian lower crust can be accounted for by a kinetical hindrance (overstepping) of the consumption of the plagioclase component (garnet and clinopyroxene forming reactions), which does not release water. Densification proceeds relatively rapidly (within 6 My) at higher pressure and temperature (at least 100 °C above equilibrium), when dehydration reactions start releasing water. These results emphasize the key role of free water in metamorphic reaction kinetics and, consequently, on geodynamical processes. © 2007 Elsevier B.V. All rights reserved. Keywords: Bouguer anomaly; eclogite; metamorphic reaction kinetics; water; Tibet; India plate Available online at www.sciencedirect.com Earth and Planetary Science Letters 264 (2007) 226 – 244 www.elsevier.com/locate/epsl ⁎ Corresponding author. Tel.: +33 1 44 32 22 50, +33 1 44 32 22 61; fax: +33 1 44 32 20 00. E-mail address: [email protected] (G. Hetényi). 0012-821X/$ - see front matter © 2007 Elsevier B.V. All rights reserved. doi:10.1016/j.epsl.2007.09.036

Welcome message from author
This document is posted to help you gain knowledge. Please leave a comment to let me know what you think about it! Share it to your friends and learn new things together.
Transcript
Available online at www.sciencedirect.com
tters 264 (2007) 226–244www.elsevier.com/locate/epsl
Earth and Planetary Science Le
Density distribution of the India plate beneath the Tibetan plateau:Geophysical and petrological constraints on the kinetics
of lower-crustal eclogitization
György Hetényi a,⁎, Rodolphe Cattin a, Fabrice Brunet a, Laurent Bollinger b,Jérôme Vergne a, John L. Nábělek c, Michel Diament d
a Laboratoire de Géologie, Ecole Normale Supérieure, CNRS - UMR 8538, 24 rue Lhomond, 75005 Paris, Franceb Laboratoire de Détection et de Géophysique, CEA, BP12, 91680 Bruyères-le-Châtel, France
c College of Oceanic and Atmospheric Sciences, Oregon State University, Corvallis OR 97331, USAd Institut de Physique du Globe de Paris, 4 place Jussieu, 75252 Paris, France
Received 22 May 2007; received in revised form 14 September 2007; accepted 25 September 2007
Available onli
Editor: C.P. Jaupart
ne 6 October 2007
Abstract
We combine seismological and Bouguer anomaly data with thermo-kinematic and petrological modelling to constrain the extentand kinetics of the eclogitization process in the Indian lower crust underthrusting Tibet. Based on Airy-type isostasy gravitymodelling, we show that the presence of denser material (eclogites) is required beneath the Tibetan Plateau. Using the geometriesof main crustal interfaces constrained by seismological experiments along three profiles perpendicular to the Himalayan arc,multilayer density-models suggest that eclogitization of the Indian lower crust is completed where the maximal depth of its descentis reached.
In an integrated geophysical and petrological approach, the temperature field of the studied area is determined and realisticpressure–temperature–density grids are calculated assuming different hydration levels for the Indian lower crust. The deriveddensity profiles are used to forward model Bouguer anomalies and to compare them to the observations. It appears thateclogitization of the Indian lower crust is delayed compared to where it is expected to occur from phase equilibria. The results showthat neither dry nor fully hydrated (free water in excess) lower-crust models are satisfactory. A hydration level of ca. 1 wt.% H2O,consistent with a lower crust having experienced amphibolitic conditions, is more realistic and yields better results. On this basis,the densification delay of the Indian lower crust can be accounted for by a kinetical hindrance (overstepping) of the consumption ofthe plagioclase component (garnet and clinopyroxene forming reactions), which does not release water. Densification proceedsrelatively rapidly (within 6 My) at higher pressure and temperature (at least 100 °C above equilibrium), when dehydration reactionsstart releasing water.
These results emphasize the key role of free water in metamorphic reaction kinetics and, consequently, on geodynamicalprocesses.© 2007 Elsevier B.V. All rights reserved.
Keywords: Bouguer anomaly; eclogite; metamorphic reaction kinetics; water; Tibet; India plate
⁎ Corresponding author. Tel.: +33 1 44 32 22 50, +33 1 44 32 22 61; fax: +33 1 44 32 20 00.E-mail address: [email protected] (G. Hetényi).
0012-821X/$ - see front matter © 2007 Elsevier B.V. All rights reserved.doi:10.1016/j.epsl.2007.09.036
227G. Hetényi et al. / Earth and Planetary Science Letters 264 (2007) 226–244
1. Introduction
The southern border of the Tibetan Plateau is thescene of continental collision since 50 Ma (Patriat andAchache, 1984). Over the last three decades this regionhas been extensively studied to understand both itsbuilding and its structure from various methods,including structural geology, petrologic observations,thermochronological data, GPS measurements andseismological experiments (e.g. Le Fort, 1986; Zhaoet al., 1993; Jackson and Bilham, 1994; Lavé andAvouac, 2000; Bollinger et al., 2004; Bettinelli et al.,2006). The convergence across the Himalayas is mainlyaccommodated along major thrust faults, including theMain Central Thrust, the Main Boundary Thrust and theMain Frontal Thrust (Fig. 1) (e.g. Cattin and Avouac,
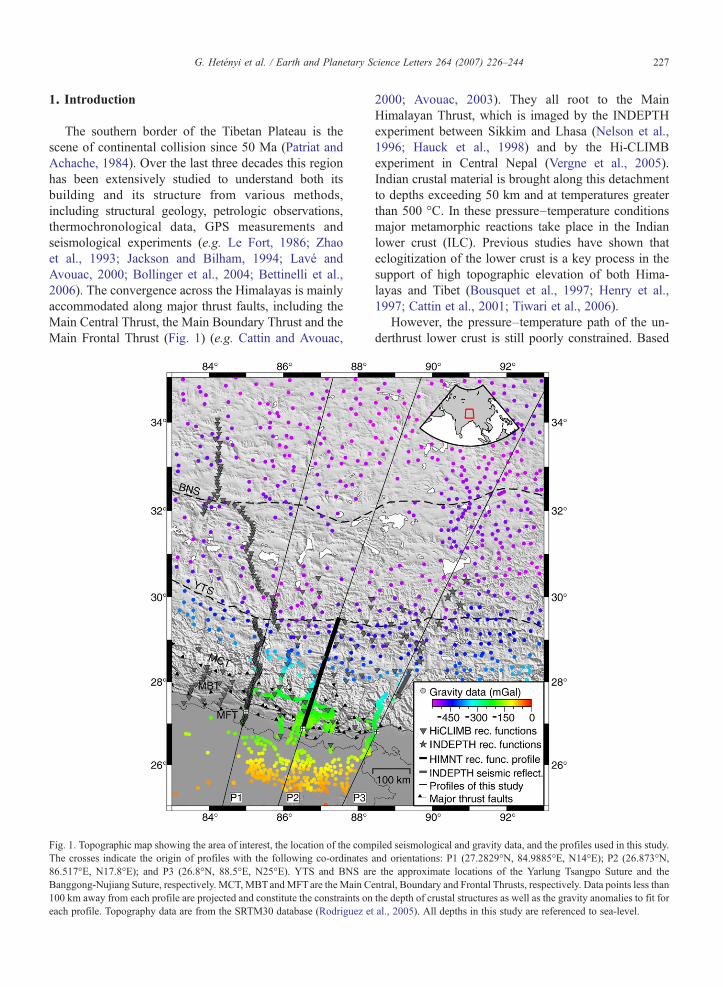
Fig. 1. Topographic map showing the area of interest, the location of the comThe crosses indicate the origin of profiles with the following co-ordinates86.517°E, N17.8°E); and P3 (26.8°N, 88.5°E, N25°E). YTS and BNS arBanggong-Nujiang Suture, respectively. MCT, MBTandMFTare the Main C100 km away from each profile are projected and constitute the constraints oneach profile. Topography data are from the SRTM30 database (Rodriguez et
2000; Avouac, 2003). They all root to the MainHimalayan Thrust, which is imaged by the INDEPTHexperiment between Sikkim and Lhasa (Nelson et al.,1996; Hauck et al., 1998) and by the Hi-CLIMBexperiment in Central Nepal (Vergne et al., 2005).Indian crustal material is brought along this detachmentto depths exceeding 50 km and at temperatures greaterthan 500 °C. In these pressure–temperature conditionsmajor metamorphic reactions take place in the Indianlower crust (ILC). Previous studies have shown thateclogitization of the lower crust is a key process in thesupport of high topographic elevation of both Hima-layas and Tibet (Bousquet et al., 1997; Henry et al.,1997; Cattin et al., 2001; Tiwari et al., 2006).
However, the pressure–temperature path of the un-derthrust lower crust is still poorly constrained. Based
piled seismological and gravity data, and the profiles used in this study.and orientations: P1 (27.2829°N, 84.9885°E, N14°E); P2 (26.873°N,e the approximate locations of the Yarlung Tsangpo Suture and theentral, Boundary and Frontal Thrusts, respectively. Data points less thanthe depth of crustal structures as well as the gravity anomalies to fit foral., 2005). All depths in this study are referenced to sea-level.

228 G. Hetényi et al. / Earth and Planetary Science Letters 264 (2007) 226–244
on a receiver function profile and observed fast lower-crustal P-wave velocities, Schulte-Pelkum et al. (2005)argue that the lower crust is partially (∼30%) eclogitizedjust South of the Yarlung Tsangpo Suture (YTS), and thatthe eclogitization process is governed by water availabil-ity. This implies that the lower-crustal material reaches theeclogite facies via granulite facies conditions, as shown inLe Pichon et al. (1997) for geotherms established aftermore than∼20Myof relaxation. However the latter studyalso shows that the geothermmay follow an amphibolite–eclogite and even a blueschist–eclogite path for shorterrelaxation times between ∼10–20 My and less than∼10 My, respectively.
The major shortcoming of these previous studies is thelack of accurate crustal geometries and thicknesses. Herewe take advantage of the recent Hi-CLIMB seismicexperiment, which imaged the main lithospheric struc-tures from the Siwaliks to Central Tibet (Nábělek et al.,2005;Hetényi et al., 2006).Alongwith the INDEPTHandthe HIMNT experiments (Zhao et al., 1993; Schulte-Pelkum et al., 2005), these seismological profiles crossingthe southern border of the Tibetan Plateau are used withgravity data to study both lateral variations andeclogitization of the Indian lower crust. First we discussthe compensation of Tibetan Plateau in term of Airyisostasy. Next, using both gravity anomalies andgeometrical constraints we estimate density variation inthe India lower crust. To better constrain the P–T path ofthe Indian lower crust, we calculate density distributionsfrom thermo-kinematic modelling and accurate petroge-netic grids. These modellings yield a multitude of densitydistributions, which we evaluate by comparing theirsynthetic gravity anomalies to observed ones. Finally,introduction of reaction kinetics to the model is appraisedand interpreted, together with the path of the Indian lowercrust in the pressure–temperature space.
2. Seismological and gravity anomaly datasets
Previous studies have used seismological or gravityobservations to image the main structures of theHimalayas and Southern Tibet. The HIMNT experiment(Schulte-Pelkum et al., 2005) reveals a descendingMoho beneath the Himalayas and its flattening South ofthe YTS, which is the northern extent of surfaceoccurrences of Indian-affinity rocks. However, theMoho's geometry further North remains unknownbecause the YTS marks the northern extension of thisexperiment. More recently the Hi-CLIMB project gave ahigher-resolution crustal image from the Ganges Basinto the North of the Banggong-Nujiang Suture (BNS)along ∼85°E (Nábělek et al., 2005; Hetényi et al.,
2006). Along this profile the descent of the India plate isclearly visible. The Indian lower crust smoothly crossesthe YTS at depth, and underthrusts the southern part ofthe Tibetan Plateau almost until the BNS. This suture isknown to be a major lithospheric limit: South of theBNS (Lhasa block), the crust is thicker and colder(Owens and Zandt, 1997), and shows better refractedwave propagation properties (Barazangi and Ni, 1982;Ni and Barazangi, 1983) than to its North (Qiangtangblock). Analysis of Bouguer anomalies in the southernborder of and across Tibet (Lyon-Caen and Molnar,1983; Jin et al., 1996) shows gravity anomalies as low as−500 mGal (1 mGal=10−5 m s−2) and confirms athickened crust all over the plateau.
To achieve good spatial coverage and study lateralvariations on the southern border of the Tibetan Plateau,we gathered seismological and gravity anomaly datafrom several sources along three profiles associated withthe INDEPTH, HIMNT and Hi-CLIMB seismologicalexperiments (Figs. 1 and 2).
2.1. Seismological data
The seismological data come from three majorexperiments (Fig. 1). Phase 1 (South) of the Hi-CLIMBmain array defines the line of profile P1 (Nábělek et al.,2005). Profile P2 passes along the HIMNT experimentline (Schulte-Pelkum et al., 2005). The southern path ofthe INDEPTH experiment through the Himalayas definesprofile P3 (Nelson et al., 1996; Hauck et al., 1998). Theobtained geometries of the main crustal boundaries arecompared on Fig. 2.
The depth-constraints of crustal interfaces for the Hi-CLIMB experiment (triangles on Fig. 1) come fromreceiver function calculations. We computed the receiv-er functions using the iterative time-domain deconvolu-tion method of Ligorría and Ammon (1999) using aband-pass filter between 0.01 Hz and 0.5 Hz cornerfrequencies and 100 iterations. Along the main array, thecalculated receiver functions are migrated using theCommon Conversion Point method (Zhu, 2000), in-cluding altitude corrections and with a 2-D velocity-model constrained by calculating average VP/VS-ratiosusing multiples (Nábělek et al., 2005). Using the P-to-Sconversion image along with the stacked images of themultiples, we pick the depth of the Moho. The top ofthe Indian lower crust is well imaged beneath SouthernTibet (Lhasa block). It is located 15 km above theMoho and exhibits a seismic signature generallystronger than that of the Moho, indicating a majorincrease in density and velocity. This 15 km lower crustis present beneath the Indian shield, but its upper limit
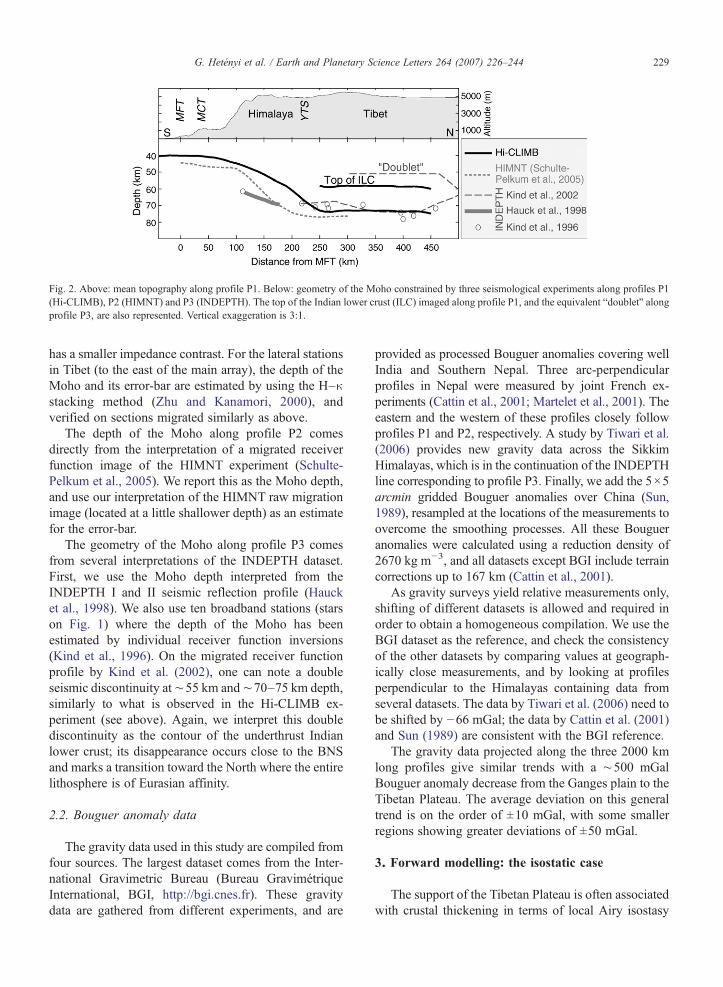
Fig. 2. Above: mean topography along profile P1. Below: geometry of the Moho constrained by three seismological experiments along profiles P1(Hi-CLIMB), P2 (HIMNT) and P3 (INDEPTH). The top of the Indian lower crust (ILC) imaged along profile P1, and the equivalent “doublet” alongprofile P3, are also represented. Vertical exaggeration is 3:1.
229G. Hetényi et al. / Earth and Planetary Science Letters 264 (2007) 226–244
has a smaller impedance contrast. For the lateral stationsin Tibet (to the east of the main array), the depth of theMoho and its error-bar are estimated by using the H–κstacking method (Zhu and Kanamori, 2000), andverified on sections migrated similarly as above.
The depth of the Moho along profile P2 comesdirectly from the interpretation of a migrated receiverfunction image of the HIMNT experiment (Schulte-Pelkum et al., 2005). We report this as the Moho depth,and use our interpretation of the HIMNT raw migrationimage (located at a little shallower depth) as an estimatefor the error-bar.
The geometry of the Moho along profile P3 comesfrom several interpretations of the INDEPTH dataset.First, we use the Moho depth interpreted from theINDEPTH I and II seismic reflection profile (Haucket al., 1998). We also use ten broadband stations (starson Fig. 1) where the depth of the Moho has beenestimated by individual receiver function inversions(Kind et al., 1996). On the migrated receiver functionprofile by Kind et al. (2002), one can note a doubleseismic discontinuity at∼55 km and∼70–75 km depth,similarly to what is observed in the Hi-CLIMB ex-periment (see above). Again, we interpret this doublediscontinuity as the contour of the underthrust Indianlower crust; its disappearance occurs close to the BNSand marks a transition toward the North where the entirelithosphere is of Eurasian affinity.
2.2. Bouguer anomaly data
The gravity data used in this study are compiled fromfour sources. The largest dataset comes from the Inter-national Gravimetric Bureau (Bureau GravimétriqueInternational, BGI, http://bgi.cnes.fr). These gravitydata are gathered from different experiments, and are
provided as processed Bouguer anomalies covering wellIndia and Southern Nepal. Three arc-perpendicularprofiles in Nepal were measured by joint French ex-periments (Cattin et al., 2001; Martelet et al., 2001). Theeastern and the western of these profiles closely followprofiles P1 and P2, respectively. A study by Tiwari et al.(2006) provides new gravity data across the SikkimHimalayas, which is in the continuation of the INDEPTHline corresponding to profile P3. Finally, we add the 5×5arcmin gridded Bouguer anomalies over China (Sun,1989), resampled at the locations of the measurements toovercome the smoothing processes. All these Bougueranomalies were calculated using a reduction density of2670 kg m−3, and all datasets except BGI include terraincorrections up to 167 km (Cattin et al., 2001).
As gravity surveys yield relative measurements only,shifting of different datasets is allowed and required inorder to obtain a homogeneous compilation. We use theBGI dataset as the reference, and check the consistencyof the other datasets by comparing values at geograph-ically close measurements, and by looking at profilesperpendicular to the Himalayas containing data fromseveral datasets. The data by Tiwari et al. (2006) need tobe shifted by −66 mGal; the data by Cattin et al. (2001)and Sun (1989) are consistent with the BGI reference.
The gravity data projected along the three 2000 kmlong profiles give similar trends with a ∼500 mGalBouguer anomaly decrease from the Ganges plain to theTibetan Plateau. The average deviation on this generaltrend is on the order of ±10 mGal, with some smallerregions showing greater deviations of ±50 mGal.
3. Forward modelling: the isostatic case
The support of the Tibetan Plateau is often associatedwith crustal thickening in terms of local Airy isostasy

Fig. 3. Two end-member tests without and with densification of the Indian lower crust. Top: topography. Below: observed (crosses) and calculated(solid line) Bouguer anomalies along the profile, and their difference (below). Bottom: geometry and density of the bodies. The dashed line contoursthe underthrust ILC. (a) Model 1: no density variation within the Indian lower crust: while the differences between the model and the observations aresmall along most of the Southern part of the profile, a clear divergence appears north of 100 km. (b) Model 2: sudden density increase of the entireIndian lower crust beneath 35 km depth: the misfit is small on both ends of the profile, but there is a clear difference between −200 and 500 km.
230 G. Hetényi et al. / Earth and Planetary Science Letters 264 (2007) 226–244
231G. Hetényi et al. / Earth and Planetary Science Letters 264 (2007) 226–244
(e.g. Jin et al., 1996; Cattin et al., 2001). Here we testthis assumption using both gravity measurements andvariations of crustal thickness inferred from seismolog-ical constraints along profile P1, where the best resolvedand longest continuous dataset is available.
3.1. Calculations
Our method to calculate the 2D synthetic gravityanomalies is the following. First, we define the shape ofthe Moho on each profile from the seismological datadescribed above. Based on observations along the Hi-CLIMB profile, where the Indian lower crust under-thrusts the entire Lhasa block, we fix the lower-crustalthickness to 15 km. Similar value is used in the study ofTiwari et al. (2006), and is observed on INDEPTH dataalong profile P3. The Moho and the top of the Indianlower crust separate the model into three areas, to whichwe associate reference densities: ρM for the mantle, ρLCfor the ILC, and ρUC for the upper crust. The model isextended at both ends: to the North at a constant depthcorresponding to the northernmost observations, and tothe South at 35 kmMoho depth, as observed beneath theIndian shield (e.g. Saul et al., 2000). Finally, ourapproach includes a sedimentary domain correspondingto the foreland basin, with a density of ρS=2250 kg m
−3
and a geometry of the basement following Hetényi et al.(2006) for profiles P1 and P2 and Tiwari et al. (2006) forprofile P3.
Then we use the algorithm of Won and Bevis (1987),based on the method of Talwani et al. (1959), tocalculate the gravitational attraction of the definedpolygons at the altitude of the observed data locations.The obtained anomaly curve is then shifted to the samelevel as the observations in the southern part of theprofile, where the mean level of the gravity anomaliesdoes not differ significantly from zero.
We estimate the sensitivity of our modelling by ver-tically shifting the Moho depth beneath Tibet by ±3 km,which is the average error-bar on the seismological image.The greatest deviation is ±49 mGal, which is the samemagnitude as the misfit between modelled and observedanomalies, and as the maximum extent of data dispersionalong the profile.
3.2. Constraints on isostasy
In order to explain the observed gravity anomalies,we first test models assuming local isostatic compensa-tion (Airy, 1855) of the Tibetan plateau (the zone locatedbeyond 300 km north of the MFT). These tests areperformed using the topography and gravity data along
profile P1, and with the simplification that the entirecrust has a uniform density (ρC=ρLC=ρUC). In this case,the crustal root R (the deepening of the Moho) derivessimply from topography as:
R ¼ T � qCDq
; ð1Þ
where Δρ=ρM−ρC is the density contrast across theMoho, and T is the average topography. Then theagreement of the observed (Obsi) and calculated (Cali)gravity data is measured by the misfit function
v2 ¼PN
iObsi � Calið Þ=rið Þ2
N; ð2Þ
where N is the number of data samples, and σ is anestimate of data dispersion, defined in 40 equidistantintervals along the entire profile as half of the differencebetween the highest and lowest data value.
The value of the misfit, calculated for a wide range ofρC and Δρ, shows that local isostatic compensationwould occur if the density of the crust and the mantlewere low (2500 kg m−3 and 2800–3100 kg m−3,respectively). Even though the density contrast acrossthe Moho is consistent with previous studies (Jin et al.,1996; Cattin et al., 2001), the absolute values of densityare inconsistent with those known for a typical mantleand an average crust (e.g. Turcotte and Schubert, 1982;Christensen and Mooney, 1995; Szafián and Horváth,2006). Thus we conclude that the observed Bougueranomalies are not compatible with a simple isostaticmodel, and that the primary density contrast beneathTibet should be introduced at shallower depth. In orderto explain the anomalies, we construct more realisticdensity models (see the next section), in which the usedgeometries already take into account regional isostaticeffects due to the weight of the Tibetan plateau and theflexure of the India plate (Hetényi et al., 2006).
4. Density variations beneath Tibet
To better approach the real composition of thelithosphere, we take into account the density variationsof the Indian lower crust due to eclogitization (see e.g.Henry et al., 1997, Cattin et al., 2001). In this meta-morphic transformation process, the density of the lowercrust increases to reach a value that is close to that of themantle (Bousquet et al., 1997; Jull and Kelemen, 2001).Bousquet et al. (1997) determined simplified petroge-netic grids, which show that the density of eclogitesdepends on the initial composition of the rock as well as
232 G. Hetényi et al. / Earth and Planetary Science Letters 264 (2007) 226–244

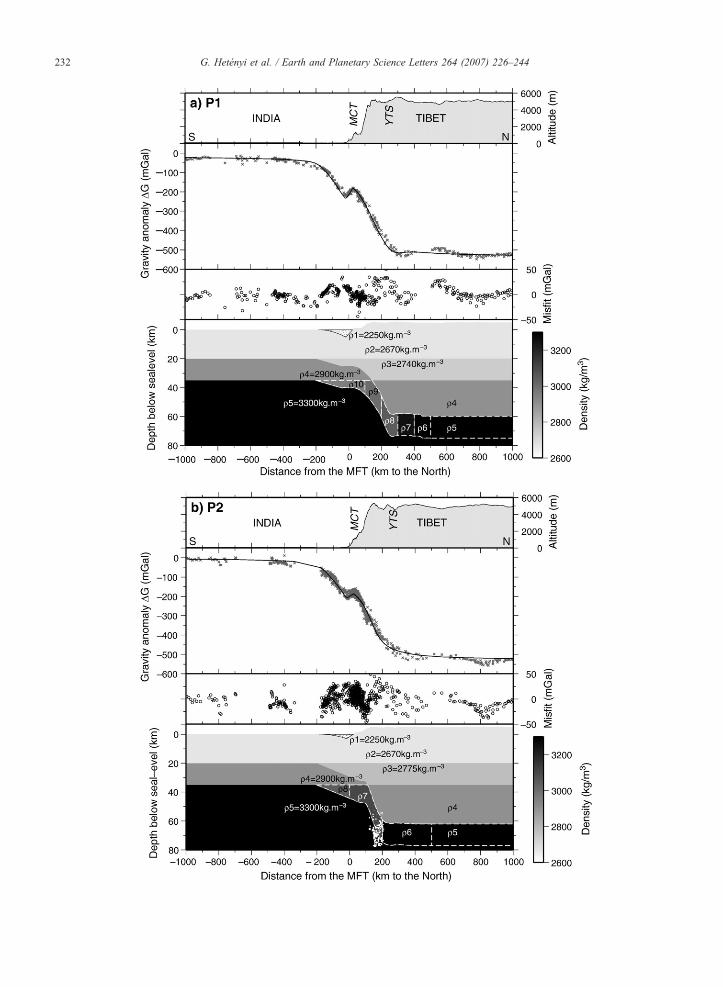
Fig. 4 (a)–(c) Three models corresponding to the best fit solutions at profiles P1, P2 and P3 (graphs as on Fig. 3). The imaged geometry of the Mohois assumed for all profiles with an Indian lower-crustal thickness of 15 km. The descending lower crust is divided into 100 km long bodies and theirdensities are varied independently to fit the observed Bouguer anomalies. These best models show that the major density jump occurs when the ILCreaches its maximum depth, what we interpret as the completion of the eclogitization process. The density-contrast between the crust and the mantleremains significant during the descent of the lower crust. White dots on the bottom graph of Fig. 4b represent lower-crustal microseismicityrelocalized by Monsalve et al. (2006). The white solid lines on the bottom graph of Fig. 4c show the shear-wave velocity models obtained byinversion of receiver function data at individual broadband stations of the INDEPTH experiment (Kind et al., 1996), the overlying scale representing1 km s−1 steps per tick in VS. Density values that are not noted on the figures are the following: (a) ρ6=3300, ρ7=3250, ρ8=3050, ρ9=3000, andρ10=2950 kg m−3. (b) ρ6=3300, ρ7=3100, and ρ8=3050 kg m−3. (c) ρ6=3200, ρ7=3100, and ρ8=3000 kg m−3.
233G. Hetényi et al. / Earth and Planetary Science Letters 264 (2007) 226–244
on the P–T conditions, and ranges between 3080 and3630 kg m−3. Based on these grids and on thermo-kinematic modelling, Henry et al. (1997) proposed thatthe high altitude of the Himalayas is related to theabsence of eclogites beneath the mountain range, due tothe fast rates of underthrusting of relatively coldmaterial. Furthermore, based on gravity data combinedwith numerical modelling, Cattin et al. (2001) showedthat eclogitization does not take place under the HighHimalayan range as expected from a steady-state localequilibrium assumption, but further North beneath theTibetan Plateau. More recently, Tiwari et al. (2006)showed that gravity and magnetic anomalies acrossSikkim can be explained with a model in which the crustbeneath Tibet (between 56 and 72 km depth) iseclogitized ∼100 km north of the YTS.
To explore the effect of density variation within thelower crust and to constrain its spatial extent, we first test
two end-members models without and with densification,respectively, using the geometries of profile P1. Next wepropose a gradual density variation that is consistent withthe observed gravity anomalies for the three studiedprofiles.
4.1. Tests of densification of the Indian lower crustbeneath Tibet
In the first test (Model 1), we suppose that Tibetancrust becomes denser with depth but we assume nodensity variation within the Indian lower crust (Fig. 3a).The calculated Bouguer anomaly is roughly consistentwith the observed one between the Ganges plain and theHigh Himalaya. However in southern and central Tibet,the calculated anomaly is systematically lower than —and thus inconsistent with — the observed one. Themisfit reaches up to 250 mGal in central Tibet, which

234 G. Hetényi et al. / Earth and Planetary Science Letters 264 (2007) 226–244
implies that the primary density contrast is locateddeeper than necessary (undercompensation).
In the second test (Model 2), we assume a densityincrease of 400 kg m−3 for the entire underthrust part ofthe ILC (beneath 35 km, Fig. 3b), thus its densitycontrast with the mantle is close to zero as suggested byHenry et al. (1997). However, we assume that theunderthrust part remains lighter than the mantle and wedo not address the question of delamination. TheBouguer anomaly corresponding to Model 2 presentsa step of ∼500 mGal between India and central Tibet, inagreement with the observed anomaly. Nevertheless, thecalculated anomaly is systematically higher than theobserved one between −200 and 500 km distance,beneath the foreland basin and the Himalayan range,with a maximum deviation of ∼150 mGal, implyingovercompensation in this zone.
The deviations between the calculated and observedanomalies in these two models represent end-members,and suggest a progressive density variation of the Indianlower crust. These changes occur between the forelandbasin and Southern Tibet, 500 km north from the MFT,where the density of the lower crust reaches the densityof the mantle. We performed similar tests on profiles P2and P3 and obtained identical results.
4.2. Gradual density variation of the ILC along profileand lateral comparisons
To model a gradual change of the Indian lower-crustaldensity from 2900 to 3300 kg m−3, we divide the zonebetween −200 and 500 km into 100 km long segmentsand vary their densitiesmanually and stepwise. Numerousmodels have been tested to simulate northward densifi-cation, using linear density gradients on varying length aswell as non-linear density changes, in order to minimizeχ2 in Eq. (2).We similarly processed all three profiles; ourresults (Fig. 4a–c) show many similarities but also somedifferences.
The similarities of the results lie in the fact that, in thevery first order, the geometry of the Moho is quitesimilar along each profile: it starts at 35 km depth in theSouth and ends at about 75 km depth beneath theTibetan plateau. The density values show that the majorchange in density of the Indian lower crust occurs onceit reaches its maximum depth. Also, a slow gradualchange from lower to higher values takes place in thedescending part.
The differences between the three profiles are alsolinked to the geometries: the steepness and the localizationof the lower crust's descent are particular to each profile.Between profile P1 and P2, the differences are small:
profile P2 shows a somewhat steeper dip, located closer tothe front of the range compared to profile P1, but bothprofiles reach their maximum depth in one ramp. This isnot the case for profile P3: there is a flat part in the descentof the lower crust between two ramps, and constraints onthe geometry (even if they are less tight) suggest that itplunges at a lower angle and on a longer distance thanprofiles P1 and P2. Thus the gradual change of densityalso takes place on a larger distance. One additionaldifference is the geometry of the foreland basin: whiledata are well explained by a flexural form at profiles P1and P2, it is better represented with a shallower, flat-bottom basin at profile P3, as previously mentioned byTiwari et al. (2006).
These results are also consistent with the detailedseismological image. The inverted receiver functions atindividual stations of the INDEPTH experiment (Kindet al., 1996) show a two-step transition in shear wavevelocity between the lower crust and the mantle inSouthern Tibet (white lines on Fig. 4c). These receiverfunctions are located in a zone where the density of theIndian lower crust is constant, but lower than that of themantle. The same features are visible at Hi-CLIMBstations in Lhasa block (Nábělek et al., 2005), and highlower-crustal velocities are observed in the northern partof the HIMNT experiment (Schulte-Pelkum et al.,2005). This two-step transition can be explained bythe high density of eclogites relative to their P-wavevelocity (Guéguen and Palciauskas, 1992), which leadsto two impedance-contrasts: one between the bottom ofTibetan crust and the top of the eclogitized Indian lowercrust, and the second between the bottom of the ILC andthe top of the lithospheric mantle. (More quantitatively,following Hacker and Abers (2004), at a pressure of20 kbar and a temperature range of 600–700 °C, weobtain a P-wave velocity of 7.5±0.1 km s−1 and amantle density value of 3350±30 kg m−3, the error-barsaccounting for compositional variations of eclogite.)
Our findings confirm the results of Henry et al.(1997), which suggest that the extreme altitude of theHimalayas, in a zone between 100 and 200 km north ofthe front, can be explained by the absence of eclogitesbeneath them. Due to the fast subduction rate and therelatively cold temperatures, the eclogitization processis completed further North, at ∼300 km from the MFT(Henry et al., 1997).
4.3. Limitations of this approach: towards a coupledpetrological modelling
The ILC density at depth is estimated by taking intoaccount large-scale observations only. This first-order
235G. Hetényi et al. / Earth and Planetary Science Letters 264 (2007) 226–244
approach, neglecting the presence of local geologicalfeatures, appears to be reasonable. The limited spatialextent and second-order density contrast of thesefeatures contribute to gravity anomalies only withinthe dispersion of the data (tens of mGals).
Also, we neglect here density variations resultingfrom thermal expansion and compressibility. Further-more, the petrological relevance of the gradual densitychange occurring in the ILC, which is inferred fromgeophysical data, has not been evaluated. This evalu-ation requires the modelling of metamorphic transfor-mations, in particular eclogitization at depth. This isonly possible if the pressure and temperature distribu-tions beneath Tibet are accurately established. In thenext section we overcome these limitations and wecombine thermo-kinematic modelling and petrogeneticgrids to evaluate the petrological relevance of thedensity models retrieved above.
5. Integrated geophysical and petrologicalapproach: modelling
The density of the Indian lower crust beneath theTibetan plateau can be determined from the temperaturefield at depth (thermo-kinematic model) and from phaseequilibria calculation (petrological modelling) for agiven lower-crustal composition.
The comparison between the density distributionderived from geophysical data (see above) and that
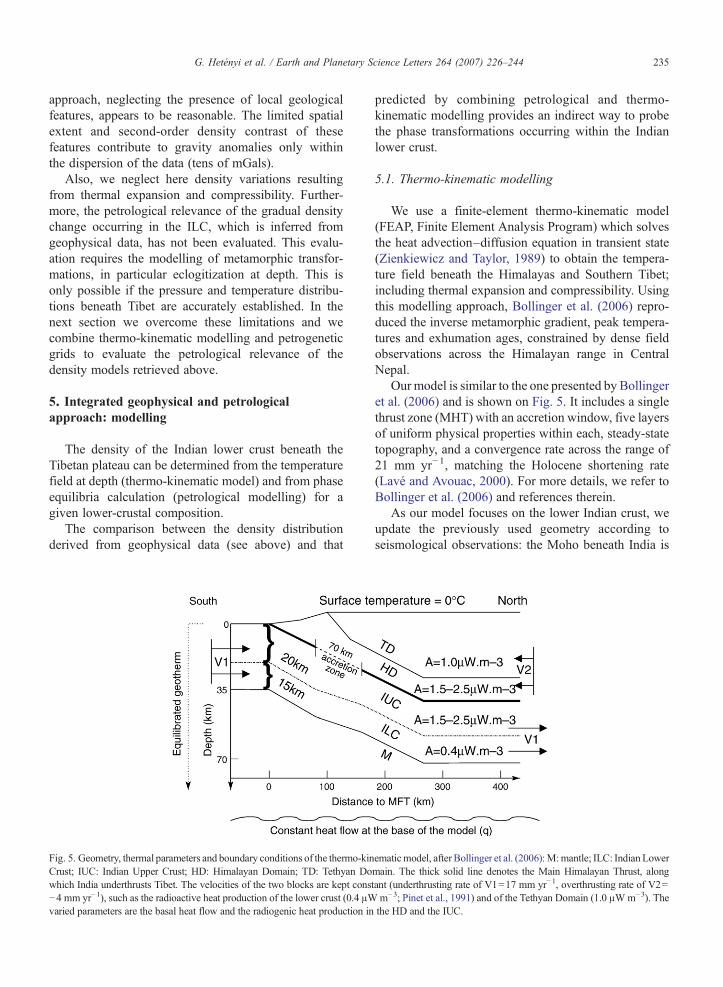
Fig. 5. Geometry, thermal parameters and boundary conditions of the thermo-kinCrust; IUC: Indian Upper Crust; HD: Himalayan Domain; TD: Tethyan Dowhich India underthrusts Tibet. The velocities of the two blocks are kept cons−4 mm yr−1), such as the radioactive heat production of the lower crust (0.4 μWvaried parameters are the basal heat flow and the radiogenic heat production in
predicted by combining petrological and thermo-kinematic modelling provides an indirect way to probethe phase transformations occurring within the Indianlower crust.
5.1. Thermo-kinematic modelling
We use a finite-element thermo-kinematic model(FEAP, Finite Element Analysis Program) which solvesthe heat advection–diffusion equation in transient state(Zienkiewicz and Taylor, 1989) to obtain the tempera-ture field beneath the Himalayas and Southern Tibet;including thermal expansion and compressibility. Usingthis modelling approach, Bollinger et al. (2006) repro-duced the inverse metamorphic gradient, peak tempera-tures and exhumation ages, constrained by dense fieldobservations across the Himalayan range in CentralNepal.
Our model is similar to the one presented by Bollingeret al. (2006) and is shown on Fig. 5. It includes a singlethrust zone (MHT) with an accretion window, five layersof uniform physical properties within each, steady-statetopography, and a convergence rate across the range of21 mm yr−1, matching the Holocene shortening rate(Lavé and Avouac, 2000). For more details, we refer toBollinger et al. (2006) and references therein.
As our model focuses on the lower Indian crust, weupdate the previously used geometry according toseismological observations: the Moho beneath India is
ematicmodel, after Bollinger et al. (2006):M:mantle; ILC: Indian Lowermain. The thick solid line denotes the Main Himalayan Thrust, alongtant (underthrusting rate of V1=17 mm yr−1, overthrusting rate of V2=m−3; Pinet et al., 1991) and of the Tethyan Domain (1.0 μWm−3). Thethe HD and the IUC.

Table 1Petrological model parameters, with composition of the lower crust inweight percent (Rudnick and Fountain, 1995; Rudnick and Gao, 2003)
Model name MW (wet) MD (dry) MPH (1% water)
SiO2 53.961 53.961 53.422Al2O3 17.078 17.078 16.907FeOx 8.660 8.660 8.573MgO 7.316 7.316 7.243CaO 9.691 9.691 9.594Na2O 2.678 2.678 2.651K2O 0.616 0.616 0.610H2O 0.0–5.54 a 0.0 1.0Total 100.00 100.00 100.00Hydration Full None Partiala For the MW model, the H2O component is in excess (i.e. fully
hydrated assumption). This corresponds to a hydration level for theILC (amount of water contained in hydrous minerals) comprisedbetween 0.24 wt.% and 5.11 wt.% H2O depending on the P–Tconditions along the P–T path derived here. The hydration level of theILC before it is underthrust amounts to ca. 3 wt.% H2O.
Table 2Selected solid solutions for petrological modelling, correspondingformulae and thermodynamic references
Phase Formula Source
Biotite K[MgxFeyMn1− x− y]3−wAl1+2wSi3−wO10(OH)2,x+y≤1
Powell andHolland (1999)
Orthopyroxene [MgxFe1− x]2− yAl2ySi2− yO6 Holland andPowell (1996)
Clinopyroxene Na1− yCayMgxyFe(1− x)y
Al1− ySi2O6
Holland andPowell (1996)
Muscovite KxNa1− xMgyFezAl3− 2(y+ z)
Si3+ y+ zO10(OH)2
Holland andPowell (1998)
Clinoamphibole Ca2− 2wNaz+ 2w[MgxFe1− x]3 + 2y+ zAl3− 3y−wSi7+w+ yO22(OH)2,w+y+z≤1
Wei and Powell(2003); Whiteet al. (2003)
Garnet Fe3xCa3yMg3zMn3(1− x− y− z)
Al2Si3O12,x+y+ z≤1Holland andPowell (1998)
Feldspar KyNaxCa1− x− yAl2− x− y
Si2+ x+ yO8,x+y≤1Fuhrman andLindsley (1988)
Talc [MgxFe1− x]3− yAl2ySi4− yO10(OH)2
Sapphirine [MgxFe1− x]4− y / 2
Al9− ySi2− y / 2O20
Holland andPowell (1998)
Spinel MgxFe1− xAl2O4
Chlorite [MgxFewMn1− x−w]5− y+ z
Al2(1 + y− z)Si3− y+ zO10(OH)8,x+w≤1
Holland et al.(1998)
Chloritoid MgxFeyMn1− x− yAl2SiO5(OH)2,x+y≤1
White et al.(2000)
The thermodynamic data used by the Perple_X code are based onHolland and Powell (1998, updated in 2002). The compositionalvariables w, x, y, and z may vary between zero and unity and aredetermined in Perple_X as a function of computational variables byfree-energy minimization.
236 G. Hetényi et al. / Earth and Planetary Science Letters 264 (2007) 226–244
located at 35 km, the lower crust has a constant thicknessof 15 km, and the descent of the plate is continued untilthe Moho reaches a depth of 73 km.
Following previous studies (Henry et al., 1997;Bollinger et al., 2006), we test the effect of two thermalparameters: upper crustal radiogenic heat production A,and basal heat flow of the model q. The latter parameteris varied between 15 mWm−2 (Pinet et al., 1991; Gupta,1993) and 30 mW m−2 (Rao et al., 1976) by steps of2.5 mW m−2. Since the radiogenic heat production ofthe Indian upper crust beneath the Himalayas, of theLesser Himalayas and of the overlying High HimalayanCrystalline are still largely unconstrained, locallyranging between 0.7 and 5 μW m−3 (Menon et al.,2003), we have considered that 1.5 and 2.5 μW m−3
represent mean low and high values in these regions andadopted these end-members for A. These values appear tobe consistent with the few heterogeneous local estimatesof the High Himalayan crystalline radiogenic heatproduction (England et al., 1992). Aside from the aboveparameters, the model follows the one in Bollinger et al.(2006) including the granodioritic composition of theHimalayan and Tethyan domain, as well as of the Indianupper crust. The composition of the Indian lower crust isdiscussed in the following section.
5.2. Petrological modelling
To assess the gravity anomalies produced by a density-distribution based on a thermo-kinematic model, oneneeds to know the dependence of density as a function oftemperature and pressure.
We calculated mineral compositions and modes for anaverage lower crust composition as a function of pressureand temperature using Perple_X (Connolly, 2005). For agiven composition and a set of solution phases, Gibbsenergy is minimized to map the phase relations on thatcomposition. Then, physical properties, such as density,are derived. A high density resolution (in the P–T space)and a high accuracy level can be achieved with thissoftware since mineral compositional variations with Pand Tare taken into account alongwith thermal expansionand compressibility for individual phases. In all cases,density models derived from Perple_X assume thermo-chemical equilibrium at all scales.
We use an average lower-crustal composition based onRudnick andFountain (1995) andRudnick andGao (2003)with eight major oxide components (including water; seeTable 1). The selected solid-solution data and the corre-sponding thermodynamic sources are listed in Table 2.Actually, we have considered three different lower crustcompositions differing only in their water content:

237G. Hetényi et al. / Earth and Planetary Science Letters 264 (2007) 226–244
– MW (Mafic and Wet) is a fully hydrated lower crust.Full hydration means that the water content in MWcorresponds to the minimum water content requiredto stabilize all the hydrous phases (and in the sameproportion) as in a water-saturated system undergreenschist/blueschist facies conditions, i.e. condi-tions at which the Indian lower crust enters theHimalayan subduction. This hydration level isderived from the Perple_X output (5.54 wt.%).
– MD (Mafic and Dry) is a completely dry lower crustwithout any hydrated mineral. We suppose here thatthe Indian Lower Crust experienced granulitic P–Tconditions without being rehydrated before enteringthe Himalayan subduction.
– MPH (Mafic and Partially Hydrated) is a partiallyhydrated lower crust (1 wt.% H2O). This simulates ascenario where the Indian Lower Crust first experiencedamphibolitic conditions (with no subsequent hydrationevent) and then re-equilibrated under greenschist/blueschist conditions prior to underthrusting.
6. Results and discussion: constraints oneclogitization kinetics of the Indian lower crust
For the sake of simplicity, the following sections arestructured in a way that the parameters of the ILC densitymodel based on thermo-kinematic and petrologic con-straints which fits better the geophysical data, called “bestfit model” hereinafter, are presented first. Then thesensitivity of these parameters is discussed in detail, andthe various constraints on the thermo-kinematic andpetrologicmodelling are addressed. Finally, we showhowthis combined approach can provide new constraints onthe eclogitization kinetics of the ILC.
6.1. The best fit model
Fig. 6 shows the best fit model solution of this study.It yields gravity anomalies in very good agreement withmeasurements, leading to a misfit lower than 50 mGal,and in many cases lower than 25 mGal, which corre-sponds to the estimated error of our dataset. This resultclearly confirms the major role of eclogitization in thesupport of Tibet. The density distribution of this modelis obtained by using a temperature field calculated withA=2.5 μW m−3 and q=15 mW m−2, an amphiboliticcrust (MPH model) and a delay in eclogitization, whichprescribes that eclogitization occurs between 300 and350 km north of the MFT rather than between 0 and80 km. Constraints on the above three conditions, to-gether with the path of the Indian lower crust in the P–Tspace, are described in the following sections.
6.2. Petrological constraints on the temperature field
The two criteria used to assess the temperature field ofthe models are the temperature at the Moho (at 35 kmdepth) beneath the Indian shield, TMI, and the temperatureof the eclogitized Indian lower crust beneath Tibet, TET.The obtained values in all tested models for both TMI andTET are shown on Fig. 7 and are discussed below.
The temperature at the Moho varies between 392 and583 °C for the “cold” (A=1.5 μWm−3), and between 472and 660 °C for the “hot” (A=2.5 μW m−3) thermo-kinematic models. This is equivalent to a step of about+12.5 °C for an increase of basal heat flow of 1 mWm−2
at constant A, and to an average difference of 78 °Cbetween “hot” and “cold”models of equal basal heat flow.Our best fit model uses the same thermal parameters asBollinger et al. (2006), and shows a TMI of 472 °C. This isconsistent with previous work by Henry et al. (1997),which favours models with TMI between 417 and 463 °C,and rejects models with TMI of 684 °C, based on heat flowmeasurements in the Indian shield. Putting the acceptablerange of TMI to around 425–525 °C (shaded region inFig. 7a), the basal heat flow is 15±4 mW m−2 for the“hot”, and 21±4 mW m−2 for the “cold” models, or anyequivalent combination in between.
The temperature reached by the underthrust Indianlower crust beneath Tibet provides another constraint. TET(at 350 km) varies between 565 and 753 °C for the “cold”,and 700 and 888 °C for the “hot”models. The temperatureincrease is the same for Δq=+1 mW m−2 as above, butthe average difference between “hot” and “cold” modelsat equal basal heat flow is increased to 135 °C. Examplesfrom Holsnøy Island in the Bergen Arcs complex showthat the solidus is∼700 °C at 16–19 kbar forwet eclogites(Andersen et al., 1991). Experimental studies revealsimilar values: the solidus of wet mafic rocks at 20 kbar isaround 700 °C, and a 1% water-content rock producesabout 10% melt at this temperature (Rushmer, 1991).More recently, Raimbourg et al. (2007) measured anaverage of 718 °C and 20.5 kbar on samples fromHolsnøy Island, without observing any sign of melting.As our model is not fully hydrated, we can expect asolidus slightly above these values (dashed line inFig. 7b). Comparing the obtained values of TET with theabove estimation of the solidus, we eliminate the “hot”models above q=17 mW m−2, the “cold” models above28 mW m−2, or any equivalent combination in between.
In summary, the best fit model with A=2.5 μW m−3
and q=15 mW m−2 is close to the highest allowed tem-perature without melting. This model does not change theupper crustal thermal structure ofBollinger et al. (2006). Ittherefore still satisfies both the thermochronological

Fig. 6. The best fit density-model (graphs as on Fig. 3), based on: i) the thermal field from thermo-kinematic modelling (white contours and value in°C, A=2.5 μWm−3 and q=15 mWm−2); ii) petrogenetic grids corresponding to a mafic lower crust with 1 wt.% water content (Fig. 7); iii) a delay ofeclogitization until 300 km. The arrowmarks the path of the Indian lower crust and the place where transformation into eclogite takes place. See Fig. 7and Section 6 for more details. The densities of the upper crust and the mantle are based on the petrogenetical grids of Bousquet et al. (1997).
238 G. Hetényi et al. / Earth and Planetary Science Letters 264 (2007) 226–244
and peak temperature dataset available through theunderplated Lesser Himalayas and its overlying crystal-line nappes constraining the paleo-location of the 350 °C
Fig. 7. Temperature at the Moho beneath the Indian shield (TMI) and withinbasal heat flow (q) and radiogenic heat production of the upper crust (A). In (ais approximate melting temperature of lowly hydrated mafic rocks.
to 550 °C isotherm under the Himalayas. An uncertaintyat ±50 °C is estimated on these mid-crustal isotherms,deduced from the uncertainty on the thermometrical
the eclogitized Indian lower crust beneath Tibet (TET), as a function of), the shaded region is the acceptable range of TMI. In (b) the dashed line

239G. Hetényi et al. / Earth and Planetary Science Letters 264 (2007) 226–244
(Beyssac et al., 2004) and thermochronological dataset aswell as on the closure temperature for Ar inmuscovite andhornblende (e.g. McDougall and Harrison, 1999). In themeantime, other models with lower radiogenic heatproduction and higher basal heat flow (until A=1.5 μWm−3 and q=21 mW m−2, “cold”) are equivalent andpossible. In term of synthetic gravity anomalies, this set ofsolution reproduces very well the observed differencebetween values in India and Tibet (∼500 mGal); as of thesensitivity of the solution, an increase of 4 mW m−2 in a“cold” model heat flow would lower this difference by∼30 mGal.
6.3. The choice of the petrological model
The most sensitive parameters that differentiate thethree petrological models (MW, MD and MPH) are thehorizontal localization of density increase, and thetemperature of this zone. Based on gravity modelling inSection 4.2, the highest amplitude change in the densityof the lower crust is located at around 300 km north ofthe MFT. On the other hand, the path of the Indian lowercrust in temperature–pressure space (Fig. 8) shows thatthe major increase of density is expected to occur at thetransition to the blueschist facies, close to the front
Fig. 8. Density grid for a mafic composition with 1 wt.% water content. Gresystem. The black contoured circles show the P–T distribution for the best fitfrom South to North. The white lines delineate the position of the ILC at 25mainly through the breakdown of albite into jadeite+quartz, does not releasedensity until it crosses the dehydration line and eclogitizes rapidly. This is alsodensity of the ILC (including the delay). See Section 6.4 for more details.
(between 0 and 100 km horizontal distance), irrespectiveof the level of hydration (dry, partially hydrated, or wet)of the ILC. The temperature of the ILC at around300 km is 150±50 °C higher than the temperature of thezone where the density change is expected to occur fromP–T–ρ grids, and this is true for all thermal models.Such transformation delay clearly shows that thekinetics of the eclogitization process should be consid-ered for the ILC, since it influences considerably itsdensity distribution, and thus the gravity anomaly.
Reaction overstepping by 150±50 °C is unlikely inwater-saturated systems since these could not survive forgeological timescales (Wood and Walther, 1983). Acompletely dry system is also unlikely: examples from theBergen Arc in Norway show that a dry crust subductedinto roots of continental collision zones undergoeseclogitization only if hydrous fluids are available,independently of the crossing of equilibrium boundaries(Austrheim et al., 1997). Similar triggering of eclogitiza-tion in subduction zones is also known, for example inZambia (John and Schenk, 2003). In this context, fluid isthought to infiltrate from the hydrated mantle wedge;however, in our case of underthrusting, there is no similarargument for localized fluid infiltration. These considera-tions lead us to favour petrological model MPH (1 wt.%
y lines show the stability limit of plagioclase and of free water in themodel (Fig. 6) within the Indian Lower Crust during its underthrusting0 and 350 km north of the MFT. As the disappearance of plagioclase,water, it can be delayed (overstepped), and the ILC can keep its initialrepresented by the colours filling the black circles, showing the actual

240 G. Hetényi et al. / Earth and Planetary Science Letters 264 (2007) 226–244
H2O) as the most realistic solution, a model for which freewater is however not available along the whole ILCunderthrusting path. This is in line with Henry et al.(1997), who discuss that, in the case of the PrecambrianIndian crust, whereas the water necessary to form allhydrated minerals in the blueschist facies (∼5% in theMW model) may not be available, a water content ofabout 1% can probably be found.
The gravity anomalies associated to a mafic lowercrust with three different hydration levels (MW, MD andMPH) are shown on Fig. 9a. The primary point here is toreproduce the observed absolute step between the twoendpoints of the profile. The synthetic anomaliescorresponding to the three models actually support thepetrological considerations developed above. A maficlower crust hydrated at 1 wt.% H2O (MPH) reproduceswell the difference of ∼500 mGal between India andTibet, whereas synthetic anomalies obtained by consid-ering either the wet or the dry model are clearly off,situated about 80 mGal above and 60 mGal belowthe data, respectively. However, between ∼50 and∼350 km horizontal distance, the synthetic anomalies ofthe MPH model follow the same gradient as theobservations, but are offset by +100 mGal. This is dueto the fact that the locus of density-change in the ILC iscalculated assuming thermo-chemical equilibrium (i.e.no reaction overstepping).
6.4. Implications for the eclogitization kinetics
Fig. 9b shows three different reaction kinetics for theeclogitization of the ILC (inset), and the corresponding
Fig. 9. (a) The effect of the choice of hydration level on gravity anomalies (wistep in resolving the problem is to reproduce the step of∼500 mGal in Bouguwater-content model reproduces the observed step between India and Tibet, themphasized by the arrows at ∼600 km. (b) The effect of reaction kineticsequilibrium and slowed-down (see inset) models of eclogitization, the calcu400 km. The best fit model is where the eclogitization is delayed to about 3
gravity anomalies. The curve assuming thermochemicalequilibrium, where the change in density occurs fullyand exactly where it is anticipated by the MPHpetrogenetic grid, is reported from Fig. 9a. The low-kinetics case is based on the assumption that theeclogitization process is sluggish: it begins as it isexpected from the petrogenetic grid, but the transfor-mation progresses linearly with distance (thus time)until its completion at 300 km horizontal distance. Wesee that the synthetic gravity anomalies still fail tofollow the observed data. Finally, the best fit model (seealso Fig. 6) is where the eclogitization process is delayed(overstepped) until 300 km and then occurs within50 km. The synthetic anomaly fits very well to theobserved one, included the gravity-low at ∼300 km. Itshould be noted that other types of density evolutionscan also fit the observations, provided that the transitionproceeds in the 250–350 km interval and that it ismonotonous. We also note that density variations due tocompressibility and thermal expansion partially cancelout in the descending part of the ILC, thus the remainingeffect, being less than 10% of the density change relatedto eclogitization, is neglected.
Fig. 8 summarizes the non-gravimetric constraints ofour models. It shows the petrogenetic grid of the MPHmodel, with two lines enhanced in grey: the limit ofstability of plagioclase and of free water in the system(dehydration line), respectively. The circles show thepath of the underthrusting Indian lower crust in the P–Tfield with the colours corresponding to its density. Weclaim that, along this path, the conversion of the plagio-clase component into garnet and/or clinopyroxene,
th thermal parameters of A=2.5 μWm−3 and q=15 mWm−2). The firster anomalies between the two endpoints of the profile. While the 1 wt.%e wet model falls short of it, and the dry model step is too large, as it ison gravity anomalies, using the 1 wt.% water-content model. For thelated anomalies are clearly different from observations between 0 and00 km (see inset, as well as Figs. 6 and 8).
241G. Hetényi et al. / Earth and Planetary Science Letters 264 (2007) 226–244
which does not release water, is kinetically hindered.The density change predicted by the petrogenetic grid(equilibrium conditions) does not actually occur. Lateron, when the P–T conditions of this metastable lowercrust reach the dehydration line, free water is producedwhich catalyses the metamorphic reactions (water isprovided under these conditions by amphibole andepidote breakdown). Eclogitization occurs then rela-tively quickly due to the large temperature overstep(150±50 °C), and density reaches its maximum value(equilibrium assemblage).
We highlighted the position of the Indian lower crustat 250 and 350 km, which encompass the dehydrationline in this pressure range (Fig. 8). On the one hand, theyare the limits of the zone until which eclogitization isdelayed, and also inside which we cannot distinguishbetween different densification models on the basis ofgravity. On the other hand, this ±50 km zone corre-sponds to an uncertainty of ±50 °C in temperature,which is similar to the temperature constraints obtainedwhen assessing the thermal field (the ±4 mW m2
corresponding to ±50 °C). Thus, even if a smaller trade-off is possible between eclogitization localization andthe thermal structure, it is realistic to consider the twowhite lines as a lower and upper bound to the tem-perature field, and to assume that the key factor in theeclogitization process is the release of free water in thesystem.
We consider that the geometry used in the thermo-kinematic model is within the error-bars of profile P2,and the obtained results are roughly valid for this profile.The main difference in the geometry of profile P2compared to profile P1 is a steeper descent of the lowercrust to its maximal depth (Fig. 4b). On the same figure,we reported the relocated microseismicity data ofMonsalve et al. (2006). A clear cluster of events isvisible between 140 and 200 km North of the MFT andat a depth of ∼60–80 km. This zone of microseismicityis located where the ILC reaches its maximum depth,i.e. where eclogitization is catalyzed due to waterrelease by dehydration reactions. The observed micro-seismicity is therefore an additional argument for therelease of free water in the eclogitization zone of theILC; the liberated water increases pore pressure andcauses failure at previously stable stress conditions.
Concerning profile P3, we have followed the samemodelling steps with a more accurate geometry. Thecalculations are less well constrained as gravity anomalydata show more dispersion in the region of interest(between 100 and 400 km), but our results show that adelay of ∼200 km is probable, followed by a transitionzone of kinetics that is longer than in the best fit model.
7. Conclusions
This study brings new constraints on metamorphicreaction overstepping and kinetics at field scale frompetrological models, gravity anomalies and seismo-logical data at the southern border of the TibetanPlateau.
We compile both seismological and Bouguer anom-aly data along three arc-perpendicular profiles. Forwardgravity modelling based on the observed geometries andvaried densities show that Airy-type isostatic compen-sation is unlikely to occur, as it yields unrealistic den-sities. This suggests that higher density eclogites arerequired to support the Tibetan Plateau. Multilayermodels show that Indian lower crust eclogitization iscompleted once the ILC reaches its maximal depth.
In order to interpret these geophysical data in a pet-rological frame:
(i) we performed thermo-kinematic modelling toobtain the temperature field in the area;
(ii) we calculated realistic petrogenetic (pressure–temperature–density) grids;
(iii) we tested wet, dry, and partially hydrated maficlower-crustal composition models.
This led us to probe different types of reactionkinetics for the eclogitization of the ILC.
The Indian lower crust follows a blueschist–eclogitepath in the temperature–pressure space. The deriveddensity profiles were used for forward modelling ofBouguer anomalies. Comparison of the differentmodels shows that at least a small amount of watershould be contained in the ILC prior to underthrusting,and that the plagioclase-consuming reactions (no waterrelease) are overstepped, and therefore densification isdelayed. This delay lasts until the attainment of thedehydration reactions where eclogitization will occurin less than 100 km horizontal distance. Consideringthe underthrusting rate (17 mm yr−1), the eclogitiza-tion occurs quickly (less than 6 My). Even whenconsidering the uncertainties of the localization ofeclogitization and of the temperature field, the appear-ance of free water in the system remains the key factorin the eclogitization process. The partial eclogitizationof mafic compositions (gabbroic rocks from Zambia)along a blueschist–eclogite path has already beendocumented by John and Schenk (2003). They alsoreach the conclusions that large overstepping of reac-tion boundaries has occurred and that the gabbro-eclogite transformation was triggered by the presenceof a free fluid-phase.
242 G. Hetényi et al. / Earth and Planetary Science Letters 264 (2007) 226–244
The derivation ofmineral reaction kinetics is one of thechallenges of metamorphic petrology. Even though reac-tion progress can be evaluated, reaction duration is diffi-cult to assess from field-based observations. All attemptsthat have been made to derive reaction rates in metamor-phic systems (e.g. Baxter and DePaolo, 2000; Carlsonet al., 1995; Vance and O'Nions, 1992; Christensen et al.,1989) show that reaction kinetics in nature are lower, byseveral orders of magnitude, than those obtained exper-imentally (see Baxter, 2003 for a review). Baxter (2003)suggests that water availability during metamorphism canaccount for this discrepancy. For example, Rubie (1986)has proposed that at deep crustal levels, fluid-presentconditions could be transitory and related to relativelyshort dehydration events. This is in line with the inter-pretation of our gravity dataset in the frame of phaseequilibria which strongly suggests that the water releasedby mineral dehydration can trigger eclogitization reac-tions. This result emphasizes how the sluggishness ofnucleation kinetics can be a source of disequilibriumduring metamorphism as already pointed out by Rubie(1998). Our new type of time-resolved constraint on theeclogitization process, which suggests that crystallization(nucleation and growth) of the stable mineral assemblagecan be delayed by at least 100 °C under free-fluid absentconditions, clearly prompts the investigation of the role ofwater on mineral nucleation kinetics.
Acknowledgements
The authors would like to thank all parties that havehelped to complete the geophysical datasets in thisstudy. Many thanks to Gaspar Monsalve for providingthe HIMNT microseismicity data. The paper greatlybenefited from discussions with Christian Chopin onpetrology, metamorphic facies and reaction kinetics;with Julia de Sigoyer on petrology and crustal com-position; and with Marie-Pierre Doin on modelling. Weacknowledge Christian Chopin for the thorough reviewof the manuscript, two anonymous reviewers for theircomments that have helped to clarify our modellingchoices, as well as the Editor Claude Jaupart for hissuggestions and help. Petrogenetic calculations wereperformed using the Perple_X code (www.perplex.ethz.ch; Connolly, 2005). Finite-element computations wereperformed using the FEAP program, developed by R.Taylor at the University of California at Berkeley (http://www.ce.berkeley.edu/rlt/feap/). Figs. 1, 3, 4, 6 and 7were prepared by the GMTsoftware package (Wessel andSmith, 1991). We thank the French DYETI programmefor support. Project Hi-CLIMB is supported by the U.S.NSF Continental Dynamics Program, EAR 9909609.
References
Airy, G.B., 1855. On the computation of the effect of the attraction ofmountain-masses, as disturbing the apparent astronomical latitudeof stations in geodetic surveys. Phil. Trans. Roy. Soc. Lond. 145,101–104.
Andersen, T., Austrheim, H., Burke, E.A.J., 1991. Mineral fluid meltinteractions in high-pressure shear zones in the Bergen Arcs nappecomplex, Caledonides of Norway — implications for the fluidregime in Caledonian eclogite-facies metamorphism. Lithos 27 (3),187–204.
Austrheim, H., Erambert, M., Engvik, A.K., 1997. Processing of crustin the root of the Caledonidan continental collision zone: the roleof eclogitization. Tectonophysics 273, 129–153.
Avouac, J.-P., 2003. Mountain building, erosion, and the seismic cyclein the Nepal Himalaya. Adv. Geophys. 46, 1–80. doi:10.1016/S0065-2687(03)46001-9.
Barazangi, M., Ni, J., 1982. Velocities and propagation characteristicsof Pn and Sn beneath the Himalayan arc and Tibetan Plateau:possible evidence for underthrusting of Indian continentallithosphere beneath Tibet. Geology 10, 179–185.
Baxter, E.F., 2003. Natural constraints on metamorphic reactions rates.In: Vance, D., Müller, W., Villa, I.M. (Eds.), Geochronology,Linking the Isotopic Record with Petrology and Textures. Geol.Soc., London, Spec. Publ., vol. 220, pp. 183–202.
Baxter, E.F., DePaolo, D.J., 2000. Field measurement of slowmetamorphic reaction rates at temperatures of 500° to 600 °C.Science 288, 1411–1414.
Bettinelli, P., Avouac, J.-P., Flouzat, M., Jouanne, F., Bollinger, L.,Willis, P., Chitrakar, G.R., 2006. Plate motion of India andinterseismic strain in the Nepal Himalaya from GPS and Dorismeasurements. J. Geod. 80, 567–589.
Beyssac, O., Bollinger, L., Avouac, J.-P., Goffé, B., 2004. Thermalmetamorphism in the Lesser Himalaya of Nepal determined fromRaman spectroscopy of carbonaceous material. Earth Planet. Sci.Lett. 225, 233–241.
Bollinger, L., Avouac, J.-P., Beyssac, O., Catlos, E.J., Harrison, T.M.,Grove, M., Goffé, B., Sapkota, S., 2004. Thermal structure andexhumation history of the Lesser Himalaya in central Nepal.Tectonics 23, TC5015. doi:10.1029/2003TC001564.
Bollinger, L., Henry, P., Avouac, J.-P., 2006. Mountain building in theNepal Himalaya: thermal and kinematic model. Earth Planet. Sci.Lett. 244, 58–71.
Bousquet, R., Goffé, B., Henry, P., Le Pichon, X., Chopin, C., 1997.Kinematic, thermal and petrological model of the Central Alps:lepontine metamorphism in the upper crust and eclogitisation ofthe lower crust. Tectonophysics 273, 105–127.
Carlson, W.D., Denison, C., Ketcham, R.A., 1995. Controls on thenucleation and growth of porphyroblasts: kinetics from naturaltextures and numerical models. Geol. J. 30, 207–225.
Cattin, R., Avouac, J.-P., 2000. Modeling mountain building and theseismic cycle in the Himalaya of Nepal. J. Geophys. Res. 105,13389–13407.
Cattin,R.,Martelet,G.,Henry, P.,Avouac, J.-P.,Diament,M., Shakya, T.R.,2001. Gravity anomalies, crustal structure and thermomechanical sup-port of the Himalaya of Central Nepal. Geophys. J. Int. 147, 381–392.
Christensen, N., Mooney, W., 1995. Seismic velocity structure andcomposition of the continental crust; a global view. J. Geophys Res.100, 9761–9788.
Christensen, J.N., Rosenfeld, J.L., DePaolo, D.J., 1989. Rates oftectonometamorphic processes from rubidium and strontiumisotopes in garnet. Science 244, 1465–1469.

243G. Hetényi et al. / Earth and Planetary Science Letters 264 (2007) 226–244
Connolly, J.A.D., 2005. Computation of phase equilibria by linearprogramming: a tool for geodynamic modeling and its application tosubduction zone decarbonation. Earth Planet. Sci. Lett. 236,524–541.
England, P., Le Fort, P., Molnar, P., Pêcher, A., 1992. Heat sources orTertiary metamorphism and anatexis in the Annapurna-Manasluregion (Central Nepal). J. Geophys. Res. 97, 2107–2128.
Fuhrman, M.L., Lindsley, D.H., 1988. Ternary-feldspar modeling andthermometry. Am. Mineral. 73, 201–215.
Guéguen, Y., Palciauskas, V., 1992. Introduction à la physique desroches. In: Hermann (Ed.), des sciences et des arts, Paris. 299 pp.
Gupta, M.L., 1993. Is the Indian shield hotter than other Gondwanashields? Earth planet. Sci. Lett. 115, 275–285.
Hacker, B.R., Abers, G.A., 2004. Subduction factory 3: an excelworksheet and a macro for calculating the densities, seismic wavespeeds, and H2O content of minerals and rocks at pressure andtemperature. Geochem.Geophys. Geosys. 5 (1), Q01005. doi:10.1029/2003GC000614.
Hauck, M.L., Nelson, K.D., Brown, L.D., Zhao, W., Ross, A.R., 1998.Crustal structure of the Himalayan orogen at∼90° east longitude fromProject INDETPH deep reflection profiles. Tectonics 17 (4), 481–500.
Henry, P., Le Pichon, X., Goffé, B., 1997. Kinematic, thermal andpetrological model of the Himalayas: constraints related to meta-morphismwithin the underthrust Indian crust. Tectonophysics 273,31–56.
Hetényi, G., Cattin, R., Vergne, J., Nábělek, J.L., 2006. The effectiveelastic thickness of the India Plate from receiver function imaging,gravity anomalies and thermomechanical modelling. Geophys. J.Int. 167, 1106–1118.
Holland, T., Powell, R., 1996. Thermodynamics of order-disorder inminerals. 2. Symmetric formalism applied to solid solutions. Am.Mineral. 81, 1425–1437.
Holland, T.J.B., Powell, R., 1998. An internally consistent thermody-namic data set for phases of petrological interest. J. Metamorph.Geol. 16, 309–343.
Holland, T., Baker, J., Powell, R., 1998. Mixing properties andactivity-composition relationships of chlorites in the systemMgO–FeO–Al2O3–SiO2–H2O. Eur. J. Mineral. 10, 395–406.
Jackson, M., Bilham, R., 1994. Constraints on Himalaya deformationinferred from vertical velocity fields in Nepal and Tibet. J. Geophys.Res. 99, 13897–13912.
Jin, Y., McNutt, M.K., Zhu, Y.S., 1996. Mapping the descent of theIndian and Eurasian plates beneath the Tibetan Plateau fromgravity anomalies. J. Geophys. Res. 101, 11275–11290.
John, T., Schenk, V., 2003. Partial eclogitisation of gabbroic rocks in a latePrecambrian subduction zone (Zambia): prograde metamorphismtriggered by fluid infiltration. Contrib.Mineral. Petrol. 146, 174–191.
Jull, M., Kelemen, P.B., 2001. On the conditions for lower crustalconvective instability. J. Geophys. Res. 106, 6423–6446.
Kind, R., Ni, J., Zhao, W., Wu, J., Yuan, X., Zhao, L., Sandvol, E.,Reese, C., Nabelek, J., Hearn, T., 1996. Evidence from earthquakedata for a partially molten crustal layer in Southern Tibet. Science274, 1692–1694.
Kind, R., Yuan, X., Saul, J., Nelson, D., Sobolev, S.V., Mechie, J.,Zhao, W., Kosarev, G., Ni, J., Achauer, U., Jiang, M., 2002.Seismic images of crust and upper mantle beneath Tibet: evidencefor Eurasian plate subduction. Science 298, 1219–1221.
Lavé, J., Avouac, J.-P., 2000. Active folding of fluvial terraces acrossthe Siwaliks Hills. J. Geophys. Res. 105, 5735–5770.
Le Fort, P., 1986. Metamorphism and magmatism during theHimalayan collision. Collision TectonicsGeol. Soc. Spec. Publ.,vol. 19, pp. 159–172.
Le Pichon, X., Henry, P., Goffé, B., 1997. Uplift of Tibet: fromeclogites to granulites. Tectonophysics 273, 57–76.
Ligorría, J., Ammon, C.J., 1999. Iterative deconvolution and receiver-function estimation. Bull. Seism. Soc. Am. 89 (5), 1395–1400.
Lyon-Caen, H., Molnar, P., 1983. Constraints on the structure of theHimalaya from an analysis of gravity anomalies and a flexuralmodel of the lithosphere. J. Geophys. Res. 88 (B10), 8171–8191.
Martelet, G., Sailhac, P., Moreau, F., Diament, M., 2001. Character-ization of geological boundaries using 1-D wavelet transform ongravity data: theory and application to the Himalayas. Geophysics66 (4), 1116–1129.
McDougall, I., Harrison, T.M., 1999. Geochronology and Thermo-chronology by the 40Ar/39Ar Method. Oxford Univ. Press, NewYork. 269 pp.
Menon, R., Kumar, P.S., Reddy, G.K., Srinivasan, R., 2003.Radiogenic heat production of Late Archaean Bundelkhand graniteand some Proterozoic gneisses and granitoids of central India.Curr. Sci. 85, 634–638.
Monsalve, G., Sheehan, A., Schulte-Pelkum,V., Rajaure, S., Pandey,M.R.,Wu, F., 2006. Seismicity and one-dimensional velocity-structure of theHimalayan collision zone: earthquakes in the crust an upper mantle.J. Geophys. Res. 111, B10301. doi:10.1029/2005JB004062.
Nábělek, J.L., Vergne, J., Hetényi, G., 2005. Project Hi-CLIMB: asynoptic view of the Himalayan collision zone and Southern Tibet.EoS Trans. AGU 86 (52) Fall Meet. Suppl., Abstract T52A-02.
Nelson, K.D., et al., 1996. Partially molten middle crust beneathSouthern Tibet: synthesis of project INDEPTH results. Science274, 1684–1688.
Ni, J., Barazangi, M., 1983. High-frequency seismic wave propagationbeneath the Indian Shield, Himalayan Arc, Tibetan Plateau andsurrounding regions: high uppermost mantle velocities andefficient Sn propagation beneath Tibet. Geophys. J. R. Astron.Soc. 72, 665–689.
Owens, T.J., Zandt, G., 1997. Implications of crustal propertyvariations for models of Tibetan plateau evolution. Nature 387,37–43.
Patriat, P., Achache, J., 1984. India–Eurasia collision chronology hasimplications for shortening and driving mechanism of plates.Nature 311, 615–621.
Pinet, C., Jaupart, C., Mareschal, J.-C., Gariepy, C., Bienfait, G.,Lapointe, R., 1991. Heat flow and structure of the lithosphere inthe eastern Canadian shield. J. Geophys. Res. 96, 19941–19963.
Powell, R., Holland, T., 1999. Relating formulations of thethermodynamics of mineral solid solutions: activity modeling ofpyroxenes, amphiboles, and micas. Am. Mineral. 84, 1–14.
Raimbourg, H., Goffé, B., Jolivet, L., 2007. Garnet reequilibration andgrowth in the eclogite facies and geodynamical evolution nearpeak metamorphic conditions. Contrib. Mineral. Petrol. 153, 1–28.doi:10.1007/s00410-006-0130-3.
Rao, R.U.M., Rao, G.V., Narain, H., 1976. Radioactive heat generationand heat flow in the Indian shield. Earth Planet. Sci. Lett. 30, 57–64.
Rodriguez, E., Morris, C.S., Belz, J.E., Chapin, E.C., Martin, J.M.,Daffer, W., Hensley, S., 2005. An assessment of the SRTMtopographic products. Technical Report JPL D-31639. JetPropulsion Laboratory, Pasadena, California. 143 pp.
Rubie, D.C., 1986. The catalysis of mineral reactions by water andrestrictions on the presence of aqueous fluid during metamor-phism. Mineral. Mag. 50, 399–415.
Rubie, D.C., 1998. Disequilibrium during metamorphism: the role ofnucleation kinetics. In: Treloar, P.J., O, P., Brien (Eds.), WhatDrives Metamorphism and Metamorphic Reactions? Geol. Soc.,London, Spec. Publ., vol. 138, pp. 199–214.

244 G. Hetényi et al. / Earth and Planetary Science Letters 264 (2007) 226–244
Rudnick, R.L., Fountain, D.M., 1995. Nature and composition of thecontinental crust— a lower crustal perspective. Rev.Geophys. 33 (3),267–309.
Rudnick, R.L., Gao, S., 2003. The composition of the continentalcrust, in: Holland, H.D., Turekian, K.K. (Eds.) Treatise onGeochemistry, Vol. 3; The Crust (Ed. Rudnick, R.L.) pp. 1–64,Elsevier-Pergamon, Oxford.
Rushmer, T., 1991. Partial melting of two amphibolites: contrastingexperimental results under fluid-absent conditions. Contrib.Mineral. Petrol. 107, 41–59.
Saul, J., Kumar, M.R., Sarkar, D., 2000. Lithospheric and upper mantlestructure of the Indian Shield, from teleseismic receiver functions.Geophys. Res. Lett. 27 (16), 2356–2360.
Schulte-Pelkum, V., Monsalve, G., Sheehan, A., Pandey, M.R.,Sapkota, S., Bilham, R., Wu, F., 2005. Imaging the Indiansubcontinent beneath the Himalaya. Nature 435, 1222–1225.
Sun, W., 1989. Bouguer Gravity Anomaly Map of the People'sRepublic of China. Chin. Acad. Geoexploration, Beijing.
Szafián, P., Horváth, F., 2006. Crustal structure in the Carpatho–Pannonian region: insights from three-dimensional gravity mod-elling and their geodynamic significance. Int. J. Earth Sci. 95,50–67.
Talwani, M., Worzel, J.I., Landisman, M., 1959. Rapid gravitycomputations for two-dimensional bodies with application tothe Mendocino submarine fracture zone. J. Geophys. Res. 64,46–59.
Tiwari, V.M., Vyghreswara, R., Mishra, D.C., Singh, B., 2006. Crustalstructure across Sikkim, NE Himalaya from new gravity andmagnetic data. Earth Planet. Sci. Lett. 247, 61–69.
Turcotte, D.L., Schubert, G., 1982. Geodynamics, Application ofContinuum Physics to Geological Problems. John Wiley & Sons,New York. 450 pp.
Vance, D., O, Nions, R.K., 1992. Prograde and retrograde thermalhistories from the central Swiss Alps. Earth Planet. Sci. Lett. 114,113–129.
Vergne, J., Nábĕlek, J.L., Hi-CLIMB Team, 2005. Geometry andcharacteristics of the Main Himalayan Thrust in Nepal/Tibetrevealed by the Hi-CLIMB seismological experiment. Eos Trans.AGU 86 (52) Fall Meet. Suppl., Abstract T52A-03.
Wei, C.J., Powell, R., 2003. Phase relations in high-pressuremetapelites in the system KFMASH (K2O-FeO-MgO-Al2O3-SiO2-H2O) with application to natural rocks. Contrib. Mineral.Petrol. 145, 301–315.
Wessel, P., Smith, W.H.F., 1991. Free software helps map and displaydata. EoS Trans. AGU, 72, pp. 441 and 445–446.
White, R.W., Powell, R., Holland, T.J.B., Worley, B.A., 2000. Theeffect of TiO2 and Fe2O3 on metapelitic assemblages at greenschistand amphibolite facies conditions: mineral equilibria calculationsin the system K2O–FeO–MgO–Al2O3–SiO2–H2O–TiO2–Fe2O3.J. Metamorph. Geol. 18, 497–511.
White, R.W., Powell, R., Phillips, G.N., 2003. A mineral equilibriastudy of the hydrothermal alteration in mafic greenschist faciesrocks at Kalgoorlie, Western Australia. J. Metamorph. Geol. 21,455–468.
Won, I.J., Bevis, M., 1987. Computing the gravitational and magneticanomalies due to a polygon: algorithms and Fortran subroutines.Geophysics 52 (2), 232–238.
Wood, B.J., Walther, J.W., 1983. Rates of hydrothermal reactions.Science 222, 413–415. doi:10.1126/science.222.4622.413.
Zhao, W., Nelson, K.D., Project INDEPTH Team, 1993. Deep seismic-reflection evidence continental underthrusting beneath SouthernTibet. Nature 366, 557–559.
Zhu, L., 2000. Crustal structure across the San Andreas Fault,Southern California from teleseismic converted waves. EarthPlanet. Sci. Lett. 179, 183–190.
Zhu, L., Kanamori, H., 2000. Moho depth variation in SouthernCalifornia from teleseismic receiver functions. J. Geophys. Res.105, 2969–2980.
Zienkiewicz, O.C., Taylor, R.L., 1989. The Finite Element Method.McGraw-Hill, New York.
Related Documents