2018-01-0161 Published 03 Apr 2018 This material is declared a work of the U.S. Government and is not subject to copyright protection in the United States. INTERNATIONAL. Predictive GT-Power Simulation for VNT Matching on a 1.6 L Turbocharged GDI Engine Dennis Robertson, Graham Conway, and Chris Chadwell Southwest Research Institute Joseph McDonald, Daniel Barba, and Mark Stuhldreher US Environmental Protection Agency Aaron Birckett Honeywell Transportation Systems Citation: Robertson, D., Conway, G., Chadwell, C., McDonald, J. et al., “Predictive GT-Power Simulation for VNT Matching on a 1.6 L Turbocharged GDI Engine,” SAE Technical Paper 2018-01-0161, 2018, doi:10.4271/2018-01-0161. Abstract (GDI) engine [1]. Te model was tuned so that it predicted T he thermal efciency benefts of low-pressure (LP) burn-rates and end-gas knock over an engine operating map exhaust gas recirculation (EGR) in spark-ignition with varying speeds, loads, EGR rates and fuel types. Using engine combustion are well known. One of the greatest the model, an assessment of VNT performance was performed barriers facing adoption of LP-EGR for high power-density using compressor and turbine maps made available from applications is the challenge of boosting. Variable nozzle Honeywell Transportation Systems. Results show that the turbines (VNTs) have recently been developed for gasoline single VNT device supports LP-EGR across the operating map applications operating at high exhaust gas temperatures while maintaining realistic full-load performance and main- (EGTs). Te use of a single VNT as a boost device may provide taining or improving upon thermal efciency compared to a a lower-cost option compared to two-stage boosting systems twin-scroll turbocharger. Tis work was done as part of the or 48 V electronic boost devices for some LP-EGR applica- Environmental Protection Agency’s continuing assessment tions. A predictive model was created based on engine testing of advanced light-duty automotive technologies to support results from a 1.6 L turbocharged gasoline direct injection setting appropriate national greenhouse gas standards. Introduction B y 2025, the automotive industry must reduce CO2 emissions by at least 30% and criteria pollutant emis- sions for vehicles sold in the U.S. by a factor of three [2]. To achieve these emissions standards, advanced engine combustion strategies are being pursued. One promising strategy is the use of cooled exhaust gas recirculation (EGR) [3, 4, 5, 6]. Cooled EGR leads to higher thermal efciencies through a reduction in heat transfer losses. Cooled EGR is also well known to improve knock resistance, enabling either higher compression ratios or increased specifc torque with optimal combustion phasing. Additionally, cooled EGR ofers benefts relative to specifc heat by displacing the diatomic air mole- cules with triatomic molecules recirculated from the exhaust. Te increase in heat capacity reduces combustion tempera- tures, leading to lower NO X and CO emissions [7]. Finally, pumping losses decrease with the use of cooled EGR by reducing the volumetric efciency of the engine and requiring higher manifold pressure for a given load. However, greater use of cooled EGR introduces a chal- lenge in the sizing of traditional turbochargers. Te turbine in a traditional single-stage turbocharger is size-compromised to achieve the low-speed, high-load target as well as a high enough fow capacity for minimized turbine inlet pressure at the rated power condition. Te two performance targets require a design trade-of between low- and high-speed torque performance, resulting in a less than optimum turbine size for either condition. Variable nozzle turbines (VNTs) have the beneft of being able to adjust their turbine geometry to allow an efectively smaller turbine diameter at low speed (to achieve low-end torque) and an efectively larger turbine diameter at high speed (to achieve lower back pressure and high-power perfor- mance) [8, 9]. An added beneft of reduced exhaust back pressure at high engine loads is that it avoids the need for a wastegate. Tis reduction in exhaust backpressure is benefcial as it lowers the scavenging pressure ratio, which reduces the residual content in-cylinder and allows earlier combustion phasing and improved engine efciency [10]. Previous studies have shown the success of VNT with Miller operation. Tis paper identifes the potential of VNT to operate under dilute conditions, specifcally EGR dilution. Te purpose of this work was to develop an engine model using Gamma Technologies’ GT-Power sofware (Gamma Technologies, LLC., Westmont, IL) with a predictive combus- tion mechanism. Tis model assessed the performance of a VNT’s ability to support low pressure LP-EGR across the engine operating map and its impact on thermal efciency with varying EGR rates and fuel types. To accurately model

Welcome message from author
This document is posted to help you gain knowledge. Please leave a comment to let me know what you think about it! Share it to your friends and learn new things together.
Transcript

2018-01-0161 Published 03 Apr 2018
This material is declared a work of the U.S. Government and is not subject to copyright protection in the United States.
INTERNATIONAL.
Predictive GT-Power Simulation for VNT Matching on a 1.6 L Turbocharged GDI Engine Dennis Robertson, Graham Conway, and Chris Chadwell Southwest Research Institute
Joseph McDonald, Daniel Barba, and Mark Stuhldreher US Environmental Protection Agency
Aaron Birckett Honeywell Transportation Systems
Citation: Robertson, D., Conway, G., Chadwell, C., McDonald, J. et al., “Predictive GT-Power Simulation for VNT Matching on a 1.6 L Turbocharged GDI Engine,” SAE Technical Paper 2018-01-0161, 2018, doi:10.4271/2018-01-0161.
Abstract (GDI) engine [1]. Te model was tuned so that it predicted
The thermal efciency benefts of low-pressure (LP) burn-rates and end-gas knock over an engine operating map exhaust gas recirculation (EGR) in spark-ignition with varying speeds, loads, EGR rates and fuel types. Using engine combustion are well known. One of the greatest the model, an assessment of VNT performance was performed
barriers facing adoption of LP-EGR for high power-density using compressor and turbine maps made available from applications is the challenge of boosting. Variable nozzle Honeywell Transportation Systems. Results show that the turbines (VNTs) have recently been developed for gasoline single VNT device supports LP-EGR across the operating map applications operating at high exhaust gas temperatures while maintaining realistic full-load performance and main-(EGTs). Te use of a single VNT as a boost device may provide taining or improving upon thermal efciency compared to a a lower-cost option compared to two-stage boosting systems twin-scroll turbocharger. Tis work was done as part of the or 48 V electronic boost devices for some LP-EGR applica- Environmental Protection Agency’s continuing assessment tions. A predictive model was created based on engine testing of advanced light-duty automotive technologies to support results from a 1.6 L turbocharged gasoline direct injection setting appropriate national greenhouse gas standards.
Introduction
By 2025, the automotive industry must reduce CO2 emissions by at least 30% and criteria pollutant emis-sions for vehicles sold in the U.S. by a factor of three
[2]. To achieve these emissions standards, advanced engine combustion strategies are being pursued. One promising strategy is the use of cooled exhaust gas recirculation (EGR) [3, 4, 5, 6].
Cooled EGR leads to higher thermal efciencies through a reduction in heat transfer losses. Cooled EGR is also well known to improve knock resistance, enabling either higher compression ratios or increased specifc torque with optimal combustion phasing. Additionally, cooled EGR ofers benefts relative to specifc heat by displacing the diatomic air mole-cules with triatomic molecules recirculated from the exhaust. Te increase in heat capacity reduces combustion tempera-tures, leading to lower NOX and CO emissions [7]. Finally, pumping losses decrease with the use of cooled EGR by reducing the volumetric efciency of the engine and requiring higher manifold pressure for a given load.
However, greater use of cooled EGR introduces a chal-lenge in the sizing of traditional turbochargers. Te turbine in a traditional single-stage turbocharger is size-compromised to achieve the low-speed, high-load target as well as a high enough fow capacity for minimized turbine inlet pressure at
the rated power condition. Te two performance targets require a design trade-of between low- and high-speed torque performance, resulting in a less than optimum turbine size for either condition.
Variable nozzle turbines (VNTs) have the beneft of being able to adjust their turbine geometry to allow an efectively smaller turbine diameter at low speed (to achieve low-end torque) and an efectively larger turbine diameter at high speed (to achieve lower back pressure and high-power perfor-mance) [8, 9]. An added beneft of reduced exhaust back pressure at high engine loads is that it avoids the need for a wastegate. Tis reduction in exhaust backpressure is benefcial as it lowers the scavenging pressure ratio, which reduces the residual content in-cylinder and allows earlier combustion phasing and improved engine efciency [10]. Previous studies have shown the success of VNT with Miller operation. Tis paper identifes the potential of VNT to operate under dilute conditions, specifcally EGR dilution.
Te purpose of this work was to develop an engine model using Gamma Technologies’ GT-Power sofware (Gamma Technologies, LLC., Westmont, IL) with a predictive combus-tion mechanism. Tis model assessed the performance of a VNT’s ability to support low pressure LP-EGR across the engine operating map and its impact on thermal efciency with varying EGR rates and fuel types. To accurately model

2 PREDICTIVE GT-PowER SIMULATIoN foR VNT MATChING oN A 1.6 L TURboChARGED GDI ENGINE
This material is declared a work of the U.S. Government and is not subject to copyright protection in the United States.
_L ________ _ -
Roots Supercharger
F,..h Air
FIGURE 1 EP6CDTx engine. FIGURE 2 Engine confguration as found in test-cell and as
US
Gov
ernm
ent
/ U
S En
viro
nmen
tal P
rote
ctio
n A
genc
y
TABLE 1 PSA EP6CDTx Specifcations.
modelled within GT-Power. boost is provided via stock, twin-scroll turbocharger and added positive displacement supercharger. The EGR valve is placed post-EGR cooler downstream of the turbine.
US
Gov
ernm
ent
/ U
S En
viro
nmen
tal P
rote
ctio
n A
genc
y
Figure 2. While electrical power consumed by the super-charger electric motor was not included in the analysis, its operation and expected backpressure were included. Te exhaust manifold pressure was increased to match the intake manifold pressure to simulate a turbocharger capable of meeting the boost pressure requirement. For all simulated
Displacement
bore
Stroke
CR
Turbocharger
E-boost
1.6 L
77 mm
85.8 mm
10.5:1
original equipment twin-scroll or VNT
boost cart with supercharger used. A schematic of the test cell setup can be found in Valve train Intake and Exhaust Cam Phaser
Intake Valvetronic (Continuous VVL)
Injection system Side-mounted GDI
Rated Power 120 kw @ 5000 rpm
Rated Torque 240 Nm @ 1600–4000 rpm US
Gov
ernm
ent
/ U
S En
viro
nmen
tal P
rote
ctio
n A
genc
y
the efects of varying exhaust residuals, boost pressure and spark timing, a predictive, quasi-dimensional combustion model was constructed within GT-Power using data from an experimental version of a production PSA (Peugeot Société Anonyme) 1.6 L turbocharged engine shown in Figure 1 and Table 1.
The output from the quasi-dimensional combustion model was used to investigate the efect of cooled EGR on inhibiting autoignition in a downsized turbocharged engine. In addition, further model data are presented demonstrating the capability of the model to predict boosting requirements correctly for a VNT or twin-scroll turbocharger at rated power.
Simulation Model Te engine selected for this study was a PSA EP6CDTx confg-ured with LP-EGR [1]. Table 1 lists the engine geometry and test confguration, and Figure 1 depicts the engine.
Supplemental boost was required when the twin-scroll turbocharger was unable to meet the target load at the desired EGR rate. To supply the supplemental boost, a mechanical supercharger coupled to an electric motor was
conditions, the manifold air temperature was set to 40 °C to align with the engine testing. Te post-turbine EGR was routed to the intake without passing through a three-way-catalyst (TWC). Te EGR therefore has uncatalyzed HC, CO and lesser amounts of H2 and these can all help the dilute combustion process by increasing the fame speed [11]. Further details of the test setup can be found in the companion paper [1].
Model Geometry The test engine was modeled in GT-Power (Gamma Technologies, Ltd., Morrisville, NC, USA). Component geometry was determined with a combination of direct measurement, engineering judgment, or was provided by the component manufacturer (see Table 2).
To achieve the objectives of this study, the GT-Power model required the following features:
• Predictive combustion
• Predictive knock
• Cycle-by-cycle adjustment of combustion phasing to mitigate knock per the knock model prediction
• Flexible load control algorithm

PREDICTIVE GT-PowER SIMULATIoN foR VNT MATChING oN A 1.6 L TURboChARGED GDI ENGINE 3
This material is declared a work of the U.S. Government and is not subject to copyright protection in the United States.
_L ________ _
-
TABLE 2 Sources of geometry data. TABLE 3 Load control algorithm.
Model Component Method Intake, Exhaust, and EGR Direct measurement State Load Control Device
Remaining Load Control Actuator Positions
US
Gov
ernm
ent
/ U
S En
viro
nmen
tal
Pro
tect
ion
Age
ncy
US
Gov
ernm
ent
/ U
S En
viro
nmen
tal
wastegate wide open Systems 0 Variable valve lift (VVL), throttle targeted 92 kPa Valve Flow Coefcients flow bench Testing External boost device fxed
1
Pro
tect
ion
Age
ncy intake manifold pressure
Throttle
at 0 RPM
VVL set to maximum lift
wastegate wide open
External boost device fxed
2
3
US
Gov
ernm
ent
/ U
S En
viro
nmen
tal
wastegate
External boost Device
at 0 RPM
VVL set to maximum lift
Throttle wide-open
External boost device fxed at 0 RPM
VVL set to maximum lift
Throttle wide-open
wastegate closed
Cylinder Engineering Estimate Provided by Manufacturer
Turbocharger and External Provided by Supplier Boost Device
FIGURE 3 10.5:1 combustion chamber surface geometry.
Pro
tect
ion
Age
ncy
FIGURE 4 Simulink control code. A larger-scale version of this schematic is reproduced within Appendix figure 1 for
Predictive combustion models require detailed topog-raphy of the in-cylinder geometry to predict wetted fame area
improved legibility.
US
Gov
ernm
ent
/ U
S En
viro
nmen
tal
Pro
tect
ion
Age
ncy
and turbulence. Non-predictive models such as the Wiebe function [12, 13, 14] rely primarily on test data. Head and piston surface models were added to the engine model by importing stereolithography (STL) fles of the piston and cylinder head surfaces that represent the combustion chamber. (Figure 3) illustrates the piston and cylinder head surface geometries used as input to the model. Te surface detail was coarsened to speed computation times by setting the Surface Discretization Resolution parameter to 1.0. Te network of pipes that make up the engine breathing system were imported from CAD models by converting STL fles into GT-Power map
object (Figure 5). Engine measurements, controls, and parts using GT-Power’s GEM3D sofware. monitors interfaced with this object in the GT map.
Load Control Te model was designed to operate across the baseline speed and load map of the engine with varying EGR rates, diferent fuels, and moderate hardware changes. Te load control algo-rithm must both be fexible and mimic the baseline calibration of the engine. Te selected load control algorithm was a state machine and can be seen in Table 3.
Tis control algorithm was implemented in the GT-Power model via Mathworks (Natick, MA) MATLAB Simulink co-simulation. Co-simulation enabled the combined advan-tages of GT-Power controllers and Simulink capability to ofer a fexible and robust control architecture. Te state machine and combustion phasing logic was entirely coded in Simulink. Te throttle and turbocharger controllers in GT-Power are robust, as they are model-based. Te Simulink code, therefore, only confgured these controllers to operate in the desired state. Tis confguration was achieved by setting targets and limits for the GT-Power controllers from the Simulink code.
Te complete Simulink code is illustrated in Figure 4. Te code was compiled as a dynamic link library fle (.dll exten-sion) and input in the GT-Power model via the SimulinkHarness
Predictive Combustion (SITurb) Predictive combustion modeling was included to predict combustion performance across the wide range of operating conditions, an important consideration when adjusting engine back pressure, as experienced by a boosting device study. When changing back pressure, total trapped residual content changes. Te presence of residual content will afect burn rates, autoignition, heat transfer and efective volumetric ef-ciency. Te SITurb model within GT-Power has the capability to account for the above processes and was selected for this boosting device study.
Combustion in spark-ignition gasoline engines is premixed turbulent combustion. The f lame begins from exothermic reactions ignited by the high temperature ignition kernel. Te reactions form a laminar-like fame which is then wrinkled and perturbed by varying scales of turbulence, primarily the Taylor microscale [15]. During this phase, the fame is defned as a developing fame. Once the fame has grown to a size larger than the integral scale of turbulence,

4 PREDICTIVE GT-PowER SIMULATIoN foR VNT MATChING oN A 1.6 L TURboChARGED GDI ENGINE
This material is declared a work of the U.S. Government and is not subject to copyright protection in the United States.
- -1 0 MFB
- Base
0.8 ····· TFSM 1.4 ---TFSM 0.6
(l'.) 0.6
LL ~ 0.4
0.2
0.0 -30 -15 0 15 30 45 60
0 24 HRR
- Base <( 20 ·····TFSM 1.4 0 ---TFSM 0.6 2- 16 0::::
12 0:::: I
8
4
0 -30 -15 0 15 30 45 60
Local Cylinder Crank Angle ( deg]
- -sa2o -10 0 10 20 30 40 30
Turbulent Flame Speed Multipler 0.72 1
~Q 25 0.61 0.67
40 -- fr 0.8 -- MFB
'tl 20 0.56 0.61
~ ~ 'e30 o.s<il ~ .§. C: a::: 15 0.56
~ .11 (9 13
'o !!! w "' u.
10 0.51 a: 20 0.4 "' i(l ::;
5 0.45 10 0.2 ; 0.67
0 0.40
0 40°
2 4 6 8 10 12 14 16 18 20 -20 -10 0 10 20 30
Crank Angle, (deg a TDC) BMEP (bar)
FIGURE 5 SimulinkHarness object in GT-Power. A larger- FIGURE 7 Sensitivity sweep of Turbulent flame Speed scale version of this schematic is reproduced within Appendix Multiplier on fuel mass fraction burned (Mfb) and heat release figure 1 for improved legibility. rate (hRR).
US
Gov
ernm
ent
/ U
S En
viro
nmen
tal P
rote
ctio
n A
genc
y U
S G
over
nmen
t /
US
Envi
ronm
enta
l Pro
tect
ion
Age
ncy
US
Gov
ernm
ent
/ U
S En
viro
nmen
tal P
rote
ctio
n A
genc
y
process, FKGM is mainly used to adjust the 0–2% (MFB 0–2) burn duration.
Te fnal tuning maps for the FKGM and TFSM are presented as functions of EGR and engine brake mean efec-tive pressure (BMEP) in Figure 8 and Figure 9. Te FKGM required only slight tuning at low loads to avoid unreasonably early start of ignition timing. Te TFSM shows only a slight variation over a wide operating range, though a sensitivity to EGR was apparent at low loads.
Te predictive combustion model was evaluated over a wide range of conditions. (Figure 13) illustrates the match of
FIGURE 8 Tuning map for the Turbulent flame Speed Multiplier.
it is defned as fully developed. At this point, the fame has a constant velocity until it reaches the combustion chamber wall where it rapidly decelerates. Te fame itself has a fnite thickness on the order of 1-2 mm. Within this fame thickness, the freshly entrained fuel-air mixture is heated to the point at which the exothermic reactions occur, releasing heat from the fuel. Te time for this process is also considered a function of turbulence scale size and laminar burning velocity. A typical relationship between fame radius and mass fraction of fuel burned can be seen in Figure 6.
Te SITurb model within GT-Power has independent tuning factors for each phase of combustion. Te minimum adjustment of each of these factors is ideal to preserve the broad application of the model. Te two factors that require mapped tuning are the Flame Kernel Growth Multiplier (FKGM) and the Turbulent Flame Speed Multiplier (TFSM). Te impact of the TFSM on combustion is illustrated in Figure 7. Reducing TFSM slows down the combustion process and can be used to tune the 10–90% mass fraction of fuel burn (MFB 10–90). Te FKGM mainly impacts the early fame growth, and, although it will afect the entire combustion
FIGURE 6 flame front radius (fre), burned gas radius (frb) and mass fraction of fuel burned (Mfb) as a function of crank angle.
US
Gov
ernm
ent
/ U
S En
viro
nmen
tal P
rote
ctio
n A
genc
y

PREDICTIVE GT-PowER SIMULATIoN foR VNT MATChING oN A 1.6 L TURboChARGED GDI ENGINE 5
This material is declared a work of the U.S. Government and is not subject to copyright protection in the United States.
- ~-------20
18
16
14
~ 12 0 -0::: 10 C)
8 UJ 6
4
2
0
Flame Kernel Growth Multiplier
0.30
0.38-------t
-----0.45
2 4 6 8 10 12 14 16 18 20
BMEP (bar)
0.60
0.53
0.45
0.38
0.30
0.22
0.15
- -------Activation Energy Multiplier
30 .,.,--- --,--------------, 1.03
25
0.81
20
~ ;:; 15 CJ 0.70 LJ.J
10 0.59 0.92
5
9 o _ _ _._,__,_~ --.---~-1000 2000 3000 4000 5000 6000
Engine Speed (RPM)
-70 C linder Pressure
--Stock CR, MBT 60 - Increase CR
.:::' 50 --Retard Timing i --AddEGR Q) 40 ····•Higher Al<I Fuel ... ~ 30 (/)
~ 20 a..
10
0.92
0.81
0.70
0.59
0.49
0.38
o~----------------~ -60 -45 -30 -15 0 15 30 45 60
Crank Angle [ deg]
FIGURE 9 Tuning map for flame Kernel Growth Multiplier. the test data. Te knock model was calibrated to test data by tuning the Activation Energy Multiplier as a function of speed and EGR rate, (Figure 10). Without a chemical kinetics component, the knock tolerance beneft of EGR must be afected by a lower Activation Energy Multiplier.
Te knock model was exercised at 2000 RPM and 10 bar BMEP. With the baseline compression ratio (CR), this point was the maximum load at minimum spark advance for best torque (MBT) timing. Knock onset was considered at a knock index of 5. Knock index is sensitive, thus any value from 5–10 was considered knock onset. Te diference in the knock-limited CA50 (the point at which 50% of the fuel is burned) from a knock index of 5 to 10 was ~0.5°.
A compression ratio increase of 1.3 points was investi-gated. Te knock model predicted an increase in knock. Various knock mitigation techniques were applied: later combustion phasing, EGR dilution, and higher AKI fuel. Each knock mitigation technique sufciently eliminated knock. (Figure 11) provides a visual for the cylinder pressure with
US
Gov
ernm
ent
/ U
S En
viro
nmen
tal P
rote
ctio
n A
genc
y
start of combustion between the predictive model and the test the increased compression ratio and the knock mitigation techniques. Table 4 gives numerical values for the critical data. Te primary tuning parameter was FKGM. Start of
combustion has a minimal impact on performance or combus-tion, but it does provide an indication of the required spark advance.
parameter changes.
FIGURE 10 Map of Activation Energy Multiplier.
Knock Model A knock model was developed to identify a reasonable combustion phasing for the controller to target. Te knock model must predict knock over the full range of speeds and loads with varying EGR rates.
Te knock model used is based on the Livengood and Wu induction time integral (Eq. 1) [16] and uses the Douaud and Eyzat (D&E) empirical model (Eq. 2) [17] to calculate autoigni-tion delay times. Once the integral reaches unity, autoignition is deemed to occur. Te D&E model considers only pressure and temperature of the end-gas. The role of dilution in chemical kinetics must be accounted for by adjustment of the Activation Energy Multiplier. Te nature of this model requires an ad hoc approach to EGR knock modeling—a signifcant limitation to the broad application of the model. At the time of the analysis, Gamma Technologies had developed a chemical kinetics-based knock model called kinetics-fit-gasoline knock model; however, it was still considered experimental in GT-Power v2016, and thus was not used.
FIGURE 11 Cylinder pressure progression through knock mitigation strategies.
US
Gov
ernm
ent
/ U
S En
viro
nmen
tal P
rote
ctio
n A
genc
y U
S G
over
nmen
t /
US
Envi
ronm
enta
l Pro
tect
ion
Age
ncy
× æ çè
dt = 1 (1) ò ta
t =0 t ö÷ø
3800ö÷ø
ONæ çè
-1 7.P e M T (2) =t 17 68. 100
Where:
ON = Research Octane Number P = Pressure T = Temperature M = Activation Energy Multiplier τ = Autoignition Delay Time
Te octane number was matched to the anti-knock index (AKI) of the test fuel, and the activation energy was tuned to

6 PREDICTIVE GT-PowER SIMULATIoN foR VNT MATChING oN A 1.6 L TURboChARGED GDI ENGINE
This material is declared a work of the U.S. Government and is not subject to copyright protection in the United States.
- -------10
� GT Power Simulation � Test Results
u C 0 I- -l -10 1:11) C: ·e -20 i= C: -30 0
:-2 -40 C: ~ NoEGR
-50 "' N ~ N S:l 00 "' ~ 0 ... § § ... "' 0 0 § § § N "' "' ... N ,.... N ,., ... ... N ,., <t
Engine Speed [RPM) • BMEP (bar)
- -------0
-10
bO -20 C
·e: -3o I=
-40 C 0
·.:i ·2 -50
~ -60 <.O 6 LI)
N ,-t
� Test Results
With EGR
N 0 0 00 <.O 0 ,-t N ,-t 6 ,-t N
6 6 6 0 6 6 LI) LI) 0 0 0 0 N ,..... 0 m 0 0 ,-t ,-t N m "'1"
Engine Speed [RPM] · BMEP [bar]
- ~------30
0 25
5 20 0 ~ 15 0
al 10 ... :E 5
0 <.O 6 LI)
N ,-t
� GT Power Simulation � Test Results
N 0 N 0 00 <.O 0 ,-t N 6 ,-t 6 ,-t N
6 6 0 6 0 6 6 LI) LI) 0 0 0 0 0 N ,.....
N 0 m 0 0 ,-t ,-t N m "'1"
Engine Speed [RPM] - BMEP [bar]
- -------40
~ 30 ~ 0 en 20 0 .-t
~ 10 :E
0
� GT Power Simulation
With EGR
<.O N 0 0 6 ,-t N ,-t
LI) 6 6 6 N LI) LI) 0 ,-t N ,..... 0
,-t ,-t N
� Test Results
00 6 8 m
<.O ,-t
6 0 0 m
Engine Speed [RPM) - BMEP (bar]
0 N 6 0 0 "'1"
FIGURE 13 Start of combustion validation with EGR. TABLE 4 Confguration and knock performance of the knock mitigation strategies.
CR CA50 [°aTDC]
EGR [%]
Fuel AKI
Knock Index
FIGURE 14 burn duration validation without EGR.
Base CR, MBT 10.5 8 0 93 9.4
Increase CR 11.8 8 0 93 95.0
Retard Timing 11.8 13 0 93 7.7
Add EGR 11.8 8 18 93 6.7
High AKI Fuel 11.8 8 0 100 13.2
Validation to Test Data As outlined in Conway et al. [1], the engine generated data for over 200 test conditions with and without LP-EGR. Data generated at these points was used to validate the GT-Power model created for this study. Eight points were selected for an initial validation. Tese points cover a wide operating portion of the engine map and give an indication of the performance of the GT-Power model under all conditions. A comparison of the ignition timing for conditions with and without LP-EGR can be seen in Figure 12 and Figure 13. Ignition timing was adjusted to target comparable CA50. Except for 1250 RPM and 6 bar BMEP, all conditions match well both with and without LP-EGR.
MFB 10–90 is the other tuned parameter, and a compar-ison between test data and simulation results is presented in Figure 14 and Figure 15. Te primary tuning parameter for MFB 10–90 was the TFSM. Comparing all cases identi-fes that the model under-predicts the burn rates, that is, the predicted MFB 10–90 are longer than the test data, although there are cases where the trend is reversed. It would be possible to individually tune the TFSM for each individual case, however this would remove any predictive capability from the model.
As well as the MFB 10–90 duration being matched, it is necessary to match the combustion process from spark to termination. A comparison between simulated and experi-mental shape of the MFB curve under two diferent sets of conditions can be seen in Figure 16 where there is good agree-ment between prediction and test data.
FIGURE 12 Start of combustion validation without EGR.
FIGURE 15 burn duration validation with EGR.
US
Gov
ernm
ent
/ U
S En
viro
nmen
tal P
rote
ctio
n A
genc
yU
S G
over
nmen
t /
US
Envi
ronm
enta
l P
rote
ctio
n A
genc
y
US
Gov
ernm
ent
/ U
S En
viro
nmen
tal P
rote
ctio
n A
genc
y U
S G
over
nmen
t /
US
Envi
ronm
enta
l Pro
tect
ion
Age
ncy
US
Gov
ernm
ent
/ U
S En
viro
nmen
tal P
rote
ctio
n A
genc
y
Te knock model matched test data within −3° to +3° CA50 along the lug curve (Figure 17). Improving the accuracy of the model would require a point-by-point adjustment of the Activation Energy Multiplier. Tis approach was not desir-able as it would hinder the predictive capability of the model.
Predictive simulations were performed across the oper-ating map under more than 70 speeds–load conditions; the

PREDICTIVE GT-PowER SIMULATIoN foR VNT MATChING oN A 1.6 L TURboChARGED GDI ENGINE 7
This material is declared a work of the U.S. Government and is not subject to copyright protection in the United States.
-1.0 2000 - 2
0.8
0.6 m u.. ~ 0.4
0.2 - GT Result - Test Data
0.0 -30 -15 0 15 30 45
CAD [deg]
1.0 3000 - 20
0.8
0.6 m u.. ~ 0.4
0.2 - GT Result - Test Data
0.0 -30 - ·15 0 ·15 30 45
CAD [deg]
-1~!1 £ Lu:::S IT C ,-"' e.....
0 .,, <( u
35
3 0
2 5
20
15
1 0
5
0
1000
_ ,A ____ o. ___ _
--£:r- Experimental Data
-0- GT Power Simulation
2000 3000 4000 5000
Engine Speed [RPM)
60
60
-Twin Scroll w/ External Boost
22 Premium - w/ EGR
20
18
16
i 14 ..c ~ 12
~ 10 m 8
6
4 270 2
1000 2000 3000
Speed (RPM)
4000 5000
-Simulation Results Compared
22 to est Data
20
18
16
i 14 ..c ~ 12
~ 10 m 8
6
4
2 ~ ::;:::;;;----~ ~ -~-_j 1000 2000 3000 4000 5000
Speed (RPM)
BSFC (g/kWh) 400
380
360
340
320
300
280
260
240
220
200
% Diff BSFC 10
8
6
4
2
0
-2
-4
-6
FIGURE 16 Mfb curve at 2000-2 and 3000-20 FIGURE 18 bSfC results from GT-Power simulation without EGR. with EGR.
US
Gov
ernm
ent
/ U
S En
viro
nmen
tal P
rote
ctio
n A
genc
y
US
Gov
ernm
ent
/ U
S En
viro
nmen
tal P
rote
ctio
n A
genc
y
FIGURE 19 bSfC diference between test data and the fnal GT-Power simulation. Positive values suggest that predicted bSfC values were higher than test data.
US
Gov
ernm
ent
/ U
S En
viro
nmen
tal P
rote
ctio
n A
genc
y
FIGURE 17 Knock model performance compared to test data across the lug curve.
US
Gov
ernm
ent
/ U
S En
viro
nmen
tal
Pro
tect
ion
Age
ncy
here is subject to the predictive capability of the D&E knock model. An overprediction of knock will result in combustion phasing retardation and an increase in BSFC.
VNT Simulation
predicted brake specifc fuel consumption (BSFC) results can be seen in Figure 18.
Te predicted BSFC values were compared to test data run using an external boost device and twin-scroll turbo-charger. Te average BSFC error compared to test data was below 2% over the operating area of the map as can be seen in Figure 19. At loads below 1 bar BMEP, BSFC is highly sensi-tive to friction and pumping. Te Chen-Flynn friction model [18] used within GT-Power was tuned to motoring data but not to fred data and therefore may not accurately represent the true physics. In knock-limited areas, the model predicts higher BSFC than observed during testing. BSFC prediction
Afer the model was validated against the twin-scroll test data, the VNT turbocharger maps from Honeywell Transportation Systems1 were included in the model. Te new confguration modeled within GT-Power can be seen in Figure 20. Note the removal of the wastegate and supercharger device.
Te process to select the gasoline specifc VNT map is independent of the compressor map. Te frst step is assuming that the compressor corrected mass fow and pressure ratio would remain the same and therefore only the turbine map is changed from the twin-scroll to VNT. Further compressor
1 Honeywell Transportation Systems, Plymouth, MI/Rolle, Switzerland is a major supplier of automotive turbochargers.

8 PREDICTIVE GT-PowER SIMULATIoN foR VNT MATChING oN A 1.6 L TURboChARGED GDI ENGINE
This material is declared a work of the U.S. Government and is not subject to copyright protection in the United States.
-
-VNT
120tW
t20tW
Twin5croll Cytl ,4
___ - Twin Scroll, Cyl 1,4@WOT
___ Twin Scroll, Cyl 2,J@WOT t OpenUMax Flow --- Twin Scroll Turbine Wastega e
--- VNT@WOT .. VNT Max Flow for Different Rack PosttJOns
Pressure Ratio P3t/P4
Twin Scroll Cy1l,3
_ L_ _____ _ \V~NiJT~:__-~P~re~m.!.!_iu~m.!.!....:-2w~/--=E:.::G::.:.R-=----7 22....:
20
18
16
~ 14 .0 ~ 12 Cl. w 10 :a: co 8
6
4 270 2
BSFC (g/kWh) 400
380
360
340
320
300
280
260
240
220
200 1000 2000 3000 4000 5000
Speed (RPM)
-VNT comparison to Twin-Scroll w/ External Boost 22
20 18
16
~ 14 e 12 Cl.
~ 10 co 8
6
4
2
0
2 L--r-'--------,-:-::---~:;;;---~sooo 2000 3000 4000 1000
Speed (RPM)
%DiffBSFC 18 16
14 12 10
8
6
4
2
0
-2
-4
-6
FIGURE 20 Engine as confgured in GT-Power using a VNT FIGURE 22 bSfC map for VNT hardware with EGR. boost device. The supplement boost is removed for this confguration.
Below 12 bar BMEP, the VNT BSFC was like the twin-scroll with external boost, where boosting was not signifcant. For low-speed (e.g., below 2500 RPM) and high-load (e.g., above 15 bar BMEP), improved knock resistance and pumping work from lower backpressure yielded improved fuel efciency with the VNT. At high power, the VNT results indicated higher BSFC from increased backpressure due to the smaller turbine. Te
US
Gov
ernm
ent
/ U
S En
viro
nmen
tal P
rote
ctio
n A
genc
y
map iteration can be conducted once the ideal VNT turbine is selected. Te VNT is selected such that it has sufcient mass fow capacity to cover the low speed torque region (VNT in more closed position) to the high speed rated power point (VNT more open to reduce turbine inlet pressure and power). Te twin-scroll turbine has a wastegate valve used to bypass excess turbine energy to control the compressor to a specifc mass fow and pressure ratio. A properly matched VNT should not need the wastegate valve as the map width is tailored to contain all the engine operating points. (Figure 21) shows the full load curve on both the twin-scroll and VNT turbines.
Te predictive combustion and knock from the twin-scroll model were maintained with no adjustment. Any change in back pressure would still be accounted for by the predictive models, but no further calibration efort was required. Te same engine actuator positions were also maintained, except where noted. Te BSFC map for the VNT model is illustrated in Figure 22.
increase in back pressure led to higher trapped residuals and higher knock potential. In reaction to the onset of knock, ignition timing was retarded, thus reducing efciency. Additionally, at high loads and engine speeds, exhaust gas temperature limits become critical and it was necessary to add additional fuel to cool the exhaust gas, again to the detriment of efciency. Recall, the twin-scroll turbocharger required supplemental boost at low speeds. A BSFC percentage diference map between the VNT and twin-scroll with external boost is pictured in Figure 23.
Te compressor operation over full load is depicted in Figure 24. Te margin of compressor surge at the lef-hand side of the map and choke margin towards the right-hand side are within the acceptable limits defned by Honeywell (Figure 24). To achieve a targeted load, the EGR rate was reduced (Figure 25) as load was increased. At speeds below 1750 RPM, the required
FIGURE 23 Diference map of bSfC comparing the VNT and twin-scroll (with external boost).
Turbine operation along full load curve, FIGURE 21 twin-scroll and VNT (courtesy of honeywell Transportation Systems – units removed at the request of the manufacturer).
US
Gov
ernm
ent
/ U
S En
viro
nmen
tal P
rote
ctio
n A
genc
y
US
Gov
ernm
ent
/ U
S En
viro
nmen
tal P
rote
ctio
n A
genc
y U
S G
over
nmen
t /
US
Envi
ronm
enta
l Pro
tect
ion
Age
ncy

PREDICTIVE GT-PowER SIMULATIoN foR VNT MATChING oN A 1.6 L TURboChARGED GDI ENGINE 9
This material is declared a work of the U.S. Government and is not subject to copyright protection in the United States.
-Efficienc Ma - Reduced
0
~ c:: ~ :J <I) <I)
~ a..
-25
20
~ i 15 "' c:: t§ 10 UJ
5
0 0
Reduced Mass Flow Rate
I I I ,
I , �
1000
-0-Twin Scroll+ External Boost
-0-VNT
2000 3000 4000 5000
Engine Speed [RPM]
0.0 20.0 30.0 35.0 37.5 40.0 42.5 45.0 47.5 50.0 52.5 55.0 57.5 60.0 62.5 65.0 67.5 70.0 72.5 75.0 77.5 80.0 82.5 100.0
6000
-Pre-Turbine Terrperature
22 without Enrichment
20
850 ~ 18 e a. w ~ 16
1•
12+---~---~--~-----4 30-00 3500 •ooo •soo 5000
Speed (RPM)
PreTurbT [0 C] 1100
1000
900
800
700
600
500
400
FIGURE 24 Compressor operation along full load curve. FIGURE 26 Pre-turbine temperature map near rated power (courtesy of honeywell Transportation Systems - x-y units without enrichment. removed at the request of the manufacturer).
US
Gov
ernm
ent
/ U
S En
viro
nmen
tal P
rote
ctio
n A
genc
y
US
Gov
ernm
ent
/ U
S En
viro
nmen
tal P
rote
ctio
n A
genc
y
Regular Grade Fuel Analysis Te initial fuel chosen for the GT-Power simulation was the EPA Tier II ‘Premium’ fuel. For the second phase of testing, the LEV III ‘Regular’ fuel with 10% ethanol, by volume, from EGR rate comparison between VNT and the California Low Emissions Vehicle Program (LEV) was
FIGURE 25 twin-scroll (with external boost).
used [19]. Specifcations for each fuel can be seen in Table 5. Te fuel used for the initial engine simulation runs was
the Tier 2 certifcation fuel, (like a premium grade fuel) to align with the test data. Until recently, vehicle emission certifcation and compliance testing in the U.S. used a premium quality fuel with approximately 93AKI and no added ethanol (E0). However, the Tier 3 and LEV III fuels now used for criteria pollutant emissions compliance consist of both a low and a high AKI and are formulated to match the average ethanol (E10) and aromatic content and distillation properties of gasolines available in the U.S. (or in the case of LEV III, the state of California) more closely. Te reduced aromatic content of Tier 3 and LEV III fuels also reduces carbon content relative to Tier 2 fuels.
Any analysis of future hardware technology packages must not be overly sensitive to fuel octane to account for manufac-
US
Gov
ernm
ent
/ U
S En
viro
nmen
tal
Pro
tect
ion
Age
ncy
boost pressure to achieve the target load with EGR exceeded turers choosing to require use of “regular grade” (87 AKI the capability of the VNT. Te lower dilution at high power minimum) gasoline during in-use operation of their vehicles. raised exhaust temperatures enough to require fuel enrichment If the application were designated by the manufacturer for to maintain <950 °C pre-turbine temperature. minimum 91 AKI gasoline, then there could be an unacceptable A pre-turbine temperature map, without enrichment, is engine power de-rate if a consumer used regular grade gasoline
TABLE 5 fuel specifcations.
illustrated in Figure 26. Tis map shows pre-turbine tempera-ture if no enrichment were used. Te maximum exhaust temperature predicted was 1020 °C.
Overall, the model predicted that VNT would perform as well as a single boost device. Te model predicted that reduced EGR rates would be required to achieve targeted loads at low and high speeds. Tere was minor change in BSFC across much of the map and it was possible to meet the target torque curve, albeit with reduced efciency, at the high power.
Emissions performance and fuel efciency sufered at peak
EPA Tier II Certifcation Fuel
LEV III Regular Certifcation Fuel
fuel Grade Premium Regular
Ethanol Content 0 10 (vol %)
LhV (MJ/kg) 43.25 41.39
US
Gov
ernm
ent
/ U
S En
viro
nmen
tal P
rote
ctio
n A
genc
y
power from enrichment for component protection. Pre-turbine RoN/MoN/AKI 96 / 87.7 / 91.9 91.8 / 84.2 / 88.0
temperatures were maintained at <950 °C. EGR rate was h:C 1.85 1.95 reduced at 4500 RPM to meet performance targets. To avoid o:C NA 0.0326 enrichment at the same power, the turbine must be capable of Total Aromatics (vol 28 22 1020 °C turbine inlet temperatures or a modifed turbine size %) must be found that reduces back pressure sufciently at high Notes: LhV – Lower heating Value, RoN – Research octane loads to be able to utilize EGR to reduce exhaust gas temperature. Number, MoN – Motor octane Number, AKI = (RoN + MoN)/2
10 PREDICTIVE GT-PowER SIMULATIoN foR VNT MATChING oN A 1.6 L TURboChARGED GDI ENGINE
This material is declared a work of the U.S. Government and is not subject to copyright protection in the United States.
-22 1-'il"""-.ll.lli!li!ll...W"'-'l.'-"-l::.l!<,~l-'L-
20
18
:[16 Cl.
~ 14 co
12
10
- Premium Fuel ··• .. Regular Fuel
a~ --------------------' 1000 2000 3000 4000 5000
Engine Speed [RPM]
- -----------50 c 50 FB
gi 40 .. ·········•··· ... •··· ············· ····• ....... .
~ 30 · ······ ·····•················· ······· .. ··/ ~ .•·
1 20 ....... / -------- : ____ ~ u 10 ' - Premium Fuel
···· Regular Fuel
0--------------------' 1000 2000 3000 4000 5000
Engine Speed [RPM]
- -----------~ 15 ~ a:: (!) w 10 C: Q)
~
cf 5 - Premium Fuel ·····Regular Fuel
o~~-------======:..._-~- ---- __J, 1000 2000 3000 4000
Engine Speed [RPM]
-40 Brake Efficienc
35
~ e..... 30 1, c:: Ql
·13 25 <.: uJ
20
............... •··•·· ··
- Premium Fuel ··•·· Re ular Fuel
·· ····• ............. .
·-............. .
·-- ------ .. .•.. -·
5000
15'--------------------' 1000 2000 3000 4000 5000
Engine Speed [RPM]
rather than premium grade gasoline. EPA analyses of future FIGURE 29 EGR percentage for premium and regular fuel.
full Load Curve of simulations with premium BSFC across the operating range is plotted in Figure 34. A comparison to the premium fuel testing was performed on
FIGURE 27 and regular fuel.
a BTE basis to account for the diferent lower heating values of the two fuels. (Figure 35) illustrates the large operating region where there is a slight diference: loads up to 12–14 bar BMEP. Most drive cycle operation occurs in the low-load (e.g., less than 12 bar BMEP), low-speed region (e.g., below 3000 rpm, depending on gearing), so drive cycle performance is unlikely to be signifcantly impacted.
Tough the thermal efciency of the regular fuel was no diferent for drive cycle operation, the lower-carbon-content LEV III E10 fuel has a positive impact on CO2 emissions (Figure 36). Te results indicated a brake-specifc CO2 (BSCO2) beneft with regular fuel up to 13–15 bar BMEP. Above this
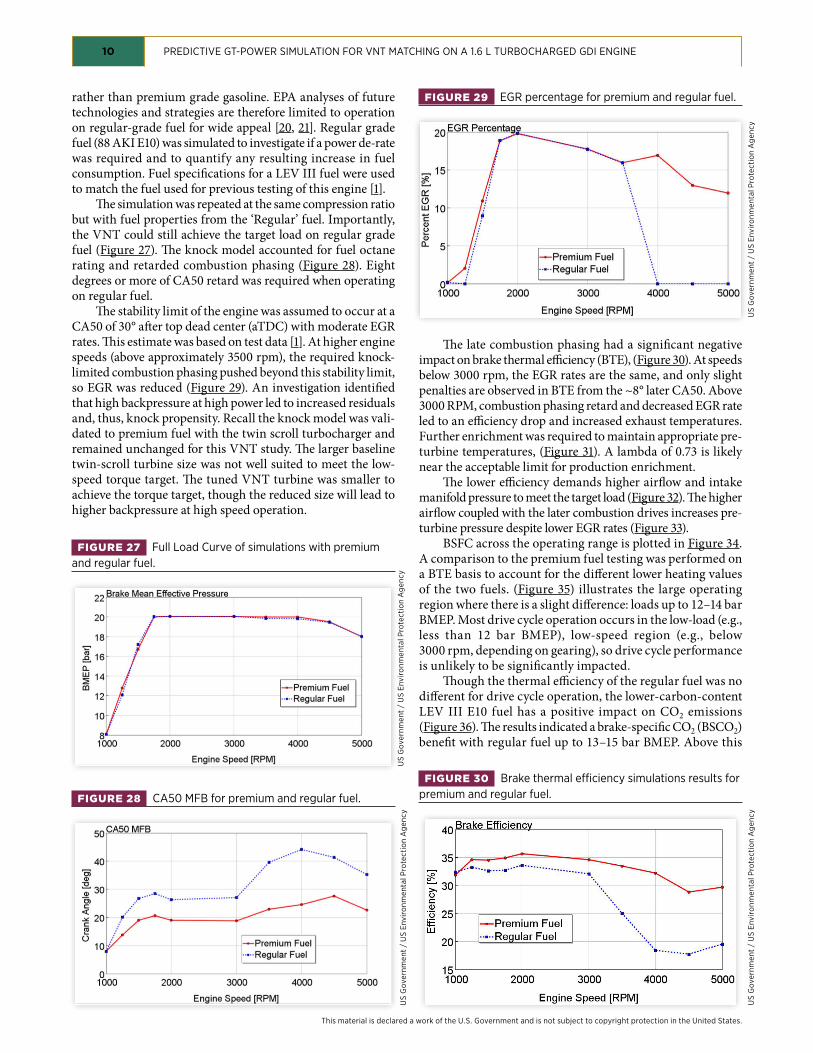
FIGURE 30 brake thermal efciency simulations results for
FIGURE 28 premium and regular fuel. CA50 Mfb for premium and regular fuel.
US
Gov
ernm
ent
/ U
S En
viro
nmen
tal P
rote
ctio
n A
genc
yU
S G
over
nmen
t /
US
Envi
ronm
enta
l Pro
tect
ion
Age
ncy
US
Gov
ernm
ent
/ U
S En
viro
nmen
tal P
rote
ctio
n A
genc
y U
S G
over
nmen
t /
US
Envi
ronm
enta
l Pro
tect
ion
Age
ncy
technologies and strategies are therefore limited to operation on regular-grade fuel for wide appeal [20, 21]. Regular grade fuel (88 AKI E10) was simulated to investigate if a power de-rate was required and to quantify any resulting increase in fuel consumption. Fuel specifcations for a LEV III fuel were used to match the fuel used for previous testing of this engine [1].
Te simulation was repeated at the same compression ratio but with fuel properties from the ‘Regular’ fuel. Importantly, the VNT could still achieve the target load on regular grade fuel (Figure 27). Te knock model accounted for fuel octane rating and retarded combustion phasing (Figure 28). Eight degrees or more of CA50 retard was required when operating on regular fuel.
Te stability limit of the engine was assumed to occur at a CA50 of 30° afer top dead center (aTDC) with moderate EGR rates. Tis estimate was based on test data [1]. At higher engine speeds (above approximately 3500 rpm), the required knock-limited combustion phasing pushed beyond this stability limit, so EGR was reduced (Figure 29). An investigation identifed that high backpressure at high power led to increased residuals and, thus, knock propensity. Recall the knock model was vali-dated to premium fuel with the twin scroll turbocharger and remained unchanged for this VNT study. Te larger baseline twin-scroll turbine size was not well suited to meet the low-speed torque target. Te tuned VNT turbine was smaller to achieve the torque target, though the reduced size will lead to higher backpressure at high speed operation.
Te late combustion phasing had a signifcant negative impact on brake thermal efciency (BTE), (Figure 30). At speeds below 3000 rpm, the EGR rates are the same, and only slight penalties are observed in BTE from the ~8° later CA50. Above 3000 RPM, combustion phasing retard and decreased EGR rate led to an efciency drop and increased exhaust temperatures. Further enrichment was required to maintain appropriate pre-turbine temperatures, (Figure 31). A lambda of 0.73 is likely near the acceptable limit for production enrichment.
Te lower efciency demands higher airfow and intake manifold pressure to meet the target load (Figure 32). Te higher airfow coupled with the later combustion drives increases pre-turbine pressure despite lower EGR rates (Figure 33).

PREDICTIVE GT-PowER SIMULATIoN foR VNT MATChING oN A 1.6 L TURboChARGED GDI ENGINE 11
This material is declared a work of the U.S. Government and is not subject to copyright protection in the United States.
-1.1 Lambda
1.or---------- .,.._-__ ..._
ca zl 0.9 E ca
...J
0 .8 - Premium Fuel ··•··Regular Fuel
··· ...
··•··· ...............•
·• .... .... 0.1.--:---:------------------_J
1000 2000 3000 4000 5000
Engine Speed (RPM]
-3.0 Intake Manifold Pressure
2.5
~ .£2.0 ~ ::, 1/)
~ 1.5 a..
1.0 .. ··
.• ····• ····· ················•··--------···· ........... . .... ....... ............ .
- Premium Fuel ··•··Regular Fuel
0.5'------------------_J 1000 2000 3000 4000 5000
Engine Speed [RPM]
-4.5 Pre-Turbine Pressure
4.0
ro 3.5
......... •... --· ··- .. ... •···
.0
~ 3.0 ::, ~ 2.5 ~ a.. 2.0 ---Premium Fuel
··•·· Regular Fuel 1.5
1.0"'-----------------_J 1000 2000 3000 4000 5000
Engine Speed [RPM]
- ~---------22 VNT - Re ular - w/ EGR
20
18
16
i 14 ..c ;:' 12
~ 10 co 8
6
4
BSFC (g/kWh)
520
480
440
400
360
320
280
240
2 ~~~- """"""'----·
200 1000 2000 3000 4000
Engine Speed (RPM)
-22 VNT - Prem vs. Re ular - w/ EGR
20
18
16
i 14 ..c ;:' 12
~ 10 co 8
6
4
2
5000
Pct. Diff. BTE (%)
0
-10
-20
-30
-40
-50 2000 3000 4000 5000
Engine Speed (RPM)
-22 VNT - Prem vs. Re ular - w/ EGR
20
18
16
i 14 ..c ;:' 12
~ 10 co 8
6
4
2
-D
Pct. Diff. BSCO2 (%)
Rel. to Prem. 6 3
-3
-8
-14
-19
-25
t----.----.----------1 -30 1000 2000 3000 4000 5000
Engine Speed (RPM)
FIGURE 31 Lambda comparison between premium and FIGURE 34 bSfC of regular fuel VNT with EGR. regular fuel.
US
Gov
ernm
ent
/ U
S En
viro
nmen
tal P
rote
ctio
n A
genc
y
US
Gov
ernm
ent
/ U
S En
viro
nmen
tal P
rote
ctio
n A
genc
y
FIGURE 35 bTE diference between regular and premium
FIGURE 32 fuel simulation results. A lower value indicates worse bTE for
Intake manifold comparison between the the regular fuel.
premium and regular fuel.
US
Gov
ernm
ent
/ U
S En
viro
nmen
tal
Pro
tect
ion
Age
ncy
US
Gov
ernm
ent
/ U
S En
viro
nmen
tal P
rote
ctio
n A
genc
y
FIGURE 36 Comparison of predicted brake-specifc Co2
FIGURE 33 emissions between regular and premium fuels. Simulation results for exhaust manifold backpressure for premium and regular fuels.
US
Gov
ernm
ent
/ U
S En
viro
nmen
tal P
rote
ctio
n A
genc
y
US
Gov
ernm
ent
/ U
S En
viro
nmen
tal P
rote
ctio
n A
genc
y

12 PREDICTIVE GT-PowER SIMULATIoN foR VNT MATChING oN A 1.6 L TURboChARGED GDI ENGINE
This material is declared a work of the U.S. Government and is not subject to copyright protection in the United States.
-Second Variable Geometry Turbine
22 Premium - w/ EGR
20
18
16
i 14 .0 ;;:- 12
~ 10 [l) 8
6
4 270 ----
2
1000 2000 3000 4000
Speed (RPM)
5000
BSFC (glkWh) 400
380
360
340
320
300
280
260
240
220
200
FIGURE 37 bSfC map of second Variable Geometry Turbine device.
US
Gov
ernm
ent
/ U
S En
viro
nmen
tal P
rote
ctio
n A
genc
y
load, the reduced efciency from late combustion phasing ofset the beneft from the carbon content of the fuel. Near peak power, however, there is a dramatic reduction in BSCO2 resulting from the ~30% enrichment. Carbon monoxide emis-sions increased to ~500 g/kWh, ofsetting BSCO2 production.
Other Hardware Investigations Te created GT-Power model was also evaluated with hardware from another turbocharger supplier to corroborate the results presented in this paper.2 Te compressor and turbine maps for the other turbocharger were slightly larger. Both suppliers provided maps for existing hardware, and thus, only discrete steps between compressor and turbine sizes were available.
Both variable turbine turbochargers performed similarly. Each achieved the target load with similar EGR rates. BSFC values for most of the map matched each other, with only slight diferences at some points (Figure 22, Figure 37). Te comparable results from two model suppliers provides strong corroboration that a VNT is a viable solution to support LP-EGR across a wide range of engine operation.
Summary A GT-Power model was created that used predictive knock and combustion sub-models. Te model was initially tuned to match an EGR and non-EGR dataset and contour maps for three diferent model multipliers were produced. Te model compared favorably to test data generated under sixteen sets of conditions with and without cooled LP-EGR. Generally, BSFC matched well to test data across the engine operating map with <2% absolute error being observed.
2 Identifcation, turbine map and compressor map withheld at the request of the manufacturer.
Compressor and turbocharger maps of VNT technology were provided for this study and imported into the GT-Power model. Te model was exercised on both regular and premium grade fuels.
Conclusions Based on the simulation study carried out, the following conclusions are ofered:
• Performance of the VNT was favorable at engine speeds below 3500 RPM and loads below 12 bar BMEP but higher back pressure resulted in reduced efciency at higher speeds. For this study, the turbine required high efciency at low fow capacity to act as the sole boost device and therefore had to be small enough to achieve the low speed, high load targets (1750 rpm 20 bar BMEP). Although BSFC increased marginally at the peak-power condition, it was possible to run the target torque curve with the single boost device.
• Te GT-Power model appropriately retarded combustion phasing with regular grade fuel. EGR was removed to enable further spark retardation without combustion becoming unstable. Te retarded combustion and removal of dilution increased exhaust gas temperature signifcantly, requiring further fuel addition to maintain <950 °C exhaust temperatures. Terefore, although the target torque curve could be achieved, efciency was reduced. Efciency performance was no diferent than the premium fuel results up to ~12 bar BMEP.
• Te simulation efort was replicated on a diferent variable geometry turbine and the results were comparable to the frst variable nozzle turbine study.
• Te calibration maps for GT-Power SITurb model variables can be used to guide other modeling eforts which use high pressure dilute combustion.
Future Work Future work intends to investigate the synergy between EGR and Miller operation with boost supplied from a VNT. Te use of Miller strategy could compensate for the reduced knock resis-tance with the regular fuel and improve overall engine efciency. It also has potential to reduce full load exhaust temperatures and resulting enrichment for component protection. The GT-Power kinetics-ft-gasoline model is also planned for future work to minimize ad hoc tuning as a function of EGR rate.
References 1. Conway, G., Robertson, D., Chadwell, C., Kargul, J. et al.,
“Evaluation of Emerging Technologies on a 1.6 L Turbocharged GDI Engine,” SAE Technical Paper 2018-01-1423.

PREDICTIVE GT-PowER SIMULATIoN foR VNT MATChING oN A 1.6 L TURboChARGED GDI ENGINE 13
This material is declared a work of the U.S. Government and is not subject to copyright protection in the United States.
2. EPA Federal Register, “2017 and Later Model Year Light-Duty Vehicle Greenhouse Gas Emissions and Corporate Average Fuel Economy Standards,” ISBN 7342144584: 62624-63200, 2012.
3. Yonekawa, A., Ueno, M., Watanabe, O., and Ishikawa, N., “Development of New Gasoline Engine for Accord Plug-in Hybrid,” SAE Technical Paper 2013-01-1738, 2013, doi:10.4271/2013-01-1738.
4. Gukelberger, R., Gingrich, J., Alger, T., Almaraz, S. et al., “LPL EGR and D-EGR® Engine Concept Comparison Part 1: Part Load Operation,” SAE Int. J. Engines 8(2):570-582, 2015, doi:10.4271/2015-01-0783.
5. Liu, Z. and Cleary, D., “Fuel Consumption Evaluation of Cooled External EGR for a Downsized Boosted SIDI DICP Engine,” SAE Technical Paper 2014-01-1235, 2014, doi:10.4271/2014-01-1235.
6. Song, D., Jia, N., Guo, X., Ma, X. et al., “Low Pressure Cooled EGR for Improved Fuel Economy on a Turbocharged PFI Gasoline Engine,” SAE Technical Paper 2014-01-1240, 2014, doi:10.4271/2014-01-1240.
7. Alger, T., Gingrich, J., Khalek, I., and Mangold, B., “Te Role of EGR in PM Emissions from Gasoline Engines,” SAE Int. J. Fuels Lube. 3(1):85-98, 2010, doi:10.4271/2010-01-0353.
8. Glahn, C., Kluin, M., Hermann, I., and Koenigstein, A., “980 °C Gasoline Variable Turbine Geometry – Te Afordable Upcoming Technology for High-Volume Efcient Engines,” in 26th Aachen Colloquium Automobile and Engine Technology, Oct. 20, 2017.
9. Bontemps, N., Roux, J.-S., and Jeckel, D., Schlosshauer, A. “VNT Turbocharger for Gasoline “Miller” Engines,” in International Conference and Exhibition SIA Powertrain Versailles 2017, June 07, 2017.
10. Eichler, F., Demmelbauer-Ebner, W., and Teobald, J., Stiebels, B., “Te New EA211 TSI Evo from Volkswagen,” Proceedings: International Vienna Motor Symposium, 2016.
11. Roth, D., Keller, P., and Becker, M., “Reqruirements of External EGR Systems for Dual Cam Phaser Turbo GDI Engines,” SAE Technical Paper 2010-01-0588, 2010, doi:https://doi.org/10.4271/2010-01-058.
12. Wiebe, I.I., “Progress in Engine Cycle Analysis: Combustion Rate and Cycle Processes.” Mashgiz, Ural-Siberia Branch, 1962, 271 pp (in Russian).
13. Wiebe, I. I. “Semi-empirical expression for combustion rate in engines.” Proceedings of Conference on Piston engines, USSR, 1956, pp. 185-191. (Academy of Sciences, Moscow).
14. Ghojel, J., “Review of the Development and Applications of the Wiebe Function: A Tribute to the Contribution of Ivan Wiebe to Engine Research,” International Journal of Engine Research. 11:297, 2010, doi:10.1243/14680874JER06510.
15. Gillespie, L., Lawes, M., Sheppard, C., and Woolley, R., “Aspects of Laminar and Turbulent Burning Velocity Relevant to SI Engines,” SAE Technical Paper 2000-01-0192, 2000, doi:https://doi.org/10.4271/2000-01-0192.
16. Livengood, J.C., and Wu, P.C., “Correlation of Autoignition Phenomena in Internal Combustion engines and Rapid Compression Machines,” Fifh Symposium (International) on Combustion (1955) pp. 347-356.
17. Douaud, A. and Eyzat, P., “Four-Octane-Number Method for Predicting the Anti-Knock Behavior of Fuels and
Engines,” SAE Technical Paper 780080, 1978, doi:https://doi. org/10.4271/780080.
18. Chen, S.K. and Flynn, P.F., “Development of Single Cylinder Compression Ignition Research Engine,” SAE Technical Paper 650733, 1965.
19. California Environmental Protection Agency – Air Resources Board. “California 2015 And Subsequent Model Criteria Pollutant Exhaust Emission Standards and Test Procedures and 2017 and Subsequent Model Greenhouse Gas Exhaust Emission Standards and Test Procedures for Passenger Cars, Light-Duty Trucks, and Medium-Duty Vehicles.” §100.3.1.2 Certifcation Gasoline Fuel Specifcations for LEV III Light-Duty Vehicles and Medium-Duty Vehicles. September 2, 2015 https://www.arb.ca.gov/ msprog/levprog/cleandoc/ldtps_2015+_cp_or_2017+_ghg_ my_lev%20iii_clean%20complete_10-15.pdf, last accessed Jan. 3, 2018.
20. U.S. EPA, “Proposed Determination on the Appropriateness of the Model Year 2022-2025 Light-Duty Vehicle Greenhouse Gas Emissions Standards under the Midterm Evaluation: Technical Support Document,” EPA-420-R-16-020, November, 2016.
21. U.S. EPA, “Draf Technical Assessment Report: Midterm Evaluation of Light-Duty Vehicle Greenhouse Gas Emission Standards and Corporate Average Fuel Economy Standards for Model Years 2022-2025,” EPA-420-D-16-901, July, 2016.
Contact Information For additional information please contact Graham Conway at Southwest Research Institute at [email protected]
Disclaimer Te views expressed in this article are those of the authors and do not necessarily represent the views or policies of the U.S. Environmental Protection Agency.
Acknowledgments The authors would like to acknowledge Honeywell Transportation Systems for their technical support on this project and for providing VNT compressor and turbine map data.
Work by SwRI presented within this paper was conducted under contract to the U.S. EPA, Contract Number EP-C-15-006.
Defnitions/Abbreviations AKI - Anti-knock index aTDC - Afer top dead center BMEP - Brake mean efective pressure BSCO2 - Brake specifc carbon dioxide BSFC - Brake specifc fuel consumption BTE - Brake thermal efciency CA - Crank angle

14 PREDICTIVE GT-PowER SIMULATIoN foR VNT MATChING oN A 1.6 L TURboChARGED GDI ENGINE
This material is declared a work of the U.S. Government and is not subject to copyright protection in the United States.
CO2 - Carbon dioxide CR - Compression ratio DI - Direct injection EGR - Exhaust gas recirculation FKGM - Flame kernel growth multiplier GDI - Gasoline direct injection GT - Gamma Technologies LHV - Lower heating value LP-EGR - Low-pressure EGR MBT - Minimum spark advance for best torque MFB - Mass fraction burned
MON - Motor Octane Number NOX - Oxides of nitrogen RON - Research octane number STL - Stereolithography SwRI - Southwest Research Institute TFSM - Turbulent fame speed multiplier TWC - Tree-way-catalyst VNT - Variable nozzle turbocharger VVL - Variable valve lif

PREDICTIVE GT-PowER SIMULATIoN foR VNT MATChING oN A 1.6 L TURboChARGED GDI ENGINE 15
This material is declared a work of the U.S. Government and is not subject to copyright protection in the United States.
- '------------------------
Goto2 BMEP _E rr VV\._Lift _mm
Slate
E,iiSpd eBoos1
LoaJ _ Control
Slate Co~rolerType
BM EP _Target 1 .. ge1
l ov.erli mi
Fee-k
Tlrott~ Gelo State
Upperlimi
Slate LO'tie!'Limi
WG
Kl
CASO_Ta~~ CASO_Meas
S!)kTim
Comb Phasi'lg Control
Appendix
APPENDIX FIGURE 1 Simulink control code.
US
Gov
ernm
ent
/ U
S En
viro
nmen
tal P
rote
ctio
n A
genc
y

16 PREDICTIVE GT-PowER SIMULATIoN foR VNT MATChING oN A 1.6 L TURboChARGED GDI ENGINE
- ~---------------
mi Slmuilnk
Controller% Comb_ Monitor
-1
Simullnk Controller"
MovlrtQ Av.ni,oe- 1-1
~ Stmullnk
Controlle~ SendSlgnal_
Toro
r;]
~ Slmulln
Controller% S.ndSlon_ WG-
1
SlmuilnkControl ~SlmuhnkHamess-1
SlmullnkController'!liErlgmeSensors
Stmulink Con olllr'M> R ,_valve_
Ult
lln Con rolle""°
MOVlrtQ Averaol-'4 · l
)(
Slmullnk Control~
Receive Slonal•BMEP
1
APPENDIX FIGURE 2 SimulinkHarness object in GT-Power.
US
Gov
ernm
ent
/ U
S En
viro
nmen
tal P
rote
ctio
n A
genc
y
This is a declared work of the U.S. Government and is not subject to U.S. copyright protection. foreign copyrights may apply. The U.S. Government assumes no liability or responsibility for the contents of this paper or the use of this paper, nor is it endorsing any manufacturers, products, or services cited herein and any trade name that may appear in the paper has been included only because it is essential to the contents of the paper.
Positions and opinions advanced in this paper are those of the author(s) and not necessarily those of SAE International. The author is solely responsible for the content of the paper.
ISSN 0148-7191
Related Documents