Agriculture, Ecosystems and Environment 147 (2012) 13–23 Contents lists available at ScienceDirect Agriculture, Ecosystems and Environment jo ur n al homepage: www.elsevier.com/lo cate/agee Denitrification potential in subsoils: A mechanism to reduce nitrate leaching to groundwater M.M.R. Jahangir a,b , M.I. Khalil a,c , P. Johnston b , L.M. Cardenas d , D.J. Hatch d , M. Butler d , M. Barrett e , V. O’flaherty e , K.G. Richards a,∗ a Teagasc Environment Research Centre, Johnstown Castle, Co. Wexford, Ireland b Department of Civil, Structural & Environmental Engineering, Museum Building, University of Dublin-Trinity College, Dublin 2, Ireland c University College Dublin/Environmental Protection Agency, Johnstown Castle Estate, Wexford, Ireland d Rothamsted Research, North Wyke, Okehampton, Devon EX20 2SB, UK e Microbial Ecology Laboratory, Microbiology, School of Natural Sciences and Ryan Institute for Environment, Marine and Energy, NUI Galway, Galway, Ireland a r t i c l e i n f o Article history: Received 3 September 2010 Received in revised form 14 March 2011 Accepted 26 April 2011 Available online 28 May 2011 Keywords: Denitrification potential N2O mole fractions Subsoil Greenhouse gas Nitrate leaching Grassland a b s t r a c t Understanding subsurface denitrification potential will give greater insights into landscape nitrate (NO 3 − ) delivery to groundwater and indirect nitrous oxide (N 2 O) emissions to the atmosphere. Potential deni- trification rates and ratios of N 2 O/(N 2 O + N 2 ) were investigated in intact soil cores collected from 0–0.10, 0.45–0.55 and 1.20–1.30 m depths representing A, B and C soil horizons, respectively from three randomly selected locations within a single intensively managed grazed grassland plot in south eastern Ireland. The soil was moderately well drained with textures ranging from loam to clay loam (gleysol) in the A to C horizon. An experiment was carried out by amending soils from each horizon with (i) 90 mg NO 3 − –N as KNO 3 , (ii) 90 mg NO 3 − –N + 150 mg glucose-C, (iii) 90 mg NO 3 − –N + 150 mg DOC (dissolved organic car- bon, prepared using top soil of intensively managed grassland) kg −1 dry soil. An automated laboratory incubation system was used to measure simultaneously N 2 O and N 2 , at 15 ◦ C, with the moisture content raised by 3% (by weight) above the moisture content at field capacity (FC), giving a water-filled pore space (WFPS) of 80, 85 and 88% in the A, B and C horizons, respectively. There was a significant effect (p < 0.01) of soil horizon and added carbon on cumulative N 2 O emissions. N 2 O emissions were higher from the A than the B and C horizons and were significantly lower from soils that received only nitrate than soils that received NO 3 − + either of the C sources. The two C sources gave similar N 2 O emissions. The N 2 fluxes differed significantly (p < 0.05) only between the A and C horizons. During a 17-day incubation, total denitrification losses of the added N decreased significantly (p < 0.01) with soil depth and were increased by the addition of either C source. The fraction of the added N lost from each horizon were A: 25, 61, 45%; B: 12, 29, 28.5% and C: 4, 20, 18% for nitrate, nitrate + glucose-C and nitrate + DOC, respectively. The ratios of N 2 O to N 2 O + N 2 differed significantly (p < 0.05) only between soil horizons, being higher in the A (0.58–0.75) than in the deeper horizons (0.10–0.36 in B and 0.06–0.24 in C), clearly indicating the potential of subsoils for a more complete reduction of N 2 O to N 2 . Stepwise multiple regression analysis revealed that N 2 O flux increased with total organic C and total N but decreased with NO 3 − –N which together explained 88% of the variance (p < 0.001). The N 2 flux was best explained (R 2 = 0.45, p < 0.01) by soluble organic nitrogen (SON) (positive) and with NO 3 − –N (negative). Stepwise multiple regression revealed a best fit for total denitrification rates which were positive for total C and negative for NO 3 − –N with the determination coefficient of 0.76 (p < 0.001). The results suggest that without C addition, potential deni- trification rate below the root zone was low. Therefore, the added C sources in subsoils can satisfactorily increase nitrate depletion via denitrification where the mole fraction of N 2 O would be further reduced to N 2 during diffusional transport through the soil profile to the atmosphere and/or to groundwater. Subsoil denitrification can be accelerated either through introducing C directly into permeable reactive barriers and/or indirectly, by irrigating dirty water and manipulating agricultural plant composition and diversity. © 2011 Elsevier B.V. All rights reserved. ∗ Corresponding author. Tel.: +353 053 9171200; fax: +353 053 9142213. E-mail address: [email protected] (K.G. Richards). 1. Introduction An excess of N in the environment is viewed as an escalat- ing global threat, due to its impacts on groundwater quality and the atmosphere (Stark and Richards, 2008). Soils under grazed 0167-8809/$ – see front matter © 2011 Elsevier B.V. All rights reserved. doi:10.1016/j.agee.2011.04.015

Welcome message from author
This document is posted to help you gain knowledge. Please leave a comment to let me know what you think about it! Share it to your friends and learn new things together.
Transcript

Dt
MMa
b
c
d
e
a
ARRAA
KDNSGNG
0d
Agriculture, Ecosystems and Environment 147 (2012) 13– 23
Contents lists available at ScienceDirect
Agriculture, Ecosystems and Environment
jo ur n al homepage: www.elsev ier .com/ lo cate /agee
enitrification potential in subsoils: A mechanism to reduce nitrate leachingo groundwater
.M.R. Jahangira,b, M.I. Khalil a,c, P. Johnstonb, L.M. Cardenasd, D.J. Hatchd, M. Butlerd,
. Barrette, V. O’flahertye, K.G. Richardsa,∗
Teagasc Environment Research Centre, Johnstown Castle, Co. Wexford, IrelandDepartment of Civil, Structural & Environmental Engineering, Museum Building, University of Dublin-Trinity College, Dublin 2, IrelandUniversity College Dublin/Environmental Protection Agency, Johnstown Castle Estate, Wexford, IrelandRothamsted Research, North Wyke, Okehampton, Devon EX20 2SB, UKMicrobial Ecology Laboratory, Microbiology, School of Natural Sciences and Ryan Institute for Environment, Marine and Energy, NUI Galway, Galway, Ireland
r t i c l e i n f o
rticle history:eceived 3 September 2010eceived in revised form 14 March 2011ccepted 26 April 2011vailable online 28 May 2011
eywords:enitrification potential2O mole fractionsubsoilreenhouse gasitrate leachingrassland
a b s t r a c t
Understanding subsurface denitrification potential will give greater insights into landscape nitrate (NO3−)
delivery to groundwater and indirect nitrous oxide (N2O) emissions to the atmosphere. Potential deni-trification rates and ratios of N2O/(N2O + N2) were investigated in intact soil cores collected from 0–0.10,0.45–0.55 and 1.20–1.30 m depths representing A, B and C soil horizons, respectively from three randomlyselected locations within a single intensively managed grazed grassland plot in south eastern Ireland. Thesoil was moderately well drained with textures ranging from loam to clay loam (gleysol) in the A to Chorizon. An experiment was carried out by amending soils from each horizon with (i) 90 mg NO3
−–N asKNO3, (ii) 90 mg NO3
−–N + 150 mg glucose-C, (iii) 90 mg NO3−–N + 150 mg DOC (dissolved organic car-
bon, prepared using top soil of intensively managed grassland) kg−1 dry soil. An automated laboratoryincubation system was used to measure simultaneously N2O and N2, at 15 ◦C, with the moisture contentraised by 3% (by weight) above the moisture content at field capacity (FC), giving a water-filled pore space(WFPS) of 80, 85 and 88% in the A, B and C horizons, respectively. There was a significant effect (p < 0.01)of soil horizon and added carbon on cumulative N2O emissions. N2O emissions were higher from the Athan the B and C horizons and were significantly lower from soils that received only nitrate than soilsthat received NO3
− + either of the C sources. The two C sources gave similar N2O emissions. The N2 fluxesdiffered significantly (p < 0.05) only between the A and C horizons. During a 17-day incubation, totaldenitrification losses of the added N decreased significantly (p < 0.01) with soil depth and were increasedby the addition of either C source. The fraction of the added N lost from each horizon were A: 25, 61,45%; B: 12, 29, 28.5% and C: 4, 20, 18% for nitrate, nitrate + glucose-C and nitrate + DOC, respectively. Theratios of N2O to N2O + N2 differed significantly (p < 0.05) only between soil horizons, being higher in the A(0.58–0.75) than in the deeper horizons (0.10–0.36 in B and 0.06–0.24 in C), clearly indicating the potentialof subsoils for a more complete reduction of N2O to N2. Stepwise multiple regression analysis revealedthat N2O flux increased with total organic C and total N but decreased with NO3
−–N which togetherexplained 88% of the variance (p < 0.001). The N2 flux was best explained (R2 = 0.45, p < 0.01) by solubleorganic nitrogen (SON) (positive) and with NO3
−–N (negative). Stepwise multiple regression revealed abest fit for total denitrification rates which were positive for total C and negative for NO3
−–N with the
determination coefficient of 0.76 (p < 0.001). The results suggest that without C addition, potential deni-trification rate below the root zone was low. Therefore, the added C sources in subsoils can satisfactorilyincrease nitrate depletion via denitrification where the mole fraction of N2O would be further reduced toN2 during diffusional transport through the soil profile to the atmosphere and/or to groundwater. Subsoildenitrification can be accelerated either through introducing C directly into permeable reactive barriersand/or indirectly, by irrigating dirty water and manipulating agricultural plant composition and diversity.∗ Corresponding author. Tel.: +353 053 9171200; fax: +353 053 9142213.E-mail address: [email protected] (K.G. Richards).
167-8809/$ – see front matter © 2011 Elsevier B.V. All rights reserved.oi:10.1016/j.agee.2011.04.015
© 2011 Elsevier B.V. All rights reserved.
1. Introduction
An excess of N in the environment is viewed as an escalat-ing global threat, due to its impacts on groundwater quality andthe atmosphere (Stark and Richards, 2008). Soils under grazed

1 system
gieLtTcfFvupfldosnbYcf
gtr2tCdrisettc2awNt1isota
dNat((fitGaoh2cif
4 M.M.R. Jahangir et al. / Agriculture, Eco
rassland often have high concentrations of nitrate (NO3−), aris-
ng from the application of mineral fertilizers, slurries, animalxcreta and from the native soil organic matter (Foster, 2000).arge amounts of N transferred within the soil system increasehe potential and the opportunities for NO3
− losses (Davies, 2000).he average leaching losses of NO3
− from terrestrial ecosystems inentral Europe is 15 kg N ha−1 y−1 (Werner, 1994). Nitrate trans-ormation in the root zone is well documented (Ibendahl andleming, 2007), but its movement and transformations in pre-ailing geochemical conditions below the root zone are less wellnderstood (Jarvis and Hatch, 1994). The added NO3
− can be trans-orted through percolating water and transformed to gaseousorms, thereby leaving agricultural systems, or may be lost througheaching and runoff (Clough et al., 2005). Substantial quantities ofissolved inorganic N, particularly NO3
−, are exported through lowrder streams (Alexander et al., 2000). Nitrate contamination ofurface water and groundwater is common in watersheds domi-ated by agricultural activities (Townsend et al., 2003), primarilyecause of diffuse pollution from intensive farming (Foster andoung, 1980). Denitrification is one of the most important pro-esses that can control the quantity of nitrate available for leachingrom soil to water (Jarvis, 2000).
Denitrification is the mainly microbial reduction of NO3− to the
aseous products nitric oxide (NO), nitrous oxide (N2O) or dini-rogen (N2). This process is an important mechanism for nitrateemoval in a variety of suboxic environments (Seitzinger et al.,006). Some studies have shown that the highest rates of deni-rification occur in the upper soil horizon (Clement et al., 2002;osandey et al., 2003; Kustermann et al., 2010), the extent of whichepends on moisture levels (Khalil and Baggs, 2005). Recently,esearchers have found microbial ‘hot spots’ with significant den-trification activity in patches of organic rich subsoils at depths ofeveral meters (Hill et al., 2004) and in urine treated subsoils (Dixont al., 2010). Subsoil denitrification has been suggested as an impor-ant mechanism for the removal of excess NO3
− before leachingo groundwater, transport within saturated subsoil zones, or dis-harge to surface aquifers via subsurface drainage (Fenton et al.,009; Sotomayor and Rice, 1996). Denitrification not only servess a natural pathway for the elimination of excess NO3
− in soil andater (Ellis et al., 1975), but also contributes to the emissions of2O, a potent greenhouse gas (Knowles, 1982) and an indirect con-
ributor to the depletion of ozone (O3) in the stratosphere (Crutzen,970). An interesting feature of denitrification in subsurface soils
s that it is likely to be overlooked as a contributor to global atmo-pheric N2O concentrations, due to the possible further reductionf N2O to N2 under O2 limited conditions during upward diffusionhrough the soil profile, if adequate sources of organic carbon (C)re present (Elmi et al., 2003; Castle et al., 1998).
The beneficial effect to the environment of NO3− removal by
enitrification depends on the partitioning of its end-products into2O and N2. Knowledge of the denitrification gaseous end-productsnd the N2O/(N2O + N2) ratio is necessary to assess accuratelyhe environmental consequences of the denitrification processElmi et al., 2003), with emphasis on the subsoil environmentBergsma et al., 2002). The lack of information on N2 emissionsrom terrestrial ecosystems not only limits our understanding ofts significance as a sink for reactive N, but also impedes the quan-ification of the process as a whole (Davidsson and Seitzinger, 2006;roffman et al., 2006) so that N budgets in biogeochemical modelsre incomplete (Boyer et al., 2006). To date, only a few estimatesf denitrification in the subsoils of riparian wetlands and peat soilsave been reported (Casey et al., 2001; Dhondt et al., 2004; Hill et al.,
000, 2004; Well et al., 2001). Depending on the environmentalonditions, the mechanisms and magnitude of denitrification lossesn subsoils of grazed grassland may however, deviate considerablyrom those of other sites warranting further investigation unders and Environment 147 (2012) 13– 23
grassland ecosystems. The relative importance of the denitrifica-tion process depends strongly on certain environmental conditionsincluding O2 concentration, NO3
− content and C availability (Tiedje,1988), though their influences on the mole fractions of N2O andN2 in agricultural soils are still under debate, with little consensus(Venterea et al., 2005). Where organic C is added, a significant den-itrifying potential may be revealed at depths as great as 7 m (Jarvisand Hatch, 1994; McCarty and Bremner, 1992).
A lack of organic C to provide energy to denitrifiers is usuallyidentified as the major factor limiting denitrification rates (Devitoet al., 2000; Pabich et al., 2001). More precisely, the quality andquantity of the C source is most often more important than totalorganic C due to its variable availability to microbes (Ciarlo et al.,2007). The specific contribution of the different C sources availableto denitrifying micro-organisms has not been defined (Beauchampet al., 1989). Therefore, knowledge of the factors controlling thedenitrification process and, more specifically the N2O/(N2O + N2)ratios, are crucial to improve our understanding of the extent ofcomplete reduction of NO3
− via denitrification occurring in sub-soil environments. Concerning health and environmental hazardsof NO3
− and the global warming potential of N2O, we hypothe-sized that the addition of a readily available source of C (glucose)would enhance the reduction of N2O to N2 in subsoils and show alower N2O/(N2O + N2) ratio in amended soils than in unamendedsoils. The main objectives of this research were (a) to measure thepotential denitrification rates in subsoils under optimized substrateand moisture conditions and (b) to investigate the relationshipsbetween soil properties and maximum denitrification rates andratios of N2O/N2O + N2.
2. Materials and methods
2.1. Study site characteristics
Soil samples were collected in January 2008 (winter) from threerandomly selected locations within a single intensively managedgrazed grassland plot at the dairy farm of Teagasc EnvironmentResearch Centre, Johnstown Castle, Wexford, Ireland (52.3342◦N,−6.4575◦W). The soil textures of a profile up to 1.3 m depth variedfrom loam to clay loam (Brown Earth) overlying Ordovician sedi-ments of sandstone and shale. Soil physical and chemical propertiesincluding the initial nitrate content of three horizons at the experi-mental site are presented in Table 1. The average groundwater tableis below 1.2 m during winter and below 2.0 m during summer. Ona yearly average, 24 cows graze the land for a total of 50 days andabout 375 kg N ha−1 y−1 is harvested in total by one silage cut andofftake by grazing animals. The total annual N inputs are about450 kg N ha−1 from inorganic fertilizers, animal excrement and Ndeposition.
2.2. Soil sampling
Intact soil cores (45) were collected from three depths (0–0.10,0.45–0.55 and 1.20–1.30 m), representing the A, B and C horizons,of the soil profile. Stainless steel cylinders (0.12 m × 0.15 m) weremanually inserted up to 0.02 m below the top rim of the core (with a0.02 m wooden spacer inside the corer) using a percussion hammerinto the soil after trimming off the swards to sample the sur-face/upper horizon (0–0.10 m) and then a hole was dug around thecylinder to assist removal, giving each core a size of 0.1 m × 0.15 m.The two other (deeper) horizons were sampled from the same loca-tions by first removing the soil from the upper horizons. Fine mesh
netting was placed over the top and bottom of the cylinders to con-tain the soil and kept in place using rubber bands at both ends. Soilsamples were stored immediately after collection in a cold room at4 ◦C and transported to Rothamsted Research, North Wyke, UK, in
M.M.R. Jahangir et al. / Agriculture, Ecosystem
Tab
le
1R
ange
s
(min
–max
)
of
soil
ph
ysic
al
and
chem
ical
pro
per
ties
of
the
exp
erim
enta
l sit
e
(n
=
5).
Soil
hor
izon
Sam
pli
ng
dep
th(m
)D
rain
agea
Text
ure
Dry
bulk
den
sity
(g
cm−3
)p
H
(H2O
)
NO
3−
–N(m
g
kg−1
)N
H4
+–N
(mg
kg−1
)To
tal N
(mg
kg−1
)O
rgan
ic
C(%
)M
oist
ure
at
FCa
(%)
Moi
stu
re
atM
WH
Ca
(%)
A
0–0.
10
MW
D
Loam
1.21
–1.3
2
5.71
–6.9
7
5.5–
6.0
3.5–
5.5
2950
–320
0
2.80
–2.9
0 38
–42
39–4
5B
0.45
–0.5
5
MW
D-P
D
Loam
–cla
y–lo
am
1.45
–1.5
5
5.47
–6.6
4
3.0–
3.5
2.5–
3.5
1000
–105
0
0.78
–0.8
2 24
–30
26–3
3C
1.20
–1.3
0
PD-I
D
Cla
y
loam
–cla
y
1.50
–1.6
4
4.58
–5.6
4
2.0–
2.5
1.5–
3.0
390–
395
0.20
–0.2
5
22–2
4
24–2
5
aM
WD
–
mod
erat
ely
wel
l dra
ined
, PD
–
poo
rly
dra
ined
, ID
–
imp
erfe
ctly
dra
ined
;
FC
–
fiel
d
cap
acit
y;
MW
HC
–
max
imu
m
wat
er
hol
din
g
cap
acit
y.
s and Environment 147 (2012) 13– 23 15
insulated boxes and then stored at 4 ◦C until the commencementof experiments.
2.3. Soil core preparation and amendment
Three sets of 12 cores (3 horizons with 4 replications)were used where all of the soil cores were amended withnitrate (90 mg NO3
−–N kg−1 as KNO3) and the treatments con-sisted of: (T1) a control (without C), (T2) 150 mg glucose-Ckg−1, and (T3) 150 mg DOC-C kg−1. Nitrate was supplied to ensurean adequate source of substrate for denitrification, and the controlwas taken to differentiate the effect of the added carbon sourceson denitrification. The nitrate rate, assuming negligible inhibitionto microbial activity, was selected based on the reports of largeleaching losses (50–200 kg NO3–N ha−1) from intensively grazedand/or fertilized pasture (Cameron and Haynes, 1986; Jarvis, 2000;Scholefield et al., 1993; Ledgard et al., 1996) and soil solutionNO3
−–N concentrations greater than 100 mg L−1 under maize crop-ping (Perego et al., 2012). The water soluble organic carbon (WSOC)in the A, B and C horizons was 80, 50 and 24 mg C L−1, respec-tively. During maximum water holding capacity (MWHC) and FCmeasurements, water saturation and drain-out may cause lossesof indigenous WSOC and NO3
−. Therefore, an enhanced amountof C and N were added to compensate for losses and also ensuredthat the denitrifiers were potentially active with readily availablesubstrate.
Each of the three treatment sets of cores was incubated con-secutively while maintaining exactly the same conditions. Duringeach incubation, 12 soil cores were weighed and placed in a plastictray of approximately 0.6 m length × 0.5 m width × 0.25 m heightand water was added slowly to bring the water level to 3 cm belowthe top of soil. After 24 h, fine mess was placed over both ends ofthe core to prevent soil loss and then the soil core was placed ona fine screen metal sieve fixed to a wooden frame, allowing waterto drain out for 30 min so as to achieve MWHC of the soil (Karimet al., 1988; Scharenbroach, 2010). After weighing, the soil coreswere kept covered to limit evaporation and were allowed to drainwater by gravitation for 48 h and weighed again to estimate the fieldcapacity (FC) of the soil (Karim et al., 1988; Scharenbroach, 2010).The amendment solutions were prepared with an amount of waterrequired to maintain the soil WFPS levels at a moisture content of3% above the moisture content at FC: ca. 80, 85 and 88% for the soilscollected from A, B and C horizons, respectively. Potential denitri-fication rates require approximately anaerobic conditions (greaterthan 80% WFPS). Because the existing field conditions would havehigher O2 concentrations in the top soil than the subsoils, the WFPSsimposed for this study were chosen to reflect these relative differ-ences as considered most closely appropriate.
2.4. Preparation of dissolved organic C (DOC) solution used
Surface soils (1 kg) from grazed grassland were collected;herbage, roots, stones and other extraneous materials wereremoved. Subsequently, 100 g soil was placed into a 500 ml plas-tic bottle and 150 ml deionised water was added (1:1.5, v/v ratio).The bottle was shaken mechanically for 1 h. The supernatant wasremoved following sedimentation, and was centrifuged for 30 minat 2500 rpm; filtered using filter paper (Whatman No. 41) and DOCwas measured using a TOC analyser (TOC-Vcph/cpn; ShimadzuCorporation, Kyoto, Japan). The NO3
− and NH4+ concentrations
being 1.5 and 2.2 mg kg−1, respectively were negligible, but werededucted from the amendment added to soil cores.
2.5. Soil core pre-incubation, incubation and data recording
The denitrification study was carried out by incubating the soilcores at 15 ◦C, for 17 days, in an automated laboratory incubation
1 system
sepiloHEvsmFm(wrTivtobaotwnzmwcwmwafiNatG
sTihideenpr
2
abiaoipNse
6 M.M.R. Jahangir et al. / Agriculture, Eco
ystem installed at the research centre at North Wyke (Cardenast al., 2003; Scholefield et al., 1997). The incubation system com-rised a 1.3 m3 temperature controlled cabinet containing 12
ncubation vessels (each fitted with an amendment vessel) and gasines. In order to measure N2 production, incubations were carriedut in a He + O2 atmosphere as described by Cardenas et al. (2003).eadspace temperatures inside the vessels were logged hourly.ach of 12 soil cores was then placed inside a cylindrical incubationessel to an exact fit. A mixture of He + O2 was passed through theoil core (via the base of the vessel) in order to purge (flow-throughode) the soil atmosphere, headspace and all N2 gas lines for 24 h.
low rates of a He + O2 mixture (20 ml min−1) were regulated usingass flow controllers to provide an O2 concentration of ca. 20%
Scholefield et al., 1997; Cardenas et al., 2003). The He + O2 mixtureas then directed to the vessel via the lid (flow-over mode) after
educing the flow rate to 10 ml min−1 and O2 level to 15% for 72 h.he effluent gases from each vessel were passed through an outletn the lid of the incubation vessels to an actuated 16-port selectionalve to split and direct the gas stream from each outlet column towo gas chromatographs (GCs) (automatic sample feeding). Flow-ver continued for 72 h until the measured N2 levels had reached aaseline. After replacement of the atmosphere within the soil cores,mendments were added via a secondary vessel, fitted to the centref each lid, by flushing with He (to avoid any atmospheric N2 con-amination during amendment). The amendment in the soil coresas found to be well distributed based on subsequent analyses ofine sub-samples from each core from three vertical and three hori-ontal sections. The technique allowed the direct and independenteasurement of N2O and N2 fluxes from each incubation vessel,hich permitted an exact measurement of denitrified gas con-
entrations. Continuous recording of N2O and N2 concentrationsere automated at a frequency of approximately 12 measure-ents per day using Shimadzu GC throughout the experiment. N2Oas detected by Electron Capture Detector (ECD) with separation
chieved by a stainless steel packed column (2 m long, 4 m bore)lled with ‘Porapak Q’ (80–100 mesh) and using N2 as a carrier gas.2 was detected by He Ionization Detector (HID) with separationchieved by a PLOT column (30 m long, 0.53 mm i.d.), with He ashe carrier gas. The software ‘Kontron’ (Kontron Electronic, Munich,ermany) was used to measure the concentration of effluent gases.
Scholefield et al. (1997) found that this technique is particularlyuited to an investigation into the effects of O2 concentration per se.hey observed O2 concentrations negatively correlated with WFPSn the automated technique of a denitrification study. Therefore,igher WFPS in subsoil horizons (85–88%) than in A horizon (80%)
ndicated lower O2 contents. The technique prevented further O2iffusion from headspace into soil cores, because no changes in thestimated water contents (measured at the initial, highest peak andnd of the experiment) was observed. This provided evidence thato air exchange into the soil cores occurred during the incubationeriod and predicted that microbiological compositions remainedelatively unaltered throughout the experimental period.
.6. Physical and chemical analyses
In addition to the three treatment sets of cores (36 in total), andditional three cores from each horizon (9 cores) were sampledefore pre-incubation. Another three cores were removed from
ncubation on the day following the highest recorded N2O peaknd before the N2 peak was attained (this left three replicates outf the four original treatment sets to continue until the end of thencubation). At the end of each experiment, all soil cores were pre-
ared for physical and chemical analyses. Pre-incubation, at peak2O and N2 emission points and at the end of incubations, soil sub-amples were taken for microbial analysis, as described by Barrettt al. (2010). Soil moisture content was measured gravimetrically
s and Environment 147 (2012) 13– 23
after drying for 24 h at 105 ◦C. Dry bulk density (BD) was deter-mined by a soil core method, using the oven dry weight of soil andthe known volume of the soil corer. Soil mineral N as ammonium(NH4
+) and nitrate (NO3−) were analysed using an Aquakem 600
Discrete Analyser (Askew and Smith, 2005; Standing Committee ofAnalysts, 1981) after extraction with 2 M KCl in 1:2.5 (w:w) of soiland KCl solution. The WSOC was analysed on a TOC Analyser (TOC-Vcph/cpn; Shimadzu Corporation, Kyoto, Japan) after extractionwith deionised water (soil water ratio 1:2.5). The WSOC extractswere first used to measure pH and then centrifuged at 1500 rpm for30 min and then filtered through a 0.45 �m filter. Soil total organicC and N were determined by dry combustion analysis (Leco CNS2000 analyzer; Leco Corporation, USA). The SON was calculated bysubtracting total inorganic nitrogen from total nitrogen as per vanKessel et al. (2009).
2.7. Calculation of potential denitrification
Denitrification potential is defined as the denitrification rateunder anaerobic condition with abundant NO3
− (Aulakh et al.,1992) and available organic C as an energy source for denitri-fying organisms (Well and Myrold, 2002). N2O and N2 fluxes(mg N kg−1 dry soil d−1) were calculated from the concentrationscontinuously measured by the GC during the entire incuba-tion period. Approximately 12 measurements were recorded persample per day and averaged to express flux as mg kg−1 d−1. Den-itrification rates and total denitrification (TDN) losses of added Nwere calculated from the N2O and N2 fluxes. The N2O mole fractionswere calculated using N2O fluxes and the total fluxes of N2O andN2 [N2O/(N2O + N2)]. All the calculated results were then comparedfor three soil depths and treatments.
2.8. Statistical methods
All statistical analyses were performed using SPSS 16 (SPSSInc., USA). Because variables were log normally distributed, a logtransformation was applied. The residual checks confirmed theassumptions of the analyses and the homogeneity of varianceswithin each treatment. A 2-way ANOVA was carried out to dis-tinguish treatment and depths effects on the data at maximumfluxes, mean and cumulative emissions of N2O, N2, N2O + N2 andon the N2O/(N2O + N2) ratios over the incubation period with treat-ment and soil depths as fixed factors following univariate analysisunder a General Linear Model. Multiple comparisons test betweenindividual treatment and depth effects were carried out using theBonferroni Post Hoc test. Simple and multiple linear regressions(stepwise) analyses using the data points at the highest flux stagewere carried out to test relationships between potential denitri-fication rates and soil properties (soil pH, NH4
+, NO3−, total N,
organic N, inorganic N, WSOC, total C and organic C) after convert-ing all non-normal data to log-transformed data. For correlationand regression study we used soil cores at maximum emissionsunder all treatments because our interest was to see the changes insome soil physico-chemical properties at the very moment of maxi-mum denitrification. For this, we removed additional soil cores (oneor two for each treatment and depth) during maximum denitrifi-cation from the incubation chamber for each depth in each run. Astatistical probability of p < 0.05 was considered significant for alltests.
3. Results
3.1. N2O and N2 fluxes
Mean fluxes of N2O varied significantly between treatments(p < 0.01), soil horizons (p < 0.001) and the interaction of treatments
M.M.R. Jahangir et al. / Agriculture, Ecosystems and Environment 147 (2012) 13– 23 17
(a)
0
2
4
6
8
10
12
0 2 4 6 8 10 12 14 16Days since ame ndme nt
N2O
flux
(mg
N k
g-1d-1
) T1T2T3
(b)
0.00.30.50.81.01.31.51.82.0
0 2 4 6 8 10 12 14 16Days since amendment
N2O
flux
(mg
N k
g-1d-1
)
T1T2T3
(c)
0.0
0.2
0.4
0.6
0.8
1.0
0 2 4 6 8 10 12 14 16Days since amendmnet
N2O
flux
(mg
N k
g-1d-1
) T1T2T3
(d)
0.0
0.5
1.0
1.5
2.0
0 2 4 6 8 10 12 14 16Days since amend ment
N2 f
lux
(mg
N k
g-1d-1
)
T1T2T3
(e)
0.00.51.01.52.02.53.03.54.0
0 2 4 6 8 10 12 14 16Days since amendment
N2 f
lux
(mg
N k
g-1d-1
)
T1T2T3
(f)
0.0
0.5
1.0
1.5
2.0
2.5
3.0
0 2 4 6 8 10 12 14 16Days since amendment
N2 f
lux
(mg
N k
g-1d-1
)T1T2T3
(c, f)
aatCphtetsa
TM
Fig. 1. N2O and N2 fluxes from three different soil horizons, A (a, d); B (b, e) and C
nd soil horizons (p < 0.05) (Fig. 1). The maximum N2O fluxes thatppeared during the incubation period varied significantly betweenreatments (p < 0.001) and depths (p < 0.001). The nitrate + glucose-
(T2) and nitrate + DOC (T3) treatments showed the highesteaks for N2O fluxes on day 1 after the amendment in the Aorizon (9.91 and 7.22 mg N kg−1 dry soil for T2 and T3, respec-ively). Though smaller (1.28 mg N kg−1 dry soil), the maximum
missions in the nitrate only (T1) treatment were delayed forwo days. The maximum peaks were several-fold lower in theubsoils (B and C horizons), ranging from 0.07–0.22, 0.20–0.44nd 0.47–1.04 (mg N kg−1 dry soil) for T1, T2 and T3 treatmentsable 2ean and cumulative N2O and N2 fluxes/emissions at various soil horizons as affected by
Treatment Soil horizon N2O
Cumulative emissions (mg N kg−1) Flux rate (
T1: NO3− only A 13.05 0.77
B 1.27 0.07
C 0.67 0.04
T2: NO3− + Glucose-C A 40.52 2.38
B 2.54 0.15
C 0.99 0.06
T3: NO3− + DOC A 23.81 1.40
B 9.21 0.54
C 1.59 0.09
as influenced by nitrate only (T1); nitrate + glucose C, (T2) and nitrate + DOC, (T3).
respectively, compared with the A horizon and observed betweenday 4 and 8 of incubation. Similarly, mean N2O fluxes overthe incubation period were significantly (p < 0.001) greater inthe A horizon (0.77–2.38 mg N kg−1 d−1) than in the subsoilhorizons (0.07–0.54 mg N kg−1 d−1); the lowest being in the Chorizon (Table 2). Overall, the soil cores amended with nitrateonly (T1) displayed significantly (p < 0.01) lower cumulative N2O
emissions than the T2 and T3 treatments, whereas it wasconsistently (p > 0.05) higher in the treatment with glucose-C(40.5 mg N kg−1) than with DOC (23.8 mg N kg−1). Despite lowemissions, subsoils that received DOC enhanced N2O emissionsN and C sources during the 17-day incubation period (n = 3).
N2
mg N kg−1 d−1) Cumulative emissions (mg N kg−1) Flux rate (mg N kg−1 d−1)
9.35 0.559.01 0.532.15 0.13
13.56 0.8023.60 1.3915.70 0.9216.69 0.9816.30 0.9613.90 0.82
1 systems and Environment 147 (2012) 13– 23
b(
twCTnhnzhb0I0flhIA(
3
reBspnffaf1matzaasatC
3
doat
3
ponraRoe
Fig. 2. Cumulative denitrification (N O + N ) (a), percentage losses of the applied N
8 M.M.R. Jahangir et al. / Agriculture, Eco
ut did not differ significantly from those that received glucose-CTable 2).
The treatment and soil depth had pronounced effects on theime course of N2 fluxes (Fig. 1). In the A horizon, the highest peakas observed on day 6 after amendment with nitrate + glucose-
and nitrate + DOC (1.03 and 1.29 mg N kg−1 dry soil in T2 and3, respectively) and on day 5 of incubation when treated withitrate only (0.96 mg N kg−1 dry soil). In subsurface horizons, theighest peaks were observed on day 1 after amendment withitrate only (0.66, and 0.38 mg N kg−1 dry soil at B and C hori-ons), but it was delayed by 4–7 days in the treatment thatad C. The mean N2 fluxes only differed significantly (p < 0.05)etween the A and C horizons. In the A horizon, it ranged from.55 mg N kg−1 d−1 in T1 to 0.98 mg N kg−1 d−1 in T3 (Table 2).n the C horizon, it varied from 0.13 mg N kg−1 d−1 in T1 to.92 mg N kg−1 d−1 in T2. Added C did not affect the mean N2ux significantly (p > 0.05). The T2 treatment showed consistentlyigher emissions than T3 though the difference was not significant.
n contrast to the subsoil horizons, cumulative N2 emissions in the horizon were higher with added DOC than with added glucose-C
Table 2).
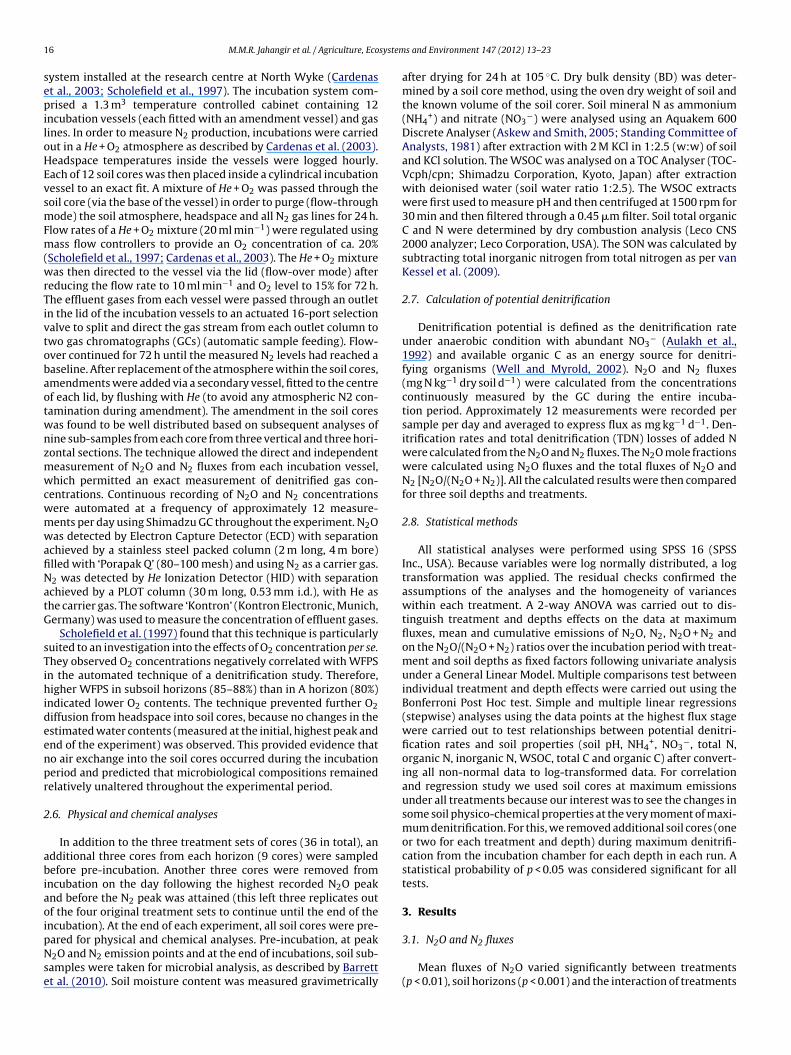
.2. Total denitrification rates and the losses of added nitrogen
The TDN (N2O + N2) rate significantly (p < 0.05) differed withegards to soil depth and treatments (Fig. 2a). Cumulative TDNmissions were significantly higher in the A horizon than in the
(p < 0.05) and C (p < 0.01) horizons, but the latter two were nottatistically different from each other. Considering multiple com-arisons between the treatments, the soil cores amended withitrate alone (T1) showed significantly (p < 0.01 for T2 and p < 0.05
or T3) lower TDN emissions (ca. 22.4, 10.3 and 2.82 mg N kg−1
rom A, B and C horizons, respectively) than the same horizonsmended with either glucose-C (ca. 54.1, 26.2 and 16.7 mg N kg−1
or A, B and C horizons, respectively) or DOC (ca. 40.5, 25.5 and5.5 mg N kg−1 from A, B and C horizons, respectively). The treat-ent and soil depth significantly affected the percentage losses of
dded N (Fig. 2b). The loss of added NO3−–N from T1, T2 and T3
reatments, respectively were significantly greater in the A hori-on (ca. 25, 60 and 45%) compared with B (p < 0.05) (ca. 12, 29nd 29%) and C (p < 0.01) (ca. 3, 20 and 18%) horizons and the Bnd C horizons also differed significantly (p < 0.05). Addition of Cignificantly increased N losses in T2, nitrate + glucose-C (p < 0.05)nd T3, nitrate + DOC (p < 0.01) compared with the T1, nitrate onlyreatment. There were no significant differences between the two
sources.
.3. Nitrous oxide mole fractions at various soil depths
The mole fractions of N2O varied significantly (p < 0.05) with soilepth but did not differ significantly to either added N with or with-ut C sources (Fig. 2c). The A horizon had significantly (p < 0.05 for Bnd p < 0.01 for C horizons) greater N2O mole fractions (0.58–0.75)han the subsoil horizons (0.06–0.36).
.4. Relationship between denitrification and soil properties
Pearson correlation coefficients between denitrification end-roducts and all the soil-related controlling factors with their levelsf significance are shown in Table 3. As expected, there was a sig-ificant (p < 0.001) positive correlation between N2O flux and TDNates with R2 = 0.95. The N2O mole fractions were also positively
nd significantly correlated with TDN rates and N2O flux, giving2 values of 0.50 and 0.55, respectively. The estimated coefficientsf soil physico-chemical properties were selected as significantxplanatory variables for the models that had the best fit to predict2 2
(b) and N2O mole fractions (c) from three different treatments (see text) and soilhorizons during the 17-day incubation period.
the observed flux following stepwise multiple linear regressions ofpotential denitrification rates and N2O mole fractions during theincubation (summarized in Table 4).
Considering the three soil horizons, a significant positive cor-relation was observed between N2O flux and total organic carbon(p < 0.001) and soil total N (p < 0.05) but a significant negative cor-relation was observed with NO3
−–N (p < 0.001) at the moment ofmaximum emission. The N2 flux was significantly positively corre-lated with SON (p < 0.01) and negatively with NO3
−–N (p < 0.05).The regression model developed for the estimation of N2 emis-sions explained only 45% of the variances of N2 flux (Table 4).The TDN (N2O + N2) showed a significant positive linear relation-ship with total C (p < 0.001), but a significant negative relationship
−
with NO3 –N (p < 0.01). The empirical model developed throughstepwise multiple regression analysis for TDN rates also includedthese variables and explained 76% (adjusted R2 = 0.76) of variances(Table 4). Strong positive relationship was observed for N2O mole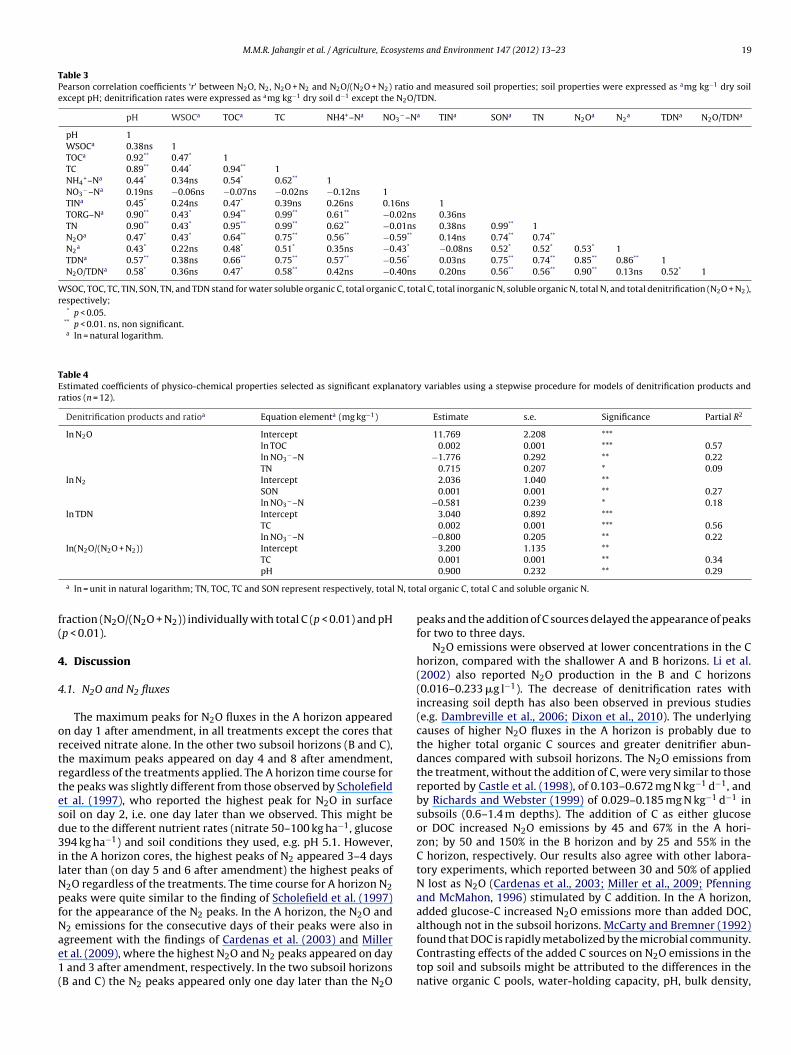
M.M.R. Jahangir et al. / Agriculture, Ecosystems and Environment 147 (2012) 13– 23 19
Table 3Pearson correlation coefficients ‘r’ between N2O, N2, N2O + N2 and N2O/(N2O + N2) ratio and measured soil properties; soil properties were expressed as amg kg−1 dry soilexcept pH; denitrification rates were expressed as amg kg−1 dry soil d−1 except the N2O/TDN.
pH WSOCa TOCa TC NH4+–Na NO3−–Na TINa SONa TN N2Oa N2
a TDNa N2O/TDNa
pH 1WSOCa 0.38ns 1TOCa 0.92** 0.47* 1TC 0.89** 0.44* 0.94** 1NH4
+–Na 0.44* 0.34ns 0.54* 0.62** 1NO3
−–Na 0.19ns −0.06ns −0.07ns −0.02ns −0.12ns 1TINa 0.45* 0.24ns 0.47* 0.39ns 0.26ns 0.16ns 1TORG–Na 0.90** 0.43* 0.94** 0.99** 0.61** −0.02ns 0.36nsTN 0.90** 0.43* 0.95** 0.99** 0.62** −0.01ns 0.38ns 0.99** 1N2Oa 0.47* 0.43* 0.64** 0.75** 0.56** −0.59** 0.14ns 0.74** 0.74**
N2a 0.43* 0.22ns 0.48* 0.51* 0.35ns −0.43* −0.08ns 0.52* 0.52* 0.53* 1
TDNa 0.57** 0.38ns 0.66** 0.75** 0.57** −0.56* 0.03ns 0.75** 0.74** 0.85** 0.86** 1N2O/TDNa 0.58* 0.36ns 0.47* 0.58** 0.42ns −0.40ns 0.20ns 0.56** 0.56** 0.90** 0.13ns 0.52* 1
WSOC, TOC, TC, TIN, SON, TN, and TDN stand for water soluble organic C, total organic C, total C, total inorganic N, soluble organic N, total N, and total denitrification (N2O + N2),respectively;
* p < 0.05.** p < 0.01. ns, non significant.a ln = natural logarithm.
Table 4Estimated coefficients of physico-chemical properties selected as significant explanatory variables using a stepwise procedure for models of denitrification products andratios (n = 12).
Denitrification products and ratioa Equation elementa (mg kg−1) Estimate s.e. Significance Partial R2
ln N2O Intercept 11.769 2.208 ***ln TOC 0.002 0.001 *** 0.57ln NO3
−–N −1.776 0.292 ** 0.22TN 0.715 0.207 * 0.09
ln N2 Intercept 2.036 1.040 **SON 0.001 0.001 ** 0.27ln NO3
−–N −0.581 0.239 * 0.18ln TDN Intercept 3.040 0.892 ***
TC 0.002 0.001 *** 0.56ln NO3
−–N −0.800 0.205 ** 0.22ln(N2O/(N2O + N2)) Intercept 3.200 1.135 **
TC 0.001 0.001 ** 0.34
N, tot
f(
4
4
ortrtesd3ilNpfNae1(
pH
a ln = unit in natural logarithm; TN, TOC, TC and SON represent respectively, total
raction (N2O/(N2O + N2)) individually with total C (p < 0.01) and pHp < 0.01).
. Discussion
.1. N2O and N2 fluxes
The maximum peaks for N2O fluxes in the A horizon appearedn day 1 after amendment, in all treatments except the cores thateceived nitrate alone. In the other two subsoil horizons (B and C),he maximum peaks appeared on day 4 and 8 after amendment,egardless of the treatments applied. The A horizon time course forhe peaks was slightly different from those observed by Scholefieldt al. (1997), who reported the highest peak for N2O in surfaceoil on day 2, i.e. one day later than we observed. This might beue to the different nutrient rates (nitrate 50–100 kg ha−1, glucose94 kg ha−1) and soil conditions they used, e.g. pH 5.1. However,
n the A horizon cores, the highest peaks of N2 appeared 3–4 daysater than (on day 5 and 6 after amendment) the highest peaks of
2O regardless of the treatments. The time course for A horizon N2eaks were quite similar to the finding of Scholefield et al. (1997)or the appearance of the N2 peaks. In the A horizon, the N2O and2 emissions for the consecutive days of their peaks were also in
greement with the findings of Cardenas et al. (2003) and Millert al. (2009), where the highest N2O and N2 peaks appeared on dayand 3 after amendment, respectively. In the two subsoil horizonsB and C) the N2 peaks appeared only one day later than the N2O
0.900 0.232 ** 0.29
al organic C, total C and soluble organic N.
peaks and the addition of C sources delayed the appearance of peaksfor two to three days.
N2O emissions were observed at lower concentrations in the Chorizon, compared with the shallower A and B horizons. Li et al.(2002) also reported N2O production in the B and C horizons(0.016–0.233 �g l−1). The decrease of denitrification rates withincreasing soil depth has also been observed in previous studies(e.g. Dambreville et al., 2006; Dixon et al., 2010). The underlyingcauses of higher N2O fluxes in the A horizon is probably due tothe higher total organic C sources and greater denitrifier abun-dances compared with subsoil horizons. The N2O emissions fromthe treatment, without the addition of C, were very similar to thosereported by Castle et al. (1998), of 0.103–0.672 mg N kg−1 d−1, andby Richards and Webster (1999) of 0.029–0.185 mg N kg−1 d−1 insubsoils (0.6–1.4 m depths). The addition of C as either glucoseor DOC increased N2O emissions by 45 and 67% in the A hori-zon; by 50 and 150% in the B horizon and by 25 and 55% in theC horizon, respectively. Our results also agree with other labora-tory experiments, which reported between 30 and 50% of appliedN lost as N2O (Cardenas et al., 2003; Miller et al., 2009; Pfenningand McMahon, 1996) stimulated by C addition. In the A horizon,added glucose-C increased N2O emissions more than added DOC,although not in the subsoil horizons. McCarty and Bremner (1992)
found that DOC is rapidly metabolized by the microbial community.Contrasting effects of the added C sources on N2O emissions in thetop soil and subsoils might be attributed to the differences in thenative organic C pools, water-holding capacity, pH, bulk density,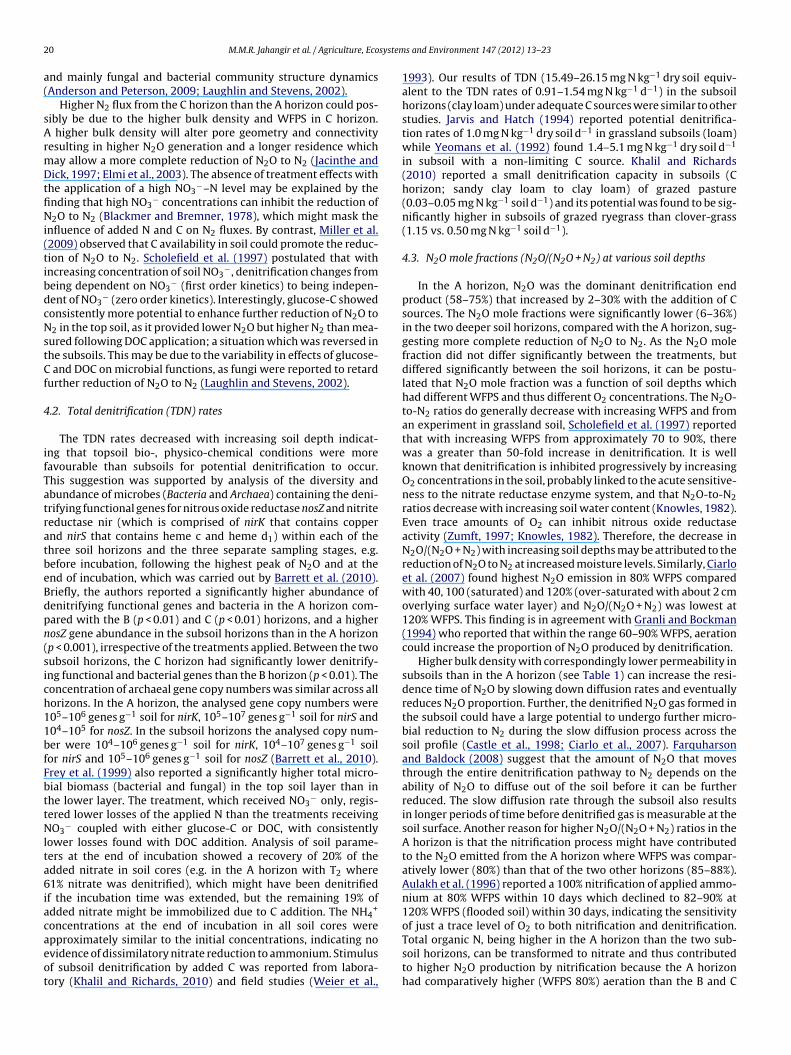
2 system
a(
sArmDtfiNi(tibdcNstCf
4
ifTatratbeBdpn(sich11bfFbttNlta6iacaeot
0 M.M.R. Jahangir et al. / Agriculture, Eco
nd mainly fungal and bacterial community structure dynamicsAnderson and Peterson, 2009; Laughlin and Stevens, 2002).
Higher N2 flux from the C horizon than the A horizon could pos-ibly be due to the higher bulk density and WFPS in C horizon.
higher bulk density will alter pore geometry and connectivityesulting in higher N2O generation and a longer residence whichay allow a more complete reduction of N2O to N2 (Jacinthe andick, 1997; Elmi et al., 2003). The absence of treatment effects with
he application of a high NO3−–N level may be explained by the
nding that high NO3− concentrations can inhibit the reduction of
2O to N2 (Blackmer and Bremner, 1978), which might mask thenfluence of added N and C on N2 fluxes. By contrast, Miller et al.2009) observed that C availability in soil could promote the reduc-ion of N2O to N2. Scholefield et al. (1997) postulated that withncreasing concentration of soil NO3
−, denitrification changes fromeing dependent on NO3
− (first order kinetics) to being indepen-ent of NO3
− (zero order kinetics). Interestingly, glucose-C showedonsistently more potential to enhance further reduction of N2O to2 in the top soil, as it provided lower N2O but higher N2 than mea-
ured following DOC application; a situation which was reversed inhe subsoils. This may be due to the variability in effects of glucose-
and DOC on microbial functions, as fungi were reported to retardurther reduction of N2O to N2 (Laughlin and Stevens, 2002).
.2. Total denitrification (TDN) rates
The TDN rates decreased with increasing soil depth indicat-ng that topsoil bio-, physico-chemical conditions were moreavourable than subsoils for potential denitrification to occur.his suggestion was supported by analysis of the diversity andbundance of microbes (Bacteria and Archaea) containing the deni-rifying functional genes for nitrous oxide reductase nosZ and nitriteeductase nir (which is comprised of nirK that contains coppernd nirS that contains heme c and heme d1) within each of thehree soil horizons and the three separate sampling stages, e.g.efore incubation, following the highest peak of N2O and at thend of incubation, which was carried out by Barrett et al. (2010).riefly, the authors reported a significantly higher abundance ofenitrifying functional genes and bacteria in the A horizon com-ared with the B (p < 0.01) and C (p < 0.01) horizons, and a higherosZ gene abundance in the subsoil horizons than in the A horizonp < 0.001), irrespective of the treatments applied. Between the twoubsoil horizons, the C horizon had significantly lower denitrify-ng functional and bacterial genes than the B horizon (p < 0.01). Theoncentration of archaeal gene copy numbers was similar across allorizons. In the A horizon, the analysed gene copy numbers were05–106 genes g−1 soil for nirK, 105–107 genes g−1 soil for nirS and04–105 for nosZ. In the subsoil horizons the analysed copy num-er were 104–106 genes g−1 soil for nirK, 104–107 genes g−1 soilor nirS and 105–106 genes g−1 soil for nosZ (Barrett et al., 2010).rey et al. (1999) also reported a significantly higher total micro-ial biomass (bacterial and fungal) in the top soil layer than inhe lower layer. The treatment, which received NO3
− only, regis-ered lower losses of the applied N than the treatments receivingO3
− coupled with either glucose-C or DOC, with consistentlyower losses found with DOC addition. Analysis of soil parame-ers at the end of incubation showed a recovery of 20% of thedded nitrate in soil cores (e.g. in the A horizon with T2 where1% nitrate was denitrified), which might have been denitrified
f the incubation time was extended, but the remaining 19% ofdded nitrate might be immobilized due to C addition. The NH4
+
oncentrations at the end of incubation in all soil cores were
pproximately similar to the initial concentrations, indicating novidence of dissimilatory nitrate reduction to ammonium. Stimulusf subsoil denitrification by added C was reported from labora-ory (Khalil and Richards, 2010) and field studies (Weier et al.,s and Environment 147 (2012) 13– 23
1993). Our results of TDN (15.49–26.15 mg N kg−1 dry soil equiv-alent to the TDN rates of 0.91–1.54 mg N kg−1 d−1) in the subsoilhorizons (clay loam) under adequate C sources were similar to otherstudies. Jarvis and Hatch (1994) reported potential denitrifica-tion rates of 1.0 mg N kg−1 dry soil d−1 in grassland subsoils (loam)while Yeomans et al. (1992) found 1.4–5.1 mg N kg−1 dry soil d−1
in subsoil with a non-limiting C source. Khalil and Richards(2010) reported a small denitrification capacity in subsoils (Chorizon; sandy clay loam to clay loam) of grazed pasture(0.03–0.05 mg N kg−1 soil d−1) and its potential was found to be sig-nificantly higher in subsoils of grazed ryegrass than clover-grass(1.15 vs. 0.50 mg N kg−1 soil d−1).
4.3. N2O mole fractions (N2O/(N2O + N2) at various soil depths
In the A horizon, N2O was the dominant denitrification endproduct (58–75%) that increased by 2–30% with the addition of Csources. The N2O mole fractions were significantly lower (6–36%)in the two deeper soil horizons, compared with the A horizon, sug-gesting more complete reduction of N2O to N2. As the N2O molefraction did not differ significantly between the treatments, butdiffered significantly between the soil horizons, it can be postu-lated that N2O mole fraction was a function of soil depths whichhad different WFPS and thus different O2 concentrations. The N2O-to-N2 ratios do generally decrease with increasing WFPS and froman experiment in grassland soil, Scholefield et al. (1997) reportedthat with increasing WFPS from approximately 70 to 90%, therewas a greater than 50-fold increase in denitrification. It is wellknown that denitrification is inhibited progressively by increasingO2 concentrations in the soil, probably linked to the acute sensitive-ness to the nitrate reductase enzyme system, and that N2O-to-N2ratios decrease with increasing soil water content (Knowles, 1982).Even trace amounts of O2 can inhibit nitrous oxide reductaseactivity (Zumft, 1997; Knowles, 1982). Therefore, the decrease inN2O/(N2O + N2) with increasing soil depths may be attributed to thereduction of N2O to N2 at increased moisture levels. Similarly, Ciarloet al. (2007) found highest N2O emission in 80% WFPS comparedwith 40, 100 (saturated) and 120% (over-saturated with about 2 cmoverlying surface water layer) and N2O/(N2O + N2) was lowest at120% WFPS. This finding is in agreement with Granli and Bockman(1994) who reported that within the range 60–90% WFPS, aerationcould increase the proportion of N2O produced by denitrification.
Higher bulk density with correspondingly lower permeability insubsoils than in the A horizon (see Table 1) can increase the resi-dence time of N2O by slowing down diffusion rates and eventuallyreduces N2O proportion. Further, the denitrified N2O gas formed inthe subsoil could have a large potential to undergo further micro-bial reduction to N2 during the slow diffusion process across thesoil profile (Castle et al., 1998; Ciarlo et al., 2007). Farquharsonand Baldock (2008) suggest that the amount of N2O that movesthrough the entire denitrification pathway to N2 depends on theability of N2O to diffuse out of the soil before it can be furtherreduced. The slow diffusion rate through the subsoil also resultsin longer periods of time before denitrified gas is measurable at thesoil surface. Another reason for higher N2O/(N2O + N2) ratios in theA horizon is that the nitrification process might have contributedto the N2O emitted from the A horizon where WFPS was compar-atively lower (80%) than that of the two other horizons (85–88%).Aulakh et al. (1996) reported a 100% nitrification of applied ammo-nium at 80% WFPS within 10 days which declined to 82–90% at120% WFPS (flooded soil) within 30 days, indicating the sensitivityof just a trace level of O2 to both nitrification and denitrification.
Total organic N, being higher in the A horizon than the two sub-soil horizons, can be transformed to nitrate and thus contributedto higher N2O production by nitrification because the A horizonhad comparatively higher (WFPS 80%) aeration than the B and C
system
haaiieiNtorfpc(sibibt
4t
rodoicarg(lIe(esthpti
b(ricstowlt
ao(wat
M.M.R. Jahangir et al. / Agriculture, Eco
orizons (WFPS 85–88%). High N2O/(N2O + N2) ratios are the char-cteristic of fairly well-aerated soils, in which N2O can easily diffuseway, and thus is not further reduced to N2 by denitrifying organ-sms (Webster and Hopkins, 1996). Also the presence of high NO3
−
n top soil can decrease further reduction of N2O to N2 (Bandibast al., 1994). Schlegel (1992) explained this phenomenon by stat-ng that NO3
− is preferred as an electron acceptor with respect to2O. The N2O can also be produced simultaneously by nitrifica-
ion and denitrification (Khalil and Baggs, 2005), so the productionf N2O from nitrification could affect calculated N2O to (N2O + N2)atios (Elmi et al., 2005). These factors result in subsoil conditionsavouring N2 as the dominating end product of denitrification. N2Oroduced by nitrification is prone to be consumed by denitrifi-ation via N2O uptake and reduction by N2O reductase activityDannenmann et al., 2008). Thus, N2O and N2 can be producedimultaneously under adequate supplies of nitrate and C sourcesn the A horizon. On the other hand, subsoil denitrification coulde an important NO3
− removal pathway to limit nitrate contam-nation to surface water and groundwater as well as atmosphericuild-up of N2O, provided that there is an available C source to drivehe denitrification sequence to completion.
.4. Relationships between potential denitrification rates andheir controlling factors
The strong positive relationships of potential denitrificationates with total soil organic C content and not with water-solublerganic C (WSOC) suggests that this fraction is not the only can-idate for an electron donor and that the total organic C containsther C sources, which might also influence denitrification. Sim-larly, Hill and Cardaci (2004) reported a weak and insignificantorrelation between WSOC and denitrification potential in mixednd conifer forest soils. Well et al. (2001) found a positive linearelationship between denitrification and total organic C in a shallowroundwater zone. Richards and Webster (1999) and Brettar et al.2002) also observed a similar relationship in a soil that containedabile C, which was assumed to have been relatively bioavailable.t is likely that the organic C in grassland produced more min-ralisable C fractions which are more important than the WSOCassumed to be equal to DOC) for denitrification to occur. Siemenst al. (2003) revealed that the DOC leached from some agriculturaloils contributed negligibly to the denitrification process becausehe DOC appeared not to be bioavailable. Khalil and Richards (2010),owever, postulated that dissolved organic C, oxidation-reductionotential and the substrates (C and N) load differences betweenhe land uses could regulate the degree of denitrification capac-ty/potential in soils.
Both positive and negative correlations have been reportedetween soil pH and potential denitrification rates (N2O, N2)Scholefield et al., 1997; Brady and Weil, 2002). The activity of N2Oeductase enzyme is generally thought to increase with increas-ng pH values (Chapuis-Lardy et al., 2007). Denitrification itselfan increase pH by releasing CO2 and hydroxide (OH−). However,trongly acidic environments (pH <5) inhibit denitrification andend to arrest the denitrification chain with the formation of nitriter N2O (Brady and Weil, 2002). In our case, the soil was a gleysolith pH values close to 5 in the 1.20–1.30 m soil depth which had
ower denitrifier populations than A horizon affecting overall rela-ionships.
The negative correlation between potential denitrification ratesnd the soil NO3
− content might be attributed to the reductionf NO3
− to N2O and N2 and/or immobilization to some extent
Scholefield et al., 1997), as the NH4+ concentrations at the endere similar to the initial level. Fig. 2 showed that 3–61% of
pplied nitrate converted to N2O + N2 (TDN) through denitrifica-ion, regardless of treatments and soil depths. The NH4
+–N was
s and Environment 147 (2012) 13– 23 21
positively correlated with denitrification rates, whereas total inor-ganic N showed a rather weaker and negative correlation. Thisindicates that NH4
+ was assimilated into the cells of denitrifiersand enhanced both the denitrifying population and activity (Busset al., 2005).
The potential denitrification rates (N2O, N2 and N2O + N2 fluxes)were positively correlated with total N and SON content, the for-mer is in line with the findings of Ciarlo et al. (2007). This indicatesthat soil total N might have provided adequate amounts of NO3
−
and NH4+ to the substrate pool after mineralization. Bandibas
et al. (1994) proposed that N2O emissions were affected by theN2O/(N2O + N2) ratio. Thus, denitrification is a complex processand the soil and environmental factors that influence the processare interrelated. Any variable controlling the N2O emissions canbe a rate-limiting one at different times, depending on particularconditions (Dobbie and Smith, 2003).
There is potential for subsoil denitrification to be enhanced bythe introduction of available C sources into subsoils which can bedirectly or indirectly managed. Fenton et al. (2008) recommendedthe use of C substrates directly in constructed permeable reactivebarriers in subsoils to treat NO3
− contaminated groundwater, butthis is not likely to be cost effective. Manipulation of plant com-position and abundance to increase C leaching might indirectlyenhance subsoil denitrification. For example, in arable systems theuse of cover crops during the winter recharge has been shown tosignificantly increase groundwater DOC concentrations (Premrovet al., 2009) and this could also enhance denitrification. In thegroundwater beneath dirty water irrigated grassland, Jahangir et al.(2010) observed substantial amounts of DOC (25 mg L−1) with anitrate concentration of nearly 0.02 mg L−1 and the N2O/(N2O + N2)ratio of 0.01. This indicates the influence of land use and manage-ment, supplying energy sources to denitrifiers, on the reductionof groundwater nitrate and dissolved N2O. The potential implica-tion of denitrification in subsoil implies that leaching would bedecreased through reduction of nitrate to N2O and the N2O pro-duced would be further reduced to N2 during diffusional transportinto the atmosphere and/or to groundwater.
5. Conclusions
The rates of N2O emission and TDN (N2O + N2) under potentialconditions were generally greater in the surface soil than in thesubsoils, irrespective of the supply of NO3
− alone or coupled withC sources in the form of glucose and DOC. Addition of C markedlyincreased soil denitrification rates, giving higher N2O/(N2O + N2)ratios in the surface soil than in the subsoils. This clearly indicatesthe potential of subsoils for more complete reduction of N2O toN2 while the energy sources for denitrifiers are available. Lossesof added nitrate via denitrification were 25% in A horizon and 3%in C horizon which increased to 45–61% in A horizon and 17–18%in C horizon after C addition. The results suggest that without Caddition, potential denitrification rate below the root zone waslow. Denitrification potentials were mainly regulated by substratesincluding total organic C, total N and SON. The findings suggest thatboth glucose-C and DOC were highly effective for the completereduction of NO3
− to occur in subsoil environments and subsoilscould have a large potential to attenuate NO3
− that has leachedbelow the root zone, with the production of more N2 than N2O, ifavailable C is not limiting.
Acknowledgments
Financial support for this study was provided through theResearch Stimulus Fund Programme of the Irish Department ofAgriculture, Fisheries and Food (Grant RSF 06 383). We would liketo thank the Water Quality research group in Teagasc Environment
2 system
Rgo
R
A
A
A
A
A
B
B
B
B
B
B
B
B
B
C
C
C
C
C
C
C
C
C
C
D
D
D
D
D
2 M.M.R. Jahangir et al. / Agriculture, Eco
esearch Centre, Ireland and the Soil and Atmosphere researchroup in Rothamsted Research, North Wyke, UK for providing lab-ratory facilities and helping out with field and analytical work.
eferences
lexander, R., Smith, R., Schwarz, G., 2000. Effect of stream channel size on thedelivery of nitrogen to the Gulf of Mexico. Nature 403, 758–761.
nderson, A.J., Peterson, S.O., 2009. Effects of C and N availability and soil–waterpotential interactions on N2O emission. Soil Biol. Biochem. 41, 1726–1733.
skew, F.E., Smith, R.K., 2005. Inorganic non metallic constituents; Method 4500-CL− E Automated Ferricyanide method. In: Eaton, D.A., Clesceri, L.S., Rice, E.W.,Greensberg, A.E. (Eds.), Standard Methods for the Examination of Waters andWaste Water. , 21st ed. American Public Health Association, 8001 Street, NW,Washington, DC 2001-3710, pp. 4–74, ISBN: 0-87553-047-8, 0-87553-047-8.
ulakh, M.S., Doran, J.W., Mosier, A.R., 1992. Soil denitrification: significance, mea-surement and effects of management. Adv. Soil Sci. 18, 1–57.
ulakh, M.S., Singh, K., Singh, B., Doran, J.W., 1996. Kinetics of nitrification underupland and flooded soils of varying texture. Commun. Soil Sci. Plant Anal. 27,2079–2089.
andibas, J., Vermoesen, A., DeGroot, C.J., Van Clemput, O., 1994. The effect of dif-ferent moisture regimes and soil characteristics on nitrous oxide emission andconsumption by different soils. Soil Sci. 158, 106–114.
arrett, M., Jahangir, M.M.R., Cardenas, L., Khalil, M.I., Johnston, P., Richards, K.G.,O’Flaherty, V., 2010. Quantitative molecular biology and gas flux measurementsdemonstrate soil treatment and depth effects on the distribution and activity ofdenitrifiers. Abstracts, B43F-06 AGU , San Francisco, California, USA.
eauchamp, E.G., Trevors, J.T., Paul, J.W., 1989. Carbon sources for bacterial denitri-fication. Adv. Soil Sci. 10, 113–142.
ergsma, T.T., Robertson, G.P., Ostrom, N.E., 2002. Influence of soil moisture and landuse history on denitrification end-products. J. Environ. Qual. 1, 711–717.
lackmer, A.M., Bremner, J.M., 1978. Inhibitory effect of nitrate on reduction ofnitrous oxide to molecular nitrogen by microorganisms. Soil Biol. Biochem. 10,187–191.
oyer, W.E., Alexander, R.B., Parton, W.J., Li, C., Butterbach-Bahl, K., Donner, S.D.,Skaggs, R.W., Del Grosso, S.J., 2006. Modelling denitrification in terrestrial andaquatic ecosystems at regional scales. Ecol. Appl. 16, 2123–2142.
rady, N.C., Weil, R.R., 2002. The Nature and Properties of Soils, 13th ed. PrenticeHall, New Jersey, p. 250.
rettar, I., Sanchez-Perez, J.M., Trémolières, M., 2002. Nitrate elimination by den-itrification in hardwood forest soils of the Upper Rhine floodplain–correlationwith redox potential and organic matter. Hydrobiologia 269, 11–21.
uss, S.R., Rivett, A.R., Morgan, P., Bemment, C.D., 2005. Attenuation of nitrate in thesubsurface environment. Environment Agency Report, EPA, UK, pp. 42–43.
ameron, K.C., Haynes, R.J., 1986. Retention and movement of nitrogen in soils. In:Haynes, R.J., Cameron, K.C., Goh, K.M., Sherlock, R.R. (Eds.), Mineral Nitrogen inthe Plant–Soil System. Academic Press, London, pp. 166–241.
ardenas, L.M., Hawkins, J.M.B., Chadwick, D., Scholefield, D., 2003. Biogenic gasemissions from soils measured using a new automated laboratory incubationsystem. Soil Biol. Biochem. 35, 867–870.
asey, R.E., Tylor, M.D., Klaine, S.J., 2001. Mechanisms of nutrient attenuation in asubsurface flow in riparian wetland. J. Environ. Qual. 30, 1732–1737.
astle, K., Arah, J.R.M., Vinten, A.J.A., 1998. Denitrification in intact subsoil cores.Biol. Fertil. Soils 28, 12–18.
hapuis-Lardy, L., Wrage, N., Metay, A., Chotte, J.L., Bernoux, M., 2007. Soils, a sinkfor N2O? A review. Global Change Biol. 13, 1–17.
iarlo, E., Conti, M., Bartoloni, N., Rubio, G., 2007. The effect of moisture on nitrousoxide emissions from soil and the N2O/(N2O + N2) ratio under laboratory condi-tions. Biol. Fertil. Soils 43, 675–681.
lement, J.C., Pinay, G., Marmonier, P., 2002. Seasonal dynamics of denitrificationalong topohydrosequences in three different riparian wetland. J. Environ. Qual.31, 1025–1037.
lough, T.J., Sherlock, R.R., Rolston, D.E., 2005. A review of the movement and fateof N2O in the subsoil. Nutr. Cycl. Agroecosyst. 72, 3–11.
osandey, A.C., Maitre, V., Guenat, C., 2003. Temporal denitrification patterns indifferent horizons of two riparian soils. Eur. J. Soil Sci. 54, 25–37.
rutzen, P.J., 1970. Influence of nitrogen oxides on atmospheric ozone content. Q. J.Royal Meteor. Soc. 96, 320–325.
ambreville, C., Henault, H., Bizouard, F., Morvan, T., Chaussod, R., Germon, J.C.,2006. Compared effects of long-term pig slurry applications and mineral fertil-izations on soil denitrification and its end products (N2O, N2). Biol. Fertil. Soils42, 490–500.
annenmann, M., Butterbach-Bahl, K., Gasche, R., Willibald, G., Papen, H., 2008.Dinitrogen emissions and the N2:N2O emission ratio of a rendzic Leptosol asinfluenced by pH and forest thinning. Soil Biol. Biochem. 40, 2317–2323.
avidsson, E.A., Seitzinger, S., 2006. The enigma of progress in denitrificationresearch. Ecol. Appl. 16, 2057–2063.
avies, D.B., 2000. The nitrate issue in England and Wales. Soil Use Manage. 16,142–144.
evito, K.J., Fitzgerald, D., Hill, A.R., Aravena, R., 2000. Nitrate dynamic in relation tolithology and hydrologic flow path in a river riparian zone. J. Environ. Qual. 29,1075–1084.
s and Environment 147 (2012) 13– 23
Dhondt, K., Boeckx, P., Hofman, G., Van Clemput, O., 2004. Temporal and spatial pat-tern of denitrification enzyme activity and nitrous oxide fluxes in three adjacentvegetated riparian buffer zones. Biol. Fertil. Soils 40, 243–251.
Dixon, E.R., Laughlin, R.J., Watson, C.J., Hatch, D.J., 2010. Evidence for the productionof NO and N2O in two contrasting subsoils following the addition of syntheticcattle urine. Rapid Commun. Mass Spectrom. 24, 519–528.
Dobbie, K.E., Smith, K.A., 2003. Nitrous oxide emission factors for agricultural soilsin Great Britain: the impact of soil water-filled pore space and other controllingvariables. Global Change Biol. 9, 204–218.
Ellis, J.R., Mielke, L.N., Schuman, G.E., 1975. The nitrogen status beneath beef cattlefeedlots in eastern Nebraska. Soil Sci. Soc. Am. Proc. 39, 107–111.
Elmi, A.A., Madramootoo, C., Hamel, C., Liu, A., 2003. Denitrification and nitrous tonitrous oxide plus nitrogen ratios in the soil profile under three tillage systems.Biol. Fertil. Soils 38, 340–348.
Elmi, A.A., Astatkie, T., Madramootoo, C., Gordon, R., Burton, D., 2005. Assessmentof denitrification gaseous end-products in the soil profile under two watermanagement practices using repeated measures analysis. J. Environ. Qual. 34,446–454.
Farquharson, R., Baldock, J., 2008. Concepts in modelling N2O emissions from landuse. Plant Soil 309, 147–167.
Fenton, O., Healy, M.G., Rodgers, M., 2008. Preliminary steps in the location of a farm-scale groundwater remediation system. Proceedings of Environmental ScienceAssociation of Ireland (ESA) 2007, 52–58.
Fenton, O., Richards, K.G., Kirwan, L., Khalil, M.I., Healy, M.G., 2009. Factors affectingnitrate distribution in shallow groundwater under a beef farm in South EasternIreland. J. Environ. Manage. 90, 3135–3146.
Foster, S.S.D., 2000. Assessing and controlling the impacts of agriculture on ground-water – from barley barons to beef bans. Q. J. Eng. Geol. Hydrogeol. 33, 263–280.
Foster, S.S.D., Young, C.P., 1980. Groundwater contamination due to agriculturalland-use practices in the United Kingdom. In: Aquifer Contamination and Protec-tion, vol. 30. UNESCO–IHP Studies and Reports in Hydrology Series, pp. 268–282.
Frey, S.D., Elliott, E.T., Paustian, K., 1999. Bacterial and fungal abundance and biomassin conventional and no-tillage agroecosystems along two climatic gradients. SoilBiol. Biochem. 31, 573–585.
Granli, T., Bockman, O., 1994. Nitrous oxide from agriculture. Norwegian J. Agric. Sci.12, 7–128.
Groffman, P.M., Altabet, M.A., Bohlke, J.K., Butterbach-Bahl, K., David, M.B., Firestone,M.K., Giblin, A.E., Kana, T.M., Nielsen, L.P., Voytek, M.A., 2006. Methods formmeasuring denitrification: diverse approaches to a difficult problem. Ecol. Appl.16, 2057–2063.
Hill, A.R., Cardaci, M., 2004. Denitrification and organic carbon availability in riparianwetland soils and subsurface sediments. Soil Sci. Soc. Am. J. 68, 320–325.
Hill, A.R., Devito, K.G., Campagnolo, S., Sanmugadas, K., 2000. Subsurface denitrifi-cation in forest riparian zone: interactions between hydrology and supplies ofnitrate and organic carbon. Biogeochemistry 51, 193–223.
Hill, A.R., Vidon, P.G.F., Langat, J., 2004. Denitrification potential in relation to fiveheadwater riparian zones. J. Environ. Qual. 33, 911–919.
Ibendahl, G., Fleming, R.A., 2007. Controlling aquifer nitrogen levels when fertilizingcrops: a study of groundwater contamination and denitrification. Ecol. Model.205, 507–514.
Jacinthe, P.A., Dick, W.A., 1997. Soil management and nitrous oxide emissions fromcultivated fields in Southern Ohio. Soil Till. Res. 41, 221–235.
Jahangir, M.M.R., Barrett, M., Johnston, P., O’Flaherty, V., Khalil, M.I., Richards, K.G.,2010. Groundwater denitrification and denitrifier functional gene abundancesat a range of hydrogeological settings in Ireland. Abstracts, B51B-0356 AGU , SanFrancisco, California, USA.
Jarvis, S.C., 2000. Progress in studies of nitrate leaching from grassland soils. Soil UseManage. 16, 152–156.
Jarvis, S.C., Hatch, D.J., 1994. Potential for denitrification at depth below long-termgrass swards. Soil Biol. Biochem. 26, 1629–1636.
Karim, Z., Rahman, S.M., Idris, M., Karim, A.J.M.S., 1988. A Manual for the Determi-nation of Soil Physical Parameters. BARC S & I Publication No. 31, BARC, Dhaka,p. 76.
Khalil, M.I., Baggs, E.M., 2005. Soil water-filled pore space affects the interactionbetween CH4 oxidation, nitrification and N2O emissions. Soil Biol. Biochem. 37,1785–1794.
Khalil, M.I., Richards, K.G., 2010. Denitrification enzyme activity and potential of sub-soils under grazed grasslands assayed by membrane inlet mass spectrometer.Soil Biol. Biochem., doi:10.1016/j.soilbio.2010.08.024.
Knowles, R., 1982. Denitrification. Microbiol. Rev. 46, 43–70.Kustermann, B., Christen, O., Hulsgergen, K., 2010. Modelling nitrogen cycles of
farming systems as basis of site- and farm-specific nitrogen management. Agric.Ecosyst. Environ. 135, 70–80.
Laughlin, R.J., Stevens, R.J., 2002. Evidence for fungal dominance of denitrificationand codenitrification in a grassland soil. Soil Sci. Soc. Am. J. 66, 1540–1548.
Ledgard, S.F., Sprosen, M.S., Brier, G.J., Nemaia, E.K.K., Clark, D.A.A., 1996. Nitro-gen inputs and losses from New Zealand dairy farmlets, as affected by nitrogenfertilizer application: year one. Plant Soil 181, 65–69.
Li, X., Inubushi, K., Sakamato, K., 2002. Nitrogen oxide concentrations in an Andisolprofile and emissions to the atmosphere as influenced by the application ofnitrogen fertilizers and manure. Biol. Fertil. Soils 35, 108–113.
McCarty, G.W., Bremner, J.M., 1992. Availability of organic carbon for denitrificationof nitrate in subsoils. Biol. Fertil. Soils 14, 219–222.
Miller, M.N., Zebarth, B.J., Dandie, C.E., Burton, D.E., Goyer, C., Trevors, J.E., 2009.Influence of liquid manure on soil denitrification abundance, denitrification, andnitrous oxide emissions. Soil Sci. Soc. Am. J. 73, 760–768.
system
P
P
P
P
R
S
S
S
S
S
S
S
S
Yeomans, J.C., Bremner, J.M., McCarty, G.W., 1992. Denitrification capacity anddenitrification potential of subsurface soil. Commun. Soil Sci. Plant Anal. 23,
M.M.R. Jahangir et al. / Agriculture, Eco
abich, W.J., Valiela, I., Hemond, H.F., 2001. Relationship between DOC concentrationand vadose zone thickness and depth below water table in groundwater of CapeCod, USA. Biogeochemistry 55, 247–268.
erego, A., Basile, A., Bonfante, A., De Mascellis, R., Terribile, F., Brenna, S., Acutis, M.,2012. Nitrate leaching under maize cropping systems in Po Valley (Italy). Agric.Ecosyst. Environ. 147, 57–65.
fenning, K.S., McMahon, P.B., 1996. Effect of nitrate, organic carbon, and temper-ature on potential denitrification rates in nitrate rich riverbed sediments. J.Hydrol. 187, 283–295.
remrov, A., Coxon, C.E., Hackett, R., Brennan, D., Sills, P., Richards, K.G., 2009. Over-winter green cover in a spring barley system: role in exporting dissolved organiccarbon to shallow groundwater and implications for denitrification. In: Grignani,C., Acutis, M., Zavattaro, L., Bechini, L., Bertora, C., Gallina, P.M., Sacco, D. (Eds.),Proceedings of 16th Nitrogen Workshop. 28th June to 1st July 2009, Turin, Italy,pp. 11–12.
ichards, J.E., Webster, P.C., 1999. Denitrification in subsoils of the Broadbalk Con-tinuous Wheat Experiment. Soil Biol. Biochem. 31, 747–755.
charenbroach, B., 2010. Introduction to Soil Science–Soil Water Content,Laboratory Manual, pp. 1–5, http://www.masslaboratory.org/linked/lab5acca iss water content.pdf (consulted on 10.12.10).
chlegel, G.H., 1992. Allgemeine Mikrobiologie, 7th ed. Thieme, Stuttgart, New York,pp. 337–339.
cholefield, D., Tyson, K.C., Garwood, E.A., Armstrong, A.C., Hawkins, J., Stone, A.C.,1993. Nitrate leaching from grazed grassland lysimeters: effects of fertilizerinput, field drainage, age of sward and pattern of weather. J. Soil Sci. 44, 601–613.
cholefield, D., Hawkins, J.M.B., Jackson, S.M., 1997. Use of flowing helium atmo-sphere incubation technique to measure the effects of denitrification controlsapplied to intact cores of a clay soil. Soil Biol. Biochem. 29, 1337–1344.
eitzinger, S., Harrison, J.A., Bohlke, J.K., Bouwman, A.F., Lowrance, R., Peterson, B.,Tobias, C., Van Drecht, G., 2006. Denitrification across landscapes and water-scapes: a synthesis. Ecol. Appl. 16 (6), 2064–2090.
iemens, J., Haas, M., Kaupenjohann, M., 2003. Dissolved organic matter-induceddenitrification in subsoils and aquifers. Geoderma 113, 253–271.
otomayor, D., Rice, C.W., 1996. Denitrification in soil profiles beneath grassland andcultivated soils. Soil Sci. Soc. Am. J. 60, 1822–1828.
tanding Committee of Analysts, 1981. Chloride in Waters, Sewage and Effluents.In: Methods for the Examination of Water and Associated Materials (Blue Book).HMSO, London, pp. 40–48, ISBN: 0-11751-626-0.
s and Environment 147 (2012) 13– 23 23
Stark, C.H., Richards, K.G., 2008. The continuing challenge of agricultural nitrogenloss to the environment in the context of global change and advancing research.Dynamic Soil Dynamic Plant 2, 1–12.
Tiedje, J.M., 1988. Ecology of denitrification and dissimilatory nitrate reduction toammonium. In: Zehnder, A.J.B. (Ed.), Biology of Anaerobic Micro-Organisms.Wiley, New York, pp. 179–244.
Townsend, A.R., Howarth, R.W., Bazzaz, F.A., Booth, M.S., Cleveland, C.C., Collinge,S.K., Dobson, A.P., Epstein, P.R., Holland, E.A., Keeny, D.R., Mallin, M.A., Rogers,C.A., Wayne, P., Wolfe, A.H., 2003. Human health effects of a changing globalnitrogen cycle. Frontiers Ecol. Environ. 5, 240–246.
van Kessel, C., Clough, T., van Groenigen, J.W., 2009. Dissolved organic nitrogen: anoverlooked pathway of nitrogen loss from agricultural systems? J. Environ. Qual.38, 393–401.
Venterea, R.T., Burger, M., Spokas, K.A., 2005. Nitrogen oxide and methane emis-sions under varying tillages and fertilizer management. J. Environ. Qual. 34,1467–1477.
Webster, E.A., Hopkins, D.W., 1996. Contributions from different microbial processto N2O emission from soil under different moisture regimes. Biol. Fertil. Soils 22,331–335.
Weier, K.L., McRae, I.C., Myers, R.J.K., 1993. Denitrification in a clay soil under pastureand annual crop: estimation of potential losses using intact soil cores. Soil Biol.Biochem. 25, 991–997.
Well, R., Myrold, D.D., 2002. A proposed method for measuring subsoil denitrificationin situ. Soil Sci. Soc. Am. J. 66, 507–518.
Well, R., Augustin, J., Davis, J., Griffith, S.M., Meyer, K., Myrold, D.D., 2001. Produc-tion and transport of denitrification gases in shallow groundwater. Nutr. Cycl.Agroecosyst. 60, 65–76.
Werner, W., 1994. Stickstoff und phosphateeintrag in FlieBgewasser Deutschlandsunter besonderer Berucksichtigung des Eintraggeschens im Lockergesteins-beereich der chemaligen DDR. Agrarspectrum, PL 22, DLG Verlag, Frunkfurt,p. 243.
919–927.Zumft, W.G., 1997. Cell biology and molecular basis of denitrification. Microbiol.
Mol. Biol. Rev. 61, 533–616.
Related Documents