Demystifying Data @ CHOP: Pre-Reading Attached is an excerpt from a book written by Health Catalyst, a healthcare datawarehousing company that spun out of Intermountain Healthcare. This particular section talks about healthcare data, the need to unlock it, discover patterns, and automate distribution. It will set the stage to discuss our data infrastructure at CHOP. CHOP did not purchase Health Catalyst, but we built our CHOP datawarehouse with a similar mindset and model A few questions to think about: • What are different ways to distribute data to end users? • What is the value of a dashboard vs a measurement tool? • What is the advantage and disadvantage of self-exploration data? Got questions? Email Albert Chi ([email protected]) or Vaidehi Nayar ([email protected])

Welcome message from author
This document is posted to help you gain knowledge. Please leave a comment to let me know what you think about it! Share it to your friends and learn new things together.
Transcript
Demystifying Data @ CHOP: Pre-Reading Attached is an excerpt from a book written by Health Catalyst, a healthcare datawarehousing company that spun out of Intermountain Healthcare. This particular section talks about healthcare data, the need to unlock it, discover patterns, and automate distribution. It will set the stage to discuss our data infrastructure at CHOP. CHOP did not purchase Health Catalyst, but we built our CHOP datawarehouse with a similar mindset and model A few questions to think about:
• What are different ways to distribute data to end users?
• What is the value of a dashboard vs a measurement tool?
• What is the advantage and disadvantage of self-exploration data?
Got questions? Email Albert Chi ([email protected]) or Vaidehi Nayar ([email protected])
55
THE ANALYTICS SYSTEM: STANDARD MEASUREMENT WORK
4
An overview of the three-system framework for improving and sustaining clinical effectiveness, reducing waste and improving patient safety was discussed in chapter 3. Now we will review the analytic system.
CHAPTER 4 THE ANALYTICS SYSTEM: STANDARD MEASUREMENT WORK 56
This discussion will focus on unlocking your data and the importance of a good measurement system. By the end of this chapter, you should be able to describe different data models (including their strengths and weaknesses in healthcare), know how to use Pareto analysis to prioritize improvement opportunities, and discover patterns in the data to ignite meaningful, scalable and sustainable change.
Arguably, healthcare is the most data-intense industry in the world. Clinicians cannot deliver and sustain high-quality, safe care without information that is readily available. Measurement is the basis for assessing and sustaining potential improvements in healthcare quality. Deming once said, “In God we trust, all others must bring data.” In order to know whether a change is an improvement, an analytic system is absolutely essential. Key performance measures allow improvement teams to assess care against past performance (shared common baselines), evidence-based clinical guidelines and nationally recognized standards. As Lord Kelvin said, “If you cannot measure it, you cannot improve it.” In an improvement effort, you always need some form of objective measure to demonstrate how well things are working.
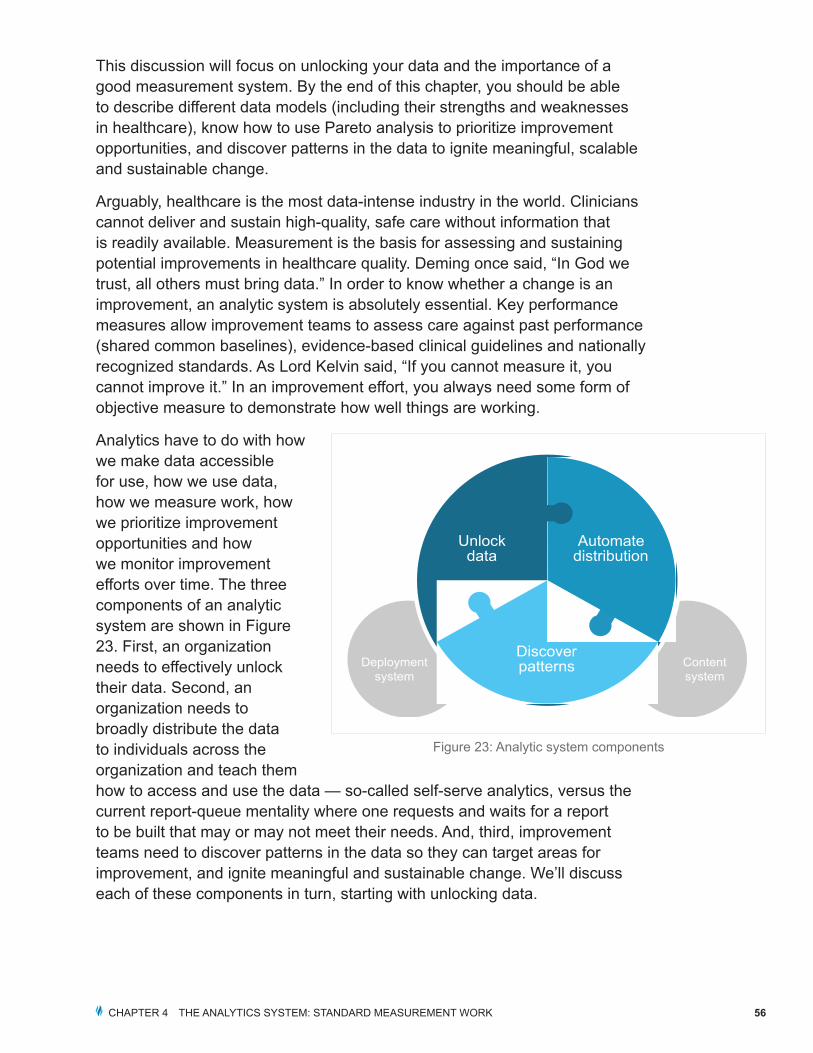
Analytics have to do with how we make data accessible for use, how we use data, how we measure work, how we prioritize improvement opportunities and how we monitor improvement efforts over time. The three components of an analytic system are shown in Figure 23. First, an organization needs to effectively unlock their data. Second, an organization needs to broadly distribute the data to individuals across the organization and teach them how to access and use the data — so-called self-serve analytics, versus the current report-queue mentality where one requests and waits for a report to be built that may or may not meet their needs. And, third, improvement teams need to discover patterns in the data so they can target areas for improvement, and ignite meaningful and sustainable change. We’ll discuss each of these components in turn, starting with unlocking data.
Content system
Unlock data
Deployment system
Automate distribution
Discover patterns
Figure 23: Analytic system components
CHAPTER 4 THE ANALYTICS SYSTEM: STANDARD MEASUREMENT WORK 57
Chapter 4.1 — Unlocking and appropriately using data
Two ways of using data: accountability versus learning
Few would argue that data is necessary to drive improvement. However, it is equally important to understand at the outset of an improvement initiative how data should be used to optimize the likelihood that clinicians will engage in improvement efforts.
New knowledge and a migration to a profession-based model of care require a move from the traditional judgment-based model to a learning-based model. A judgment-based approach focuses on the person, while a learning-based model focuses on continuous improvement.
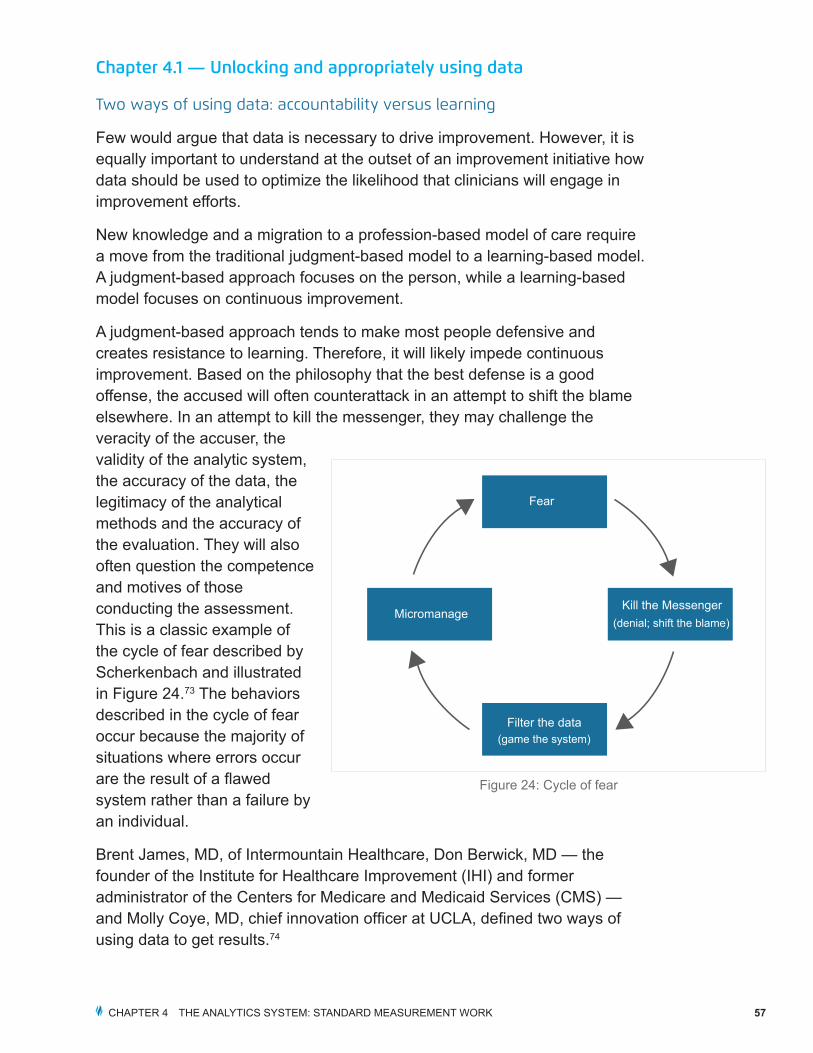
A judgment-based approach tends to make most people defensive and creates resistance to learning. Therefore, it will likely impede continuous improvement. Based on the philosophy that the best defense is a good offense, the accused will often counterattack in an attempt to shift the blame elsewhere. In an attempt to kill the messenger, they may challenge the veracity of the accuser, the validity of the analytic system, the accuracy of the data, the legitimacy of the analytical methods and the accuracy of the evaluation. They will also often question the competence and motives of those conducting the assessment. This is a classic example of the cycle of fear described by Scherkenbach and illustrated in Figure 24.73 The behaviors described in the cycle of fear occur because the majority of situations where errors occur are the result of a flawed system rather than a failure by an individual.
Brent James, MD, of Intermountain Healthcare, Don Berwick, MD — the founder of the Institute for Healthcare Improvement (IHI) and former administrator of the Centers for Medicare and Medicaid Services (CMS) — and Molly Coye, MD, chief innovation officer at UCLA, defined two ways of using data to get results.74
Fear
Micromanage
Filter the data(game the system)
Kill the Messenger(denial; shift the blame)
Figure 24: Cycle of fear
CHAPTER 4 THE ANALYTICS SYSTEM: STANDARD MEASUREMENT WORK 58
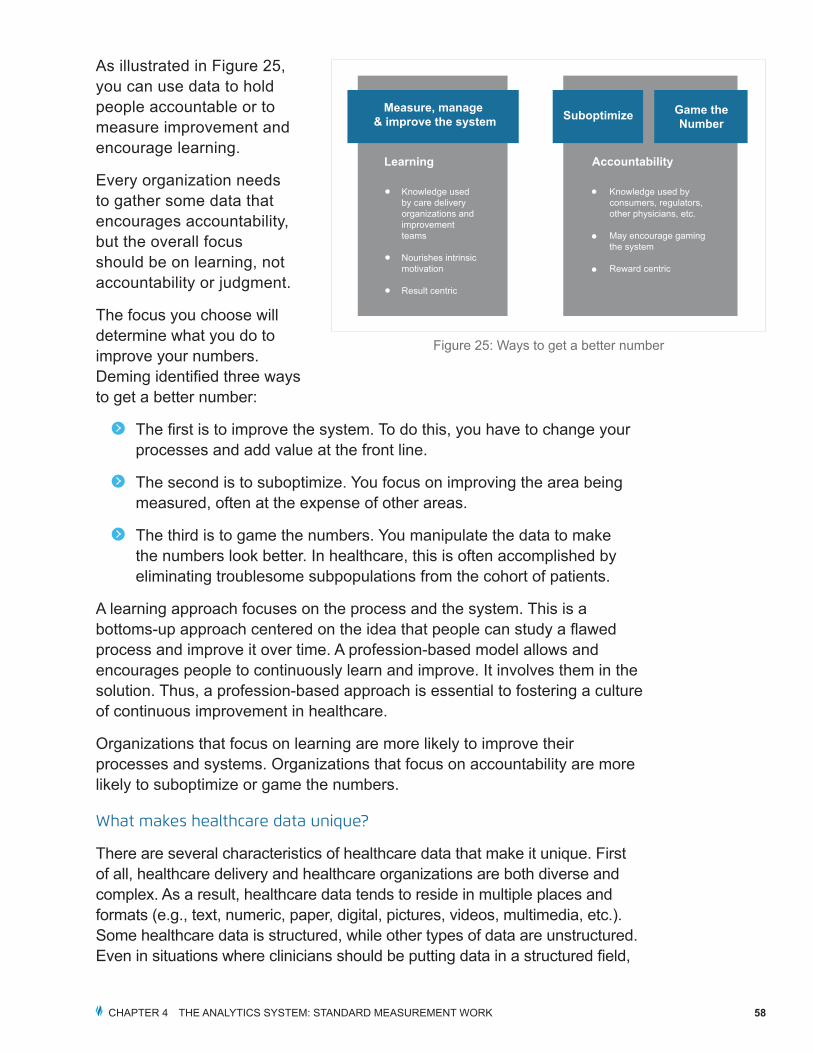
As illustrated in Figure 25, you can use data to hold people accountable or to measure improvement and encourage learning.
Every organization needs to gather some data that encourages accountability, but the overall focus should be on learning, not accountability or judgment.
The focus you choose will determine what you do to improve your numbers. Deming identified three ways to get a better number:
The first is to improve the system. To do this, you have to change your processes and add value at the front line.
The second is to suboptimize. You focus on improving the area being measured, often at the expense of other areas.
The third is to game the numbers. You manipulate the data to make the numbers look better. In healthcare, this is often accomplished by eliminating troublesome subpopulations from the cohort of patients.
A learning approach focuses on the process and the system. This is a bottoms-up approach centered on the idea that people can study a flawed process and improve it over time. A profession-based model allows and encourages people to continuously learn and improve. It involves them in the solution. Thus, a profession-based approach is essential to fostering a culture of continuous improvement in healthcare.
Organizations that focus on learning are more likely to improve their processes and systems. Organizations that focus on accountability are more likely to suboptimize or game the numbers.
What makes healthcare data unique?
There are several characteristics of healthcare data that make it unique. First of all, healthcare delivery and healthcare organizations are both diverse and complex. As a result, healthcare data tends to reside in multiple places and formats (e.g., text, numeric, paper, digital, pictures, videos, multimedia, etc.). Some healthcare data is structured, while other types of data are unstructured. Even in situations where clinicians should be putting data in a structured field,
Learning
Knowledge used by care delivery organizations and improvement teams
Nourishes intrinsic motivation
Result centric
Accountability
Knowledge used by consumers, regulators, other physicians, etc.
May encourage gaming the system
Reward centric
Measure, manage & improve the system Suboptimize Game the
Number
Figure 25: Ways to get a better number
CHAPTER 4 THE ANALYTICS SYSTEM: STANDARD MEASUREMENT WORK 59
they may not be, resulting in the need to manually extract the data — a time-consuming and costly process. Oftentimes, healthcare data is described using inconsistent or variable definitions. For example, one group of clinicians may define a cohort of asthmatic patients differently than another group of clinicians. Healthcare also tends to generate very large volumes of data. The amount of new healthcare knowledge is massive and expanding on an almost daily basis. This means evidence is constantly changing. Regulatory and reporting requirements also continue to increase and evolve. Finally, for both care delivery and improvement efforts, clinicians need to get to patient-level detail.
The best way to make healthcare data accessible
A healthcare enterprise data warehouse (EDW) is the core of an analytical infrastructure. Given its complexity and quantity, it is important that healthcare data be readily accessible electronically and that the design of the EDW is maximally adaptable to support the dynamic and unique nature of the healthcare environment.
EDWs are described using conceptual data models. Different data models have been developed to meet various analytic requirements. A data model can be thought of as a diagram or flowchart that illustrates the relationships between data and data sources. The data model demonstrates the specific entities, attributes and relationships involved in a business or enterprise. The data model serves as the basis that IT professionals use to create the physical data model. The characteristics of the data model matter because of the complex and dynamic nature of healthcare data and the healthcare environment. Various types of data models and how they relate to healthcare are described below.
Data model types
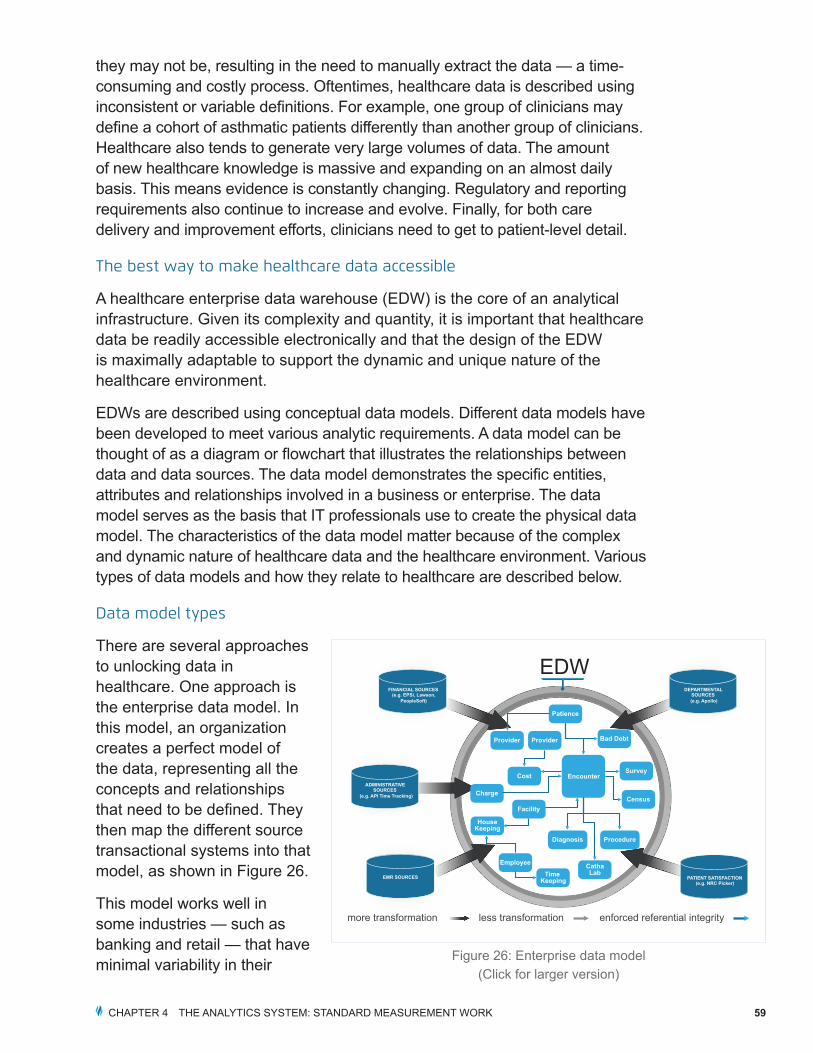
There are several approaches to unlocking data in healthcare. One approach is the enterprise data model. In this model, an organization creates a perfect model of the data, representing all the concepts and relationships that need to be defined. They then map the different source transactional systems into that model, as shown in Figure 26.
This model works well in some industries — such as banking and retail — that have minimal variability in their
less transformation enforced referential integrity
FINANCIAL SOURCES (e.g. EPSi, Lawson,
PeopleSoft)
ADMINISTRATIVE SOURCES
(e.g. API Time Tracking)
EMR SOURCES
DEPARTMENTAL SOURCES (e.g. Apollo)
PATIENT SATISFACTION (e.g. NRC Picker)
EDW
Patience
Provider
Cost Encounter
Charge
Facility
Employee
Time Keeping
CathaLab
HouseKeeping
Bad Debt
Survey
Census
ProcedureDiagnosis
Provider
more transformation
Figure 26: Enterprise data model(Click for larger version)
CHAPTER 4 THE ANALYTICS SYSTEM: STANDARD MEASUREMENT WORK 60
data and where concepts and definitions are relatively static. Unfortunately, this highly organized model cannot be delivered incrementally, it takes a long time to create and it can be expensive. The extract, transform and load (ETL) routines used to move data into the model are complex. Finally, because of the characteristics of healthcare data — including constant, evidence-based care updates — you have to continuously redesign the model to make new data fit. Some healthcare systems have spent years on this approach and still have not been able to move any data into the model. This model has had limited success in healthcare, although it has been very successful in other industries.
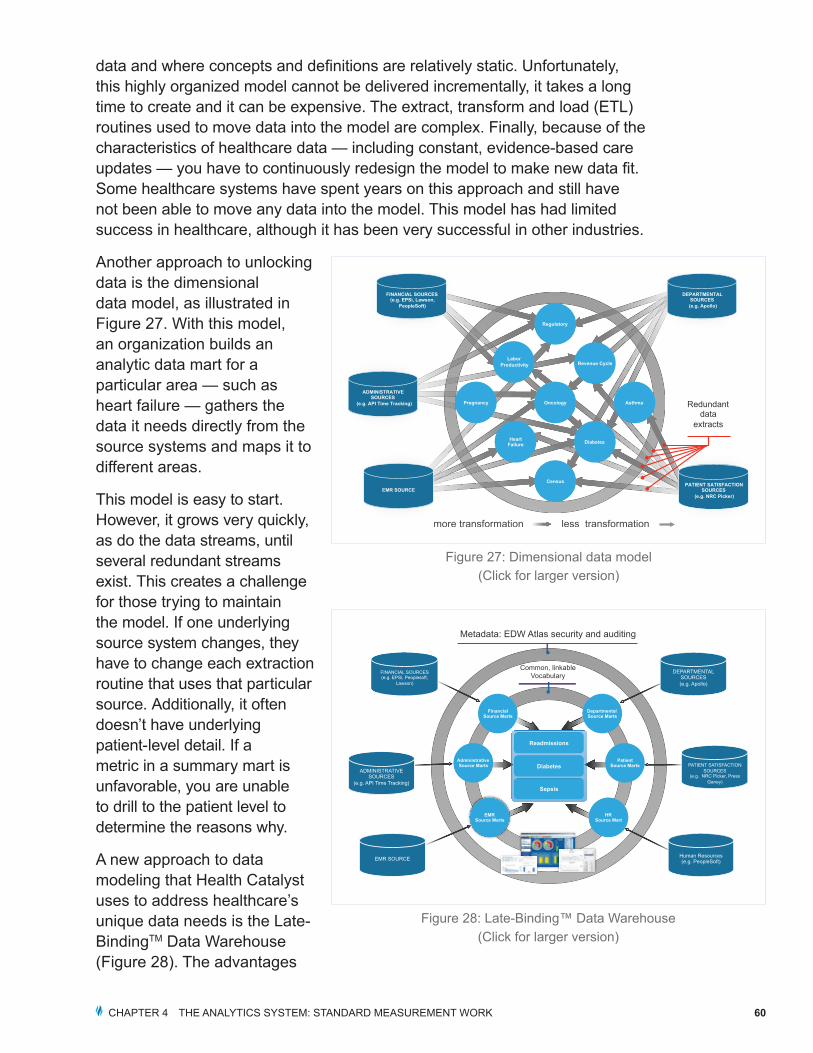
Another approach to unlocking data is the dimensional data model, as illustrated in Figure 27. With this model, an organization builds an analytic data mart for a particular area — such as heart failure — gathers the data it needs directly from the source systems and maps it to different areas.
This model is easy to start. However, it grows very quickly, as do the data streams, until several redundant streams exist. This creates a challenge for those trying to maintain the model. If one underlying source system changes, they have to change each extraction routine that uses that particular source. Additionally, it often doesn’t have underlying patient-level detail. If a metric in a summary mart is unfavorable, you are unable to drill to the patient level to determine the reasons why.
A new approach to data modeling that Health Catalyst uses to address healthcare’s unique data needs is the Late-BindingTM Data Warehouse (Figure 28). The advantages
Oncology
Diabetes Heart Failure
Regulatory
Pregnancy Asthma
Labor Productivity Revenue Cycle
Census PATIENT SATISFACTION SOURCES
(e.g. NRC Picker)
DEPARTMENTAL SOURCES (e.g. Apollo)
FINANCIAL SOURCES (e.g. EPSi, Lawson,
PeopleSoft)
ADMINISTRATIVE SOURCES
(e.g. API Time Tracking)
less transformationmore transformation
Redundant data
extracts
EMR SOURCE
Figure 27: Dimensional data model(Click for larger version)
Metadata: EDW Atlas security and auditing
Common, linkable Vocabulary
Financial Source Marts
Administrative Source Marts
Departmental Source Marts
Patient Source Marts
EMR Source Marts
HR Source Mart
Diabetes
Sepsis
Readmissions
FINANCIAL SOURCES (e.g. EPSi, Peoplesoft,
Lawson)
ADMINISTRATIVE SOURCES
(e.g. API Time Tracking)
EMR SOURCE
DEPARTMENTAL SOURCES (e.g. Apollo)
PATIENT SATISFACTION
SOURCES (e.g. NRC Picker, Press
Ganey)
Human Resources (e.g. PeopleSoft)
Figure 28: Late-Binding™ Data Warehouse(Click for larger version)
CHAPTER 4 THE ANALYTICS SYSTEM: STANDARD MEASUREMENT WORK 61
of the late binding approach are that it is generally faster to launch, it is easier and less expensive to maintain, and most importantly, it provides maximum adaptability for clinicians who are involved in improving care in the highly dynamic healthcare environment.
In the late binding model, one brings data into the warehouse in a raw format that keeps the same structure and feel of the underlying transactional system. This quick copy can be done in a few weeks, unlike the enterprise model, which can take years to develop. The structure stays the same, which enables analysts familiar with the transactional system to recognize the data structure in the warehouse. Naming and data type standards are applied to make it easier for analysis, but minimal transformation occurs.
In the late binding platform one can connect disparate data with a common linkable vocabulary. For example, identifiers for patients, providers and facilities can be linked across different data source systems such as an electronic health record (EHR) or claims (source marts), and one patient can be viewed across the entire system. From there, you can build marts focused on a particular clinical area such as diabetes (subject area marts). This can be done quickly because you are not going back to the individual source systems. You already have all the data in the late binding data warehouse. If an underlying source changes, you update one extraction routine instead of multiple streams. The result is just-in-time data binding. Rather than trying to define everything up front, you bind the data later, when you are trying to solve an actual clinical or operational problem. Finally, you can build graphical data visualizations atop the subject area marts, so it’s easier to interpret the data and identify trends and patterns.
Data binding and why it matters
Data binding is a technique in which raw data elements are mapped to conceptual definitions. One of the keys to the data model developed by Health Catalyst is binding the data late (i.e., when clinicians are trying to solve a problem). But that doesn’t mean you always wait until the end. Data that is stable, like vocabulary terms and patient and provider identifiers, can be bound early. Data that is likely to change should be bound later. For example, length of stay (LOS) in a hospital may sound straightforward on paper, but surgeons might define LOS as point of incision to discharge from the post-anesthesia care unit (PACU), and cardiologists might define it as emergency department (ED) arrival to discharge. Because the LOS definition will change for different use cases, you will want to bind it later.
In the late binding model, one brings data into the warehouse in a raw format that keeps the same structure and feel of the underlying transactional system. This quick copy can be done in a few weeks, unlike the enterprise model, which can take years to develop.
CHAPTER 4 THE ANALYTICS SYSTEM: STANDARD MEASUREMENT WORK 62
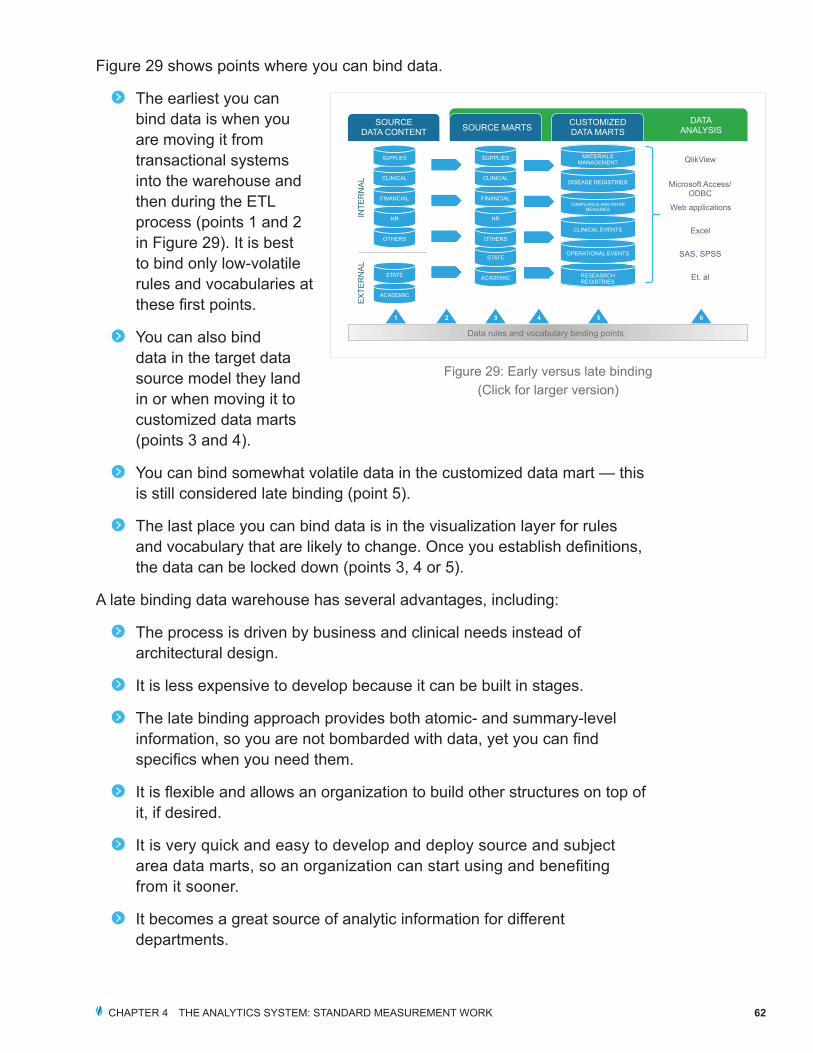
Figure 29 shows points where you can bind data.
The earliest you can bind data is when you are moving it from transactional systems into the warehouse and then during the ETL process (points 1 and 2 in Figure 29). It is best to bind only low-volatile rules and vocabularies at these first points.
You can also bind data in the target data source model they land in or when moving it to customized data marts (points 3 and 4).
You can bind somewhat volatile data in the customized data mart — this is still considered late binding (point 5).
The last place you can bind data is in the visualization layer for rules and vocabulary that are likely to change. Once you establish definitions, the data can be locked down (points 3, 4 or 5).
A late binding data warehouse has several advantages, including:
The process is driven by business and clinical needs instead of architectural design.
It is less expensive to develop because it can be built in stages.
The late binding approach provides both atomic- and summary-level information, so you are not bombarded with data, yet you can find specifics when you need them.
It is flexible and allows an organization to build other structures on top of it, if desired.
It is very quick and easy to develop and deploy source and subject area data marts, so an organization can start using and benefiting from it sooner.
It becomes a great source of analytic information for different departments.
ACADEMIC
STATE
SOURCE DATA CONTENT SOURCE MARTS CUSTOMIZED
DATA MARTS DATA
ANALYSIS
OTHERS
HR
FINANCIAL
CLINICAL
SUPPLIES
INTE
RN
AL
EX
TER
NA
L
ACADEMIC
STATE
OTHERS
HR
FINANCIAL
CLINICAL
SUPPLIES
RESEASRCH REGISTRIES
QlikView
Microsoft Access/ ODBC
Web applications
Excel
SAS, SPSS
Et. al
OPERATIONAL EVENTS
CLINICAL EVENTS
COMPLIANCE AND PAYER MEASURES
DISEASE REGISTRIES
MATERIALS MANAGEMENT
1
Data rules and vocabulary binding points
2 3 4 5 6
Figure 29: Early versus late binding(Click for larger version)
CHAPTER 4 THE ANALYTICS SYSTEM: STANDARD MEASUREMENT WORK 63
The structure aligns with governance or data stewardship, so different departments can access different source marts because they are the stewards of that data.
It improves an organization’s information about the data (i.e., metadata) by tracking how often it is refreshed, where it came from, who’s in charge of that data and so on.
It is noteworthy that the late binding data warehouse is the approach that has most consistently worked in healthcare to unlock data and drive improved results.
Automating data distribution
Once the data is unlocked, an organization can automate the broad distribution of the information. Ideally, the data is distributed electronically to enable clinicians to effectively and efficiently view the information they need in as close to real time as possible.
Today, in most healthcare delivery organizations, the distribution work falls primarily to analysts or clinicians, who encounter many challenges. First, they must understand what types of data are needed. Before they can locate and compile that data, they have to wait for IT to run reports or queries. Only then can they start interpreting data and distributing it to the right people. Obviously, understanding the need and interpreting data are two value-add tasks. But at many healthcare organizations at least 80 percent of the analyst’s or clinician’s time is spent gathering or waiting for data instead of analyzing information.
There are several examples of non-value-added tasks. If the person preparing the report doesn’t get all the necessary data, he or she has to do chart abstraction, where one pulls up the patient’s record and manually types the missing data into an Excel spreadsheet or another data collection file system. This is sometimes called sneaker ETL because the analyst spends a lot of time walking from one system to another to enter data. When you reach the stage where you want to provide others access to the data (i.e., the distribution/provisioning stage), the new data are typically integrated into another Excel spreadsheet (spreadsheet data marts or spreadmarts), but they aren’t tied back to the source information. The person creating the report might have built clever macros to grab this data, but if they leave the organization, they also take the knowledge about how the macros work, and the people left behind can only hope the data imports correctly. Spreadmarts are volatile — they are not standardized, they are not predictable and they are often not secure.
CHAPTER 4 THE ANALYTICS SYSTEM: STANDARD MEASUREMENT WORK 64
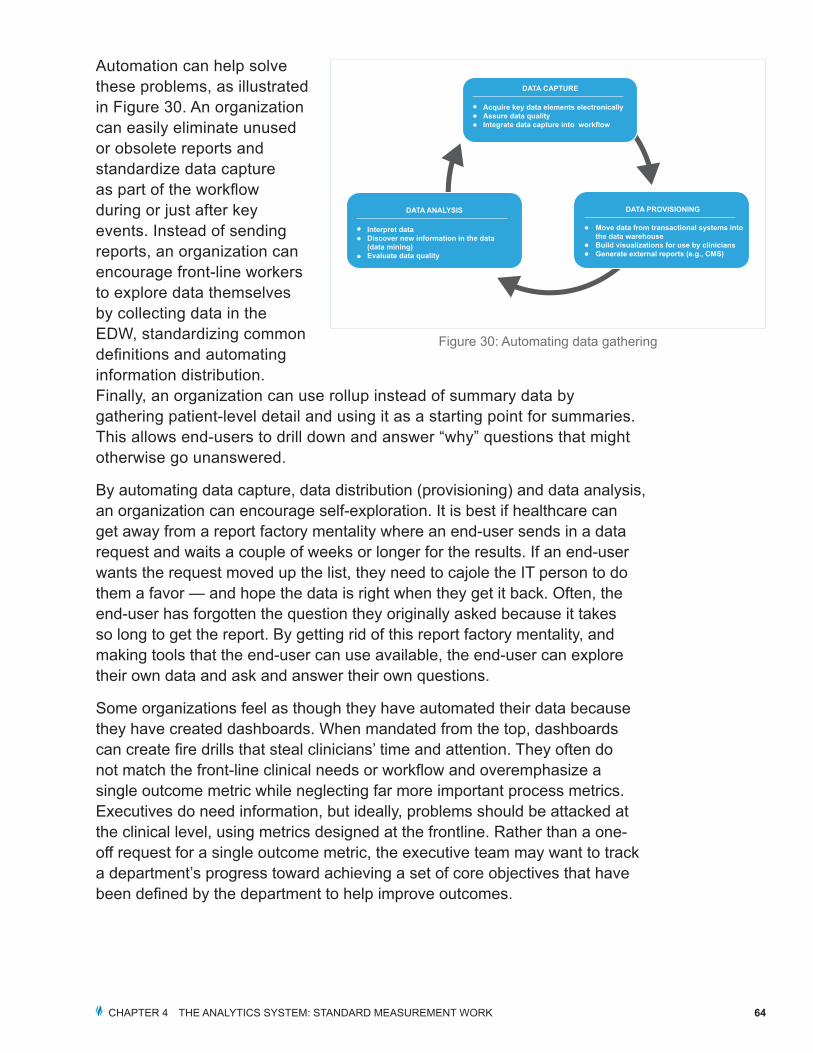
Automation can help solve these problems, as illustrated in Figure 30. An organization can easily eliminate unused or obsolete reports and standardize data capture as part of the workflow during or just after key events. Instead of sending reports, an organization can encourage front-line workers to explore data themselves by collecting data in the EDW, standardizing common definitions and automating information distribution. Finally, an organization can use rollup instead of summary data by gathering patient-level detail and using it as a starting point for summaries. This allows end-users to drill down and answer “why” questions that might otherwise go unanswered.
By automating data capture, data distribution (provisioning) and data analysis, an organization can encourage self-exploration. It is best if healthcare can get away from a report factory mentality where an end-user sends in a data request and waits a couple of weeks or longer for the results. If an end-user wants the request moved up the list, they need to cajole the IT person to do them a favor — and hope the data is right when they get it back. Often, the end-user has forgotten the question they originally asked because it takes so long to get the report. By getting rid of this report factory mentality, and making tools that the end-user can use available, the end-user can explore their own data and ask and answer their own questions.
Some organizations feel as though they have automated their data because they have created dashboards. When mandated from the top, dashboards can create fire drills that steal clinicians’ time and attention. They often do not match the front-line clinical needs or workflow and overemphasize a single outcome metric while neglecting far more important process metrics. Executives do need information, but ideally, problems should be attacked at the clinical level, using metrics designed at the frontline. Rather than a one-off request for a single outcome metric, the executive team may want to track a department’s progress toward achieving a set of core objectives that have been defined by the department to help improve outcomes.
Acquire key data elements electronicallyAssure data qualityIntegrate data capture into workflow
DATA CAPTURE
Interpret dataDiscover new information in the data (data mining)Evaluate data quality
DATA ANALYSIS
Move data from transactional systems into the data warehouseBuild visualizations for use by cliniciansGenerate external reports (e.g., CMS)
DATA PROVISIONING
Figure 30: Automating data gathering
Related Documents