* *

Welcome message from author
This document is posted to help you gain knowledge. Please leave a comment to let me know what you think about it! Share it to your friends and learn new things together.
Transcript

Demography and intergenerational public transfers:
a political economy approach
Loïc Batté∗
Work in progress, please do not cite.This version: March 25, 2013
Abstract
This paper aims at studying how demographic changes impact the public pro-
vision of social security and publicly-funded education, when these policies are
determined as the outcome of a vote that involves both contributory and ben-
e�ciary generations. To this end, I set up an OLG model with production and
intragenerational heterogeneity, in which these two intergenerational transfers are
funded through taxes on the working generation. Individual preferences for taxa-
tion are aggregated through probabilistic voting. Contrary to previous studies in
the �eld, which need to posit the existence of successive contracts between gener-
ations, the emergence and continuation of intergenerational tranfers only results
here from the ability of each age group to tip the scales of redistribution to its
side at each given period.
Under the assumption of non-strategic voting, and picking speci�c functional
forms, I derive predictions on the impact of fertility and mortality rate changes
on the level and composition of public spending, as well as on the potential of
the economy to accumulate physical and human capital. In particular, population
ageing points out to a rising tax burden in the future. I put these predictions into
perspective with historical data on the secular evolution of public spending.
JEL Classi�cation: E24, E62, H42, H52, H55, J11.
Keywords: Demographic change, education, pensions, political economy oftaxation.
∗PhD candidate, Toulouse School of Economics & GREMAQ. Contact: [email protected]. I wishto thank warmly Gilles Saint-Paul for his very valuable advice and support. This work also bene�teda lot from comments by Georges Casamatta, Philippe de Donder, Eric Mengus, Christian Hellwig,Marti Mestieri, Juan Carlos Conesa, as well as seminar participants at Toulouse School of Economics,Universitat Autonoma de Barcelona and the ENTER Jamboree 2013 in Université Libre de Bruxelles.All remaining errors are of course mine.
1

1 Introduction
1.1 Motivation and aim of this paper
The recent debates on social security reforms in many advanced economies have shednew light on the relevance of population ageing on long-term growth or public �nancesustainability. More generally, they compel us to think about the impact of publicpolicies on intra- and intergenerational redistribution, human and physical capital ac-cumulation, and productivity growth. Crucial to these issues is the way in which thesize of government and the composition of public spending are collectively decided upon.If, as is the case in many OECD countries, public policies are determined through avoting process, we need to know both how individual preferences about the policiesaggregate into collective choice, and how this collective choice a�ects private decisions.The relative political power of each generation then becomes determinant when policiesthat involve intergenerational tranfers are considered.
In this paper, I focus on two particular public policies with strong generational contents:education and retirement.1 I seek to address speci�c questions that are relevant topractitioners of political economy, public economics or even growth theory. First, Itackle the problem of explaining the emergence and continuation of PAYGO pensionsystems, viewing it here primarily as an inter- and intra-generational redistribution tool.Similarly, I investigate the reasons that underlie the public funding of education, in apositive rather than a normative way. Second, I look at how demography (summed upin the model by two proxies of the fertility and mortality rates) can impact total publicspending, as well as its allocation between pensions and education subsidies. Finally,I try to shed light on how demographic change may alter the processes of physicaland human capital accumulation. In particular, I wish to separate the direct e�ectsof demographic change on economic behaviour (e.g. the fact that increased longevitymakes saving more desirable, or the capital dilution e�ect of increased fertility) from thee�ects that stem from modi�ed political decisions on public spending. All these issuesare adressed with a political economy lens, as public spending decisions are assumed tobe the outcome of popular vote.
To these ends, I set up a model in which I divide the general population in three gen-erations (young, middle-aged and old individuals) that coexist in a closed-economy,overlapping-generations setting with production, physical and human capital accumu-lation. The middle-aged (i.e. working-age or active) generation �nances educationsubsidies2 to the youngs, as well as pensions for the elderly, through two earmarked �at
1The focus on these two policies stems from the large share of GDP they represent in most advancedeconomies, and the fact that part of the literature considers them to exhibit complementarity features.I do not study health care in this paper: although the healthcare system operates some degree ofredistribution towards the old, it also exerts a function of insurance within each generation.
2These education subsidies are also referred to as tuition help.
2
taxes levied on labor income. The political process, modelled as probabilistic votingon the two tax rates, determines the size of the public sector and the allocation ofpublic spending. Because the education policy may have a redistributive impact withineach generation, I assume some degree of intragenerational heterogeneity, alongside theintergenerational one. This takes the form of an initial private ability owned by youngindividuals, who can use it (and the tuition help) to acquire education.
I �nd that pensions and education subsidies come into existence only as the result of adirect con�ict between bene�ciaries of the two policies, and that there is no complemen-tarity between the two types of intergenerational transfers. The relative importance ofthe two transfers comes from the political in�uence each generation exerts on policy-makers, be it through the higher responsiveness of each member of the age groups topolicy or through the sheer numbers of voters in each age group. Additionally, themodel delivers the prediction that the ageing of population should translate into anincreasing taxation burden: a decrease in fertility and an increase in longevity bothforce the total level of taxes on the working segment of the population upwards.
1.2 Literature review
A part of the literature on the political economy of pensions considers pensions asone of the two pillars of an intergenerational pact (the second pillar being educationtransfers), which has the ability to restore e�ciency even when some of the generationslack commitment or cannot access capital markets.3 For instance in Boldrin & Montes(2005), authors consider the system of transfers to be the outcome of majority voting:since recipients of the transfers fail to constitute a majority, these tranfers are sustainedin equilibrium only through reputational considerations and speci�c out-of-equilibriumstrategies that can be interpreted as a contract between all successive generations.4
This paper departs from this idea by considering a di�erent mechanism for preferenceaggregation, namely probabilistic voting (as �rst introduced by Lindbeck & Weibull(1987)): the outcome of the voting process then maximises a weighted sum of theutility of voters, and ultimately depends on current state variables only, provided votersbehave in a non-strategic way (i.e. if they fail to internalise the e�ect of current policychoices on future ones, even if future policy rates are correctly anticipated). In thissetting, no reputation mechanism, commitment technology nor altruism is needed toexplain the outcome of positive education and pension transfers. In this respect, my
3See for instance Boldrin & Montes (2005), or Rangel (2003) for a more general discussion of whatis meant by intergenerational contracts.
4The set of strategies and beliefs sustaining the equilibrium amounts indeed to a contract thatstipulates that each generation accepts to provide pensions and education to the dependent generations,expecting repayment when old, and where breaching the pact once results in the termination of alltransfers for the whole history of the game. See also Belletini & Berti Ceroni (1999) for an example ofthis in a slightly di�erent setting.
3
model is closest to Gonzalez-Eiras & Niepelt (2007) and Lancia (2010).
Another advantage of this formulation is that taxation levels (and hence the share ofoutput devoted to public spending) depend on the parameters of the model in a richerway than if majority voting was used: indeed, parametrical changes fail to changethe identity of the median voter (which is usually one individual inside a large ageand/or income group) in the setups presented above, so that they in�uence policyonly insofar as they have an impact on the median voter's preferred policy. On theopposite, parametrical changes in my model impact both the policy preferences of eachagent and their weight in the decision process. This allows to analyse how the agestructure of the population (summed up by two parameters that proxy the fertility andmortality rates) in�uences the size and composition of public spending. These resultscan then be interpreted in a historical perspective: we are able to confront the resultsof our comparative statics exercises to empirical estimates in Lindert (94), which showthat the shift in the age structure explains to a large extent the development of socialspending (encompassing social security and educational spending) between the end ofthe 19th century and 1930. Lindert (96) con�rms this role for subsequent years.
Additionally, this model incorporates general equilibrium e�ects of taxation (as inBoldrin & Rustichini (2000)), since the factor prices (wages and interest rates here)are endogenously determined and depend on the levels of taxation which are votedfor in the political process: in turn, they in�uence the private behaviour of agents (oncapital accumulation and education decisions), and the tax rate preferences of each cat-egory of individuals. A last contribution of this model is to introduce intragenerationalheterogeneity, which allows to investigate distributional issues as well as e�ciency. Al-though the education subsidy is not a purely redistributive policy tool, it allows for apotential reduction of initial inequality within a given generation. To the best of ourknowledge, introducing within-cohort heterogeneity has not been attempted before, ina context where education and pension policies are jointly determined by popular vote.One thing we do not consider in this version of the paper5 is a (within-a-generation)redistributive pension system: it has been shown elsewhere (see Conde Ruiz & Galasso(2005)) that this brings additional support to pensions, from several age segments ofthe general population.
Outline The rest of the paper is organised as follows. Section 2 presents the structureof the model and its main assumptions. In section 3, I solve for the general dynamics ofthe model in two steps: �rst by considering private decisions under given tax rates, thenby analysing political decision-making on the level of the two taxes, under additionalassumptions. Section 4 derives predictions about the impact of demographic change onthe levels of both tax rates, and the overall trajectory of the economy: these predictions
5A previous version of this paper allowed for redistributive pensions; further research is needed tosolve the model with this speci�c amendment.
4

are confronted with available empirical evidence. Finally, section 5 discusses some ofthe assumptions and results, and concludes.
2 Model setup
2.1 OLG structure, and private decisions
2.1.1 Agents
Time is discrete and indexed by t. At every period, three generations (young, middle-aged workers, old pensioners) coexist. I denote N t1
t2 the number of individuals born at t1alive at t2 6: N t
t (respectively Nt−1t and N t−2
t ) then denotes the number of young (resp.middle-aged workers and old people) alive at t. All individuals live for the �rst twoperiods. To proxy longevity, we assume that only an exogenous fraction δt ∈ (0; 1] ofthe middle-aged workers of period t−1 reached old age in t. I also denote nt the fertilityrate of the middle-aged generation of t. It follows from the de�nitions of the fertilityand death rates that in period t, the young generation is (1 + nt) time as numerous asthe middle-aged one, and the middle-aged workers are (1 + nt−1)/δt time as numerousas the old.7
2.1.2 Private decisions
Utility Young agents born at t with innate ability ωi seek to maximise their lifetimeutility U with respect to consumption at all periods:
U ti,t = ln(cti,t) + β ln(cti,t+1) + β2δt+2 ln(cti,t+2) (1)
Middle-aged agents also maximise a reduced version of this lifetime utility, their con-sumption when young being �xed once they reach working age. Here, β represents aone-period discount rate on future utility �ows. The one-period utility is chosen to belogarithmic, at each period. The following paragraphs describe the actions available toagents, and the constraints they face, in each period.
Youngs Young individuals born at t (indexed by their type i) have an innate abilityωi ∼ F (ω), which is independently and identically distributed (F denoting the cumu-lative distribution function of abilities). They do not consume in t. The only decision
6In order to be consistent, the superscript over any variable will henceforth refer to the date of birthof the individual, while the subscript will indicate the current period (possibly along another subscriptdesignating the type of an individual, whenever relevant), unless otherwise mentioned.
7This last relationship stems from N t−2t = δtN
t−2t−1 and N t−1
t = N t−1t−1 = (1 + nt−1)N
t−2t−1 .
5

young individuals need to take is whether to educate or not, education being a zero-onedecision.
Along with help (or tuition services) provided by the state gt, which is determined asdescribed in subsection 2.3, the innate ability ωi determines the actual welfare cost toeducate as follows:
f(ωi; gt) = ln
(1 +
1
gt + ωi
)(2)
It is noteworthy that the tuition help provided to each young gt is una�ected by theindividual educational decision, and does not depend on ability: I assume abilities tobe unobservable, and that the education decision is taken after receiving the govern-mental help only, so that government has to provide universal education and to allocateeducational resources equally between individuals. Educating is here a zero-one deci-sion: either the individual pays the full cost of education f , and he will become aneducated worker in the next period, or he does not pay any cost and remains unskilled.For analytical tractability reasons, the welfare cost is assumed to be logarithmic in theinverse of (gt +ωi), which I interpret as a (monetary-equivalent) cost to educate. I alsowish to stress here the fact that ωi, the innate ability, is in�nitely substitutable withgovernment help in education: this is naturally an extreme view, as individual abilityis undeniably complementary to some degree to tuition services proposed by the state.This is nonetheless also warranted for analytical tractability.8
Middle-aged workers At this stage, every middle-aged worker (born at t − 1) iseither educated or non-educated, depending on his decision in the previous period.Every worker provides an inelastic labor supply and receives a wage. Let we,t (resp.w0,t) the wage received by a skilled (resp. unskilled) worker. A fraction τe,t of this wageis taxed by the government to provide a transfer to the young; similarly, a fraction τp,tis taxed to fund pension bene�ts for old individuals. The two tax rates are later onreferred to as the education tax rate and the pension tax rate. The remaining disposableincome (1− τe,t− τp,t)wj,t (where j ∈ {0, e}) can be spent for consumption or saved fornext period, which individuals will reach with the exogenous probability δt+1 < 1 only.Let ct−1j,t denote the consumption at time t of a middle-aged worker of type j and sj,this savings, the private budget constraint for date t then writes:
(1− τe,t − τp,t)wj,t = ct−1j,t + sj,t (3)
Pensioners The surviving old individuals receive pension bene�ts pj,t depending ontheir type j ∈ {0, e}, and the product of their savings from last period sj,t−1. Fortractability reasons, it is assumed that on top of their own savings, pensioners also
8The analytical form chosen here ensures that it is always costly to educate (namely f(ω, g) >0, ∀g, ω), that education is in�nitely costly when ω = g = 0, and that an individual with in�nite abilitywill incur no welfare cost to educate whatever the help provided (since limω→+∞ f(ω, g) = 0, ∀g).
6

receive a share of the savings that were made by the deceased members of their owngeneration.9 An interpretation is that middle-aged workers have access to perfectlycompetitive life insurance providers, which sell policies that collect one's savings incase of death and rebate the product of the savings of those who deceased in case oflife. Between periods t and (t + 1), the insurance companies invest the premia theycollected (i.e. the totality of savings) in the production process and get a gross rate ofreturn Rt. Under a zero-pro�t condition for life insurance companies, each survivingindividual of type j then receives an amount equal to (1− δt)/δt ·Rtsj,t−1.
10
The private budget constraint for date t of an old individual is then:
ct−2j,t = Rt(sj,t−1 +1− δtδt
sj,t−1) + pj,t = Rtsj,t−1δt
+ pj,t (4)
2.2 Production
Production Yt uses capital Kt and labor as inputs. Let Ne,t (resp. N0,t) denote thee�cient labor supplied by educated (resp. non-educated) workers at time t. I assumethat skilled labor is fully substitutable with unskilled labor, at a rate η > 111. I callskill premium this exogenous η (as it will be clear that we,t = ηw0,t). It is assumedthat capital fully depreciates after every period of production, so that the capital ateach period is the sum of all savings made by workers at the previous period. Theproduction function is Cobb-Douglas in capital and e�cient labor, with α < 1 theelasticity of production with respect to e�cient labor:
Yt = (N0,t + ηNe,t)αK1−α
t
Let yt = YtNt−1
t
and kt = Kt
Nt−1t
the output and capital per worker ratios, and let µt the
fraction of educated individuals in the workforce at time t (i.e. the fraction of middle-aged workers at time t that educated in period t − 1). This last de�nition allows toreexpress each type of labor as follows: Ne,t = µtN
t−1t and N0,t = (1−µt)N t−1
t . Outputper worker then writes:
yt = (µtη + 1− µt)αk1−αt (5)
Given this functional form for production, and assuming the labor and capital marketsto operate under perfect competition, one gets:
w0,t = α(µtη + 1− µt)α−1k1−αt (6)
9An alternative assumption would be to consider accidental bequests: this is unwarranted for ourstory here, and needlessly complicates the computations.
10This type of contract could be considered as an annuity contract, except there is only one periodon which to pay the annuity in case of life.
11Empirical studies seem to indicate that skilled and unskilled labor are imperfect substitutes atbest. Yet, the point of this assumption is to abstract from considerations of the relative supply ofskilled versus unskilled labor when trying to determine the skill premium η, which is exogenous underthe previous assumption.
7

we,t = ηα(µtη + 1− µt)α−1k1−αt = ηw0,t (7)
Rt = (1− α)(µtη + 1− µt)αk−αt (8)
Equations (6) and (7) show why the paremeter η is called skill premium, as it representsthe relative contribution to production and wage of a skilled worker as compared to anunskilled one.
2.3 The public sector: education subsidies and pensions
The public sector is designed to implement a level of taxes τe,t and τp,t, levied on middle-aged workers' payroll income, to fund education subsidies to the youngs and pensionsto the old. Subsection 2.4 presents the way in which these two linear taxes are decidedat each period; for now, treating these tax levels as given is su�cient.
Education subsidies gt are provided to every young individual, irrespectively of their�nal decision to educate or not. As stated earlier, I make the assumption that thegovernment cannot observe the type of each individual (represented by ωi), and thatthe provision of tuition help occurs before the decision to educate or not is taken. Thepublic budget constraint of the education system is:
τe,tNt−1t (µtwe,t + (1− µt)w0,t) = gtN
tt
⇔ gt =τe,t
1 + n(µtwe,t + (1− µt)w0,t) =
τe,t1 + n
αyt (9)
Contrary to the educational transfers, pension bene�ts pj,t are awarded to retireesaccording to their level of education. More precisely, the relative pension of an educatedretiree vs. a non-educated one is constrained to match the relative wage (which makesthis pension system non redistributive within a generation, or Bismarckian). The publicbudget constraint of the pension system is written as follows:
µt−1pe,t + (1− µt−1)p0,t =τp,t(1 + n)
δt(µtwe,t + (1− µt)w0,t) =
τp,t(1 + n)
δtαyt (10)
with pe,t = ηp0,t to match relative wages.12
12See equation (7) for a derivation of relative wages.
8

2.4 Voting over education and pensions
In order to determine the level of the education and pension taxes, a way of aggregatingthe preferences of heterogeneous agents must be de�ned.
I de�ne �rst the indirect utility of an individual as the maximal utility the individualcan get from his private decisions, as a function of the two taxes. For instance, theindirect utility in period t of an educated middle-aged individual born in period (t−1),denoted V t−1
t,e , writes:
V t−1t,e (τe,t, τp,t, µt, kt) = max ln(ct−1t,e ) + βδ ln(ct−1t+1,e) (11)
s.t. (3), (4), (10)
Then this indirect utility is the criterion by which each individual evaluates any pro-posed level of taxes.
In what follows, we consider the levels of the two taxes to be the outcome of a politicalcompetition involving two parties, which propose a policy platform which they arecommitted to implement if elected. Since the policy space (τe,t, τp,t) is bidimensional, aCondorcet winner may fail to exist, so that one has to use another political equilibriumconcept to describe the outcome of such a process. Among the options suggested in theliterature, I choose to implement here probabilistic voting as in Lindbeck & Weibull(1987).
In a two-party electoral competition setting, it is assumed that voters have intrinsicideological preferences for parties, on top of the preferences for their policy platform.In any constituency with shared characteristics (here, in any age-income group), someof the voters have strong ideological preference for a party, so that they are inclinedto support it unless it proposes a very detrimental platform, while others have lowideological attachment and are assumed to be very responsive to a change of platform.Consequently, a policy platform shift by one party induces a gradual, smooth change inthe proportion of voters supporting it in every age and income-related constituency. Asconstituencies may be more or less responsive to the proposed policy, a politician seekingelection will be more or less willing to cater to its special interests. Because politiciansare assumed to propose the platform which attracts the highest number of voters,both parties seek to balance the interests of the di�erent groups. These considerationsare translated analytically by attributing political weights to each constituency (theweight being higher for constituencies more attached to the policy platform and lessconcerned about ideology). Any o�ce-motivated politician will then propose the taxpolicy platform that maximises the political-power weighted sum of each constituency'sindirect utility under the tax policy.
In the present case, I choose to attribute age-related political weights only, avoidingto discriminate constituencies by their level of education (hence of income as well).Denoting ρ (respectively χ and ψ) the per individual political power of the young (re-spectively middle-aged and old) generation, the politicians propose the policy platform
9
(τe, τp) that maximises:
Wt = ρ(1 + n)
(∫ ∞i=0
V tt,idF (i)
)+ χ(µtV
t−1t,e + (1− µt)V t−1
t,0 ) (12)
+ψδt
1 + nt−1(µt−1V
t−2t,e + (1− µt−1)V t−2
t,0 )
Probabilistic voting was chosen in this context because of its main property of takinginto account the utility of each individual in the population. Indeed, under the median-voter setting, segments of the population which have preferences far away from thoseof the median voter fail to be represented, and may end up with a very low indirectutility under the chosen policy. While it might be argued that this is a realistic featureof general elections in a democracy, it does not �t well in a setting where large fractionsof the voters share a special interest and might get their voice heard in the democraticprocess even if they do not form a majority. For instance, in this model, because theyoungs (respectively the elderly) are direct recipients of educational subsidies (respec-tively pensions) and enjoy a direct, sizeable bene�t from a positive τe (respectively τp),any con�guration of the electorate where the median voter would choose a zero taxrate would substantively damage the utilities of the group. Hence, it seems plausibleto include every individual's indirect utility into the politician's objective function atthe time of policy proposal.
Moreover, as the economic conditions change, the identity of the median voter willchange in continuous distributions of voters, but not necessarily in settings where thegeneral population is divided into large homogenous categories. In our model, whilethe young generation is indeed distributed continuously with respect to private abilities,the middle-aged and old generations are divided into two broad categories inside whichindividuals are homogenous. Hence, provided that the median voter (if it exists at allin two dimensions, else in one of the two dimensions) does not belong to the younggeneration under a set of parameters of the model, one cannot expect a slight changein a parameter to change the identity of the median voter (while it may still changethe median voter's preferred policy). This is an undesirable feature if, as in this paperone wishes to study the in�uence of some parameters on equilibrium (for instance, theimpact of the fertility rate n in our case)13.
2.5 State variables, timing of decisions and dynamics
Following the desciption of this economy, it is straightforward to see that the state ofthe economy at t is entirely described by the two state variables µt, the fraction ofeducated workers, and kt, the capital per head. The dynamics of this economy is then
13For a more detailed discussion of probabilistic voting, I refer the reader to Persson & Tabellini(2000).
10
twofold: the level of taxes is �rst determined by a vote at the beginning of each period,given the state of the economy. Then given the tax rates that have been voted upon,the value of the state variables evolves according to the education decisions of youngindividuals and the savings decisions of middle-aged workers (who take into accounttheir expectations of the future tax rates as well). We turn to analysing this dynamicsin the next section.
3 The politico-economic dynamics
In this section, I study how the dynamics of the economy unfolds, using backwardinduction. I �rst derive the behaviour of private agents under given taxes, which yieldsa law of motion for the state variables µt and kt when a speci�c tax policy τt is chosen.Thereafter, under several additional assumptions, I am able to characterise the policyoutcome for a given state of the economy. The law of motion of the state variables,together with the implicit policy rule, yields the entire politico-economic dynamics ofthe economy, and allows to characterise its steady state.
3.1 Dynamics of the economy under given tax policies
In this subsection, I derive explicit solutions for the private decisions made by individ-uals given the state of the economy, the current value of the tax rates τe,t and τp,t, andthe expected values of tax rates in the next period, τe,t+1 and τp,t+1. It is noteworthythat the agents are assumed to take their private decisions under rational expectations:since there is no uncertainty in this model, the expected values of future tax rates areequal to the true ones.
3.1.1 Optimizing over educational choice and savings
The educational choice made by a young individual born at date t is solved backward,�rst obtaining the savings decision made by middle-aged workers of education j ∈ {0, e}at date t+ 1.
Savings decision Type j worker seeks to maximise his second-period utility V t−1j,t =
ln(ct−1j,t ) + βδt+1 ln(ct−1t+1) subject to (3), (4). The FOC on savings sj,t yields:
sj,t =βδt+1
1 + βδt+1
(1− τe,t − τp,t)wj,t −δt+1pj,t+1/Rt+1
1 + βδt+1
(13)
11
One then gets the level of consumptions at t and t+ 1 of the middle-aged individual ofeducation j born at t− 1:
ctj,t =1
1 + βδt+1
(1− τe,t − τp,t)wj,t +δt+1pj,t+1/Rt+1
1 + βδt+1
(14)
ctj,t+1 =βRt+1
1 + βδt+1
(1− τe,t − τp,t)wj,t +βδt+1pj,t+1
1 + βδt+1
(15)
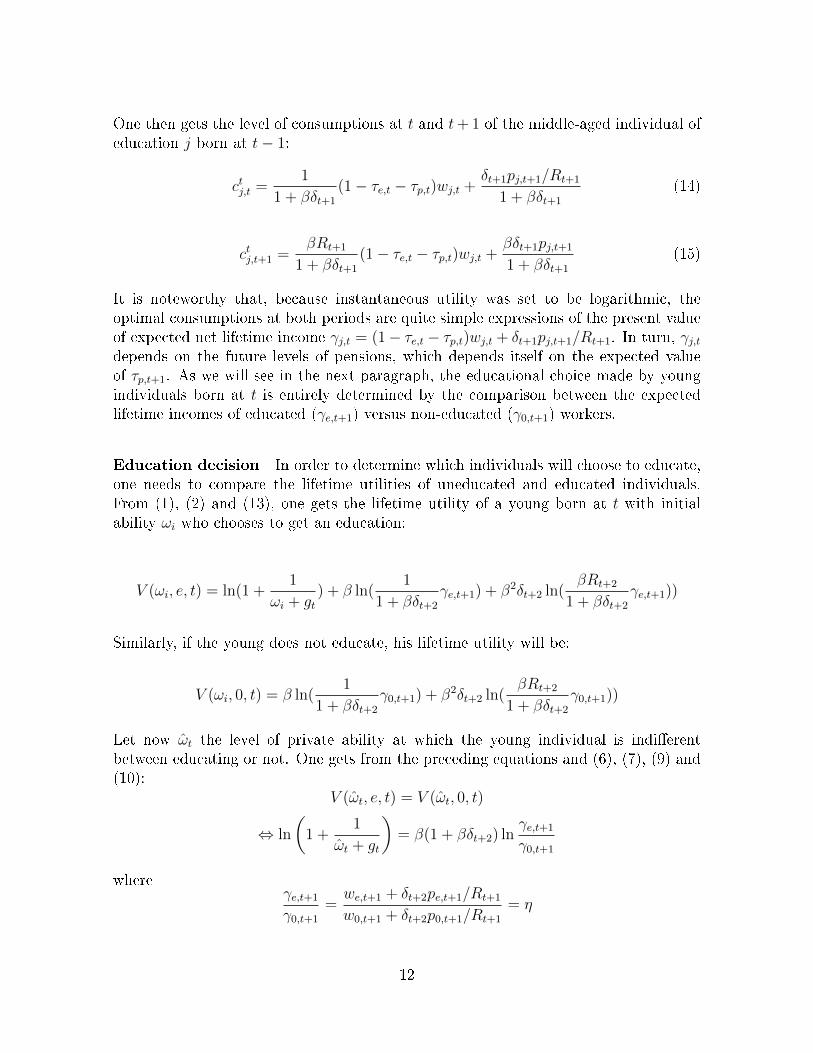
It is noteworthy that, because instantaneous utility was set to be logarithmic, theoptimal consumptions at both periods are quite simple expressions of the present valueof expected net lifetime income γj,t = (1− τe,t − τp,t)wj,t + δt+1pj,t+1/Rt+1. In turn, γj,tdepends on the future levels of pensions, which depends itself on the expected valueof τp,t+1. As we will see in the next paragraph, the educational choice made by youngindividuals born at t is entirely determined by the comparison between the expectedlifetime incomes of educated (γe,t+1) versus non-educated (γ0,t+1) workers.
Education decision In order to determine which individuals will choose to educate,one needs to compare the lifetime utilities of uneducated and educated individuals.From (1), (2) and (13), one gets the lifetime utility of a young born at t with initialability ωi who chooses to get an education:
V (ωi, e, t) = ln(1 +1
ωi + gt) + β ln(
1
1 + βδt+2
γe,t+1) + β2δt+2 ln(βRt+2
1 + βδt+2
γe,t+1))
Similarly, if the young does not educate, his lifetime utility will be:
V (ωi, 0, t) = β ln(1
1 + βδt+2
γ0,t+1) + β2δt+2 ln(βRt+2
1 + βδt+2
γ0,t+1))
Let now ωt the level of private ability at which the young individual is indi�erentbetween educating or not. One gets from the preceding equations and (6), (7), (9) and(10):
V (ωt, e, t) = V (ωt, 0, t)
⇔ ln
(1 +
1
ωt + gt
)= β(1 + βδt+2) ln
γe,t+1
γ0,t+1
whereγe,t+1
γ0,t+1
=we,t+1 + δt+2pe,t+1/Rt+1
w0,t+1 + δt+2p0,t+1/Rt+1
= η
12
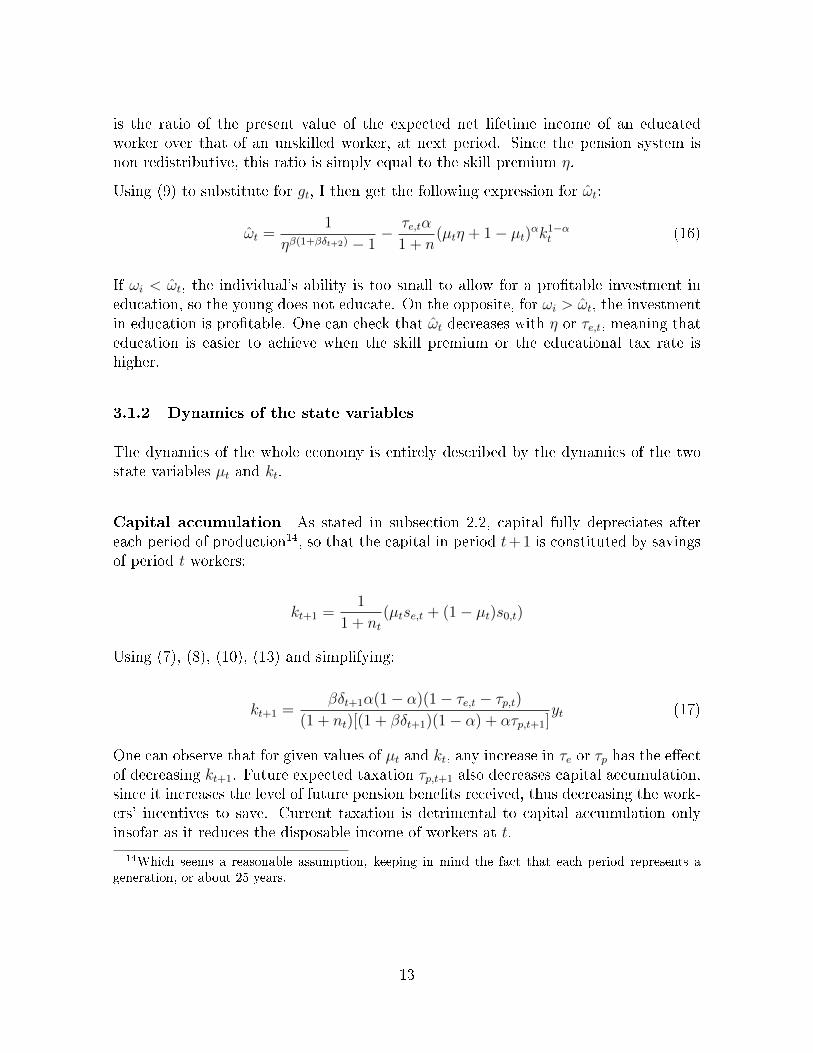
is the ratio of the present value of the expected net lifetime income of an educatedworker over that of an unskilled worker, at next period. Since the pension system isnon redistributive, this ratio is simply equal to the skill premium η.
Using (9) to substitute for gt, I then get the following expression for ωt:
ωt =1
ηβ(1+βδt+2) − 1− τe,tα
1 + n(µtη + 1− µt)αk1−αt (16)
If ωi < ωt, the individual's ability is too small to allow for a pro�table investment ineducation, so the young does not educate. On the opposite, for ωi > ωt, the investmentin education is pro�table. One can check that ωt decreases with η or τe,t, meaning thateducation is easier to achieve when the skill premium or the educational tax rate ishigher.
3.1.2 Dynamics of the state variables
The dynamics of the whole economy is entirely described by the dynamics of the twostate variables µt and kt.
Capital accumulation As stated in subsection 2.2, capital fully depreciates aftereach period of production14, so that the capital in period t+ 1 is constituted by savingsof period t workers:
kt+1 =1
1 + nt(µtse,t + (1− µt)s0,t)
Using (7), (8), (10), (13) and simplifying:
kt+1 =βδt+1α(1− α)(1− τe,t − τp,t)
(1 + nt)[(1 + βδt+1)(1− α) + ατp,t+1]yt (17)
One can observe that for given values of µt and kt, any increase in τe or τp has the e�ectof decreasing kt+1. Future expected taxation τp,t+1 also decreases capital accumulation,since it increases the level of future pension bene�ts received, thus decreasing the work-ers' incentives to save. Current taxation is detrimental to capital accumulation onlyinsofar as it reduces the disposable income of workers at t.
14Which seems a reasonable assumption, keeping in mind the fact that each period represents ageneration, or about 25 years.
13

Evolution of the share of educated workers As stated in subsection 3.1.1, youngindividuals born at t educate if and only if their private ability ωi is above the cuto�ability ω. Recalling that I de�ned F as the cumulative distribution function of privateabilities, one gets:
µt+1 = 1− F (ωt) (18)
3.2 Additional assumptions
In order to solve the model further, I make several assumptions on the distribution ofabilities of the young, their participation in the political process, and the way in whichexpectations of future policy impact the current policy choice at date t.
3.2.1 Time-path of demography parameters
In order to perform simple analyses of the impact of demography on the policy choices,I will analyse only one type of path for the fertility and longevity parameters. Namely,I will consider constant fertility and longevity from the start of time (t = 0) up to someperiod t′, after which one of the two parameters is allowed to change permanently toa new, constant value. It is assumed that agents do not anticipate the shock at all,but that they correctly perceive it to be permanent once it has occured. The aim ofthis exercise is to characterise the response to an unexpected permanent demographicshock, while keeping things reasonably simple to analyse.
Assumption 1 The time path of demography parameters is as follows:
nt = n, δt = δ, ∀t < t′
nt = n′ or δt = δ′, ∀t ≥ t′
3.2.2 Distribution of abilities
For analytical tractability reasons, and additionally to the setup presented in section2, I look at a particular case where abilities are distributed uniformly.
Assumption 2 Abilities are distributed uniformly over the interval [0; ω], where:
ω =1
ηβ(1+βδ) − 1
14

Under this assumption, it obtains that:
ωt = ω − τe,tα
1 + nt(µtη + 1− µt)αk1−αt
Using the formula of the pdf of a uniform distribution:
µt+1 = 1− F (ωt) = 1− ωtω
=τe,tαyt
ω(1 + nt)(19)
Then the relationship between the policy rate τe,t and the future value of the statevariable µt+1 is linear, for a given level of production. Moreover, µt+1 = 0 when τe = 0,and the marginal e�ect of τe on µt+1 is strictly positive at τe = 0: indeed, at τe = 0,the young with the highest ability ω is indi�erent between educating or not, so thata marginal increase in τe has a positive impact on education. Such features avoidobtaining a discontinuous policy function around values of kt and µt where optimalpolicy involves no education, which highly simpli�es subsequent analysis of the impactof the education tax rate on the future state of the economy.
3.2.3 Voting rights
In the rest of this paper, young individuals are assumed to hold no political power.
Assumption 3 Young individuals hold no political power: ρ = 0.
This is largely a simplifying assumption, yet it can be supported by the fact that politicalrights are tied with electoral majority in most countries, entailing that the youngestfraction of the population has no impact on electoral outcomes. Notice that assuming astrictly positive value of ρ would only tip further the scales towards education subsidies,since the young are the direct bene�ciaries of education transfers.15 Assumption 3 thenmerely underestimates the scope for public �nance of education, without changing theessence of the results.
In this setting, ψ and χ then become redundant parameters (in the sense that collectivepreferences for taxation are left unchanged if both ψ and χ are multiplied by the sameconstant), so we assume χ = 1 without loss of generality. ψ then becomes the relativepolitical power of one pensioner compared to one worker: although solid empiricalevidence on the value of this parameter is hard to obtain, higher electoral turnout ofelderly people compared to the general population, as well as the relative salience ofpension policy on pensioners' welfare, point out to a value of ψ higher than one.16
15Of course, the young want to increase τe only up to the point where taxation is not too detrimentalto capital accumulation: I believe the direct e�ect of an increase in τe nonetheless dominates this lattere�ect, around the values of τe that are obtained when ρ is set to zero.
16Notice that ψ is independent from the relative mass of pensioners and workers in the population,even though sheer numbers in a generation also have an impact on the policy outcome.
15

3.2.4 Expectations of future policies
As may be seen from subsection 3.1.1, private decisions about savings and educationare dependent on the expected future state of the economy (and expected future policychoices). For instance, the lifetime income (in net present value) of a middle-agedindividual at t depends not only on his wage, but also on the net present value of thefuture pension he will receive at (t + 1), which in turn depends on the level of capitalkt+1 and the share of educated workers µt+1 of next period. But this future pensionalso depends on the future contribution rate τp,t+1, which will be decided upon in nextperiod. Given that the savings decision at t is based on the expected net presentvalue of lifetime income, it is dependent on the anticipation the agent makes aboutτp,t+1. More generally, all private decisions depend on the anticipated future policychoices. Therefore, the current policy choices (τe,t, τp,t) potentially depend as well onthe anticipated future policy choices of next period (τe,t+1, τp,t+1), since these policychoices are made to maximise indirect utilities that are themselves the result of privatedecisions.
In this paper, I assume that agents have rational expectations of future policies, but donot vote strategically: when voting on their preferred policy for today, they take the(correctly anticipated) value of future ones as given and ignore the impact their choicewill have on the future policy choice.
Assumption 4 All agents are assumed to vote in a non-strategic way:
(τe,t+1, τp,t+1) = (τe,t+1, τp,t+1)
∂Wt
∂τe,t+1
=∂Wt
∂τp,t+1
= 0
Another assumption about the formation of expectations is to consider that agentsvote in a sophisticated way. In this case, agents not only know the level of future taxrates but also the true policy rule of the economy: this knowledge allows to computethe impact of a change of policy now on future policies, which are not considered asgiven anymore at the time of the current political decision. The main motivation forconsidering the agents to vote non-strategically is the fact that each agent is atomisticand thus cannot change the outcome of the vote by himself; then future policy itselfcan be considered to be invariant to the current individual policy choice.
3.3 Taxation choices
Under assumption 3, the two policy rates now maximise the following welfare function:
Wt = (µtVt−1e,t + (1− µt)V t−1
0,t ) +ψδt
1 + nt−1(µt−1V
t−2e,t + (1− µt−1)V t−2
0,t )
16

The choice set for policies is de�ned as:
S =
{(τe; τp) ∈ [0; 1]2 | 0 ≤ τe + τp ≤ 1, τe ≤ τe,max(yt) =
ω(1 + nt−1)
αyt
}where the last condition on τe is used to rule out from the start cases in which τe isso large that education subsidies divert more resources than what is needed to ensureµt+1 = 1 (which is a pure waste). S is a compact and convex subset of R2.
Under assumptions 2 and 4, appendix A shows that the partial derivatives of Wt on Sare as follows:
∂Wt
∂τe,t= βαδt+1
(η − 1)αytω(1 + nt) + τe,t(η − 1)αyt
− 1 + βδt+1 − βαδt+1
1− τe,t − τp,t(20)
∂Wt
∂τp,t=
ψδtα
(1 + nt−1)(1− α + ατp,t)− 1 + βδt+1 − βαδt+1
1− τe,t − τp,t(21)
Because future levels of taxation are taken as given in the welfare maximisation pro-gram, and since per-period utility is assumed to be logarithmic, these future expectedtax rates disappear in the determination of current taxes (again, see appendix A formore details). From the point of view of tax rate determination, the political econ-omy problem is essentially a succession of static ones, unlike cases in which agents votein a fully strategic way. Assumption 4 plays here a fundamental role on this result:since agents take future levels of taxes as given, they neglect the impact their votetoday will have on the outcome of the vote tomorrow (even if this level is correctlyanticipated). The consequence of this assumption is to destroy the dynamic linkagebetween successive policies, which means that this model does not need to rely on rep-utational arguments to sustain equilibria with positive pensions and education, amongother things. Then the current policy choice merely balances the interests of agents,taking into account their relative political power and numbers.
By computing the Hessian matrix of W , one can easily check that W is strictly concavein τ = (τe; τp) ∈ S. Given that S is compact and convex, one and only one couple ofpolicies τ ∗ maximises W in S; moreover, if τ ∗ lies in the interior of S, both derivativesof W with respect to the tax levels (as expressed in equations (20) and (21)) are equalto zero at τ∗. This de�nes a policy rule that maps the state variables of the economyinto a vector of tax rates (τe, τp). The following proposition summarizes this insight:
Proposition 1 The policy rule of the economy τ(k, µ) = (τe(k, µ); τp(k, µ)) is implicitlyde�ned by equations (20) and (21). It solely depends on output y, as de�ned in (5): inparticular, it is una�ected by the future expected values of the tax rates in next period.
17
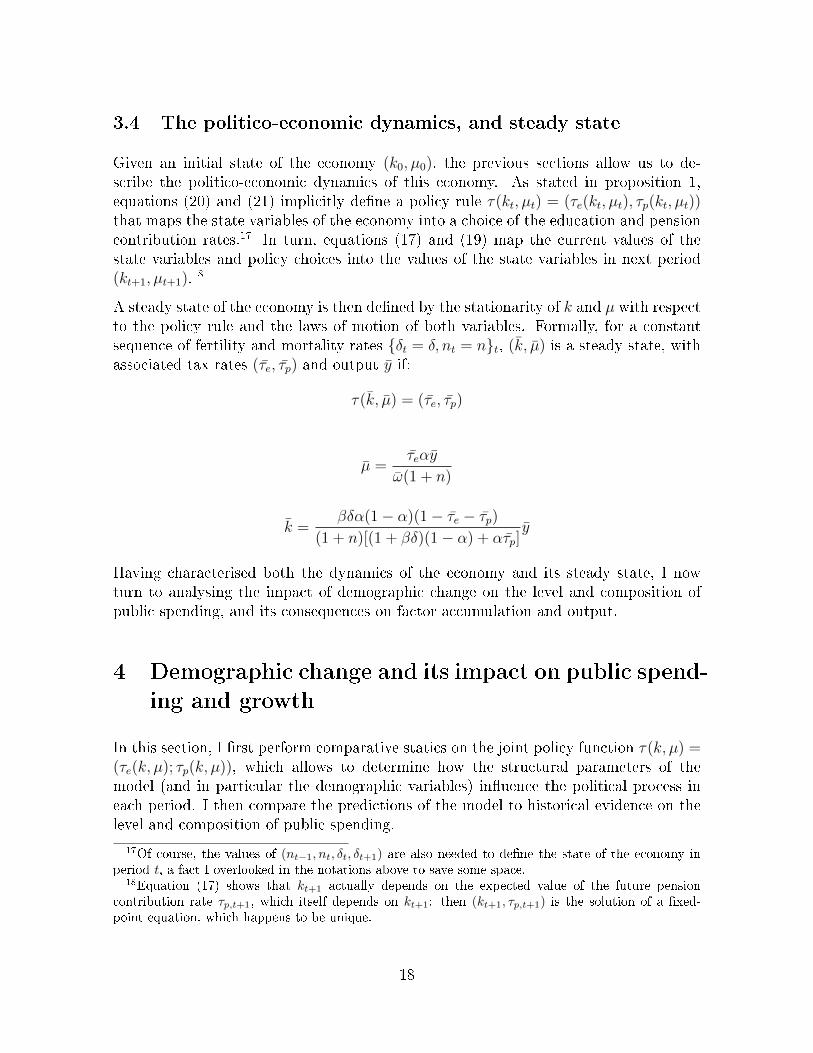
3.4 The politico-economic dynamics, and steady state
Given an initial state of the economy (k0, µ0), the previous sections allow us to de-scribe the politico-economic dynamics of this economy. As stated in proposition 1,equations (20) and (21) implicitly de�ne a policy rule τ(kt, µt) = (τe(kt, µt), τp(kt, µt))that maps the state variables of the economy into a choice of the education and pensioncontribution rates.17 In turn, equations (17) and (19) map the current values of thestate variables and policy choices into the values of the state variables in next period(kt+1, µt+1).
18
A steady state of the economy is then de�ned by the stationarity of k and µ with respectto the policy rule and the laws of motion of both variables. Formally, for a constantsequence of fertility and mortality rates {δt = δ, nt = n}t, (k, µ) is a steady state, withassociated tax rates (τe, τp) and output y if:
τ(k, µ) = (τe, τp)
µ =τeαy
ω(1 + n)
k =βδα(1− α)(1− τe − τp)
(1 + n)[(1 + βδ)(1− α) + ατp]y
Having characterised both the dynamics of the economy and its steady state, I nowturn to analysing the impact of demographic change on the level and composition ofpublic spending, and its consequences on factor accumulation and output.
4 Demographic change and its impact on public spend-
ing and growth
In this section, I �rst perform comparative statics on the joint policy function τ(k, µ) =(τe(k, µ); τp(k, µ)), which allows to determine how the structural parameters of themodel (and in particular the demographic variables) in�uence the political process ineach period. I then compare the predictions of the model to historical evidence on thelevel and composition of public spending.
17Of course, the values of (nt−1, nt, δt, δt+1) are also needed to de�ne the state of the economy inperiod t, a fact I overlooked in the notations above to save some space.
18Equation (17) shows that kt+1 actually depends on the expected value of the future pensioncontribution rate τp,t+1, which itself depends on kt+1: then (kt+1, τp,t+1) is the solution of a �xed-point equation, which happens to be unique.
18

4.1 Demography and the level and allocation of public spending
4.1.1 Comparative statics on policy choices
I �rst analyse the e�ect of a change in parameters on the levels of the two policy ratesthat are chosen in equilibrium, for a �xed value of both state variables (actually for a�xed level of yt, which is the only relevant endogenous variable in the choice of τ ∗t ). Todo so, and to obtain results that are valid both when τ ∗ is in the interior and at theboundary of S, the monotone comparative results of Milgrom & Shannon (1995) shallbe used.
Monotone comparative statics for a submodular function: general method
W is strictly submodular in τ , as the cross-derivative of W is strictly negative every-where:
∂2W
∂τp∂τe |y=cst= −1 + βδt+1 − βδt+1α
(1− τe − τp)2< 0
The method developed by Milgrom & Shannon (1995) for comparative statics is relevantin the case of supermodular functions, however. Their general method can be putinto use by considering the strictly supermodular function W (τ) = W (τ), where τ =
(τe;−τp). Now for any parameter of interest σ, if we obtain that ∂2W∂τk∂σ |y=cst
≥ 0 for
k = 1, 2, then W exhibits increasing di�erences in (τ , σ). Using Milgrom & Shannon(95), supermodularity along with increasing di�erences implies that the argmax ofwelfare τ ∗(σ) is a monotone nondecreasing, continuous function of σ.19 In terms ofthe original choice variables, it means that τ ∗e (σ) would be nondecreasing while τ ∗p (σ)is nonincreasing in σ.
In the following paragraphs, we use this method to examine successively the e�ect ofceteris paribus increases in the two demography parameters nt and δt on the two taxrates. I also consider the impact of the level of output yt on τ .
Impact of a change in the fertility rate nt : I �rst study the impact of a changein nt on the policy decisions taken at the time of the shock t. From equations (20) and(21), we obtain that ∂2Wt
∂n∂τp= 0 and ∂2Wt
∂n∂τe< 0. The result on the cross-derivative with
respect to τe and nt translates the fact that when nt increases, educational subsidiesneed to be shared between more young people, thereby diminishing the returns on theeducation tax rate. In what follows, this e�ect will be called the dilution e�ect offertility on human capital, by analogy with the e�ect on physical capital. Besides, at tthe fertility of the old generation nt−1 is already determined and not impacted by the
19The continuity property comes from the fact that τ∗ maximises W on S, a convex and compactsubset of R2, which allows us to apply the weak version of the maximum theorem.
19

shock, so that the fertility shock has no impact on the pension margin of decision. Thenfollowing Milgrom & Shannon (1995), right after a shock on nt it can be predicted thatτe,t will decrease and τp,t will increase. This phenomenon comes from the fact the e�ectof total taxation on the welfare of middle-aged voters: if education subsidies becomeless e�cient and τe,t is reduced, then there is more �scal space for pension �nancingand τp,t will go up.
Let us now consider the impact of the shock for future periods (i.e. for t+ 1 on), whenthe shock is permanent and perceived as such. From equations (20) and 21), we obtainthat ∂2Wt
∂n∂τp< 0 and ∂2Wt
∂n∂τe< 0. The result on the cross-derivative with respect to τe and
nt is unchanged and can still be interpreted as an input dilution e�ect. The secondinequality is due to the fact that a higher fertility rate in t (and in subsequent periods)reduces the share of pensioners in the voting population from t + 1 on, making theirinterests less represented in the political process. Taken in isolation, these e�ects implythat an increase in the fertility parameter would lead to both lower pensions and lowereducation subsidies: however, and as the submodularity of W suggests, lowering oneof the two tax rates has the e�ect of reducing the burden of total taxation, and henceleaves some space to an increase in the other tax rate. Therefore, it is so far impossibleto determine whether each individual tax rate would decrease if n increased, except ifone of the two tax rates lies at the boundary of S.20 Nonetheless, both tax rates risingconsecutively to an increase in n is absolutely ruled out. In fact, appendix B.1 provesthat total taxation τ = τe + τp actually goes down when n goes up, for any given valuesof kt and µt. The results above are summarised in the proposition that follows:
Proposition 2 In the long run, total taxation τ = τe + τp is negatively impacted byincreases in the fertility rate n. Additionally, if one of the two tax rates is at theboundary of the choice set S for a given state of the economy (i.e. if τe = 0, τe =τe,max(yt) or τp = 0), then an increase in n causes the other tax rate to decrease.
Impact of a change in the longevity parameter δ : In order to determine howan increase in δ would modify the policy choices, the two cross-derivatives of welfarewith respect to the policy rate and δ need to be computed.
∂2Wt
∂δ∂τe,t= βα
(η − 1)αytω(1 + n) + τe,t(η − 1)αyt
− β − βα1− τe,t − τp,t
(22)
Concerning the determination of τe, equation (22) shows that two e�ects compete whenδ increases: on the one hand, an increased probability to survive until the next periodmakes it more likely for current workers to reap the bene�ts of investing into the nextgeneration's education (through increased pensions tomorrow). On the other hand, anincreased survival rate into old age has the e�ect that agents will more likely experience
20In this case, a marginal increase in n leaves this tax rate unchanged, which means the cross-derivative e�ect on W can be ignored.
20

the adverse e�ect of taxation on next-period capital accumulation (which matters, aswell, for tomorrow's production and ultimately pensions).
∂2Wt
∂δ∂τp,t=
ψα
(1 + n)(1− α + ατp,t)− β − βα
1− τe,t − τp,t(23)
Concerning τp, equation (23) indicates that the increased likelihood of reaching old agematters for capital accumulation reasons as well, so that middle-aged voters will caremore about not taxing too large a share of their income now. However, this e�ect isbalanced by the fact that there are more old people when δ goes up, which implies atilt towards more pensions.
To see how the two trade-o�s relative to an increase in δ are usually resolved, �rstnotice that rearranging terms in equations (22) and (23) yield, for k ∈ {e; p}:
∂2Wt
∂δ∂τk=
1
δ
∂Wt
∂τk+
1
1− τe − τp(24)
Additionally, it can be easily shown that ∂Wt
∂τk(τ ∗e , τ
∗p ) ≥ 0 for k ∈ {e; p} as long as τ ∗e > 0
and τ ∗p > 0.21 From equation (24), we can then deduce that both cross-derivatives arestrictly positive as long as the argmax of welfare is strictly positive (i.e. as long as bothtaxes are positive in equilibrium), meaning that the increase in the negative e�ects oftaxations is trumped by the increase in the bene�ts of taxation, for both pensions andeducation subsidies. So both tax rates, taken in isolation, would increase following anincrease in δ.
As in the case of the fertility rate, however, the submodularity of W and the fact thatτe and τp are jointly determined prevent us from reaching an unambiguous conclusion,except if one of the two tax rates is at the boundary of S. Both tax rates can rise,or one can rise at the expense of the other, the only case being ruled out is the onewhere both would decrease at the same time following an increase in δ. As before in thecase of n, I prove in appendix B.2 that total taxation τ = τe + τp necessarily increases(weakly) when δ increases, whatever the state of the economy (kt, µt). These resultsare summarised in the following proposition:
Proposition 3 Total taxation τ = τe + τp is an increasing function of the survival rateδ. Additionally, if one of the two tax rates is at the boundary of the choice set S for agiven state of the economy, then an increase in δ causes the other tax rate to increase.
Analysing the impact of y on policy choices Although y is an endogenous vari-able in the model as a whole, it seems useful to analyse how the political choice madeat t depends on the value of y. Since the policy choice problem is a succession of static
21If the argmax of welfare lies in the interior of S, both derivatives are equal to zero.
21

problems rather than dynamic ones, methods of comparative statics also apply here.As it has been said earlier, this political choice does not hinge on the values of kt or µttaken in isolation, but rather on yt = (µtη + 1− µt)αk1−αt .
Simple computations show that ∂2Wt
∂y∂τe> 0 and ∂2Wt
∂y∂τp= 0. As a consequence, when y
is higher, the education tax rate is bigger or unchanged, and the pension contributionrate is unchanged or lower. All else being equal, a more productive economy will allowfor more support for education and less support for pensions.
4.1.2 The impact of demography on public spending in a historical per-
spective
The late 19th and the 20th century were characterised by a secular decline in mortalityand fertility rates, which can be interpreted respectively as a rise in δ and a fall in n.Notwithstanding the cross-taxation e�ects on welfare discussed above, it seems to bethat a decrease in n or an increase in δ both lead to higher values of τe and τp: at thevery least, the model predicts an increase in the level of total taxation. This seems tobe in line with the historical evidence of a rising share of public spending to GDP. Inow contrast this analysis to empirical studies of the links between the age structure ofthe population and public spending.
Cross-country estimates by Lindert (1994) suggest that for the period 1880-1930, theshare of population aged 65 and more had a positive impact on the share of GDPdevoted to total social spending (a notion that encompasses all social transfers such aspensions, health care, etc. and educational spending): this type of evidence concurswith the insight that longevity (proxied by δ in our model) should have a positiveimpact on total spending (and thus taxation). The e�ect on social transfers only isalso positive. On the contrary, the share of population aged between 20 and 39 hasa signi�cant negative impact on the share of social tranfers in GDP. The results areglobally con�rmed in a similar analysis of the 1960-1980 period by Lindert (1996): overthis period, a higher share of older people in total population exerts a positive impacton the share of GDP spent on pensions, while the share of school-age individuals doesnot a�ect signi�cantly the share of educational spending on GDP.
Additionally, an analysis on U.S. states by Poterba (1997) of the demographic deter-minants of public education spending reveals that the share of people older than 65in the population has a negative impact on education spending per child. Conversely,the share of public spending going to education rises with the share of population ofschooling age.
There are several limits to this exercise of comparing the available evidence with thepredictions of the model. First, the model so far is silent on which of the two taxrates whould increase with δ (or decrease when n increases). Second, the explanatoryvariables used in the aforementioned works are shares of speci�c age groups in the pop-
22

ulation, which do not match exactly with the broad variables of fertility and longevitythat are present in the model. Indeed, in our model the share of elderly people in thepopulation can rise either following an increase in δ, or following a decrease in n. Thesame reasoning also applies to the share of young pepole in the population. Fortunately,population ageing seems to have the same impact on public spending whether it comesfrom a drop in n or a rise in δ.
5 Conclusion and discussion
This paper takes a stance on the forces that led to the establishment of social securityand publicly funded education in market economies with democratic institutions, inthe period ranging from the late 19th century to the end of the 20th century. Themodel developed above aims at highlighting the major role played by the shift in thedemographic structure in establishing and progressively growing these two types ofintergenerational transfers over the period.
As in other recent developments in the literature on the political economy of pensions, Idepart from the standard asssumption of majority voting as the preference aggregationmechanism, replacing it with the assumption of probabilistic voting. While the morecommon formulation has its advantages, it fails to take into account notions like therelative political weight of each age group, which I believe determines to some extentthe tax policy pursued in each period. Since the weight of each group depends, amongothers, on its relative size, a change in the demographic structure of the populationis bound to have some e�ects on the size and the composition of public spending. Byvirtue of this modelling of preference aggregation, there is no need anymore to interpretthe pension and education systems as two pillars of a contract between generations, thatis sustained by implicit punishment schemes. This model insists instead on the intra-period con�ict existing between present generations, and the fact that the equilibriumpolicy merely balances the interest of each generation.
The model developed in this paper predicts that population ageing, whether it comesfrom decreased fertility or increased longevity, leads to a higher level of overall taxationand spending (including both educational and pension transfers). Evidence on thehistorical evolution of public spending, as well as cross-section evidence on U.S. states,seems to corroborate this analysis. Current research on this model involves �nding thetotal e�ect of the demography parameters on human and physical capital accumulation,both along the transition path and at steady state.
Further research might have to include simulations of the model for di�erent, morerealistic distribution of abilities. Introducing a degree of intragenerational redistributionin the pension system is also a possibility, to take advantage of the intragenerationalheterogeneity present in the model. In theses cases, the greater realism of the modelcomes at the expense of analytical tractability. I believe that the current formulation
23

of the model already has the advantage of putting into evidence the main qualitativeresults, even if analytical computations fail to reach a conclusion on the composition ofpublic spending between pensions and transfers to the young.
Another potential source of improvement in the model would be to endogenise thedemographic parameters, especially the fertility parameter n. Indeed, several authors(see for instance Van Groezen et al. (2003), and Cremer et al. (2011)) shed light on thefact that fertility choices depend not only on the design of the educational system, butalso on the pension system as well. Incorporating these insights into this model seemsa promising way forwards.
24

References
Belletini, Giorgio; Berti Ceroni, Carlotta. �Is Social Security Really Bad for Growth ?�Review of Economic Dynamics 2, no.4 (1999), pp. 796-819. Elsevier for the Society forEconomic Dynamics.
Boldrin, Michele; Montes, Ana. �The Intergenerational State: Education and Pensions�.The Review of Economic Studies 72, no.3 (jul. 2005), pp.651-664. Blackwell Publishing.
Boldrin, Michele; Rustichini, Aldo. �Political Equilibria with Social Security�. Reviewof Economic Dynamics 3, no.1 (2000), pp.41-78. Elsevier Science.
Cremer, Helmuth; Gahvari, Firouz; Pestieau, Pierre. �Fertility, human capital accumu-lation, and the pension system.� Journal of Public Economics 95 (2011), pp. 1272-1279.Elsevier Science.
Gonzalez-Eiras, Martin; Niepelt, Dirk. �Population Ageing, Government Budgets,and Productivity Growth in Politico-Economic Equilibrium�. CEPR Discussion Pa-per n.6581 (2007).
Lancia, Francesco. �A Dynamic Politico-Economic Model of Intergenerational Con-tract� in �Demographic Change, Intergenerational Con�ict and Economic Growth�(chapter 2). Doctoral dissertation (2010). Università di Bologna.
Lindbeck, Assar; Weibull, Jörgen. �Balanced-budget redistribution as the outcome ofpolitical competition�. Public Choice 52 (1987), pp. 273-297. Springer Verlag.
Lindert, Peter. "The Rise of Social Spending, 1880-1930". Explorations in EconomicHistory 31, no.1 (jan. 1994), pp 1-37. Elsevier Science.
Lindert, Peter. "What Limits Social Spending?" Explorations in Economic History 33,no.1 (jan.1996), pp 1-34. Elsevier Science.
Poterba, James. "Demographic structure and the political economy of public educa-tion", Journal of Policy Analysis and Management 16, no.1 (1997), pp. 48-66. JohnWiley & Sons, Ltd.
Persson, Torsten; Tabellini, Guido. �Political Economy - Explaining Economic Policy.�MIT Press. Published 2000.
Rangel, Antonio. �Forward and Backward Intergenerational Goods: Why Is SocialSecurity Good for the Environment ?� The American Economic Review 93, no.3 (2003),pp. 813-834. American Economic Association.
Van Groezen, Bas; Leers, Theo; Meijdam, Lex. �Social security and endogenous fertility:pensions and child allowances as Siamese twins.� Journal of Public Economics 87(2003), pp. 233-251. Elsevier Science.
25

A Appendix: Obtaining the derivative of welfare with
respect to policy instruments
In this appendix, I describe how to compute the derivative of the welfare with respectto the two policy instruments, by �rst using a relationship between γt and the statevariables in (t+ 1).
Relationship between the PV of lifetime income and state variables Thepresent value of the net lifetime income of an educated worker is given by the following:γ0,t = (1− τe,t − τp,t)w0,t + δp0,t+1/Rt+1.
Savings are related to γ by the following:
s0,t =βδ
1 + βδ(1− τe,t − τp,t)w0,t −
δ
1 + βδ
p0,t+1
Rt+1
⇒ βδ
1 + βδγ0,t = s0,t + δ
p0,t+1
Rt+1
(25)
But next-period capital is given by:
kt+1 =1
1 + n(µtse,t + (1− µt)s0,t)
⇒ s0,t =kt+1(1 + n)
(µtη + 1− µt)since se,t = ηs0,t.
Moreover,p0,t+1
Rt+1
=α
δ(1− α)· τp,t+1(1 + n)kt+1
µtη + 1− µt(26)
Using (25) and (26), one now gets to the following equation linking next-period capitaland the NPV of expected lifetime income :
βδ
1 + βδγ0,t =
kt+1(1 + n)
(µtη + 1− µt)·(
1 + τp,t+1α
1− α
)(27)
Computing the derivatives The welfare function that is maximised as an outcomeof the vote is the following:
Wt = (µtVt−1e,t + (1− µt)V t−1
0,t ) +ψδ
1 + n(µt−1V
t−2e,t + (1− µt−1)V t−2
0,t )
26

However, since γe,t = ηγ0,t for all t, it is easy to show that the welfare of educated andnon-educated individuals of the same generation only di�er by a constant. Hence, thetax rates τe,t and τp,t alternatively need to maximise the following function:
Wt = V t−10,t +
ψδ
1 + nV t−20,t
The indirect utility of a non-educated old individual can be further computed as follows,using equation (27):
V t−20,t = ln(ct−20,t ) = ln(
β
1 + βδγ0,t−1Rt) = ln(Rt/δ) + ln
(kt(1 + τp,tα/(1− α))(1 + n)
µt−1η + 1− µt−1
)At t, all current and past state variables are predetermined so the welfare of old peopleis only sensitive to τp,t:
∂V t−20,t
∂τp,t=
α
1− α + ατp,t(28)
∂V t−20,t
∂τe,t= 0 (29)
Concerning the welfare of non-educated workers, the following is obtained:
V t−10,t = ln(ct−10,t ) + βδ ln(ct−10,t+1) = ln(
1
1 + βδγ0,t) + βδ ln(
β
1 + βδγ0,tRt+1)
= (1 + βδ) ln(β
1 + βδγ0,t) + βδ ln(Rt+1)− ln β
Using equation (8) and (27), it obtains that:
V t−10,t = (1 + βδ − βαδ) ln kt+1 + βαδ ln((η − 1)µt+1 + 1)− (1 + βδ) ln(µt(η − 1) + 1)
+(1 + βδ) ln(1 + τp,t+1α/(1− α)) + c
where c is a constant.
Since voters are assumed to vote non-strategically, they take the future value of thepension contribution rate as given in the evaluation of their indirect welfare. Thecurrent education state variable µt is also given at the time of the vote. It then appearsthat the welfare of middle-aged individuals is a�ected by changes in current policy ratesonly insofar as it changes the future values of state variables one period ahead. As aconsequence, the partial derivatives of the indirect utility of a middle-aged worker withrespect to the two policy instruments are:
∂V t−10,t
∂τp,t= (1 + βδ − βαδ)∂ ln kt+1
∂τp,t= −1 + βδ − βαδ
1− τe,t − τp,t(30)
27

∂V t−10,t
∂τe,t= (1 + βδ − βαδ)∂ ln kt+1
∂τe,t+ βαδ
∂ ln((η − 1)µt+1 + 1)
∂τe,t
= −1 + βδ − βαδ1− τe,t − τp,t
+ βαδ(η − 1)αyt
ω(1 + n) + τe,t(η − 1)αyt(31)
Then the derivatives of total welfare with respect to the values of the two policy instru-ments are computed as follows:
∂Wt
∂τk,t=
ψδ
1 + n
∂V t−20,t
∂τk,t+∂V t−1
0,t
∂τk,t
for k = e, p. This yields equations (21) and (20).
B Appendix: Comparative statics results on total tax-
ation
In this appendix, I show that total taxation τ = τe + τp decreases when n increases,and increases when δ increases.
B.1 Comparative statics on the fertility rate
First assume that under a given set of parameters, the chosen tax rates lie in the interiorof the choice set S. Then partial derivatives of W with respect to both tax rates, theexpressions of which are given by (20) and (21), are equal to zero at (τe, τp). Then totaltaxation cannot go up following an increase in n: indeed, equation (20) imposes that τeneeds to decrease if n and τe+τp are to go up simultaneously. Similarly, a simultaneous(weak) increase in τe + τp and n imply, through (21), that τp needs to decrease as well.Then, a strict increase in n along with a weak increase in total taxation τe + τp implya strict increase in both τe and τp, hence in τe + τp, which is a logical contradiction.Hence, the e�ect of an increase in n is to reduce total taxation.
Now when τ = (τe, τp) belongs to the frontier of S, this means that one of the twoderivatives in (20) and (21) (or possibly both) is strictly di�erent from zero. Hence,a marginal increase in n in this case will fail to change one of the two tax rates, orpossibly both. Then because ∂2Wt/∂τe∂n < 0 and ∂2Wt/∂τp∂n < 0, the one of the twotax rates that does not change following an increase in n necessarily goes down.22 Asa result, total taxation e�ectively goes down in this case following an increase in n.
22Since one of the two tax rates does not change, the submodularity of W does not matter in thiscase and we consider only the direct e�ect on the other tax rate.
28

B.2 Comparative statics on the survival rate
Again, assume that the optimal tax rate lies in the interior of S. In this case, theexpressions in (20) and (21) are also equal to zero. Following the same logic as before,assuming total taxation τ = τe + τp goes down when δ increases leads to �nding thatτe and τp should increase, which is impossible. By contradiction, an increase in δ thenhas the e�ect of increasing total taxation.
Now when the optimal policy does not lie in the interior of S, one of the two tax rates willremain constant following an increase in δ. Then ∂2Wt/∂τe∂δ > 0 and ∂2Wt/∂τp∂δ > 0imply that the other tax rate will rise when δ increases. Then in this case, an increasein the survival probability δ causes total taxation to go up.
29
Related Documents