Submitted By – Shubhra Dewangan Demographi cs Of Australia, New Zealand & Mexico

Welcome message from author
This document is posted to help you gain knowledge. Please leave a comment to let me know what you think about it! Share it to your friends and learn new things together.
Transcript
Submitted By –Shubhra Dewangan
Demographics
OfAustralia, New Zealand
& Mexico

Australia
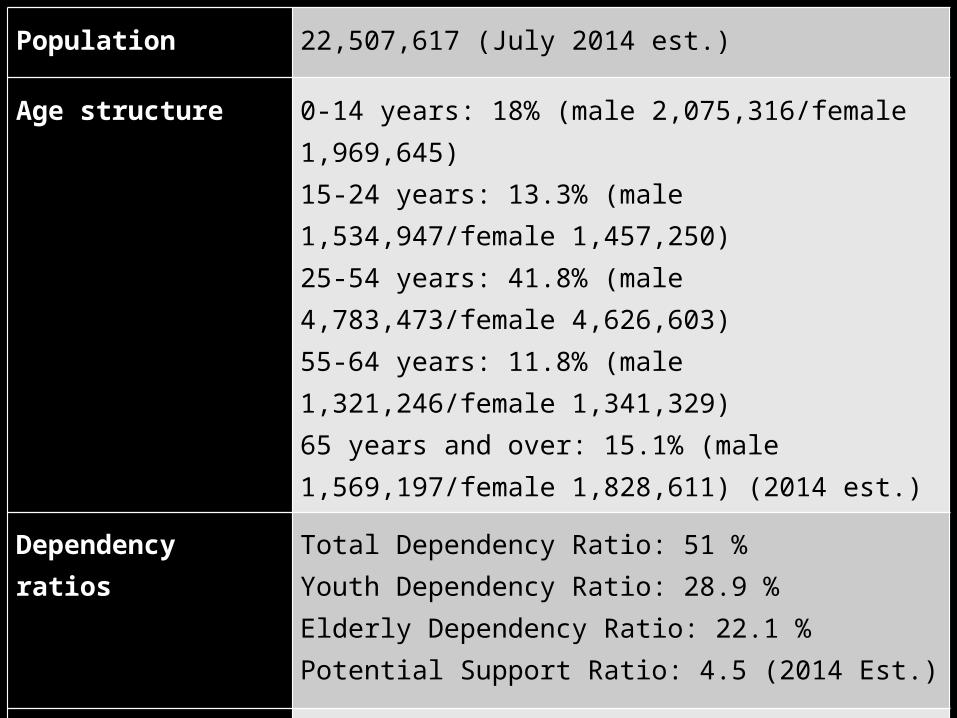
Population 22,507,617 (July 2014 est.)Age structure 0-14 years: 18% (male 2,075,316/female 1,969,645) 15-24 years: 13.3% (male 1,534,947/female 1,457,250) 25-54 years: 41.8% (male 4,783,473/female 4,626,603) 55-64 years: 11.8% (male 1,321,246/female 1,341,329) 65 years and over: 15.1% (male 1,569,197/female 1,828,611) (2014 est.)Dependency ratios Total Dependency Ratio: 51 % Youth Dependency Ratio: 28.9 % Elderly Dependency Ratio: 22.1 % Potential Support Ratio: 4.5 (2014 Est.)Median age Total: 38.3 Years Male: 37.5 Years Female: 39 Years (2014 Est.)
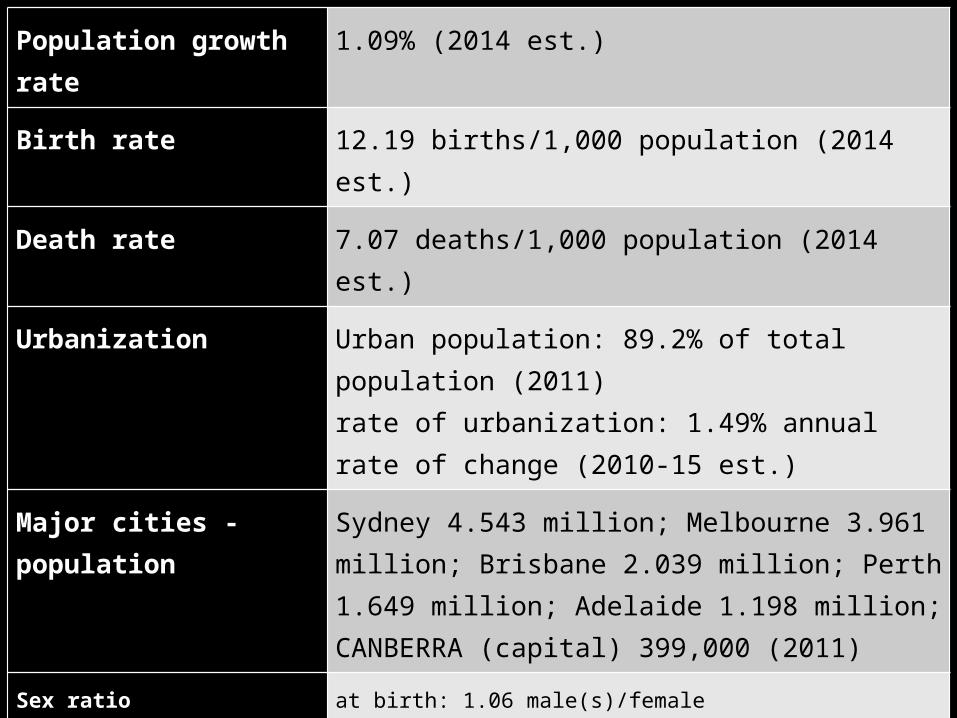
Population growth rate 1.09% (2014 est.)Birth rate 12.19 births/1,000 population (2014 est.)Death rate 7.07 deaths/1,000 population (2014 est.)Urbanization Urban population: 89.2% of total population (2011) rate of urbanization: 1.49% annual rate of change (2010-15 est.)Major cities - population Sydney 4.543 million; Melbourne 3.961 million; Brisbane 2.039 million; Perth 1.649 million; Adelaide 1.198 million; CANBERRA (capital) 399,000 (2011)Sex ratio at birth: 1.06 male(s)/female 0-14 years: 1.05 male(s)/female 15-24 years: 1.05 male(s)/female 25-54 years: 1.03 male(s)/female 55-64 years: 1.01 male(s)/female 65 years and over: 0.85 male(s)/female total population: 1.01 male(s)/female (2014 est.)

Infant mortality rate Total: 4.43 Deaths/1,000 Live Births Male: 4.74 Deaths/1,000 Live Births Female: 4.1 Deaths/1,000 Live Births (2014 Est.)Life expectancy at birth Total Population: 82.07 Years Male: 79.63 Years Female: 84.64 Years (2014 Est.)Ethnic groups White 92%, Asian 7%, Aboriginal And Other 1%Languages English 76.8%, Mandarin 1.6%, Italian 1.4%, Arabic 1.3%, Greek 1.2%, Cantonese 1.2%, Vietnamese 1.1%, Other 10.4%, Unspecified 5% (2011 Est.)Literacy Definition: Age 15 And Over Can Read And Write Total Population: 99% Male: 99% Female: 99% (2003 Est.)
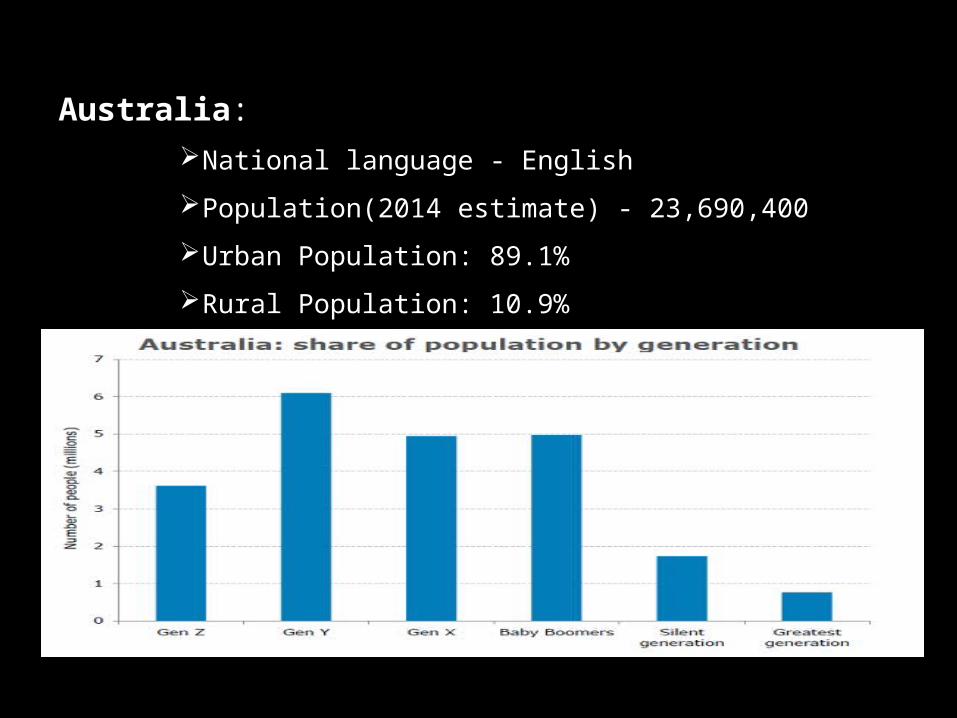
Australia:National language - English
Population(2014 estimate) - 23,690,400
Urban Population: 89.1%
Rural Population: 10.9%

New Zealand
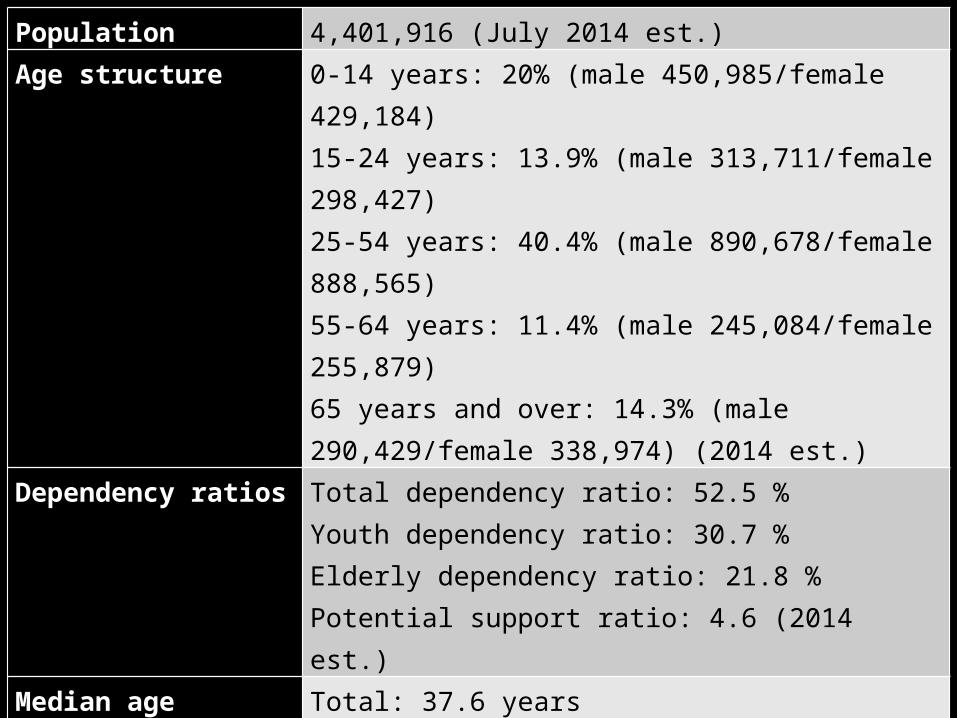
Population 4,401,916 (July 2014 est.)Age structure 0-14 years: 20% (male 450,985/female 429,184) 15-24 years: 13.9% (male 313,711/female 298,427) 25-54 years: 40.4% (male 890,678/female 888,565) 55-64 years: 11.4% (male 245,084/female 255,879) 65 years and over: 14.3% (male 290,429/female 338,974) (2014 est.)Dependency ratios Total dependency ratio: 52.5 % Youth dependency ratio: 30.7 % Elderly dependency ratio: 21.8 % Potential support ratio: 4.6 (2014 est.)Median age Total: 37.6 years Male: 36.7 years Female: 38.4 years (2014 est.)Population growth rate 0.83% (2014 est.)Birth rate 13.4 births/1,000 population (2014 est.)Death rate 7.3 deaths/1,000 population (2014 est.)
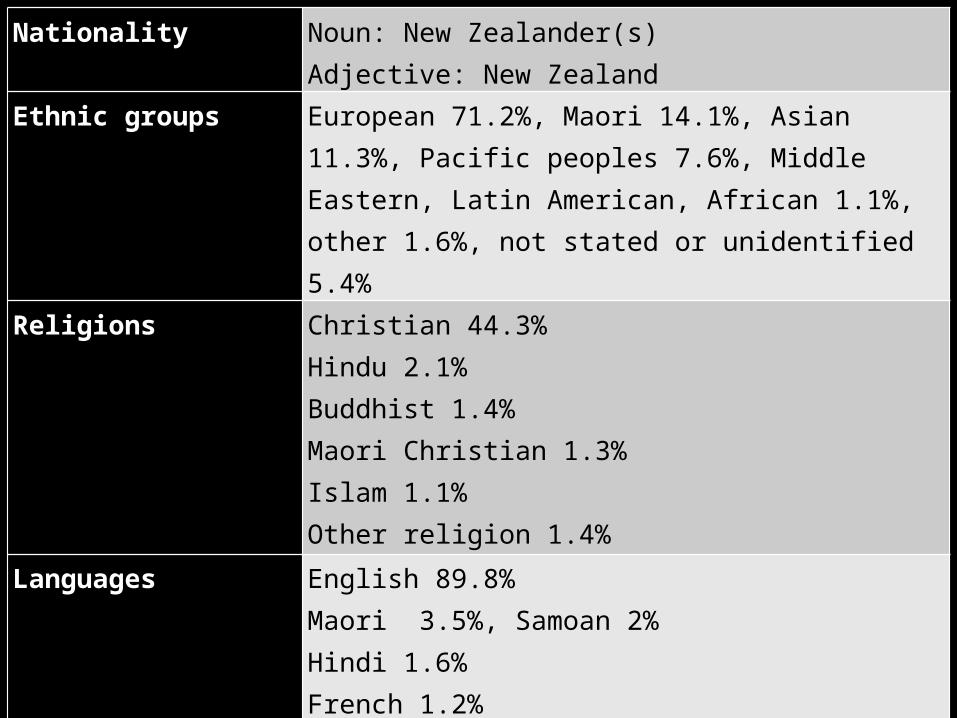
Nationality Noun: New Zealander(s) Adjective: New ZealandEthnic groups European 71.2%, Maori 14.1%, Asian 11.3%, Pacific peoples 7.6%, Middle Eastern, Latin American, African 1.1%, other 1.6%, not stated or unidentified 5.4%Religions Christian 44.3% Hindu 2.1%Buddhist 1.4%Maori Christian 1.3%Islam 1.1%Other religion 1.4%Languages English 89.8%Maori 3.5%, Samoan 2%Hindi 1.6%French 1.2%Northern Chinese 1.2%, Yue 1%Other or not stated 20.5%

Infant mortality rate Total: 4.59 Deaths/1,000 Live Births Male: 5.14 Deaths/1,000 Live Births Female: 4.01 Deaths/1,000 Live Births (2014 Est.)Life expectancy at birth Total Population: 80.93 Years Male: 78.88 Years Female: 83.08 Years (2014 Est.)Education expenditures 7.4% Of GDP (2012)Natural Resources Natural Gas, Iron Ore, Sand, Coal, Timber, Hydropower, Gold, Limestone
Natural Hazards Earthquakes are Common, though usually not severe; volcanic activityEnvironment – Current Issues Deforestation; Soil Erosion; Native Flora And Fauna Hard-hit by Invasive Species
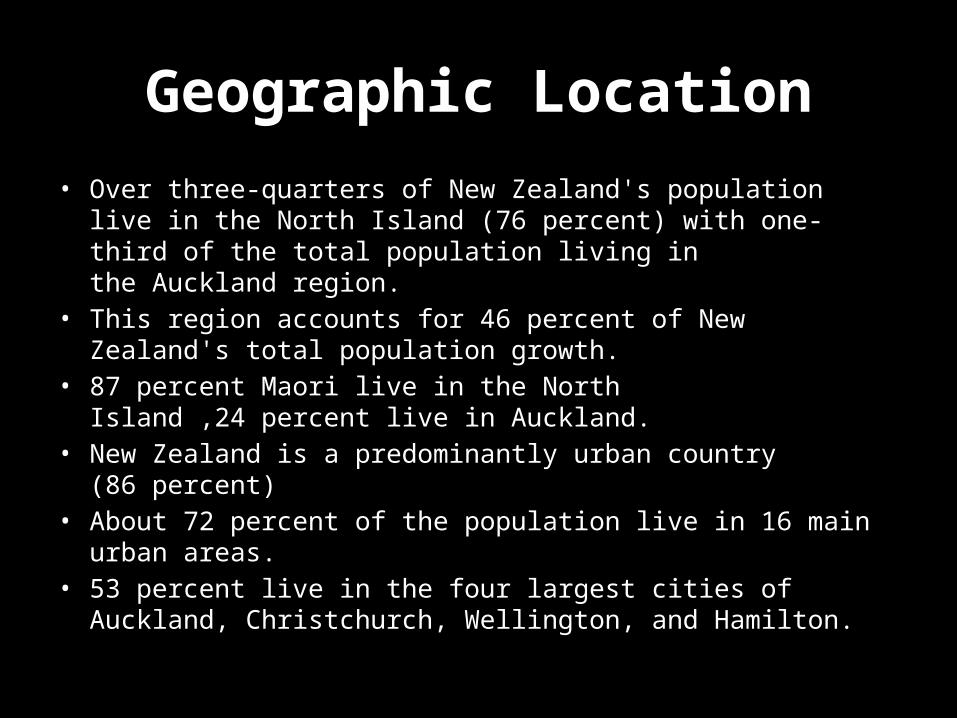
Geographic Location• Over three-quarters of New Zealand's population live in the North Island (76 percent) with one-third of the total population living in the Auckland region. • This region accounts for 46 percent of New Zealand's total population growth. • 87 percent Maori live in the North Island ,24 percent live in Auckland. • New Zealand is a predominantly urban country (86 percent)• About 72 percent of the population live in 16 main urban areas.• 53 percent live in the four largest cities of Auckland, Christchurch, Wellington, and Hamilton.
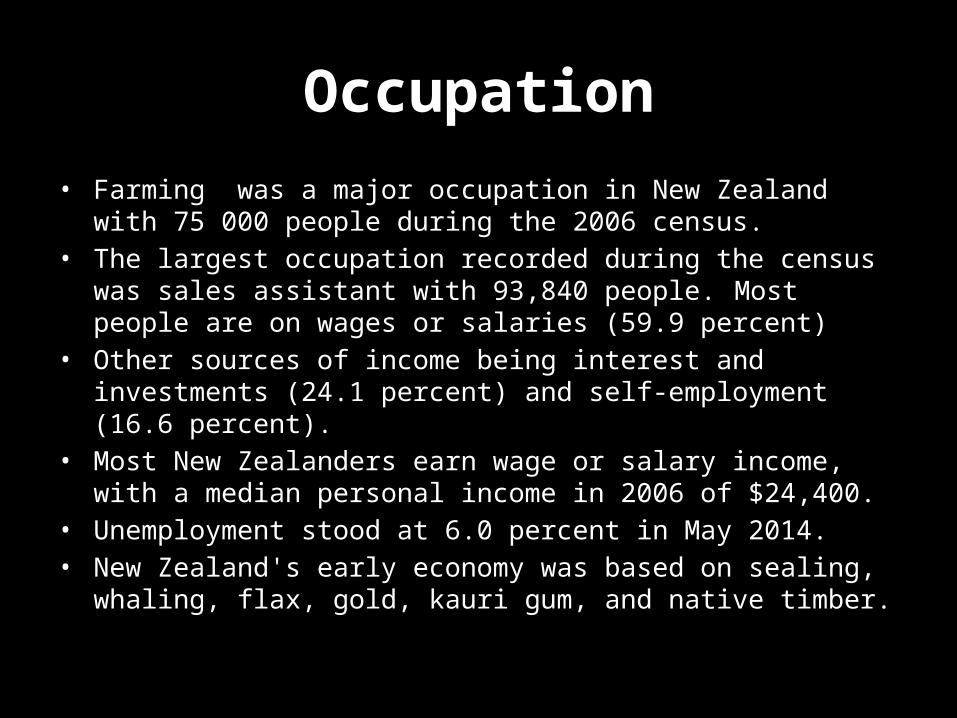
Occupation• Farming was a major occupation in New Zealand with 75 000 people during the 2006 census. • The largest occupation recorded during the census was sales assistant with 93,840 people. Most people are on wages or salaries (59.9 percent)• Other sources of income being interest and investments (24.1 percent) and self-employment (16.6 percent).• Most New Zealanders earn wage or salary income, with a median personal income in 2006 of $24,400. • Unemployment stood at 6.0 percent in May 2014. • New Zealand's early economy was based on sealing, whaling, flax, gold, kauri gum, and native timber.

Passenger service• Transport by bus services form the main component of public transport services in New Zealand cities.• Two major cities, Auckland and Wellington, also have suburban rail systems.• Some cities also operate local ferry services. New Zealand has a long history of international and coastal shipping. • Water taxis for reaching a destination that isn’t accessible by ferry or for scenic tour of local sights.• Gradual shift towards the private car in recent decades has been observed. • New Zealand is a car-dominant society. The number of households with two or more cars is on the rise.

MEXICO

Population 120,286,655 (July 2014 Est.)Age Structure 0-14 Years: 27.9% (Male 17,188,577/Female 16,423,421) 15-24 Years: 18.1% (Male 10,999,445/Female 10,741,999) 25-54 Years: 40.4% (Male 23,385,321/Female 25,200,511) 55-64 Years: 7% (Male 3,850,792/Female 4,527,074) 65 Years And Over: 6.6% (Male 3,594,675/Female 4,374,840) (2014 Est.)Dependency Ratios Total Dependency Ratio: 52.7 % Youth Dependency Ratio: 42.7 % Elderly Dependency Ratio: 10.1 % Potential Support Ratio: 9.9 (2014 Est.)Median Age Total: 27.3 Years Male: 26.3 Years Female: 28.4 Years (2014 Est.)Population Growth Rate 1.21% (2014 Est.)Birth Rate 19.02 Births/1,000 Population (2014 Est.)

Death Rate 5.24 Deaths/1,000 Population (2014 Est.)Urbanization Urban Population: 78.1% Of Total Population (2011) Rate Of Urbanization: 1.49% Annual Rate Of Change (2010-15 Est.)Major Cities - Population MEXICO CITY (Capital) 20.446 Million; Guadalajara 4.525 Million; Monterrey 4.213 Million; Puebla 2.335 Million; Tijuana 1.82 Million; Toluca De Lerdo 1.748 Million (2011)Sex Ratio At Birth: 1.05 Male(s)/Female 0-14 Years: 1.05 Male(s)/Female 15-24 Years: 1.02 Male(s)/Female 25-54 Years: 0.93 Male(s)/Female 55-64 Years: 0.96 Male(s)/Female 65 Years And Over: 0.81 Male(s)/Female Total Population: 0.96 Male(s)/Female (2014 Est.)

Nationality Noun: Mexican(s) Adjective: MexicanEthnic Groups Mestizo (Amerindian-spanish) 60%, Amerindian Or Predominantly Amerindian 30%, White 9%, Other 1%Languages Spanish Only 92.7%, Spanish And Indigenous Languages 5.7%, Indigenous Only 0.8%, Unspecified 0.8% Note: Indigenous Languages Include Various Mayan, and Other Regional Languages (2005)Literacy Definition: Age 15 And Over Can Read And Write Total Population: 93.5% Male: 94.8% Female: 92.3% (2011 Est.)Child Labor - Children Ages 5-14 Total Number: 1,105,617 Percentage: 5 % (2009 Est.)
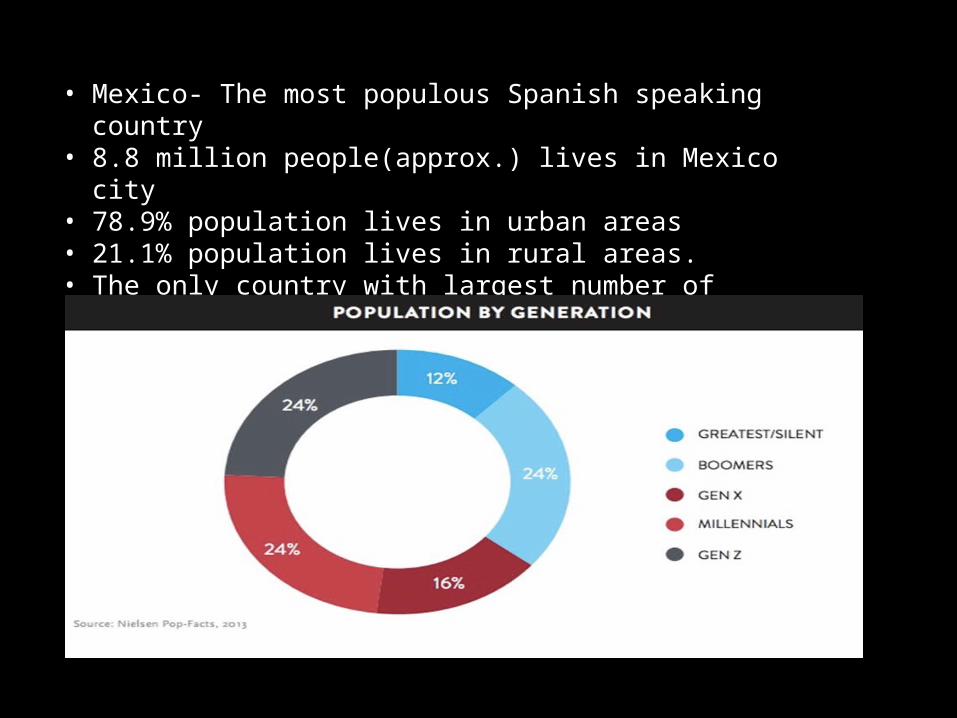
• Mexico- The most populous Spanish speaking country• 8.8 million people(approx.) lives in Mexico city• 78.9% population lives in urban areas• 21.1% population lives in rural areas.• The only country with largest number of Americans due to the positive impacts of NAFTA

NAFTA- Highlights• Narrowed the gap between the per capita incomes of Mexico, the United States, and Canada• The deal with US helped in reducing prices of clothes, food and consumer durables in Mexico• Helped in increasing the GDP of Mexican economy
European Union- Trade Picture• Entered into force in October 2000• The EU is Mexico's second biggest export market after the USA• The EU's key imports from Mexico- mineral products, machinery and electric equipment, transport equipment and optic photo precision instruments.• Key EU exports to Mexico- machinery and electric equipment, transport equipment, chemical products, and mineral products.• The bilateral stock in as well as the flow of investment between the EU and Mexico is significant.

Thank You !!
Related Documents