Yasuyuki Sawada Economic Research and Regional Cooperation Department Asian Development Bank 17 January 2019|G20 Symposium: For a Better Future: Demographic Changes and Macroeconomic Challenges Demographic Transitions, Productivity, and the Role of Technology in Asia and the Pacific

Welcome message from author
This document is posted to help you gain knowledge. Please leave a comment to let me know what you think about it! Share it to your friends and learn new things together.
Transcript
Yasuyuki Sawada
Economic Research and Regional Cooperation Department Asian Development Bank
17 January 2019|G20 Symposium: For a Better Future: Demographic Changes and Macroeconomic Challenges
Demographic Transitions, Productivity, and the Role of Technology in Asia and the Pacific

Outline
• Aging, Productivity, and the Role of Technology in Asia and the Pacific
• Harvesting Demographic Dividends as a Region

Aging, Productivity, and the Role of Technology
in Asia and the Pacific
3
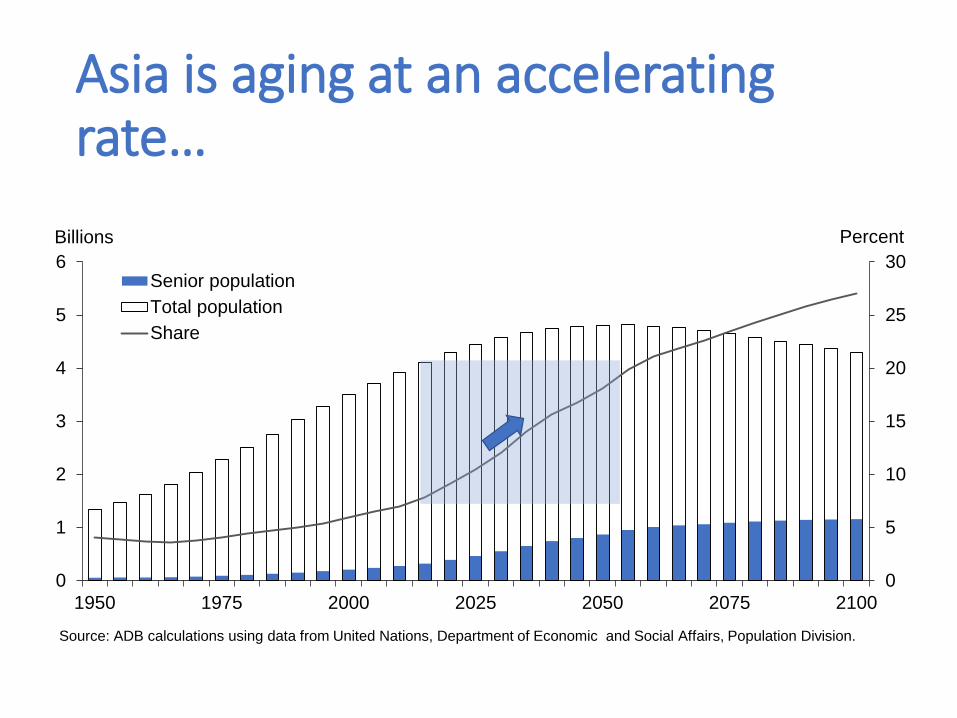
Asia is aging at an accelerating rate…
0
5
10
15
20
25
30
0
1
2
3
4
5
6
1950 1975 2000 2025 2050 2075 2100
PercentBillions
Senior populationTotal populationShare
Source: ADB calculations using data from United Nations, Department of Economic and Social Affairs, Population Division.
-10
0
10
20
30
40
50
60
0 5 10 15 20 25 30GD
P pe
r cap
ita (c
onst
ant 2
010
$) ('
000)
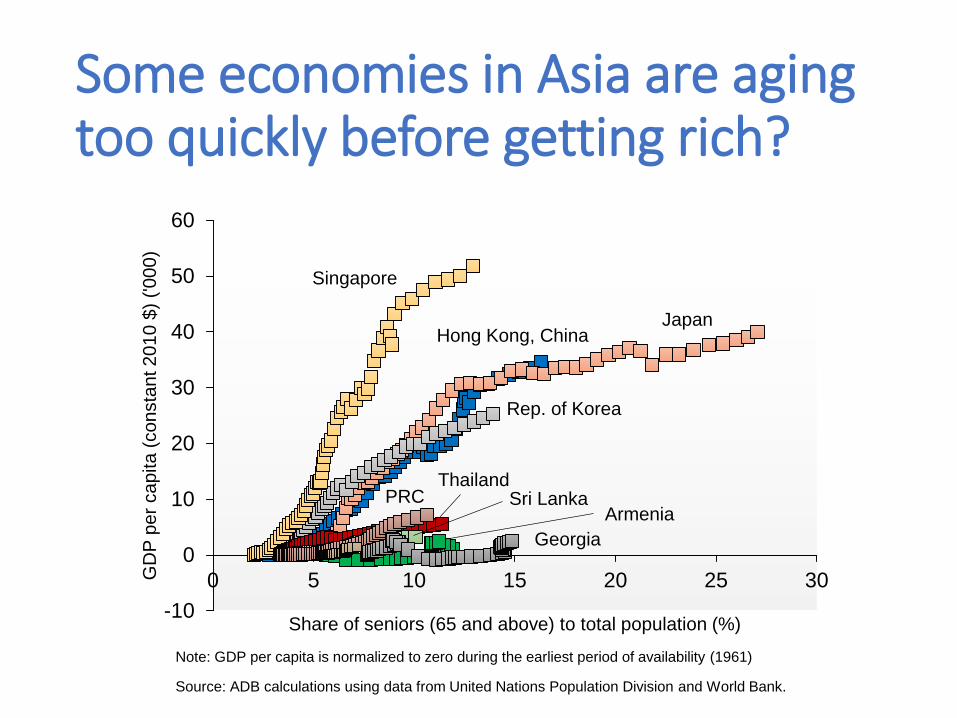
Share of seniors (65 and above) to total population (%)
Some economies in Asia are aging too quickly before getting rich?
Singapore
Source: ADB calculations using data from United Nations Population Division and World Bank.
JapanHong Kong, China
Rep. of Korea
PRC
Georgia
Thailand
ArmeniaSri Lanka
Note: GDP per capita is normalized to zero during the earliest period of availability (1961)
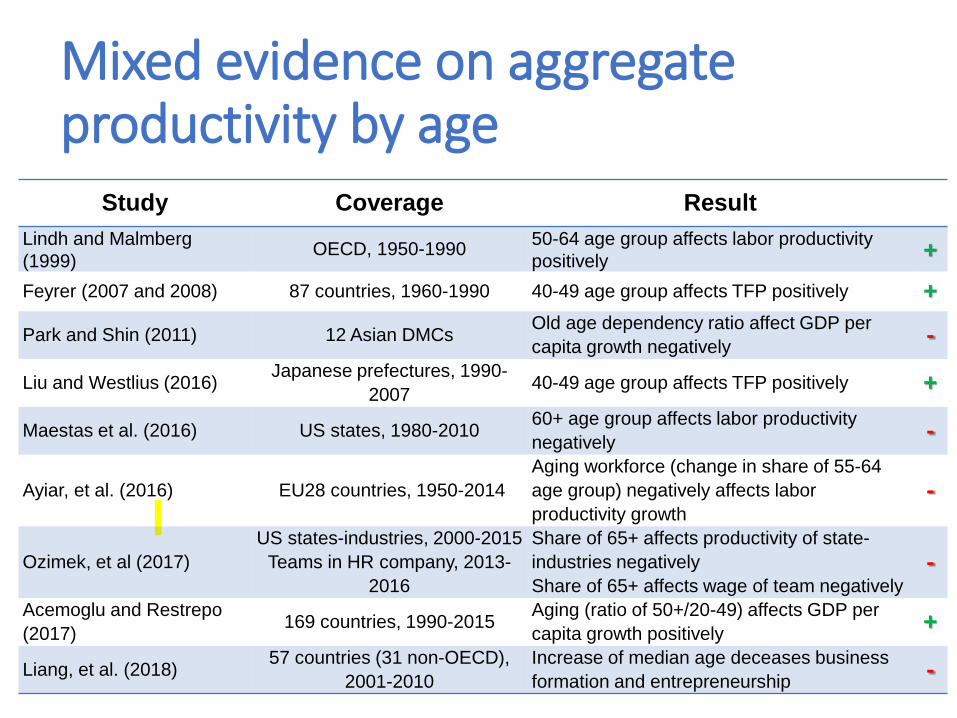
Mixed evidence on aggregate productivity by age
Study Coverage ResultLindh and Malmberg(1999) OECD, 1950-1990 50-64 age group affects labor productivity
positively +Feyrer (2007 and 2008) 87 countries, 1960-1990 40-49 age group affects TFP positively +
Park and Shin (2011) 12 Asian DMCs Old age dependency ratio affect GDP per capita growth negatively -
Liu and Westlius (2016) Japanese prefectures, 1990-2007 40-49 age group affects TFP positively +
Maestas et al. (2016) US states, 1980-2010 60+ age group affects labor productivity negatively -
Ayiar, et al. (2016) EU28 countries, 1950-2014Aging workforce (change in share of 55-64 age group) negatively affects laborproductivity growth
-
Ozimek, et al (2017)US states-industries, 2000-2015
Teams in HR company, 2013-2016
Share of 65+ affects productivity of state-industries negativelyShare of 65+ affects wage of team negatively
-
Acemoglu and Restrepo (2017) 169 countries, 1990-2015 Aging (ratio of 50+/20-49) affects GDP per
capita growth positively +
Liang, et al. (2018) 57 countries (31 non-OECD), 2001-2010
Increase of median age deceases business formation and entrepreneurship -
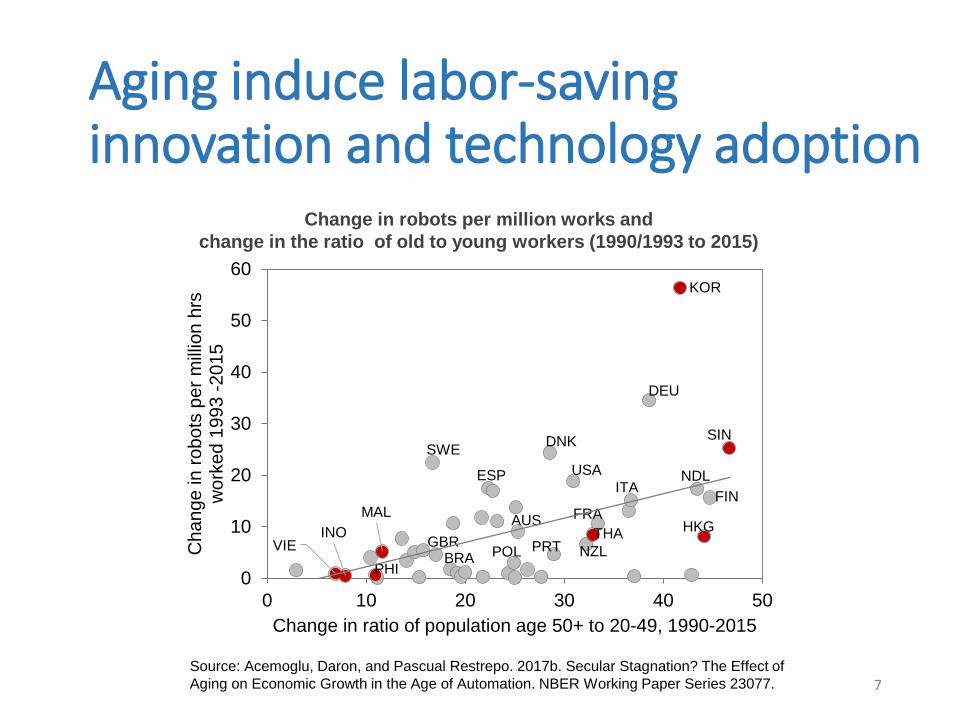
Aging induce labor-saving innovation and technology adoption
7Source: Acemoglu, Daron, and Pascual Restrepo. 2017b. Secular Stagnation? The Effect of Aging on Economic Growth in the Age of Automation. NBER Working Paper Series 23077.
Change in robots per million works and change in the ratio of old to young workers (1990/1993 to 2015)
VIEINO
PHI
MAL
SWE
GBRBRA
ESP
POL
AUS
DNK
PRT
USA
NZLTHA
FRA
ITA
DEU
KOR
NDL
HKG
FIN
SIN
0
10
20
30
40
50
60
0 10 20 30 40 50
Cha
nge
in ro
bots
per
mill
ion
hrs
wor
ked
1993
-201
5
Change in ratio of population age 50+ to 20-49, 1990-2015

• In macro growth regression, how can we identify age specific effects? • Following Fair and Dominguez (1991) AER, we impose flexible non-linear
age structure by including higher polynomial effects for the age-specific population share, pj, i.e., 𝛼𝛼𝑗𝑗≡𝛾𝛾0+𝛾𝛾1𝑗𝑗+𝛾𝛾2𝑗𝑗2+𝛾𝛾3𝑗𝑗3+…:
𝑔𝑔 = 𝑋𝑋𝑋𝑋 + 𝛼𝛼1𝑝𝑝1 + 𝛼𝛼2𝑝𝑝2 + ⋯+ 𝛼𝛼𝐽𝐽𝑝𝑝𝐽𝐽 + 𝑢𝑢
• We can easily show that:
g= 𝑋𝑋𝑋𝑋 + 𝛾𝛾1𝐷𝐷1 + 𝛾𝛾2𝐷𝐷2 + 𝛾𝛾3𝐷𝐷3 + ⋯+ 𝑢𝑢, 𝐷𝐷𝑖𝑖 ≡ ∑𝑗𝑗=1𝐽𝐽 𝑗𝑗𝑖𝑖𝑝𝑝𝑗𝑗 −
1𝐽𝐽∑𝑗𝑗=1𝐽𝐽 𝑗𝑗𝑖𝑖
• Canonical macro data: (1) PWT 9.0(2) UN World Population Prospects 2017(3) The International Federation of Robotics data
Overall impact of the aging and technology nexus on growth (Park, Shin, and Takenaka, 2018)

Population distribution and per capita growth (cross country, 1993-2015, cubic function)
-0.8
-0.6
-0.4
-0.2
0
0.2
0.4
0 5 10 15 20 25 30 35 40 45 50 55 60 65 70 75 80
Pooled
-0.6-0.5-0.4-0.3-0.2-0.1
00.10.20.3
0 5 10 15 20 25 30 35 40 45 50 55 60 65 70 75 80
Initial GDP per Capita Controlled
-1
-0.8
-0.6
-0.4
-0.2
0
0.2
0.4
0.6
0 5 10 15 20 25 30 35 40 45 50 55 60 65 70 75 80
Fixed Effect Regression
-0.6
-0.5
-0.4
-0.3
-0.2
-0.1
0
0.1
0.2
0.3
0 5 10 15 20 25 30 35 40 45 50 55 60 65 70 75 80
Fixed Effect, OECD Countries
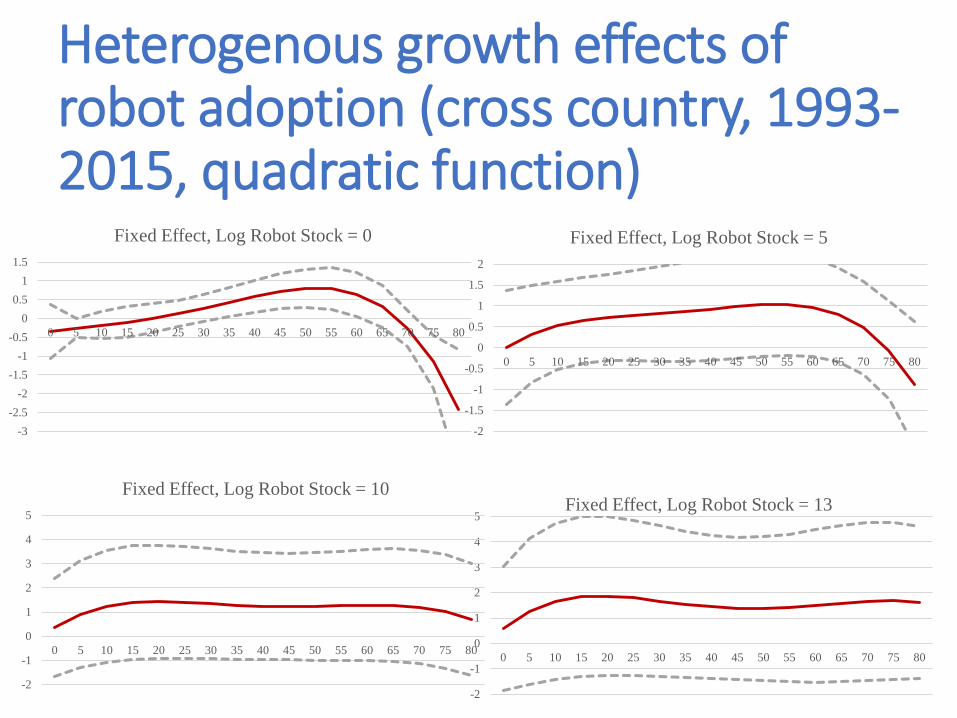
Heterogenous growth effects of robot adoption (cross country, 1993-2015, quadratic function)
-3-2.5
-2-1.5
-1-0.5
00.5
11.5
0 5 10 15 20 25 30 35 40 45 50 55 60 65 70 75 80
Fixed Effect, Log Robot Stock = 0
-2
-1
0
1
2
3
4
5
0 5 10 15 20 25 30 35 40 45 50 55 60 65 70 75 80
Fixed Effect, Log Robot Stock = 13
-2
-1.5
-1
-0.5
0
0.5
1
1.5
2
0 5 10 15 20 25 30 35 40 45 50 55 60 65 70 75 80
Fixed Effect, Log Robot Stock = 5
-2
-1
0
1
2
3
4
5
0 5 10 15 20 25 30 35 40 45 50 55 60 65 70 75 80
Fixed Effect, Log Robot Stock = 10

Roles of technologies
Role of Technology Examples
1. Technology for health and longevity
Biotechnology, automated diagnosis, surgery and therapies, IOT (medical equipment and wearable sensory devices), and health-related big data analysis
2. Technology for transforming work and workplace
Industrial robots, automation, artificial intelligence, machine learning, and human function aiding devises at workplace (adaptive technologies), remote work
3. Technology for workers and supportive labor market infrastructure
Technology-based education/lifelong training, human resource and age diversity management, cloud-based job matching service

Harvesting Demographic Dividends as a Region
12
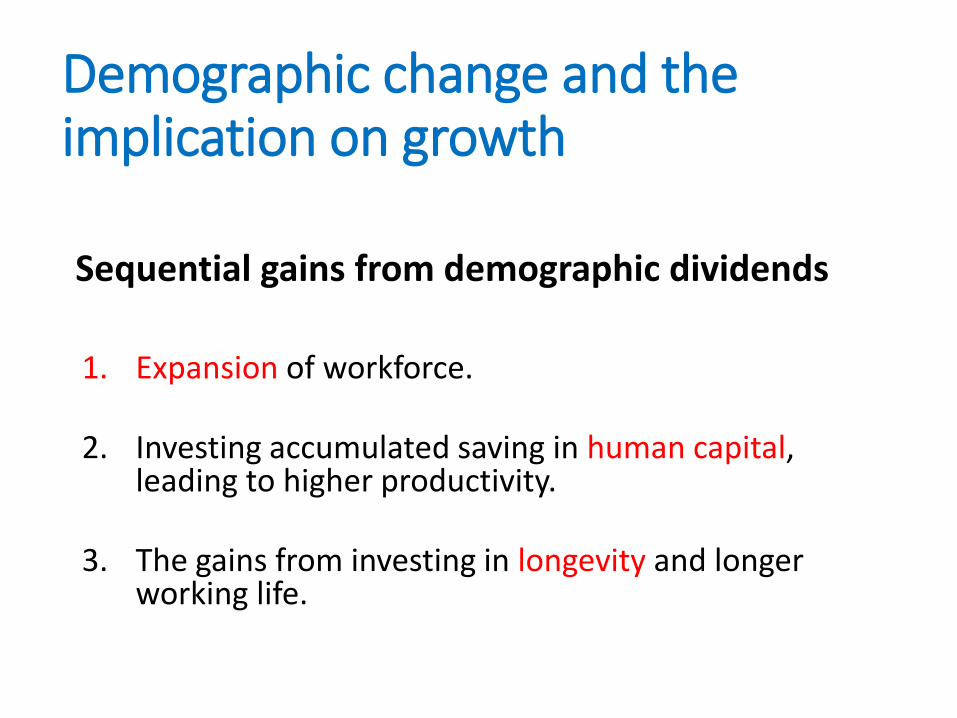
Demographic change and the implication on growth
Sequential gains from demographic dividends
1. Expansion of workforce.
2. Investing accumulated saving in human capital, leading to higher productivity.
3. The gains from investing in longevity and longer working life.
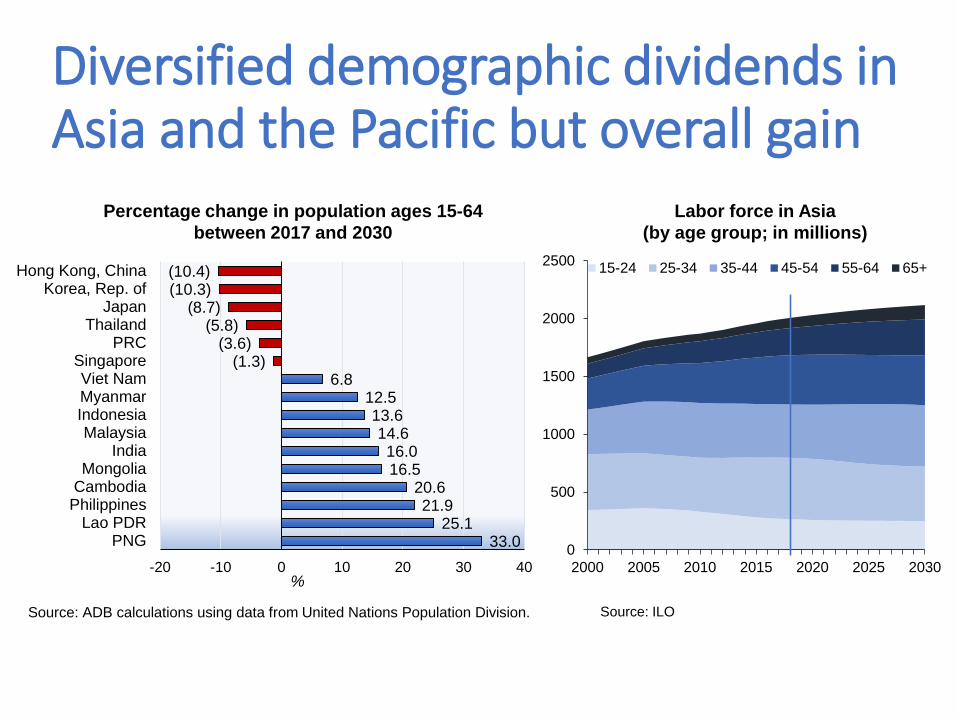
Diversified demographic dividends in Asia and the Pacific but overall gain
33.0 25.1
21.9 20.6
16.5 16.0
14.6 13.6
12.5 6.8
(1.3)(3.6)
(5.8)(8.7)
(10.3)(10.4)
-20 -10 0 10 20 30 40
PNGLao PDR
PhilippinesCambodiaMongolia
IndiaMalaysia
IndonesiaMyanmarViet Nam
SingaporePRC
ThailandJapan
Korea, Rep. ofHong Kong, China
%
Percentage change in population ages 15-64 between 2017 and 2030
Source: ADB calculations using data from United Nations Population Division.
0
500
1000
1500
2000
2500
2000 2005 2010 2015 2020 2025 2030
15-24 25-34 35-44 45-54 55-64 65+
Source: ILO
Labor force in Asia (by age group; in millions)

Varying openness to migration
15
International migrant stock and the population share, 2017
Source: ADB calculations using data from International Migrant Stock: The 2017 Revision. http://www.un.org/en/development/desa/population/migration/data/estimates2/estimates17.shtml(accessed Aug 2018).

Job creations and human resource development through regional economic integration
Policy Implications
Preparing for Population Aging with Technology
• Active promotion of technological innovation and adoption (& adaption)
• Creating enabling environment for workers of all ages
Harvesting Demographic Dividend through Regional Cooperation
• Facilitating regional economic integration, especially the cross-border movement of workforce, capital and services.

THANK YOU VERY MUCH
ADO 2011Preparing for Demographic Transition
ADO 2018How Technology Affects Jobs?
Aging, Economic Growth, and Old-age Security in AsiaPark, Lee and Mason (2012)
Tapping Technology to Maximize the Longevity Dividend in AsiaADB (2018)
ADB Publications on Aging /Technologies
Related Documents