285 DEMOGRAPHIC TRANSITION, DEMOGRAPHIC BONUS AND AGEING IN MEXICO Virgilio Partida-Bush, National Council on Population, Mexico Nearly all countries have undergone, or are currently undergoing, the demographic transition. In general terms, the transition is a shift from a regime characterized by high and uncontrolled levels of mortality and fertility to one of low and controlled levels. This transition began later but is progressing more rapidly in the developing countries, such as Mexico, than in the more developed countries. The transition leads to changes in the size and age structure of the population, and these give rise to social and policy challenges that have yet to be fully resolved. In Mexico, the sharp decline in mortality due to the expansion of health services, the low cost of importing effective drugs and a pronatalist policy that sought to meet the labour needs of an expanding industrial sector and to populate the national territory, all favoured rapid demographic growth during the twentieth century. Growth was especially rapid between 1954 and 1974, when the population increased by over 3 per cent per year. This was among the highest rates of population growth in human history. The country later adopted a new population policy that sought to reduce population growth, and this led to a rapid decline in fertility during the last quarter of the twentieth century. The demographic transition is expected to be essentially completed during the next fifty years, when the age structure of the population will become much older. On the way towards that final stage, the rapid demographic growth of the past will continue to impact the age structure, as large cohorts born during the periods of peak growth pass through the life cycle. The transition will give rise to two changes as pronounced as they are distinct: first, the population of working age will grow rapidly; later, the number of older adults will increase rapidly, reaching, within half a century, ageing ratios similar to those in the developed countries. Even in 2050, there will be traces in the age structure of the rapid growth that characterized the generations born during the second half of the twentieth century. The impact of that past growth will finally cease early in the second half of the twenty-first century. The consequences of this demographic past are evident today, but they will become even more pronounced in the coming years when the ageing process intensifies. This paper reviews the demographic origin of those two changes in the age structure — in other words, how past and future changes in fertility, mortality and migration have contributed, and will contribute in the future, to the formation of the demographic bonus and eventual ageing. The paper first considers the phases of demographic transition and then goes on to analyse the contribution of each of these three demographic phenomena to changes in the number and age structure of the Mexican population. A. DEMOGRAPHIC TRANSITION IN MEXICO Mexico’s demographic transition has followed a typical profile, as can be seen from figure 1. Following the pre-transitional phase that lasted until about 1930, the first stage saw a rapid decline in mortality while birth rates remained fairly steady and even rose between 1945 and 1960. The second phase began around 1970 when the decline in fertility, which began during the 1960s, became more rapid. The third stage of the process, when the birth and mortality figures converge, will occur during the first half of the twenty-first century.

Welcome message from author
This document is posted to help you gain knowledge. Please leave a comment to let me know what you think about it! Share it to your friends and learn new things together.
Transcript
285
DEMOGRAPHIC TRANSITION, DEMOGRAPHIC BONUS AND AGEING IN MEXICO
Virgilio Partida-Bush, National Council on Population, Mexico
Nearly all countries have undergone, or are currently undergoing, the demographic transition. In general terms, the transition is a shift from a regime characterized by high and uncontrolled levels of mortality and fertility to one of low and controlled levels. This transition began later but is progressing more rapidly in the developing countries, such as Mexico, than in the more developed countries. The transition leads to changes in the size and age structure of the population, and these give rise to social and policy challenges that have yet to be fully resolved. In Mexico, the sharp decline in mortality due to the expansion of health services, the low cost of importing effective drugs and a pronatalist policy that sought to meet the labour needs of an expanding industrial sector and to populate the national territory, all favoured rapid demographic growth during the twentieth century. Growth was especially rapid between 1954 and 1974, when the population increased by over 3 per cent per year. This was among the highest rates of population growth in human history. The country later adopted a new population policy that sought to reduce population growth, and this led to a rapid decline in fertility during the last quarter of the twentieth century. The demographic transition is expected to be essentially completed during the next fifty years, when the age structure of the population will become much older. On the way towards that final stage, the rapid demographic growth of the past will continue to impact the age structure, as large cohorts born during the periods of peak growth pass through the life cycle. The transition will give rise to two changes as pronounced as they are distinct: first, the population of working age will grow rapidly; later, the number of older adults will increase rapidly, reaching, within half a century, ageing ratios similar to those in the developed countries. Even in 2050, there will be traces in the age structure of the rapid growth that characterized the generations born during the second half of the twentieth century. The impact of that past growth will finally cease early in the second half of the twenty-first century. The consequences of this demographic past are evident today, but they will become even more pronounced in the coming years when the ageing process intensifies. This paper reviews the demographic origin of those two changes in the age structure — in other words, how past and future changes in fertility, mortality and migration have contributed, and will contribute in the future, to the formation of the demographic bonus and eventual ageing. The paper first considers the phases of demographic transition and then goes on to analyse the contribution of each of these three demographic phenomena to changes in the number and age structure of the Mexican population.
A. DEMOGRAPHIC TRANSITION IN MEXICO
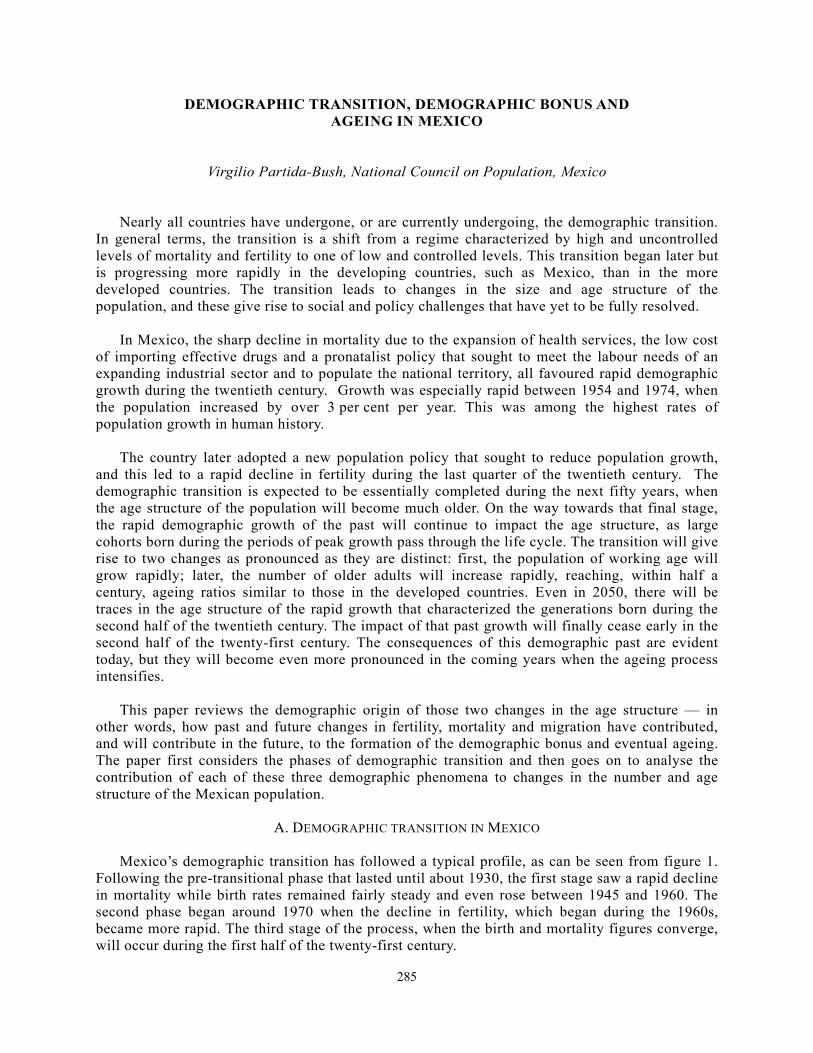
Mexico’s demographic transition has followed a typical profile, as can be seen from figure 1. Following the pre-transitional phase that lasted until about 1930, the first stage saw a rapid decline in mortality while birth rates remained fairly steady and even rose between 1945 and 1960. The second phase began around 1970 when the decline in fertility, which began during the 1960s, became more rapid. The third stage of the process, when the birth and mortality figures converge, will occur during the first half of the twenty-first century.
286
Figure 1. Crude birth and death rates, Mexico, 1900-2050
Year1900 1910 1920 1930 1940 1950 1960 1970 1980 1990 2000 2010 2020 2030 2040 2050
Rat
es (p
er th
ousa
nd)
0
5
10
15
20
25
30
35
40
45
50
Death
Birth
Source: CONAPO (2002), based on Collver (1965) and Zavala (1989).
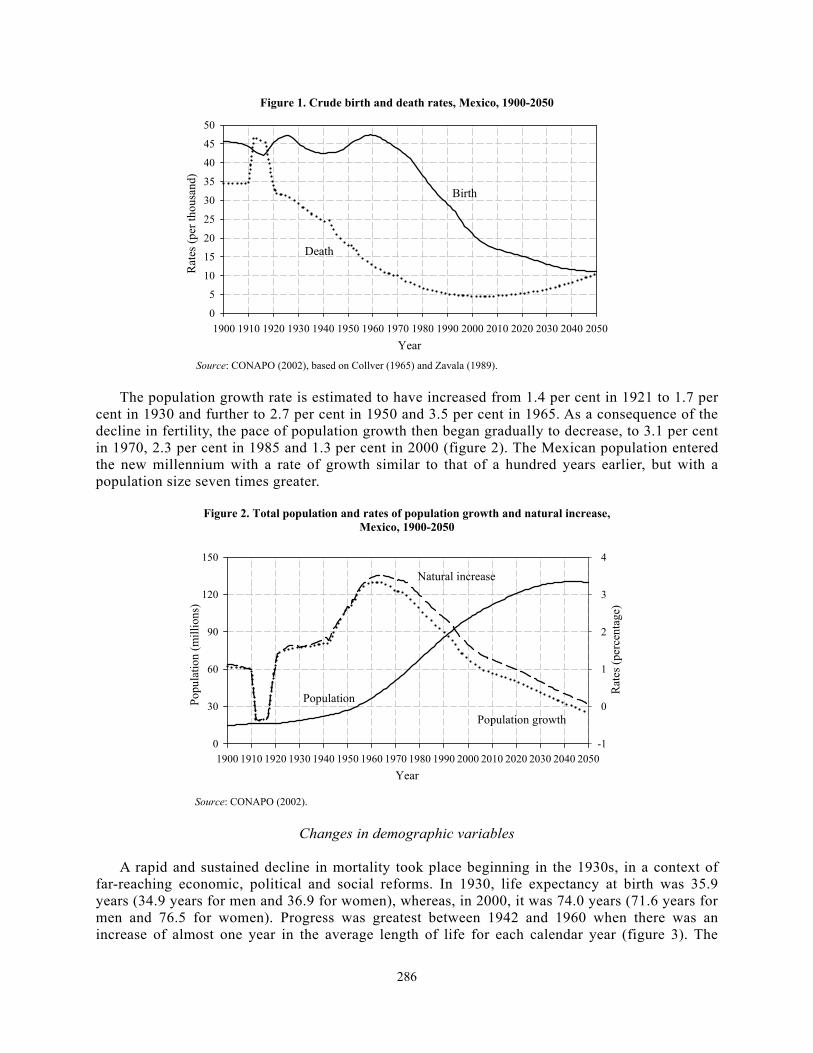
The population growth rate is estimated to have increased from 1.4 per cent in 1921 to 1.7 per cent in 1930 and further to 2.7 per cent in 1950 and 3.5 per cent in 1965. As a consequence of the decline in fertility, the pace of population growth then began gradually to decrease, to 3.1 per cent in 1970, 2.3 per cent in 1985 and 1.3 per cent in 2000 (figure 2). The Mexican population entered the new millennium with a rate of growth similar to that of a hundred years earlier, but with a population size seven times greater.
Figure 2. Total population and rates of population growth and natural increase, Mexico, 1900-2050
Year1900 1910 1920 1930 1940 1950 1960 1970 1980 1990 2000 2010 2020 2030 2040 2050
Popu
latio
n (m
illio
ns)
0
30
60
90
120
150
Rat
es (p
erce
ntag
e)
-1
0
1
2
3
4
Population
Natural increase
Population growth
Source: CONAPO (2002).
Changes in demographic variables
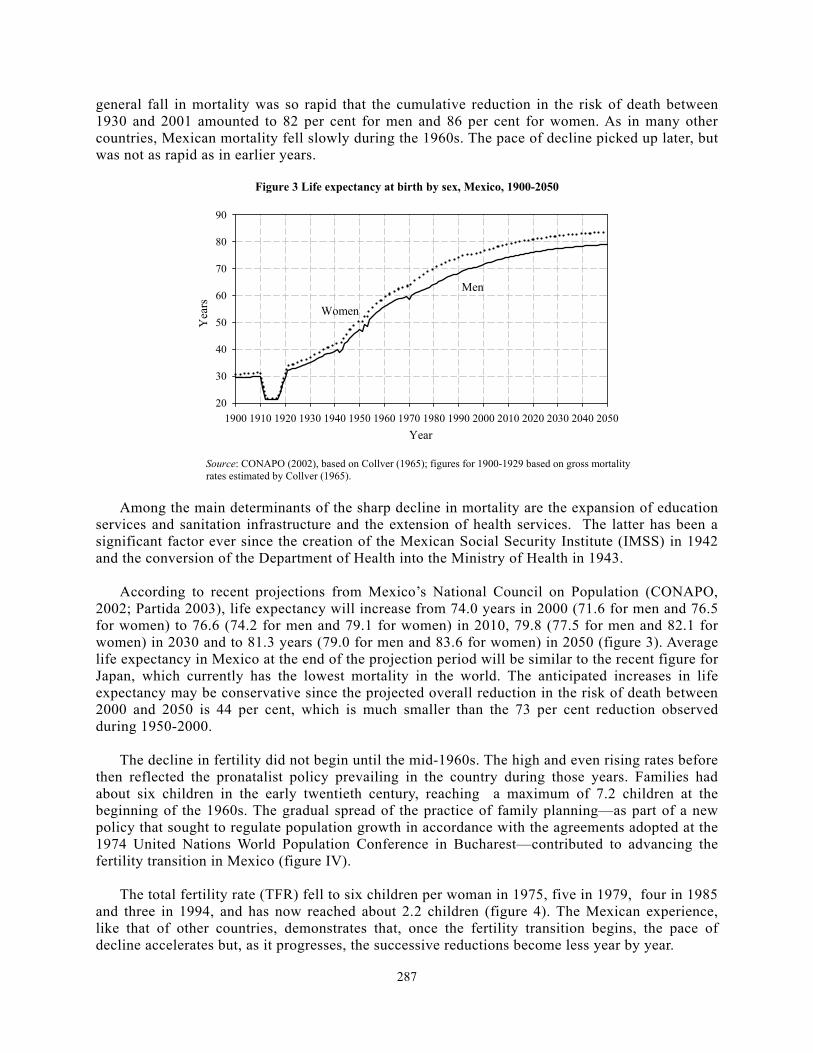
A rapid and sustained decline in mortality took place beginning in the 1930s, in a context of far-reaching economic, political and social reforms. In 1930, life expectancy at birth was 35.9 years (34.9 years for men and 36.9 for women), whereas, in 2000, it was 74.0 years (71.6 years for men and 76.5 for women). Progress was greatest between 1942 and 1960 when there was an increase of almost one year in the average length of life for each calendar year (figure 3). The
287
general fall in mortality was so rapid that the cumulative reduction in the risk of death between 1930 and 2001 amounted to 82 per cent for men and 86 per cent for women. As in many other countries, Mexican mortality fell slowly during the 1960s. The pace of decline picked up later, but was not as rapid as in earlier years.
Figure 3 Life expectancy at birth by sex, Mexico, 1900-2050
Year1900 1910 1920 1930 1940 1950 1960 1970 1980 1990 2000 2010 2020 2030 2040 2050
Yea
rs
20
30
40
50
60
70
80
90
Women
Men
Source: CONAPO (2002), based on Collver (1965); figures for 1900-1929 based on gross mortality rates estimated by Collver (1965).
Among the main determinants of the sharp decline in mortality are the expansion of education services and sanitation infrastructure and the extension of health services. The latter has been a significant factor ever since the creation of the Mexican Social Security Institute (IMSS) in 1942 and the conversion of the Department of Health into the Ministry of Health in 1943.
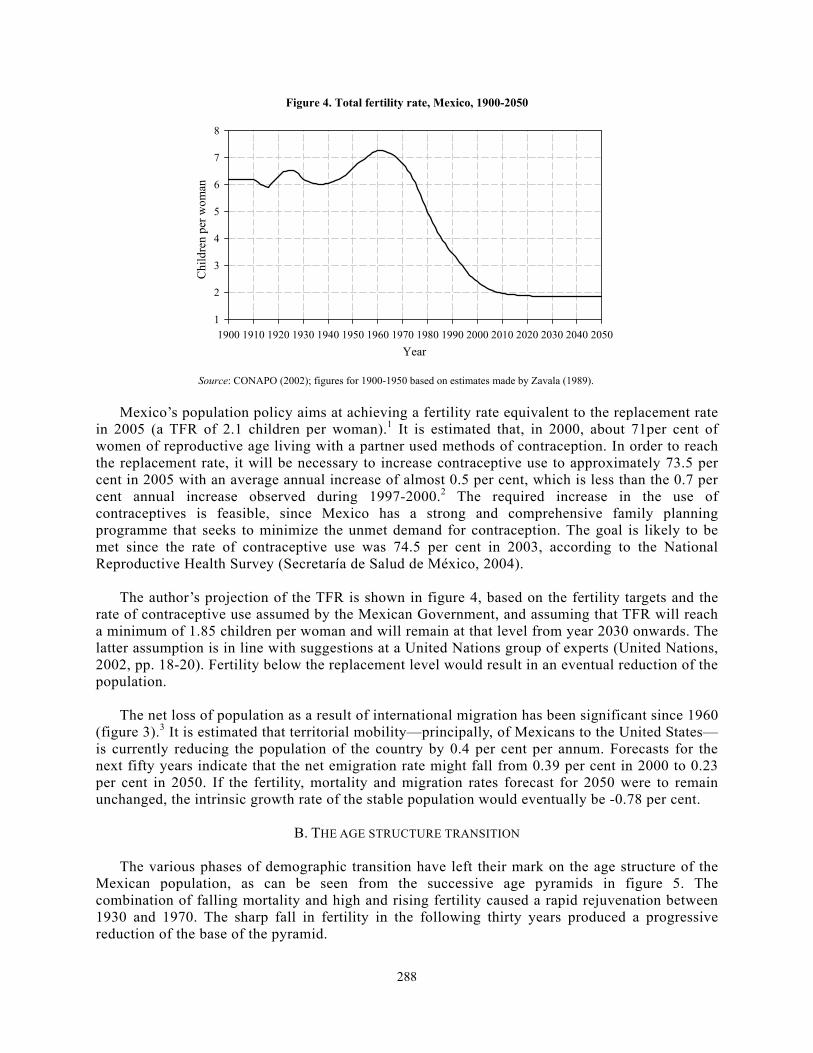
According to recent projections from Mexico’s National Council on Population (CONAPO, 2002; Partida 2003), life expectancy will increase from 74.0 years in 2000 (71.6 for men and 76.5 for women) to 76.6 (74.2 for men and 79.1 for women) in 2010, 79.8 (77.5 for men and 82.1 for women) in 2030 and to 81.3 years (79.0 for men and 83.6 for women) in 2050 (figure 3). Average life expectancy in Mexico at the end of the projection period will be similar to the recent figure for Japan, which currently has the lowest mortality in the world. The anticipated increases in life expectancy may be conservative since the projected overall reduction in the risk of death between 2000 and 2050 is 44 per cent, which is much smaller than the 73 per cent reduction observed during 1950-2000. The decline in fertility did not begin until the mid-1960s. The high and even rising rates before then reflected the pronatalist policy prevailing in the country during those years. Families had about six children in the early twentieth century, reaching a maximum of 7.2 children at the beginning of the 1960s. The gradual spread of the practice of family planning—as part of a new policy that sought to regulate population growth in accordance with the agreements adopted at the 1974 United Nations World Population Conference in Bucharest—contributed to advancing the fertility transition in Mexico (figure IV). The total fertility rate (TFR) fell to six children per woman in 1975, five in 1979, four in 1985 and three in 1994, and has now reached about 2.2 children (figure 4). The Mexican experience, like that of other countries, demonstrates that, once the fertility transition begins, the pace of decline accelerates but, as it progresses, the successive reductions become less year by year.
288
Figure 4. Total fertility rate, Mexico, 1900-2050
Year1900 1910 1920 1930 1940 1950 1960 1970 1980 1990 2000 2010 2020 2030 2040 2050
Chi
ldre
n pe
r wom
an
1
2
3
4
5
6
7
8
Source: CONAPO (2002); figures for 1900-1950 based on estimates made by Zavala (1989).
Mexico’s population policy aims at achieving a fertility rate equivalent to the replacement rate in 2005 (a TFR of 2.1 children per woman).1 It is estimated that, in 2000, about 71per cent of women of reproductive age living with a partner used methods of contraception. In order to reach the replacement rate, it will be necessary to increase contraceptive use to approximately 73.5 per cent in 2005 with an average annual increase of almost 0.5 per cent, which is less than the 0.7 per cent annual increase observed during 1997-2000.2 The required increase in the use of contraceptives is feasible, since Mexico has a strong and comprehensive family planning programme that seeks to minimize the unmet demand for contraception. The goal is likely to be met since the rate of contraceptive use was 74.5 per cent in 2003, according to the National Reproductive Health Survey (Secretaría de Salud de México, 2004). The author’s projection of the TFR is shown in figure 4, based on the fertility targets and the rate of contraceptive use assumed by the Mexican Government, and assuming that TFR will reach a minimum of 1.85 children per woman and will remain at that level from year 2030 onwards. The latter assumption is in line with suggestions at a United Nations group of experts (United Nations, 2002, pp. 18-20). Fertility below the replacement level would result in an eventual reduction of the population. The net loss of population as a result of international migration has been significant since 1960 (figure 3).3 It is estimated that territorial mobility—principally, of Mexicans to the United States—is currently reducing the population of the country by 0.4 per cent per annum. Forecasts for the next fifty years indicate that the net emigration rate might fall from 0.39 per cent in 2000 to 0.23 per cent in 2050. If the fertility, mortality and migration rates forecast for 2050 were to remain unchanged, the intrinsic growth rate of the stable population would eventually be -0.78 per cent.
B. THE AGE STRUCTURE TRANSITION
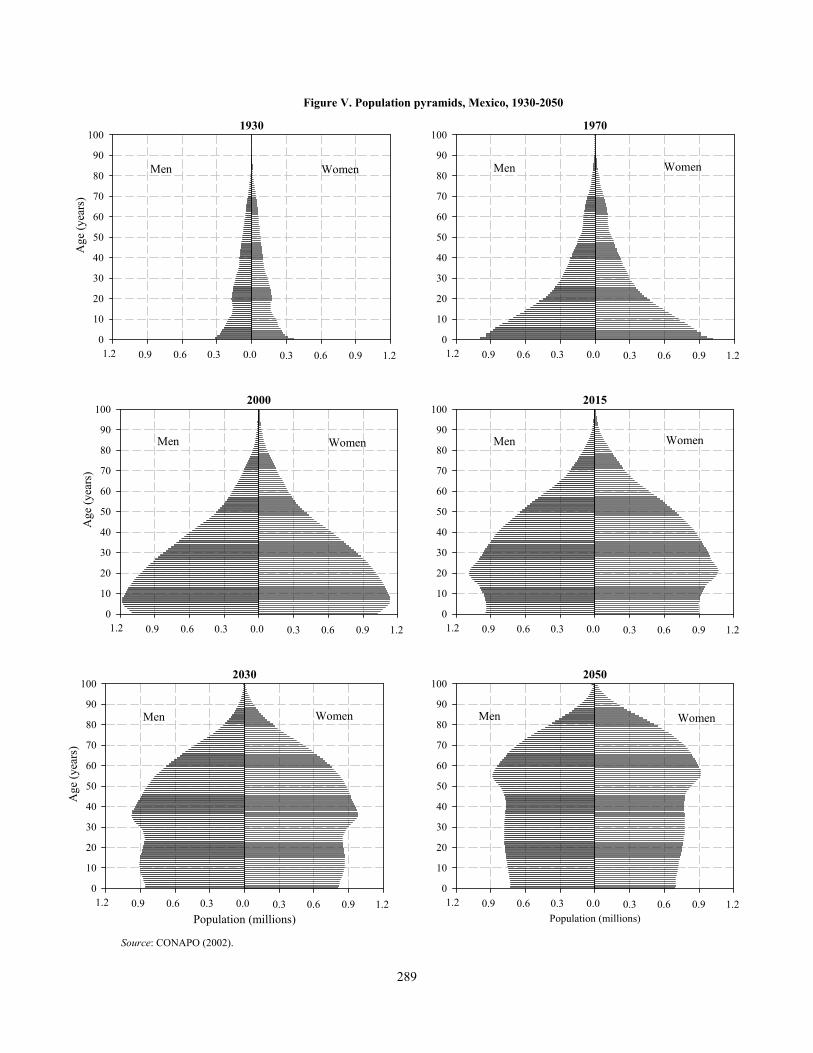
The various phases of demographic transition have left their mark on the age structure of the Mexican population, as can be seen from the successive age pyramids in figure 5. The combination of falling mortality and high and rising fertility caused a rapid rejuvenation between 1930 and 1970. The sharp fall in fertility in the following thirty years produced a progressive reduction of the base of the pyramid.
289
Figure V. Population pyramids, Mexico, 1930-2050
1930
Age
(yea
rs)
0
10
20
30
40
50
60
70
80
90
100
Men Women
0.00.30.60.91.2 0.3 0.6 0.9 1.2
1970
0
10
20
30
40
50
60
70
80
90
100
Men Women
0.00.30.60.91.2 0.3 0.6 0.9 1.2
2000
Age
(yea
rs)
0
10
20
30
40
50
60
70
80
90
100
Men Women
0.00.30.60.91.2 0.3 0.6 0.9 1.2
2015
0
10
20
30
40
50
60
70
80
90
100
Men Women
0.00.30.60.91.2 0.3 0.6 0.9 1.2
2030
Population (millions)
Age
(yea
rs)
0
10
20
30
40
50
60
70
80
90
100
Men Women
0.00.30.60.91.2 0.3 0.6 0.9 1.2
2050
Population (millions)
0
10
20
30
40
50
60
70
80
90
100
Men Women
0.00.30.60.91.2 0.3 0.6 0.9 1.2
Source: CONAPO (2002).
290
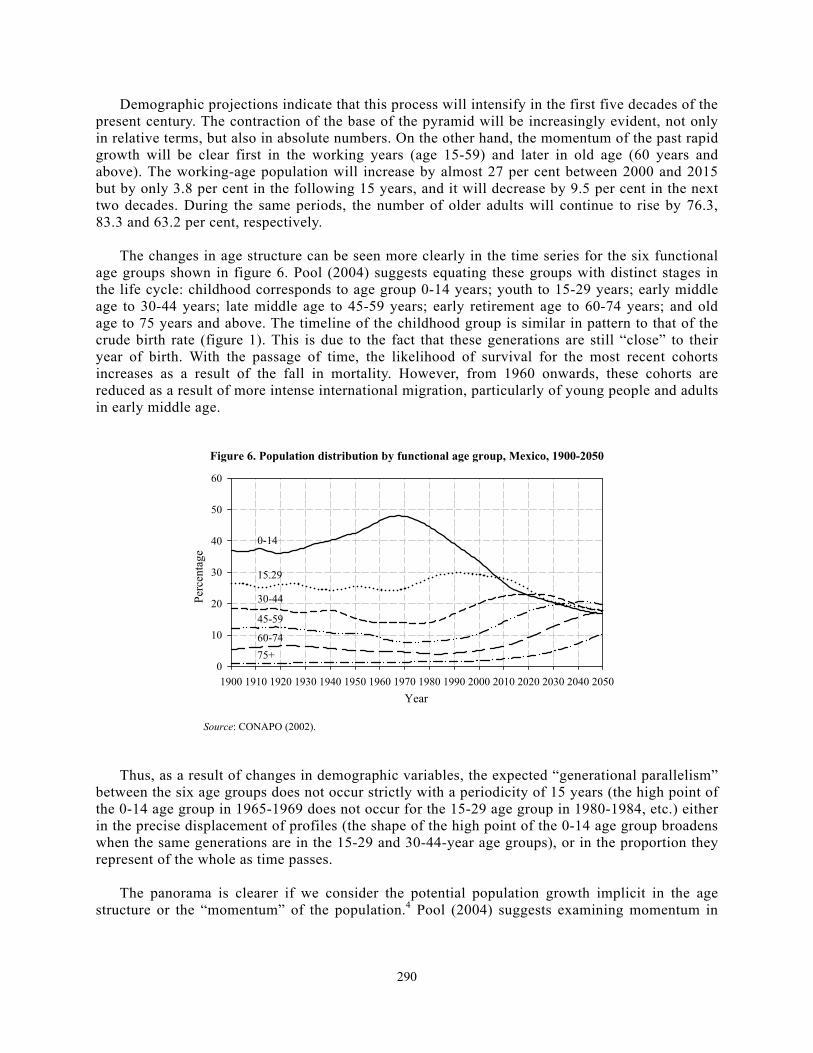
Demographic projections indicate that this process will intensify in the first five decades of the present century. The contraction of the base of the pyramid will be increasingly evident, not only in relative terms, but also in absolute numbers. On the other hand, the momentum of the past rapid growth will be clear first in the working years (age 15-59) and later in old age (60 years and above). The working-age population will increase by almost 27 per cent between 2000 and 2015 but by only 3.8 per cent in the following 15 years, and it will decrease by 9.5 per cent in the next two decades. During the same periods, the number of older adults will continue to rise by 76.3, 83.3 and 63.2 per cent, respectively. The changes in age structure can be seen more clearly in the time series for the six functional age groups shown in figure 6. Pool (2004) suggests equating these groups with distinct stages in the life cycle: childhood corresponds to age group 0-14 years; youth to 15-29 years; early middle age to 30-44 years; late middle age to 45-59 years; early retirement age to 60-74 years; and old age to 75 years and above. The timeline of the childhood group is similar in pattern to that of the crude birth rate (figure 1). This is due to the fact that these generations are still “close” to their year of birth. With the passage of time, the likelihood of survival for the most recent cohorts increases as a result of the fall in mortality. However, from 1960 onwards, these cohorts are reduced as a result of more intense international migration, particularly of young people and adults in early middle age.
Figure 6. Population distribution by functional age group, Mexico, 1900-2050
Year1900 1910 1920 1930 1940 1950 1960 1970 1980 1990 2000 2010 2020 2030 2040 2050
Perc
enta
ge
0
10
20
30
40
50
60
0-14
15.29
30-44
45-59
60-7475+
Source: CONAPO (2002). Thus, as a result of changes in demographic variables, the expected “generational parallelism” between the six age groups does not occur strictly with a periodicity of 15 years (the high point of the 0-14 age group in 1965-1969 does not occur for the 15-29 age group in 1980-1984, etc.) either in the precise displacement of profiles (the shape of the high point of the 0-14 age group broadens when the same generations are in the 15-29 and 30-44-year age groups), or in the proportion they represent of the whole as time passes. The panorama is clearer if we consider the potential population growth implicit in the age structure or the “momentum” of the population.4 Pool (2004) suggests examining momentum in
291
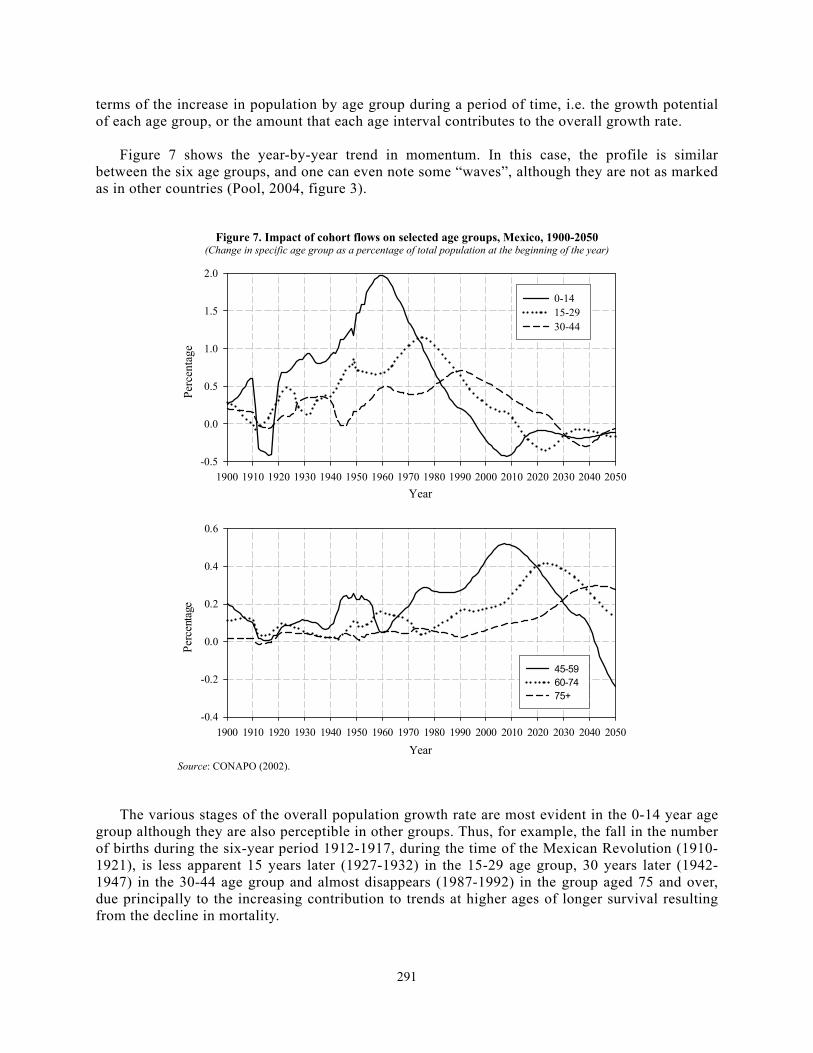
terms of the increase in population by age group during a period of time, i.e. the growth potential of each age group, or the amount that each age interval contributes to the overall growth rate. Figure 7 shows the year-by-year trend in momentum. In this case, the profile is similar between the six age groups, and one can even note some “waves”, although they are not as marked as in other countries (Pool, 2004, figure 3).
Figure 7. Impact of cohort flows on selected age groups, Mexico, 1900-2050 (Change in specific age group as a percentage of total population at the beginning of the year)
Year1900 1910 1920 1930 1940 1950 1960 1970 1980 1990 2000 2010 2020 2030 2040 2050
Perc
enta
ge
-0.5
0.0
0.5
1.0
1.5
2.0
0-14 15-29 30-44
Year1900 1910 1920 1930 1940 1950 1960 1970 1980 1990 2000 2010 2020 2030 2040 2050
Perc
enta
ge
-0.4
-0.2
0.0
0.2
0.4
0.6
45-59 60-74 75+
Source: CONAPO (2002).
The various stages of the overall population growth rate are most evident in the 0-14 year age group although they are also perceptible in other groups. Thus, for example, the fall in the number of births during the six-year period 1912-1917, during the time of the Mexican Revolution (1910-1921), is less apparent 15 years later (1927-1932) in the 15-29 age group, 30 years later (1942-1947) in the 30-44 age group and almost disappears (1987-1992) in the group aged 75 and over, due principally to the increasing contribution to trends at higher ages of longer survival resulting from the decline in mortality.
292
The clearest “wave” is the one that occurs around 1960 which is the result of the policy of promoting and, later, discouraging large families. Once the fall in fertility slows drastically beginning in 2005 (figure 4), the process of convergence towards eventual stability will continue to give rise to waves although they will be much smaller than the one that occurred around 1960. The “intergenerational” spacing of these waves will be approximately 15 years throughout the present century although up to 2050 they will be observed only among the children and youth (figure 7).
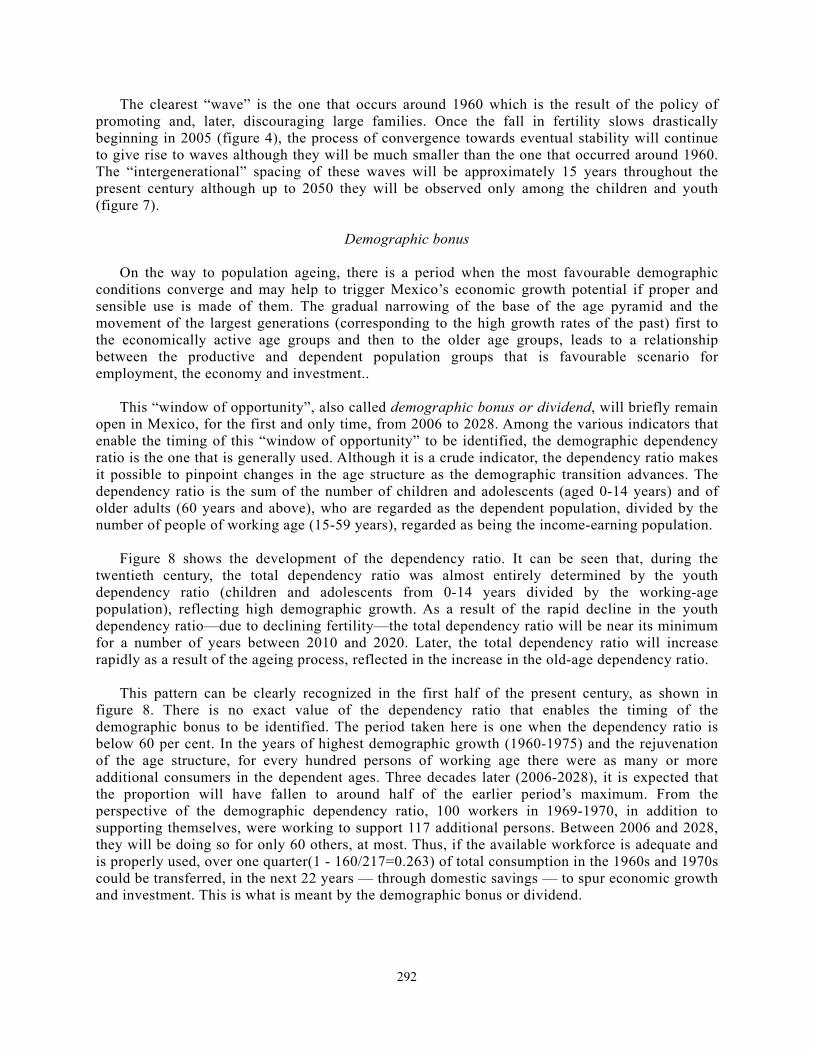
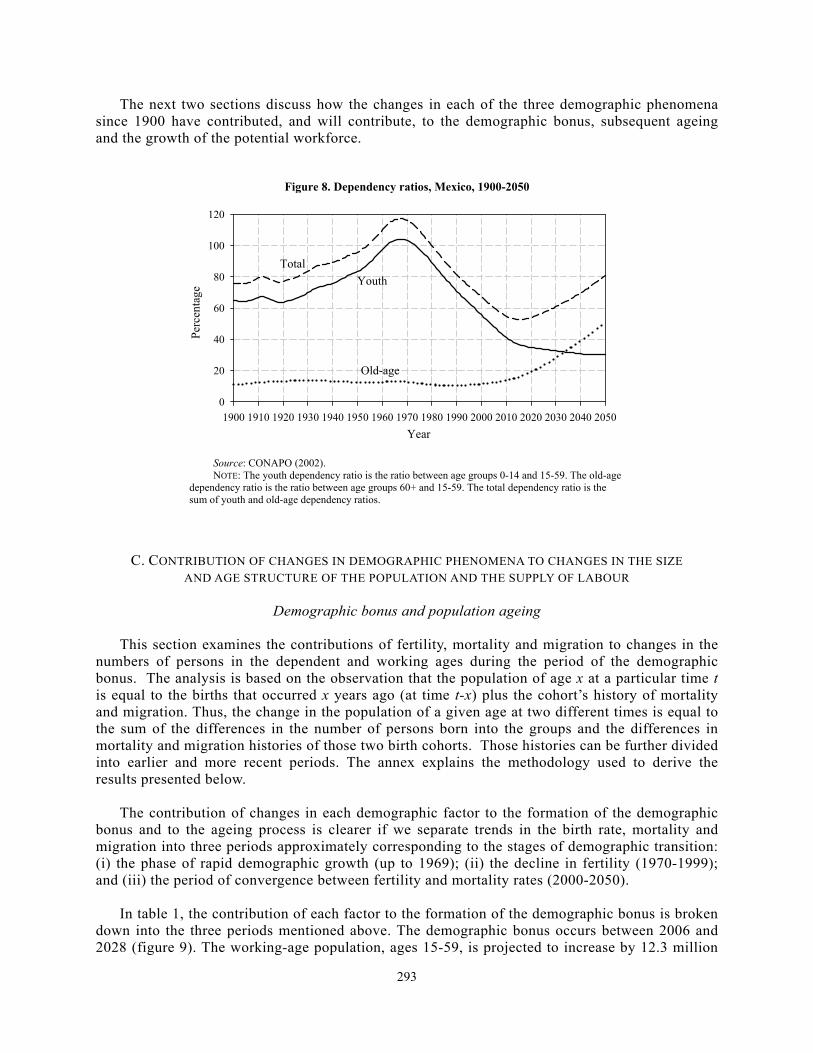
Demographic bonus On the way to population ageing, there is a period when the most favourable demographic conditions converge and may help to trigger Mexico’s economic growth potential if proper and sensible use is made of them. The gradual narrowing of the base of the age pyramid and the movement of the largest generations (corresponding to the high growth rates of the past) first to the economically active age groups and then to the older age groups, leads to a relationship between the productive and dependent population groups that is favourable scenario for employment, the economy and investment.. This “window of opportunity”, also called demographic bonus or dividend, will briefly remain open in Mexico, for the first and only time, from 2006 to 2028. Among the various indicators that enable the timing of this “window of opportunity” to be identified, the demographic dependency ratio is the one that is generally used. Although it is a crude indicator, the dependency ratio makes it possible to pinpoint changes in the age structure as the demographic transition advances. The dependency ratio is the sum of the number of children and adolescents (aged 0-14 years) and of older adults (60 years and above), who are regarded as the dependent population, divided by the number of people of working age (15-59 years), regarded as being the income-earning population. Figure 8 shows the development of the dependency ratio. It can be seen that, during the twentieth century, the total dependency ratio was almost entirely determined by the youth dependency ratio (children and adolescents from 0-14 years divided by the working-age population), reflecting high demographic growth. As a result of the rapid decline in the youth dependency ratio—due to declining fertility—the total dependency ratio will be near its minimum for a number of years between 2010 and 2020. Later, the total dependency ratio will increase rapidly as a result of the ageing process, reflected in the increase in the old-age dependency ratio. This pattern can be clearly recognized in the first half of the present century, as shown in figure 8. There is no exact value of the dependency ratio that enables the timing of the demographic bonus to be identified. The period taken here is one when the dependency ratio is below 60 per cent. In the years of highest demographic growth (1960-1975) and the rejuvenation of the age structure, for every hundred persons of working age there were as many or more additional consumers in the dependent ages. Three decades later (2006-2028), it is expected that the proportion will have fallen to around half of the earlier period’s maximum. From the perspective of the demographic dependency ratio, 100 workers in 1969-1970, in addition to supporting themselves, were working to support 117 additional persons. Between 2006 and 2028, they will be doing so for only 60 others, at most. Thus, if the available workforce is adequate and is properly used, over one quarter(1 - 160/217=0.263) of total consumption in the 1960s and 1970s could be transferred, in the next 22 years — through domestic savings — to spur economic growth and investment. This is what is meant by the demographic bonus or dividend.
293
The next two sections discuss how the changes in each of the three demographic phenomena since 1900 have contributed, and will contribute, to the demographic bonus, subsequent ageing and the growth of the potential workforce.
Figure 8. Dependency ratios, Mexico, 1900-2050
Year1900 1910 1920 1930 1940 1950 1960 1970 1980 1990 2000 2010 2020 2030 2040 2050
Perc
enta
ge
0
20
40
60
80
100
120
TotalYouth
Old-age
Source: CONAPO (2002). NOTE: The youth dependency ratio is the ratio between age groups 0-14 and 15-59. The old-age dependency ratio is the ratio between age groups 60+ and 15-59. The total dependency ratio is the sum of youth and old-age dependency ratios.
C. CONTRIBUTION OF CHANGES IN DEMOGRAPHIC PHENOMENA TO CHANGES IN THE SIZE AND AGE STRUCTURE OF THE POPULATION AND THE SUPPLY OF LABOUR
Demographic bonus and population ageing
This section examines the contributions of fertility, mortality and migration to changes in the numbers of persons in the dependent and working ages during the period of the demographic bonus. The analysis is based on the observation that the population of age x at a particular time t is equal to the births that occurred x years ago (at time t-x) plus the cohort’s history of mortality and migration. Thus, the change in the population of a given age at two different times is equal to the sum of the differences in the number of persons born into the groups and the differences in mortality and migration histories of those two birth cohorts. Those histories can be further divided into earlier and more recent periods. The annex explains the methodology used to derive the results presented below. The contribution of changes in each demographic factor to the formation of the demographic bonus and to the ageing process is clearer if we separate trends in the birth rate, mortality and migration into three periods approximately corresponding to the stages of demographic transition: (i) the phase of rapid demographic growth (up to 1969); (ii) the decline in fertility (1970-1999); and (iii) the period of convergence between fertility and mortality rates (2000-2050). In table 1, the contribution of each factor to the formation of the demographic bonus is broken down into the three periods mentioned above. The demographic bonus occurs between 2006 and 2028 (figure 9). The working-age population, ages 15-59, is projected to increase by 12.3 million
294
persons or 18.2 per cent during this period. Changes in fertility and mortality each contribute positively to growth in the number aged 15-59 (with growth in births contributing 6,522,654 persons and mortality decline contributing 6,955,228). By contrast, international migration is estimated to reduce the working-age population by 1.2 million persons, which amounts 8.6 per cent of natural increase (that is, the sum of the contributions of fertility and mortality, 13.5 million).
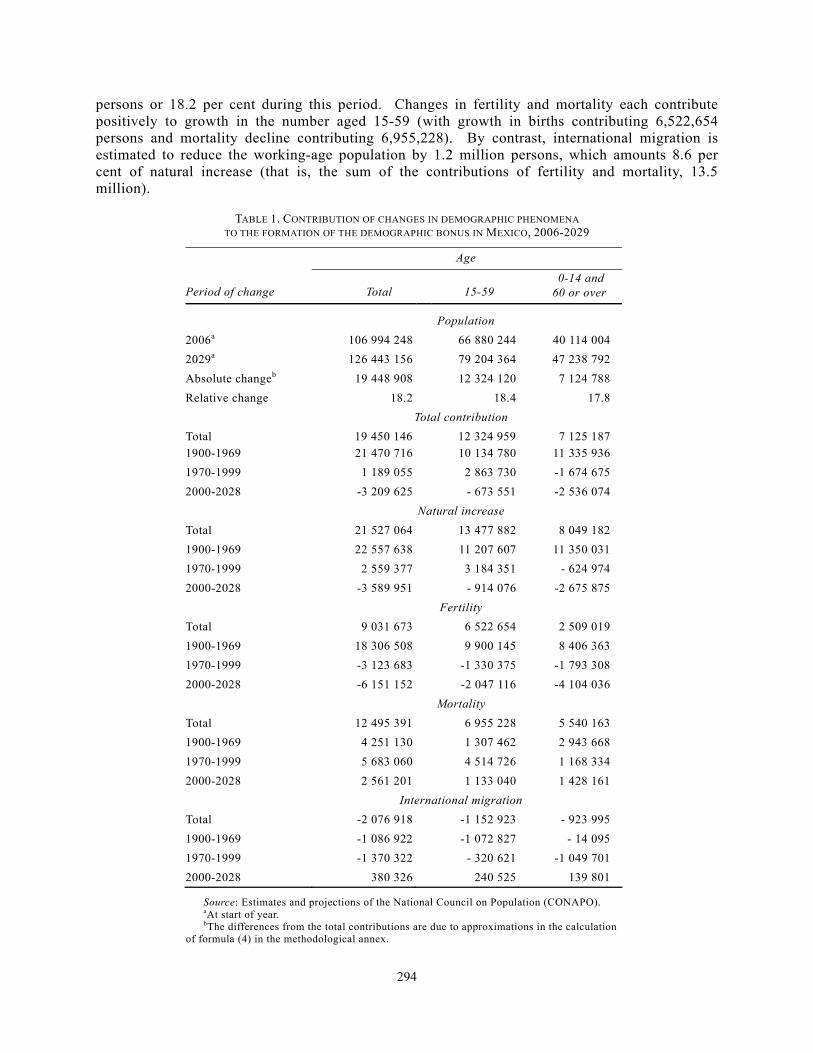
TABLE 1. CONTRIBUTION OF CHANGES IN DEMOGRAPHIC PHENOMENA TO THE FORMATION OF THE DEMOGRAPHIC BONUS IN MEXICO, 2006-2029
Age
Period of change Total 15-59 0-14 and 60 or over
Population 2006a 106 994 248 66 880 244 40 114 004 2029a 126 443 156 79 204 364 47 238 792 Absolute changeb 19 448 908 12 324 120 7 124 788 Relative change 18.2 18.4 17.8
Total contribution Total 19 450 146 12 324 959 7 125 187 1900-1969 21 470 716 10 134 780 11 335 936 1970-1999 1 189 055 2 863 730 -1 674 675 2000-2028 -3 209 625 - 673 551 -2 536 074
Natural increase Total 21 527 064 13 477 882 8 049 182 1900-1969 22 557 638 11 207 607 11 350 031 1970-1999 2 559 377 3 184 351 - 624 974 2000-2028 -3 589 951 - 914 076 -2 675 875
Fertility Total 9 031 673 6 522 654 2 509 019 1900-1969 18 306 508 9 900 145 8 406 363 1970-1999 -3 123 683 -1 330 375 -1 793 308 2000-2028 -6 151 152 -2 047 116 -4 104 036
Mortality Total 12 495 391 6 955 228 5 540 163 1900-1969 4 251 130 1 307 462 2 943 668 1970-1999 5 683 060 4 514 726 1 168 334 2000-2028 2 561 201 1 133 040 1 428 161
International migration Total -2 076 918 -1 152 923 - 923 995 1900-1969 -1 086 922 -1 072 827 - 14 095 1970-1999 -1 370 322 - 320 621 -1 049 701 2000-2028 380 326 240 525 139 801
Source: Estimates and projections of the National Council on Population (CONAPO). aAt start of year. bThe differences from the total contributions are due to approximations in the calculation of formula (4) in the methodological annex.
295
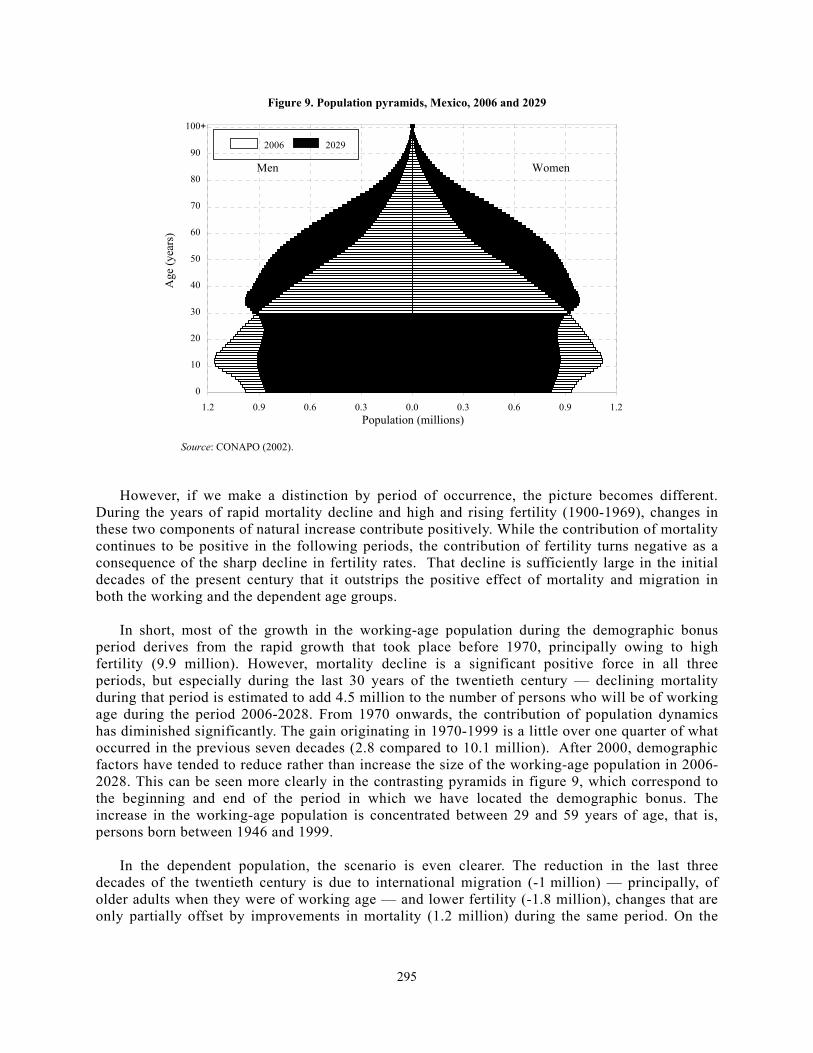
Figure 9. Population pyramids, Mexico, 2006 and 2029
1.2 0.9 0.6 0.3 0.0 0.3 0.6 0.9 1.20
10
20
30
40
50
60
70
80
90
100
Age
(yea
rs) a
Population (millions)
Men Women
2006 2029
+
Source: CONAPO (2002).
However, if we make a distinction by period of occurrence, the picture becomes different. During the years of rapid mortality decline and high and rising fertility (1900-1969), changes in these two components of natural increase contribute positively. While the contribution of mortality continues to be positive in the following periods, the contribution of fertility turns negative as a consequence of the sharp decline in fertility rates. That decline is sufficiently large in the initial decades of the present century that it outstrips the positive effect of mortality and migration in both the working and the dependent age groups. In short, most of the growth in the working-age population during the demographic bonus period derives from the rapid growth that took place before 1970, principally owing to high fertility (9.9 million). However, mortality decline is a significant positive force in all three periods, but especially during the last 30 years of the twentieth century — declining mortality during that period is estimated to add 4.5 million to the number of persons who will be of working age during the period 2006-2028. From 1970 onwards, the contribution of population dynamics has diminished significantly. The gain originating in 1970-1999 is a little over one quarter of what occurred in the previous seven decades (2.8 compared to 10.1 million). After 2000, demographic factors have tended to reduce rather than increase the size of the working-age population in 2006-2028. This can be seen more clearly in the contrasting pyramids in figure 9, which correspond to the beginning and end of the period in which we have located the demographic bonus. The increase in the working-age population is concentrated between 29 and 59 years of age, that is, persons born between 1946 and 1999. In the dependent population, the scenario is even clearer. The reduction in the last three decades of the twentieth century is due to international migration (-1 million) — principally, of older adults when they were of working age — and lower fertility (-1.8 million), changes that are only partially offset by improvements in mortality (1.2 million) during the same period. On the
296
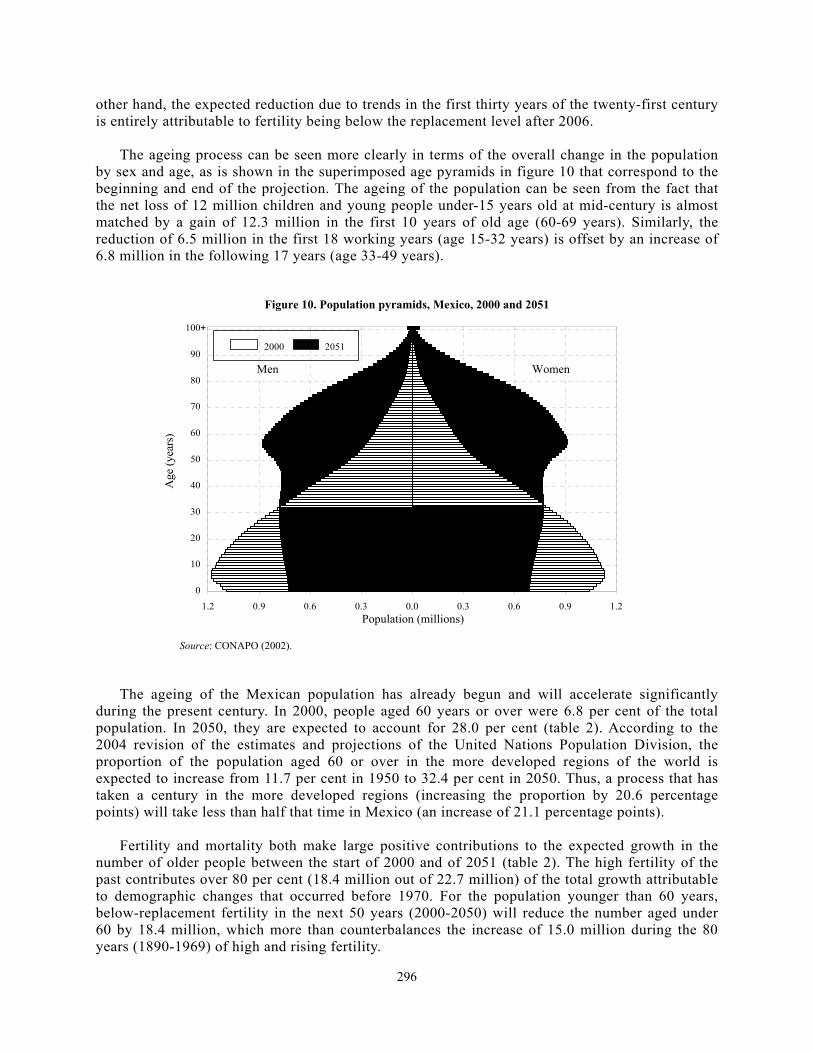
other hand, the expected reduction due to trends in the first thirty years of the twenty-first century is entirely attributable to fertility being below the replacement level after 2006. The ageing process can be seen more clearly in terms of the overall change in the population by sex and age, as is shown in the superimposed age pyramids in figure 10 that correspond to the beginning and end of the projection. The ageing of the population can be seen from the fact that the net loss of 12 million children and young people under-15 years old at mid-century is almost matched by a gain of 12.3 million in the first 10 years of old age (60-69 years). Similarly, the reduction of 6.5 million in the first 18 working years (age 15-32 years) is offset by an increase of 6.8 million in the following 17 years (age 33-49 years).
Figure 10. Population pyramids, Mexico, 2000 and 2051
1.2 0.9 0.6 0.3 0.0 0.3 0.6 0.9 1.2
0
10
20
30
40
50
60
70
80
90
100
Age
(yea
rs) a
Population (millions)
Men Women
2000 2051
+
Source: CONAPO (2002).
The ageing of the Mexican population has already begun and will accelerate significantly during the present century. In 2000, people aged 60 years or over were 6.8 per cent of the total population. In 2050, they are expected to account for 28.0 per cent (table 2). According to the 2004 revision of the estimates and projections of the United Nations Population Division, the proportion of the population aged 60 or over in the more developed regions of the world is expected to increase from 11.7 per cent in 1950 to 32.4 per cent in 2050. Thus, a process that has taken a century in the more developed regions (increasing the proportion by 20.6 percentage points) will take less than half that time in Mexico (an increase of 21.1 percentage points). Fertility and mortality both make large positive contributions to the expected growth in the number of older people between the start of 2000 and of 2051 (table 2). The high fertility of the past contributes over 80 per cent (18.4 million out of 22.7 million) of the total growth attributable to demographic changes that occurred before 1970. For the population younger than 60 years, below-replacement fertility in the next 50 years (2000-2050) will reduce the number aged under 60 by 18.4 million, which more than counterbalances the increase of 15.0 million during the 80 years (1890-1969) of high and rising fertility.

297
TABLE 2. CONTRIBUTION OF CHANGES IN DEMOGRAPHIC FACTORS TO POPULATION GROWTH DURING THE AGEING PROCESS IN MEXICO, 2000-2051
Age Period of change Total 60 or over 0-59
Population 2000a 99 929 495 6 752 115 93 177 3802051a 129 480 027 36 488 325 92 991 702Absolute changeb 29 550 532 29 736 210 -185 678Relative change 29.6 440.4 -0.2
Total contribution Total 29 547 562 29 732 281 -184 7191890-1969 38 470 126 22 658 345 15 811 7811970-1999 2 345 023 3 511 832 -1 166 8092000-2050 -11 267 587 3 562 104 -14 829 691
Natural increase Total 33 168 886 32 697 041 471 8451890-1969 40 728 223 23 456 955 17 271 2681970-1999 4 594 503 6 159 910 -1 565 4072000-2050 -12 153 840 3 080 176 -15 234 016
Fertility Total 8 138 009 20 974 104 -12 836 0951890-1969 33 378 322 18 381 567 14 996 7551970-1999 -6 794 642 2 592 537 -9 387 1792000-2050 -18 445 671 0 -18 445 671
Mortality Total 25 030 877 11 722 937 13 307 9401890-1969 7 349 901 5 075 388 2 274 5131970-1999 11 389 145 3 567 373 7 821 7722000-2050 6 291 831 3 080 176 3 211 655
International migration Total -3 621 324 -2 964 760 -656 5641890-1969 -2 258 097 -798 610 -1 459 4871970-1999 -2 249 480 -2 648 078 398 5982000-2050 886 253 481 928 404 325
Source: Estimates and projections of the National Council on Population (CONAPO). aAt start of year. bThe differences from the total contributions are due to approximations in the calculation of formula (4) in the methodological annex.
Although the overall reduction in the risk of death is the same (74 per cent) during the two 80-year periods 1890-1969 and 1970-2050 (calculations not shown), the contribution of improved survival to the growth in both age groups is greater in the second period (6.6 million for older adults and 11.0 million for persons aged under 60 years) than in the first (5.1 and 2.3 million, respectively).
298
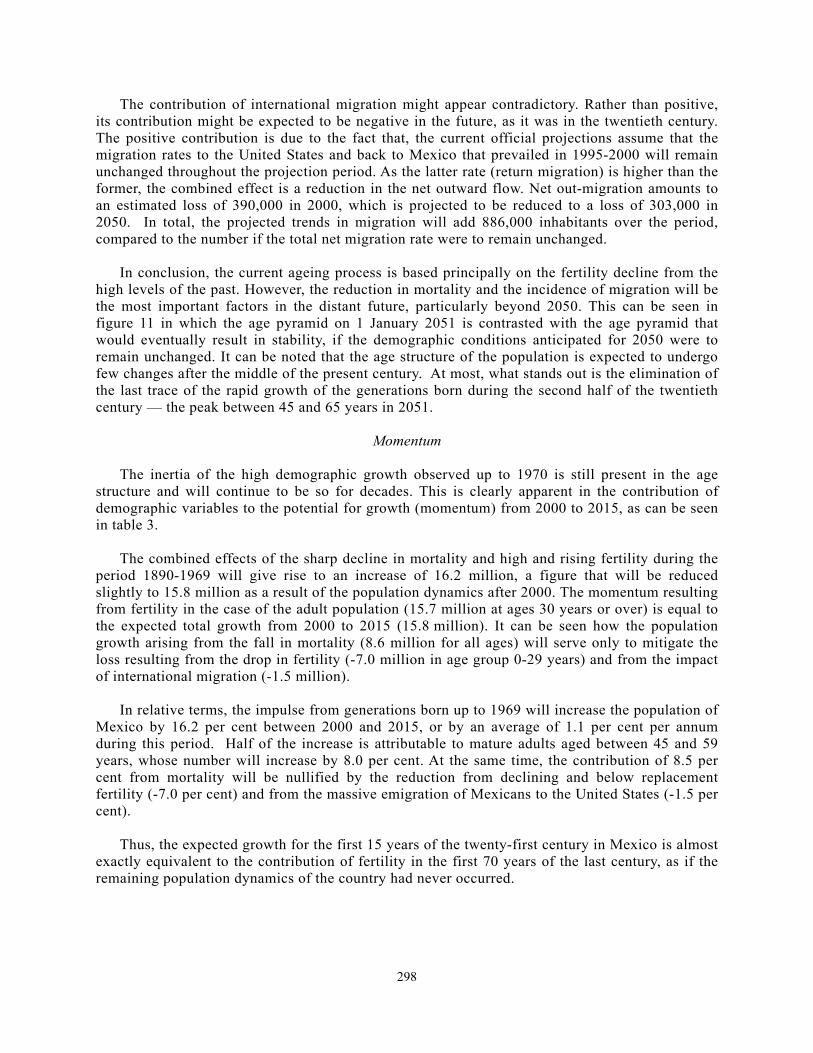
The contribution of international migration might appear contradictory. Rather than positive, its contribution might be expected to be negative in the future, as it was in the twentieth century. The positive contribution is due to the fact that, the current official projections assume that the migration rates to the United States and back to Mexico that prevailed in 1995-2000 will remain unchanged throughout the projection period. As the latter rate (return migration) is higher than the former, the combined effect is a reduction in the net outward flow. Net out-migration amounts to an estimated loss of 390,000 in 2000, which is projected to be reduced to a loss of 303,000 in 2050. In total, the projected trends in migration will add 886,000 inhabitants over the period, compared to the number if the total net migration rate were to remain unchanged. In conclusion, the current ageing process is based principally on the fertility decline from the high levels of the past. However, the reduction in mortality and the incidence of migration will be the most important factors in the distant future, particularly beyond 2050. This can be seen in figure 11 in which the age pyramid on 1 January 2051 is contrasted with the age pyramid that would eventually result in stability, if the demographic conditions anticipated for 2050 were to remain unchanged. It can be noted that the age structure of the population is expected to undergo few changes after the middle of the present century. At most, what stands out is the elimination of the last trace of the rapid growth of the generations born during the second half of the twentieth century — the peak between 45 and 65 years in 2051.
Momentum
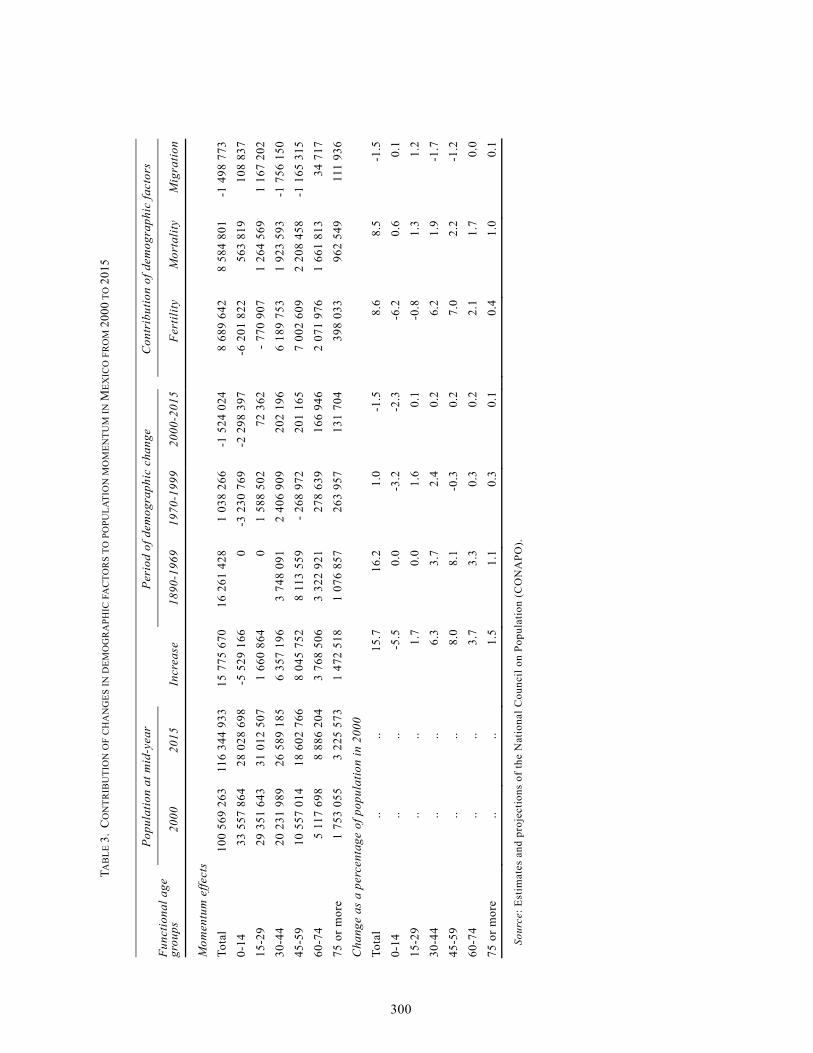
The inertia of the high demographic growth observed up to 1970 is still present in the age structure and will continue to be so for decades. This is clearly apparent in the contribution of demographic variables to the potential for growth (momentum) from 2000 to 2015, as can be seen in table 3. The combined effects of the sharp decline in mortality and high and rising fertility during the period 1890-1969 will give rise to an increase of 16.2 million, a figure that will be reduced slightly to 15.8 million as a result of the population dynamics after 2000. The momentum resulting from fertility in the case of the adult population (15.7 million at ages 30 years or over) is equal to the expected total growth from 2000 to 2015 (15.8 million). It can be seen how the population growth arising from the fall in mortality (8.6 million for all ages) will serve only to mitigate the loss resulting from the drop in fertility (-7.0 million in age group 0-29 years) and from the impact of international migration (-1.5 million). In relative terms, the impulse from generations born up to 1969 will increase the population of Mexico by 16.2 per cent between 2000 and 2015, or by an average of 1.1 per cent per annum during this period. Half of the increase is attributable to mature adults aged between 45 and 59 years, whose number will increase by 8.0 per cent. At the same time, the contribution of 8.5 per cent from mortality will be nullified by the reduction from declining and below replacement fertility (-7.0 per cent) and from the massive emigration of Mexicans to the United States (-1.5 per cent). Thus, the expected growth for the first 15 years of the twenty-first century in Mexico is almost exactly equivalent to the contribution of fertility in the first 70 years of the last century, as if the remaining population dynamics of the country had never occurred.
299
Figure 11. Population pyramid and associated stable population, Mexico, 2051
1.2 0.9 0.6 0.3 0.0 0.3 0.6 0.9 1.2
0
10
20
30
40
50
60
70
80
90
100
Age
(yea
rs) a
Population (millions)
Men Women
2051 Stable
+
Source: CONAPO (2002).
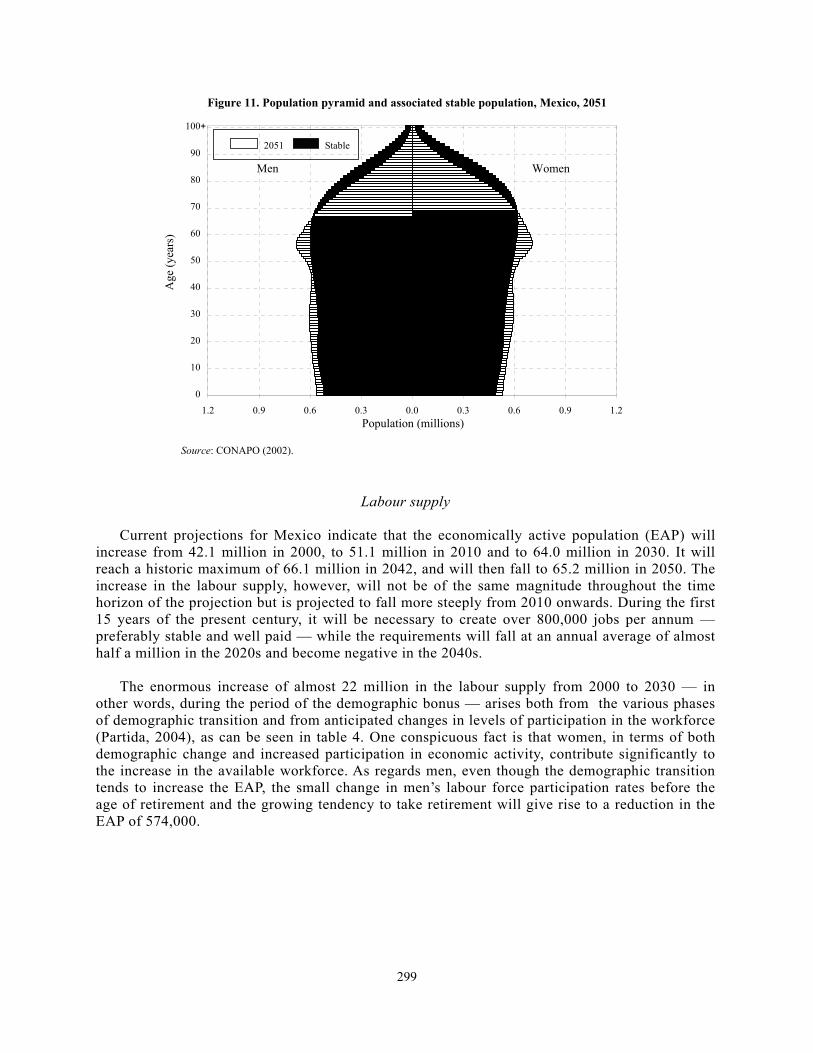
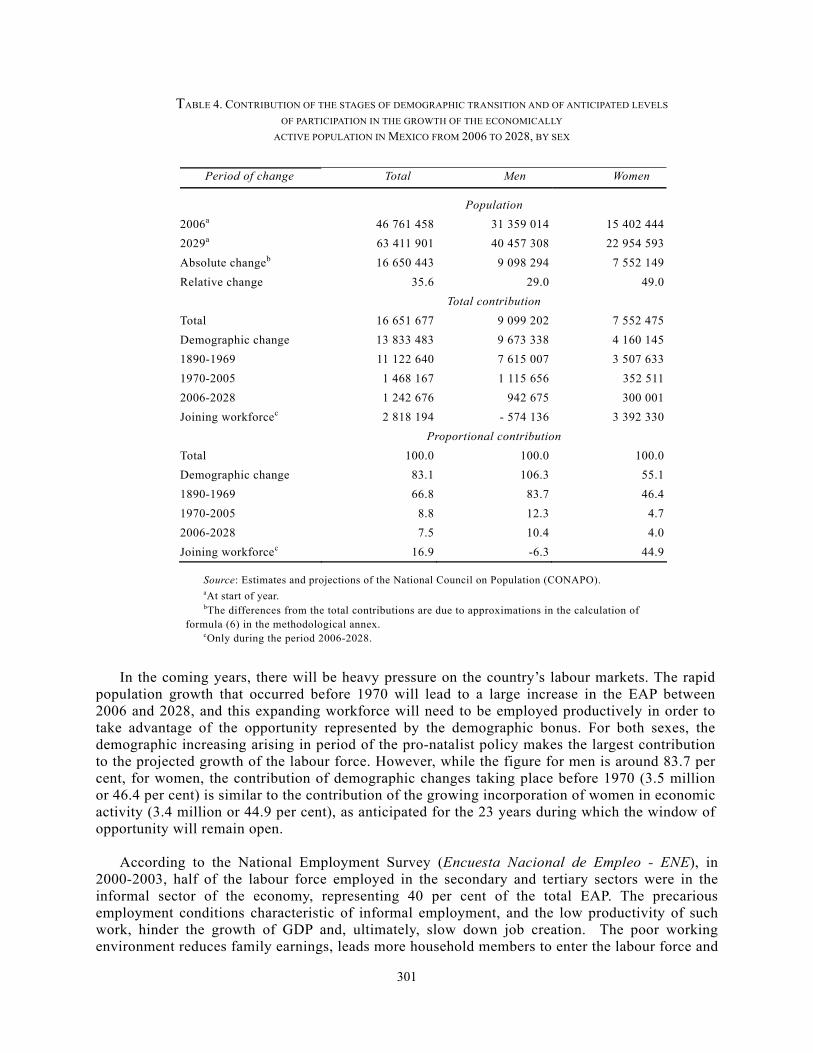
Labour supply Current projections for Mexico indicate that the economically active population (EAP) will increase from 42.1 million in 2000, to 51.1 million in 2010 and to 64.0 million in 2030. It will reach a historic maximum of 66.1 million in 2042, and will then fall to 65.2 million in 2050. The increase in the labour supply, however, will not be of the same magnitude throughout the time horizon of the projection but is projected to fall more steeply from 2010 onwards. During the first 15 years of the present century, it will be necessary to create over 800,000 jobs per annum — preferably stable and well paid — while the requirements will fall at an annual average of almost half a million in the 2020s and become negative in the 2040s. The enormous increase of almost 22 million in the labour supply from 2000 to 2030 — in other words, during the period of the demographic bonus — arises both from the various phases of demographic transition and from anticipated changes in levels of participation in the workforce (Partida, 2004), as can be seen in table 4. One conspicuous fact is that women, in terms of both demographic change and increased participation in economic activity, contribute significantly to the increase in the available workforce. As regards men, even though the demographic transition tends to increase the EAP, the small change in men’s labour force participation rates before the age of retirement and the growing tendency to take retirement will give rise to a reduction in the EAP of 574,000.
TAB
LE 3
. C
ON
TRIB
UTI
ON
OF
CH
AN
GES
IN D
EMO
GR
APH
IC F
AC
TOR
S TO
PO
PULA
TIO
N M
OM
ENTU
M IN
MEX
ICO
FR
OM
200
0 TO
201
5
Po
pula
tion
at m
id-y
ear
Peri
od o
f dem
ogra
phic
cha
nge
Con
trib
utio
n of
dem
ogra
phic
fact
ors
Func
tiona
l age
gr
oups
200
0
201
5 I
ncre
ase
1890
-196
919
70-1
999
2000
-201
5Fe
rtili
tyM
orta
lity
Mig
ratio
n
Mom
entu
m e
ffect
s To
tal
100
569
263
116
344
933
15 7
75 6
7016
261
428
1 03
8 26
6-1
524
024
8 68
9 64
28
584
801
-1 4
98 7
730-
14
33 5
57 8
64
28 0
28 6
98-5
529
166
0-3
230
769
-2 2
98 3
97-6
201
822
563
819
108
837
15-2
9 29
351
643
31
012
507
1 66
0 86
40
1 58
8 50
2 7
2 36
2- 7
70 9
071
264
569
1 16
7 20
230
-44
20 2
31 9
89
26 5
89 1
856
357
196
3 74
8 09
12
406
909
202
196
6 18
9 75
31
923
593
-1 7
56 1
5045
-59
10 5
57 0
14
18 6
02 7
668
045
752
8 11
3 55
9- 2
68 9
72 2
01 1
657
002
609
2 20
8 45
8-1
165
315
60-7
4 5
117
698
8 88
6 20
43
768
506
3 32
2 92
1 2
78 6
39 1
66 9
462
071
976
1 66
1 81
3 3
4 71
775
or m
ore
1 75
3 05
5 3
225
573
1 47
2 51
81
076
857
263
957
131
704
398
033
962
549
111
936
Cha
nge
as a
per
cent
age
of p
opul
atio
n in
200
0 To
tal
.. ..
15.7
16.2
1.0
-1.5
8.6
8.5
-1.5
0-14
..
.. -5
.50.
0-3
.2-2
.3-6
.20.
60.
115
-29
.. ..
1.7
0.0
1.6
0.1
-0.8
1.3
1.2
30-4
4 ..
.. 6.
33.
72.
40.
26.
21.
9-1
.745
-59
.. ..
8.0
8.1
-0.3
0.2
7.0
2.2
-1.2
60-7
4 ..
.. 3.
73.
30.
30.
22.
11.
70.
075
or m
ore
.. ..
1.5
1.1
0.3
0.1
0.4
1.0
0.1
So
urce
: Est
imat
es a
nd p
roje
ctio
ns o
f th
e N
atio
nal C
ounc
il on
Pop
ulat
ion
(CO
NA
PO).
300
301
TABLE 4. CONTRIBUTION OF THE STAGES OF DEMOGRAPHIC TRANSITION AND OF ANTICIPATED LEVELS
OF PARTICIPATION IN THE GROWTH OF THE ECONOMICALLY ACTIVE POPULATION IN MEXICO FROM 2006 TO 2028, BY SEX
Period of change Total Men Women
Population 2006a 46 761 458 31 359 014 15 402 4442029a 63 411 901 40 457 308 22 954 593Absolute changeb 16 650 443 9 098 294 7 552 149Relative change 35.6 29.0 49.0
Total contribution Total 16 651 677 9 099 202 7 552 475Demographic change 13 833 483 9 673 338 4 160 1451890-1969 11 122 640 7 615 007 3 507 6331970-2005 1 468 167 1 115 656 352 5112006-2028 1 242 676 942 675 300 001Joining workforcec 2 818 194 - 574 136 3 392 330
Proportional contribution Total 100.0 100.0 100.0Demographic change 83.1 106.3 55.11890-1969 66.8 83.7 46.41970-2005 8.8 12.3 4.72006-2028 7.5 10.4 4.0Joining workforcec 16.9 -6.3 44.9
Source: Estimates and projections of the National Council on Population (CONAPO). aAt start of year. bThe differences from the total contributions are due to approximations in the calculation of formula (6) in the methodological annex. cOnly during the period 2006-2028.
In the coming years, there will be heavy pressure on the country’s labour markets. The rapid population growth that occurred before 1970 will lead to a large increase in the EAP between 2006 and 2028, and this expanding workforce will need to be employed productively in order to take advantage of the opportunity represented by the demographic bonus. For both sexes, the demographic increasing arising in period of the pro-natalist policy makes the largest contribution to the projected growth of the labour force. However, while the figure for men is around 83.7 per cent, for women, the contribution of demographic changes taking place before 1970 (3.5 million or 46.4 per cent) is similar to the contribution of the growing incorporation of women in economic activity (3.4 million or 44.9 per cent), as anticipated for the 23 years during which the window of opportunity will remain open. According to the National Employment Survey (Encuesta Nacional de Empleo - ENE), in 2000-2003, half of the labour force employed in the secondary and tertiary sectors were in the informal sector of the economy, representing 40 per cent of the total EAP. The precarious employment conditions characteristic of informal employment, and the low productivity of such work, hinder the growth of GDP and, ultimately, slow down job creation. The poor working environment reduces family earnings, leads more household members to enter the labour force and
302
minimizes any possibility of savings. A limited savings capacity not only puts family assets at risk from major unforeseen expenses, but also prevents the accumulation of resources needed to cope with old age. Together with the low percentage of workers currently contributing to social security systems, those who do contribute to pension plans do so for too short a time, with the result that the fund so constituted is inadequate for the purchase of an adequate annuity to ensure a dignified old age. If recent patterns of contribution were to remain unchanged in the future, those aged 15 years — some of whom contribute, while some do not, and others have not yet joined the workforce — would spend the major part of their active life outside social security systems. The average number of years during which they would pay into retirement savings systems — about 12 years for men and 8 for women — is far short of the minimum required (24 years) to enable them to draw the minimum pension guaranteed by the current Mexican Social Security Institute (IMSS) law, which is likely to be extended before long to the other pension schemes in the country. At 25 years of age, the situation is similar, particularly for a professional beginning his or her active life after finishing university education. Thus, if present contribution conditions remain unchanged, people will be poor not only during their working life but also in retirement. If the recent characteristics of labour markets were to continue until 2050, the proportion contributing to social security systems would begin to diminish in 2018, but the number of newly retired people would soar. The number would double between 2000 and 2016 and increase by a factor of 5 by mid-century. According to economic forecasts, a constant rate of growth of GDP of 4.8 per cent from 2000 to 2030 would be necessary to ensure that the number of established, productive and well-paid jobs with benefits (including social security) would include 84 per cent of the EAP in 2030 (Hernández Laos, 2004). If that scenario were to occur, the number of people covered would rise rapidly, increasing more than three-fold in only a quarter of a century (2010-2035), but, above all, they would represent over 90 per cent of the EAP, implying that people would contribute to the system for long periods (almost 30 years for men and over 23 years for women). This highly optimistic scenario would involve a virtuous circle. The labour force would be highly productive, thereby supporting high economic growth. The high contribution rates would create substantial reserves in pension plans, which, in turn, would favour investment and would generate further productive employment. At the same time, the high level of remuneration would encourage adolescents and young people to remain in the education system, with a consequential increase in human capital and a rise in the productivity of labour. Thus, the optimum utilization of the demographic bonus is “merely” a matter of fuelling mechanisms to ensure an annual 4.8 per cent growth in GDP for three decades. The demographic transition in the developing countries, such as Mexico, is occurring much more rapidly than in more developed regions. In Mexico, the sharp fall in mortality combined with a pro-natalist policy, which sought to meet the demand for labour from an expanding industrial sector and to populate the national territory, favoured high population growth during the twentieth century.
303
D. FINAL REMARKS The consequences of that demographic past are apparent today but will be even more important in the next few years, when the demographic bonus will offer the opportunity to promote savings and investment to cope with rapid population ageing. A number of public policies have been implemented in recent years that may help in utilizing the demographic bonus, even though they were not specifically designed to address the age-structure transition. The programme known as Oportunidades (Opportunities) is part of the struggle to combat extreme poverty. It focuses on the creation of human capital by means of food allowances that are granted on the condition that children and adolescents remain in school. Although the programme has been rated a success, only in the first years of the demographic bonus will it be possible to ascertain whether the available workforce is sufficiently qualified and whether it can be fully utilized to generate savings and investment. Another programme that should have a positive influence on the utlitization of the demographic bonus is Arranque Parejo en la Vida (Equal Start in Life). It aims to offer the same chance of healthy survival to all newborns and to reduce maternal mortality significantly. The anticipated increases in life expectancy and, hence, the eventual ageing of the population, largely depend on the success of health programmes such as Arranque Parejo en la Vida. Although programmes such as Oportunidades and Arranque Parejo en la Vida are short- and medium-term in scope and are useful tools for the utilization of the demographic bonus, the major challenge is the generation of sufficiently productive and well-paid employment to fully utilize a growing workforce stemming from the rapid increase in the working-age population. Informal employment currently accounts for almost half the economically active population. In addition to this problem, it will be necessary to create sufficient employment to meet the annual increase of over 800,000 new entrants to the workforce between 2000 and 2015 and an average of 500,000 during the period 2016-2030. While the window of opportunity remains open (2006-2028), the EAP will increase by 16.7 million, of which 12.5 million will be due to the increased numbers in the 15-59 year age group. Making use of the demographic bonus thus rests on the practical possibilities of minimizing the informal sector of the economy and creating productive employment for new job-seekers. Only in this way can the country take advantage of the saving and investment opportunities offered by a favourable dependency ratio. Recent economic projections for Mexico indicate that a sustained growth of 4.8 per cent per annum will be needed to ensure that, in 2030, enough formal jobs will have been created to absorb the available workforce. An intermediate scenario would perhaps be more likely, under which the jobs created would absorb between 71 and 76 per cent of the available workforce. If the current stagnation of the Mexican economy continues for 10 or 15 years, the demographic bonus will become a demographic nightmare. The “window of opportunity” will close without ever having been opened and, worst of all, Mexico will be doomed to become an old and poor country.
_______________
304
ANNEX
CALCULATION OF THE CONTRIBUTION OF DEMOGRAPHIC COMPONENTS TO POPULATION CHANGE IN EACH AGE GROUP
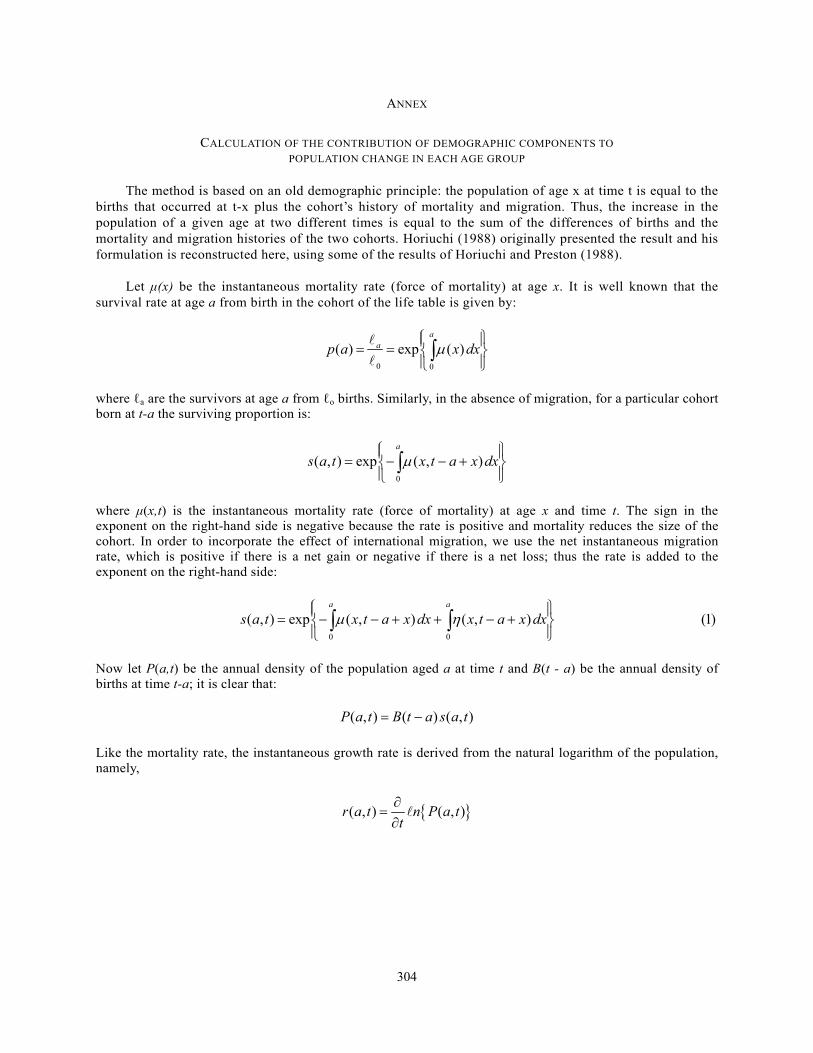
The method is based on an old demographic principle: the population of age x at time t is equal to the
births that occurred at t-x plus the cohort’s history of mortality and migration. Thus, the increase in the population of a given age at two different times is equal to the sum of the differences of births and the mortality and migration histories of the two cohorts. Horiuchi (1988) originally presented the result and his formulation is reconstructed here, using some of the results of Horiuchi and Preston (1988).
Let μ(x) be the instantaneous mortality rate (force of mortality) at age x. It is well known that the
survival rate at age a from birth in the cohort of the life table is given by:
0 0
( ) exp ( )a
ap a x dxμ⎧ ⎫⎪ ⎪= = ⎨ ⎬⎪ ⎪⎩ ⎭∫
l
l
where ℓa are the survivors at age a from ℓo births. Similarly, in the absence of migration, for a particular cohort born at t-a the surviving proportion is:
0
( , ) exp ( , )a
s a t x t a x dxμ⎧ ⎫⎪ ⎪= − − +⎨ ⎬⎪ ⎪⎩ ⎭∫
where μ(x,t) is the instantaneous mortality rate (force of mortality) at age x and time t. The sign in the exponent on the right-hand side is negative because the rate is positive and mortality reduces the size of the cohort. In order to incorporate the effect of international migration, we use the net instantaneous migration rate, which is positive if there is a net gain or negative if there is a net loss; thus the rate is added to the exponent on the right-hand side:
0 0
( , ) exp ( , ) ( , ) (1)a a
s a t x t a x dx x t a x dxμ η⎧ ⎫⎪ ⎪= − − + + − +⎨ ⎬⎪ ⎪⎩ ⎭∫ ∫
Now let P(a,t) be the annual density of the population aged a at time t and B(t - a) be the annual density of births at time t-a; it is clear that:
( , ) ( ) ( , )P a t B t a s a t= −
Like the mortality rate, the instantaneous growth rate is derived from the natural logarithm of the population, namely,
{ }( , ) ( , )r a t n P a tt∂
=∂l
305
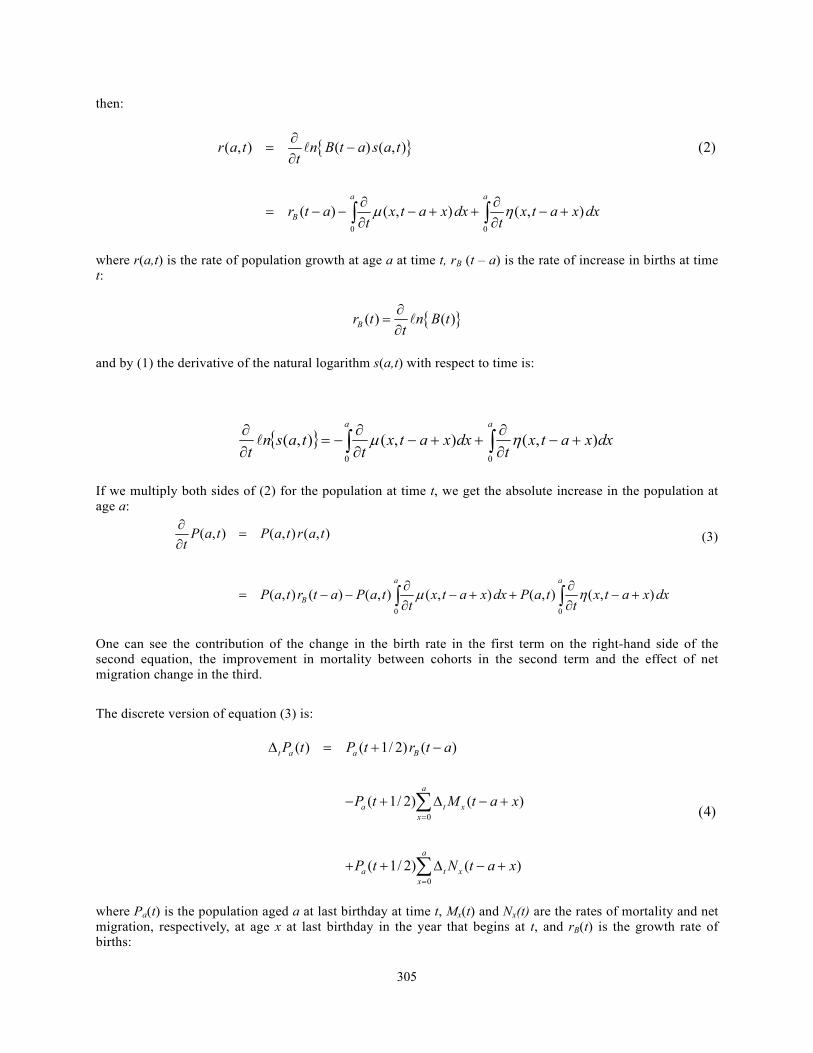
then:
{ }
0 0
( , ) ( ) ( , ) (2)
( ) ( , ) ( , )a a
B
r a t n B t a s a tt
r t a x t a x dx x t a x dxt tμ η
∂= −
∂
∂ ∂= − − − + + − +
∂ ∂∫ ∫
l
where r(a,t) is the rate of population growth at age a at time t, rB (t – a) is the rate of increase in births at time t:
{ }( ) ( )Br t n B tt∂
=∂l
and by (1) the derivative of the natural logarithm s(a,t) with respect to time is:
If we multiply both sides of (2) for the population at time t, we get the absolute increase in the population at age a:
(3)
One can see the contribution of the change in the birth rate in the first term on the right-hand side of the second equation, the improvement in mortality between cohorts in the second term and the effect of net migration change in the third.
The discrete version of equation (3) is:
0
0
( ) ( 1/ 2) ( )
( 1/ 2) ( )(4)
( 1/ 2) ( )
t a a B
a
a t xx
a
a t xx
P t P t r t a
P t M t a x
P t N t a x
=
=
Δ = + −
− + Δ − +
+ + Δ − +
∑
∑
where Pa(t) is the population aged a at last birthday at time t, Mx(t) and Nx(t) are the rates of mortality and net migration, respectively, at age x at last birthday in the year that begins at t, and rB(t) is the growth rate of births:
0 0
( , ) ( , ) ( , )
( , ) ( ) ( , ) ( , ) ( , ) ( , )a a
B
P a t P a t r a tt
P a t r t a P a t x t a x dx P a t x t a x dxt tμ η
∂=
∂
∂ ∂= − − − + + − +
∂ ∂∫ ∫
{ } ∫∫ +−∂∂
++−∂∂
−=∂∂ aa
dxxatxt
dxxatxt
tasnt 00
),(),(),( ημl
306
with Bt being the number of births during the year that begins at t.
To analyse the contribution of changes in demographic variables and of the beginning of employment, we consider the definition of the rate of participation in working life: where EAP(a,t) is the annual density of the economically active population (EAP) at time t. Thus,
( , )( , ) ( , )EAP a tA a t P a t=
the change in the EAP is:
( , ) ( , ) ( , ) ( , ) ( , ) ( , ) ( , ) (5)EAP a t P a t A a t A a t P a t P a t A a tt t t t∂ ∂ ∂ ∂
= = =∂ ∂ ∂ ∂
In the first element on the far right one can identify the contribution of demographic change and in the second term the part played by transformations on incorporation into labour markets. The discrete version of equation (5) for the year beginning at t is:
[ ]( ) ( 1/ 2) ( ) ( 1/ 2) ( 1) ( ) (6)t a a t a a a aEAP t A t P t P t A t A tΔ = + Δ = + + −
_______________
NOTES
1 The target was proposed in 1995 in the context of the National Population Programme 1995-2000 and remains in the National Population Programme 2001-2006. 2 It is estimated that the TFR fell by approximately 0.47 children between 1995 and 2000, corresponding to an annual decrease of 0.09 children. Reaching the population replacement rate in 2005 will entail a smaller annual reduction in the TFR from 2000 onwards. 3 The difference between total growth and natural increase is the net migration balance. Since the natural increase rates exceed those of total growth, it follows that the net migration rate is negative. 4 This concept was originally proposed by Keyfitz (1971) and refers to the number of times by which the present population would be multiplied when stability was eventually reached if the prevailing fertility were to fall immediately to the replacement rate and the age schedule of mortality were to remain at its current level (net reproduction rate equal to 1). The author finds that the closer the current age structure to the eventual stable age composition, the lower the factor by which the present population will multiply. Thus, the more distant the current age structure from stability (i.e., the more youthful it is), the greater the age structure’s “momentum”.
{ }1( ) /B t tr t n B B −= l
307
REFERENCES
Collver, Andrew (1965). Birth rates in Latin America: New estimates of historical trends and fluctuations.,
Berkeley: University of California. CONAPO (2002). Proyecciones de la población de México 2000-2050. Mexico: Consejo Nacional de
Población. Hernández Laos, Enrique (2004). Desarrollo demográfico y económico de México (1970-2000-2030).
Mexico: Consejo Nacional de Población. Horiuchi, Shiro (1988). Assessing effects of mortality reduction on population aging: An analysis of the
elderly female population in Japan. Paper presented at a Seminar on Mortality Transition in East Asia and South Asia, Beijing, 29 August-2 September 1988.
Horiuchi, Shiro and Samuel Preston (1988). Age-specific growth rates: the legacy of past population
dynamics. Demography, vol. 25, No. 3, pp. 429-441. Keyfitz, Nathan (1971). On the momentum of population growth. Demography, vol. 8 , No. 1, pp. 71-80. Partida, Virgilio (2003). Proyecciones de la población económicamente activa de México y de las entidades
federativas, 2000-2050 (Documento Metodológico). México. Partida, Virgilio (2004). Proyecciones de la población de México, de las entidades federativas, de los
municipios y localidades, 2000-2050. México. Pool, Ian (2004). Of demographic dividends, windows of opportunity and development: Age-structure,
population waves and cohort flows. Document submitted to the Seminar on Age-structural Transitions: Demographic Bonus, But Emerging Challenges for Population and Sustainable Development, CICRED, Paris, 23 - 26 February 2004.
Secretaría de Salud de México (2004). Encuesta Nacional de Salud Reproductiva—ENSAR, 2003
(database). United Nations (2002). Completing the fertility transition (ESA/P/WP.172). New York. Zavala, María Eugenia (1989). Dos momentos en la transición demográfica. Demos, México: 6-7.
Related Documents