Demographic Study Public School Enrollments for Princeton Public Schools 25 Valley Road, Princeton, NJ 08540 March 24, 2017 Sundance Associates 117 Greenvale Court Cherry Hill, NJ 08034-1701 Tel 856-755-0174 Fax 856-755-0176 E-mail: [email protected] SUNDANCE ~~~~~~~~~ SUNDANCE ~~~~~~~ ~~~~~~ ~~~~~ ~~ ~~~~~~~~~ Prepared by

Welcome message from author
This document is posted to help you gain knowledge. Please leave a comment to let me know what you think about it! Share it to your friends and learn new things together.
Transcript

Demographic Study Public School Enrollments
for Princeton Public Schools
25 Valley Road, Princeton, NJ 08540
March 24, 2017
Sundance Associates 117 Greenvale Court
Cherry Hill, NJ 08034-1701
Tel 856-755-0174 Fax 856-755-0176
E-mail: [email protected]
SUNDANCE~~~~~~~~~~~~~~~~~~~~
~~~~~~~~~SUNDANCE~~~~~~~~~~~~~~~~~~~~
~~~~~~~~~
Prepared by

Princeton Public School District Demographic Study SUNDANCE~~~~~~~~~~~~~~~~~~~~
~~~~~~~~~SUNDANCE~~~~~~~~~~~~~~~~~~~~
~~~~~~~~~
i 1 2 3 4 5 6 7 8 9 10 11 12 13 14 15 16 17 18 19 20 21 22 23 24 25 26 27 28 29 30 31 32 33 34 35 36
Table of Contents
Page
i
Executive Summary BACKGROUND
Profile: Public School District and Map History: Enrollment and Students per Residential Unit Profile: Municipality Private/Public Schools Comparative Enrollments Technical, Choice & Charter Schools
GENERAL DEMOGRAPHICS
Population Growth: Area, County and State Population Growth: Constituent Municipalities 2010 Population by Age & Gender Pyramid Comparative Populations by Age Group Births: Annual Births by Municipality Births: Annual by School District
NEW HOUSING IMPACT Historic Residential Permitting Enrollment & Permitting Growth Comparisons Future Residential Permitting Public School Children from New Housing 1-5 Years Public School Children from New Housing 6-10 Years New Public School Children by School Assignment
METHODOLOGY Cohort Survival Projections Standard Methodology Presentation of Grade Level Cohort Survival by Year Housing Adjustment for Cranbury Township Births & 8th Grade Enrollments for Cranbury Township
ENROLLMENT PROJECTIONS District Wide Enrollments by Year Comparison of District Wide Enrollment Adjustments Elementary Grade PK-5 Enrollments Middle School Grade 6-8 Enrollments High School Grade 8-12 Enrollments Comparative Enrollments by Grade Level Organization Community Park Elementary Johnson Park Elementary Littlebrook Elementary Riverside Elementary Comparative Elementary Kindergarten Enrollment Time In District: 1, 2, 3 Years; 1 Year by Grade Level Org 1 Year for Elementary Schools APPENDIX: Cohort Survival Worksheets; Princeton & Cranbury Residential Multipliers

Princeton Public School District Demographic Study SUNDANCE~~~~~~~~~~~~~~~~~~~~
~~~~~~~~~SUNDANCE~~~~~~~~~~~~~~~~~~~~
~~~~~~~~~
Executive Summary
The Methodology used in projecting enrollments is the recommended method of the New Jersey Department of Education and is known as “Cohort Survival” or “Grade Level Progression”. The Princeton School District has a student population of 3,671 stu-dents in 6 schools, organized as 4) Grade PK-5 Elementary Schools, 1) Grade 6-8 Middle School, and 1) Grade 9-12 High School. In a 10-year history, enrollment peaked at 3,684 students in 2008, decreased 332 stu-dents over 3 years to 3,339 and has since increase over 5 years to3,671, just 13 students less than the 2008 peak. The number of students per occupied housing unit has steadily decreased from .223 in year 2000 to .189 in year 2015. The single Municipality in the School District is known as Princeton with a borough form of government in Mercer County, NJ. ,that was estab-lished in its current form on January 1, 2013, through the consolidation of the Borough of Princeton and Princeton Township. Private School enrollment runs approximately 16% at the Elementary level, 10% at the Middle School level, and 17% at the High School. Population Trends are such that the population decreased by 1,748 people (5.7%) from 32,230 in 2000 to 28,572 in 2010. However, the area population is estimated at a slight increase to 29,603 in 2015. Age & Gender Pyramids, with population counts in 5-year age group-ings, show Child Bearing Age groups to be comparably small; and that the Pre-school Age group is smaller in size than the 5-9 Age group. Population by Age Group from 2000 to 2010 reveals increases in all categories except Pre-School and Childbearing age. In particular, Childbearing Age lost 1,851 persons between 2000 and 2010. Births in the district have been generally declining since year 2007 with a high of 251 Births, to a year 2013 low of 174 Births. School Year Births, providing a better correlation to enrollments than Calendar Year Births, are used in this projection. Historic Residential permitting averaged 55 units during the period 2005-2012, and jumped to 538 units in 2013 before returning to a more normal 20 units in 2014. Year 2015 permits jumped again to 379 units followed by a more normal 24 units in 2016 evidencing recent volatility. Future Residential permitting includes 664 units at 8 developments in a mix of market rate and affordable housing that are to be occupied in a 5-year period of 2017 to 2021. 212 Public School Children (.280 per unit) will be generated by these 8 developments, of which 186 will attend the public schools. They are add-ed to the standard projection in the appropriate years and at the geo-graphically appropriate schools, and is noted as Modification #1 to a standard projection. An additional 120 Public School Children might be generated in the extended projection period from 2021-25 if the proposed 350-unit Butler Tract housing is brought to fruition. ii
The population in Princeton decreased 1,748 persons from 2000 to 2010.
The Childbearing Age group is compar-atively small and significantly decreas-ing between the 2000 and 2010 census. Live Births on a school year basis have been generally decreasing by 5 fewer birth per year, but increased in 2015.
In the 5-year projection period, 664 units of new housing will generate 186 Princeton Public School students. In the 6-10 year projection, the Butler Tract, with a possible 350 units, could generate an additional 120 public school students.
Princeton Public School District Demographic Study SUNDANCE~~~~~~~~~~~~~~~~~~~~
~~~~~~~~~SUNDANCE~~~~~~~~~~~~~~~~~~~~
~~~~~~~~~
Executive Summary
iii
The District-wide 5-year projection is for ±19 students around an average of 3,814 students.
The Elementary School projection is for a peak of 1,438 students next year de-creasing 67 students to 1,371 in year 2021.
Middle School enrollments continue to increase to a year 2021 level of 839 students, an increase of 77 students over the current enrollment.
Affordable Housing Allocations for Princeton have been recently been (re)ordered by the Courts. The final disposition is unclear, and their impact will be provided in an addendum. The Birth to Kindergarten Survival Ratio used in this projection is the average od the most recent 3 years rather than the standard 6 years. This is Modification #2 and is justified by the strong upward trend of the Ratio. Cranbury Township enrollments were also projected, including an ad-justment for new housing, and their decreasing 8th Grade enrollment is added to the Princeton projection before High School. This is a neces-sary Modification #3. District-wide Enrollment increased by 332 students in the historic pro-jection period to 3,671 students in 2016. In the projection period, the dis-trict enrollment will peak in 2017 at 3,836 students and then decrease to 3,806, that is 135 more students than the end of the historic period. Elementary School Enrollment for Grades K-5 increased 85 students in the historic period ending at a peak of 1,338 students in 2016. Enroll-ments in the projection period, will peak at 1,438 students in 2017 and then decrease to 1,371 at the end of the projection period. Middle School Enrollments, for Grades 6-8, increased by 43 students from a 2012 high of 738 to end the historic period at 762 students. Dur-ing the projection period, enrollments increase by 77 students. To a peri-od high of 839 students. Enrollments continue to increase in the extend-ed projection period. By year 2019, enrollments are exceeding capaci-ties. High School Enrollments for grades 9-12, increased by 204 students to 1,571 at the end of the historic period. During the projected period, en-rollments peak in 2018 at 1,656 and will then decrease to 1,596 in 2021. During the extended projection period enrollments will begin to increase again.
High School enrollments, that in-creased 204 students in the historic period, will peak at 1,656 students in 2018, an additional 85 students, and end the projection period at 1,596 in year 2021.

Princeton Public School District Demographic Study 1 SUNDANCE~~~~~~~~~~~~~~~~~~~~
~~~~~~~~~SUNDANCE~~~~~~~~~~~~~~~~~~~~
~~~~~~~~~
Profile: School District
SOURCE: https://en.wikipedia.org/wiki/Princeton_Public_Schools
Princeton Public Schools is a comprehensive community public school district that serves students in pre-Kindergarten through twelfth grade from Princeton, New Jersey. Students from Cranbury Township attend the district's high school as part of a sending/receiving relationship. The district administration building is at 25 Valley Road in Princeton. As of the 2016-17 school year, the district's six schools had an enroll-ment of 3,671 students. Residents of Princeton University's housing complexes for graduate stu-dents with families, are zoned to the district.
SOURCE: http://www.melissadata.com/lookups/MapSchool.asp
Community Park Elementary 372 Witherspoon St Princeton, NJ 08540-3477 609-806-4230 J Witherspoon Middle School 217 Walnut Ln Princeton, NJ 08540-3484 609-806-4270 Johnson Park Elem. School 285 Rosedale Rd Princeton, NJ 08540-6705 609-806-4240 Littlebrook Elementary School 39 Magnolia Ln Princeton, NJ 08540-4013 609-806-4250 Princeton High School 151 Moore St Princeton, NJ 08540-3312 609-806-4280 Riverside Elementary School 58 Riverside Dr Princeton, NJ 08540-5425 609-806-4260
1. 2. 3. 4. 5. 6.
Princeton Public School District Demographic Study 2 SUNDANCE~~~~~~~~~~~~~~~~~~~~
~~~~~~~~~SUNDANCE~~~~~~~~~~~~~~~~~~~~
~~~~~~~~~
Profile: School District Historic Data
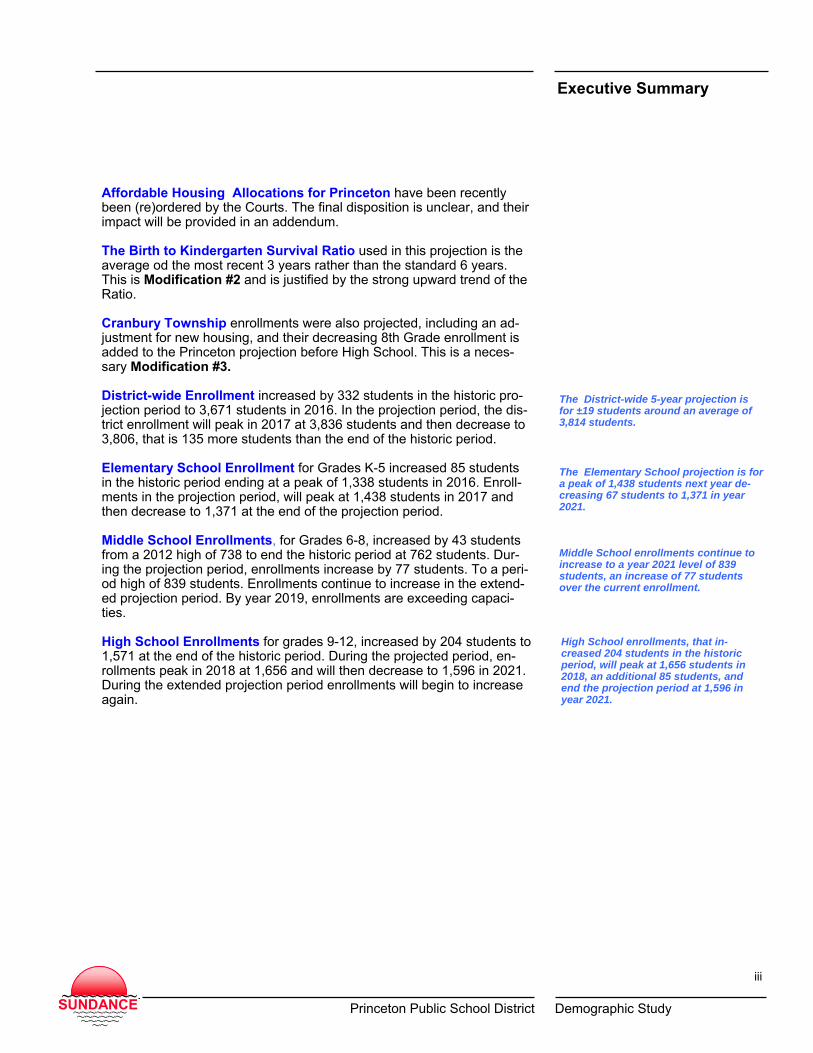
The 10-year history of enrollments exhibits a peak in year 2008, the last year in which NJDOE reported student counts in then separate school districts. The District experienced a decrease over 3 years of 345 students to a low of 3339 students in year 2011. That decrease was followed by a 5-year increase of 332 students to a recent high of 3671 students in Octo-ber of year 2016. This study projects enrollments for a more accurate 5 years (2017-2021) and for a less accurate 6-10 years (2022-2027). The Cohort Survival method of enrollment projection is found to be within ±1% per year accu-racy.
SOURCE: http://www.state.nj.us/education/data/enr/preNJSMART.htm
2016 enrollments have risen to just 13 students less than 2008 peak enrollments.
The number of students per occupied housing unit has steadily decreased from .223 in year 2000 to .189 in year 2015.
Enrollments began to increase after year 2011, the first year of the 6 years of historic enrollments used in the pro-jection.
Used in the projection >

Princeton Public School District Demographic Study 3 SUNDANCE~~~~~~~~~~~~~~~~~~~~
~~~~~~~~~SUNDANCE~~~~~~~~~~~~~~~~~~~~
~~~~~~~~~
Princeton Borough Municipal Demographics
Princeton is a municipality with a borough form of government in Mercer County, NJ that was established in its current form on January 1, 2013, through the consolidation of the Borough of Princeton and Princeton Township. As of the 2010 United States Census, the municipality's population was 28,572, reflecting the former township's population of 16,265, along with the 12,307 in the former borough. Princeton was founded before the American Revolution and is best known as the location of Princeton University, located in the community since 1756. Although its association with the university is primarily what makes Princeton a college town, other important institutions in the area include the Institute for Advanced Study, Westminster Choir College, Princeton Plasma Physics Laboratory, Princeton Theological Seminary, Opinion Research Corporation, Bristol-Myers Squibb, Siemens Corporate Research, SRI International, FMC Corporation, The Robert Wood John-son Foundation, Amrep, Church and Dwight, Berlitz International, and Dow Jones & Company. Princeton is roughly equidistant from New York City and Philadelphia. It is close to many major highways that serve both cities (e.g. Interstate 95 and US Route 1), and receives major television and radio broadcasts from each. It is also close to Trenton, New Jersey's capital city. The governor of New Jersey's official residence has been in Princeton since 1945, when Morven in the borough became the first Governor's mansion. It was later replaced by the larger Drumthwacket, a colonial mansion located in the former Township. Princeton was ranked 15th of the top 100 towns in the United States to Live and Work In by Money Magazine in 2005. Although residents of Princeton (Princetonians) traditionally have a strong community-wide identity, the community had been composed of two separate municipalities: a township and a borough. The central bor-ough was completely surrounded by the township. The Borough seceded from the Township in 1894 in a dispute over school taxes; the two munic-ipalities later formed the Princeton Public Schools, and some other public services were conducted together before they were reunited into a single Princeton in January 2013. The Borough and Township had roughly equal populations. According to the United States Census Bureau, Princeton has a total ar-ea of 18.363 square miles (68.041 km2), including 17.932 square miles (46.444 km2) of land (97.65%) and 0.431 square miles (1.115 km2) of water (2.35%).
SOURCE: https://en.wikipedia.org/wiki/Princeton_New_Jersey
Princeton Public School District Demographic Study 4 SUNDANCE~~~~~~~~~~~~~~~~~~~~
~~~~~~~~~SUNDANCE~~~~~~~~~~~~~~~~~~~~
~~~~~~~~~
Public & Private Schools Comparative Enrollment 2010-14
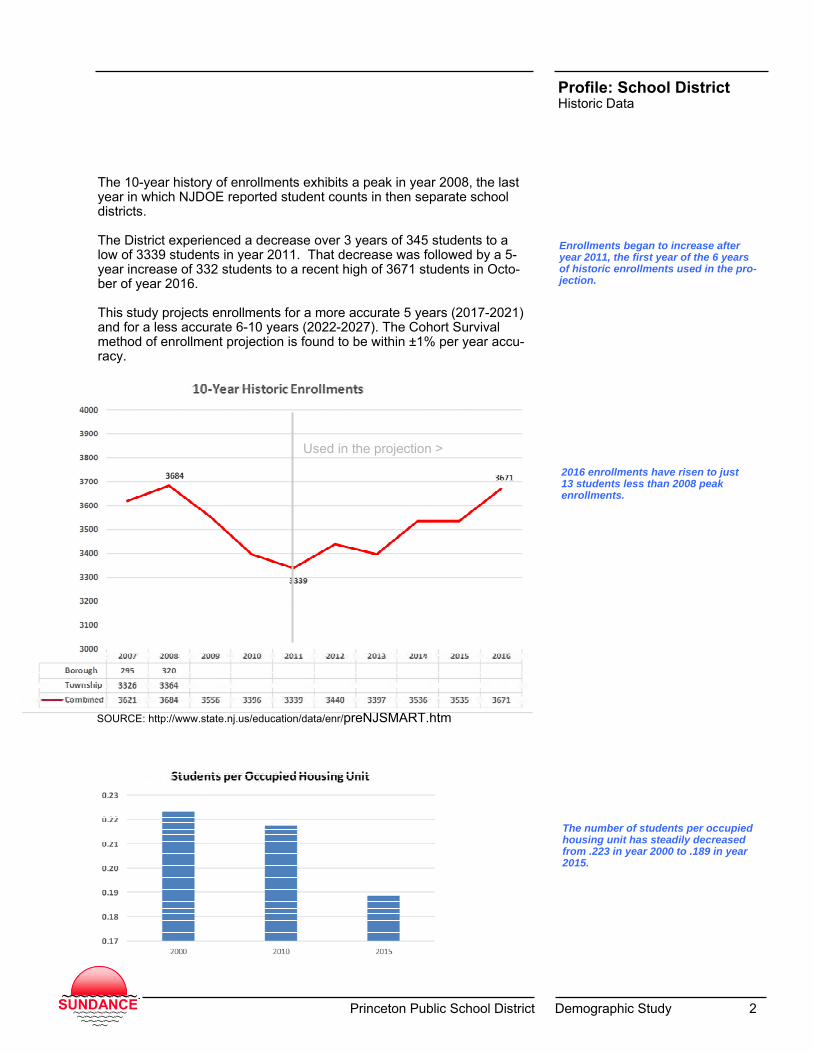
The following data is an average of the period 2010-14 from the Ameri-can Community Survey 5-Year estimates. Kindergarten enrollment was at 85.4%public, approximately 3% less than the county and 0.7% more than the state. Elementary School (Grades 1-4) at 83.5% public is 5% less than the comparable county and about 6% less than the state public school enrollment levels. Middle School (Grade 5-8) at 95.1% public is about 7.3% more than the comparable county and 6% less than the state public school enroll-ments. High School (Grade 9-12) at 83.3% public is about 5.5% less than the comparable county and 1% less than the state public school enroll-ments. With a district-wide enrollment nearing 3,700 students, each 1% is the equivalent of 37 students or one to two classrooms.
SOURCE: American Community Survey 2010-14 found at http://factfinder.census.gov/faces/tableservice
Private schools located in Princeton include The Lewis School of Prince-ton, Princeton Day School, Princeton Friends School, Hun School of Princeton, Ying Hua International School, and Princeton International School of Mathematics and Science (PRISMS). St. Paul Catholic School (pre-school to 8th grade) founded in 1878, is the oldest and only coeducational Catholic school, joining Princeton Acade-my of the Sacred Heart (K-8, all male) and Stuart Country Day School of the Sacred Heart (coed for Pre-K, and all-female K-12), which operate under the supervision of the Roman Catholic Diocese of Trenton. Schools that are outside the town proper but have Princeton mailing ad-dresses include the American Boychoir School in Plainsboro Township, Chapin School, Princeton Junior School in Lawrence Township, the Wal-dorf School of Princeton (New Jersey's only Waldorf school), Princeton Montessori School in Montgomery Township, Eden Institute in West Windsor Township, and Princeton Latin Academy in Hopewell.
The private schools in the School District geographic area are having minimal impact on the enrollments. At-tendance therein is less than the County and State percentages; and no changes in Private School enrollment levels is anticipated.
Princeton Public School District Demographic Study 5 SUNDANCE~~~~~~~~~~~~~~~~~~~~
~~~~~~~~~SUNDANCE~~~~~~~~~~~~~~~~~~~~
~~~~~~~~~
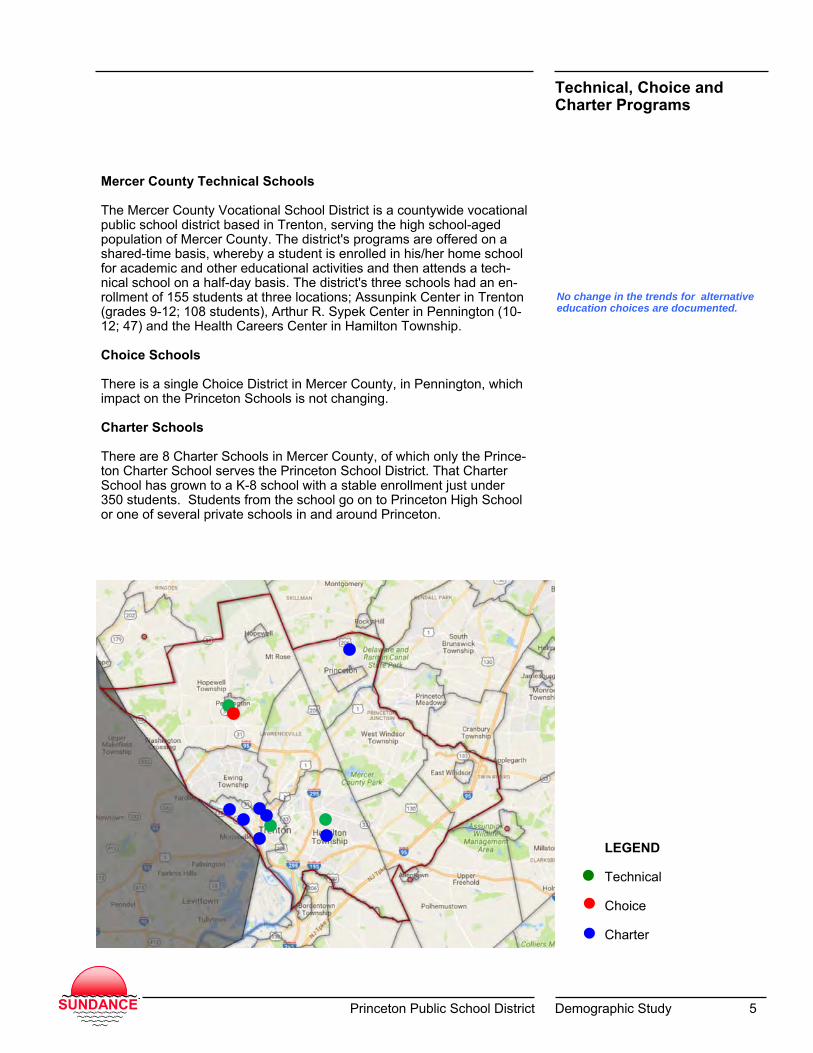
Technical, Choice and Charter Programs
Mercer County Technical Schools The Mercer County Vocational School District is a countywide vocational public school district based in Trenton, serving the high school-aged population of Mercer County. The district's programs are offered on a shared-time basis, whereby a student is enrolled in his/her home school for academic and other educational activities and then attends a tech-nical school on a half-day basis. The district's three schools had an en-rollment of 155 students at three locations; Assunpink Center in Trenton (grades 9-12; 108 students), Arthur R. Sypek Center in Pennington (10-12; 47) and the Health Careers Center in Hamilton Township. Choice Schools There is a single Choice District in Mercer County, in Pennington, which impact on the Princeton Schools is not changing. Charter Schools There are 8 Charter Schools in Mercer County, of which only the Prince-ton Charter School serves the Princeton School District. That Charter School has grown to a K-8 school with a stable enrollment just under 350 students. Students from the school go on to Princeton High School or one of several private schools in and around Princeton.
LEGEND Technical Choice Charter
No change in the trends for alternative education choices are documented.

Princeton Public School District Demographic Study 6 SUNDANCE~~~~~~~~~~~~~~~~~~~~
~~~~~~~~~SUNDANCE~~~~~~~~~~~~~~~~~~~~
~~~~~~~~~
Population Growth Comparative SD Area, County and State
The school district had a peak population of 30,230 in year 2000 and decrease 1,658 persons by 2010. The district population was 28,572 persons, as of the US Census 2010, and is estimated to have grown to 29,603 in 2015.
The district population was 28,572 persons as of the US Census 2010.
Princeton Public School District Demographic Study 7 SUNDANCE~~~~~~~~~~~~~~~~~~~~
~~~~~~~~~SUNDANCE~~~~~~~~~~~~~~~~~~~~
~~~~~~~~~
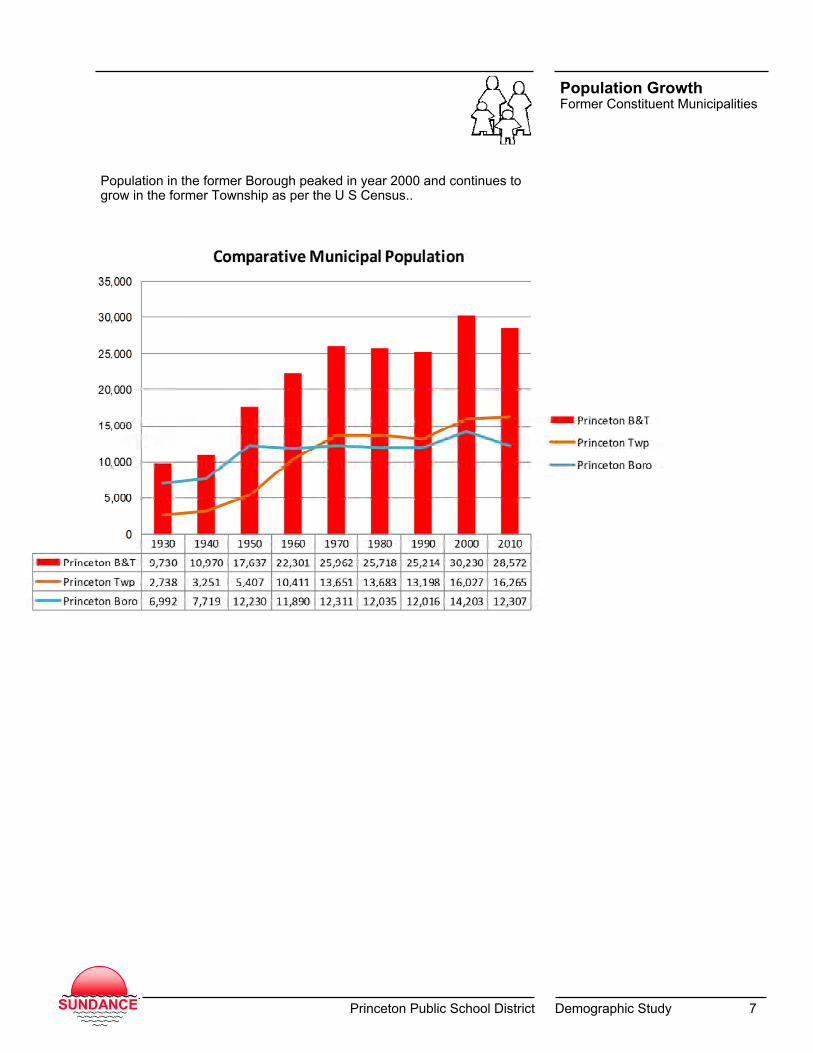
Population Growth Former Constituent Municipalities
Population in the former Borough peaked in year 2000 and continues to grow in the former Township as per the U S Census..

Princeton Public School District Demographic Study 8 SUNDANCE~~~~~~~~~~~~~~~~~~~~
~~~~~~~~~SUNDANCE~~~~~~~~~~~~~~~~~~~~
~~~~~~~~~
2010 Population Age & Gender Pyramid
The Age & Gender Pyramid for the School District (combined municipali-ties) illustrates population counts in 5 year groups with Males on the left and Females on the right, as of the 2010 U S Census. Of particular interest in school demography is the size of the prime childbearing age groups between 20 and 39 years of age. The female counts in these groups are significantly reduced. except for the 20-24 age group that is heavily influenced by Graduate Students at the higher education institutions. Of very real importance is that the 10-14 age group is smaller than the 15-19 age group and the 5-9 age group is smaller than the 15-19, etc. Under 5 years is the smallest of all….indicating smaller and smaller future enrollments.
The under 5 age group was 68 persons smaller than the 5-9 age group.
Smaller Future Enrollments
Aging In Place
Graduate ˄ and Undergraduate Students ˄

Princeton Public School District Demographic Study 9 SUNDANCE~~~~~~~~~~~~~~~~~~~~
~~~~~~~~~SUNDANCE~~~~~~~~~~~~~~~~~~~~
~~~~~~~~~
Comparative Population by Age Groups
Population by Age Group from 2000 to 2010 reveals changes in all cate-gories. Pre-School Age (0-4) decreased by 204 persons between 2000 and 2010 to original 1990 levels. School Age (5-17) increased by 64 persons between 2000 and 2010, following a much larger 1,292 person increase 10 years earlier. Childbearing Age (18-39) decreased by 1,851 between 2000 and 2010 following a 1,794 person increase in the prior decade, providing a poten-tial for fewer births than in the past. Middle Age (40-64) increased by 102 between 2000 and 2010, an indi-cation that the population is aging in place. Seniors (65+) increased by 231 persons between 2000 and 2010.
Over the 10-year period, 2000-2010, Pre-School counts decreased and School Age populations increased, but only slightly.

Princeton Public School District Demographic Study 10 SUNDANCE~~~~~~~~~~~~~~~~~~~~
~~~~~~~~~SUNDANCE~~~~~~~~~~~~~~~~~~~~
~~~~~~~~~
Municipal Annual Births
Live Births in each contributing municipality are provided below. This data relative to assignment of Township or Borough may be inaccu-rate, due to confusing geographic assignments, while the combined total is accurate.
Combined Live Births in the area municipalities have been generally de-clining since year 2007 with a high of 251 Births, and a year 2013 low of 174 Births. The 6-year trend, is perhaps more indicative of recent levels of birth. The 6-year trend is for about a 6 fewer births every year.
Princeton Public School District Demographic Study 11 SUNDANCE~~~~~~~~~~~~~~~~~~~~
~~~~~~~~~SUNDANCE~~~~~~~~~~~~~~~~~~~~
~~~~~~~~~
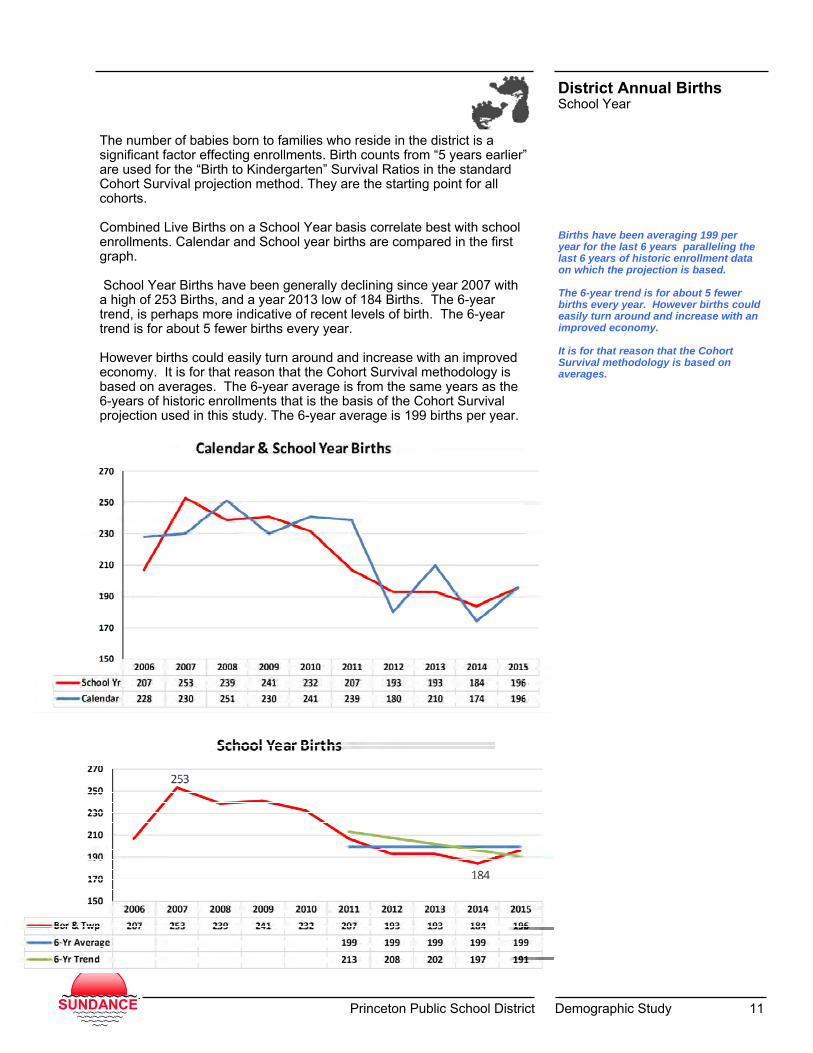
District Annual Births School Year
Births have been averaging 199 per year for the last 6 years paralleling the last 6 years of historic enrollment data on which the projection is based. The 6-year trend is for about 5 fewer births every year. However births could easily turn around and increase with an improved economy. It is for that reason that the Cohort Survival methodology is based on averages.
The number of babies born to families who reside in the district is a significant factor effecting enrollments. Birth counts from “5 years earlier” are used for the “Birth to Kindergarten” Survival Ratios in the standard Cohort Survival projection method. They are the starting point for all cohorts. Combined Live Births on a School Year basis correlate best with school enrollments. Calendar and School year births are compared in the first graph. School Year Births have been generally declining since year 2007 with a high of 253 Births, and a year 2013 low of 184 Births. The 6-year trend, is perhaps more indicative of recent levels of birth. The 6-year trend is for about 5 fewer births every year. However births could easily turn around and increase with an improved economy. It is for that reason that the Cohort Survival methodology is based on averages. The 6-year average is from the same years as the 6-years of historic enrollments that is the basis of the Cohort Survival projection used in this study. The 6-year average is 199 births per year.

Princeton Public School District Demographic Study 12 SUNDANCE~~~~~~~~~~~~~~~~~~~~
~~~~~~~~~SUNDANCE~~~~~~~~~~~~~~~~~~~~
~~~~~~~~~
Residential Permitting by Municipality & Combined
Residential Permitting is significantly increased on a project basis in the recent past with comparably large developments permitted in 2013 and in 2015. More importantly, there are recently approved and constructed units that will impact the future enrollments.
It is of note that the average annual permitting level from 2005-12 is 55 units. Acknowledging the delay between permitting and construction and occu-pancy schedules, the impact of new students from the high 2015 level has just begun to impact the enrollments. Owner/Developers were con-sulted and provided current occupancy statistics for the relevant projects. As a result, occupied units as of September 1, 2016 are not included in the projection. However, the impact of all future units are included as per the build-out and occupancy schedules on page 14. Before moving on to the impact of new housing on enrollments, analysis of the correlation of new housing to enrollments is provided on the next page.

Princeton Public School District Demographic Study 13 SUNDANCE~~~~~~~~~~~~~~~~~~~~
~~~~~~~~~SUNDANCE~~~~~~~~~~~~~~~~~~~~
~~~~~~~~~
Residential Permitting Impact on Enrollments
The above chart illustrates the relationship between the issuance of Building Permits and the change in enroll-ment one year later. For example in 2013, 538 Residential Building Permits were issued and one year later, that is in school year 2014-15, the District experienced an increase of 101 students. The bottom chart illustrates the relationship between the issuance of Building Permits and the change from the year 2003 enrollment of 3,553 students. For example in 2013, 538 Residential Building Permits were issued and one year later, that is in school year 2014-15, the District was only 113 students less than base year 2003, where it had been 214 students less in the prior year. There is a clear relationship between building permits and enrollment a year or two later. Both charts indicate that there is generally decreasing enrollments due to aging in place when Building Permits are below 100 units annually.

Princeton Public School District Demographic Study 14 SUNDANCE~~~~~~~~~~~~~~~~~~~~
~~~~~~~~~SUNDANCE~~~~~~~~~~~~~~~~~~~~
~~~~~~~~~
Residential Permitting
Nearly all (95%) of the 127 units at Merwick Ph 1 were occupied at the start of the 2016-17 school and accounts for some of the current in-crease in enrollment. In 2017 an additional 506 units are to be occupied by the start of the next school year. The 8 unit IAS project is occupied in 2019. No other developments are planned until 2020-21 when the Princeton Housing Corporation has plans for 150 units of mixed housing; and 2022-23 when the University may be developing the 350-unit (est.) Butler Tract.
664 residential units, primarily multi-family, will be developed in the next 5 years. Schedules for occupancy were devel-oped in consultation with the Owner/Developer.

Princeton Public School District Demographic Study 15 SUNDANCE~~~~~~~~~~~~~~~~~~~~
~~~~~~~~~SUNDANCE~~~~~~~~~~~~~~~~~~~~
~~~~~~~~~
Public School Age Children from New Housing
139 Public School Age Children (of 212 SAC) will be generated for 2017 by the 506 new residential units, and an additional 47 toward the end of the 5-year projection, for a total of 186 new students.
The units to be occupied in a given year are multiplied by a Unit Type and Bed-room count Multiplier from the Rutgers University study. 664 units will generate 186 public school children over the 5-year projection period.
SOURCE: The source for the Students per Unit Type Multipliers is Who Lives in New Jersey Housing, a Quick Guide to Residential Demographic Multipliers by the Center for Urban Policy Research of the Edward J. Bloustein School of Planning and Public Policy at Rut-gers, The State University of New Jersey, as developed from the 2000 U. S. Census.
Princeton Public School District Demographic Study 16 SUNDANCE~~~~~~~~~~~~~~~~~~~~
~~~~~~~~~SUNDANCE~~~~~~~~~~~~~~~~~~~~
~~~~~~~~~
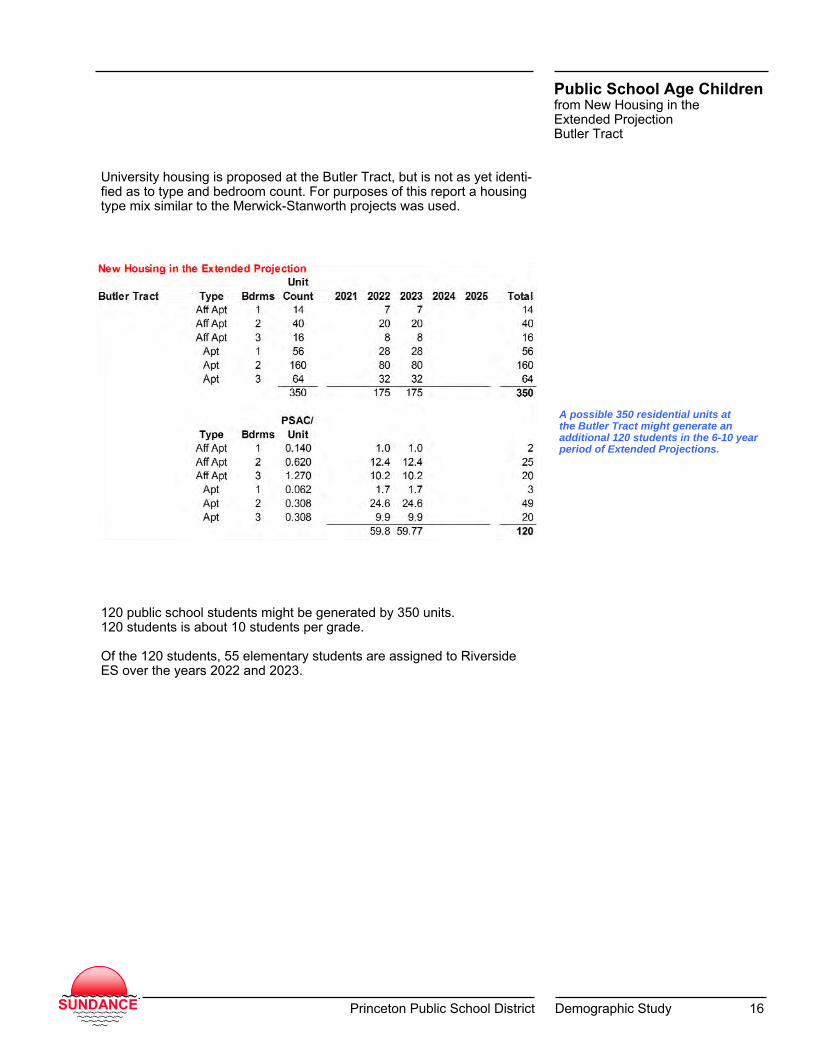
Public School Age Children from New Housing in the Extended Projection Butler Tract
120 public school students might be generated by 350 units. 120 students is about 10 students per grade. Of the 120 students, 55 elementary students are assigned to Riverside ES over the years 2022 and 2023.
A possible 350 residential units at the Butler Tract might generate an additional 120 students in the 6-10 year period of Extended Projections.
University housing is proposed at the Butler Tract, but is not as yet identi-fied as to type and bedroom count. For purposes of this report a housing type mix similar to the Merwick-Stanworth projects was used.

Princeton Public School District Demographic Study 17 SUNDANCE~~~~~~~~~~~~~~~~~~~~
~~~~~~~~~SUNDANCE~~~~~~~~~~~~~~~~~~~~
~~~~~~~~~
Public School Age Children Geographic Assignment to an Elementary School
186 + 120 (5 Yr. Projection plus 6-10 Year Extended projection) students from new housing will be distributed first across the District-wide projec-tion and then to the individual Elementary, Middle and High Schools. 31 new students are within the Littlebrook attendance area, 14 are at the elementary level. 58 new students are within the Johnson Park attendance area, 27 are at the elementary level. 94 new students are within the Community Park attendance area, 43 are at the elementary level. 4 + 120 (projection + extended) new students are within the Riverside attendance area, 2 + 55 are at the elementary level. 43 + 28 new students are added at the Middle School. 57 + 37 new students are added at the High School level.

Princeton Public School District Demographic Study 18 SUNDANCE~~~~~~~~~~~~~~~~~~~~
~~~~~~~~~SUNDANCE~~~~~~~~~~~~~~~~~~~~
~~~~~~~~~
Cohort Survival Methodology An Introduction
Cohort Survival is the name given to the method of projecting enrollments which is recommended by the New Jersey Department of Education. The most important terms, concepts and methodology are illustrated herein. Cohort Survival projections are based on historic enrollment and birth data in the school district and incorporate six years of demographic data. They are considered very reliable where trends are expected to continue, without significant change in housing or curriculum. Cohort is the name given to the common groups of children originally born in a given year and progressing, together, through the school system, one grade level to the next. Survival Ratios refer to the number of students from one year and grade level who “survive to” or enter the next grade level the following year. For example, in the sample partial table in the side bar, historic enrollments show 200 students in 1st Grade in year 2015-16, following a 202 student Kindergarten in year 2014-15. This yields a Kindergarten to First Grade Survival Ratio of .990 (or 200 ÷ 200). Another expression of the Survival Ratio would be that 99% of the Kindergarten students “survived” to 1st Grade. Similar calculations are made for “survival” from Births Five Years Earlier to Kindergarten, and for each and every grade level transition in each and every year of historical enrollments which are used. In general, six years of historic data will yield five Survival Ratios for each grade level change, Birth to K, K to 1, Grade 1 to Grade 2, etc. The Average Survival Ratio is then calculated for each grade level change. In the side-bar example 1.034 is the 6-year average Kindergar-ten to Grade 1 ratio and 1.067 is the 6-year Grade 1 to Grade 2 Survival Ratio. The projections use the current school year 2016-17 enrollments, at the bottom of the Historic chart, as a base year. The Averaged Cohort Survival Ratios are applied to those base year enrollments and to the actual and estimated births, and projected into the next year, one grade level higher. In the side-bar example 184 Kindergarten students in 2017-18 survive at a rate of 1.034 as a 2018-19 First Grade of 191students. This similar projection is made across all grade levels for a 5-year period. Finally, the individual grade level enrollment projections are summed across each year to determine district-wide enrollments in that year.
Enrollment projections have been made using the Cohort Survival method.
Historic Enrollments
Princeton Public
Schools
Projected Enrollments

Princeton Public School District Demographic Study 19 SUNDANCE~~~~~~~~~~~~~~~~~~~~
~~~~~~~~~SUNDANCE~~~~~~~~~~~~~~~~~~~~
~~~~~~~~~
Cohort Survival Ratios
The B:K Cohort Survival Ratio is one of 3 adjustments to standard methods that is made in the report. It is based on 3 years of history rather than the standard 6 years due to the significant upward trend. Green bars indicate positive growth (more than 100% survive) and red bars indicate decreases (less than 100% survival) in any given year.
Princeton Public
Schools
Under current trends, the 2012-13 entering Kindergarten class of 180 students will survive as a graduating Grade 12 class of 418 students in 2025.

Princeton Public School District Demographic Study 20 SUNDANCE~~~~~~~~~~~~~~~~~~~~
~~~~~~~~~SUNDANCE~~~~~~~~~~~~~~~~~~~~
~~~~~~~~~
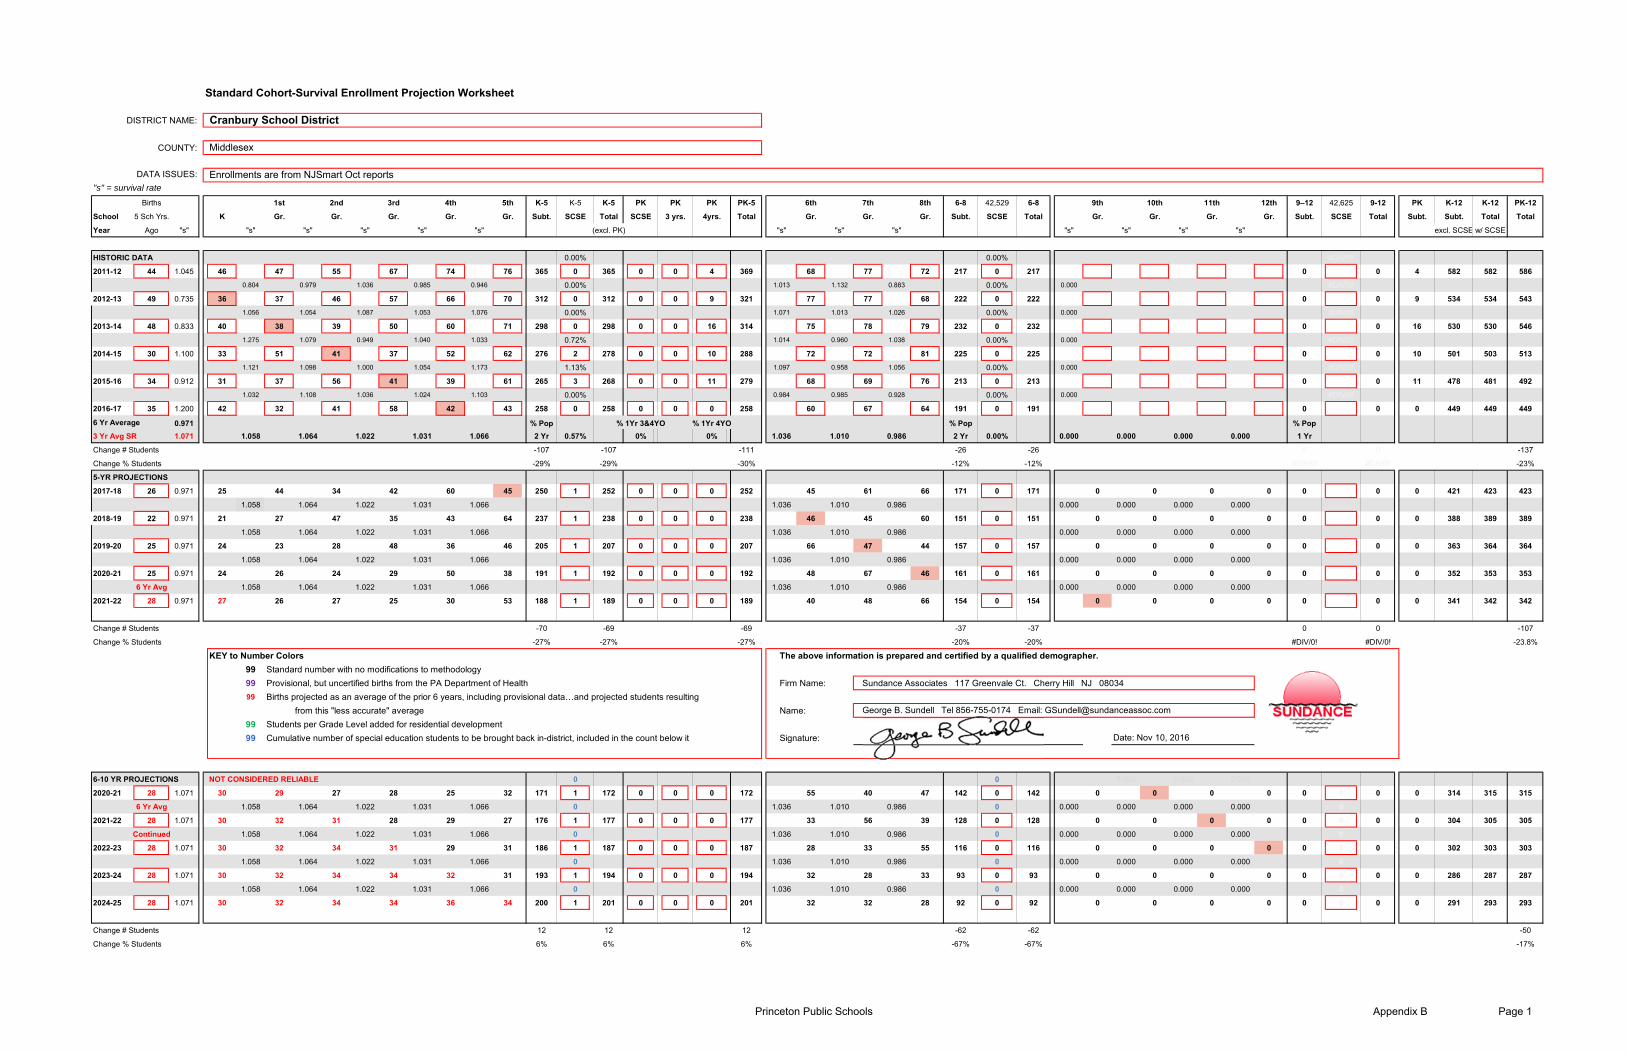
Cranbury Township New Housing & Students
Cranbury Township maintains a Send-Receive relationship with Prince-ton Schools, and send their Grade 9-12 students to Princeton High School. In order to include those students in the analysis, a separate Cohort Survival enrollment projection is made for their Kindergarten to Grade 8 students, and it, like Princeton is adjusted for new housing.
Four residential developments of 176 multi-family units will generate 42 public school children in 2017 and 2018.
Princeton Public School District Demographic Study 21 SUNDANCE~~~~~~~~~~~~~~~~~~~~
~~~~~~~~~SUNDANCE~~~~~~~~~~~~~~~~~~~~
~~~~~~~~~
Cranbury Township 8th Grade to Princeton
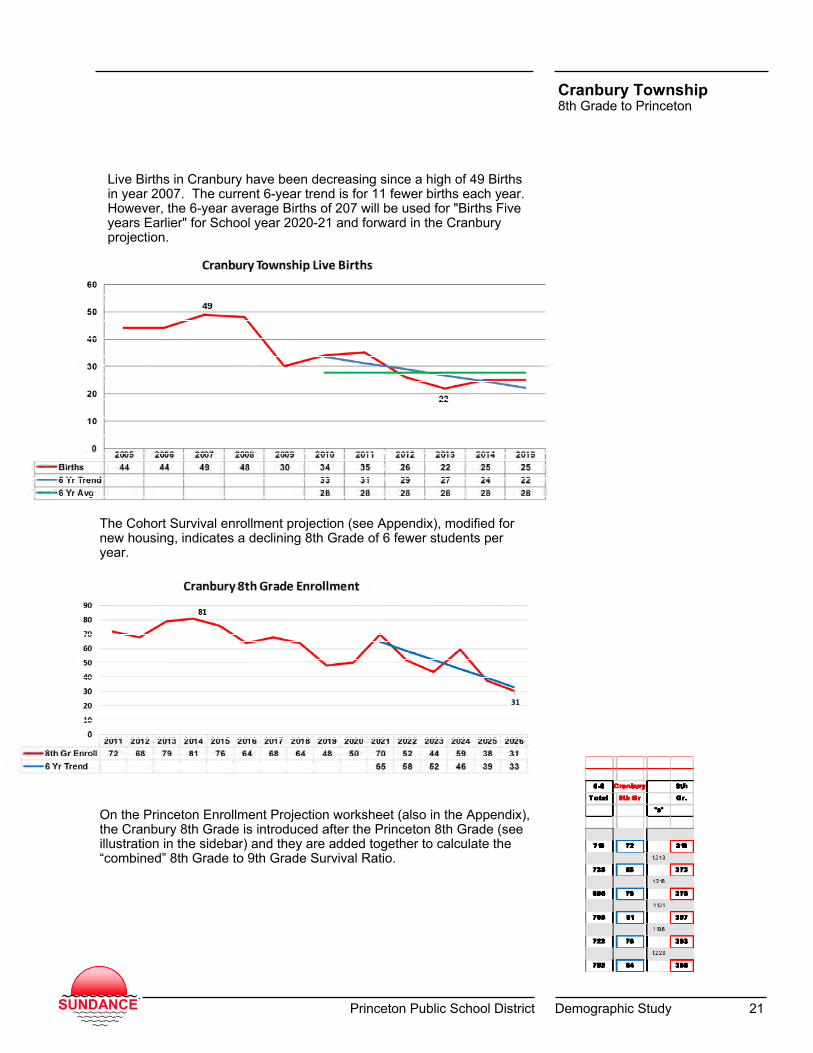
Live Births in Cranbury have been decreasing since a high of 49 Births in year 2007. The current 6-year trend is for 11 fewer births each year. However, the 6-year average Births of 207 will be used for "Births Five years Earlier" for School year 2020-21 and forward in the Cranbury projection.
The Cohort Survival enrollment projection (see Appendix), modified for new housing, indicates a declining 8th Grade of 6 fewer students per year.
On the Princeton Enrollment Projection worksheet (also in the Appendix), the Cranbury 8th Grade is introduced after the Princeton 8th Grade (see illustration in the sidebar) and they are added together to calculate the “combined” 8th Grade to 9th Grade Survival Ratio.
Princeton Public School District Demographic Study 22 SUNDANCE~~~~~~~~~~~~~~~~~~~~
~~~~~~~~~SUNDANCE~~~~~~~~~~~~~~~~~~~~
~~~~~~~~~
District-Wide Enrollment
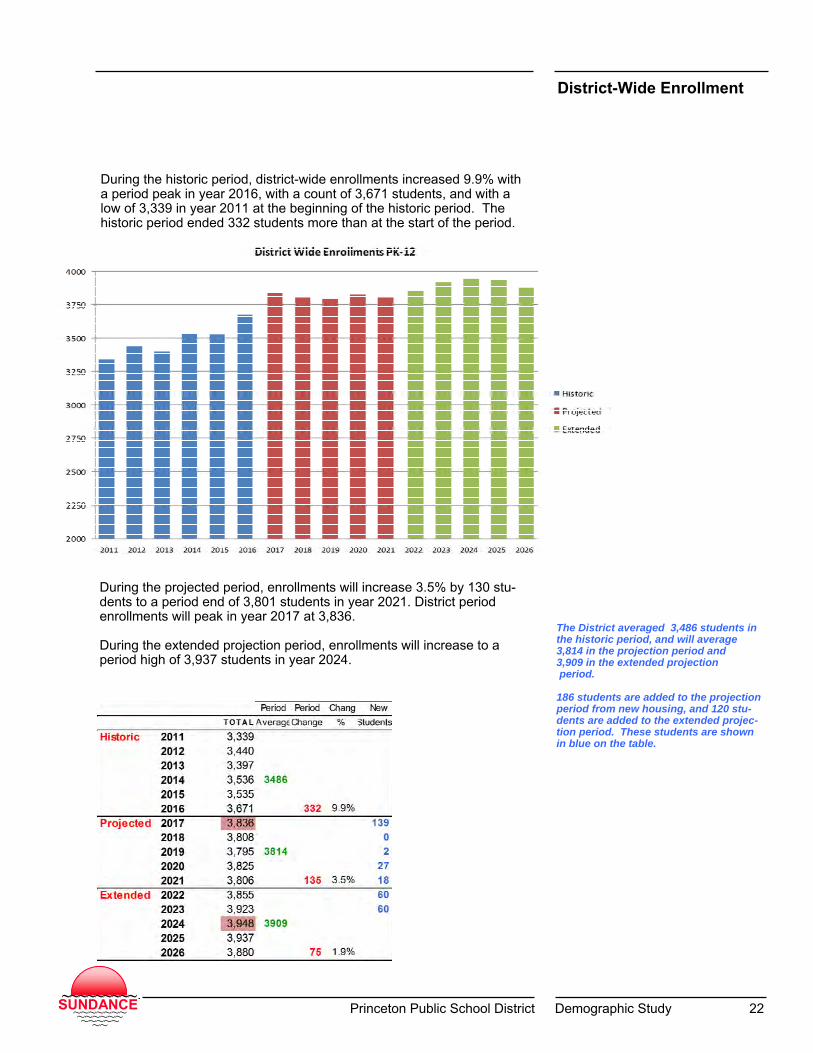
During the projected period, enrollments will increase 3.5% by 130 stu-dents to a period end of 3,801 students in year 2021. District period enrollments will peak in year 2017 at 3,836. During the extended projection period, enrollments will increase to a period high of 3,937 students in year 2024.
During the historic period, district-wide enrollments increased 9.9% with a period peak in year 2016, with a count of 3,671 students, and with a low of 3,339 in year 2011 at the beginning of the historic period. The historic period ended 332 students more than at the start of the period.
The District averaged 3,486 students in the historic period, and will average 3,814 in the projection period and 3,909 in the extended projection period. 186 students are added to the projection period from new housing, and 120 stu-dents are added to the extended projec-tion period. These students are shown in blue on the table.

Princeton Public School District Demographic Study 23 SUNDANCE~~~~~~~~~~~~~~~~~~~~
~~~~~~~~~SUNDANCE~~~~~~~~~~~~~~~~~~~~
~~~~~~~~~
District-Wide Enrollment Comparisons of the 3 Adjustments to the Standard Method
This graph and table document the impact of the two most significant modifications to the standard projection, the impact of new housing and the use of a 3-year Birth to Kindergarten Survival Ratio. The blue line on the graph indicate the stand alone levels of enrollments 1) if there were not 664 units of new housing, and the green line indi-cates a fully standard projection without 1) new housing or 2) if the Birth to Kindergarten Survival Ratio was not adjusted from a 6-year average to a 3-year average.
Projection Period

Princeton Public School District Demographic Study 24 SUNDANCE~~~~~~~~~~~~~~~~~~~~
~~~~~~~~~SUNDANCE~~~~~~~~~~~~~~~~~~~~
~~~~~~~~~
Elementary Schools PreKindergarten-Grade 5
Elementary level students are educated in four Grade K to 5 Elementary Schools. Grades K to 5 enrollments increased from a 2011 count of 1,253 to a high of 1,338 students in the historic period, with growth of 85 students. In the projection period, K-Grade 5 enrollments increase to a year 2017 high and then decrease to 1,371 students at the end of the projection period in year 2021, and to 1,363 at the end of the extended projection period...all higher than the historic period.
A year-to-year breakdown by grade level is as follows;
Increased Elementary level enrollments averaged 1,279 students in the historic period, but will average 1,401 students in the projection period, and will average 1,372 students in the extended projec-tion period. All enrollments are below the FES (Facilities Efficiency Standard) and DP (District Practice) Capacities. 86 students from new housing are added in the projection period and 55 are added in the extended projection at the elemen-tary level.

Princeton Public School District Demographic Study 25 SUNDANCE~~~~~~~~~~~~~~~~~~~~
~~~~~~~~~SUNDANCE~~~~~~~~~~~~~~~~~~~~
~~~~~~~~~
Middle School Grades 6-8
Middle School enrollments which averaged 723 students in the historic period, will increase to an average of 783 students in the projection period, before increasing to an average of 834 students in the extended projection period. Enrollments exceed Capacities after year 2018. 43 students from new housing are added in the projection period and 28 are added in the extended projection at the middle school level.
Middle school students attend one school serving Grades 6, 7 and 8. During the historic period, middle school enrollments fluctuated ending the period at 762 students, an increase of 43 students.
During the projected period, enrollments increase by an additional 77 students to 839. During the extended projection period, enrollments peak at 884 students before decreasing to 782 students in year 2026, 5 stu-dents more than the current enrollment. A year-to-year breakdown by grade level is as follows;

Princeton Public School District Demographic Study 26 SUNDANCE~~~~~~~~~~~~~~~~~~~~
~~~~~~~~~SUNDANCE~~~~~~~~~~~~~~~~~~~~
~~~~~~~~~
High School Enrollment Grade 9-12
High School students are educated in one school for Grades 9 to 12. During the historic period, high school enrollments increased, from a low of 1,367 to 1,571 students, ending the period with a gain of 204 students.
During the projected period, enrollments will peak at 1,656 students in 2018-19, before decreasing to 1,596 at the end of the period. During the extended projection period enrollments will increase by 140 students.to 1,774 students in year 2025, before decreasing to 1,735 in year 2026. A year-to-year breakdown by grade level is as follows;
Increasing High School enrollments which averaged 1,485 students in the historic period, will average 1,630 students in the projec-tion period, before increasing to an average of 1,703 students in the extended projection period. Enrollments exceed Capacities in all future years 57 students from new housing are added in the projection period and 37 are added in the extended projec-tion at the high school level.

Princeton Public School District Demographic Study 27 SUNDANCE~~~~~~~~~~~~~~~~~~~~
~~~~~~~~~SUNDANCE~~~~~~~~~~~~~~~~~~~~
~~~~~~~~~
Comparative Enrollments by Grade Level Organization
Grade PK-5 enrollments will peak at 1,438 students in year 2017 before stabilizing. Grades 6-8 enrollments will peak at 884 students in 2022 at the begin-ning of the extended projection. Grades 9-12 enrollments will peak at 1,656 in 2018 during the 5-year projection period and at 1,774 student in 2025 in the less accurate extended projection period..
PK-Gr 5 enrollments peak in 2017. Gr 6-8 enrollments will peak in 2022-23. Gr 9-12 enrollments will peak in 2018 and again in 2025.
Historic Projected
1,774

Princeton Public School District Demographic Study 28 SUNDANCE~~~~~~~~~~~~~~~~~~~~
~~~~~~~~~SUNDANCE~~~~~~~~~~~~~~~~~~~~
~~~~~~~~~
Elementary Enrollments Community Park ES
Historic K to Grade 5 enrollments at the Community Park School have been recently increasing. The historic period increased to a peak of 367 in year 2016, a gain of 62 students. The projected period increases to a peak 414 in year 2017 before de-creasing in both the projection and extended periods.
A year-to-year breakdown by grade level is as follows;
Berkeley enrollments averaged 318 stu-dents in the historic period, will average 396 students in the projection period, and will average 336 students in the extended projection period. 43 students from new housing are added in the projection period. Enrollments exceed FES Capacity in 2017 and 2018.
Princeton Public School District Demographic Study 29 SUNDANCE~~~~~~~~~~~~~~~~~~~~
~~~~~~~~~SUNDANCE~~~~~~~~~~~~~~~~~~~~
~~~~~~~~~
Elementary Enrollments Johnson Park ES
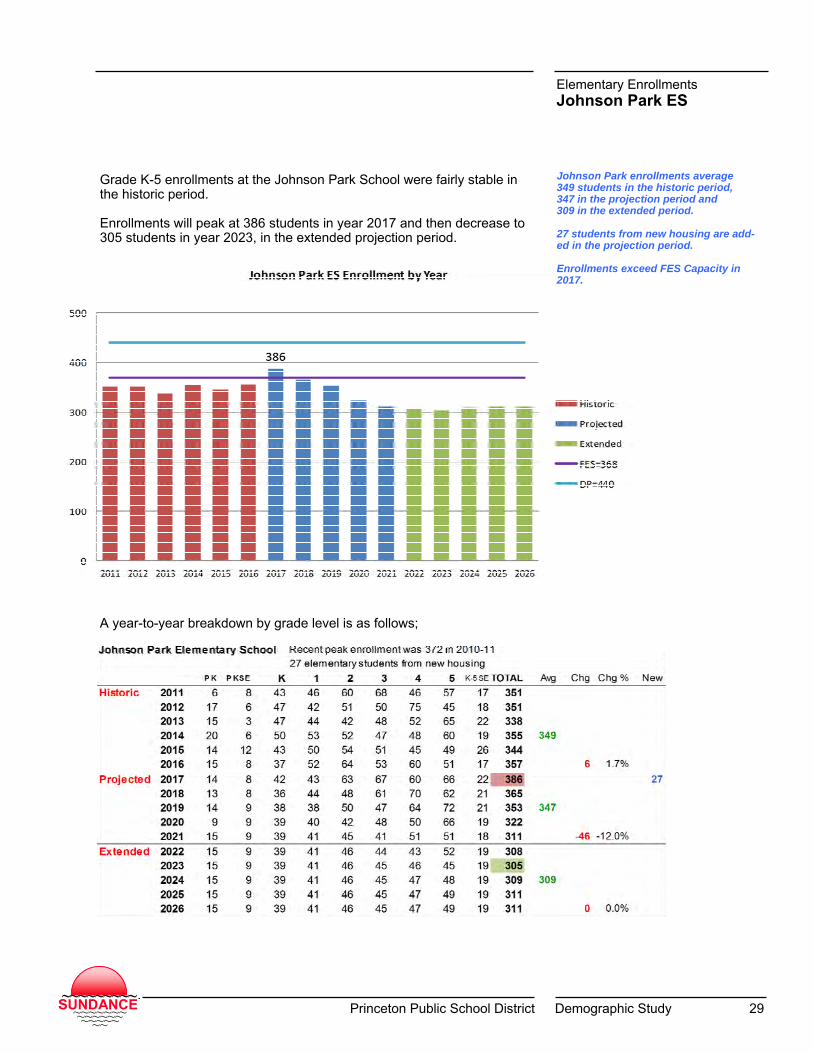
Grade K-5 enrollments at the Johnson Park School were fairly stable in the historic period. Enrollments will peak at 386 students in year 2017 and then decrease to 305 students in year 2023, in the extended projection period.
Johnson Park enrollments average 349 students in the historic period, 347 in the projection period and 309 in the extended period. 27 students from new housing are add-ed in the projection period. Enrollments exceed FES Capacity in 2017.
A year-to-year breakdown by grade level is as follows;
Princeton Public School District Demographic Study 30 SUNDANCE~~~~~~~~~~~~~~~~~~~~
~~~~~~~~~SUNDANCE~~~~~~~~~~~~~~~~~~~~
~~~~~~~~~
Elementary Enrollments Littlebrook ES
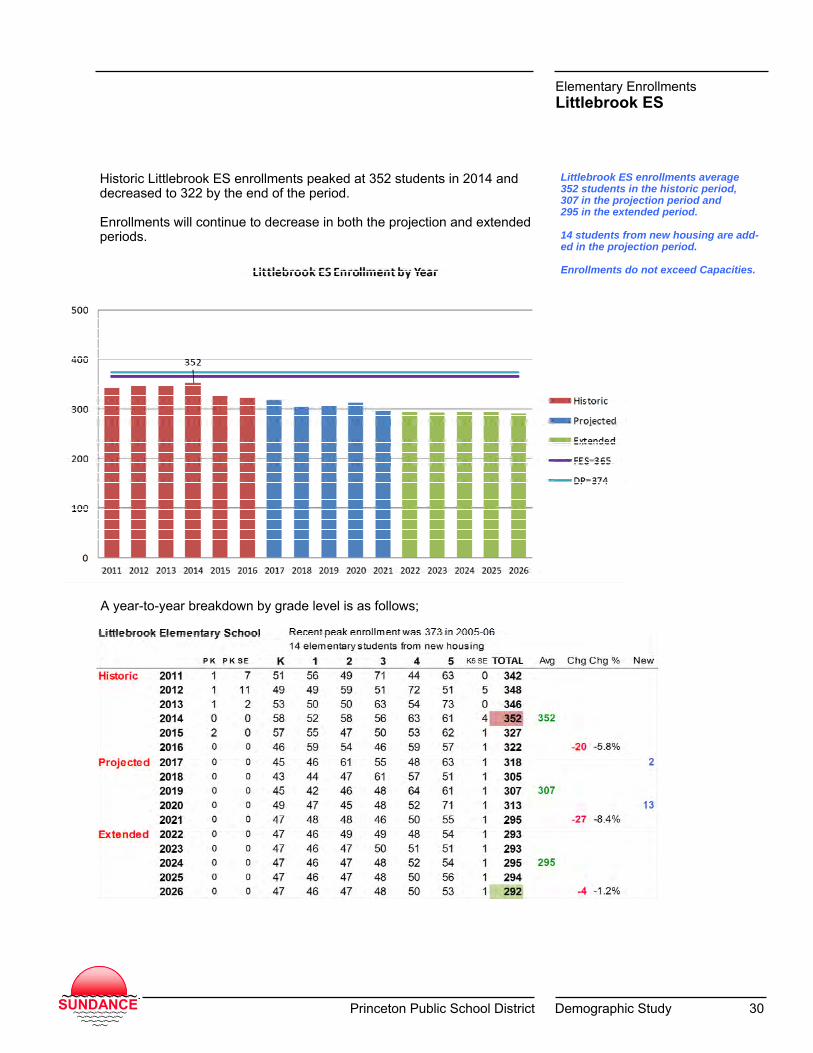
Historic Littlebrook ES enrollments peaked at 352 students in 2014 and decreased to 322 by the end of the period. Enrollments will continue to decrease in both the projection and extended periods.
A year-to-year breakdown by grade level is as follows;
Littlebrook ES enrollments average 352 students in the historic period, 307 in the projection period and 295 in the extended period. 14 students from new housing are add-ed in the projection period. Enrollments do not exceed Capacities.
Princeton Public School District Demographic Study 31 SUNDANCE~~~~~~~~~~~~~~~~~~~~
~~~~~~~~~SUNDANCE~~~~~~~~~~~~~~~~~~~~
~~~~~~~~~
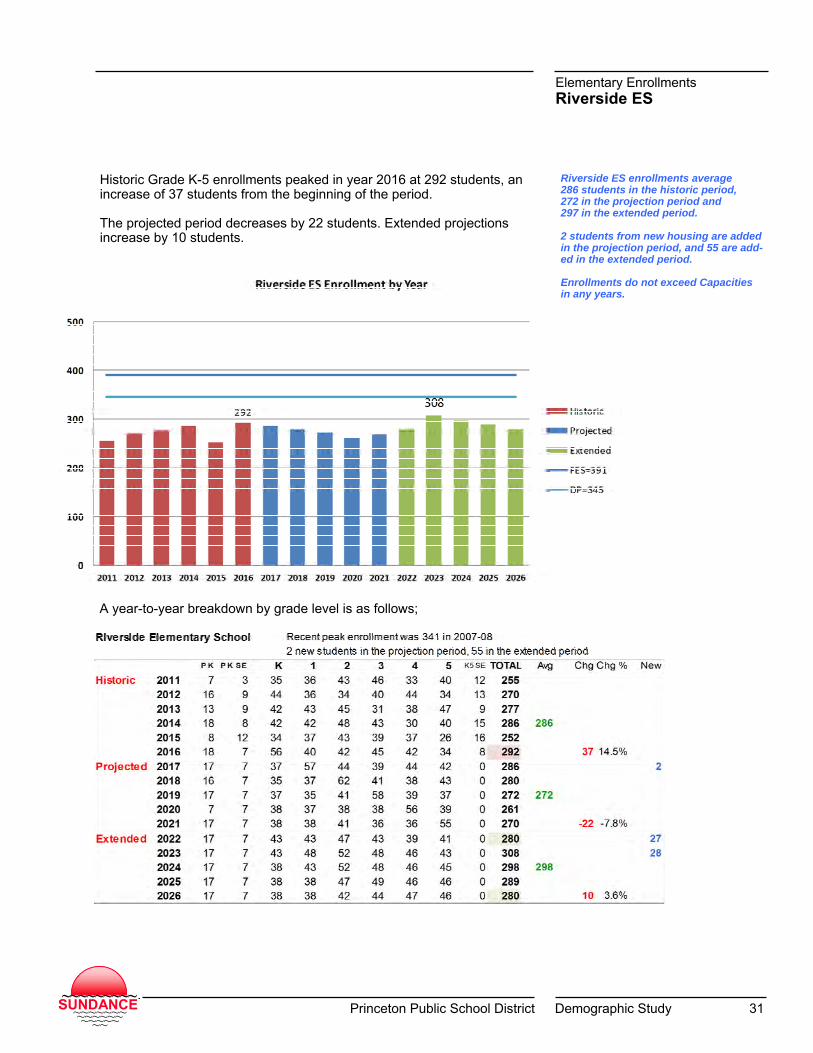
Elementary Enrollments Riverside ES
Historic Grade K-5 enrollments peaked in year 2016 at 292 students, an increase of 37 students from the beginning of the period. The projected period decreases by 22 students. Extended projections increase by 10 students.
A year-to-year breakdown by grade level is as follows;
Riverside ES enrollments average 286 students in the historic period, 272 in the projection period and 297 in the extended period. 2 students from new housing are added in the projection period, and 55 are add-ed in the extended period. Enrollments do not exceed Capacities in any years.
Princeton Public School District Demographic Study 32 SUNDANCE~~~~~~~~~~~~~~~~~~~~
~~~~~~~~~SUNDANCE~~~~~~~~~~~~~~~~~~~~
~~~~~~~~~
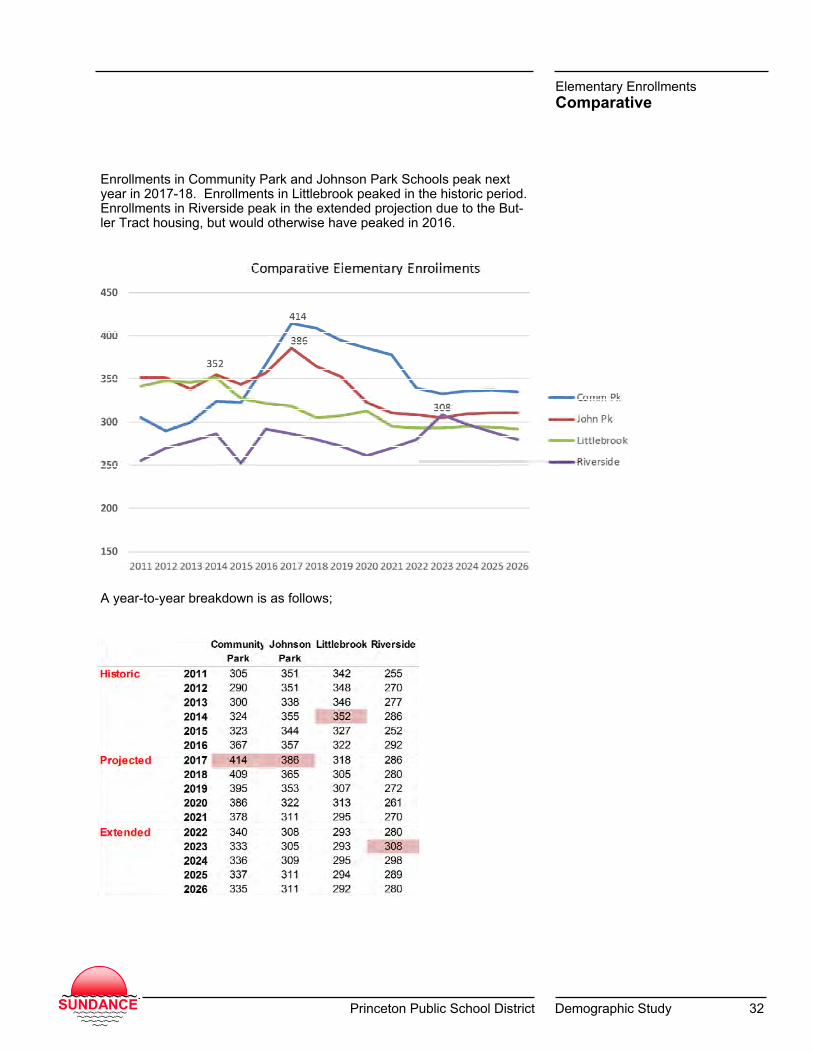
Elementary Enrollments Comparative
A year-to-year breakdown is as follows;
Enrollments in Community Park and Johnson Park Schools peak next year in 2017-18. Enrollments in Littlebrook peaked in the historic period. Enrollments in Riverside peak in the extended projection due to the But-ler Tract housing, but would otherwise have peaked in 2016.

Princeton Public School District Demographic Study 33 SUNDANCE~~~~~~~~~~~~~~~~~~~~
~~~~~~~~~SUNDANCE~~~~~~~~~~~~~~~~~~~~
~~~~~~~~~
Kindergarten Enrollment
It is worth noting that Kindergarten enrollment increased from 2015 to 2016 in Community Park and Riverside Schools and decreased in John-son Park and Littlebrook.
Princeton Public School District Demographic Study 34 SUNDANCE~~~~~~~~~~~~~~~~~~~~
~~~~~~~~~SUNDANCE~~~~~~~~~~~~~~~~~~~~
~~~~~~~~~
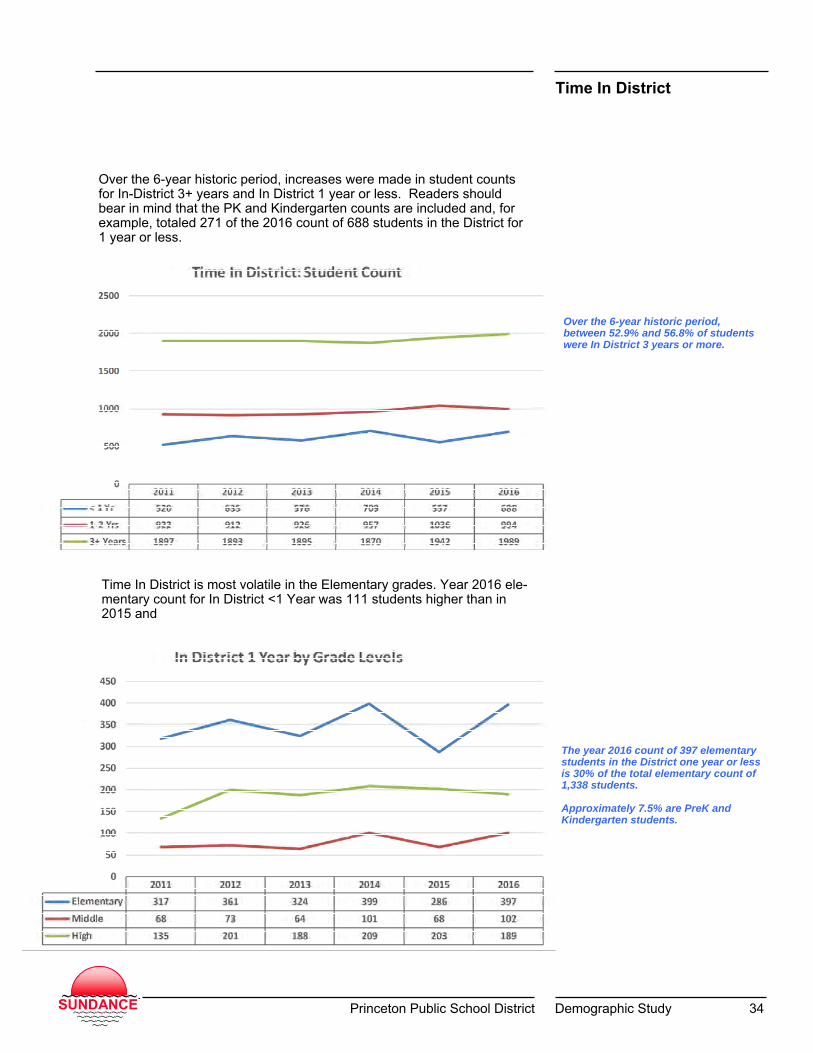
Time In District
Over the 6-year historic period, increases were made in student counts for In-District 3+ years and In District 1 year or less. Readers should bear in mind that the PK and Kindergarten counts are included and, for example, totaled 271 of the 2016 count of 688 students in the District for 1 year or less.
Time In District is most volatile in the Elementary grades. Year 2016 ele-mentary count for In District <1 Year was 111 students higher than in 2015 and
Over the 6-year historic period, between 52.9% and 56.8% of students were In District 3 years or more.
The year 2016 count of 397 elementary students in the District one year or less is 30% of the total elementary count of 1,338 students. Approximately 7.5% are PreK and Kindergarten students.

Princeton Public School District Demographic Study 35 SUNDANCE~~~~~~~~~~~~~~~~~~~~
~~~~~~~~~SUNDANCE~~~~~~~~~~~~~~~~~~~~
~~~~~~~~~
Time In District
Community Park has experienced the largest increases in “In District One Year or less” counts during the historic period moving from 71 students to 126 students. All elementary schools saw significant increases from October 2015 to October 2016.
Princeton Public School District Demographic Study 36 SUNDANCE~~~~~~~~~~~~~~~~~~~~
~~~~~~~~~SUNDANCE~~~~~~~~~~~~~~~~~~~~
~~~~~~~~~
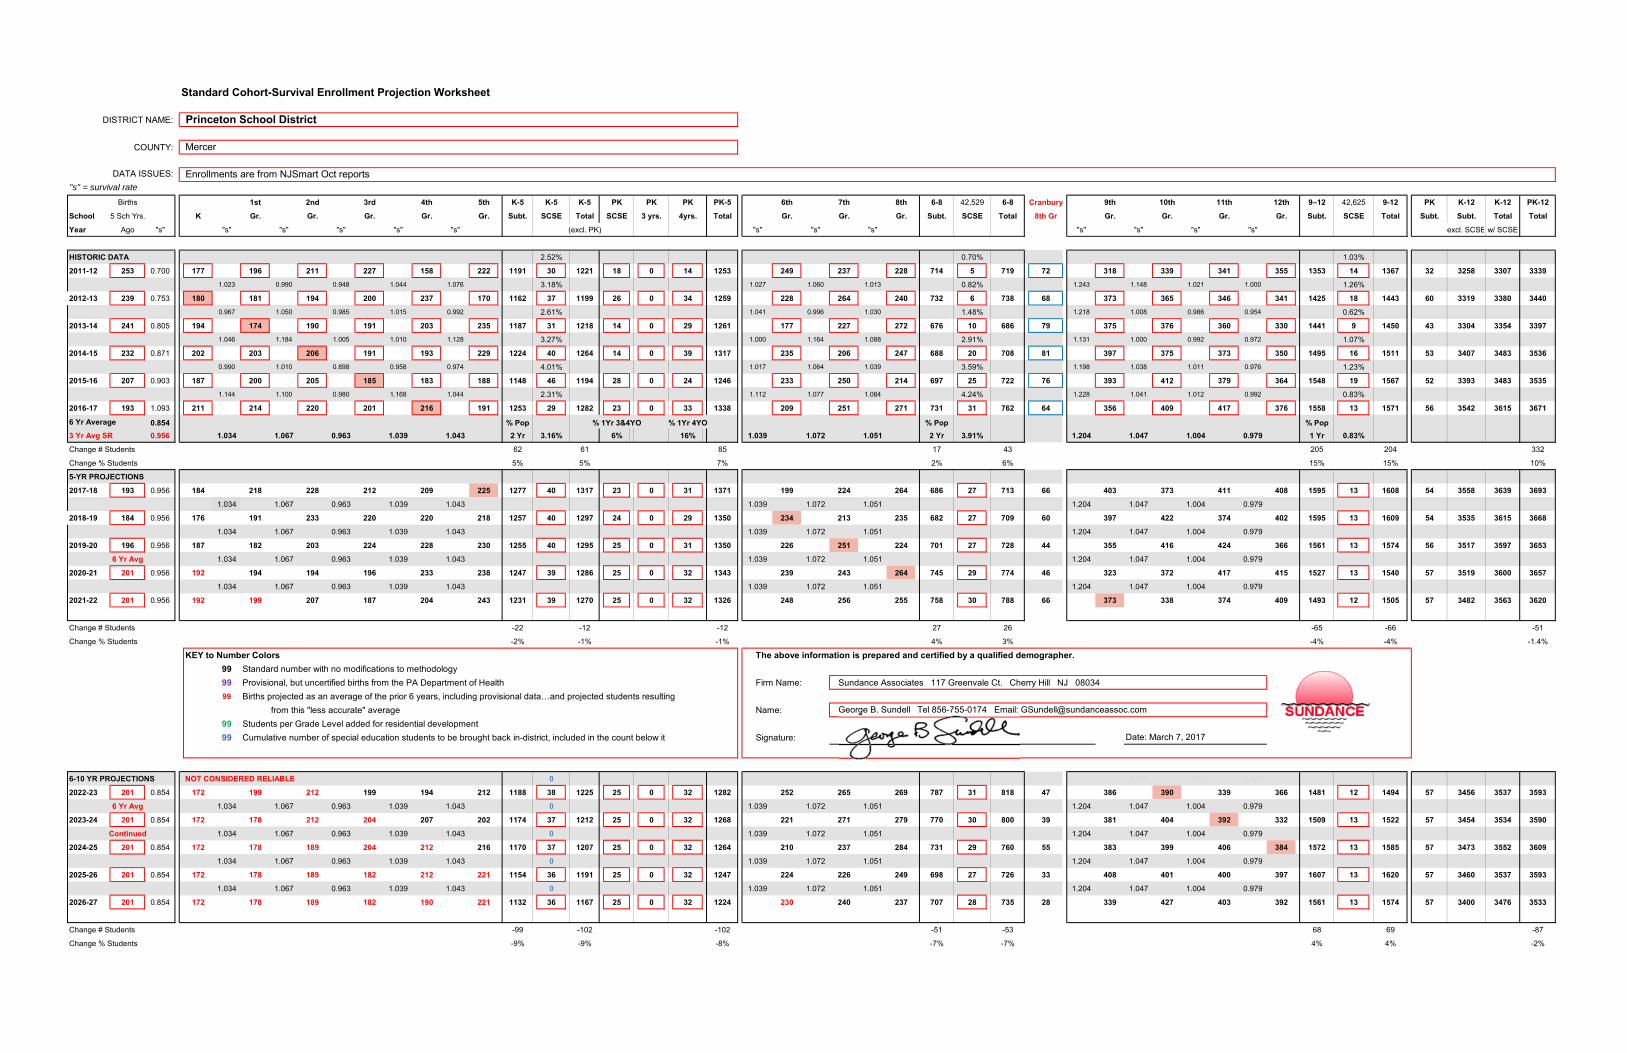
Appendix:
COHORT SURVIVAL WORKSHEETS A: PRINCETON Standard Methodology Adjusted for New Housing B: CRANBURY Standard Methodology Adjusted for New Housing C. RESIDENTIAL MULTIPLIERS
DISTRICT NAME:
COUNTY:
Enrollments are from NJSmart Oct reports"s" = survival rate
Births 1st 2nd 3rd 4th 5th K-5 K-5 K-5 PK PK PK PK-5 6th 7th 8th 6-8 42,529 6-8 Cranbury 9th 10th 11th 12th 9–12 42,625 9-12 PK K-12 K-12 PK-12
School 5 Sch Yrs. K Gr. Gr. Gr. Gr. Gr. Subt. SCSE Total SCSE 3 yrs. 4yrs. Total Gr. Gr. Gr. Subt. SCSE Total 8th Gr Gr. Gr. Gr. Gr. Subt. SCSE Total Subt. Subt. Total Total
Year Ago "s" "s" "s" "s" "s" "s" (excl. PK) "s" "s" "s" "s" "s" "s" "s" excl. SCSE w/ SCSE
HISTORIC DATA 2.52% 0.70% 1.03%
2011-12 253 0.700 177 196 211 227 158 222 1191 30 1221 18 0 14 1253 249 237 228 714 5 719 72 318 339 341 355 1353 14 1367 32 3258 3307 33391.023 0.990 0.948 1.044 1.076 3.18% 1.027 1.060 1.013 0.82% 1.243 1.148 1.021 1.000 1.26%
2012-13 239 0.753 180 181 194 200 237 170 1162 37 1199 26 0 34 1259 228 264 240 732 6 738 68 373 365 346 341 1425 18 1443 60 3319 3380 34400.967 1.050 0.985 1.015 0.992 2.61% 1.041 0.996 1.030 1.48% 1.218 1.008 0.986 0.954 0.62%
2013-14 241 0.805 194 174 190 191 203 235 1187 31 1218 14 0 29 1261 177 227 272 676 10 686 79 375 376 360 330 1441 9 1450 43 3304 3354 33971.046 1.184 1.005 1.010 1.128 3.27% 1.000 1.164 1.088 2.91% 1.131 1.000 0.992 0.972 1.07%
2014-15 232 0.871 202 203 206 191 193 229 1224 40 1264 14 0 39 1317 235 206 247 688 20 708 81 397 375 373 350 1495 16 1511 53 3407 3483 35360.990 1.010 0.898 0.958 0.974 4.01% 1.017 1.064 1.039 3.59% 1.198 1.038 1.011 0.976 1.23%
2015-16 207 0.903 187 200 205 185 183 188 1148 46 1194 28 0 24 1246 233 250 214 697 25 722 76 393 412 379 364 1548 19 1567 52 3393 3483 35351.144 1.100 0.980 1.168 1.044 2.31% 1.112 1.077 1.084 4.24% 1.228 1.041 1.012 0.992 0.83%
2016-17 193 1.093 211 214 220 201 216 191 1253 29 1282 23 0 33 1338 209 251 271 731 31 762 64 356 409 417 376 1558 13 1571 56 3542 3615 3671
6 Yr Average 0.854 % Pop % 1Yr 3&4YO % 1Yr 4YO % Pop % Pop3 Yr Avg SR 0.956 1.034 1.067 0.963 1.039 1.043 2 Yr 3.16% 6% 16% 1.039 1.072 1.051 2 Yr 3.91% 1.204 1.047 1.004 0.979 1 Yr 0.83%
Change # Students 62 61 85 17 43 205 204 332
Change % Students 5% 5% 7% 2% 6% 15% 15% 10%
5-YR PROJECTIONS
2017-18 193 0.956 184 218 228 212 209 225 1277 40 1317 23 0 31 1371 199 224 264 686 27 713 66 403 373 411 408 1595 13 1608 54 3558 3639 3693
1.034 1.067 0.963 1.039 1.043 1.039 1.072 1.051 1.204 1.047 1.004 0.979
2018-19 184 0.956 176 191 233 220 220 218 1257 40 1297 24 0 29 1350 234 213 235 682 27 709 60 397 422 374 402 1595 13 1609 54 3535 3615 3668
1.034 1.067 0.963 1.039 1.043 1.039 1.072 1.051 1.204 1.047 1.004 0.979
2019-20 196 0.956 187 182 203 224 228 230 1255 40 1295 25 0 31 1350 226 251 224 701 27 728 44 355 416 424 366 1561 13 1574 56 3517 3597 3653
6 Yr Avg 1.034 1.067 0.963 1.039 1.043 1.039 1.072 1.051 1.204 1.047 1.004 0.979
2020-21 201 0.956 192 194 194 196 233 238 1247 39 1286 25 0 32 1343 239 243 264 745 29 774 46 323 372 417 415 1527 13 1540 57 3519 3600 3657
1.034 1.067 0.963 1.039 1.043 1.039 1.072 1.051 1.204 1.047 1.004 0.979
2021-22 201 0.956 192 199 207 187 204 243 1231 39 1270 25 0 32 1326 248 256 255 758 30 788 66 373 338 374 409 1493 12 1505 57 3482 3563 3620
Change # Students -22 -12 -12 27 26 -65 -66 -51
Change % Students -2% -1% -1% 4% 3% -4% -4% -1.4%
KEY to Number Colors The above information is prepared and certified by a qualified demographer.
99 Standard number with no modifications to methodology
99 Provisional, but uncertified births from the PA Department of Health Firm Name: Sundance Associates 117 Greenvale Ct. Cherry Hill NJ 08034
99 Births projected as an average of the prior 6 years, including provisional data…and projected students resulting from this "less accurate" average Name:
99 Students per Grade Level added for residential development 99 Cumulative number of special education students to be brought back in-district, included in the count below it Signature:
6-10 YR PROJECTIONS NOT CONSIDERED RELIABLE 0 1.047 1.004 0.979
2022-23 201 0.854 172 199 212 199 194 212 1188 38 1225 25 0 32 1282 252 265 269 787 31 818 47 386 390 339 366 1481 12 1494 57 3456 3537 3593
6 Yr Avg 1.034 1.067 0.963 1.039 1.043 0 1.039 1.072 1.051 1.204 1.047 1.004 0.979
2023-24 201 0.854 172 178 212 204 207 202 1174 37 1212 25 0 32 1268 221 271 279 770 30 800 39 381 404 392 332 1509 13 1522 57 3454 3534 3590
Continued 1.034 1.067 0.963 1.039 1.043 0 1.039 1.072 1.051 1.204 1.047 1.004 0.979
2024-25 201 0.854 172 178 189 204 212 216 1170 37 1207 25 0 32 1264 210 237 284 731 29 760 55 383 399 406 384 1572 13 1585 57 3473 3552 3609
1.034 1.067 0.963 1.039 1.043 0 1.039 1.072 1.051 1.204 1.047 1.004 0.979
2025-26 201 0.854 172 178 189 182 212 221 1154 36 1191 25 0 32 1247 224 226 249 698 27 726 33 408 401 400 397 1607 13 1620 57 3460 3537 3593
1.034 1.067 0.963 1.039 1.043 0 1.039 1.072 1.051 1.204 1.047 1.004 0.979
2026-27 201 0.854 172 178 189 182 190 221 1132 36 1167 25 0 32 1224 230 240 237 707 28 735 28 339 427 403 392 1561 13 1574 57 3400 3476 3533
Change # Students -99 -102 -102 -51 -53 68 69 -87
Change % Students -9% -9% -8% -7% -7% 4% 4% -2%
Standard Cohort-Survival Enrollment Projection Worksheet
Princeton School District
Mercer
Date: March 7, 2017
DATA ISSUES:
George B. Sundell Tel 856-755-0174 Email: [email protected]

DISTRICT NAME:
COUNTY:
Enrollments are from NJSmart Oct reports"s" = survival rate
Births 1st 2nd 3rd 4th 5th K-5 K-5 PK PK PK PK-5 6th 7th 8th 6-8 6-8 Cranbury 9th 10th 11th 12th 9–12 9-12 PK K-12 K-12 PK-12School 5 Yrs. K Gr. Gr. Gr. Gr. Gr. Subt. SCSE Total SCSE 3 yrs. 4yrs. Total Gr. Gr. Gr. Subt. SCSE Total 8th Gr Gr. Gr. Gr. Gr. Subt. SCSE Total Subt. Subt. Total TotalYear Ago "s" "s" "s" "s" "s" "s" (excl. PK) "s" "s" "s" "s" "s" "s" "s" excl. SCSEw/ SCSE
5-YR PROJECTIONS PLUS NEW HOUSING Cum Yr Add+ Resid 11 11 11 11 11 11 64 11 11 11 32 11 11 11 11 43 139 139
2017-18 193 0.956 195 229 239 223 220 236 1341 42 1384 23 0 31 1438 209 235 274 719 28 747 68 414 383 421 419 1638 14 1651 54 3697 3782 38361.034 1.067 0.963 1.039 1.043 1.039 1.072 1.051 1.204 1.047 1.004 0.979
+ Resid 0 0 0 0 0 0 0 0 0 0 0 0 0 0 0 0 139 02018-19 184 0.956 176 202 244 230 231 229 1312 41 1354 24 0 29 1407 245 224 247 716 28 744 64 412 433 385 413 1643 14 1656 54 3671 3755 3808
1.034 1.067 0.963 1.039 1.043 1.039 1.072 1.051 1.204 1.047 1.004 0.979
+ Resid 0 0 0 0 0 0 1 0 0 0 0 0 0 0 0 1 141 22019-20 196 0.956 187 182 215 235 239 241 1301 41 1342 25 0 31 1398 238 263 236 737 29 766 48 374 431 435 377 1617 13 1631 56 3655 3739 3795
1.034 1.067 0.963 1.039 1.043 1.039 1.072 1.051 1.204 1.047 1.004 0.979
+ Resid 2 2 2 2 2 2 12 2 2 2 6 2 2 2 2 8 168 272020-21 201 0.956 194 196 196 210 247 252 1294 41 1335 25 0 32 1392 253 257 279 789 31 820 50 344 393 435 428 1601 13 1614 57 3684 3769 3825
1.034 1.067 0.963 1.039 1.043 1.039 1.072 1.051 1.204 1.047 1.004 0.979
+ Resid 1 1 1 1 1 1 8 1 1 1 4 1 1 1 1 6 186 182021-22 201 0.956 194 202 210 190 219 259 1274 40 1314 25 0 32 1371 263 273 272 807 32 839 70 397 362 396 427 1582 13 1596 57 3664 3749 3806
86 43 57 186Change # Students 11 21 32 33 76 77 24 25 135
Change % Students 2% 3% 2% 10% 10% 2% 2% 4%
New Children6-10-YR PROJECTIONS PLUS NEW HOUSING NOT CONSIDERED RELIABLE Cum Yr Add
+ Resid 0 5 5 5 5 5 5 28 5 5 5 14 5 5 5 5 18 60 602022-23 201 0.956 197 205 220 207 202 233 1264 40 1304 25 0 32 1361 273 287 291 851 33 884 52 416 420 368 393 1596 13 1610 57 3712 3798 3855
1.034 1.067 0.963 1.039 1.043 1.039 1.072 1.051 1.204 1.047 1.004 0.979
+ Resid 0 5 5 5 5 5 5 28 5 5 5 14 5 5 5 5 18 120 602023-24 201 0.956 197 208 223 217 220 216 1280 40 1320 25 0 32 1377 247 298 306 850 33 884 44 417 440 427 365 1649 14 1662 57 3779 3866 3923
1.034 1.067 0.963 1.039 1.043 1.039 1.072 1.051 1.204 1.047 1.004 0.979
+ Resid 0 0 0 0 0 0 0 0 0 0 0 0 0 0 0 0 0 120 02024-25 201 0.956 192 203 222 215 225 229 1287 41 1327 25 0 32 1384 224 265 313 802 31 833 59 421 437 442 418 1717 14 1731 57 3806 3892 3948
1.034 1.067 0.963 1.039 1.043 1.039 1.072 1.051 1.204 1.047 1.004 0.979
+ Resid 0 0 0 0 0 0 0 0 0 0 0 0 0 0 0 0 0 120 02025-26 201 0.956 192 199 217 214 223 235 1279 40 1320 25 0 32 1376 238 240 278 757 30 787 38 448 440 439 433 1760 15 1774 57 3796 3881 3937
1.034 1.067 0.963 1.039 1.043 1.039 1.072 1.051 1.204 1.047 1.004 0.979
+ Resid 0 0 0 0 0 0 0 0 0 0 0 0 0 120 02026-27 201 0.956 192 199 212 209 222 233 1266 40 1306 25 0 32 1363 244 256 253 752 29 782 31 380 469 442 429 1721 14 1735 57 3740 3824 3880
55 28 37 120Change # Students -46 -8 -8 -55 -57 139 140 75
Change % Students -1% -1% -1% -7% -7% 9% 9% 2%
KEY to Number Colors The above information is prepared and certified by a qualified demographer.
99 Standard number with no modifications to methodology
99 Provisional, but uncertified births from the NJ Department of Health & Senior Services Firm Name: Sundance Associates 117 Greenvale Ct. Cherry Hill NJ 08034
99 Births projected as an average of the prior 6 years, including provisional data…and projected students resulting
from this "less accurat" average Name:99 Students per Grade Level added for residential development
99 Cumulative number of special education students to be brought back in-district, included in the count below it Signature:
George B. Sundell Tel 856-755-0174 Email: [email protected]
Date: March 7, 2017
FALL REPORT AND
Adjusted for Impact of New Housing Cohort-Survival Enrollment Projection Worksheet - District
Princeton School District
Mercer
New Children
DISTRICT NAME:
COUNTY:
Enrollments are from NJSmart Oct reports"s" = survival rate
Births 1st 2nd 3rd 4th 5th K-5 K-5 K-5 PK PK PK PK-5 6th 7th 8th 6-8 42,529 6-8 9th 10th 11th 12th 9–12 42,625 9-12 PK K-12 K-12 PK-12
School 5 Sch Yrs. K Gr. Gr. Gr. Gr. Gr. Subt. SCSE Total SCSE 3 yrs. 4yrs. Total Gr. Gr. Gr. Subt. SCSE Total Gr. Gr. Gr. Gr. Subt. SCSE Total Subt. Subt. Total Total
Year Ago "s" "s" "s" "s" "s" "s" (excl. PK) "s" "s" "s" "s" "s" "s" "s" excl. SCSE w/ SCSE
HISTORIC DATA 0.00% 0.00% #DIV/0!
2011-12 44 1.045 46 47 55 67 74 76 365 0 365 0 0 4 369 68 77 72 217 0 217 0 0 4 582 582 5860.804 0.979 1.036 0.985 0.946 0.00% 1.013 1.132 0.883 0.00% 0.000 #DIV/0!
2012-13 49 0.735 36 37 46 57 66 70 312 0 312 0 0 9 321 77 77 68 222 0 222 0 0 9 534 534 5431.056 1.054 1.087 1.053 1.076 0.00% 1.071 1.013 1.026 0.00% 0.000 #DIV/0!
2013-14 48 0.833 40 38 39 50 60 71 298 0 298 0 0 16 314 75 78 79 232 0 232 0 0 16 530 530 5461.275 1.079 0.949 1.040 1.033 0.72% 1.014 0.960 1.038 0.00% 0.000 #DIV/0!
2014-15 30 1.100 33 51 41 37 52 62 276 2 278 0 0 10 288 72 72 81 225 0 225 0 0 10 501 503 5131.121 1.098 1.000 1.054 1.173 1.13% 1.097 0.958 1.056 0.00% 0.000 #DIV/0!
2015-16 34 0.912 31 37 56 41 39 61 265 3 268 0 0 11 279 68 69 76 213 0 213 0 0 11 478 481 4921.032 1.108 1.036 1.024 1.103 0.00% 0.984 0.985 0.928 0.00% 0.000 #DIV/0!
2016-17 35 1.200 42 32 41 58 42 43 258 0 258 0 0 0 258 60 67 64 191 0 191 0 0 0 449 449 449
6 Yr Average 0.971 % Pop % 1Yr 3&4YO % 1Yr 4YO % Pop % Pop3 Yr Avg SR 1.071 1.058 1.064 1.022 1.031 1.066 2 Yr 0.57% 0% 0% 1.036 1.010 0.986 2 Yr 0.00% 0.000 0.000 0.000 0.000 1 Yr
Change # Students -107 -107 -111 -26 -26 0 0 -137
Change % Students -29% -29% -30% -12% -12% #DIV/0! #DIV/0! -23%
5-YR PROJECTIONS
2017-18 26 0.971 25 44 34 42 60 45 250 1 252 0 0 0 252 45 61 66 171 0 171 0 0 0 0 0 0 0 421 423 423
1.058 1.064 1.022 1.031 1.066 1.036 1.010 0.986 0.000 0.000 0.000 0.000
2018-19 22 0.971 21 27 47 35 43 64 237 1 238 0 0 0 238 46 45 60 151 0 151 0 0 0 0 0 0 0 388 389 389
1.058 1.064 1.022 1.031 1.066 1.036 1.010 0.986 0.000 0.000 0.000 0.000
2019-20 25 0.971 24 23 28 48 36 46 205 1 207 0 0 0 207 66 47 44 157 0 157 0 0 0 0 0 0 0 363 364 364
1.058 1.064 1.022 1.031 1.066 1.036 1.010 0.986 0.000 0.000 0.000 0.000
2020-21 25 0.971 24 26 24 29 50 38 191 1 192 0 0 0 192 48 67 46 161 0 161 0 0 0 0 0 0 0 352 353 353
6 Yr Avg 1.058 1.064 1.022 1.031 1.066 1.036 1.010 0.986 0.000 0.000 0.000 0.000
2021-22 28 0.971 27 26 27 25 30 53 188 1 189 0 0 0 189 40 48 66 154 0 154 0 0 0 0 0 0 0 341 342 342
Change # Students -70 -69 -69 -37 -37 0 0 -107
Change % Students -27% -27% -27% -20% -20% #DIV/0! #DIV/0! -23.8%
KEY to Number Colors The above information is prepared and certified by a qualified demographer.
99 Standard number with no modifications to methodology
99 Provisional, but uncertified births from the PA Department of Health Firm Name: Sundance Associates 117 Greenvale Ct. Cherry Hill NJ 08034
99 Births projected as an average of the prior 6 years, including provisional data…and projected students resulting from this "less accurate" average Name:
99 Students per Grade Level added for residential development 99 Cumulative number of special education students to be brought back in-district, included in the count below it Signature:
6-10 YR PROJECTIONS NOT CONSIDERED RELIABLE 0 0 0.000 0.000 0.000
2020-21 28 1.071 30 29 27 28 25 32 171 1 172 0 0 0 172 55 40 47 142 0 142 0 0 0 0 0 0 0 0 314 315 315
6 Yr Avg 1.058 1.064 1.022 1.031 1.066 0 1.036 1.010 0.986 0 0.000 0.000 0.000 0.000 0
2021-22 28 1.071 30 32 31 28 29 27 176 1 177 0 0 0 177 33 56 39 128 0 128 0 0 0 0 0 0 0 0 304 305 305
Continued 1.058 1.064 1.022 1.031 1.066 0 1.036 1.010 0.986 0 0.000 0.000 0.000 0.000 0
2022-23 28 1.071 30 32 34 31 29 31 186 1 187 0 0 0 187 28 33 55 116 0 116 0 0 0 0 0 0 0 0 302 303 303
1.058 1.064 1.022 1.031 1.066 0 1.036 1.010 0.986 0 0.000 0.000 0.000 0.000 0
2023-24 28 1.071 30 32 34 34 32 31 193 1 194 0 0 0 194 32 28 33 93 0 93 0 0 0 0 0 0 0 0 286 287 287
1.058 1.064 1.022 1.031 1.066 0 1.036 1.010 0.986 0 0.000 0.000 0.000 0.000 0
2024-25 28 1.071 30 32 34 34 36 34 200 1 201 0 0 0 201 32 32 28 92 0 92 0 0 0 0 0 0 0 0 291 293 293
Change # Students 12 12 12 -62 -62 0 0 -50
Change % Students 6% 6% 6% -67% -67% #DIV/0! #DIV/0! -17%
Date: Nov 10, 2016
DATA ISSUES:
George B. Sundell Tel 856-755-0174 Email: [email protected]
Standard Cohort-Survival Enrollment Projection Worksheet
Cranbury School District
Middlesex
Princeton Public Schools Appendix B Page 1

DISTRICT NAME:
COUNTY:
Enrollments are from NJSmart Oct reports"s" = survival rate
Births 1st 2nd 3rd 4th 5th K-5 K-5 PK PK PK PK-5 6th 7th 8th 6-8 6-8 9th 10th 11th 12th 9–12 9-12 PK K-12 K-12 PK-12
School 5 Yrs. K Gr. Gr. Gr. Gr. Gr. Subt. SCSE Total SCSE 3 yrs. 4yrs. Total Gr. Gr. Gr. Subt. SCSE Total Gr. Gr. Gr. Gr. Subt. SCSE Total Subt. Subt. Total TotalYear Ago "s" "s" "s" "s" "s" "s" (excl. PK) "s" "s" "s" "s" "s" "s" "s" excl. SCSE w/ SCSE
5-YR PROJECTIONS PLUS NEW HOUSING Cum Yr Add+ Resid 2 2 2 2 2 2 10 0 2 2 2 5 0 2 2 2 2 7 0 21 21
2017-18 26 0.971 27 46 36 44 61 46 260 1 262 0 0 0 262 46 62 68 176 0 176 2 2 2 2 7 0 7 0 443 444 4441.058 1.064 1.022 1.031 1.066 1.036 1.010 0.986 0.000 0.000 0.000 0.000
+ Resid 2 2 2 2 2 2 14 0 2 2 2 7 0 2 2 2 2 9 0 51 302018-19 22 0.971 24 31 51 39 47 68 259 1 261 0 0 0 261 50 49 64 163 0 163 2 2 2 2 9 0 9 0 431 433 433
1.058 1.064 1.022 1.031 1.066 1.036 1.010 0.986 0.000 0.000 0.000 0.000
+ Resid 0 0 0 0 0 0 0 0 0 0 0 0 0 0 0 0 0 0 0 51 02019-20 25 0.971 24 25 33 52 40 50 225 1 226 0 0 0 226 70 51 48 169 0 169 0 0 0 0 0 0 0 0 394 395 395
1.058 1.064 1.022 1.031 1.066 1.036 1.010 0.986 0.000 0.000 0.000 0.000
+ Resid 0 0 0 0 0 0 0 0 0 0 0 0 0 0 0 0 0 0 0 51 02020-21 25 0.971 24 26 27 33 54 43 207 1 208 0 0 0 208 52 71 50 173 0 173 0 0 0 0 0 0 0 0 380 381 381
1.058 1.064 1.022 1.031 1.066 1.036 1.010 0.986 0.000 0.000 0.000 0.000
+ Resid 0 0 0 0 0 0 0 0 0 0 0 0 0 0 0 0 0 0 0 51 02021-22 28 0.971 27 26 27 27 34 58 199 1 200 0 0 0 200 44 53 70 167 0 167 0 0 0 0 0 0 0 0 366 367 367
24 12 16 51Change # Students 4 -59 -58 -58 -24 -24 0 0 -82
Change % Students -23% -22% -22% -13% -13% #DIV/0! #DIV/0! -18%
New Children6-10-YR PROJECTIONS PLUS NEW HOUSING NOT CONSIDERED RELIABLE Cum Yr Add
+ Resid 0 0 0 0 0 0 0 0 0 0 0 0 0 0 0 0 0 0 0 02020-21 28 0.971 27 29 27 28 28 37 176 1 177 0 0 0 177 60 45 52 156 0 156 0 0 0 0 0 0 0 0 332 333 333
1.058 1.064 1.022 1.031 1.066 1.036 1.010 0.986 0.000 0.000 0.000 0.000
+ Resid 0 0 0 0 0 0 0 0 0 0 0 0 0 0 0 0 0 0 0 0 0 02021-22 28 0.971 27 29 31 28 29 30 173 1 174 0 0 0 174 38 60 44 142 0 142 0 0 0 0 0 0 0 0 315 316 316
1.058 1.064 1.022 1.031 1.066 1.036 1.010 0.986 0.000 0.000 0.000 0.000
+ Resid 0 0 0 0 0 0 0 0 0 0 0 0 0 0 0 0 0 0 0 0 0 02022-23 28 0.971 27 29 31 31 29 31 177 1 178 0 0 0 178 31 38 59 129 0 129 0 0 0 0 0 0 0 0 306 307 307
1.058 1.064 1.022 1.031 1.066 1.036 1.010 0.986 0.000 0.000 0.000 0.000
+ Resid 0 0 0 0 0 0 0 0 0 0 0 0 0 0 0 0 0 0 0 0 0 02023-24 28 0.971 27 29 31 31 32 31 181 1 182 0 0 0 182 32 31 38 101 0 101 0 0 0 0 0 0 0 0 281 283 283
1.058 1.064 1.022 1.031 1.066 1.036 1.010 0.986 0.000 0.000 0.000 0.000
+ Resid 0 0 0 0 0 0 0 0 0 0 0 0 0 0 0 0 0 0 02024-25 28 0.971 27 29 31 31 32 34 184 1 185 0 0 0 185 32 32 31 95 0 95 0 0 0 0 0 0 0 0 279 280 280
Change # Students -75 -15 -15 -72 -72 0 0 -87
Change % Students -8% -8% -8% -43% -43% #DIV/0! #DIV/0! -24%
Adjusted for Impact of New Housing Cohort-Survival Enrollment Projection Worksheet - District
Cranbury School District
Middlesex
New Children
FALL REPORT AND SS S
Princeton Public Schools Appendix B Page 2
Who Lives in
New Jersey
Housing?
David Listokin
Ioan Voicu • William Dolphin • Matthew Camp
Assisted by
Darlene Jay • Meghan Leavey • Jesse Sherry • Arlene Pashman
This research was supported by funding from:
New Jersey Department of Community Affairs (NJDCA)Office of Smart Growth
New Jersey Chapter of the National Association of Industrial and Office Properties (NJ–NAIOP)
Northern New Jersey District Council of the Urban Land Institute (ULI)
with additional funding from:
New Jersey Meadowlands Commission (NJMC)
NOVEMBER 2006
Center for Urban Policy ResearchEdward J. Bloustein School of Planning and Public Policy
Rutgers, The State University of New JerseyNew Brunswick, New Jersey
New Jersey Demographic Multipliers—
The Profile of Occupants of Residential andNonresidential Development
Princeton Public Schools Appendix C Page 1

101
TABLE II-D-2 CENTRAL REGION OF NEW JERSEY
SCHOOL-AGE CHILDREN (SAC)
GRADESTRUCTURE TYPE/
BEDROOMS/ VALUE /TENURE
TOTAL SAC
Elementary (K-6)
Junior High School
(7-9) High School
(10-12)
Single-Family Detached, 2-3 BR All Values 0.367 0.231 0.077 0.059
Below Median $308,935 0.341 0.223 0.061 0.056 Above Median $308,935 0.402 0.241 0.099 0.062
Single-Family Detached, 4-5 BR All Values 1.094 0.706 0.224 0.164
Below Median $576,679 1.050 0.682 0.215 0.154 Above Median $576,679 1.177 0.752 0.242 0.183
Single-Family Attached, 2-3 BR All Values 0.292 0.177 0.078 0.037
Below Median $267,744 0.340 0.199 0.099 0.042 Above Median $267,744 0.214 0.142 0.045 0.028
Single-Family Attached, 4-5 BR All Values 1.210 0.868 0.170 0.172
Below Median $308,935 1.341 1.094 0.135 0.112 Above Median $308,935 1.056 0.601 0.212 0.243
5+ Units (Own/Rent), 0-1 BR All Values 0.064 0.042 0.014 0.008
Below Median $131,483 0.051 0.020 0.021 0.010 Above Median $131,483 0.077 0.064 0.006 0.007
5+ Units (Own/Rent), 2-3 BR All Values 0.373 0.262 0.056 0.055
Below Median $185,361 0.406 0.303 0.063 0.041 Above Median $185,361 0.330 0.210 0.047 0.073
2-4 Units, 0-1 BR All Values 0.276 0.182 0.045 0.050
Below Median $128,187 0.241 0.142 0.038 0.061 Above Median $128,187 0.312 0.222 0.052 0.039
2-4 Units, 2-3 BR All Values 0.405 0.252 0.074 0.079
Below Median $185,361 0.542 0.373 0.053 0.116 Above Median $185,361 0.233 0.100 0.100 0.033
Princeton Public Schools Appendix C Page 2
user-pc
Highlight
user-pc
Highlight
user-pc
Highlight

103
TABLE II-D-3 CENTRAL REGION OF NEW JERSEY PUBLIC SCHOOL CHILDREN (PSC)
PUBLIC SCHOOL GRADESTRUCTURE TYPE/
BEDROOMS/ VALUE /TENURE
TOTAL PSC
Elementary (K-6)
Junior High School
(7-9) High School
(10-12)
Single-Family Detached, 2-3 BR All Values 0.304 0.181 0.071 0.052
Below Median $308,935 0.282 0.173 0.058 0.051 Above Median $308,935 0.333 0.191 0.089 0.053
Single-Family Detached, 4-5 BR All Values 0.902 0.573 0.189 0.140
Below Median $576,679 0.885 0.562 0.188 0.135 Above Median $576,679 0.933 0.594 0.189 0.150
Single-Family Attached, 2-3 BR All Values 0.251 0.146 0.071 0.033
Below Median $267,744 0.287 0.163 0.088 0.036 Above Median $267,744 0.192 0.119 0.045 0.028
Single-Family Attached, 4-5 BR All Values 0.449 0.253 0.095 0.101
Below Median $308,935 0.202 0.118 0.031 0.054 Above Median $308,935 0.738 0.412 0.171 0.155
5+ Units (Own/Rent), 0-1 BR All Values 0.062 0.040 0.014 0.008
Below Median $131,483 0.051 0.020 0.021 0.010 Above Median $131,483 0.072 0.060 0.006 0.007
5+ Units (Own/Rent), 2-3 BR All Values 0.308 0.215 0.050 0.042
Below Median $185,361 0.358 0.267 0.057 0.034 Above Median $185,361 0.242 0.148 0.042 0.052
2-4 Units, 0-1 BR All Values 0.264 0.169 0.045 0.050
Below Median $128,187 0.216 0.117 0.038 0.061 Above Median $128,187 0.312 0.222 0.052 0.039
2-4 Units, 2-3 BR All Values 0.330 0.204 0.058 0.068
Below Median $185,361 0.435 0.287 0.053 0.095 Above Median $185,361 0.198 0.100 0.065 0.033
Princeton Public Schools Appendix C Page 3
user-pc
Highlight
user-pc
Highlight
user-pc
Highlight
New Jersey Demographic Multipliers: Pro le of the Occupants of Residential and Nonresidential Development
RUTGERS, THE STATE UNIVERSITY OF NEW JERSEY
131
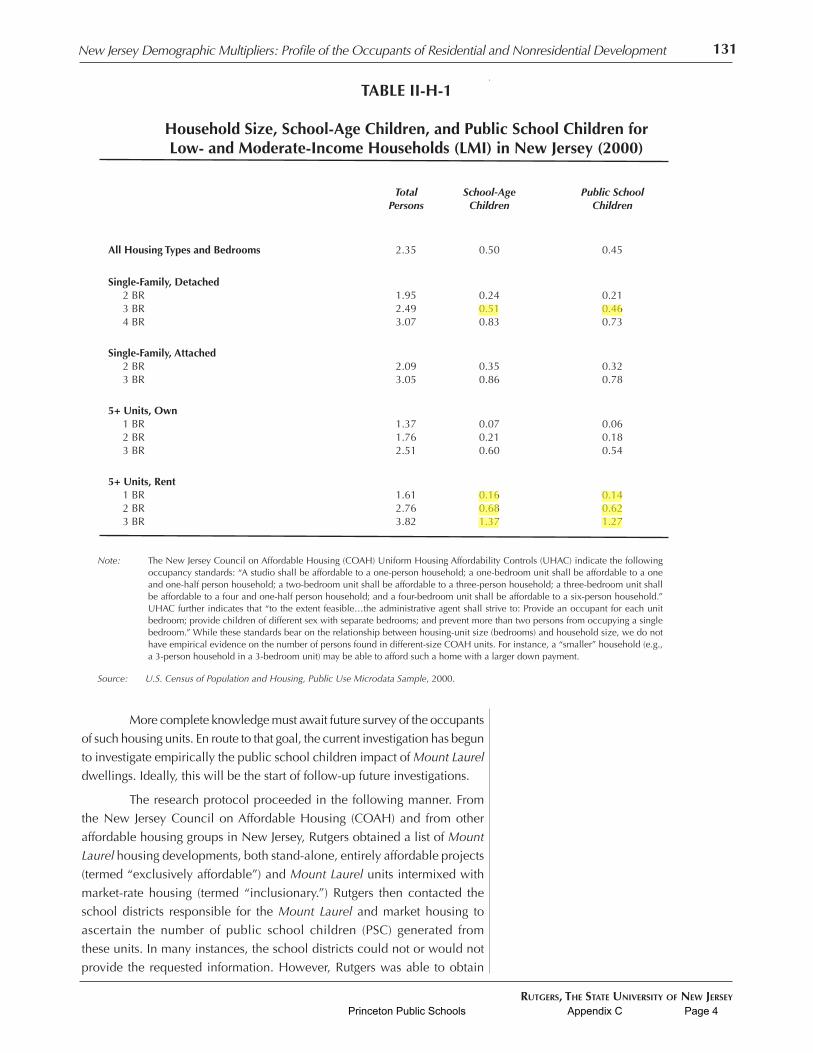
More complete knowledge must await future survey of the occupants of such housing units. En route to that goal, the current investigation has begun to investigate empirically the public school children impact of Mount Laurel dwellings. Ideally, this will be the start of follow-up future investigations.
The research protocol proceeded in the following manner. From the New Jersey Council on Affordable Housing (COAH) and from other affordable housing groups in New Jersey, Rutgers obtained a list of Mount Laurel housing developments, both stand-alone, entirely affordable projects (termed “exclusively affordable”) and Mount Laurel units intermixed with market-rate housing (termed “inclusionary.”) Rutgers then contacted the school districts responsible for the Mount Laurel and market housing to ascertain the number of public school children (PSC) generated from these units. In many instances, the school districts could not or would not provide the requested information. However, Rutgers was able to obtain
TotalPersons
School-AgeChildren
Public School Children
All Housing Types and Bedrooms 2.35 0.50 0.45
Single-Family, Detached2 BR3 BR4 BR
1.952.493.07
0.240.510.83
0.210.460.73
Single-Family, Attached2 BR3 BR
2.093.05
0.350.86
0.320.78
5+ Units, Own1 BR2 BR3 BR
1.371.762.51
0.070.210.60
0.060.180.54
5+ Units, Rent1 BR2 BR3 BR
1.612.763.82
0.160.681.37
0.140.621.27
TABLE II-H-1
Household Size, School-Age Children, and Public School Children forLow- and Moderate-Income Households (LMI) in New Jersey (2000)
Note: The New Jersey Council on Affordable Housing (COAH) Uniform Housing Affordability Controls (UHAC) indicate the following occupancy standards: “A studio shall be affordable to a one-person household; a one-bedroom unit shall be affordable to a one and one-half person household; a two-bedroom unit shall be affordable to a three-person household; a three-bedroom unit shall be affordable to a four and one-half person household; and a four-bedroom unit shall be affordable to a six-person household.” UHAC further indicates that “to the extent feasible…the administrative agent shall strive to: Provide an occupant for each unit bedroom; provide children of different sex with separate bedrooms; and prevent more than two persons from occupying a single bedroom.” While these standards bear on the relationship between housing-unit size (bedrooms) and household size, we do not have empirical evidence on the number of persons found in different-size COAH units. For instance, a “smaller” household (e.g., a 3-person household in a 3-bedroom unit) may be able to afford such a home with a larger down payment.
Source: U.S. Census of Population and Housing, Public Use Microdata Sample, 2000.
Princeton Public Schools Appendix C Page 4
user-pc
Highlight
user-pc
Highlight
user-pc
Highlight
user-pc
Highlight
user-pc
Highlight
user-pc
Typewritten Text
AFFORDABLE
user-pc
Highlight
user-pc
Highlight
user-pc
Highlight
user-pc
Highlight
user-pc
Highlight
Related Documents