PRI Discussion Paper Series (No.21A-06) Demographic Effects on Prices: Is Aging Deflationary? Visiting Scholar, Policy Research Institute, Ministry of Finance Japan. Tomoki Isa July 2021 Research Department Policy Research Institute, MOF 3-1-1 Kasumigaseki, Chiyoda-ku, Tokyo 100-8940, Japan TEL 03-3581-4111 The views expressed in this paper are those of the authors and not those of the Ministry of Finance or the Policy Research Institute.

Welcome message from author
This document is posted to help you gain knowledge. Please leave a comment to let me know what you think about it! Share it to your friends and learn new things together.
Transcript

PRI Discussion Paper Series (No.21A-06)
Demographic Effects on Prices: Is Aging Deflationary?
Visiting Scholar, Policy Research Institute, Ministry of Finance Japan.
Tomoki Isa
July 2021
Research Department Policy Research Institute, MOF
3-1-1 Kasumigaseki, Chiyoda-ku, Tokyo 100-8940, Japan
TEL 03-3581-4111
The views expressed in this paper are those of the authors and not those of the Ministry of Finance or the Policy Research Institute.

- 1 -
Demographic Effects on Prices: Is Aging Deflationary?†
Tomoki Isa‡
Abstract
Although the Bank of Japan has continued unconventional monetary easing over the years, it is still far from achieving the inflation target set by the central bank. On the back of this, there has been a growing interest in the relationship between demography and inflation, a relationship which conventional macroeconomics has not discussed much. Analyzing Japanese prefectural panel data, this paper examines demographic effects on inflation with linear regression based on the Phillips curve with some demographic variables. The result shows that the aging population has inflationary pressure on prices, while the declining population has deflationary pressure. The aging population also reduces the impact of population change and economic variation on prices, flattening the Phillips curve. As a result, this paper clarifies a multifaceted relationship between demography and inflation, suggesting that demography is not the main cause of deflation and low inflation in Japan. Keywords: inflation, deflation, Philipps curve, monetary policy, demography, aging population, population decline, old-age dependency ratio, Japanese economy JEL Classification: C33, E31, E52, J11
† I would like to express my appreciation to Junko Koeda (Associate Professor of Economics at Waseda University) for providing valuable guidance and advice. I also received helpful comments from Takeshi Yagihashi (Professor of Economics at Hosei University) and Shogo Takahashi (Visiting Scholar, Policy Research Institute, Ministry of Finance Japan). The views expressed herein are those of the author and do not necessarily reflect the opinions of the Ministry of Finance or the Policy Research Institute. The author is entirely responsible for any errors in this paper. ‡ Visiting Scholar, Policy Research Institute, Ministry of Finance Japan.

- 2 -
1 Introduction
Since the financial crisis in 2008, many countries around the world have implemented
large-scale monetary easing. The Bank of Japan also set a 2% inflation target in 20131
and has continued unconventional monetary easing over the years. Nevertheless, Japan
is still far from achieving the inflation target set by the central bank.2 This phenomenon
is observed in other developed countries and it has been pointed out that demography
has a deflationary impact (e.g., Shirakawa, 2012). If demography affects prices,
appropriate monetary policy should consider demographic trends. In addition, this
impact of demography is not irrelevant to other countries that will experience aging and
declining populations in the future. This paper examines the impact of demography on
inflation in Japan, aging at an unprecedented speed in the world.
Thanks to the latest low inflation, there has been a growing interest in the
relationship between demographics and prices among institutions such as the IMF
(Juselius and Takáts, 2015), and empirical studies have started in recent years.
According to Imam (2013), the amount of research is very limited and such research is
more theoretical rather than empirical, owing to the “The conventional wisdom that
inflation is primarily a monetary phenomenon” (Liu and Westelius, 2016, p.6).3 In this
situation, Imam (2013) is the first study to evaluate empirically the impact of aging on
monetary policy, analyzing five countries (Germany, Canada, the U.S., the U.K., and
Japan). The study shows that the effectiveness of monetary policy on the unemployment
1 The Bank of Japan ‘The "Price Stability Target" under the Framework for the Conduct of Monetary Policy’ (22nd January 2013). 2 As stated in the Annual Report on the Consumer Price Index (27th March 2020) by Statistic Bureau, Ministry of Internal Affairs and Communication (hereinafter called “MIC”), it is +0.5% (YoY, 2019). 3 This idea was advocated by Milton Friedman based on the quantity theory of money that the money supply and its velocity of circulation determine the price level.

- 3 -
rate and inflation has been weakened, showing that when the old-age dependency ratio
rises by 1 percentage point, the effect of monetary policy on inflation decreases by 0.10
percentage points.
Yoon et al. (2018) also find that the aging population is deflationary, and its
impact becomes greater if aging occurs in tandem with the declining population,
analyzing the 30 OECD countries. In contrast, Juselius and Takáts (2015) indicate that
an increase in the ratio of the young (under 19 years old) and the elderly (over 65 years
old) leads to higher inflation, whereas an increase in the working-age people (20-64
years old) ratio leads to lower inflation, examining the relationship between population
by age group and prices in 22 developed countries including Japan. As a study focusing
on Japan, Liu and Westelius (2016) conclude that aging is deflationary, based on
prefectural panel data. In summary, there is little consensus about the relationship
between aging and prices (Liu and Westelius, 2016), and further empirical research is
needed (Imam, 2013 and Juselius and Takáts, 2015).
The purpose of this paper is to conduct an empirical analysis of demographic
effects on inflation in Japan. With Japanese prefectural panel data (from 1996 to 2016),
this paper performs linear regression based on the Phillips curve with additional
explanatory variables related to demography such as the number of population and old-
age dependency ratio.
The main contribution of the paper is that this is one of the few empirical studies
focusing on a single country (Japan) with the most recent data since the financial crisis
in 2008. As this field has attracted interest because of the low inflation in recent years,
the amount of empirical research is scarce (Imam, 2013). Besides, single-country
analysis is advantageous in controlling for many factors such as changes in monetary

- 4 -
policy compared with cross-country analysis, or most of the previous studies.
In terms of the data, Japan is the appropriate country to observe a demographic
impact on inflation, because its population has been aging rapidly. Although Liu and
Westelius (2016) have already analyzed Japanese prefectural data, the analysis period is
up to 2007. This paper, then, is the first study analyzing Japanese prefectural data that
reflect the influence of the financial crisis and population decline.4 In addition, this
paper analyzes not only a direct effect of aging and population change but also a
synergistic effect of aging with the fluctuation of output gap and population.
The results indicate that the aging population has inflationary pressure on prices,
whereas the declining population has deflationary pressure. It is also found that aging
reduces the impact of population change and flattens the Phillips curve, making prices
unsusceptible to economic fluctuations. Though there is little consensus on whether
aging is deflationary or not in previous studies, this paper, examining empirically a
multifaceted relationship between demography and inflation, can explain the ambiguous
situation to some extent.
This paper is organized as follows. Section 2 reviews recent studies and
introduces the mechanism of how demography affects prices. Section 3 describes the
data and methodology. Section 4 shows the results. Section 5 presents the conclusion.
Finally, Section 6 refers to future challenges.
2 Background
Conventional macroeconomics has considered inflation as a monetary phenomenon and
4 According to the Annual Report on the Population Estimates (As of 1st October 2019) by Statistic Bureau (MIC), Japan has faced with a continuous population decline since 2011.

- 5 -
little research has been conducted on the long-term relationship between demographics
and prices (Liu and Westelius, 2016). One of the reasons for this is that the overall effect
of demography is unclear because demographic changes affect both the demand-side
and supply-side through various channels. For example, when aging increases the low-
wage workers, aging is deflationary, but aging can be also inflationary since the elderly
have a greater consumption propensity compared to the young (Yoon et al, 2018). In
addition, supply-side response to demand-side also affects prices. In other words, if
aggregate supply does not decrease along with the fall of aggregate demand, there will
be deflationary pressure (Imam, 2013). Though the paths through which demography
affects inflation are complicated, previous studies have proposed the following
mechanisms.
Juselius and Takáts (2015) find that an increase in the ratio of the young (under 19
years old) and the elderly (over 65 years old) has inflationary pressure since these
generations consume rather than produce, while the working-age (20-64 years old) has
deflationary pressure, producing more than it consumes. Katagiri et al (2019),
examining the relationship between aging and prices from the perspectives of the FTPL5
(The Fiscal Theory of the Price Level) framework, argue that aging with a birth rate
decline leads to inflation because aging brings a shrinking tax base and increasing
government spending (social security expenses). In contrast, aging with an unexpected
increase in life expectancy causes deflation because governments suppress inflation to
increase the asset value held by the elderly for compensating the lack of savings with a
greater political influence of the elderly who dislike inflation.
5 The Fiscal Theory of the Price Level (FTPL) is the idea that fiscal policy determines the price level under certain conditions.

- 6 -
Imam (2013) finds that the effectiveness of monetary policy depends on the
magnitude of each channel’s effect because society is affected by monetary policy
through many channels. For example, the young households, buying a house or a car
and being debtors, are more sensitive to interest rate changes (interest rate channel). By
contrast, the old households, holding assets and being creditors, are also sensitive to the
change, but the channel is different (wealth effect channel). Hence when the effect of
the interest rate channel is greater than that of the wealth effect channel, aging reduces
the sensitivity of society, which undermines the monetary easing effect.
As for the studies on Japan, Shirakawa (2012) suggests that the declining birthrate
and aging population are deflationary with a scatter plot of the growth rate of the
working-age population and the GDP deflator. He also explains that the expectation that
aging prevents future economic growth and decreases one's lifetime income reduces
current consumption and investment (= demand), leading to deflation. From the
perspectives of the secular stagnation hypothesis6 advocated by Summers, moreover,
Liu and Westelius (2016) point out that anxiety about the future and extending life
expectancy drive people to save money instead of investing, and excess saving causes a
low neutral rate,7 which invalidates monetary policy and leads to lower inflation.
In addition to the above theoretical arguments, Imam (2013) emphasizes the need
for empirical research, stating that “The limited work on this topic has been mainly
theoretical” (p.6) and “Given the ambiguity of the theoretical literature, it is surprising
that limited empirical work has yet been undertaken” (p.7). Although empirical research
on the relationship between demographics and prices has been increasing in recent
6 The lecture by Summers in the IMF conference in Nov. 2013 is well known. 7 Neutral interest rates realize when the economy is at the level of potential GDP. Although real interest rates need to be lower than neutral interest rates for monetary easing, it is difficult to achieve because of low inflation, decline in neutral interest rates and the zero lower bound (ZLB).

- 7 -
years, the number of studies is still small, and there is no theoretical consensus.
3 Data and Methodology
3.1 Empirical Model
Why is there no consensus among the previous studies on the demographic impact on
prices? One possible reason is that cross-country analysis may not be able to control for
factors properly such as monetary policy and institutional changes varying from country
to country. Another point to consider is that demography may have more complicated,
such as non-linear, effects than it is thought, diversifying the results of previous studies.
This paper thus focuses on a single country (Japan) and examines the impact of
demography on inflation with prefectural panel data. The estimation formula is based on
Liu and Westelius (2016) with additional explanatory variables related to demography.
The model has some cross-terms to check a non-linear effect of demography. This paper
adopts ordinary least squares (OLS) to estimate the parameters.
𝜋𝜋𝑖𝑖,𝑡𝑡 = 𝛼𝛼∆𝑂𝑂𝑂𝑂𝑂𝑂𝑖𝑖,𝑡𝑡 + 𝛽𝛽𝑋𝑋𝑖𝑖,𝑡𝑡 + 𝛾𝛾(∆𝑂𝑂𝑂𝑂𝑂𝑂𝑖𝑖,𝑡𝑡 × 𝑋𝑋𝑖𝑖,𝑡𝑡) + 𝜁𝜁∆𝑃𝑃𝑂𝑂𝑃𝑃𝑖𝑖,𝑡𝑡 + 𝜂𝜂(∆𝑂𝑂𝑂𝑂𝑂𝑂𝑖𝑖,𝑡𝑡 × ∆𝑃𝑃𝑂𝑂𝑃𝑃𝑖𝑖,𝑡𝑡)
+ 𝜅𝜅𝜋𝜋𝑖𝑖,𝑡𝑡−1 + 𝜃𝜃𝑡𝑡 + 𝑢𝑢𝑖𝑖,𝑡𝑡
Inflation rate in prefecture i in year t is denoted as 𝜋𝜋𝑖𝑖,𝑡𝑡. ODR is the old-age
dependency ratio, X is the prefectural output gap, POP is the prefectural population, 𝜃𝜃
is a time trend across prefectures and u is an error term. Δ is a year-on-year rate of
change, ∆𝑂𝑂𝑂𝑂𝑂𝑂𝑖𝑖,𝑡𝑡 × 𝑋𝑋𝑖𝑖,𝑡𝑡 and ∆𝑂𝑂𝑂𝑂𝑂𝑂𝑖𝑖,𝑡𝑡 × ∆𝑃𝑃𝑂𝑂𝑃𝑃𝑖𝑖,𝑡𝑡 are cross terms. In general, panel data
analysis includes fixed effects as variables that are unique to each prefecture and time-
invariant. This paper, however, performs pooled regression, because a hypothesis that

- 8 -
parameters of each prefectural dummy variable are equal to zero is not rejected8 by the
F test.
As for the analysis period, this study conducted a long-term analysis from 1996 to
2016 for the following reasons: (1) the purpose of this paper is to verify the impact of
long-term demographic changes on prices, (2) inflation in Japan has fluctuated slightly
and there is a high probability that the results will be non-significant in a short-term
analysis, or the identification problem. The previous studies also analyzed long-term
(20-55 years) data.
Single-country analysis has many advantages. For instance, Liu and Westelius
(2016) state that there is no need to worry about the interaction between national
institutional characteristics and demographic changes as opposed to cross-country
studies. In addition, a time trend term can control for many shocks that are common to
all prefectures, such as consumption tax hikes. Furthermore, all prefectures face the
same monetary policy and variables including the interest rate and exchange rates that
affect the inflation rate, thus there is no need to consider the factors; this study copes
with the problem of omitted variable bias.9 Leahy and Thapar (2019) also introduce
these advantages, the study which examines demography and monetary policy
effectiveness in the U.S.
This paper’s analysis also addresses reverse causality,10 or simultaneity because
inflation is considered not to affect the old-age dependency ratio and population. By
8 In other words, the F test examines whether each prefecture has a unique characteristic or not (whether Y-intercept is different from each other or not on a graph). As a result of the test, there is no such a unique characteristic with a high probability. The result of a fixed effects model can be seen in Table 2(6). 9 When a model omits relevant variables, explanatory variables are correlated with the error term in the model, or endogeneity, and the estimator does not have unbiasedness and consistency. 10 When a dependent variable affects explanatory variables, explanatory variables are correlated with the error term, endogeneity occurs.

- 9 -
contrast, much previous research conducted cross-country analyses and has a possibility
of reverse causality, owing to the existence of immigrants in the U.S. and European
countries. One possible mechanism is that economic recovery increases the inflation
rate in a country, and at the same time, many young people in other countries emigrate
in search of employment opportunities, resulting in population growth and an aging rate
decline.
3.2 Data
Prefectural inflation refers to the Consumer Price Index (hereinafter called “CPI”) in
prefectural capital cities from the Statistics Bureau, Ministry of Internal Affairs and
Communications (hereinafter called “MIC”). Although the Regional Difference Index of
Prices in the National Survey of Prices, indicating the prefectural prices, is more
appropriate to prefectural analysis, the survey was conducted once every 5 years before
2013 and is not suitable for long-term analysis. Besides, one of the prefectures (Chiba
Prefecture) has been publishing the price index of the city as that of the prefecture since
FY 2005. This is because the prefectural price index has shown the same tendency as that
of the city, thanks to distribution network development. For the above reasons, we can
equate both indexes as Liu and Westelius (2016) did. As price indicators, there is the GDP
deflator provided by the Cabinet Office, but the “price” held by the Bank of Japan as a
policy goal refers to the CPI, and this paper uses the CPI.
As an indicator of aging, we use the old-age dependency ratio from the Population
Estimates by the MIC. The old-age dependency ratio is the ratio of the elderly population
(aged 65 and over) compared to the working-age population (aged 15 to 64) and reflects
demographic change by aging more properly rather than a simple aging rate, used in many

- 10 -
previous studies. The prefectural population is also taken from the Population Estimates.
In terms of the output gap, we exclude a linear trend from prefectural GDP that is
taken from the Annual Report on Prefectural Accounts by the Cabinet Office. Specifically,
we use the gap between the data and approximate line as the output gap (so-called
residual). The HP filter (Hodrick-Prescott filter) is one of the options, but the HP filter
has been criticized in recent years.11 In addition, some macroeconomic research12 also
simply excludes a linear trend for calculating output gap, then we adopt this simple
method.
The analysis period is limited from 1996 to 2016 by the data constraint. Before
1995, the calculation of GDP was different from that after 1996, and the data are
unavailable. Though economic fluctuations are sometimes indicated by the
unemployment rate rather than the output gap in the Philipps curve, we do not use it. This
is because the accuracy of the data on prefectural unemployment rates taken from the
Labor Force Survey by the MIC is not sufficiently ensured.13
The equation can be regarded as a model of the Phillips curve with some
demographic variables. Although the basic Phillips curve contains expected inflation, it
is difficult to obtain the prefectural data. Thereby we posit that expectation is adaptive14
(𝜋𝜋𝑒𝑒 = 𝜋𝜋𝑖𝑖,𝑡𝑡−1), and use lagged inflation as expected inflation.
Descriptive statistics are shown in Table 1.
11 For instance, Hamilton, J. D. (2018) points out that the HP filter produces series with spurious dynamic relations that have no basis in the underlying data-generating process. 12 E.g., Arellano, C (2008). 13 Statistics Bureau, MIC notes that because the sample is not designed by prefecture and the sample size is too small, the accuracy of the result is not ensured, requiring attention when being used. 14 One of the rational expectations hypothesis. “Adaptive” here means that expectations for the future are formed based on the past figures.

- 11 -
Table 1. Descriptive Statistics Value (in percent)
Obs. Ave. S. D. Max. Min. Inflation 987 0.12 1.01 3.42 -2.33 Output gap 987 0.00 2.71 11.54 -10.21 ΔODR 987 3.52 1.33 7.94 -3.91 ΔPopulation 987 -0.18 0.43 1.13 -2.02
3.3 Data Overview and Hypotheses
Figure 1 shows the prefectural average of the old-age dependency ratio and inflation
from 1996 to 2016. Figure 2 illustrates the transition of annual averages for the inflation
rate, output gap, and old-age dependency ratio in the given period.
Figure 1 shows that the inflation rate tends to be higher in the areas where the
old-age dependency ratio average is high. Looking at the characteristic figures, the
highest old-age dependency ratio can be seen in Shimane Prefecture (47.2, 0.20%),
while the lowest is in Okinawa Prefecture (25.0, 0.15%); the highest inflation rate is in
Aomori Prefecture (37.3, 0.46%), while the lowest is in Tokyo (27.1, -0.07%). The
average inflation rate is positive in many prefectures except for a few prefectures,
seeming to suggest that there has been an inflationary trend in Japan. However, it should
be noted that the consumption tax was raised in 1997 and 2014 (from 3% to 5% and
from 5% to 8%, respectively).
In Figure 2, while the old-age dependency ratio has an upward trend, both the
inflation and output gap have fluctuated similarly. This graph does not show the
relationship between aging and inflation clearly, but there seems to be a positive
correlation between the inflation and output gap, which is consistent with the Phillips
curve theory.

- 12 -
Figure 1. The Averages of Old-age Dependency Ratio and Inflation (by prefecture, 1996-2016)
Source; Statistics Bureau, MIC, “Consumer Price Index” and “Old-age Dependency Ratio”
Figure 2. The Transition of Inflation, Output Gap, Old-age Dependency Ratio (national average)
Source; Statistics Bureau, MIC, “Consumer Price Index” and “Old-age Dependency Ratio,” the
Cabinet Office “Annual Report on Prefectural Accounts”
Aomori (37.3, 0.46)
Tokyo (27.1, -0.07)
Shimane (47.2, 0.20)
Okinawa (25.0, 0.15)
-0.1
0.0
0.1
0.2
0.3
0.4
0.5
20.0 25.0 30.0 35.0 40.0 45.0 50.0
Infla
tion
Old-age dependency ratio
(%)
0
10
20
30
40
50
60
-4.0
-3.0
-2.0
-1.0
0.0
1.0
2.0
3.0
4.0
5.0
6.0Inflation
Output gap
Old-age dependency ratio(right axis)
(%)

- 13 -
Considering the above data, we examine the following hypotheses.
𝜋𝜋𝑖𝑖,𝑡𝑡 = 𝛼𝛼∆𝑂𝑂𝑂𝑂𝑂𝑂𝑖𝑖,𝑡𝑡 + 𝜃𝜃𝑡𝑡 + 𝑢𝑢𝑖𝑖,𝑡𝑡 (1)
First, we conduct a brief test on the relationship between the inflation and aging rate. A
time trend term 𝜃𝜃𝑡𝑡 is added to control for common shocks across all prefectures in each
year, such as a consumption tax hike and monetary policy change. Although Liu and
Westelius (2016) indicate that 𝛼𝛼 is significantly negative (= deflationary), we expect it
to be positive (= inflationary) from Figure 1. If 𝛼𝛼 is not significant, it suggests that
factors other than aging affect prices.
𝜋𝜋𝑖𝑖,𝑡𝑡 = 𝛼𝛼∆𝑂𝑂𝑂𝑂𝑂𝑂𝑖𝑖,𝑡𝑡 + 𝛽𝛽𝑋𝑋𝑖𝑖,𝑡𝑡 + 𝜅𝜅𝜋𝜋𝑖𝑖,𝑡𝑡−1 + 𝜃𝜃𝑡𝑡 + 𝑢𝑢𝑖𝑖,𝑡𝑡 (2)
Based on the Phillips curve, it is plausible that the output gap and expected inflation
affect inflation, then we add these explanatory variables to the model. The prediction of
α, which is the biggest concern in this paper, is positive as in (1), and β is also positive
from the Phillips curve. If β is negative or non-significant, the relationship between the
output gap and inflation is inconsistent with the theory. As described above, we posit
that expectation is adaptive and use lagged inflation as expected inflation. This is
because obtaining data on the prefectural expected inflation rate is difficult, which is
one of the research constraints.
𝜋𝜋𝑖𝑖,𝑡𝑡 = 𝛼𝛼∆𝑂𝑂𝑂𝑂𝑂𝑂𝑖𝑖,𝑡𝑡 + 𝛽𝛽𝑋𝑋𝑖𝑖,𝑡𝑡 + 𝛾𝛾 (∆𝑂𝑂𝑂𝑂𝑂𝑂𝑖𝑖,𝑡𝑡 × 𝑋𝑋𝑖𝑖,𝑡𝑡) + 𝜅𝜅𝜋𝜋𝑖𝑖,𝑡𝑡−1 + 𝜃𝜃𝑡𝑡 + 𝑢𝑢𝑖𝑖,𝑡𝑡 (3)
Third, we add the cross-term between the old-age dependency ratio and output gap,
examining the synergistic effect. We expect that α and β are positive. Given that we can
obtain (𝛽𝛽 + 𝛾𝛾∆𝑂𝑂𝑂𝑂𝑂𝑂𝑖𝑖,𝑡𝑡)𝑋𝑋𝑖𝑖,𝑡𝑡 by arranging (3) for 𝑋𝑋𝑖𝑖,𝑡𝑡, if γ is positive, aging increases
inflationary pressure of output gap, and if γ is negative, aging decreases the pressure. If

- 14 -
γ is non-significant, aging and output gap affect inflation independently.
𝜋𝜋𝑖𝑖,𝑡𝑡 = 𝛼𝛼∆𝑂𝑂𝑂𝑂𝑂𝑂𝑖𝑖,𝑡𝑡 + 𝛽𝛽𝑋𝑋𝑖𝑖,𝑡𝑡 + 𝛾𝛾 (∆𝑂𝑂𝑂𝑂𝑂𝑂𝑖𝑖,𝑡𝑡 × 𝑋𝑋𝑖𝑖,𝑡𝑡) + 𝜁𝜁∆𝑃𝑃𝑂𝑂𝑃𝑃𝑖𝑖,𝑡𝑡 + 𝜅𝜅𝜋𝜋𝑖𝑖,𝑡𝑡−1 + 𝜃𝜃𝑡𝑡 + 𝑢𝑢𝑖𝑖,𝑡𝑡 (4)
In (4), we add the number of population as an explanatory variable. Population growth
increases not only aggregate demand but also aggregate supply, thus the impact of
population change on prices is unclear. If ζ is positive, population growth is inflationary
(population decline is deflationary) and if ζ is negative, population growth is
deflationary. When it is non-significant, population change does not affect prices. We
also look at how α changes when we consider population change. For example, if α
fluctuates significantly, it suggests that population has an indirect effect on prices
through aging. In addition, if α becomes non-significant, it means that it is not aging,
but population change that affects prices.
𝜋𝜋𝑖𝑖,𝑡𝑡 = 𝛼𝛼∆𝑂𝑂𝑂𝑂𝑂𝑂𝑖𝑖,𝑡𝑡 + 𝛽𝛽𝑋𝑋𝑖𝑖,𝑡𝑡 + 𝛾𝛾 (∆𝑂𝑂𝑂𝑂𝑂𝑂𝑖𝑖,𝑡𝑡 × 𝑋𝑋𝑖𝑖,𝑡𝑡) + 𝜁𝜁∆𝑃𝑃𝑂𝑂𝑃𝑃𝑖𝑖,𝑡𝑡 + 𝜂𝜂 (∆𝑂𝑂𝑂𝑂𝑂𝑂𝑖𝑖,𝑡𝑡 × ∆𝑃𝑃𝑂𝑂𝑃𝑃𝑖𝑖,𝑡𝑡) +
𝜅𝜅𝜋𝜋𝑖𝑖,𝑡𝑡−1 + 𝜃𝜃𝑡𝑡 + 𝑢𝑢𝑖𝑖,𝑡𝑡 (5)
Finally, we add the cross-term between the old-age dependency ratio and population,
examining the relationship between aging and population fluctuations. If α, ζ, and η are
all positive, aging and population growth have an inflationary synergistic effect on
prices. Given that we can obtain (𝛼𝛼 + 𝜂𝜂∆𝑃𝑃𝑂𝑂𝑃𝑃𝑖𝑖,𝑡𝑡)∆𝑂𝑂𝑂𝑂𝑂𝑂𝑖𝑖,𝑡𝑡 by arranging (5) for
∆𝑂𝑂𝑂𝑂𝑂𝑂𝑖𝑖,𝑡𝑡, population growth enhances the inflationary pressure of aging, and population
decline reduces the pressure. If α and ζ are positive and η is negative, population growth
suppresses the inflationary pressure of aging, though population decline increases the
pressure. If η is non-significant, aging and population change do not have the synergetic
effect on prices. As Yoon et al (2018) find that demography has a significant

- 15 -
deflationary impact particularly in a country experiencing a rapid decline and aging of
population, we expect η to be positive.
4 Estimation Results
4.1 Baseline case
The results of the estimation are shown in Table 2. Following the Breusch-Pagan test,15
we use robust standard errors.
Table 2. The Effect of the Old-age Dependency Ratio, Output Gap and Population
(1) (2) (3) (4) (5) (6)16
ΔODR 0.182*** (0.023)
0.153*** (0.023)
0.150*** (0.023)
0.159*** (0.023)
0.139*** (0.021)
0.180*** (0.029)
X 0.020*
(0.011) 0.084*** (0.025)
0.080*** (0.025)
0.074** (0.027)
0.066** (0.033)
ΔODR×X -0.019**
(0.008) -0.017** (0.008)
-0.015* (0.008)
-0.014 (0.009)
ΔPOP -0.166**
(0.081) 0.282* (0.164)
0.369 (0.246)
ΔODR×ΔPOP -0.129***
(0.046) -0.114***
(0.052) Fixed effects No No No No No Yes
Note: in percent.
Robust standard errors in parentheses, *, **, *** indicate significance at the 10%, 5%, and 1%
levels, respectively.
The model includes lagged inflation and a time trend with the variables above.
15 The Breusch-Pagan test is one of the methods of checking heteroscedasticity in error terms. Heteroscedasticity means that the larger the explanatory variable, the larger the variance of the explained variable. As ordinary least squares assumes homoscedasticity, we should use robust standard errors in the case of heteroscedasticity. 16 As mentioned above in footnote 8, (6) shows the result of a fixed effect model. The result is almost the same when fixed effects are considered.

- 16 -
The coefficient of the old-age dependency ratio, α is significant at a 1% level of
significance in all cases (1) to (5). The signs of the coefficients are all positive and
consistent with the hypotheses, suggesting that aging has inflationary pressure. In (5), α
is 0.139, meaning that when the old-age dependency ratio rises by 1%, 17 inflation
increases by about 0.14%. In other words, when the old-age dependency ratio doubles,
inflation increases by about 14%.
The coefficient of population change, ζ is negative in (4), but positive in (5), which
includes the cross-term between population change and the old-age dependency ratio.
This indicates that ζ in (4) contains the deflationary synergetic effect of aging and
population fluctuations.
The coefficient of the cross term, η was negative in (5), and this is not consistent
with the hypothesis. This result indicates that the synergistic effect of aging and
population decline has inflationary pressure. In (5), η is -0.129 and when the old-age
dependency ratio increases by 1% with 1% decline in population, inflation decreases by
about 0.01% (Δπ = 0.139 - 0.282 + 0.129). Thereby if the rate of change of the old-age
dependency ratio and population are the same levels, the inflationary pressure caused by
aging is almost offset by the deflationary pressure caused by population decline.
The coefficient of the output gap, β is positive and significant in all cases (2) to (5),
which is consistent with the Phillips curve theory. In (5), the coefficient of the cross term,
γ is -0.015. Given that we can obtain (𝛽𝛽 + 𝛾𝛾∆𝑂𝑂𝑂𝑂𝑂𝑂i,𝑡𝑡) 𝑋𝑋𝑖𝑖,𝑡𝑡 by arranging (5) for 𝑋𝑋𝑖𝑖,𝑡𝑡, aging
reduces inflationary pressure of the output gap. This suggests that the Phillips curve
flattens as the population ages, making prices unsusceptible to economic fluctuations. In
addition, β drastically increases and became significant at the significance level of 1% in
17 For example, it means the old-age dependency ratio increases from 20 to 20.2, not from 20 to 21.

- 17 -
(3), which means that the effect of the output gap in (2) includes a deflationary synergetic
effect that aging reduces inflationary pressure of the output gap.
4.2 Robustness Check
In 4.1, this paper showed demographic effects on prices, the prime concern of this
research. In 4.2, we check the robustness of the result.
Asako and Komaki (2007), estimating the regional Phillips curve in Japan, point
out that the coefficient of the output gap becomes non-significant when they consider
the effect of the population working in the manufacturing industry. This suggests that
the effects of demographic variables and output gap on prices, shown in 4.1, can be due
to a missing variable related to manufacturing.
𝜋𝜋𝑖𝑖,𝑡𝑡 = 𝛼𝛼∆𝑂𝑂𝑂𝑂𝑂𝑂𝑖𝑖,𝑡𝑡 + 𝛽𝛽𝑋𝑋𝑖𝑖,𝑡𝑡 + 𝛾𝛾 (∆𝑂𝑂𝑂𝑂𝑂𝑂𝑖𝑖,𝑡𝑡 × 𝑋𝑋𝑖𝑖,𝑡𝑡) + 𝜁𝜁∆𝑃𝑃𝑂𝑂𝑃𝑃𝑖𝑖,𝑡𝑡 + 𝜂𝜂 (∆𝑂𝑂𝑂𝑂𝑂𝑂𝑖𝑖,𝑡𝑡 × ∆𝑃𝑃𝑂𝑂𝑃𝑃𝑖𝑖,𝑡𝑡) +
𝜅𝜅𝜋𝜋𝑖𝑖,𝑡𝑡−1 + 𝜆𝜆𝜆𝜆𝑀𝑀𝑀𝑀𝑀𝑀𝑀𝑀𝑖𝑖,𝑡𝑡 + 𝜃𝜃𝑡𝑡 + 𝑢𝑢𝑖𝑖,𝑡𝑡 (8)
In (8), thus, we add ΔMANU to (5) as a variable relating to manufacturing. The analysis
period is, however, shortened (from 1998 to 2016) owing to the data constraint of the
employed population in the manufacturing industry, then we examine the effect of the
manufacturing variable by comparing (7) and (8). The only difference between (5) and
(7) is the analysis period.
As a manufacturing variable, we reference Asako and Komaki (2007) and use the
ratio of regular employees in manufacturing to the total number of employees by
prefecture. The prefectural number of employees is obtained from the Labor Force
Survey, and the number of regular employees in manufacturing is obtained from the
RESAS (Regional Economy Society Analysis System). Note that though Asako and

- 18 -
Komaki (2007) obtain the “total” number of manufacturing workers by region from the
Labor Force Survey, we substitute the number of “regular” manufacturing workers by
prefecture from the RESAS instead, because there is no prefectural data on the “total”
number of manufacturing workers.18 The results of the estimation are shown in Table 3.
Table 3. The Examination of the Manufacturing Factor’s Effect
(5) (7) (8)
ΔODR 0.139*** (0.021)
0.110*** (0.020)
0.106*** (0.020)
X 0.074** (0.027)
0.085*** (0.026)
0.065** (0.026)
ΔODR×X -0.015* (0.008)
-0.014* (0.008)
-0.013* (0.008)
ΔPOP 0.282* (0.164)
0.228 (0.157)
0.216 (0.159)
ΔODR×ΔPOP -0.129***
(0.046) -0.109** (0.043)
-0.095** (0.043)
ΔMANU 0.040***
(0.010) Period 1996-2016 1998-2016 1998-2016
Note: in percent.
Robust standard errors in parentheses, *, **, *** indicate significance at the 10%, 5%, and 1%
levels, respectively.
The model includes lagged inflation and a time trend with the variables above.
In (7), with the analysis period shortened, the coefficient of the total population, ζ
becomes non-significant, but others change slightly. In (8), λ is significantly positive,
suggesting that a 1%19 rise in the manufacturing ratio increases inflation by 0.04%.
18 The difference between the “total” and “regular” number of workers is that “total” includes temporary employees. 19 For example, it means the manufacturing ratio increases from 10% to 10.1%, not from 10% to

- 19 -
Nevertheless, the result of (8) shows that demography and output gap still affect
inflation, even if a manufacturing factor is taken into account.
𝜋𝜋𝑖𝑖,𝑡𝑡 = 𝛼𝛼∆𝑂𝑂𝑂𝑂𝑂𝑂𝑖𝑖,𝑡𝑡 + 𝛽𝛽𝑋𝑋𝑖𝑖,𝑡𝑡 + 𝛾𝛾 (∆𝑂𝑂𝑂𝑂𝑂𝑂𝑖𝑖,𝑡𝑡 × 𝑋𝑋𝑖𝑖,𝑡𝑡) + 𝜁𝜁∆𝑃𝑃𝑂𝑂𝑃𝑃𝑖𝑖,𝑡𝑡 + 𝜂𝜂 (∆𝑂𝑂𝑂𝑂𝑂𝑂𝑖𝑖,𝑡𝑡 × ∆𝑃𝑃𝑂𝑂𝑃𝑃𝑖𝑖,𝑡𝑡) +
𝜅𝜅𝜋𝜋𝑖𝑖,𝑡𝑡−1 + 𝜃𝜃𝑡𝑡 + 𝑢𝑢𝑖𝑖,𝑡𝑡 (9)
In addition, as another robustness testing, we use the percentage of the population aged
65 and over (ΔOLD) as an indicator of aging, instead of the old-age dependency ratio
(ΔODR). The results of the estimation are shown in Table 4.
Table 4. The Substitution of the Rate of Aging for the Old-age Dependency Ratio
(5) (9)
ΔOLD 0.139*** (0.021)
0.198*** (0.029)
X 0.074** (0.027)
0.087*** (0.028)
ΔOLD×X -0.015* (0.008)
-0.024** (0.010)
ΔPOP 0.282* (0.164)
0.292* (0.163)
ΔOLD×ΔPOP -0.129***
(0.046) -0.179** (0.056)
Note: in percent.
Robust standard errors in parentheses, *, **, *** indicate significance at the 10%, 5%, and 1%
levels, respectively.
The model includes lagged inflation and a time trend with the variables above.
Table 4 shows the result of the aging rate as an aging variable instead of the old-
age dependency ratio. In (9), the coefficient of aging, μ is 0.198, suggesting that aging is
11%.
- 20 -
still inflationary. Looking at other variables, there are no notable changes in the values
and significance level, thus we assure the robustness of the result shown in 4.1.
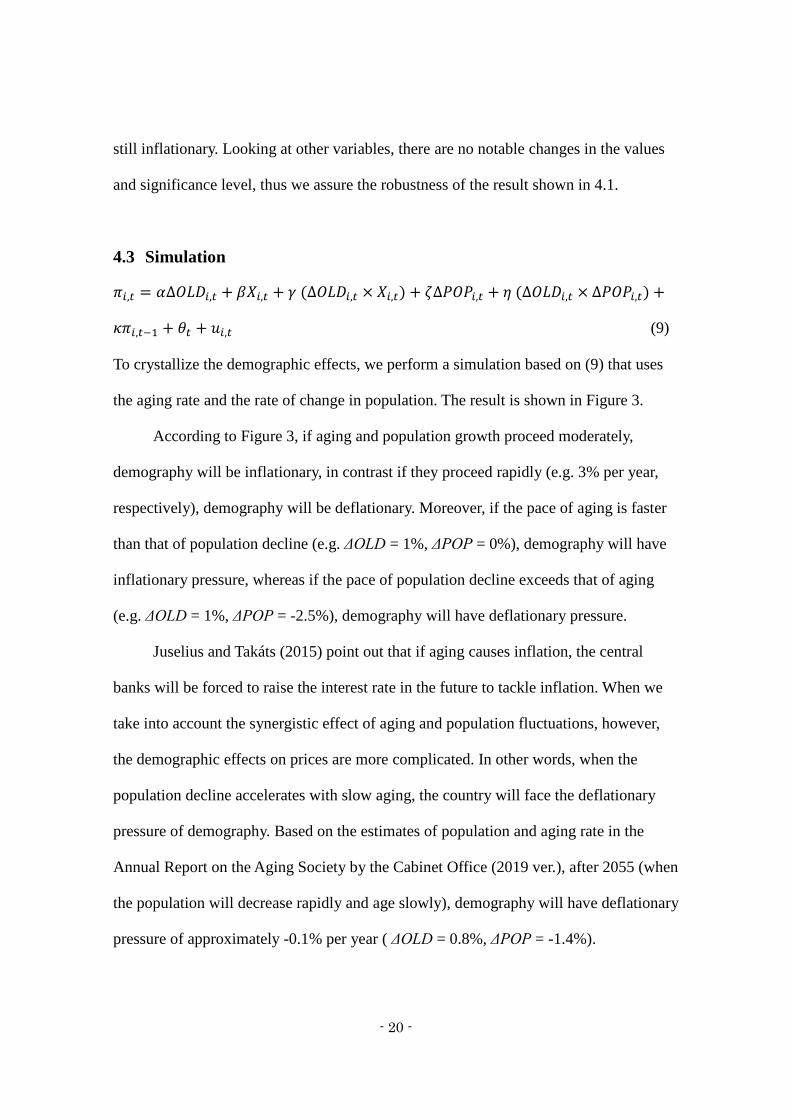
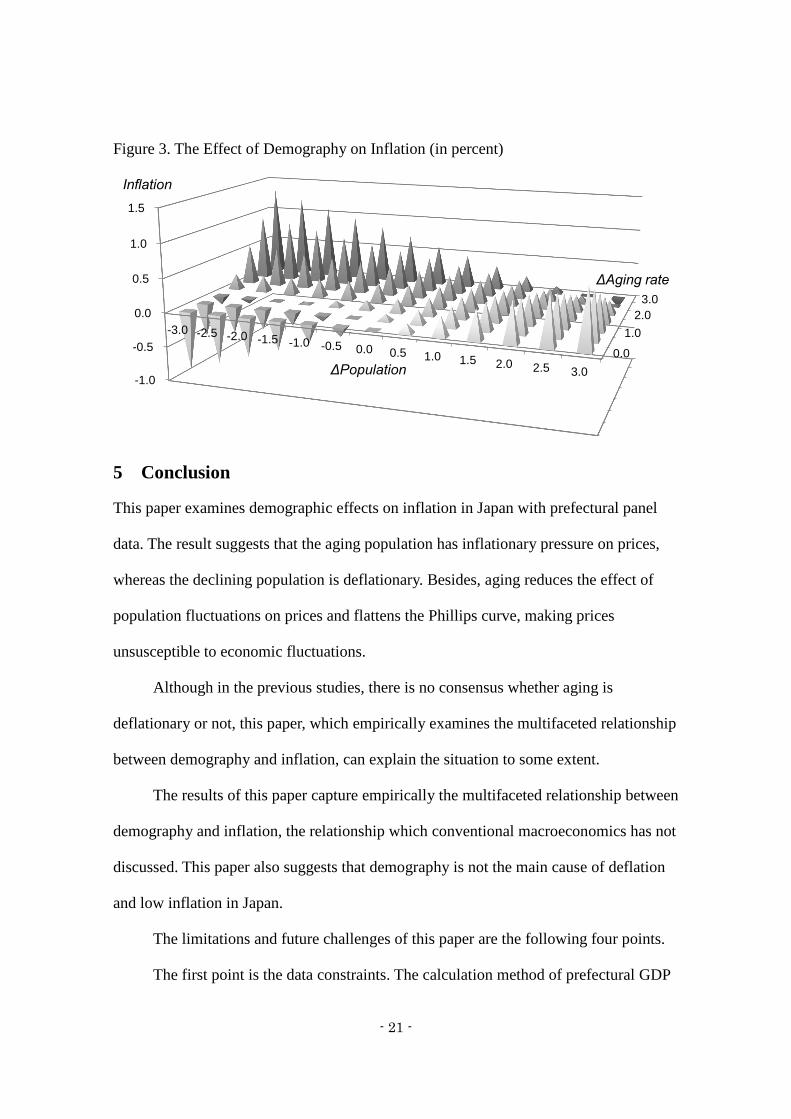
4.3 Simulation
𝜋𝜋𝑖𝑖,𝑡𝑡 = 𝛼𝛼∆𝑂𝑂𝑂𝑂𝑂𝑂𝑖𝑖,𝑡𝑡 + 𝛽𝛽𝑋𝑋𝑖𝑖,𝑡𝑡 + 𝛾𝛾 (∆𝑂𝑂𝑂𝑂𝑂𝑂𝑖𝑖,𝑡𝑡 × 𝑋𝑋𝑖𝑖,𝑡𝑡) + 𝜁𝜁∆𝑃𝑃𝑂𝑂𝑃𝑃𝑖𝑖,𝑡𝑡 + 𝜂𝜂 (∆𝑂𝑂𝑂𝑂𝑂𝑂𝑖𝑖,𝑡𝑡 × ∆𝑃𝑃𝑂𝑂𝑃𝑃𝑖𝑖,𝑡𝑡) +
𝜅𝜅𝜋𝜋𝑖𝑖,𝑡𝑡−1 + 𝜃𝜃𝑡𝑡 + 𝑢𝑢𝑖𝑖,𝑡𝑡 (9)
To crystallize the demographic effects, we perform a simulation based on (9) that uses
the aging rate and the rate of change in population. The result is shown in Figure 3.
According to Figure 3, if aging and population growth proceed moderately,
demography will be inflationary, in contrast if they proceed rapidly (e.g. 3% per year,
respectively), demography will be deflationary. Moreover, if the pace of aging is faster
than that of population decline (e.g. ΔOLD = 1%, ΔPOP = 0%), demography will have
inflationary pressure, whereas if the pace of population decline exceeds that of aging
(e.g. ΔOLD = 1%, ΔPOP = -2.5%), demography will have deflationary pressure.
Juselius and Takáts (2015) point out that if aging causes inflation, the central
banks will be forced to raise the interest rate in the future to tackle inflation. When we
take into account the synergistic effect of aging and population fluctuations, however,
the demographic effects on prices are more complicated. In other words, when the
population decline accelerates with slow aging, the country will face the deflationary
pressure of demography. Based on the estimates of population and aging rate in the
Annual Report on the Aging Society by the Cabinet Office (2019 ver.), after 2055 (when
the population will decrease rapidly and age slowly), demography will have deflationary
pressure of approximately -0.1% per year ( ΔOLD = 0.8%, ΔPOP = -1.4%).
- 21 -
Figure 3. The Effect of Demography on Inflation (in percent)
5 Conclusion
This paper examines demographic effects on inflation in Japan with prefectural panel
data. The result suggests that the aging population has inflationary pressure on prices,
whereas the declining population is deflationary. Besides, aging reduces the effect of
population fluctuations on prices and flattens the Phillips curve, making prices
unsusceptible to economic fluctuations.
Although in the previous studies, there is no consensus whether aging is
deflationary or not, this paper, which empirically examines the multifaceted relationship
between demography and inflation, can explain the situation to some extent.
The results of this paper capture empirically the multifaceted relationship between
demography and inflation, the relationship which conventional macroeconomics has not
discussed. This paper also suggests that demography is not the main cause of deflation
and low inflation in Japan.
The limitations and future challenges of this paper are the following four points.
The first point is the data constraints. The calculation method of prefectural GDP
0.01.0
2.03.0
-1.0
-0.5
0.0
0.5
1.0
1.5
-3.0 -2.5 -2.0 -1.5 -1.0 -0.5 0.0 0.5 1.0 1.5 2.0 2.5 3.0ΔPopulation
Inflation
ΔAging rate

- 22 -
was changed in 1996, limiting the analysis period of this research, despite the
abundance of other data. In general, it is thought that longer-term analysis with greater
fluctuations is better when it comes to dealing with demography. In fact, the coefficient
of population becomes non-significant in (7), when the analysis period is shortened.
Besides, longer-term data enable us to confirm the robustness by changing the analysis
period. Moreover, the expected inflation is theoretically one of the determinants of
inflation, but we cannot obtain the prefectural data. As Asako and Komaki (2007)
calculate the regional expected inflation, likewise, there may be room for calculating the
regional expected inflation here, too.
Second, though we use the old-age dependency ratio as a variable related to
aging, we can refine our study with more detailed data, such as the number of
population by 5-year age groups.
Third, external validity is an inherent problem in all studies that deal with the
relationship between population dynamics and prices. As mentioned above, the paths
through which demography affects inflation vary, it is difficult to generalize
theoretically the net effect of demography; the mechanism has not been established.
Thus, the results of this paper, focusing on Japan over the two decades (from 1996 to
2016), may be valid only for a certain period, in a certain country and under certain
conditions (e.g. demographic and economic structure), and cannot apply to other
countries immediately.
Finally, the fourth point is the nature of variables. For instance, since the aging
variable is the rate of change and indicates the speed of aging, the result of this paper
asserts that the demographic impact on inflation is determined by the speed of aging and

- 23 -
population decline, and it is not clear whether the aging society itself is inflationary.20
In other words, we are not sure of the stock effect of aging, or which prefecture has
more inflationary pressure, compared to prefectures with an aging rate of 50% and 60%.
In conclusion, in this field of demography and inflation, we should clarify the
mechanism through which demography affects prices by the following steps: (1)
conducting single-country analysis, which is easier to control for variables compared
with cross-country analysis, in aging countries, (2) examining the factors attributed to
differences among countries.
20 We conduct a simple analysis of the stock effect of aging in the following Appendix.

- 24 -
Appendix
𝜋𝜋𝑖𝑖,𝑡𝑡 = 𝛼𝛼𝑂𝑂𝑂𝑂𝑂𝑂𝑖𝑖,𝑡𝑡 + 𝛽𝛽𝑋𝑋𝑖𝑖,𝑡𝑡 + 𝛾𝛾 (𝑂𝑂𝑂𝑂𝑂𝑂𝑖𝑖,𝑡𝑡 × 𝑋𝑋𝑖𝑖,𝑡𝑡) + 𝜁𝜁∆𝑃𝑃𝑂𝑂𝑃𝑃𝑖𝑖,𝑡𝑡 + 𝜂𝜂 (𝑂𝑂𝑂𝑂𝑂𝑂𝑖𝑖,𝑡𝑡 × ∆𝑃𝑃𝑂𝑂𝑃𝑃𝑖𝑖,𝑡𝑡) +
𝜅𝜅𝜋𝜋𝑖𝑖,𝑡𝑡−1 + 𝜃𝜃𝑡𝑡 + 𝑢𝑢𝑖𝑖,𝑡𝑡 (10)
As a supplemental discussion, this paper shows a brief analysis of the issue mentioned
in Section 5, whether the aging society itself has inflationary pressure. Specifically, we
use the figure of the old-age dependency ratio in (10), instead of ΔODR.21 The results
of the estimation are shown in Table 5.
Table 5. The Stock Effect of Aging
(5) (10)
ODR 0.139*** (0.021)
0.017** (0.009)
X 0.074** (0.027)
0.049 (0.057)
ODR×X -0.015* (0.008)
-0.001 (0.002)
ΔPOP 0.282* (0.164)
0.628** (0.292)
ODR×ΔPOP -0.129***
(0.046) -0.014* (0.008)
Note: in percent.
Robust standard errors in parentheses, *, **, *** indicate significance at the 10%, 5%, and 1%
levels, respectively.
The model includes lagged inflation and a time trend with the variables above.
The result suggests that an aging society has a slight inflationary pressure
compared to a young society. Considering α = 0.017, a society where the old-age
21 The old-age dependency ratio is time-series data that monotonically increases with time and has no stationarity (expectations and autocovariances change over time), thus there is a concern about spurious regression, but it is thought that there is no such problem because other variables in the model are likely to have stationarity.

- 25 -
dependency ratio is 10 points higher than others, the society has inflationary pressure of
about 0.2%. There are great differences, however, between the result of (5) and (10) in
the magnitude and significance level of each coefficient, while the signs are the same.
This differences arising from the treatment of the old-age dependency ratio
indicate that it is necessary to distinguish “aging speed” from “aging itself” when
analyzing the effect of aging on prices.

- 26 -
References
1. Asako, K. and Komaki Y. (2007) “Chiiki betu filippusu kyokusen to sanngyou kouzou”
(in Japanese), Journal of Socio Economic Research, 55(1) 3-29.
2. Arellano, C (2008) “Default Risk and Income Fluctuations in Emerging Economies,”
American Economic Review, 98(3) 690-712.
3. Hamilton, J. D. (2018) “Why you should never use the Hodrick-Prescott filter,”
Review of Economics and Statistics, 100(5) 831-843.
4. Imam, P. A. (2013) “Shock from Graying: Is the Demographic Shift Weakening
Monetary Policy Effectiveness,” IMF Working Paper, No.13/191.
5. Juselius, M. and Takáts, E. (2015) “Can demography affect inflation and monetary
policy?” BIS Working Paper, No.485.
6. Katagiri, M. et al (2019) “Aging and deflation from a fiscal perspective,” Journal of
Monetary Economics, 111(1) 1-15.
7. Leahy, J. V and Thapar, A. (2019) “Demographic Effects on the Impact of Monetary
Policy,” the National Bureau of Economic Research Working Paper, No.26324,
8. Liu, Y. and Westelius, N. (2016) “The Impact of Demographic on Productivity and
Inflation in Japan,” IMF Working Paper, No.16/237.
9. Shirakawa, M (2012) “Demographic Changes and Macroeconomic Performance:
Japanese Experiences,” Opening Remark at 2012 BOJ-IMES Conference.
10. Yoon, J. W. et al (2018) “Impact on Demographic Changes on Inflation and the
Macroeconomy,” KDI Journal of Economic Policy, 40(1) 1-30.
Related Documents