SCHOOL OF ECONOMICS AND FINANCE Discussion Paper 2008-07 Demographic Demand Systems with Application to Equivalence Scales Estimation and Inequality Analysis: The Australian Evidence Paul Blacklow Aaron Nicholas Ranjan Ray ISSN 1443-8593 ISBN 978-1-86295-511-0

Welcome message from author
This document is posted to help you gain knowledge. Please leave a comment to let me know what you think about it! Share it to your friends and learn new things together.
Transcript

SCHOOL OF ECONOMICS AND FINANCE
Discussion Paper 2008-07
Demographic Demand Systems with Application to Equivalence Scales Estimation and Inequality Analysis:
The Australian Evidence
Paul Blacklow Aaron Nicholas
Ranjan Ray
ISSN 1443-8593 ISBN 978-1-86295-511-0

1
DEMOGRAPHIC DEMAND SYSTEMS WITH APPLICATION TO EQUIVALENCE SCALES ESTIMATION AND
INEQUALITY ANALYSIS:
THE AUSTRALIAN EVIDENCE*
by
Paul Blacklow Aaron Nicholas Ranjan Ray**
School of Economics and Finance
University of Tasmania Hobart 7001
Department of Economics Clayton Campus
Monash University VIC 3800
Department of Economics Clayton Campus
Monash University VIC 3800
December, 2008
*The research for this paper was funded by an Australian Research Council Discovery Grant (DP 0773489). The authors are grateful to the Australian Bureau of Statistics for their permission to use the HES unit record data sets.
**Corresponding author. E-mail: [email protected]

2
ABSTRACT
This paper proposes and applies an alternative demographic procedure for extending a demand system to allow for the effect of household size and composition changes, along with price changes, on expenditure allocation. The demographic procedure is applied to two recent demand functional forms to obtain their estimable demographic extensions. The estimation on pooled time series of Australian Household Expenditure Surveys yields sensible and robust estimates of the equivalence scale, and of its variation with relative prices. Further evidence on the usefulness of this procedure is provided by using it to evaluate the nature and magnitude of the inequality bias of relative price changes in Australia over a period from the late 1980s to the early part of the new millennium.
Keywords: Equivalence scales; Rank Three demand, Modified Almost Ideal Demand System, Engel Curve.
JEL Classification: C13, D12, D31, D63
3
1. INTRODUCTION
Demand systems are, traditionally, derived from a priori specified individual utility functions
that assume individual utility maximising behaviour subject to her/his budget constraint. This
posed a problem in empirical applications since individuals reside in households and the
household, rather than the individual, is the unit of behaviour. Moreover, the data set is,
typically, available at the household level, necessitating the incorporation of household size
and composition variables, along with prices and aggregate expenditure, as determinants of
demand. While the earlier studies on the impact of household size and composition changes
on expenditure patterns were ad hoc [see, for example, Prais and Houthakker (1955)] and
ignored temporal price variation, being based on a single cross section, Barten (1964)’s
introduction of household utility models allowed the specification and estimation of utility-
consistent demographic demand systems [see Pollak and Wales (1992), especially Ch. 3].
The demographic generalisation of conventional demand systems, while providing a superior
analysis of expenditure patterns, also, allows a wide variety of policy applications ranging
from the estimation of equivalence scales to the design of taxes. The chief motivation of this
paper is to explore the policy usefulness of demographic demand systems by using the
estimated demand parameters in selected policy applications. This paper proposes two
alternative demographic demand systems and illustrates their policy usefulness in calculating
equivalence scales and in assessing the impact of prices on expenditure inequality.
This study is based on the demographic generalisation of two recent demand models, namely,
the Quadratic Almost Ideal Demand System (QAIDS) [see Banks, Blundell and Lewbel
(1997)] and the Modified Almost Ideal Demand System (MAIDS) due to Cooper and
McLaren (1992). Both these demand systems extend the Almost Ideal Demand System
(AIDS), due to Deaton and Muellbauer (1980), to allow more flexible price and Engel
responses. However, while QAIDS is a rank 3 demand system with independent price and
income coefficients and allows non-monotonic relationship between the budget share of an
item and household expenditure, MAIDS retains the rank 2 feature of AIDS and imposes a
monotonic relationship. However, as Cooper and McLaren (1992, p.652) show, MAIDS
“preserves regularity in a wider region of expenditure price space” than AIDS.
The present study uses different demographic techniques on these demand systems to obtain
their demographic generalisations in estimable form. This sets up an interesting comparison
between the estimates of the basic demand parameters and of the equivalence scales from the

4
alternative demands systems. The paper also highlights the policy usefulness of the
demographically extended QAIDS by using the parameter estimates to assess the impact of
price movements on expenditure inequality.
The study is carried out on unit records contained in Australian Household Expenditure
Surveys (HES) pooled over a period of nearly 15 years. The choice of the data set generates
interest in the findings since the period covered includes a brief period of recession followed
by an uninterrupted period of low unemployment, high growth rates, GST changes and
overall economic prosperity. Australia is, thus, often cited as a model example among the
developed countries.
The plan of this paper is as follows. Section 2 derives the demographic demand models.
Section 3 describes the data, presents the demographic demand estimates and compares the
Engel curves implied by the alternative demographic demand models. The evidence on the
impact of price changes on inequality is presented in section 4. The paper ends on the
concluding note of section 5.
2. THE DEMOGRAPHIC DEMAND SYSTEMS
In non demographic form, the cost function of QAIDS is given, in logarithmic form, by
where a(p) is homogenous of degree 1 in prices, p, b(p) and c(p) are homogenous of degree 0 in p. The choice of the following functional forms for a(p), b(p) and c(p) yields the QAIDS.
5
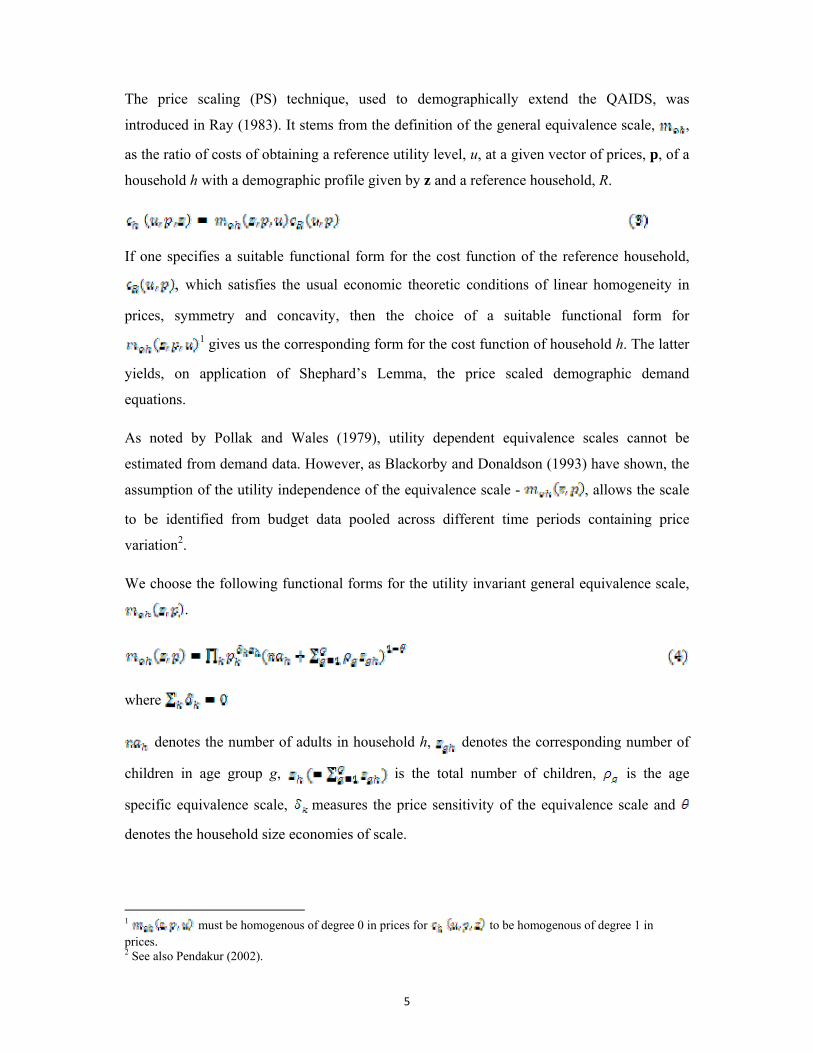
The price scaling (PS) technique, used to demographically extend the QAIDS, was
introduced in Ray (1983). It stems from the definition of the general equivalence scale, ,
as the ratio of costs of obtaining a reference utility level, u, at a given vector of prices, p, of a
household h with a demographic profile given by z and a reference household, R.
If one specifies a suitable functional form for the cost function of the reference household, , which satisfies the usual economic theoretic conditions of linear homogeneity in
prices, symmetry and concavity, then the choice of a suitable functional form for 1 gives us the corresponding form for the cost function of household h. The latter
yields, on application of Shephard’s Lemma, the price scaled demographic demand
equations.
As noted by Pollak and Wales (1979), utility dependent equivalence scales cannot be
estimated from demand data. However, as Blackorby and Donaldson (1993) have shown, the
assumption of the utility independence of the equivalence scale - , allows the scale
to be identified from budget data pooled across different time periods containing price
variation2.
We choose the following functional forms for the utility invariant general equivalence scale,
.
where
denotes the number of adults in household h, denotes the corresponding number of
children in age group g, is the total number of children, is the age
specific equivalence scale, measures the price sensitivity of the equivalence scale and
denotes the household size economies of scale.
1 must be homogenous of degree 0 in prices for to be homogenous of degree 1 in prices. 2 See also Pendakur (2002).

6
The choice of (1), (2a)-(2c) as the cost function of the reference household, in conjunction
with the price scaling (PS) demographic technique outlined above, yields the
demographically extended QAIDS, to be referred to as PS-QAIDS. In budget share terms, ,
is given as follows:
where denotes the nominal expenditure of household h. In the estimations that are reported
below, we set a priori at zero. Note that (5) specialises to the non-demographic QAIDS if
the demographic parameters, namely, , , are all zero. The conventional AIDS model is
obtained as a further specialisation if for all i. Note, from (5), that the equivalence
scale’s price sensitivity parameter, , can also be interpreted as the effect of the marginal
child on the budget share of item i for a household at subsistence level (u=0).
Unlike AIDS or QAIDS, the modified Almost Ideal Demand System (MAIDS), as introduced
in Cooper and McLaren (1992), does not have an explicit representation of its cost or
expenditure function. Consequently, the cost function based price scaling demographic
technique cannot be applied in this case. An alternative demographic procedure that
demographically modifies the utility function and retains the spirit of the PS in allowing price
sensitivity of the equivalence scale is proposed in this case. In non-demographic form, the
indirect utility function of MAIDS is given by:
where (as before) denotes nominal expenditure of household h; , are functions of
prices, and are homogenous of degree 1 and η, respectively, in p. Equation (6), which is a

7
characterisation of MPIGLOG preferences, specialises to PIGLOG if . Note, also, that
the demand systems generated by MPIGLOG preferences are members of the family of
fractional demand systems discussed in Lewbel (1987).
The demographic extension of the MPIGLOG indirect utility form that we propose3 involves
replacing by , namely, the nominal expenditure per adult equivalent, where
[given by eqn. (4)] is the price dependent, but utility invariant, equivalence scale. The
demographically modified MPIGLOG utility form is given by:
where
These equations above could be more easily be specified as:
( )*1 1,h hP m P= p z and ( )( )*
2 2,h hP m Pη
= p z as mh(p,z) has already been specified.
The symbols are as defined before, and The application of Roy’s identity to the
indirect utility form, eqn. (7), yields the demographically modified MAIDS, to be referred to
as the demographically modified MAIDS or DMMAIDS, as follows:
where
3 See Blacklow, Cooper, Ham and McLaren (2006) for an alternative demographic extension of MPIGLOG preferences.
8
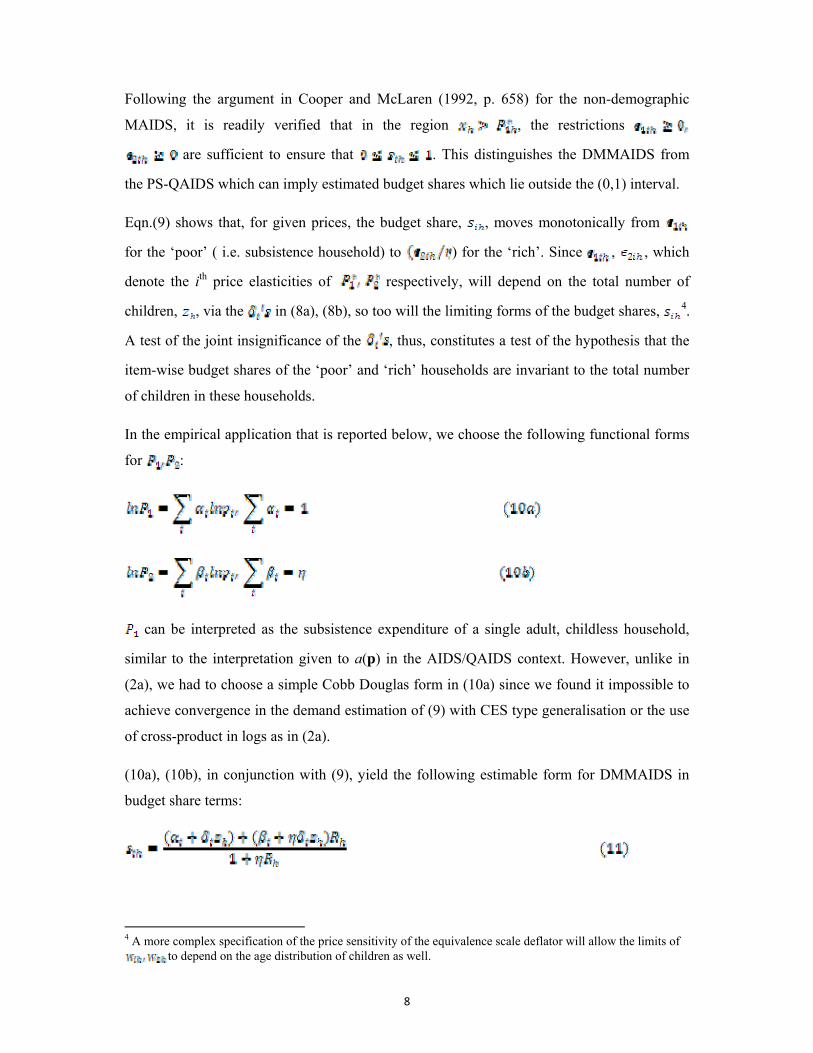
Following the argument in Cooper and McLaren (1992, p. 658) for the non-demographic
MAIDS, it is readily verified that in the region , the restrictions
are sufficient to ensure that . This distinguishes the DMMAIDS from
the PS-QAIDS which can imply estimated budget shares which lie outside the (0,1) interval.
Eqn.(9) shows that, for given prices, the budget share, , moves monotonically from
for the ‘poor’ ( i.e. subsistence household) to ) for the ‘rich’. Since , , which
denote the ith price elasticities of respectively, will depend on the total number of
children, , via the in (8a), (8b), so too will the limiting forms of the budget shares, 4
A test of the joint insignificance of the , thus, constitutes a test of the hypothesis that the
item-wise budget shares of the ‘poor’ and ‘rich’ households are invariant to the total number
of children in these households.
In the empirical application that is reported below, we choose the following functional forms
for :
can be interpreted as the subsistence expenditure of a single adult, childless household,
similar to the interpretation given to a(p) in the AIDS/QAIDS context. However, unlike in
(2a), we had to choose a simple Cobb Douglas form in (10a) since we found it impossible to
achieve convergence in the demand estimation of (9) with CES type generalisation or the use
of cross-product in logs as in (2a).
(10a), (10b), in conjunction with (9), yield the following estimable form for DMMAIDS in
budget share terms:
4 A more complex specification of the price sensitivity of the equivalence scale deflator will allow the limits of
to depend on the age distribution of children as well.

9
where is the log of real expenditure per adult equivalent, and
is given by (4). Eqn. (11) is similar to the Gorman (1976) demographic
specification in allowing sophisticated demographic effects. As with the Gorman (1976)
model, in the DMMAIDS model, given by eqn. (11), the number of children, , affects the
budget shares through the real expenditure per adult equivalent variable, , and its
coefficient, The latter effect is missing in case of the AIDS model which
assumes There is also a fixed cost demographic effect through the subsistence budget
share The addition of a child has a lateral effect on the item-wise budget shares
of a subsistence household similar to that in the QAIDS model. As we turn to the
empirical results, it is worth noting that several of the parameters have similar interpretations
in the PS-QAIDS and DMMAIDS models, making a comparison of their estimates of some
interest.
3. DATA SETS AND DEMOGRAPHIC DEMAND ESTIMATES
The estimation and analysis are based on a pooled cross-section of the unit record files from
the Household Expenditure Survey (HES) conducted by the ABS for the years 1988/9,
1993/4, 1998/9 and 2003/4. The household is chosen as the unit of analysis. The estimation
and analysis was based on the full sample of 29463 observations over the four HES data sets
(7225 households in 1988, 8389 in 1993, 6892 in 1998 and 6957 in 2003). The following 9
item breakdown of household expenditure was used: Accommodation (i=1); Electricity and
Household Fuel (i=2); Food and Non-alcoholic Beverages (i=3); Alcohol and Tobacco (i=4);
Clothing and Footwear (i=5); Health and Personal Care (i=6); Transport (i=7); Recreation
(i=8); and Miscellaneous items including Credit Charges and Education (i=9). The price
series used was based on the ABS (2008a) Consumer Price Index quarterly series by Groups,
Sub-groups and Expenditure Class but re-weighted using ABS(2005) to match the HES
Commodity List. The constructed price series was matched with each quarter and
state/territory that the HES was carried out in and based at the end of the second quarter of
1988. Children were split into the following three age groups: children under 5 years of age
( ), those aged between 5 and 14 years ( ) and the number of dependents or students aged
15 to 23 years ( ).

10
Tables 1 and 2 present the parameter estimates of the demographic demand systems, namely,
the PS-QAIDS and DMMAIDS demand models. Both these models represent significant
improvements over the nested AIDS model. This is evident from the strong statistical
significance of the quadratic coefficients, , in the case of the PS-QAIDS and 5 in the case
of the DMMAIDS model. The demographic effects are, also, highly significant in most cases.
Both the models agree that household behaviour exhibits significant economies of scale with
the estimate being significantly different from zero in both cases. The estimates of the
parameters that scale household expenditure ( ) are remarkably robust between the two
demand systems. The , which show the sensitivity of the overall equivalence scale to
prices are, also, highly significant and robust between the two demand systems. Using the
alternative interpretation of the discussed above, both the demand models agree that the
marginal addition of a child increases the budget share of Food and decreases that of Alcohol
and Tobacco for a household living at subsistence level.
Notwithstanding the fact that DMMAIDS is considerably more parsimonious in parameters
than the PS-QAIDS, the log likelihood is only marginally lower so that, on Akaike criterion,
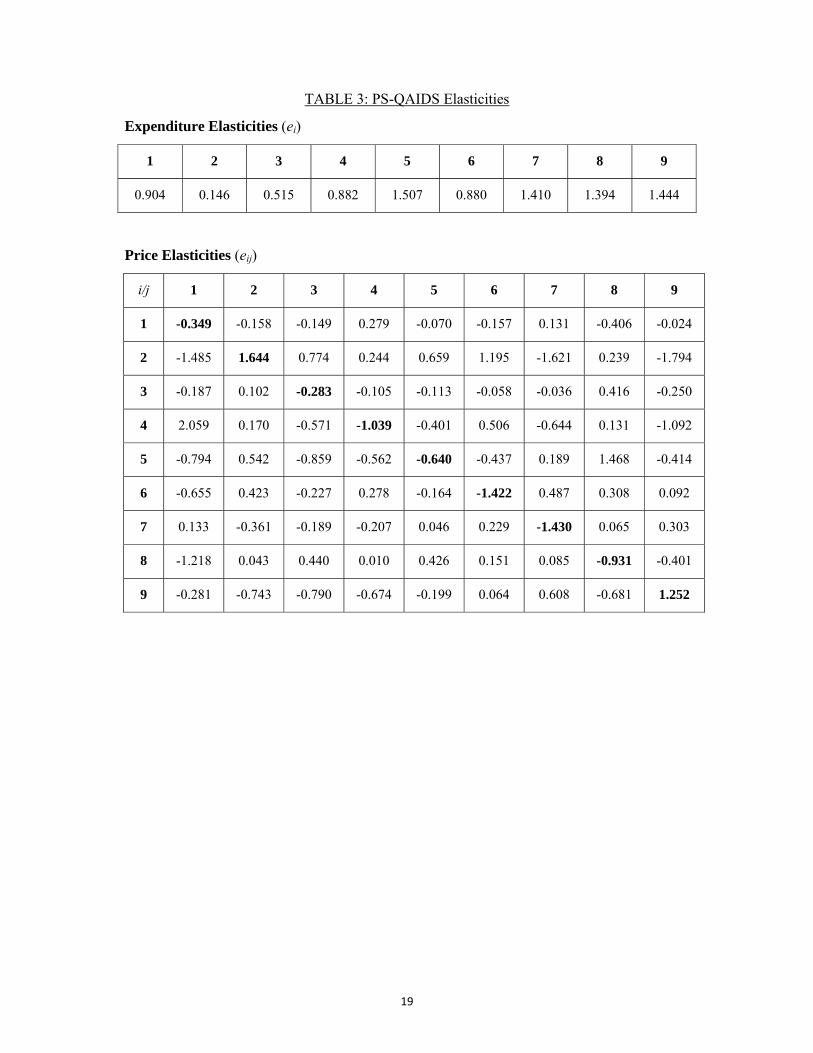
DMMAIDS is the preferred model. Tables 3 and 4 present the expenditure and price
elasticities implied by the two sets of demand estimates, and calculated at the sample means
in the 2003/4 HES and at 2003/4 prices. The expenditure elasticites are fairly robust between
the two demand systems but this does not extend to the price elasticities. The DMMAIDS
price elasticities are generally more plausible than the PS-QAIDS elasticities with the latter
recording positive own price elasticities for item 2 (Electricity and Household Fuel) and item
9 (Miscellaneous, Credit Charges and Education).
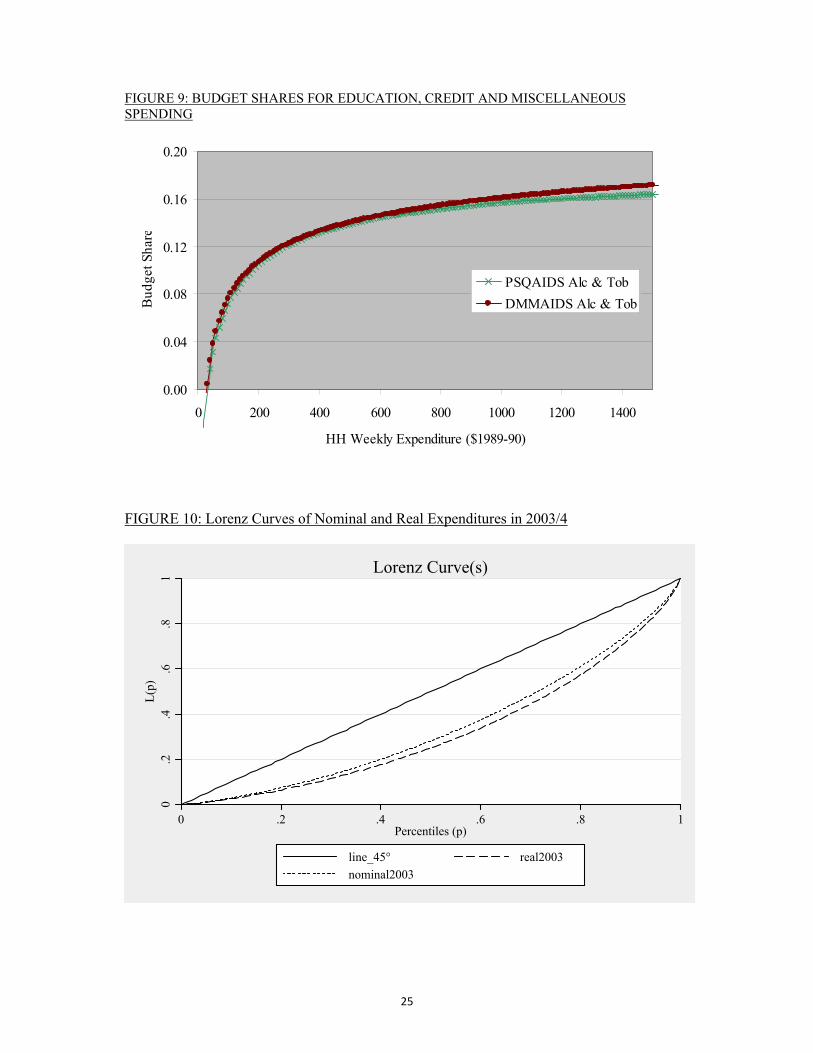
The Engel curves corresponding to the two sets of demand estimates are presented in Figs 1-
9. Each figure compares the Engel curves between the PS-QAIDS and DMMAIDS models.
The shape of the Engel curves is generally robust with the significant exceptions being
Clothing and Footwear (i=5) and Health and Personal care (i=6). Clothing illustrates an
advantage of the PS-QAIDS over the DMMAIDS since the non-monotonic relationship
between budget share and aggregate expenditure – permitted by the former but not the latter –
allows the Engel curve of this item to bend backwards. In contrast to Clothing, there is
remarkable similarity between the two Engel curves in case of Electricity and Household
5 The estimate of , which represents the generalisation of MAIDS over AIDS is highly sensitive to demographic effects, increasing from 0.44 for DMMAIDS to 0.73 for MAIDS.

11
Fuel, especially in the lower expenditure levels. In general, while the two curves track one
another quite closely in the middle expenditure ranges, wide differences open up at the two
extremes of the expenditure spectrum. For example, in relation to DMMAIDS, PS-QAIDS
understates the predicted budget share of Food quite substantially at the higher expenditure
levels. More seriously, since a cut off level of budget share of Food is often used, (based on
Engel’s law) to define the poverty line [see Lancaster, Ray and Valenzuela (1999)], the sharp
divergence between the two Engel curves for Food at the lower expenditure levels has
significant implications for poverty enumeration and identification of “food insecure”
households. If one adopts a Food budget share cut off of 0.5 or higher, then the DMMAIDS
model yields a much higher poverty line and a larger number of food insecure households
than the PS-QAIDS model. The graphs also show that the concern expressed by the MAIDS
authors, Cooper and McLaren (1992) over the PIGLOG based models yielding predicted
budget shares that lie outside the (0,1) range appears misplaced since in all cases they are
well within the range.
4. THE DISTRIBUTIONAL IMPLICATIONS OF PRICE MOVEMENTS IN
AUSTRALIA
This section illustrates the policy usefulness of the demographic demand estimates, presented
earlier, in evaluating the distributional implications of relative price movements in Australia.
Inflation that is accompanied by a significant change in the relative prices of the principal
items of consumption affects the various household groups differently due to differences in
their expenditure pattern. For example, Muellbauer (1974) shows that “relative consumer
price changes in the U.K. since 1964 have had an inequality increasing bias”. Ray (1985)
extended Muellbauer (1974)’s methodology to allow non-linear Engel curves, while
continuing to work with rank 2 preferences that assume a monotonic relationship between
budget share and aggregate expenditure.
In this section, we extend the methodology further by working within the framework of rank
3 demand systems. The PS-QAIDS has a definite edge over DMMAIDS in this welfare
application since, besides allowing independence between the linear and quadratic
expenditure coefficients in the budget share equation, PS-QAIDS has an explicit cost
function representation that makes it suitable for analysis of the distributional implications of

12
relative price changes. The DMMAIDS, which defines the expenditure function only
implicitly, is handicapped in this respect.
A comparison of the nominal and real expenditure inequalities throws light on the inequality
implications of price movements. The PS-QAIDS cost function of household h in year t is
given as follows:
where is the nominal expenditure of the household and is the utility measure in year t.
Following Muellbauer (1974, pg 42), we define real equivalent expenditure of household h in year t,
, as the minimum expenditure needed to obtain current year utility, at base year price, . In
other words:
The application of (13) in (12) yields, after some rearrangement, the following expression for
real expenditure in the PS-QAIDS case:
where is the price invariant component of the equivalence scale,
and are given in (2a)-(2c), evaluated at year t. It is readily verified from (14) that in
the base year the real and nominal expenditures are equal (i.e. ) and consequently,
the nominal and real expenditure inequalities will coincide. The magnitude and sign of the
difference between the inequalities in real and nominal expenditures per adult equivalent, i.e.
between the inequalities in and will, therefore, depend not
only on the price vector in the given year but also on the estimated PS-QAIDS parameters
that will determine the values. A comparison of the real and nominal
expenditure inequalities in year t reveals the nature of inequality bias in the relative price
movements. implies that the relative price movement has been inegalitarian or
inequality increasing, while the reverse is indicated if .
13
Table 5 presents the nominal and real expenditure inequalities based on the PS-QAIDS
parameter estimates of Table 1. The inequality estimates were calculated using the Gini and
Atkinson inequality measures with the latter evaluated at two levels of ‘inequality aversion’,
ε. Table 5 confirms that, after an initial decline in the early1990s, there has been an increase
in expenditure inequality that accelerated sharply during the period 1998/99-2003/46 which
coincides with the introduction of GST in Australia in 2000. Moreover, the larger magnitude
of real expenditure inequality over nominal expenditure inequality points to the inequality
increasing nature of the price movement since 1993/94. These findings are robust to the
choice of the measure used in the expenditure inequality calculations. The inequality
increasing nature of the price movements in Australia is seen more clearly from Fig.10 which
presents the Lorenz curves of per equivalent adult expenditures, in nominal and real terms, in
2003/4. The Lorenz curve of real expenditure lies outside that of nominal expenditure, and a
large gap exists between the two distributions, especially over the middle expenditure range.
5. CONCLUDING REMARKS
The recent turmoil in the world’s financial markets and attempts to revive falling consumer
demand in the midst of recessionary trends have highlighted the importance of reasonably
accurate estimates of demand responses to changes in income and prices. This has put the
focus of much of applied research back on the specification and estimation of demand
systems in order to obtain updated and reliable estimates of price and expenditure/income
elasticities. As Slottje (2008) says, “the current state of many global economies and the
importance of consumer expenditures in fuelling these economies make it imperative that
new research ‘demand tools’ be developed and used by economists and policy makers to deal
with increasingly complex issues that arise out of troubling economic trends” (p.207). The
present study that proposes and estimates two new demographic demand models on
Australian household expenditure data, was undertaken in this spirit.
While demand systems estimation has traditionally been performed on time series of
consumer expenditure and prices obtained from national accounts data, in recent years, with
the increasing availability of cross sectional household expenditure surveys – often in the
form of unit records – the data base has typically been pooled time series of budget surveys
6 See Blacklow and Ray (2000) for inequality movement in the earlier period, 1975/76 to 1988/89.

14
containing variation in prices, aggregate household expenditure, household size and
composition. The need to allow the simultaneous movement in these exogenous determinants
of expenditure allocation in the demand estimation has prompted the move to demographic
demand systems. This paper contributes to this trend by proposing a demographic demand
procedure and applying it to two recent demand functional forms to generate their
demographic extensions. The empirical results illustrate the usefulness of the demographic
demand procedure by providing sensible and robust estimates of the equivalence scales,
economies of household size and the price and expenditure elasticities, all of which are
required in a host of policy applications that range from poverty measurement to the design
and reform of commodity taxes. A particularly useful aspect of the proposed demographic
procedure is that its empirical application yields precise and robust estimates of the nature
and magnitude of the variation of the equivalence scale with the relative prices of the various
subgroups of expenditure items. A significant result in this context is the conclusion that,
over the period of this study, namely 1988-2003, the equivalence scale, which is used as the
household size deflator, has changed considerably in response to the relative price changes.
The policy usefulness of this exercise is further illustrated by using the equivalence scale and
demand parameter estimates to analyse the distributional implications of price movements in
Australia. The paper builds on the existing literature by proposing and applying a
methodology for evaluating the nature and magnitude of the inequality bias of relative price
changes. The findings of this study that during the period, 1998-2003, the price movements in
Australia had an inequality increasing bias, against a background of rising nominal
expenditure inequality, is a result of policy significance.
The “unitary household” model, adopted in this study can be relaxed in favour of “collective
household” models that allow intra-household interaction in decision making by various
household members [see, for example, Lewbel and Pendakur (2008)]. The extension of the
demographic demand procedure proposed here to the “collective household” framework and
the examination of the robustness of the empirical evidence to such an extension is a fruitful
area for further research.
15
REFERENCES
Australian Bureau of Statistics (2008a), Consumer Price Index, Australia, TABLE 7. CPI: Group, Sub-group and Expenditure Class, Weighted Average of Eight Capital Cities ABS 6401.05, ABS, Canberra.
Australian Bureau of Statistics (2008b), Consumer Price Index, Australia, TABLE 13. CPI: Groups, Sub-groups and Expenditure Class, Index Numbers by Capital City ABS 6401.09, ABS, Canberra.
Australian Bureau of Statistics (2008c), Consumer Price Index: Historical Weighting Patterns, 1948 to 2005, ABS 6431.0, ABS, Canberra.
Australian Bureau of Statistics (2005), Consumer Price Index: 15th Series Weighting Pattern (Reissue), ABS 6430.0, ABS, Canberra.
Banks, J., Blundell, R. and Lewbel, A. (1997) "Quadratic Engel Curves and Consumer Demand". Review of Economics and Statistics, 79, 527-539.
Barten, A.P. (1964). “Family Composition, Prices and Expenditure Patterns”. in Econometric Analysis for National Economic Planning: 16th Symposium of the Colston Society. eds., P. Hart, G. Mills and J.K. Whitakker. pp. 277-292. London: Butterworth.
Blacklow, P., Cooper, R., Ham, B. & McLaren, K. (2006). “A Regular Demand System with Commodity-Specific Demoraphic Effects”. Discussion paper, 2006-06, School of Economics and Finance, University of Tasmania, Hobart.
Blacklow, P. and Ray, R. (2000) "A Comparison of Income and Expenditure Inequality Estimates: The Australian Evidence, 1975-76 to 1993-94". Australian Economic Review, 33, 317-329.
Blackorby, C. and Donaldson, D. (1993) "Adult-Equivalence Scales and the Economic Implementation of Interpersonal Comparisons of Well-Being". Social Choice and Welfare, 10, 335-361.
Cooper, R.J. and McLaren, K. (1992). “An Empirically Oriented Demand System with Improved Regularity Properties”. Canadian Journal of Economics. 25(3), 652-668.
Deaton, A.S. and Muellbauer, J. (1980). “An Almost Ideal Demand System”. American Economic Review. 70, 312-326.
Gorman, W.M. (1976). “Tricks with Utility Functions”. in Essays in Economic Analysis: Proceedings of the 1975 AUTE Conference, Sheffield. eds., M.J. Artis and A.R. Nobay. pp. 211-242. CUP: Cambridge.
Lancaster, G., Ray, R., and Valenzuela, R. (1999). “A cross country study of household poverty and inequality on unit record household budget data”. Economic Development and Cultural Change, 48, 177-208.
Lewbel, A. (1987), “Functional Demand Systems”. Journal of Econometrics. 36(3), 311-337.
Lewbel, A. and Pendakur, K. (2008). “Estimation of Collective Household Models with Engel Curves”. Journal of Econometrics. 147(2), 350-358.
Muellbauer, J. (1974) "Prices and Inequality: The United Kingdom Experience". Economic Journal, 84, 32-55.

16
Pendakur, K. (2002) "Taking Prices Seriously in the Measurement of Inequality". Journal of Public Economics, 86, 47-69.
Pollak, R. A. and Wales, T. J. (1979) "Welfare Comparisons and Equivalence Scales". American Economic Review, 69, 216-221.
Pollak, R. A. and Wales, T. J. (1992). Demand System Specification and Estimation. OUP: Oxford.
Prais, S.J., and Houthakker, H.S. (1955). The Analysis of Family Budgets. CUP: Cambridge.
Ray, R. (1983) "Measuring the Costs of Children: An Alternative Approach". Journal of Public Economics, 22, 89-102.
Ray, R. (1985) "Prices, Children and Inequality: Further Evidence for the U.K., 1965-82". Economic Journal, 95, 1069-1077.
Slottje, D. (2008). “Estimating Demand Systems and measuring Consumer Preferences”. Journal of Econometrics. 147(2), 207-209.

17
TABLE 1: PS-QUAIDS Parameter Estimates*
α1 0.993 β1 -0.238 ρ1 0.589 γ27 -0.056 γ57 0.014 (0.00) (0.00) (0.00) (0.00) (0.35)
α2 0.492 β2 -0.141 ρ2 0.650 γ28 0.060 γ58 0.022 (0.00) (0.00) (0.00) (0.00) (0.16)
α3 0.303 β3 0.046 ρ3 0.629 γ29 -0.052 γ59 -0.010 (0.00) (0.00) (0.00) (0.00) (0.46)
α4 -0.216 β4 0.104 θ 0.444 γ33 0.069 γ66 -0.052 (0.00) (0.00) (0.00) (0.00) (0.00)
α5 -0.194 β5 0.075 γ11 -0.007 γ34 -0.045 γ67 0.043 (0.00) (0.00) (0.84) (0.00) (0.00)
α6 -0.125 β6 0.081 γ12 -0.154 γ35 -0.036 γ68 -0.009 (0.00) (0.00) (0.00) (0.00) (0.28)
α7 0.063 β7 -0.032 γ13 -0.010 γ36 -0.032 γ69 0.013 (0.09) (0.02) (0.61) (0.00) (0.28)
α8 -0.323 β8 0.119 γ14 0.160 γ37 0.007 γ77 -0.063 (0.00) (0.00) (0.00) (0.65) (0.03)
α9 0.008 β9 -0.014 γ15 0.043 γ38 0.047 γ78 0.025 (0.72) (0.06) (0.01) (0.00) (0.20)
λ1 0.019 δ1 -0.001 γ16 0.012 γ39 -0.034 γ79 0.033 (0.00) (0.11) (0.27) (0.16) (0.27)
λ2 0.010 δ2 0.000 γ17 0.008 γ44 -0.038 γ88 -0.039 (0.00) (0.12) (0.73) (0.00) (0.11)
λ3 -0.011 δ3 0.007 γ18 -0.035 γ45 -0.041 γ89 -0.035 (0.00) (0.00) (0.11) (0.00) (0.15)
λ4 -0.010 δ4 -0.007 γ19 -0.017 γ46 -0.010 γ99 0.138 (0.00) (0.00) (0.36) (0.02) (0.00)
λ5 -0.006 δ5 0.004 γ22 -0.001 γ47 -0.010 (0.00) (0.00) (0.68) (0.33)
λ6 -0.008 δ6 -0.005 γ23 0.033 γ48 -0.035 (0.00) (0.00) (0.00) (0.00)
λ7 0.008 δ7 -0.002 γ24 0.054 γ49 -0.035 (0.00) (0.00) (0.00) (0.01)
λ8 -0.007 δ8 -0.004 γ25 0.051 γ55 -0.010 (0.00) (0.00) (0.00) (0.53)
λ9 0.004 δ9 -0.222 γ26 0.065 γ56 -0.031 (0.00) 0.000 (0.00) (0.00)
Log-likelihood: 275998.9 Parameters estimated: 72 Observations: 29463 *Figures in parenthesis denote p-values.

18
TABLE 2: Demographically Modified MAIDS Parameter Estimates*
α1 0.795 β1 0.033 δ1 -0.002 (0.00) (0.00) (0.00)
α2 0.592 β2 -0.084 δ2 -0.001 (0.00) (0.00) (0.01)
α3 1.525 β3 -0.152 δ3 0.008 (0.00) (0.00) (0.00)
α4 0.029 β4 0.026 δ4 -0.006 (0.00) (0.00) (0.00)
α5 -0.204 β5 0.061 δ5 0.004 (0.00) (0.00) (0.00)
α6 0.229 β6 0.004 δ6 -0.005 (0.00) (0.02) (0.00)
α7 -0.866 β7 0.243 δ7 -0.003 (0.00) (0.00) (0.00)
α8 -0.607 β8 0.182 δ8 -0.004 (0.00) (0.00) (0.00)
α9 -0.493 β9 0.127 δ9 0.009
(0.00) (0.00) (0.00) ρ1 0.607 (0.00) ρ2 0.662 (0.00) ρ3 0.646 (0.00) θ 0.455 (0.00) η 0.439 (0.00)
Log-likelihood: 273999 Parameters estimated: 29 Observations: 29463
*Figures in parenthesis denote p-values.
19
TABLE 3: PS-QAIDS Elasticities
Expenditure Elasticities (ei)
1 2 3 4 5 6 7 8 9
0.904 0.146 0.515 0.882 1.507 0.880 1.410 1.394 1.444
Price Elasticities (eij)
i/j 1 2 3 4 5 6 7 8 9
1 -0.349 -0.158 -0.149 0.279 -0.070 -0.157 0.131 -0.406 -0.024
2 -1.485 1.644 0.774 0.244 0.659 1.195 -1.621 0.239 -1.794
3 -0.187 0.102 -0.283 -0.105 -0.113 -0.058 -0.036 0.416 -0.250
4 2.059 0.170 -0.571 -1.039 -0.401 0.506 -0.644 0.131 -1.092
5 -0.794 0.542 -0.859 -0.562 -0.640 -0.437 0.189 1.468 -0.414
6 -0.655 0.423 -0.227 0.278 -0.164 -1.422 0.487 0.308 0.092
7 0.133 -0.361 -0.189 -0.207 0.046 0.229 -1.430 0.065 0.303
8 -1.218 0.043 0.440 0.010 0.426 0.151 0.085 -0.931 -0.401
9 -0.281 -0.743 -0.790 -0.674 -0.199 0.064 0.608 -0.681 1.252

20
TABLE 4: Demographically Modified MAIDS Elasticities
Expenditure Elasticities (ei)
1 2 3 4 5 6 7 8 9
0.905 -0.132 0.653 1.025 1.316 0.882 1.445 1.353 1.481
Price Elasticities (eij)
i/j 1 2 3 4 5 6 7 8 9
1 -0.925 0.056 0.145 0.002 -0.019 0.021 -0.082 -0.058 -0.046
2 0.898 -0.331 1.731 0.029 -0.228 0.256 -0.981 -0.689 -0.551
3 0.275 0.205 -0.469 0.009 -0.07 0.078 -0.301 -0.211 -0.169
4 -0.02 -0.015 -0.039 -1.001 0.005 -0.006 0.022 0.015 0.012
5 -0.251 -0.187 -0.484 -0.008 -0.936 -0.072 0.274 0.192 0.154
6 0.093 0.07 0.18 0.003 -0.024 -0.973 -0.102 -0.072 -0.057
7 -0.352 -0.263 -0.68 -0.011 0.09 -0.1 -0.615 0.271 0.216
8 -0.28 -0.209 -0.54 -0.009 0.071 -0.08 0.306 -0.785 0.172
9 -0.381 -0.284 -0.734 -0.012 0.097 -0.109 0.416 0.292 -0.766
TABLE 5: Nominal and Real Expenditure Inequalities^
NOMINAL REAL
Year GINI
Atkinson
GINI
Atkinson
ε = 0.5 ε = 2 ε = 0.5 ε = 2
1988/9 0.308 0.076 0.287 0.308 0.076 0.286
1993/4 0.302 0.073 0.270 0.309 0.076 0.276
1998/9 0.306 0.075 0.278 0.317 0.080 0.287
2003/4 0.315 0.080 0.297 0.361 0.105 0.364
^ ε denotes ‘inequality aversion’

21
FIGURE 1: BUDGET SHARES FOR ACCOMODATION
0.20
0.25
0.30
0.35
0.40
0.45
0.50
0 200 400 600 800 1000 1200 1400
HH Weekly Expenditure ($1989-90)
Bud
get S
hare
PSQAIDS Accommodation
DMMAIDS Accommodation
FIGURE 2: BUDGET SHARES FOR ELECTRICITY AND HOUSEHOLD FUEL
0.00
0.04
0.08
0.12
0.16
0.20
0 200 400 600 800 1000 1200 1400
HH Weekly Expenditure ($1989-90)
Bud
get S
hare
PSQAIDS PowerDMMAIDS Power

22
FIGURE 3: BUDGET SHARES FOR FOOD
0.00
0.10
0.20
0.30
0.40
0.50
0 200 400 600 800 1000 1200 1400
HH Weekly Expenditure ($1989-90)
Bud
get S
hare
PSQAIDS FoodDMMAIDS Food
FIGURE 4: BUDGET SHARES FOR ALCOHOL & TOBACCO
0.00
0.06
0.12
0.18
0.24
0.30
0 200 400 600 800 1000 1200 1400
HH Weekly Expenditure ($1989-90)
Bud
get S
hare
PSQAIDS RecreationDMMAIDS Recreation

23
FIGURE 5: BUDGET SHARES FOR CLOTHING
0.00
0.02
0.04
0.06
0.08
0.10
0 200 400 600 800 1000 1200 1400
HH Weekly Expenditure ($1989-90)
Bud
get S
hare
PSQAIDS ClothingDMMAIDS Clothing
FIGURE 6: BUDGET SHARES FOR HEALTH
0.00
0.02
0.04
0.06
0.08
0.10
0 200 400 600 800 1000 1200 1400
HH Weekly Expenditure ($1989-90)
Bud
get S
hare
PSQAIDS Health & Care
DMMAIDS Health & Care

24
FIGURE 7: BUDGET SHARES FOR TRANSPORT
0.00
0.02
0.04
0.06
0.08
0.10
0 200 400 600 800 1000 1200 1400
HH Weekly Expenditure ($1989-90)
Bud
get S
hare
PSQAIDS TransportDMMAIDS Transport
FIGURE 8: BUDGET SHARES FOR RECREATION
0.00
0.06
0.12
0.18
0.24
0.30
0 200 400 600 800 1000 1200 1400
HH Weekly Expenditure ($1989-90)
Bud
get S
hare
PSQAIDS RecreationDMMAIDS Recreation
25
FIGURE 9: BUDGET SHARES FOR EDUCATION, CREDIT AND MISCELLANEOUS SPENDING
0.00
0.04
0.08
0.12
0.16
0.20
0 200 400 600 800 1000 1200 1400
HH Weekly Expenditure ($1989-90)
Bud
get S
hare
PSQAIDS Alc & TobDMMAIDS Alc & Tob
FIGURE 10: Lorenz Curves of Nominal and Real Expenditures in 2003/4
0.2
.4.6
.81
L(p)
0 .2 .4 .6 .8 1Percentiles (p)
line_45° real2003 nominal2003
Lorenz Curve(s)
26
School of Economics and Finance Discussion Papers
2008‐01 Calorie Intake in Female‐Headed and Male Headed Households in Vietnam, Elkana Ngwenya
2008‐02 Determinants of Calorie Intake in Widowhood in Vietnam, Elkana Ngwenya
2008‐03 Quality Versus Quantity in Vertically Differentiated Products Under Non‐Linear Pricing, Hugh Sibly
2008‐04 A Taxonomy of Monopolistic Pricing, Ann Marsden and Hugh Sibly
2008‐05 Vertical Product Differentiation with Linear Pricing, Hugh Sibly
2008‐06 Teaching Aggregate Demand and Supply Models, Graeme Wells
2008‐07 Demographic Demand Systems with Application to Equivalence Scales Estimation and Inequality Analysis: The Australian Evidence", Paul Blacklow, Aaron Nicholas and Ranjan Ray
2008‐08 Yet Another Autoregressive Duration Model: The ACDD Model, Nagaratnam Jeyasreedharan, David E Allen and Joey Wenling Yang
2008‐09 Substitution Between Public and Private Consumption in Australian States, Anna Brown and Graeme Wells
2007‐01 Dietary Changes, Calorie Intake and Undernourishment: A Comparative Study of India and Vietnam, Ranjan Ray
2007‐02 A Re‐examination of the Real Interest Parity Condition Using Threshold Cointegration, Arusha Cooray
2007‐03 Teaching Aggregate Demand and Supply Models, Graeme Wells
2007‐04 Markets, Institutions and Sustainability, Ella Reeks
2007‐05 Bringing Competition to Urban Water Supply, Hugh Sibly and Richard Tooth
2007‐06 Changes in Indonesian Food Consumption Patterns and their Nutritional Implications, Elkana Ngwenyaand Ranjan Ray
2007‐07 The Term Spread and GDP Growth in Australia, Jacob Poke and Graeme Wells
2007‐08 Moving Towards the USDA Food Guide Pyramid Food: Evidence from Household Food Group Choice in Vietnam, Elkana Ngwenya
2007‐09 The Determinants of the Quantity‐Quality Balance in Monopoly, Hugh Sibly
2007‐10 Rationing Recreational Access to Wilderness and Other Natural Areas, Hugh Sibly
2007‐11 Yet Another Trading Simulation: The Nonimmediacy Model, Nagaratnam Jeyasreedharan
Copies of the above mentioned papers and a list of previous years’ papers are available on request from the Discussion Paper Coordinator, School of Economics and Finance, University of Tasmania, Private Bag 85, Hobart, Tasmania 7001, Australia. Alternatively they can be downloaded from our home site at
http://www.utas.edu.au/ecofin ||
Related Documents