1 Brussels 30 January 2020 SEDEC Commission Territorial Impact Assessment Demographic Change Disclaimer This report was produced by the European Committee of the Regions secretariat to assist in the preparation of the own-initiative opinion on Demographic change: proposals on measuring and tackling its negative effects in the EU regions, by rapporteur János Ádám Karácsony (HU/EPP). This report will be shared with the European Commission and the European Parliament. The findings of this report are not binding on the European Committee of the Regions and are without prejudice to the final content of its opinions. This report is for information purposes only. Supported by

Welcome message from author
This document is posted to help you gain knowledge. Please leave a comment to let me know what you think about it! Share it to your friends and learn new things together.
Transcript
1
Brussels 30 January 2020
SEDEC
Commission
Territorial Impact Assessment
Demographic Change
Disclaimer This report was produced by the European Committee of the Regions secretariat to assist in the preparation of the own-initiative opinion on Demographic change: proposals on measuring and tackling its negative effects in the EU regions, by rapporteur János Ádám Karácsony (HU/EPP). This report will be shared with the European Commission and the European Parliament. The findings of this report are not binding on the European Committee of the Regions and are without prejudice to the final content of its opinions. This report is for information purposes only.
Supported by
2
Authors Igor Caldeira (CoR) Erich Dallhammer, Bernd Schuh, Chien-Hui Hsiung (ÖIR GmbH) Acknowledgements Zintis Hermansons (ESPON EGTC) Participants in the TIA workshop
János Ádám Karácsony Rapporteur
András Pári Expert
Bernd Schuh ÖIR
Boele Bonthuis OECD
Carla Lázaro Alentejo Regional Development Coordination Commission
Deša Srsen European Commission
Eglė Neniškienė Lithuanian Ministry of Finances
Erich Dallhammer ÖIR
Fabian Gal Researcher
Franc Zakrajsek Urban Planning Institute, Slovenia
Georgios Petras CoR
Igor Caldeira CoR
Izabella Gradinescu North-East Region, Romania
Manfred Huber World Health Organization
Miguel Martinez Tomey Southern Sparsely Populated Areas Network
Nicolas Rossignol ESPON EGTC
Petri Kahila University of Eastern Finland
Raul Formigo Universidad Carlos III (Madrid)
Roberto Giannella European Parliament
Sara Bianchi Southern Sparsely Populated Areas Network
Vasilis Margaras European Parliament Research Service
This territorial impact assesement report is the outcome of an expert workshop held by the European Committee of the Regions and ESPON EGTC in Brussels on 30 January 2020. The ESPON TIA Tool is designed to support the quantitative assessment of potential territorial impacts according to the Better Regulation guidelines. It is an interactive web application that can be used to support policy-makers and practitioners in identifying, ex-ante, potential territorial impacts of new EU legislation, policies and directives (LPDs). This report documents the results of the territorial impact assessment expert workshop on demographic change in the EU. It is intended for information purposes only. This report and the maps in it represent the views and experiences of the participants in the workshop. It is meant to be used only to support decision-making processes and does not necessarily reflect the opinion of the members of the ESPON 2020 Monitoring Committee.
3
Acronyms and legend
CoR European Committee of the Regions EP European Parliament ESPON European Territorial Observatory Network LRA Local and Regional Authority MS Member State(s) NUTS Nomenclature des unités territoriales statistiques
Common classification of territorial units for statistical purposes ÖIR Austrian Institute for Spatial Planning TIA Territorial Impact Assessment
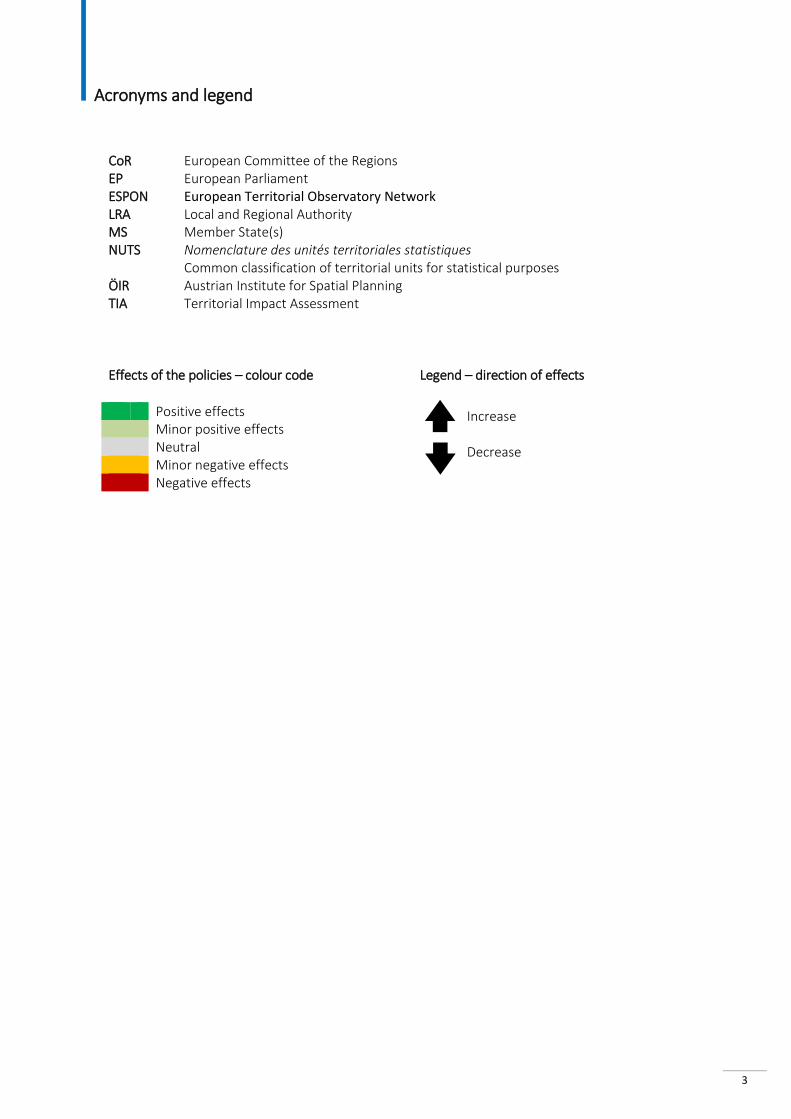
Effects of the policies – colour code Legend – direction of effects
Increase Decrease
Positive effects Minor positive effects Neutral Minor negative effects Negative effects
4
Table of contents
1.1 Context .................................................................................................................................................... 6 1.2 Political mandate .................................................................................................................................. 6 1.3 The CoR's current and past work on this topic ............................................................................ 7
2.1 Identifying the potential territorial effects based on economic, societal, environmental and governance aspects – defining a conceptual model ................................................................................................. 9
2.2. Depicting the potential territorial effects by means of indicators ......................................................... 9 2.3. Judging the intensity of the potential effects ....................................................................................... 10 2.4. Calculating the potential "regional impact" – Combining the experts' judgement with regional
sensitivity 10 2.5. Mapping the potential territorial impact .............................................................................................. 11
3.1 Reactive and proactive policy options ................................................................................................... 12 3.2 Starting questions ................................................................................................................................... 13 3.3 European Shrinking Rural Areas ..................................................................................................... 14 3.4 Age-friendly environments..................................................................................................................... 16 3.5 Discussion among participants .............................................................................................................. 17 3.5.1 Labour issues . . . . . . . . . . . . . . . . . . . . . . . . . . . . . . . . . . . . . . . . . . . . . . . . . . . . . . . . . . . . . . . . . . . . . . . . . . . . . . . . . . . . . . . . . . . 17 3.5.2 Housing . . . . . . . . . . . . . . . . . . . . . . . . . . . . . . . . . . . . . . . . . . . . . . . . . . . . . . . . . . . . . . . . . . . . . . . . . . . . . . . . . . . . . . . . . . . . . . . . . . . 18 3.5.3 Social serv ices . . . . . . . . . . . . . . . . . . . . . . . . . . . . . . . . . . . . . . . . . . . . . . . . . . . . . . . . . . . . . . . . . . . . . . . . . . . . . . . . . . . . . . . . . . 18 3.5.4 Infrastructure and the urban/rural d ichotomy . . . . . . . . . . . . . . . . . . . . . . . . . . . . . . . . . . . . . . . . . . . . . 18 3.5.5 Financial burdens . . . . . . . . . . . . . . . . . . . . . . . . . . . . . . . . . . . . . . . . . . . . . . . . . . . . . . . . . . . . . . . . . . . . . . . . . . . . . . . . . . . . . 20
4.1 Birth rate ................................................................................................................................................. 21 4.2 Total fertility rate .................................................................................................................................... 22 4.3 Unemployment rate ............................................................................................................................... 23 4.4 Economically active population per km2 ............................................................................................... 26 4.5 Perceived social network support ......................................................................................................... 28
5.1 EAGF & EAFRD: expenditure as a share of GDP .................................................................................... 31
6.1 Regional ICT infrastructure .................................................................................................................... 33
7.1 Missing aspects and statistical indicators.............................................................................................. 35 7.2 Measures to address low fertility and ageing ....................................................................................... 36 7.3 Measures to address migration ............................................................................................................. 36 7.4 Measures to address depopulation ....................................................................................................... 36
8.1 New Skills Agenda ................................................................................................................................... 38 8.2 Implementation of the Work-Life Balance Directive ............................................................................ 38 8.3 The establishment of the European Labour Authority ......................................................................... 39 8.4 Implementation of the 2030 Agenda .................................................................................................... 40 8.5 EU Industrial policy strategy .................................................................................................................. 40
5
Table of images
Map 1 - Typology of structural demographic shrinkage.............................................................................................. 14
Map 2 - Typology of simple shrinkage .......................................................................................................................... 15
Map 3 - Estimated halving of population ..................................................................................................................... 16
Map 4 - Sparsely populated areas and areas at risk .................................................................................................... 19
Map 5 - Birth rate affected by demographic change – expert judgement: strongly positive effect ........................ 22
Map 6 - Total fertility rate affected by demographic change – expert judgement: strongly positive effect ........... 23
Map 7 - Unemployment rate affected by demographic change – expert judgement: strongly positive effect ...... 25
Map 8 - Unemployment rate affected by demographic change – expert judgement: strongly negative effect ..... 26
Map 9 - Economically active population per km2 affected by demographic change – expert judgement: strongly
positive effect ................................................................................................................................................................ 28
Map 10 - Perceived social network support affected by demographic change – expert judgement: strongly
positive effect ................................................................................................................................................................ 30
Map 11 - EAGF & EAFRD - expenditure as a share of GDP affected by the demographic change – expert
judgement: strongly positive effect .............................................................................................................................. 32
Map 12 - Regional ICT infrastructure affected by demographic change – expert judgement: weakly positive effect
........................................................................................................................................................................................ 34
Figure 1 - Workshop discussion ...................................................................................................................................... 8
Figure 2 - Workshop findings: Systemic picture ............................................................................................................ 9
Figure 3 - Exposure x territorial sensitivity = territorial impact .................................................................................. 10
Figure 4 - The holistic nature of an age-friendly environment ................................................................................... 17
Figure 5 - Percentage of childcare users reporting difficulties ................................................................................... 18
Figure 6 - Result of the expert judgement: birth rate affected by demographic change .......................................... 21
Figure 7 - Result of the expert judgement: total fertility rate affected by demographic change ............................. 22
Figure 8 - Result of the expert judgement: unemployment rate affected by demographic change ........................ 24
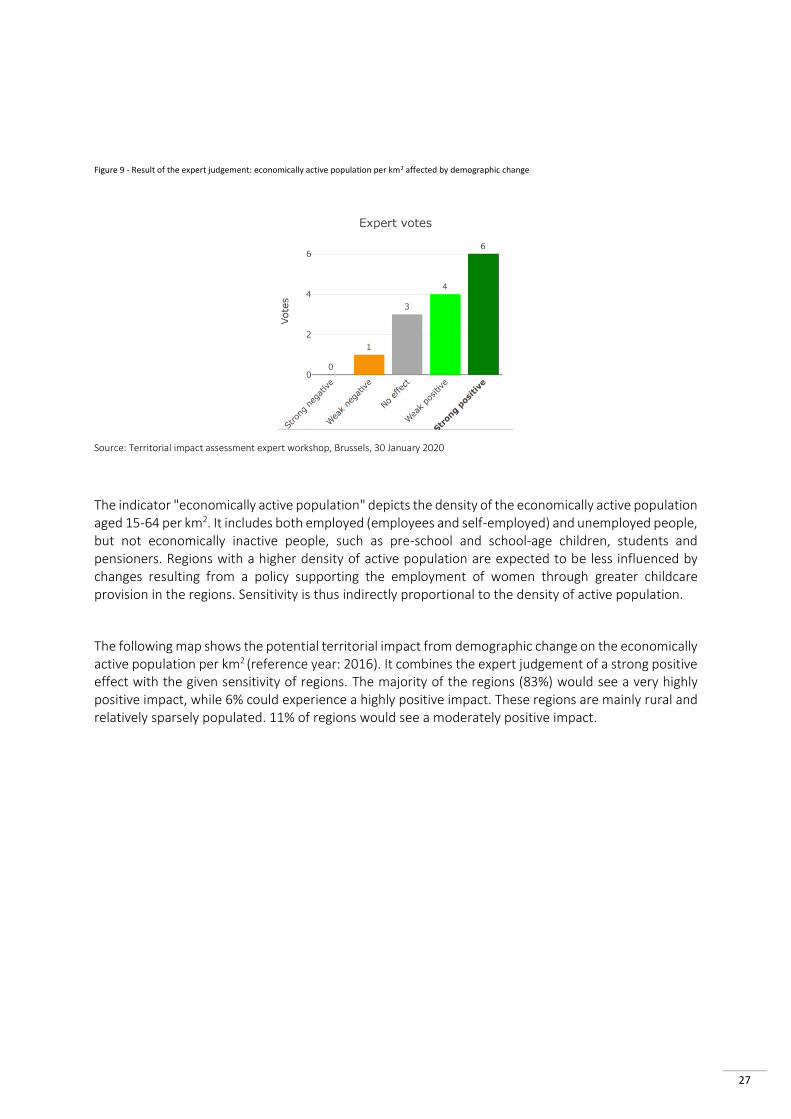
Figure 9 - Result of the expert judgement: economically active population per km2 affected by demographic
change ............................................................................................................................................................................ 27
Figure 10 - Result of the expert judgement: perceived social network support affected by demographic change 29
Figure 11 - Result of the expert judgement: EAGF & EAFRD - expenditure as a share of GDP affected by the
demographic change ..................................................................................................................................................... 31
Figure 12 - Result of the expert judgement: regional ICT infrastructure affected by demographic change ........... 33
6
Introduction
1.1 Context The European Union as a whole is experiencing a major demographic change: since 1960 the population has increased by a quarter, but it is now growing slowly and is expected to decline in the longer term. The EU represents a shrinking proportion of the world population (expected to fall from the current 6.9 % to 4.1% by the end of the century). Among the main causes for this demographic change are an ageing population and the aggravation of the unequal distribution of population.
Rising life expectancy and falling fertility rates are the main reasons for the ageing of the population. This in turn can create additional problems: firstly, the sustainability of welfare systems becomes precarious, due to the decline in the number of active people relative to the dependent population; economic growth is also jeopardised, as the loss of active population might not be counterbalanced by gains in productivity.
Many people, especially in areas with few education or employment opportunities, move to other regions in search of a better future; this move, which is especially felt in areas that are already underpopulated or in decline, aggravates the problem1. In turn, this results in a loss of human capital from some areas and leads to wider and deeper inequalities between Member States and regions. In many cases it leads to a surplus in the workforce in overpopulated areas (which results in higher unemployment rates), while at the same time essential jobs in underpopulated areas cannot be filled due to the lack of workers. Thus, we experience a paradox where there are too many workers competing for few jobs in some areas, while in other areas there are more jobs than workers. Finally, this population shift puts an additional strain on (already declining) rural areas as it exacerbates brain drain and difficulties in accessing services.
1.2 Political mandate The mandate of Commissioner Dubravka Suiča includes instructions from the Commission president to "analyse the impact of demographic change on different groups in society and on areas and regions disproportionately affected" and "to undertake an extensive mapping exercise" that will lead to more support for the affected regions.
A CoR opinion therefore provides plenty of opportunities for the CoR and its SEDEC commission to position themselves as credible actors on this topic and to influence the decision-making process. Furthermore, the CoR can provide mapping expertise and potentially assist in developing cooperation with Eurostat, due to their recent work on the first edition of the European Regional Social Scoreboard.
The aim of the own-initiative opinion is to find better ways to identify and measure the negative effects on various groups in areas affected by demographic change.
Demographic change demands appropriate responses and targeted actions, differentiated according to the subject and policy involved. The ageing population, the decline in population densities and the loss of younger people to brain drain and immigration all cause huge disparities between regions, undermine
1 It should be noted that, while some urban areas have higher unemployment rates, they quite often also have higher employment rates, meaning that there are simply fewer inactive people. In such cases many workers are competing for many jobs (which is the reason the workers are there in the first place). Indeed, low employment in rural areas could indicate that there are more workers than jobs, but it could also point to a high proportion of inactive people. It is important to look at both regional employment and regional unemployment to get the full picture.
7
cohesion policies and create significant shortages in service provision, labour and economic potential in the affected regions.
The demographic challenge is one of the CoR's political priorities and has been the subject of CoR opinions and studies in the recent past. Local and Regional Authorities (LRAs) in many Member States have key competences in strategic areas such as employment, participation in society and independent living. The own-initiative opinion will look into the social consequences that arise from brain drain and a declining/ageing population, and how local and regional authorities are affected.
1.3 The CoR's current and past work on this topic The current own-initiative opinion Demographic challenge: proposals on measuring and tackling its negative effects in the EU regions, by rapporteur János Ádám Karácsony (HU/EPP), builds on the instructions the new Commission president has given to the newly appointed commissioner for democracy and demography, Dubravka Suiča. Based on the Commission president's instructions, Ms Suiča will have to develop a comprehensive action plan for how to best support the regions most affected by demographic change.
In addition, a number of other opinions published in the last decade have dealt with topics related to demographic change, namely:
CDR 40/2016: Opinion on the EU response to the demographic challenge
CDR 15/2019: Opinion on Active and healthy ageing
CDR 1528/2017: Opinion on Territorial classification and Typologies
CDR 3138/2017: Opinion on Work-life balance for parents and carers
CDR 56/2012: Opinion on Active ageing: innovation - smart health – better lives CDR 212/2009: Opinion on Dealing with the impact of an ageing population in the EU.
The territorial Impact assessment workshop held on 30 January and the present report are intended to support this own initiative opinion. Furthermore, the CoR has also previously produced other TIA reports related to demographic change-related subjects, including the labour market and migration:
the 2016 Urban Impact Assessment report on New Skills for Europe2
the 2017 TIA report on the work-life balance directive3
the 2018 Urban Impact Assessment report on the implementation of the 2030 Agenda 4
the 2018 TIA report on the establishment of the European Labour Authority5
the 2019 TIA report on a place-based industrial strategy6.
2 https://cor.europa.eu/en/our-work/Documents/Territorial-impact-assessment/new-skills-agenda.pdf. 3 https://cor.europa.eu/en/our-work/Documents/Territorial-impact-assessment/work-life-balance.pdf. 4 https://cor.europa.eu/en/events/Documents/COTER/TIA-Urban-Agenda-28052018.pdf. 5 https://cor.europa.eu/en/our-work/Documents/Territorial-impact-assessment/TIA-ELA-Labour-Authority-20180704.pdf. 6 https://cor.europa.eu/en/events/Documents/COTER/20190306%20-TIA-Industrial-policy-strategy.pdf.
8
Methodology: ESPON Quick Check
The concept of territorial impact assessment (TIA) aims to demonstrate the regional differentiation of the impact of EU policies. The ESPON TIA Tool7 is an interactive web application that can be used to support policy-makers and practitioners in identifying, ex-ante, potential territorial impacts of new EU legislation, policies and directives (LPDs). The "ESPON TIA Quick Check" approach combines a workshop setting for identifying systemic relations between a policy and its territorial consequences with a set of indicators describing the sensitivity of European regions.
It helps to steer an expert discussion about the potential territorial effects of an EU policy proposal by checking all relevant indicators in a workshop setting. The results of the guided expert discussion are judgements about the potential territorial impact of an EU policy, considering different thematic fields (economy, society, environment, governance) for a range of indicators. These results are fed into the ESPON TIA Quick Check web tool.
The web tool translates the combination of the expert judgements on exposure with the different sensitivities of regions into maps showing the potential territorial impact of EU policy at NUTS 3 level. These maps serve as starting point for the further discussion of the various impacts of a specific EU policy on different regions. Consequently, the experts participating in the workshop provide important input for this quick check on the potential territorial effects of an EU policy proposal.
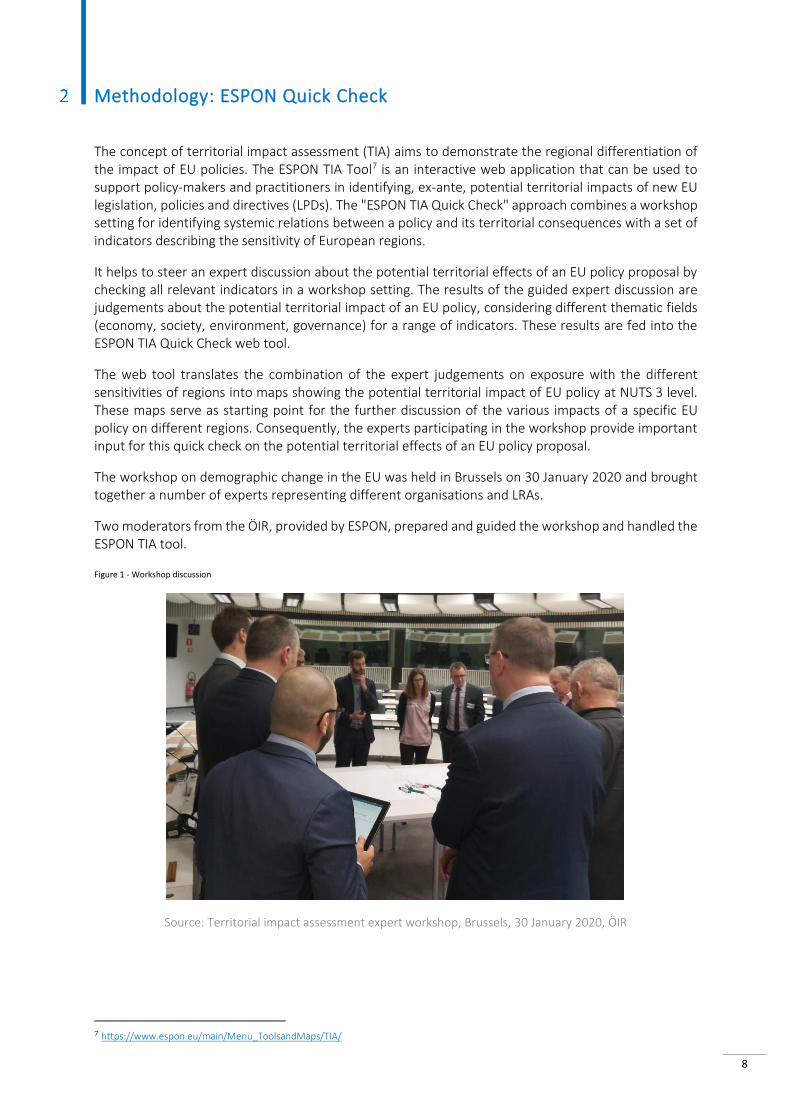
The workshop on demographic change in the EU was held in Brussels on 30 January 2020 and brought together a number of experts representing different organisations and LRAs.
Two moderators from the ÖIR, provided by ESPON, prepared and guided the workshop and handled the ESPON TIA tool.
Figure 1 - Workshop discussion
Source: Territorial impact assessment expert workshop, Brussels, 30 January 2020, ÖIR
7 https://www.espon.eu/main/Menu_ToolsandMaps/TIA/
9
2.1 Identifying the potential territorial effects based on economic, societal, environmental and governance aspects – defining a conceptual model
In the first part of the TIA workshop the participating experts discussed the potential effects of demographic change in the EU using a territorial – place-based – approach.
The discussion focused around three fields that influence population developments within a region:
natural growth,
migration, and
the availability of services of general economic interest (SGEIs)
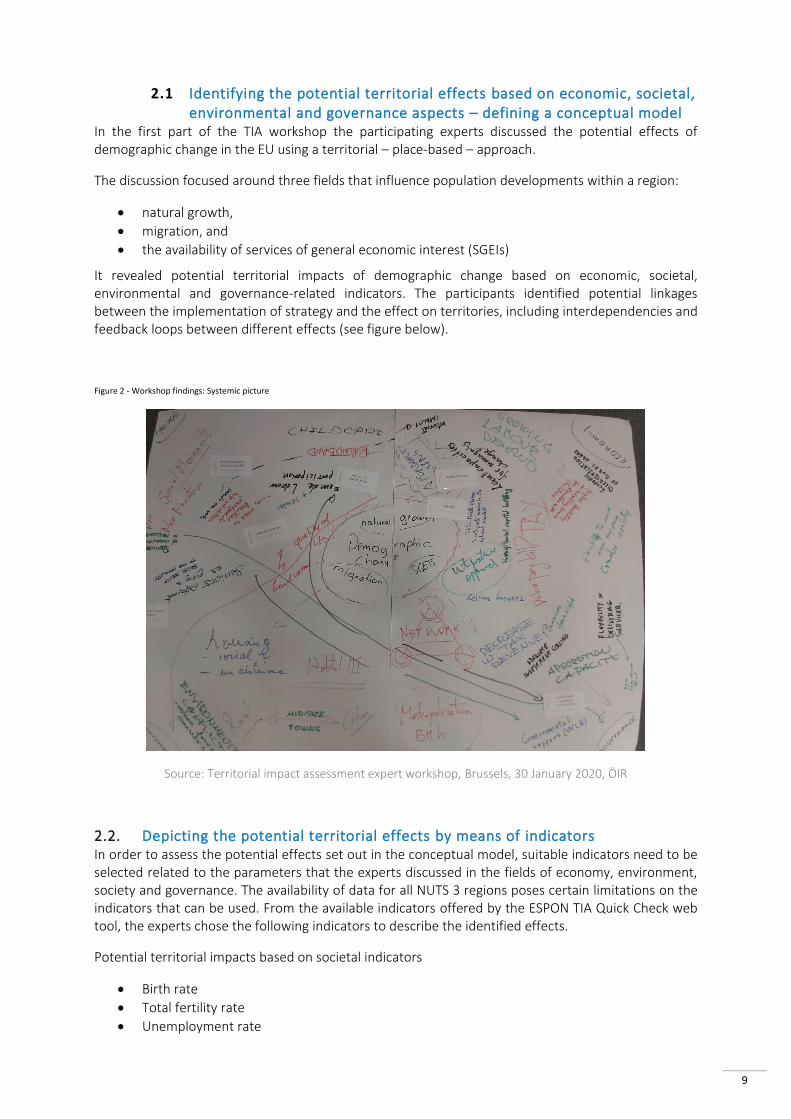
It revealed potential territorial impacts of demographic change based on economic, societal, environmental and governance-related indicators. The participants identified potential linkages between the implementation of strategy and the effect on territories, including interdependencies and feedback loops between different effects (see figure below).
Figure 2 - Workshop findings: Systemic picture
Source: Territorial impact assessment expert workshop, Brussels, 30 January 2020, ÖIR
2.2. Depicting the potential territorial effects by means of indicators In order to assess the potential effects set out in the conceptual model, suitable indicators need to be selected related to the parameters that the experts discussed in the fields of economy, environment, society and governance. The availability of data for all NUTS 3 regions poses certain limitations on the indicators that can be used. From the available indicators offered by the ESPON TIA Quick Check web tool, the experts chose the following indicators to describe the identified effects.
Potential territorial impacts based on societal indicators
Birth rate
Total fertility rate
Unemployment rate

10
Economically active population per km2
Perceived social network support
Potential territorial impacts based on governmental indicators
EAGF & EAFRD: Expenditure in share of GDP
Potential territorial impacts based on economic indicators
Regional ICT infrastructure
In addition, the experts agreed that the following indicators, which are not included in the ESPON TIA Quick Check web tool, are also relevant to describe the identified effects:
Female activity rate
Activity rate of total population
Time spent caring
Housing cost per m² by income
Regional/national support (social transfer)
2.3. Judging the intensity of the potential effects The participants in the workshop were asked to estimate the potential effects of demographic change in the EU. They assessed the potential effect on territorial welfare using the following scoring system:
++ strong advantageous effect on territorial welfare (strong increase)
+ weak advantageous effect on territorial welfare (increase)
o no effect/unknown effect/effect cannot be specified
- weak disadvantageous effect on territorial welfare (decrease)
-- strong disadvantageous effect on territorial welfare (strong decrease)
2.4. Calculating the potential "regional impact" – Combining the experts' judgement with regional sensitivity
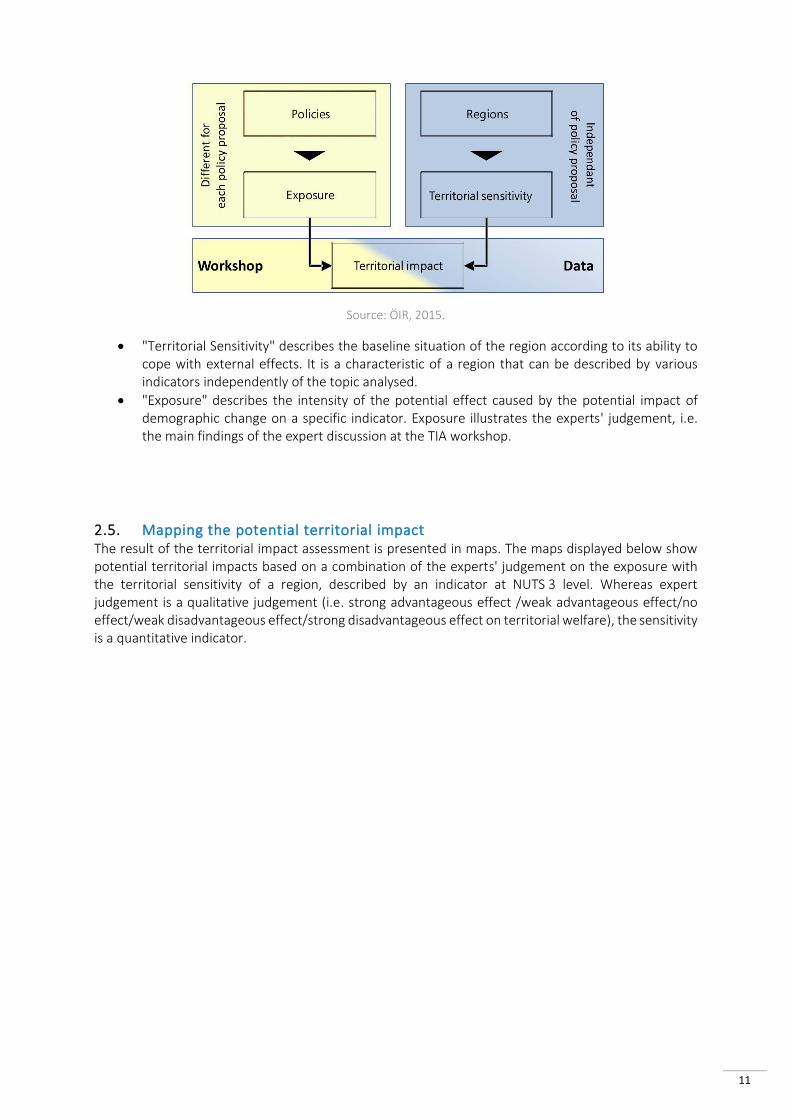
The ESPON TIA Quick Check combines the experts' judgement on the potential effects of demographic change (exposure) with indicators depicting the sensitivity of regions, resulting in maps showing a territorially-differentiated impact. This approach is based on the vulnerability concept developed by the Intergovernmental Panel on Climate Change (IPCC). In this case, the effects deriving from a particular policy measure (exposure) are combined with the characteristics of a region (territorial sensitivity) to produce potential territorial impacts (see figure below).
Figure 3 - Exposure x territorial sensitivity = territorial impact
11
Source: ÖIR, 2015.
"Territorial Sensitivity" describes the baseline situation of the region according to its ability to cope with external effects. It is a characteristic of a region that can be described by various indicators independently of the topic analysed.
"Exposure" describes the intensity of the potential effect caused by the potential impact of demographic change on a specific indicator. Exposure illustrates the experts' judgement, i.e. the main findings of the expert discussion at the TIA workshop.
2.5. Mapping the potential territorial impact The result of the territorial impact assessment is presented in maps. The maps displayed below show potential territorial impacts based on a combination of the experts' judgement on the exposure with the territorial sensitivity of a region, described by an indicator at NUTS 3 level. Whereas expert judgement is a qualitative judgement (i.e. strong advantageous effect /weak advantageous effect/no effect/weak disadvantageous effect/strong disadvantageous effect on territorial welfare), the sensitivity is a quantitative indicator.
12
Preliminary Debate
3.1 Reactive and proactive policy options Before the workshop, participants were provided with a series of policy options to serve as a basis for discussion. These options could be categorised as reactive or proactive, with the reactive policy options focusing on mitigating the impact of demographic change, and the proactive options aiming to reverse the trend.
Reactive options:
1) reduce the inactive labour force by increasing investment in better work-life balance and social infrastructure.8 The rationale behind this option would be to allow more people who are currently not able to work due to restrictions such as a lack of childcare or other social facilities to access the labour market. This would be achieved through additional public investment in this field.
2) reduce the health and care costs of an ageing society by investing in new forms of independent living (new housing concepts) and promoting the social economy.9 The rationale behind this idea would be that investment in new housing models could enable people to remain in their home environment for longer as they age.
3) improve planning of public investment by means of an obligatory demography check for public investment. The idea would be to improve the scaling of public investment based on a comprehensive demography check before the investment is made.
4) reduce of the drop-out rate of young people and broaden the skills base to make better use of existing human resources. The idea would be to invest in particular in the quality of education to reduce the drop-out rate, and also to invest in re-training programmes.
5) concentrate public service provision such as health care, education and culture in mid-size cities in the regions and use digital solutions to reach out to all places.
The rationale behind this idea would be to ensure critical mass for public service provision while at the same time ensuring the greatest possible proximity to the public. This could also be achieved by promoting new IT services such as e-medicine.
Proactive options:
6) provide additional allowances for young families to increase the reproduction rate. The rationale behind this proposal would be to provide incentives for having more children, either through direct transfers or through tax incentives.10
8 To ensure that an enhanced work-life balance is also balanced in terms of gender, a number of policy options are also available; see https://www.oecd-ilibrary.org/docserver/204235cf-en.pdf?expires=1583411996&id=id&accname=ocid84004878&checksum=E9DD62A138FFED4AC663D98402FA64A7. 9 Chapter 6 of this publication offers both regional statistics and policy options in this field: https://www.oecd-ilibrary.org/docserver/9789264279087-en.pdf?expires=1583411863&id=id&accname=ocid84004878&checksum=8A7152A98C48044C5435103A197BF187 . 10 Direct transfers and tax incentives directly linked to having more children may lead to women dropping out of (or never entering) the labour market to take care of children. Policies should focus on making it affordable to
13
5) make additional efforts to attract migrants to address demographic change. The idea would be to deliberately attract migrants to address labour or workforce shortages.
7) increase the attractiveness of the regions for students by means of dedicated investment in culture and connectivity. The rationale would be to create an open and innovative public space in the city/region to encourage young students to return to the region and make use of the digital opportunities.
8) set up dedicated incentive schemes to encourage young people to return to their regions. The rationale would be to provide financial incentives (e.g. financial allowances to resettle, to purchase property or to start a new business) to nudge people who have left the regions to come back.
Additional ideas on how to use cohesion policy to address demographic change can be found in the report Dealing with Demographic Change: Regional Policy Responses by the European Policies Research Centre11.
3.2 Starting questions Participants were asked to reflect on answers to the following questions:
What would the territorial impacts of these policy options be?
Which of these policy options would have the strongest territorial effects?
Are there patterns at national and European level that can be found in terms of territorial distribution of demographic changes?
What support should regions receive from national and EU sources to address demographic challenges?
What are the key obstacles within the regulatory and financial framework to addressing these challenges?
What role can multi-level governance and better coordination of public investment across levels of government and policies play in effectively addressing demographic change?
What should be included in a renewed action plan of the new European Commission to address demographic change in Europe?
have children and to work. For examples of family policy options see https://www.oecd-ilibrary.org/docserver/9789264281318-en.pdf?expires=1583412196&id=id&accname=ocid84004878&checksum=4028D7A72F250E30D44749E6D4992497. 11 http://www.eprc-strath.eu/public/dam/jcr:3cba92ae-d7e2-407b-bfa6-e91152f56dfe/EPRP%2072.pdf.
14
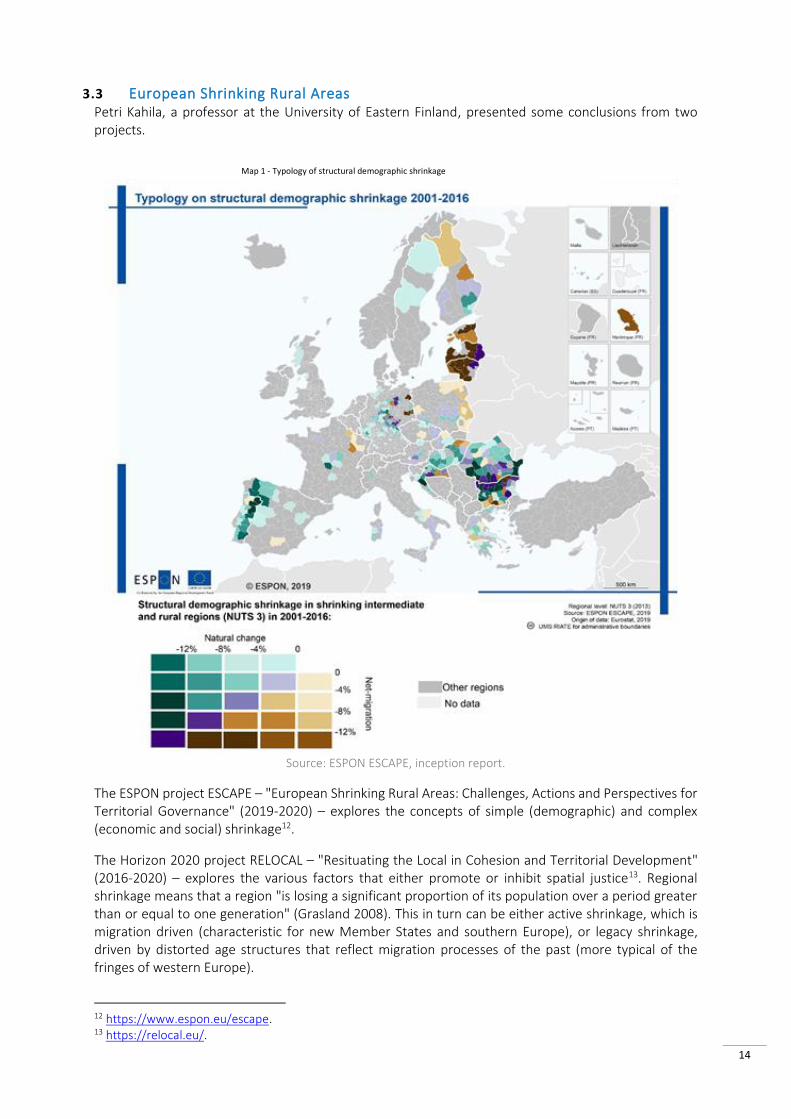
3.3 European Shrinking Rural Areas Petri Kahila, a professor at the University of Eastern Finland, presented some conclusions from two projects.
Source: ESPON ESCAPE, inception report.
The ESPON project ESCAPE – "European Shrinking Rural Areas: Challenges, Actions and Perspectives for Territorial Governance" (2019-2020) – explores the concepts of simple (demographic) and complex (economic and social) shrinkage12.
The Horizon 2020 project RELOCAL – "Resituating the Local in Cohesion and Territorial Development" (2016-2020) – explores the various factors that either promote or inhibit spatial justice13. Regional shrinkage means that a region "is losing a significant proportion of its population over a period greater than or equal to one generation" (Grasland 2008). This in turn can be either active shrinkage, which is migration driven (characteristic for new Member States and southern Europe), or legacy shrinkage, driven by distorted age structures that reflect migration processes of the past (more typical of the fringes of western Europe).
12 https://www.espon.eu/escape. 13 https://relocal.eu/.
Map 1 - Typology of structural demographic shrinkage
15
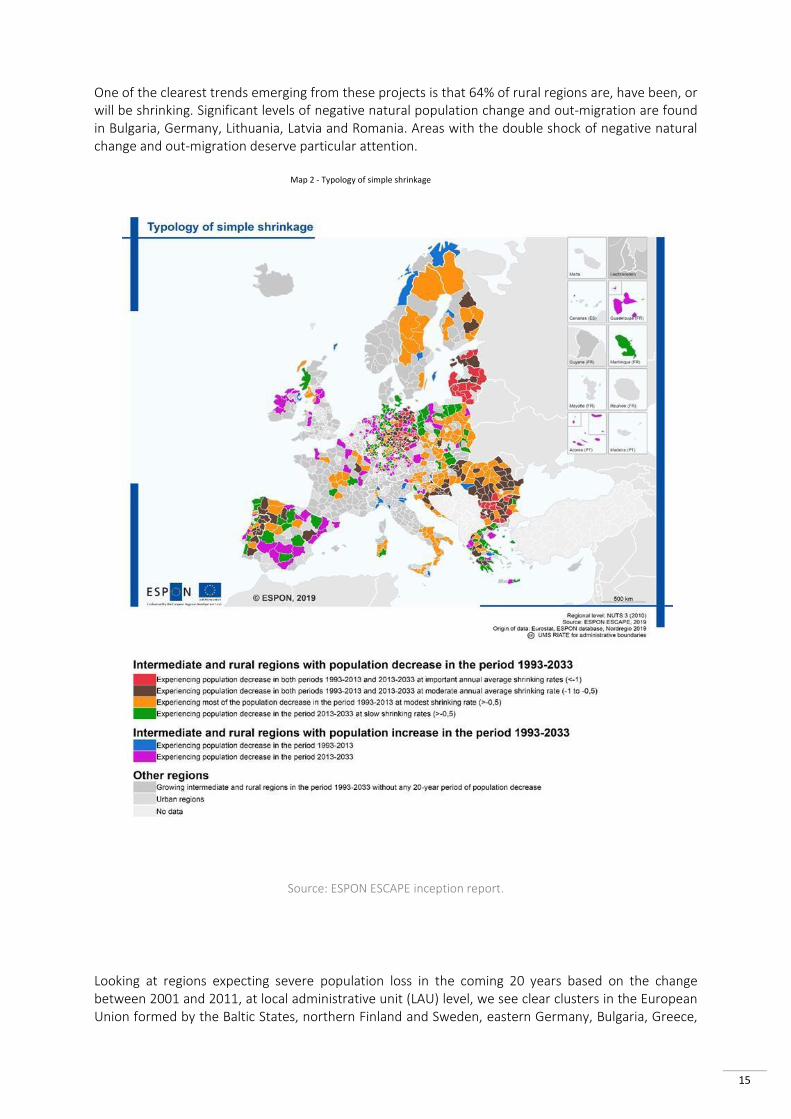
One of the clearest trends emerging from these projects is that 64% of rural regions are, have been, or will be shrinking. Significant levels of negative natural population change and out-migration are found in Bulgaria, Germany, Lithuania, Latvia and Romania. Areas with the double shock of negative natural change and out-migration deserve particular attention.
Source: ESPON ESCAPE inception report.
Looking at regions expecting severe population loss in the coming 20 years based on the change between 2001 and 2011, at local administrative unit (LAU) level, we see clear clusters in the European Union formed by the Baltic States, northern Finland and Sweden, eastern Germany, Bulgaria, Greece,
Map 2 - Typology of simple shrinkage
16
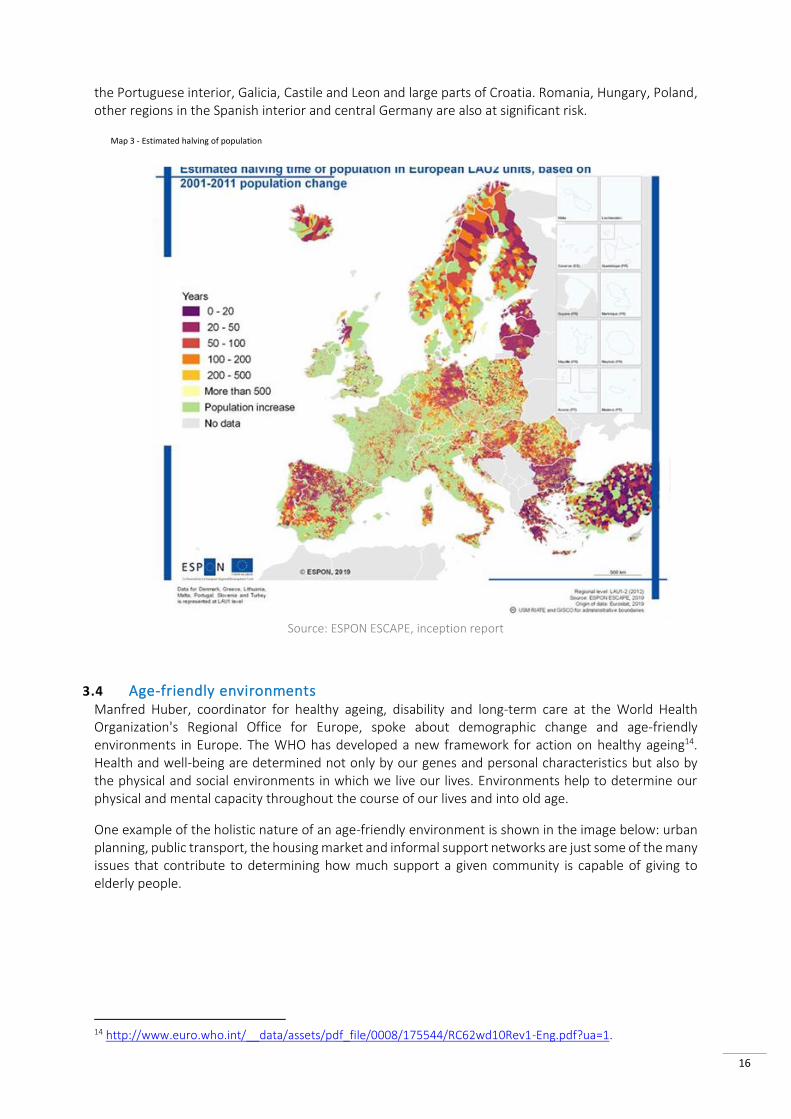
the Portuguese interior, Galicia, Castile and Leon and large parts of Croatia. Romania, Hungary, Poland, other regions in the Spanish interior and central Germany are also at significant risk.
Source: ESPON ESCAPE, inception report
3.4 Age-friendly environments Manfred Huber, coordinator for healthy ageing, disability and long-term care at the World Health Organization's Regional Office for Europe, spoke about demographic change and age-friendly environments in Europe. The WHO has developed a new framework for action on healthy ageing14. Health and well-being are determined not only by our genes and personal characteristics but also by the physical and social environments in which we live our lives. Environments help to determine our physical and mental capacity throughout the course of our lives and into old age.
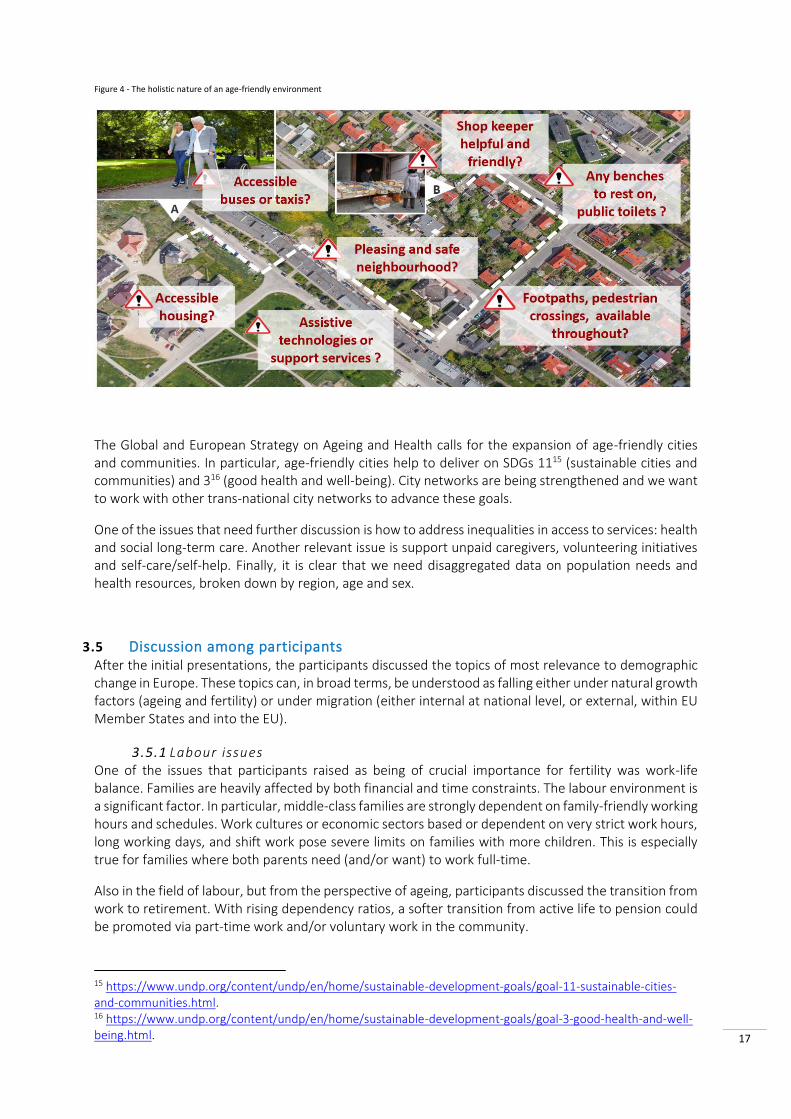
One example of the holistic nature of an age-friendly environment is shown in the image below: urban planning, public transport, the housing market and informal support networks are just some of the many issues that contribute to determining how much support a given community is capable of giving to elderly people.
14 http://www.euro.who.int/__data/assets/pdf_file/0008/175544/RC62wd10Rev1-Eng.pdf?ua=1.
Map 3 - Estimated halving of population
17
Figure 4 - The holistic nature of an age-friendly environment
The Global and European Strategy on Ageing and Health calls for the expansion of age-friendly cities and communities. In particular, age-friendly cities help to deliver on SDGs 1115 (sustainable cities and communities) and 316 (good health and well-being). City networks are being strengthened and we want to work with other trans-national city networks to advance these goals.
One of the issues that need further discussion is how to address inequalities in access to services: health and social long-term care. Another relevant issue is support unpaid caregivers, volunteering initiatives and self-care/self-help. Finally, it is clear that we need disaggregated data on population needs and health resources, broken down by region, age and sex.
3.5 Discussion among participants After the initial presentations, the participants discussed the topics of most relevance to demographic change in Europe. These topics can, in broad terms, be understood as falling either under natural growth factors (ageing and fertility) or under migration (either internal at national level, or external, within EU Member States and into the EU).
3.5.1 Labour issues One of the issues that participants raised as being of crucial importance for fertility was work-life balance. Families are heavily affected by both financial and time constraints. The labour environment is a significant factor. In particular, middle-class families are strongly dependent on family-friendly working hours and schedules. Work cultures or economic sectors based or dependent on very strict work hours, long working days, and shift work pose severe limits on families with more children. This is especially true for families where both parents need (and/or want) to work full-time.
Also in the field of labour, but from the perspective of ageing, participants discussed the transition from work to retirement. With rising dependency ratios, a softer transition from active life to pension could be promoted via part-time work and/or voluntary work in the community.
15 https://www.undp.org/content/undp/en/home/sustainable-development-goals/goal-11-sustainable-cities-and-communities.html. 16 https://www.undp.org/content/undp/en/home/sustainable-development-goals/goal-3-good-health-and-well-being.html.
18
3.5.2 Housing Access to affordable housing was considered to be a relevant factor for demographic change on multiple levels. From the perspective of natural growth, families without access to proper housing conditions for children are more likely either to have none, or to limit themselves to one child. From the perspective of an ageing society, isolation of older people in their homes is problematic – especially in cities, where community ties are weaker. The transition into care homes or serviced apartments could mitigate some of these issues.
Urban areas are especially affected by gentrification. As reported in the urban impact assessment on the implementation of the 2030 Agenda, "the emergence of the sharing economy has changed both the housing and transport markets in many cities"17. This is especially felt in large cities.
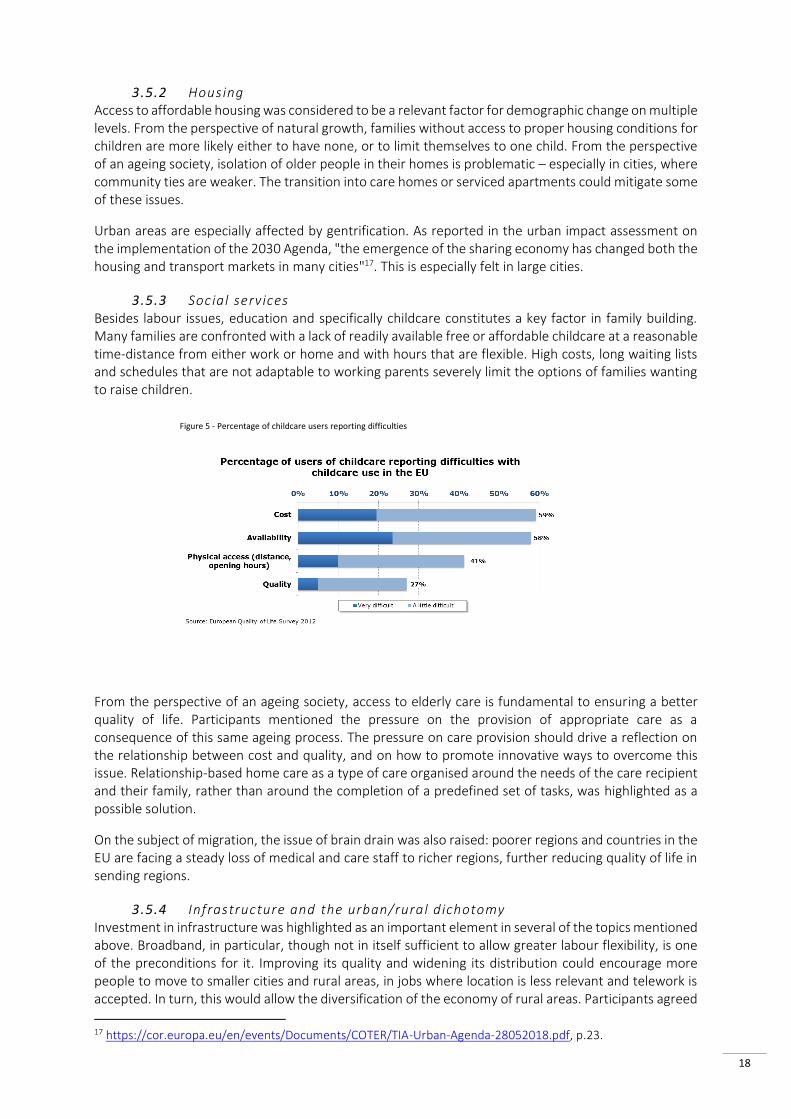
3.5.3 Social services Besides labour issues, education and specifically childcare constitutes a key factor in family building. Many families are confronted with a lack of readily available free or affordable childcare at a reasonable time-distance from either work or home and with hours that are flexible. High costs, long waiting lists and schedules that are not adaptable to working parents severely limit the options of families wanting to raise children.
From the perspective of an ageing society, access to elderly care is fundamental to ensuring a better quality of life. Participants mentioned the pressure on the provision of appropriate care as a consequence of this same ageing process. The pressure on care provision should drive a reflection on the relationship between cost and quality, and on how to promote innovative ways to overcome this issue. Relationship-based home care as a type of care organised around the needs of the care recipient and their family, rather than around the completion of a predefined set of tasks, was highlighted as a possible solution.
On the subject of migration, the issue of brain drain was also raised: poorer regions and countries in the EU are facing a steady loss of medical and care staff to richer regions, further reducing quality of life in sending regions.
3.5.4 Infrastructure and the urban/rural dichotomy Investment in infrastructure was highlighted as an important element in several of the topics mentioned above. Broadband, in particular, though not in itself sufficient to allow greater labour flexibility, is one of the preconditions for it. Improving its quality and widening its distribution could encourage more people to move to smaller cities and rural areas, in jobs where location is less relevant and telework is accepted. In turn, this would allow the diversification of the economy of rural areas. Participants agreed
17 https://cor.europa.eu/en/events/Documents/COTER/TIA-Urban-Agenda-28052018.pdf, p.23.
Figure 5 - Percentage of childcare users reporting difficulties
19
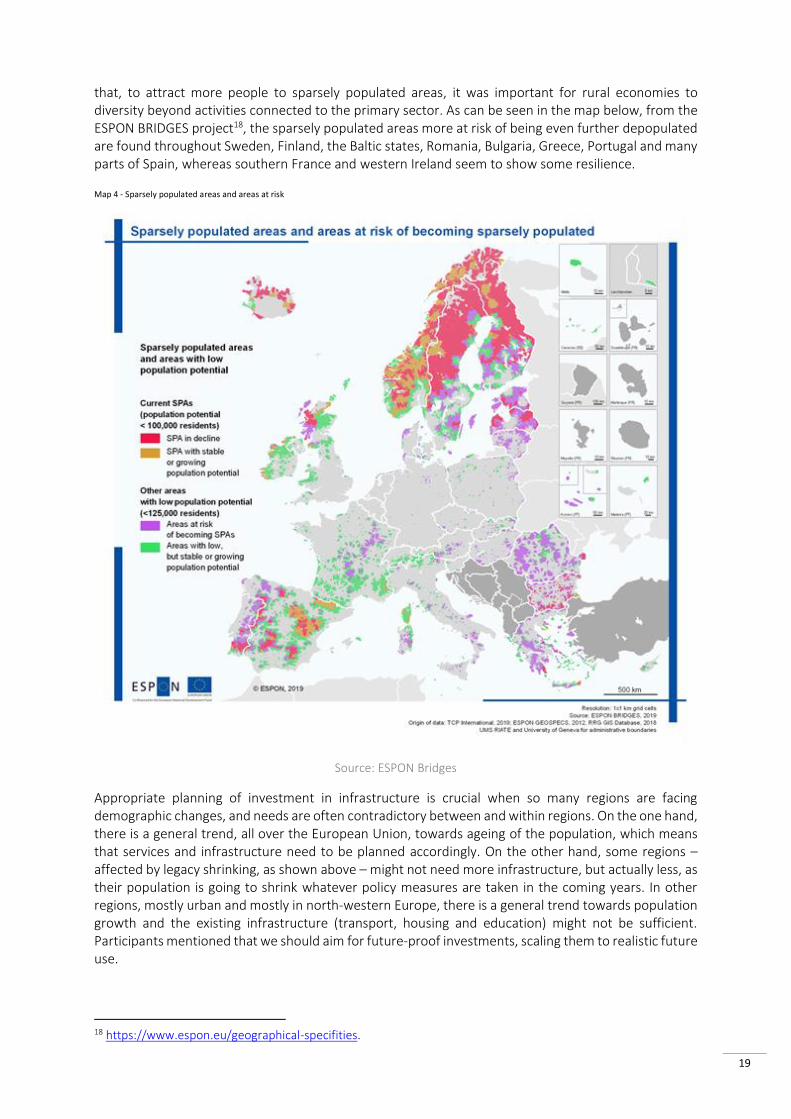
that, to attract more people to sparsely populated areas, it was important for rural economies to diversity beyond activities connected to the primary sector. As can be seen in the map below, from the ESPON BRIDGES project18, the sparsely populated areas more at risk of being even further depopulated are found throughout Sweden, Finland, the Baltic states, Romania, Bulgaria, Greece, Portugal and many parts of Spain, whereas southern France and western Ireland seem to show some resilience.
Map 4 - Sparsely populated areas and areas at risk
Source: ESPON Bridges
Appropriate planning of investment in infrastructure is crucial when so many regions are facing demographic changes, and needs are often contradictory between and within regions. On the one hand, there is a general trend, all over the European Union, towards ageing of the population, which means that services and infrastructure need to be planned accordingly. On the other hand, some regions – affected by legacy shrinking, as shown above – might not need more infrastructure, but actually less, as their population is going to shrink whatever policy measures are taken in the coming years. In other regions, mostly urban and mostly in north-western Europe, there is a general trend towards population growth and the existing infrastructure (transport, housing and education) might not be sufficient. Participants mentioned that we should aim for future-proof investments, scaling them to realistic future use.
18 https://www.espon.eu/geographical-specifities.

20
3.5.5 Financial burdens The financial burden – of the pension system, of incentives to counter negative trends, and of investment in infrastructure to respond to the challenges posed by population ageing, migration trends and attempts at increasing fertility rates – should not be underestimated. All these factors pose pressures on the fiscal system and on tax-payers. Whether that pressure comes from direct tax raises or the burden is delayed by means of public debt (which poses issues of intergenerational fairness, given that future tax-payers will be responsible for the choices of current voters) a thorough consideration of what is affordable should not be forgotten.
21
Expected societal effects
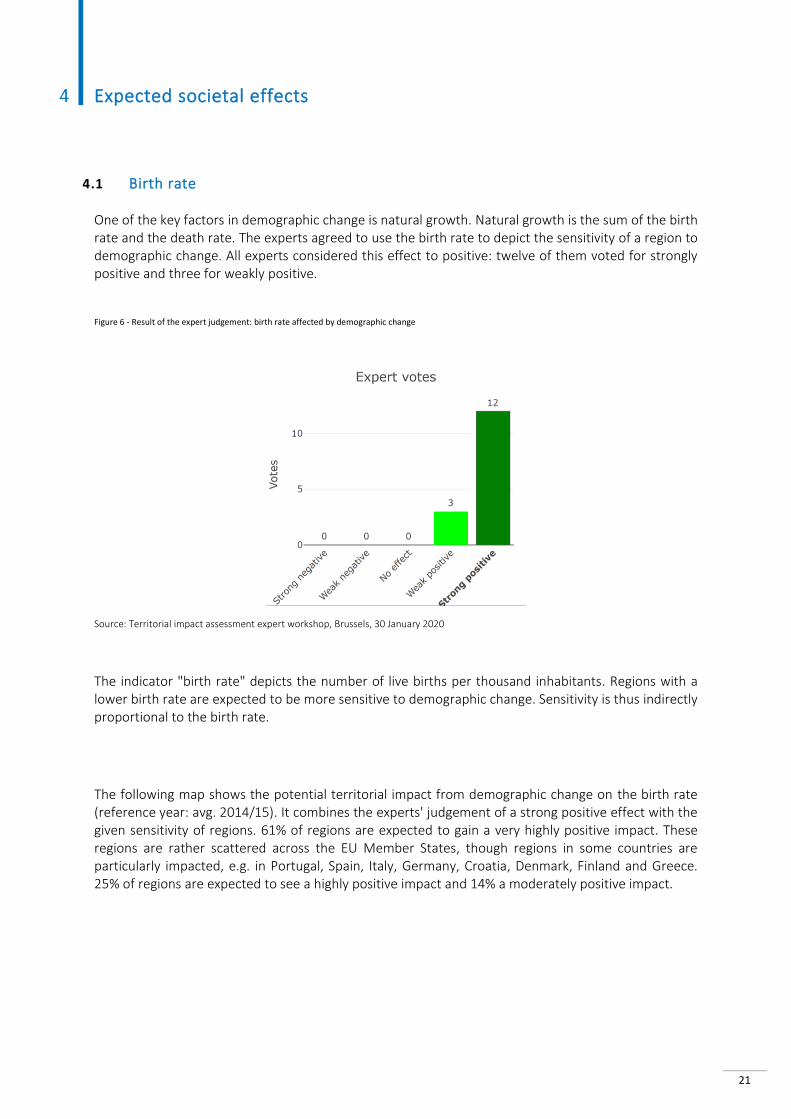
4.1 Birth rate One of the key factors in demographic change is natural growth. Natural growth is the sum of the birth rate and the death rate. The experts agreed to use the birth rate to depict the sensitivity of a region to demographic change. All experts considered this effect to positive: twelve of them voted for strongly positive and three for weakly positive.
Figure 6 - Result of the expert judgement: birth rate affected by demographic change
Source: Territorial impact assessment expert workshop, Brussels, 30 January 2020
The indicator "birth rate" depicts the number of live births per thousand inhabitants. Regions with a lower birth rate are expected to be more sensitive to demographic change. Sensitivity is thus indirectly proportional to the birth rate.
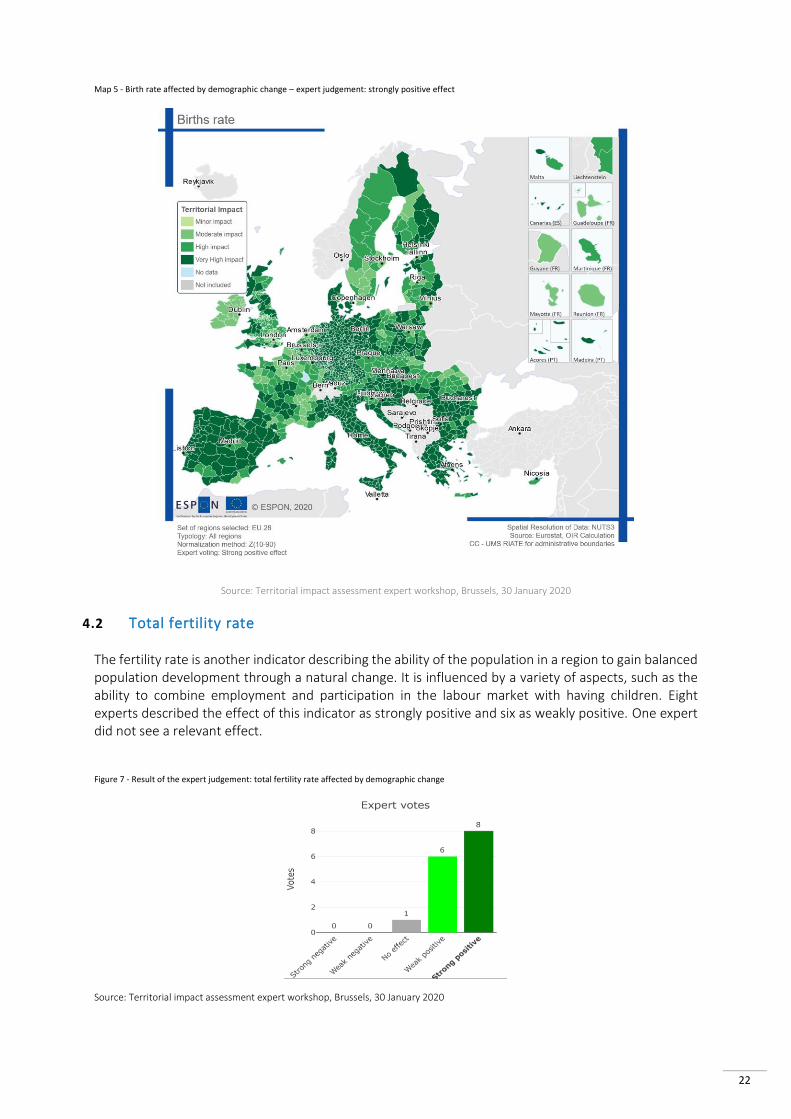
The following map shows the potential territorial impact from demographic change on the birth rate (reference year: avg. 2014/15). It combines the experts' judgement of a strong positive effect with the given sensitivity of regions. 61% of regions are expected to gain a very highly positive impact. These regions are rather scattered across the EU Member States, though regions in some countries are particularly impacted, e.g. in Portugal, Spain, Italy, Germany, Croatia, Denmark, Finland and Greece. 25% of regions are expected to see a highly positive impact and 14% a moderately positive impact.
22
Map 5 - Birth rate affected by demographic change – expert judgement: strongly positive effect
Source: Territorial impact assessment expert workshop, Brussels, 30 January 2020
4.2 Total fertility rate The fertility rate is another indicator describing the ability of the population in a region to gain balanced population development through a natural change. It is influenced by a variety of aspects, such as the ability to combine employment and participation in the labour market with having children. Eight experts described the effect of this indicator as strongly positive and six as weakly positive. One expert did not see a relevant effect.
Figure 7 - Result of the expert judgement: total fertility rate affected by demographic change
Source: Territorial impact assessment expert workshop, Brussels, 30 January 2020
23
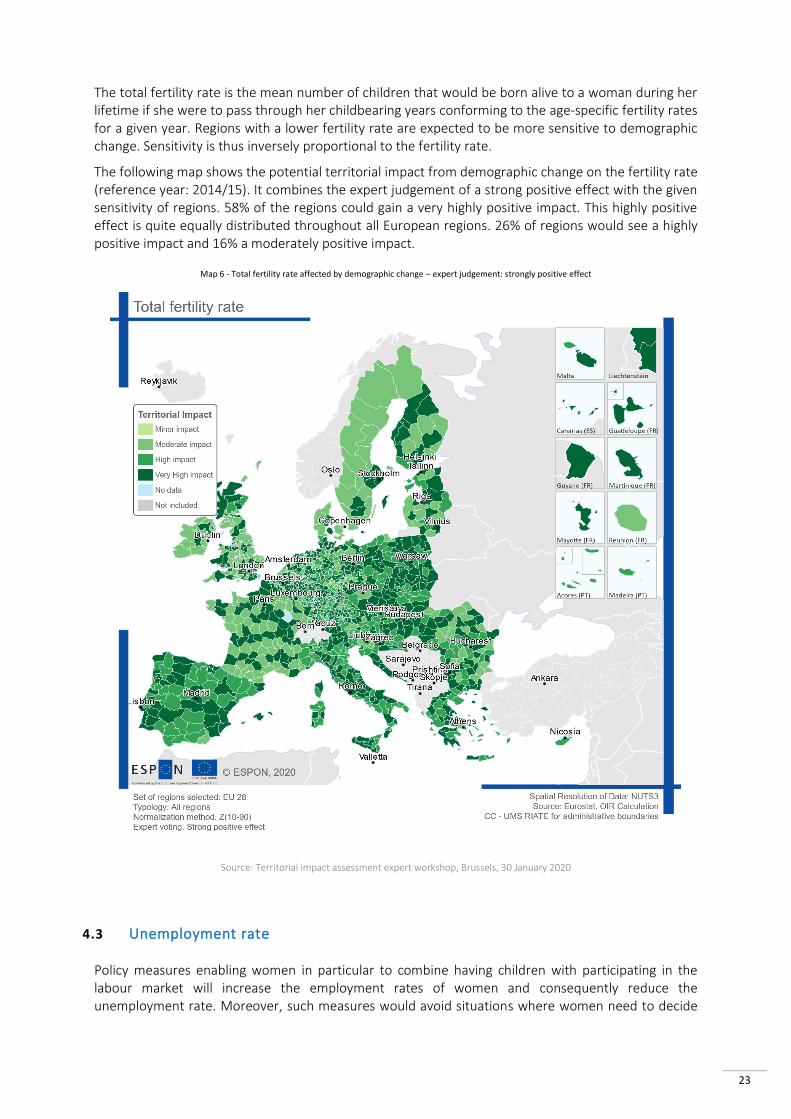
The total fertility rate is the mean number of children that would be born alive to a woman during her lifetime if she were to pass through her childbearing years conforming to the age-specific fertility rates for a given year. Regions with a lower fertility rate are expected to be more sensitive to demographic change. Sensitivity is thus inversely proportional to the fertility rate.
The following map shows the potential territorial impact from demographic change on the fertility rate (reference year: 2014/15). It combines the expert judgement of a strong positive effect with the given sensitivity of regions. 58% of the regions could gain a very highly positive impact. This highly positive effect is quite equally distributed throughout all European regions. 26% of regions would see a highly positive impact and 16% a moderately positive impact.
Map 6 - Total fertility rate affected by demographic change – expert judgement: strongly positive effect
Source: Territorial impact assessment expert workshop, Brussels, 30 January 2020
4.3 Unemployment rate Policy measures enabling women in particular to combine having children with participating in the labour market will increase the employment rates of women and consequently reduce the unemployment rate. Moreover, such measures would avoid situations where women need to decide
24
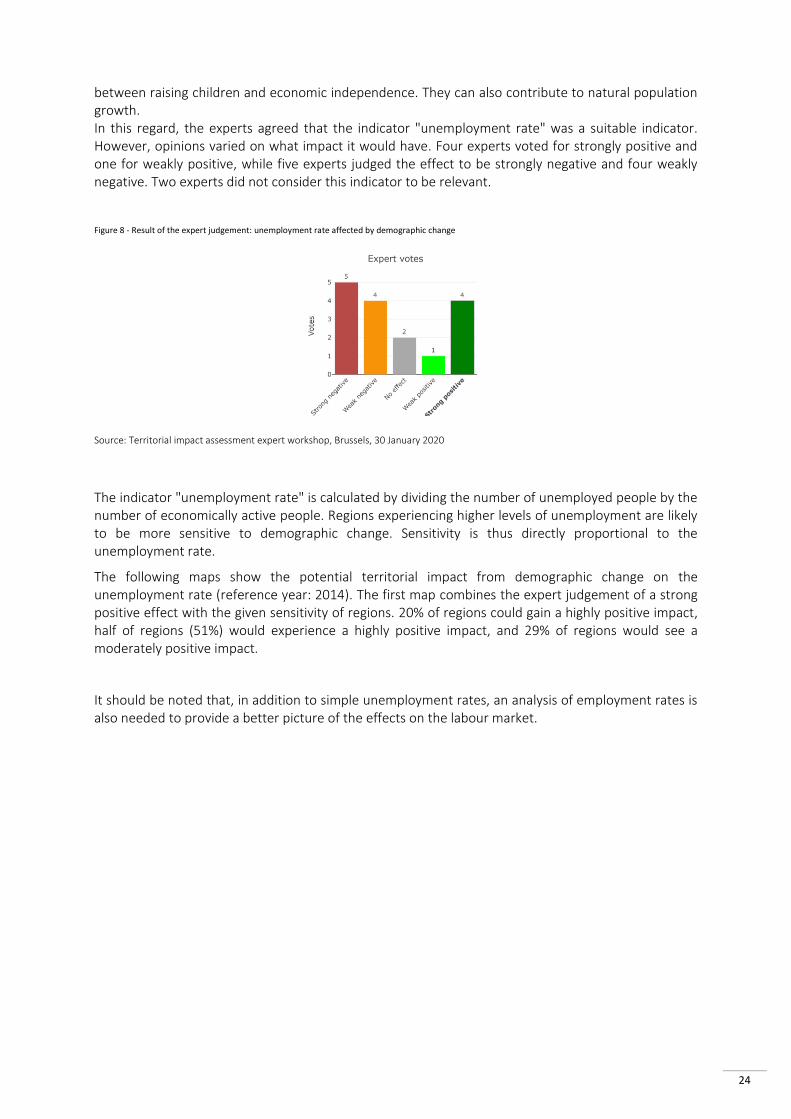
between raising children and economic independence. They can also contribute to natural population growth. In this regard, the experts agreed that the indicator "unemployment rate" was a suitable indicator. However, opinions varied on what impact it would have. Four experts voted for strongly positive and one for weakly positive, while five experts judged the effect to be strongly negative and four weakly negative. Two experts did not consider this indicator to be relevant.
Figure 8 - Result of the expert judgement: unemployment rate affected by demographic change
Source: Territorial impact assessment expert workshop, Brussels, 30 January 2020
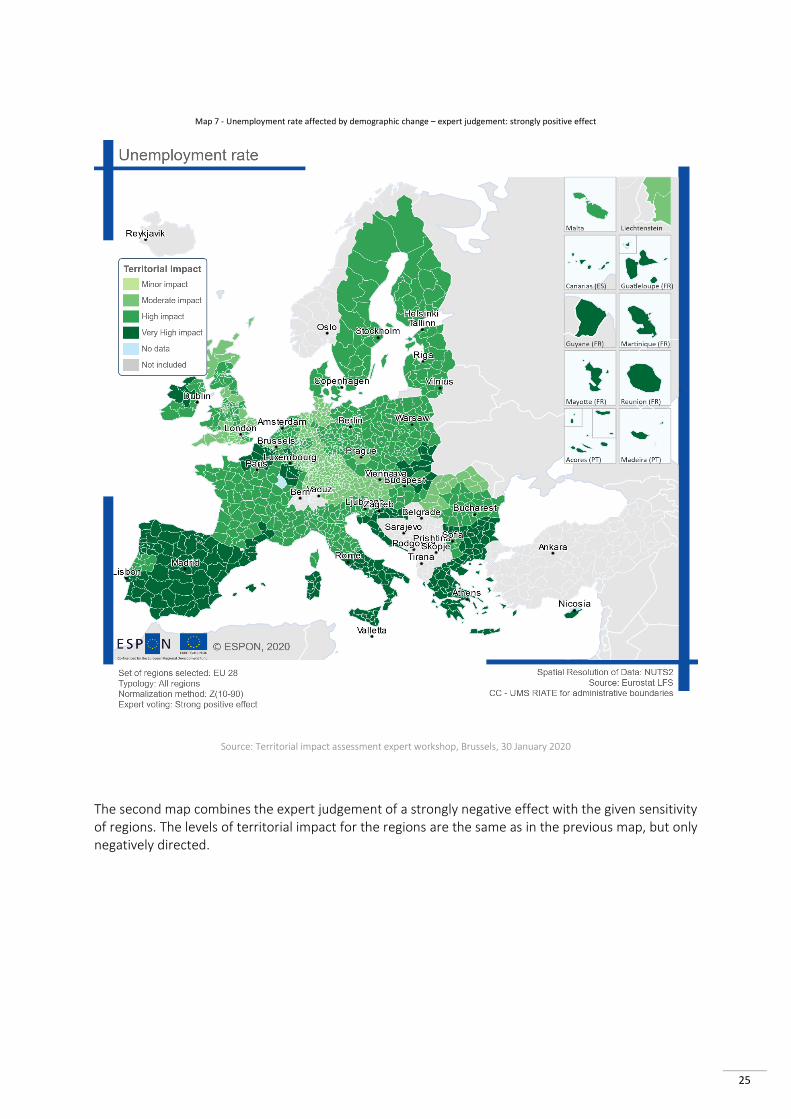
The indicator "unemployment rate" is calculated by dividing the number of unemployed people by the number of economically active people. Regions experiencing higher levels of unemployment are likely to be more sensitive to demographic change. Sensitivity is thus directly proportional to the unemployment rate.
The following maps show the potential territorial impact from demographic change on the unemployment rate (reference year: 2014). The first map combines the expert judgement of a strong positive effect with the given sensitivity of regions. 20% of regions could gain a highly positive impact, half of regions (51%) would experience a highly positive impact, and 29% of regions would see a moderately positive impact.
It should be noted that, in addition to simple unemployment rates, an analysis of employment rates is also needed to provide a better picture of the effects on the labour market.
25
Map 7 - Unemployment rate affected by demographic change – expert judgement: strongly positive effect
Source: Territorial impact assessment expert workshop, Brussels, 30 January 2020
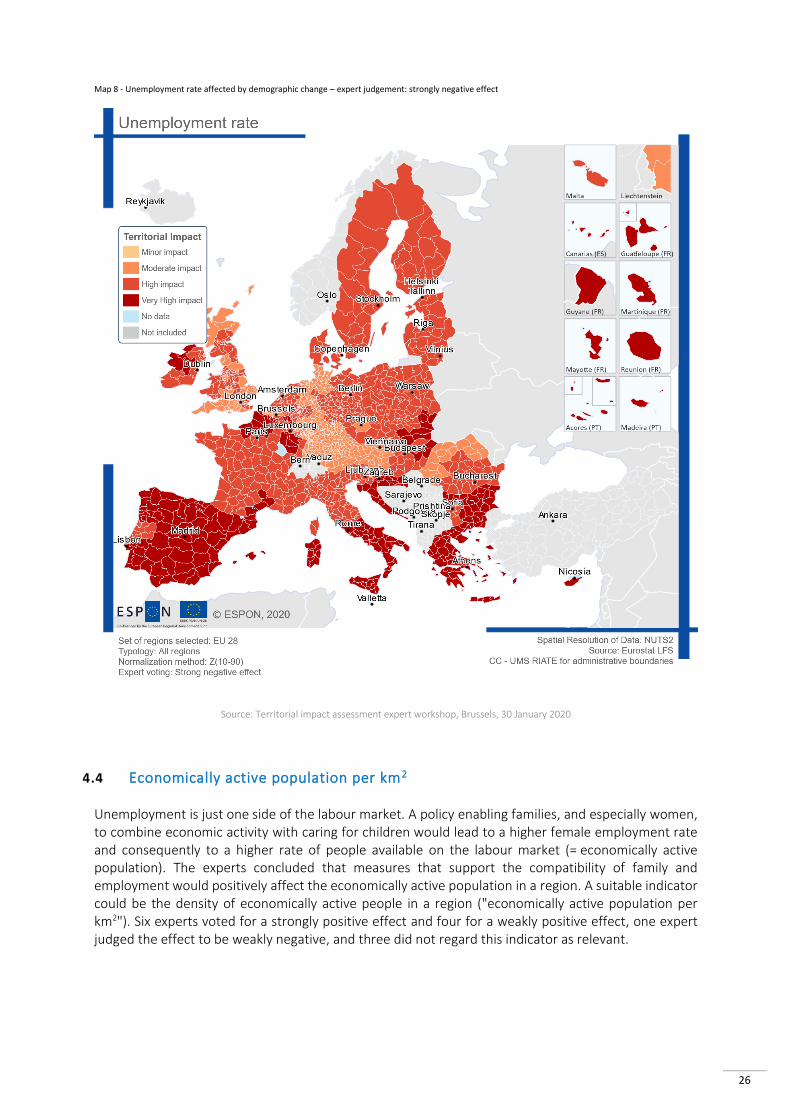
The second map combines the expert judgement of a strongly negative effect with the given sensitivity of regions. The levels of territorial impact for the regions are the same as in the previous map, but only negatively directed.
26
Map 8 - Unemployment rate affected by demographic change – expert judgement: strongly negative effect
Source: Territorial impact assessment expert workshop, Brussels, 30 January 2020
4.4 Economically active population per km2 Unemployment is just one side of the labour market. A policy enabling families, and especially women, to combine economic activity with caring for children would lead to a higher female employment rate and consequently to a higher rate of people available on the labour market (= economically active population). The experts concluded that measures that support the compatibility of family and employment would positively affect the economically active population in a region. A suitable indicator could be the density of economically active people in a region ("economically active population per km2"). Six experts voted for a strongly positive effect and four for a weakly positive effect, one expert judged the effect to be weakly negative, and three did not regard this indicator as relevant.
27
Figure 9 - Result of the expert judgement: economically active population per km2 affected by demographic change
Source: Territorial impact assessment expert workshop, Brussels, 30 January 2020
The indicator "economically active population" depicts the density of the economically active population aged 15-64 per km2. It includes both employed (employees and self-employed) and unemployed people, but not economically inactive people, such as pre-school and school-age children, students and pensioners. Regions with a higher density of active population are expected to be less influenced by changes resulting from a policy supporting the employment of women through greater childcare provision in the regions. Sensitivity is thus indirectly proportional to the density of active population.
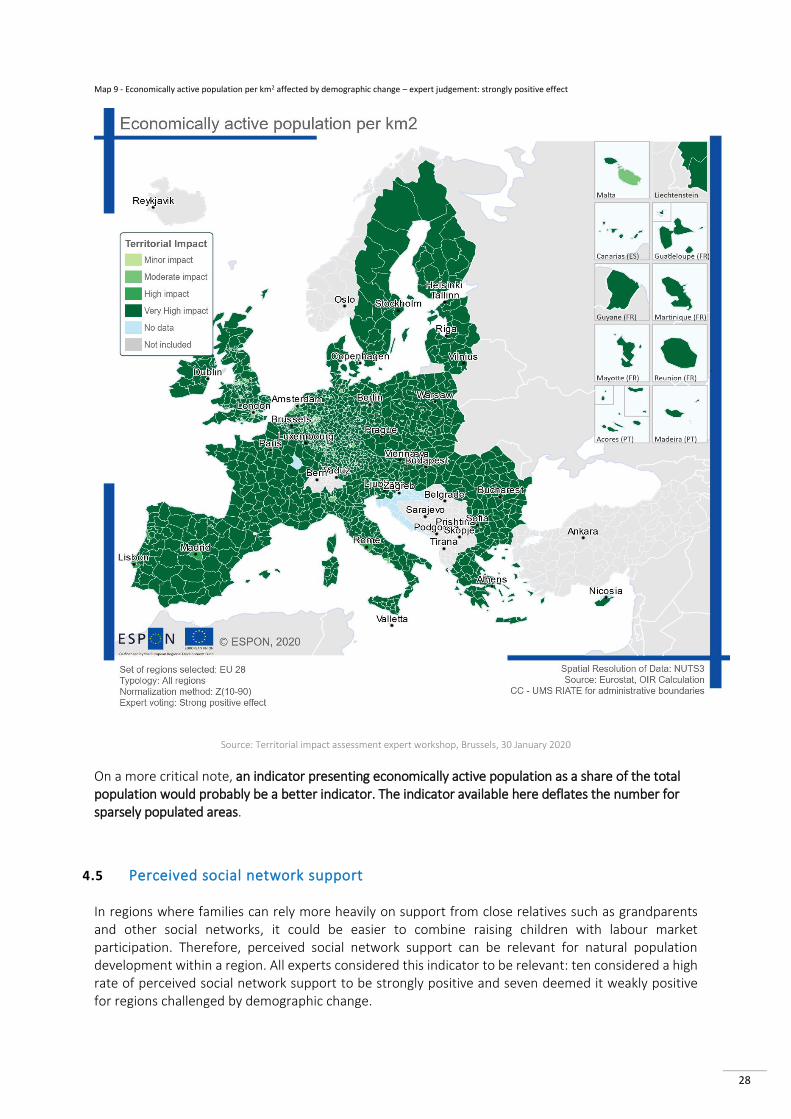
The following map shows the potential territorial impact from demographic change on the economically active population per km2 (reference year: 2016). It combines the expert judgement of a strong positive effect with the given sensitivity of regions. The majority of the regions (83%) would see a very highly positive impact, while 6% could experience a highly positive impact. These regions are mainly rural and relatively sparsely populated. 11% of regions would see a moderately positive impact.
28
Map 9 - Economically active population per km2 affected by demographic change – expert judgement: strongly positive effect
Source: Territorial impact assessment expert workshop, Brussels, 30 January 2020
On a more critical note, an indicator presenting economically active population as a share of the total population would probably be a better indicator. The indicator available here deflates the number for sparsely populated areas.
4.5 Perceived social network support In regions where families can rely more heavily on support from close relatives such as grandparents and other social networks, it could be easier to combine raising children with labour market participation. Therefore, perceived social network support can be relevant for natural population development within a region. All experts considered this indicator to be relevant: ten considered a high rate of perceived social network support to be strongly positive and seven deemed it weakly positive for regions challenged by demographic change.
29
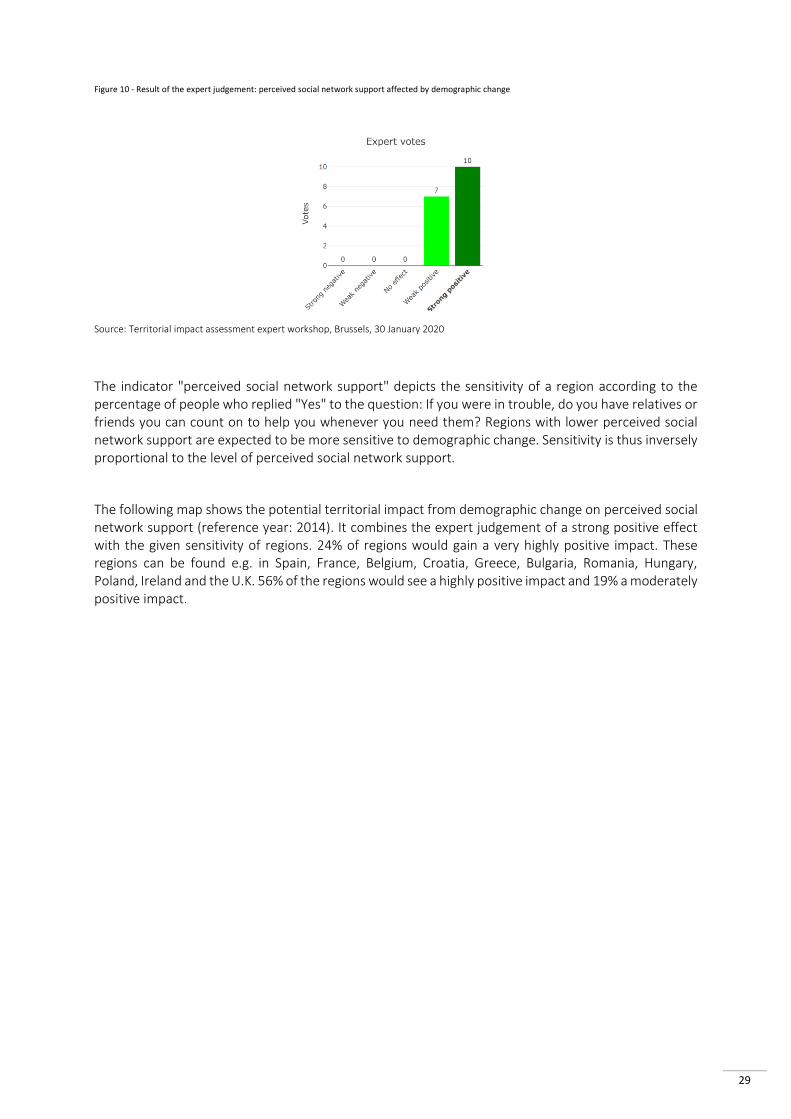
Figure 10 - Result of the expert judgement: perceived social network support affected by demographic change
Source: Territorial impact assessment expert workshop, Brussels, 30 January 2020
The indicator "perceived social network support" depicts the sensitivity of a region according to the percentage of people who replied "Yes" to the question: If you were in trouble, do you have relatives or friends you can count on to help you whenever you need them? Regions with lower perceived social network support are expected to be more sensitive to demographic change. Sensitivity is thus inversely proportional to the level of perceived social network support.
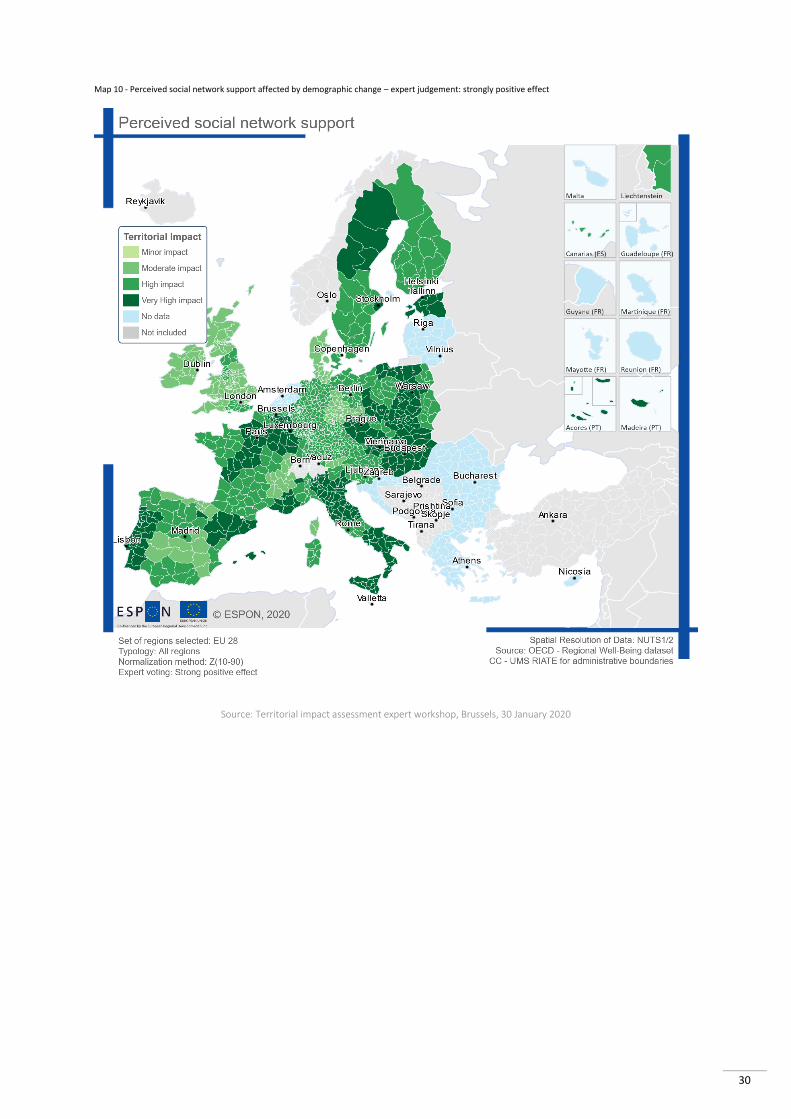
The following map shows the potential territorial impact from demographic change on perceived social network support (reference year: 2014). It combines the expert judgement of a strong positive effect with the given sensitivity of regions. 24% of regions would gain a very highly positive impact. These regions can be found e.g. in Spain, France, Belgium, Croatia, Greece, Bulgaria, Romania, Hungary, Poland, Ireland and the U.K. 56% of the regions would see a highly positive impact and 19% a moderately positive impact.
30
Map 10 - Perceived social network support affected by demographic change – expert judgement: strongly positive effect
Source: Territorial impact assessment expert workshop, Brussels, 30 January 2020
31
Expected governmental effects
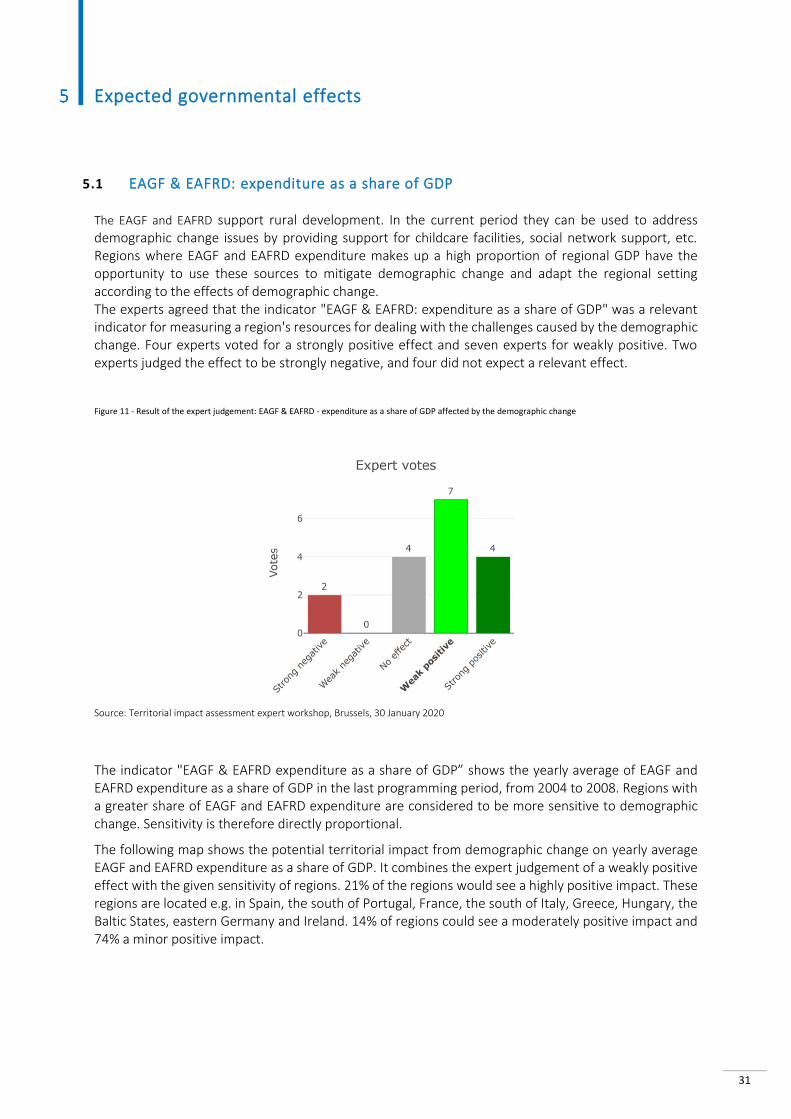
5.1 EAGF & EAFRD: expenditure as a share of GDP The EAGF and EAFRD support rural development. In the current period they can be used to address demographic change issues by providing support for childcare facilities, social network support, etc. Regions where EAGF and EAFRD expenditure makes up a high proportion of regional GDP have the opportunity to use these sources to mitigate demographic change and adapt the regional setting according to the effects of demographic change. The experts agreed that the indicator "EAGF & EAFRD: expenditure as a share of GDP" was a relevant indicator for measuring a region's resources for dealing with the challenges caused by the demographic change. Four experts voted for a strongly positive effect and seven experts for weakly positive. Two experts judged the effect to be strongly negative, and four did not expect a relevant effect.
Figure 11 - Result of the expert judgement: EAGF & EAFRD - expenditure as a share of GDP affected by the demographic change
Source: Territorial impact assessment expert workshop, Brussels, 30 January 2020
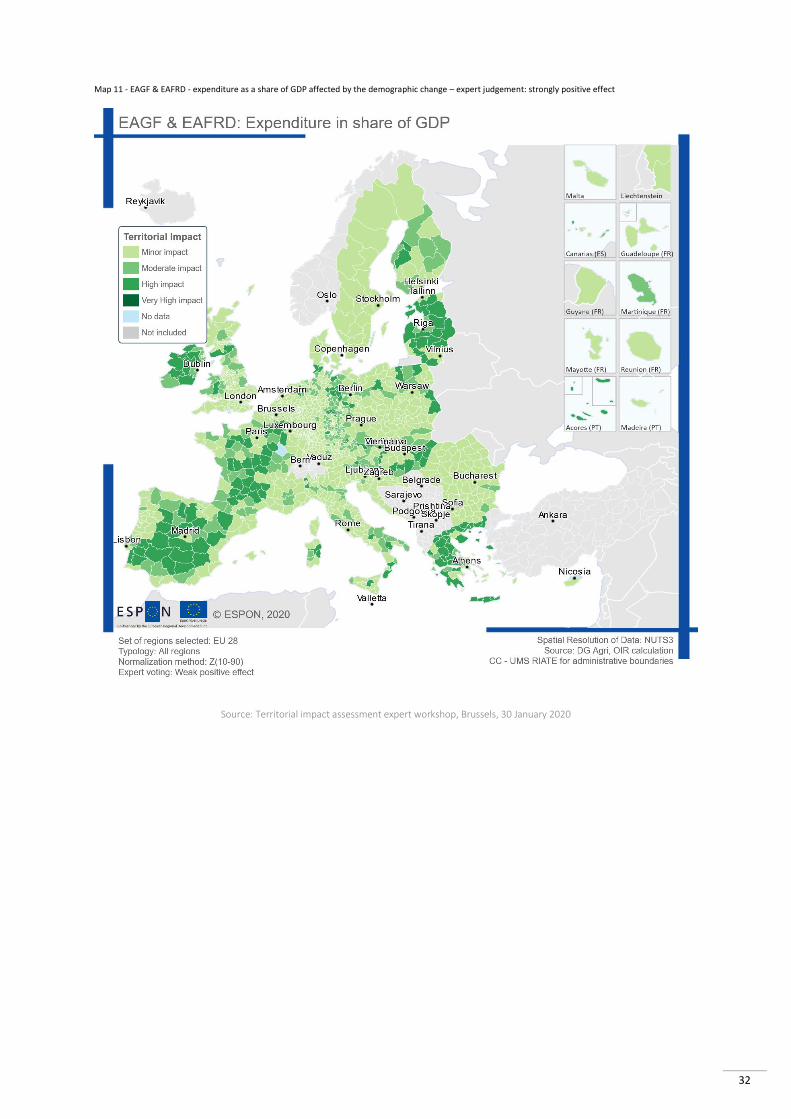
The indicator "EAGF & EAFRD expenditure as a share of GDP” shows the yearly average of EAGF and EAFRD expenditure as a share of GDP in the last programming period, from 2004 to 2008. Regions with a greater share of EAGF and EAFRD expenditure are considered to be more sensitive to demographic change. Sensitivity is therefore directly proportional.
The following map shows the potential territorial impact from demographic change on yearly average EAGF and EAFRD expenditure as a share of GDP. It combines the expert judgement of a weakly positive effect with the given sensitivity of regions. 21% of the regions would see a highly positive impact. These regions are located e.g. in Spain, the south of Portugal, France, the south of Italy, Greece, Hungary, the Baltic States, eastern Germany and Ireland. 14% of regions could see a moderately positive impact and 74% a minor positive impact.
32
Map 11 - EAGF & EAFRD - expenditure as a share of GDP affected by the demographic change – expert judgement: strongly positive effect
Source: Territorial impact assessment expert workshop, Brussels, 30 January 2020
33
Expected economic effects
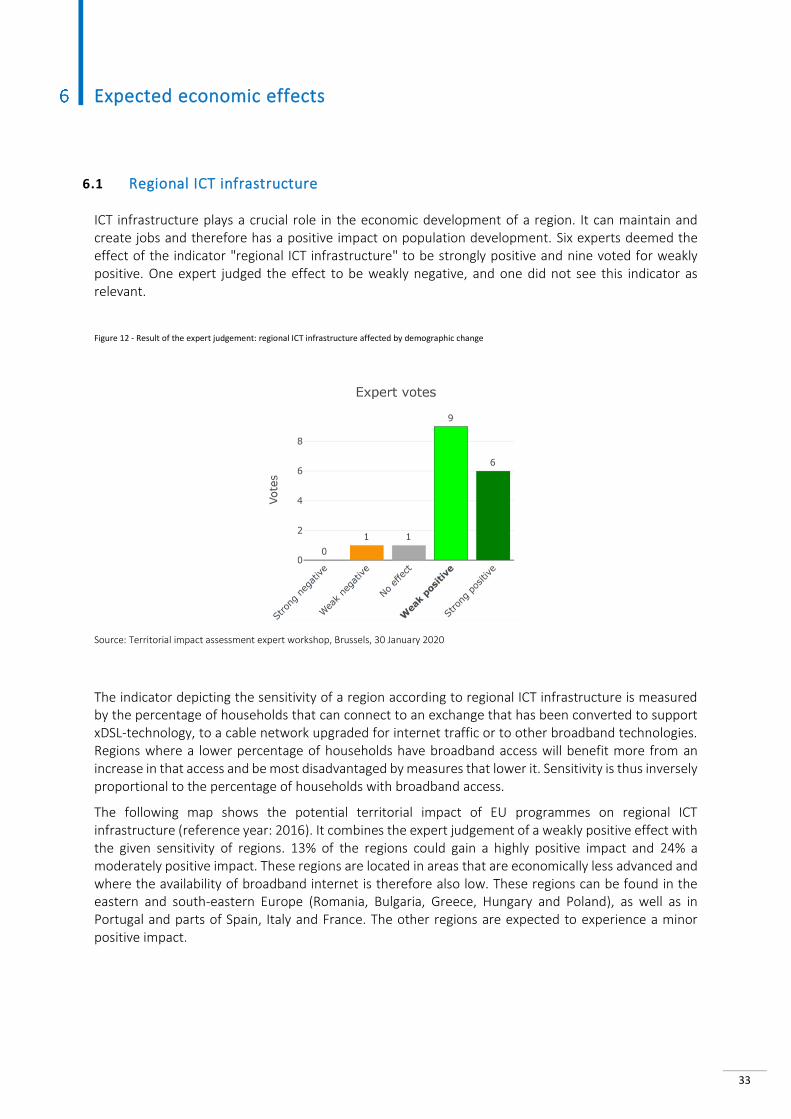
6.1 Regional ICT infrastructure ICT infrastructure plays a crucial role in the economic development of a region. It can maintain and create jobs and therefore has a positive impact on population development. Six experts deemed the effect of the indicator "regional ICT infrastructure" to be strongly positive and nine voted for weakly positive. One expert judged the effect to be weakly negative, and one did not see this indicator as relevant.
Figure 12 - Result of the expert judgement: regional ICT infrastructure affected by demographic change
Source: Territorial impact assessment expert workshop, Brussels, 30 January 2020
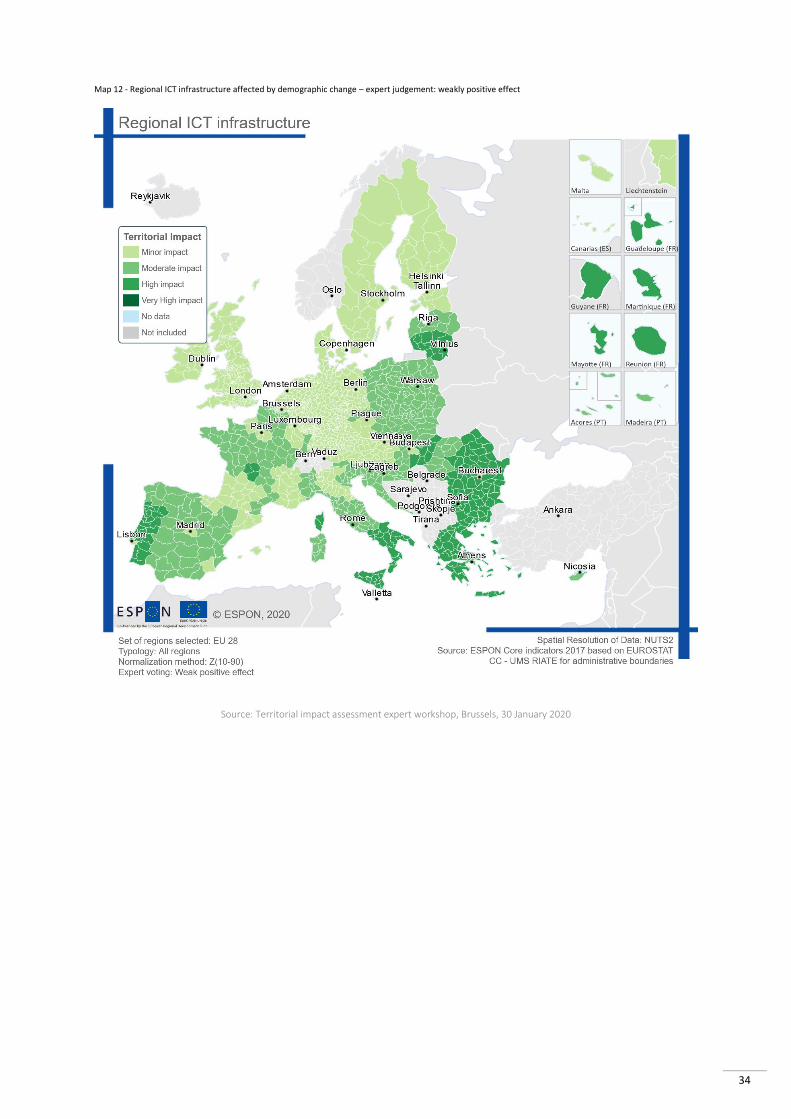
The indicator depicting the sensitivity of a region according to regional ICT infrastructure is measured by the percentage of households that can connect to an exchange that has been converted to support xDSL-technology, to a cable network upgraded for internet traffic or to other broadband technologies. Regions where a lower percentage of households have broadband access will benefit more from an increase in that access and be most disadvantaged by measures that lower it. Sensitivity is thus inversely proportional to the percentage of households with broadband access.
The following map shows the potential territorial impact of EU programmes on regional ICT infrastructure (reference year: 2016). It combines the expert judgement of a weakly positive effect with the given sensitivity of regions. 13% of the regions could gain a highly positive impact and 24% a moderately positive impact. These regions are located in areas that are economically less advanced and where the availability of broadband internet is therefore also low. These regions can be found in the eastern and south-eastern Europe (Romania, Bulgaria, Greece, Hungary and Poland), as well as in Portugal and parts of Spain, Italy and France. The other regions are expected to experience a minor positive impact.
34
Map 12 - Regional ICT infrastructure affected by demographic change – expert judgement: weakly positive effect
Source: Territorial impact assessment expert workshop, Brussels, 30 January 2020
35
Experts' policy recommendations
Based on the range of topics discussed at the workshop, the participants highlighted a series of potential measures. They also discussed other statistical indicators that could be relevant in supporting further decision-making, but that were non-existent (at least at regional level), and further issues that could also be worthy of further consideration.
7.1 Missing aspects and statistical indicators
Participants discussed the importance of subjective factors in fertility rates. While economic conditions that can be factors in the choice to have children might be easily captured by statistical data (such as poverty), other factors might be much harder to depict. These factors are relevant since it is unlikely that traditional natalist policies (based on distribution of money, farmland or tax benefits) are applicable in 21st century Europe – especially for the urban middle classes, who are not poor enough to feel content with a minor redistribution of income but not rich enough to feel the effects of any tax breaks, and are in no way interested in returning to a subsistence farming economy.
One example of such factors is what kind of housing conditions individuals and families find appropriate. The average cost of housing per square metre could be a useful indicator, but other factors (number of rooms, location versus commuting times, etc.) should not be overlooked.
Pensions are typically organised along national or occupational lines. One of the interesting components of old age income that could be looked into is old-age housing benefits, which might differ by region.
In addition, it is probably worth mentioning that pensions often play a role in decreasing inequality. Old-age income tends to be less unequally distributed than working age income because of redistributional elements in pension systems. It makes sense to assume that pensions also at least partially reduce some of the regional inequalities. However, as pensions have become more closely linked to lifetime earnings, this dampening of inequalities is likely to diminish over time.
It is particularly important for statistical authorities to collect age/sex population data at the most detailed spatial level, analyse this data, prepare cohort survival demographic projections, and regularly publish this data on the internet. This could form the basis for the public and private sectors to optimise their plans and developments in line with the current situation and projected numbers of the ageing population.
Another issue is general quality of life and happiness. Although attempts have been made to create indicators and composite indexes to reflect this reality19, the challenges already found in the field of regional SDGs are testament to the difficulty of presenting a detailed picture of the differences between regions in such fields.
One of the crucial factors for fertility in Europe nowadays is how to balance parenting with individual (and, especially, female) aspirations to economic security, independence and career and work satisfaction. Though some statistical indicators (such as total activity rate and employment rate per gender) can give us some clues, they do not necessarily give a clear picture of the hurdles that families and women face in every country in balancing the desire to have children with individual self-realisation, economic and personal security and career satisfaction. Further research in this field would be welcome.
Some of the measures below target these aspects.
19 https://worldhappiness.report/ .
36
7.2 Measures to address low fertility and ageing
Affordable childcare with flexible hours adapted to working parents is one of the main solutions to low fertility rates, especially among the middle classes. European funding (through the ESF or the ERDF) should be made available for national, regional and local authorities to invest in creating a network of childcare facilities.
Social and informal networks of care (within families, among neighbours, and for both child and elderly care) should receive support, as they can help to relieve pressure on public services and reduce financial pressures. Furthermore, informal care can be an effective means of addressing phenomena such as personal isolation and elderly solitude, a typically (though not exclusively) urban issue.
Part-time employment or voluntary social work can be encouraged as means of addressing shortcomings in social services, helping to improve economic conditions for pensioners and maintaining social ties and physical activity, contributing to better health conditions.
While standardising salaries or economic conditions at European level is not a credible (or feasible) solution, a standardisation process and a search for good practices throughout the EU could help solve issues relating to governance and provision of social services.
7.3 Measures to address migration
• Housing policies, addressing the specificities of both urban and rural needs, can help to maintain the population in rural areas and tackle the phenomenon of gentrification in cities. Focusing in particular on mid-size cities could help to bridge the gap between the strangulation of the housing market in big cities and the desertion of rural areas.
Improve connectivity and ICT accessibility, especially in regions that are challenged by out-migration. Along with the generalisation of work practices such as teleworking, this could help promote better work-life balance for working parents and diversify the economies of rural regions and smaller cities.
In regions that are affected by high out-migration, the availability of jobs is a key factor. Public investment traditionally does not generate sustainable jobs. A functioning local and regional economy is the only way forward, and that requires private investment. The promotion of entrepreneurship – and a focus on the diversification of local economies – must be considered as one of the tools to help regions affected by this phenomenon to maintain (or even attract) population.
7.4 Measures to address depopulation
The attractiveness of rural areas can be improved through the availability of high-quality public services. Investment in public services can require economies of scale that are difficult to achieve in low-density areas, so communities must identify other arrangements to ensure adequate service provision. This includes investment in broadband to facilitate digital solutions such as telemedicine and remote education. Integrated service delivery is one approach frequently used to improve access to services by improving the cost, quality, and accessibility of services in rural areas.
The current rural development model (ESF, EAFRD) has proved ineffective in its attempts stop the process of population loss and in its contribution to fostering social and economic rebalancing. To a large extent, policies are focused on the farming sector, therefore not addressing socioeconomic and demographic shifts.
Rural policies should aim to build an innovation eco-system to support knowledge creation and technological diffusion. One key task is to build scale by establishing common virtual and physical environments to bring together firms, entrepreneurs and research institutions. An
37
enabling environment for rural innovation can also be supported by investment in skills and ICT infrastructure, facilitating access to capital for entrepreneurs and SMEs, and supporting local supply chain development linked with industries such as mining and forestry.
Another aspect that can be implemented is rural proofing in all European policies (laws, funds, recommendations, etc.). Rural proofing aims to understand the impacts of government policy intervention and to ensure fair and equitable policy outcomes for rural areas. Rural proofing is about finding the best ways to deliver policies in rural areas. This could mean that implementation might need to be designed and delivered differently compared to urban areas. It is possible to overcome undesirable policy impacts in rural areas by designing and delivering proportionate solutions.20
20 For further reading on this topic, the Southern Sparsely Populated Areas has published a position paper: http://sspa-network.eu/wp-content/uploads/Position-Paper-SSPA-EUROPE-2019.pdf. They have also published a report on the Model of Rural Development of the Highlands and Islands as a successful experience: http://sspa-network.eu/wp-content/uploads/HIE-SSPA-Report-complete-document-1.pdf.

38
Recommendations from previous TIA Exercises
Below we include excerpts from TIA exercises held in the Committee of the Regions in recent years, in cooperation with the ESPON EGTC, that could provide further contributions to the topic of demographic change.
8.1 New Skills Agenda21 The experts believed that skills development should start as early as kindergarten and that school curricula should be more practical and responsive to labour market needs than they are today, ensuring equal opportunities in attaining a minimum set of skills. (…)
To this end, it is necessary for local partnerships between education systems, employers and LRAs to be created. In many cases there is a resistance or lack of interest from some or all the parties which should be cooperating in addressing the need for relevant skills. Skills should be geared to demand from employers, and for this reason it is important to create and support such partnerships. The experts noted that skills needs emerge and evolve quickly, and it is key to be able to respond to those needs in a short space of time.
There are certain skills that cannot be measured at this moment, although they are very relevant. Certification is needed of some of these skills (e.g. Chambers of Commerce could provide this) so that the citizens, especially those which are less-qualified, would be recognised for their skills. (…)
These programmes should allow cities to gear their projects to local needs, removing the unnecessary administrative burden and unrealistic expectations that come from some of these programmes.
Training sessions should be tailor made and local, and available in city areas, especially those facing the challenges of poverty and high unemployment. A model programme should be established to demonstrate to the target groups that it is possible to move up in life by developing skills through education and training. There are certain limitations that cannot be easily overcome, such as resistance and barriers to mobility within and between EU Member States. Languages, as well as other crosscutting skills, are considered to be key skills for addressing today's labour market needs across Europe.
(…)
Financing should be either directly accessible by cities or directed to cities from the MS in order to make the programmes more efficient.
EU-wide sharing of good practices would be desirable, as many good projects on developing skills are created and implemented in different EU Member States. (…)
8.2 Implementation of the Work-Life Balance Directive22 In general, the experts agreed that this directive would have a positive effect on Europe with a cohesive effect on the EU's regions. It was clear to them that the effects of this directive, largely expected to be positive, would have a higher impact on urban areas than on rural ones, due to their population density.
21 https://cor.europa.eu/en/our-work/Documents/Territorial-impact-assessment/new-skills-agenda.pdf. 22 https://cor.europa.eu/en/our-work/Documents/Territorial-impact-assessment/work-life-balance.pdf.
39
In rural areas, where gender stereotypes were traditionally more deeply rooted, the effects would be more cultural, as the changes introduced by the directive would probably bring about a shift in the perception of traditional gender roles.
Urban regions would need to adopt strategies to adapt to this new situation as, for some indicators, it was clear that the effects were stronger in urban areas. However, economically weaker regions might profit from this directive as they would become more attractive to both citizens and businesses.
The experts also proposed creating a regional platform for investors in social infrastructure and a European family friendly label for cities, to signal their family-friendly atmosphere, infrastructure and legislation, thus encouraging citizens to either remain in or move to the city and increasing the city's investment attractiveness.
The experts also underlined the clear importance of implementing this directive via multilevel governance, and that the Urban Agenda was a tool that could be used for further promoting work-life balance as well as sharing best practices.
It was clear that certain sectors would be more affected by this directive and that the European Union, along with its Member States, should offer solutions to enable those business to adapt. The experts also thought it essential to keep leave flexible in order to be fully effective, causing the least disruption to employers.
The directive would certainly, in the long term, lead to a new approach to work organisation and a shift in the perception of gender roles in relation to caring activities. Questions of costs and effects on companies would need to be assessed to avoid any disruptions, especially on smaller and medium sized companies, while larger companies and the public sector were not expected to feel strong effects from this directive.
8.3 The establishment of the European Labour Authority23 The recommendations from the experts can be divided into three areas: Information and Capacity Building
After the establishment of the Authority, national agencies and local and regional authorities (especially in those regions that have felt more strongly the effects of intra-EU migration and cross-border regions) should be targeted for special training on what the Authority is and does.
There should be special information dedicated to social groups that might be particularly affected by labour mobility: sectors such as agriculture, manufacture or construction are certainly of interest, though other sectors (science and research or the arts and creative industries) are also especially affected by international labour mobility.
Similarly, the European Labour Authority might be useful in promoting better and more informed international training and professional mobility for young people, with natural benefits not only for receiving regions, but also for regions sending these young people, which could then profit from their increased professional skills. (…)
Competences
Each Member State has its own set of political and legal competences. Though the European Labour Authority would have a very important role in promoting the exchange of experience of
23 https://cor.europa.eu/en/our-work/Documents/Territorial-impact-assessment/TIA-ELA-Labour-Authority-20180704.pdf.
40
national, local and regional authorities and in capacity building, it should not jeopardise regional competences. (…)
Social and Territorial Cohesion
If one of the medium- to long-term effects of this Authority would be to increase labour mobility, this could be good for the European economy as a whole. Nevertheless, this might also come at the expense of poorer and/or more fragile regions of the Union. Consequently, proper monitoring of the social and labour conditions across the union and the gathering of more and better social statistics is important in order to provide evidence for good decision-making.
A further development of the European Social Scoreboard24 and its enrichment, whenever possible, with social statistics detailed at regional level would provide such evidence.
Support in the context of cohesion policy may be envisaged for both regions and cities that face an increased influx of EU migrant workers (language support, legal advice, social institutions) and regions that have faced and might face further loss of labour force in the future (adapted to support the development of local economy).
8.4 Implementation of the 2030 Agenda25 The experts judged the effects of the influence of the SDG 11.3 on the SEA Directive and its influence on spatial plans to be predominantly positive. They identified the following effects: (…)
Considering the complex process of drafting and adopting urban plans, experts mentioned that significant urban infrastructure is considered to involve minor modifications, and thus does not lead to a new process of drafting and adopting impact assessment studies. The EU rules are flexible enough to allow spatial planners to solve urban challenges effectively, but the impacts of these "minor" modifications of the initial plans are not usually monitored. These projects may entail significant consequences for the urban settlement strategy, the sustainable urban mobility plan or an air quality improvement drive by the local authority. In this respect, it might ultimately be considered as an obstacle to achieving SDG 11.3.
(…)
Higher urban densities and reduced urban sprawl will reduce the traffic volume in urban regions. Due to higher settlement densities, they make it possible to provide a more attractive public transport system. Both effects would reduce car transport volumes and increase public transport, which would improve air quality. In particular urban regions that currently have high traffic density would see positive impacts. They are located e.g. in the European centre (England, Belgium, northern Germany and Paris), along the coasts (Mediterranean coast of Spain, Atlantic coast of northern Portugal) and in economically vibrant industrial areas (e.g. the Ruhr area in Germany or northern Italy).
Spatial plans focusing more strongly on SDG 11.3 would emphasise the need for recreational opportunities and areas in a high quality to improve the quality of life of city-dwellers. (…)
8.5 EU Industrial policy strategy26 Based on the discussion and on the analysis of the potential territorial effects of the policy options outlined in the workshop, experts concluded by setting out the following policy recommendations.
24 https://composite-indicators.jrc.ec.europa.eu/social-scoreboard/. 25 https://cor.europa.eu/en/events/Documents/COTER/TIA-Urban-Agenda-28052018.pdf. 26 https://cor.europa.eu/en/events/Documents/COTER/20190306%20-TIA-Industrial-policy-strategy.pdf.

41
The European Union should:
Steer interregional cooperation by facilitating partnerships and promoting cross-sectoral clusters, with greater focus on strategic value chains. (…)
Develop robust statistical indicators of economic circularity at regional level to enable better data-driven policy making.
Involve local and regional authorities in designing a European place-based industrial strategy, making use of their knowledge of the diverse realities within each Member State and taking particular care in analysing specific needs for poorer and more fragile regions.
Revise state aid rules concerning regional investments. Give increased attention to the difficulties surrounding public procurement rules. In particular, capacity building for national, regional and local authorities should be envisaged.
National, regional and local authorities should furthermore:
Question established supply chains for the benefit of innovative investments and in support of moving towards a circular economy.
Promote vocational education and training and integrate universities and entrepreneurs to deliver increased research and development with a direct impact on the development of the European industrial fabric.
Invest in research and innovation strategies for Smart Specialisation, prioritising domains, areas and economic activities where regions or countries have a competitive advantage or have the potential to generate knowledge-driven growth and to bring about the economic transformation needed to tackle the major and most urgent challenges for society and the natural and built environment.
42
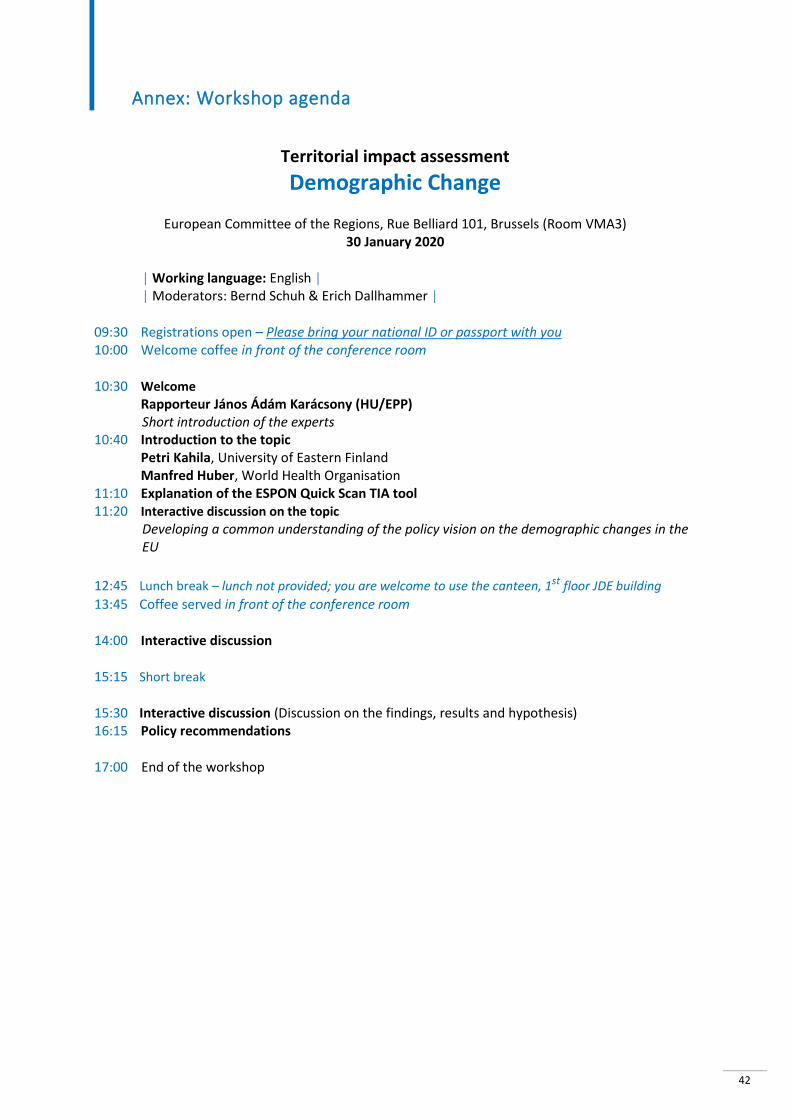
Annex: Workshop agenda
Territorial impact assessment
Demographic Change
European Committee of the Regions, Rue Belliard 101, Brussels (Room VMA3) 30 January 2020
| Working language: English | | Moderators: Bernd Schuh & Erich Dallhammer |
09:30 Registrations open – Please bring your national ID or passport with you 10:00 Welcome coffee in front of the conference room
10:30 Welcome
Rapporteur János Ádám Karácsony (HU/EPP) Short introduction of the experts
10:40 Introduction to the topic Petri Kahila, University of Eastern Finland Manfred Huber, World Health Organisation
11:10 Explanation of the ESPON Quick Scan TIA tool 11:20 Interactive discussion on the topic
Developing a common understanding of the policy vision on the demographic changes in the EU
12:45 Lunch break – lunch not provided; you are welcome to use the canteen, 1st floor JDE building
13:45 Coffee served in front of the conference room
14:00 Interactive discussion
15:15 Short break
15:30 Interactive discussion (Discussion on the findings, results and hypothesis) 16:15 Policy recommendations
17:00 End of the workshop
Related Documents