Demographic Breakdown of Twitter Users: An analysis based on names H¨ useyin Oktay University of Massachusetts Amherst, MA [email protected] Aykut Fırat Crimson Hexagon Boston, MA [email protected] Zeynep Ertem Texas A&M University College Station, TX [email protected] ABSTRACT We propose an approach for age estimation using solely people’s first names by extending an already existing method proposed by Chang et al. for eth- nicity estimation. We demonstrate that proposed method is able to predict age of a person as well as the age breakdown of an entire population bet- ter than the natural alternatives. We then apply both the age and the ethnicity method to Twitter US users and perform the largest demographic anal- ysis of the platform to the best of our knowledge. First, we closely replicate the findings about Twitter demographics in the most recent Pew Research re- port suggesting that name might be a useful indicator especially for aggregate analysis. Second, we demon- strate that our approach can overcome a methodolog- ical limitation in Pew Research study by estimating breakdown for all age groups including less than 18 years old age group. Third, we discover that Twitter US users has always been diverse, though some de- mographic groups are over-represented and some are under-represented with respect to the general inter- net users. We also find strong evidence that different demographic groups both in terms of age and ethnic- ity have different usage patterns on the platform in terms of their following relationships, topical conver- sations, and the time in the day to use the platform. I INTRODUCTION The demographic information of a population can be useful for social scientists, marketers, and policy mak- ers. For example, of Twitter users tweeting about politics, the demographic information of Yelp review- ers commenting about a specific restaurant, or of cit- izens signing an e-petition about a government bill might be of interest to the respective stake holders. However, often times data to accurately obtain such information is not available for various reasons (prac- tical, legal or ethical). In this paper, we focus on two specific kinds of de- mographic information: (1) ethnicity and (2) age. We explore inferring such demographic variables us- ing names. For ethnicity, we use an existing model proposed by Chang et al. [1] that uses last names of people in a population cross-referenced with census data to infer ethnicity. For age, we extend this model to explicitly account for the ordinal dependency among age values. We estimate age distribution of a given population by only looking at first names cross-referenced with baby name frequency data from Social Security Adminis- tration (in the rest of the paper, we refer as SSD, social security data). We show that explicitly ac- counting for the ordinal dependency among age val- ues has a better predictive power than natural alter- natives including the already proposed method men- tioned above. Finally, we apply these two methods to Twitter US user-base, a microblogging platform where demographic information is almost always missing, whereas name information is often available. We estimate age and ethnicity breakdown of Twitter US users and show that our estimates based on names not only closely match the findings of most recent Pew Research re- port about Twitter demographics [2] but also include proportions for < 18 years olds that are overlooked in Pew Research report. Moreover, using these models, we also answer questions about Twitter US users: • How diverse are Twitter US users in terms of age and ethnicity and how has diversity changed over time? • How do users from different demographic groups use Twitter platform? • How do different topics and different Twitter users attract users from different demographic groups? We report that Twitter has always been diverse and certain demographic groups have been over-represented Page 1 of 12 c ASE 2012

Welcome message from author
This document is posted to help you gain knowledge. Please leave a comment to let me know what you think about it! Share it to your friends and learn new things together.
Transcript
Demographic Breakdown of Twitter Users:An analysis based on names
Huseyin OktayUniversity of Massachusetts
Amherst, [email protected]
Aykut FıratCrimson Hexagon
Boston, [email protected]
Zeynep ErtemTexas A&M University
College Station, [email protected]
ABSTRACT
We propose an approach for age estimation usingsolely people’s first names by extending an alreadyexisting method proposed by Chang et al. for eth-nicity estimation. We demonstrate that proposedmethod is able to predict age of a person as wellas the age breakdown of an entire population bet-ter than the natural alternatives. We then applyboth the age and the ethnicity method to TwitterUS users and perform the largest demographic anal-ysis of the platform to the best of our knowledge.First, we closely replicate the findings about Twitterdemographics in the most recent Pew Research re-port suggesting that name might be a useful indicatorespecially for aggregate analysis. Second, we demon-strate that our approach can overcome a methodolog-ical limitation in Pew Research study by estimatingbreakdown for all age groups including less than 18years old age group. Third, we discover that TwitterUS users has always been diverse, though some de-mographic groups are over-represented and some areunder-represented with respect to the general inter-net users. We also find strong evidence that differentdemographic groups both in terms of age and ethnic-ity have different usage patterns on the platform interms of their following relationships, topical conver-sations, and the time in the day to use the platform.
I INTRODUCTION
The demographic information of a population can beuseful for social scientists, marketers, and policy mak-ers. For example, of Twitter users tweeting aboutpolitics, the demographic information of Yelp review-ers commenting about a specific restaurant, or of cit-izens signing an e-petition about a government billmight be of interest to the respective stake holders.However, often times data to accurately obtain suchinformation is not available for various reasons (prac-tical, legal or ethical).
In this paper, we focus on two specific kinds of de-mographic information: (1) ethnicity and (2) age.We explore inferring such demographic variables us-ing names. For ethnicity, we use an existing modelproposed by Chang et al. [1] that uses last names ofpeople in a population cross-referenced with censusdata to infer ethnicity.
For age, we extend this model to explicitly accountfor the ordinal dependency among age values. Weestimate age distribution of a given population byonly looking at first names cross-referenced with babyname frequency data from Social Security Adminis-tration (in the rest of the paper, we refer as SSD,social security data). We show that explicitly ac-counting for the ordinal dependency among age val-ues has a better predictive power than natural alter-natives including the already proposed method men-tioned above.
Finally, we apply these two methods to Twitter USuser-base, a microblogging platform where demographicinformation is almost always missing, whereas nameinformation is often available. We estimate age andethnicity breakdown of Twitter US users and showthat our estimates based on names not only closelymatch the findings of most recent Pew Research re-port about Twitter demographics [2] but also includeproportions for < 18 years olds that are overlooked inPew Research report. Moreover, using these models,we also answer questions about Twitter US users:
• How diverse are Twitter US users in terms ofage and ethnicity and how has diversity changedover time?
• How do users from different demographic groupsuse Twitter platform?
• How do different topics and different Twitterusers attract users from different demographicgroups?
We report that Twitter has always been diverse andcertain demographic groups have been over-represented
Page 1 of 12c©ASE 2012
and certain demographic groups have been under-represented compared to the general internet popu-lation reported by Pew Research study. We also dis-cover that different demographic groups use Twitterat different times during the day. Finally, we esti-mate that both different topics attract different de-mographic groups as contributors and different Twit-ter users attract different demographic groups as fol-lowers.
II METHODOLOGY
In this section, we describe two statistical models weuse for ethnicity and age estimation using names. Forethnicity estimation, we use an existing model pro-posed by Chang et al. [1] that uses last name cross-referenced with census data. We refer the reader tothat work for details about the model.
For age estimation, we use first names cross-referencedwith baby name frequency data from SSD1 and ex-tend this earlier model to explicitly model age as anordinal variable. Input to our model are a list offirst names and parameters from the SSD (i.e., fre-quency of baby names in each birth year). Outputfrom our model is population level breakdown of agecategories.
The main advantage of the proposed model is thatit requires no labeled datasets. The method uses un-supervised learning techniques to estimate age distri-bution for a given population. We note that we char-acterize such a model as partially supervised sinceparameters from the SSD can be interpreted as su-pervision to some extent. Since SSD provide ag-gregate summaries of baby name frequency statis-tics rather than individually labeled data instances,traditional supervised methods such as regression ormulti-class classification are not directly comparableto our method.
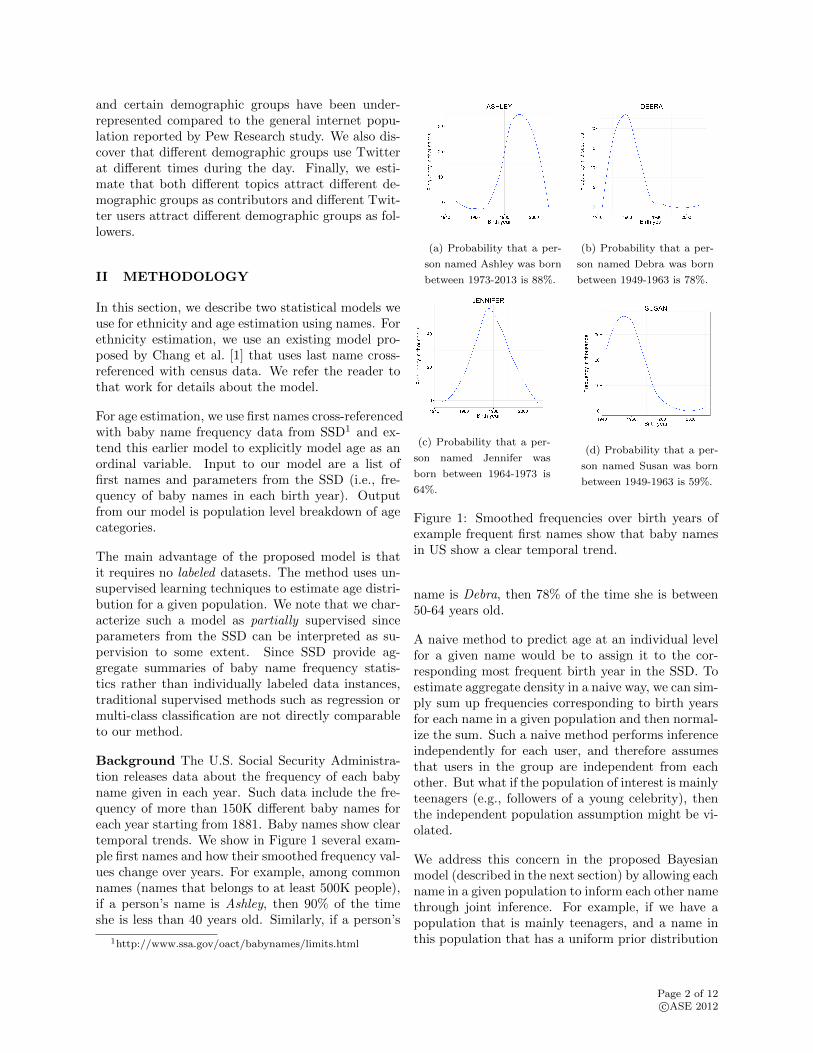
Background The U.S. Social Security Administra-tion releases data about the frequency of each babyname given in each year. Such data include the fre-quency of more than 150K different baby names foreach year starting from 1881. Baby names show cleartemporal trends. We show in Figure 1 several exam-ple first names and how their smoothed frequency val-ues change over years. For example, among commonnames (names that belongs to at least 500K people),if a person’s name is Ashley, then 90% of the timeshe is less than 40 years old. Similarly, if a person’s
1http://www.ssa.gov/oact/babynames/limits.html
(a) Probability that a per-
son named Ashley was born
between 1973-2013 is 88%.
(b) Probability that a per-
son named Debra was born
between 1949-1963 is 78%.
(c) Probability that a per-
son named Jennifer was
born between 1964-1973 is
64%.
(d) Probability that a per-
son named Susan was born
between 1949-1963 is 59%.
Figure 1: Smoothed frequencies over birth years ofexample frequent first names show that baby namesin US show a clear temporal trend.
name is Debra, then 78% of the time she is between50-64 years old.
A naive method to predict age at an individual levelfor a given name would be to assign it to the cor-responding most frequent birth year in the SSD. Toestimate aggregate density in a naive way, we can sim-ply sum up frequencies corresponding to birth yearsfor each name in a given population and then normal-ize the sum. Such a naive method performs inferenceindependently for each user, and therefore assumesthat users in the group are independent from eachother. But what if the population of interest is mainlyteenagers (e.g., followers of a young celebrity), thenthe independent population assumption might be vi-olated.
We address this concern in the proposed Bayesianmodel (described in the next section) by allowing eachname in a given population to inform each other namethrough joint inference. For example, if we have apopulation that is mainly teenagers, and a name inthis population that has a uniform prior distribution
Page 2 of 12c©ASE 2012

among almost all age groups. Then in joint inferencethese names inform each other. Therefore, the poste-rior probability of being a teenager increases for thename with a uniform prior.
Figure 2: The proposed Bayesian graphical modelto estimate density as well as predict individual agegiven a first name. Shaded variables indicate the in-puts to the model, and unshaded variables are esti-mated or inferred from the model.
Model To account for joint inference, we use a gen-erative Bayesian mixture model to estimate the agedensity of a given population. We model the individ-ual age values as hidden variables, and we model thefirst names of corresponding individuals as observedvariables. Also, parameters corresponding to firstnames for each age value are observed (through SSD).Then, we simply jointly infer the most likely valuesfor hidden variables (individual age) given the ob-served variables (corresponding first names and cor-responding frequencies in each age group).
The proposed model is closely related to mixture-models which allow populations to be a mixture ofcategories [1, 3]. Additionally, we explicitly accountfor the ordinal relations among the age values by us-ing a logistic normal prior for age proportions with apredefined covariance matrix [4, 5] instead of using aDirichlet prior.
Age values show an ordinal dependency that teenagersare smaller than young adults and young adults aresmaller than elderly. We show the clear benefit of ex-plicitly modeling age categories as ordinal variableswith a logistic-normal prior in the experimental eval-uation. Since logistic normal is not a conjugate-priorfor multinomial distribution, we use variational infer-ence.
We present the generative process of the proposedmodel more formally below. Let A be the numberof different age categories, and N be the number ofusers in a given group.
1. For each age value a ∈ 1...A,
(a) draw the distribution of first names,βfzi ∼ Dirichlet(ν)
2. From a multivariate Gaussian with a mean µand standard deviation σ, draw ν
3. Transform ν with the logistic function to getage proportions
4. For each person n ∈ 1...N ,
(a) Draw an age value zi fromMultinomial(F (ν))
(b) Draw the first name of the individual basedon age value, fni ∼Multinomial(βfnzi )
The graphical representation of the corresponding modelis shown in Figure 2. The parameters of the model areµ and Σ for multivariate Gaussian, and βa for multi-nomial distributions of first names for each age cate-gory. We transform multivariate Gaussian to multi-nomial parameters using logistic-normal as follows:
F (νi) = ηi =eνi∑j eνj.
The shaded variables in Figure 2 correspond to theobserved variables, and unshaded variables correspondto the hidden variables. We set βfnzi values from theSSD.
Age value x is an ordinal variable where x < x+ 1 <x + 2. In a posterior probability sense, such ordi-nal dependency translates into having similar poste-rior probability values for age values that are closeto each other, as shown in Figure 1. For example,if a person’s name is Ashley, she has a high proba-bility that she was born in 1990. By modeling theordinal dependency among age values, we expect toalso see high probabilities for values that are close to1990 (e.g., 1991, 1989). On the other hand, a per-son named Ashley has a low probability that she wasborn in 1950, and therefore we expect low probabilityvalues for values close to 1950 (e.g., 1951, 1949).
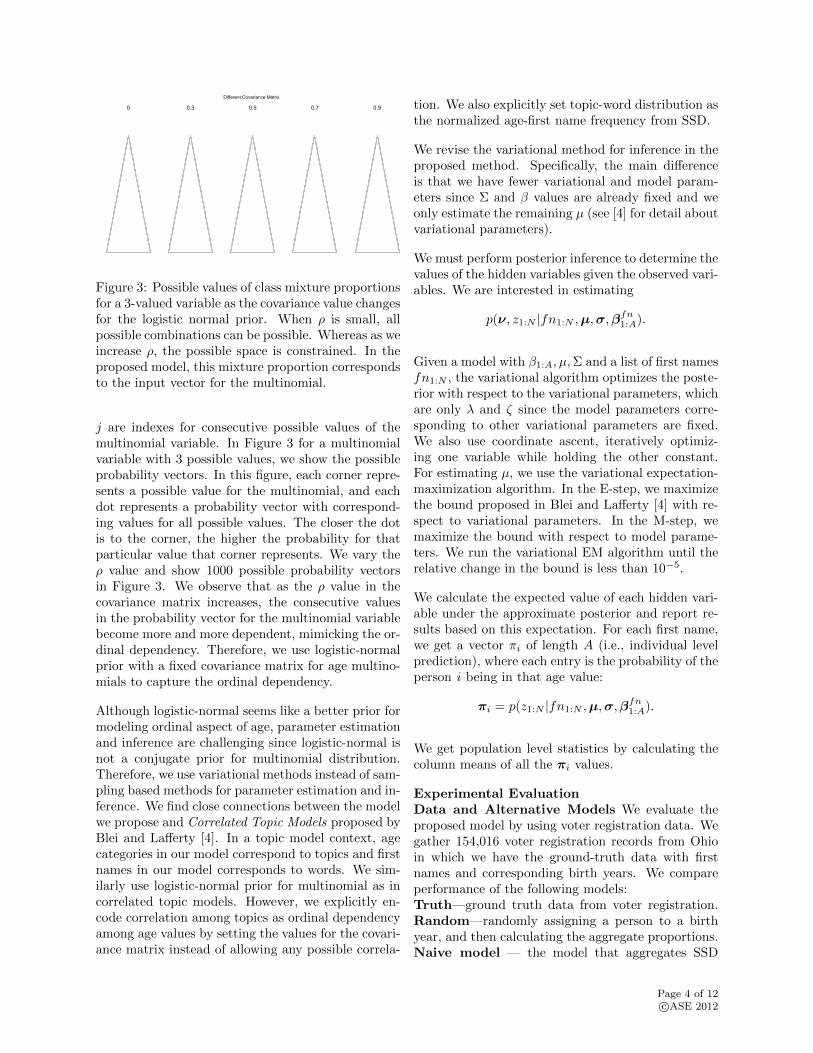
To account for the ordinal dependency among the agevalues, we set the parameter for sigma as suggested byAgresti [5], as σij = ρ|i−j| where 0 < ρ < 1 and i and
Page 3 of 12c©ASE 2012
0 0.3 0.5 0.7 0.9
Different Covariance Matrix
Figure 3: Possible values of class mixture proportionsfor a 3-valued variable as the covariance value changesfor the logistic normal prior. When ρ is small, allpossible combinations can be possible. Whereas as weincrease ρ, the possible space is constrained. In theproposed model, this mixture proportion correspondsto the input vector for the multinomial.
j are indexes for consecutive possible values of themultinomial variable. In Figure 3 for a multinomialvariable with 3 possible values, we show the possibleprobability vectors. In this figure, each corner repre-sents a possible value for the multinomial, and eachdot represents a probability vector with correspond-ing values for all possible values. The closer the dotis to the corner, the higher the probability for thatparticular value that corner represents. We vary theρ value and show 1000 possible probability vectorsin Figure 3. We observe that as the ρ value in thecovariance matrix increases, the consecutive valuesin the probability vector for the multinomial variablebecome more and more dependent, mimicking the or-dinal dependency. Therefore, we use logistic-normalprior with a fixed covariance matrix for age multino-mials to capture the ordinal dependency.
Although logistic-normal seems like a better prior formodeling ordinal aspect of age, parameter estimationand inference are challenging since logistic-normal isnot a conjugate prior for multinomial distribution.Therefore, we use variational methods instead of sam-pling based methods for parameter estimation and in-ference. We find close connections between the modelwe propose and Correlated Topic Models proposed byBlei and Lafferty [4]. In a topic model context, agecategories in our model correspond to topics and firstnames in our model corresponds to words. We sim-ilarly use logistic-normal prior for multinomial as incorrelated topic models. However, we explicitly en-code correlation among topics as ordinal dependencyamong age values by setting the values for the covari-ance matrix instead of allowing any possible correla-
tion. We also explicitly set topic-word distribution asthe normalized age-first name frequency from SSD.
We revise the variational method for inference in theproposed method. Specifically, the main differenceis that we have fewer variational and model param-eters since Σ and β values are already fixed and weonly estimate the remaining µ (see [4] for detail aboutvariational parameters).
We must perform posterior inference to determine thevalues of the hidden variables given the observed vari-ables. We are interested in estimating
p(ν, z1:N |fn1:N ,µ,σ,βfn1:A).
Given a model with β1:A, µ,Σ and a list of first namesfn1:N , the variational algorithm optimizes the poste-rior with respect to the variational parameters, whichare only λ and ζ since the model parameters corre-sponding to other variational parameters are fixed.We also use coordinate ascent, iteratively optimiz-ing one variable while holding the other constant.For estimating µ, we use the variational expectation-maximization algorithm. In the E-step, we maximizethe bound proposed in Blei and Lafferty [4] with re-spect to variational parameters. In the M-step, wemaximize the bound with respect to model parame-ters. We run the variational EM algorithm until therelative change in the bound is less than 10−5.
We calculate the expected value of each hidden vari-able under the approximate posterior and report re-sults based on this expectation. For each first name,we get a vector πi of length A (i.e., individual levelprediction), where each entry is the probability of theperson i being in that age value:
πi = p(z1:N |fn1:N ,µ,σ,βfn1:A).
We get population level statistics by calculating thecolumn means of all the πi values.
Experimental EvaluationData and Alternative Models We evaluate theproposed model by using voter registration data. Wegather 154,016 voter registration records from Ohioin which we have the ground-truth data with firstnames and corresponding birth years. We compareperformance of the following models:Truth—ground truth data from voter registration.Random—randomly assigning a person to a birthyear, and then calculating the aggregate proportions.Naive model — the model that aggregates SSD
Page 4 of 12c©ASE 2012
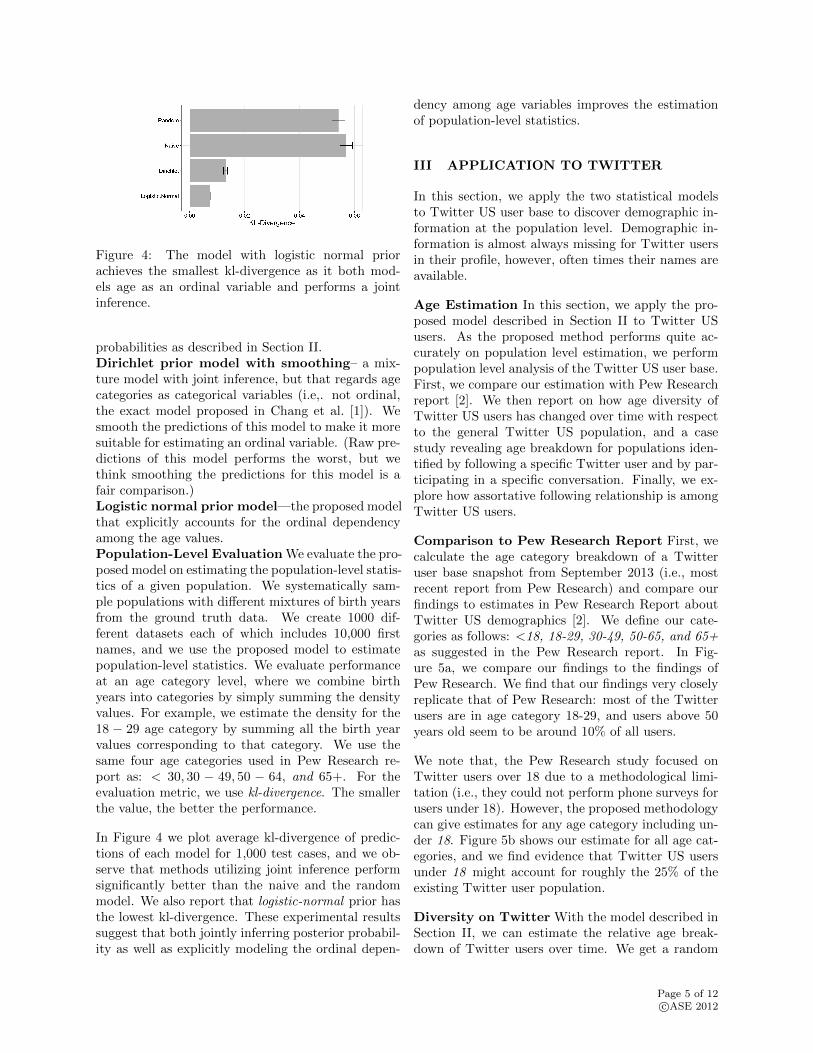
Figure 4: The model with logistic normal priorachieves the smallest kl-divergence as it both mod-els age as an ordinal variable and performs a jointinference.
probabilities as described in Section II.Dirichlet prior model with smoothing– a mix-ture model with joint inference, but that regards agecategories as categorical variables (i.e,. not ordinal,the exact model proposed in Chang et al. [1]). Wesmooth the predictions of this model to make it moresuitable for estimating an ordinal variable. (Raw pre-dictions of this model performs the worst, but wethink smoothing the predictions for this model is afair comparison.)Logistic normal prior model—the proposed modelthat explicitly accounts for the ordinal dependencyamong the age values.Population-Level Evaluation We evaluate the pro-posed model on estimating the population-level statis-tics of a given population. We systematically sam-ple populations with different mixtures of birth yearsfrom the ground truth data. We create 1000 dif-ferent datasets each of which includes 10,000 firstnames, and we use the proposed model to estimatepopulation-level statistics. We evaluate performanceat an age category level, where we combine birthyears into categories by simply summing the densityvalues. For example, we estimate the density for the18 − 29 age category by summing all the birth yearvalues corresponding to that category. We use thesame four age categories used in Pew Research re-port as: < 30, 30 − 49, 50 − 64, and 65+. For theevaluation metric, we use kl-divergence. The smallerthe value, the better the performance.
In Figure 4 we plot average kl-divergence of predic-tions of each model for 1,000 test cases, and we ob-serve that methods utilizing joint inference performsignificantly better than the naive and the randommodel. We also report that logistic-normal prior hasthe lowest kl-divergence. These experimental resultssuggest that both jointly inferring posterior probabil-ity as well as explicitly modeling the ordinal depen-
dency among age variables improves the estimationof population-level statistics.
III APPLICATION TO TWITTER
In this section, we apply the two statistical modelsto Twitter US user base to discover demographic in-formation at the population level. Demographic in-formation is almost always missing for Twitter usersin their profile, however, often times their names areavailable.
Age Estimation In this section, we apply the pro-posed model described in Section II to Twitter USusers. As the proposed method performs quite ac-curately on population level estimation, we performpopulation level analysis of the Twitter US user base.First, we compare our estimation with Pew Researchreport [2]. We then report on how age diversity ofTwitter US users has changed over time with respectto the general Twitter US population, and a casestudy revealing age breakdown for populations iden-tified by following a specific Twitter user and by par-ticipating in a specific conversation. Finally, we ex-plore how assortative following relationship is amongTwitter US users.
Comparison to Pew Research Report First, wecalculate the age category breakdown of a Twitteruser base snapshot from September 2013 (i.e., mostrecent report from Pew Research) and compare ourfindings to estimates in Pew Research Report aboutTwitter US demographics [2]. We define our cate-gories as follows: <18, 18-29, 30-49, 50-65, and 65+as suggested in the Pew Research report. In Fig-ure 5a, we compare our findings to the findings ofPew Research. We find that our findings very closelyreplicate that of Pew Research: most of the Twitterusers are in age category 18-29, and users above 50years old seem to be around 10% of all users.
We note that, the Pew Research study focused onTwitter users over 18 due to a methodological limi-tation (i.e., they could not perform phone surveys forusers under 18). However, the proposed methodologycan give estimates for any age category including un-der 18. Figure 5b shows our estimate for all age cat-egories, and we find evidence that Twitter US usersunder 18 might account for roughly the 25% of theexisting Twitter user population.
Diversity on Twitter With the model described inSection II, we can estimate the relative age break-down of Twitter users over time. We get a random
Page 5 of 12c©ASE 2012
(a) Pew Research com-
parison
(b) Age breakdown for full data
Figure 5: Estimates of the proposed method are com-parable to the findings in the Pew Research report.We also find that under 18 age group is the sec-ond most present age group among Twitter US userswhich is overlooked in Pew Research report.
sample of Twitter US users on the first day of eachmonth starting from June 2011 until January 2014.
Figure 6: We compare different age groups in theUS Twitter users to the general internet populationas reported by the Pew Research. We observe thatmost present age group on Twitter has been over rep-resented since the beginning.
In Figure 6, we compare the saturation of each agegroup above 18 years old to the age breakdown ofthe general internet users obtained from the Pew Re-search report [2]. In these plots, a line on 100%would indicate perfect representation of correspond-ing age category with respect to general internet pop-ulation. A line above 100% line would indicate over-representation and a line under 100% line would indi-cate under-representation of that particular age groupwith respect to the general internet population.
We discover that Twitter US users have always beendiverse. We also observe that age group 30-49 andage group 18-29 have been over-represented amongTwitter US users and age group 18-29 seems to bein the decline. Conversely, age group 50-64 and 65+have been under-represented on Twitter.
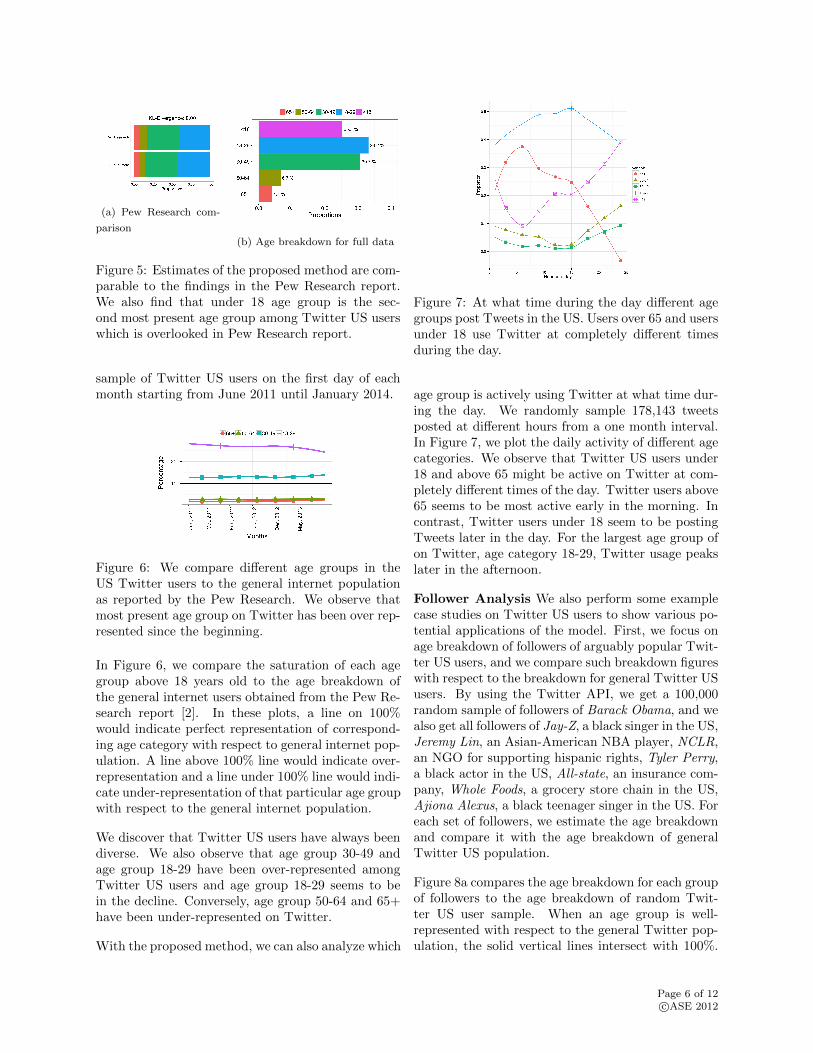
With the proposed method, we can also analyze which
Figure 7: At what time during the day different agegroups post Tweets in the US. Users over 65 and usersunder 18 use Twitter at completely different timesduring the day.
age group is actively using Twitter at what time dur-ing the day. We randomly sample 178,143 tweetsposted at different hours from a one month interval.In Figure 7, we plot the daily activity of different agecategories. We observe that Twitter US users under18 and above 65 might be active on Twitter at com-pletely different times of the day. Twitter users above65 seems to be most active early in the morning. Incontrast, Twitter users under 18 seem to be postingTweets later in the day. For the largest age group ofon Twitter, age category 18-29, Twitter usage peakslater in the afternoon.
Follower Analysis We also perform some examplecase studies on Twitter US users to show various po-tential applications of the model. First, we focus onage breakdown of followers of arguably popular Twit-ter US users, and we compare such breakdown figureswith respect to the breakdown for general Twitter USusers. By using the Twitter API, we get a 100,000random sample of followers of Barack Obama, and wealso get all followers of Jay-Z, a black singer in the US,Jeremy Lin, an Asian-American NBA player, NCLR,an NGO for supporting hispanic rights, Tyler Perry,a black actor in the US, All-state, an insurance com-pany, Whole Foods, a grocery store chain in the US,Ajiona Alexus, a black teenager singer in the US. Foreach set of followers, we estimate the age breakdownand compare it with the age breakdown of generalTwitter US population.
Figure 8a compares the age breakdown for each groupof followers to the age breakdown of random Twit-ter US user sample. When an age group is well-represented with respect to the general Twitter pop-ulation, the solid vertical lines intersect with 100%.
Page 6 of 12c©ASE 2012
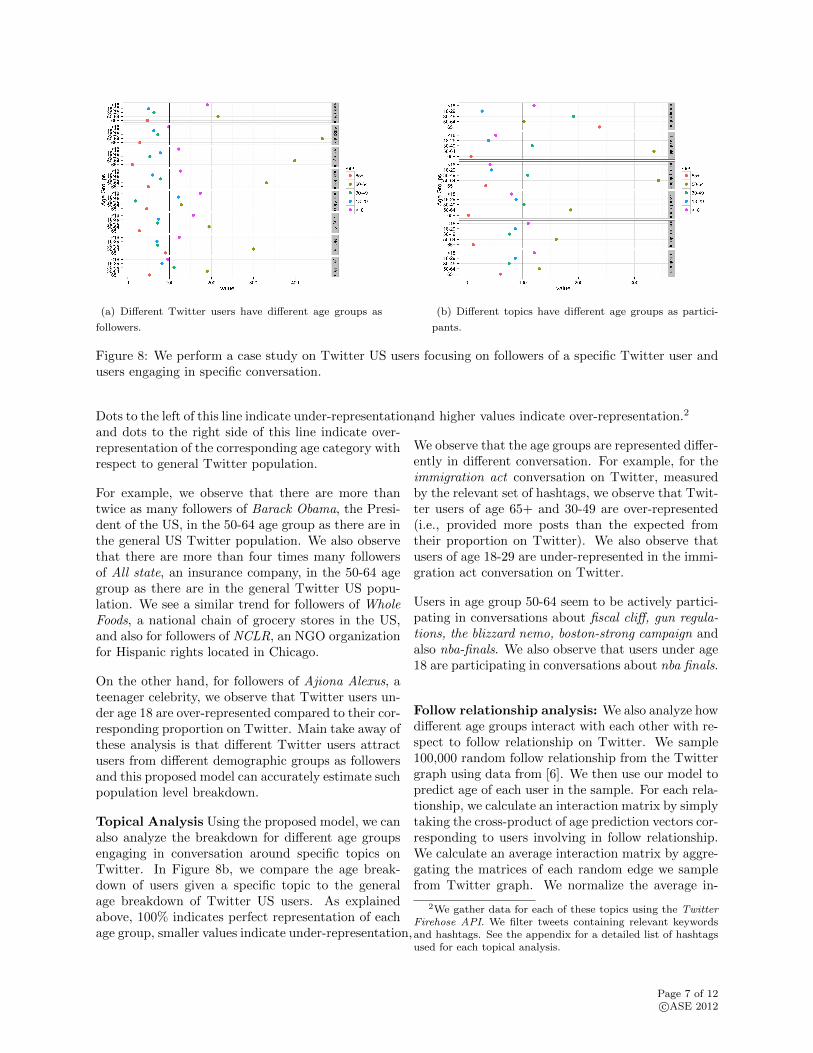
(a) Different Twitter users have different age groups as
followers.
(b) Different topics have different age groups as partici-
pants.
Figure 8: We perform a case study on Twitter US users focusing on followers of a specific Twitter user andusers engaging in specific conversation.
Dots to the left of this line indicate under-representation,and dots to the right side of this line indicate over-representation of the corresponding age category withrespect to general Twitter population.
For example, we observe that there are more thantwice as many followers of Barack Obama, the Presi-dent of the US, in the 50-64 age group as there are inthe general US Twitter population. We also observethat there are more than four times many followersof All state, an insurance company, in the 50-64 agegroup as there are in the general Twitter US popu-lation. We see a similar trend for followers of WholeFoods, a national chain of grocery stores in the US,and also for followers of NCLR, an NGO organizationfor Hispanic rights located in Chicago.
On the other hand, for followers of Ajiona Alexus, ateenager celebrity, we observe that Twitter users un-der age 18 are over-represented compared to their cor-responding proportion on Twitter. Main take away ofthese analysis is that different Twitter users attractusers from different demographic groups as followersand this proposed model can accurately estimate suchpopulation level breakdown.
Topical Analysis Using the proposed model, we canalso analyze the breakdown for different age groupsengaging in conversation around specific topics onTwitter. In Figure 8b, we compare the age break-down of users given a specific topic to the generalage breakdown of Twitter US users. As explainedabove, 100% indicates perfect representation of eachage group, smaller values indicate under-representation,
and higher values indicate over-representation.2
We observe that the age groups are represented differ-ently in different conversation. For example, for theimmigration act conversation on Twitter, measuredby the relevant set of hashtags, we observe that Twit-ter users of age 65+ and 30-49 are over-represented(i.e., provided more posts than the expected fromtheir proportion on Twitter). We also observe thatusers of age 18-29 are under-represented in the immi-gration act conversation on Twitter.
Users in age group 50-64 seem to be actively partici-pating in conversations about fiscal cliff, gun regula-tions, the blizzard nemo, boston-strong campaign andalso nba-finals. We also observe that users under age18 are participating in conversations about nba finals.
Follow relationship analysis: We also analyze howdifferent age groups interact with each other with re-spect to follow relationship on Twitter. We sample100,000 random follow relationship from the Twittergraph using data from [6]. We then use our model topredict age of each user in the sample. For each rela-tionship, we calculate an interaction matrix by simplytaking the cross-product of age prediction vectors cor-responding to users involving in follow relationship.We calculate an average interaction matrix by aggre-gating the matrices of each random edge we samplefrom Twitter graph. We normalize the average in-
2We gather data for each of these topics using the TwitterFirehose API. We filter tweets containing relevant keywordsand hashtags. See the appendix for a detailed list of hashtagsused for each topical analysis.
Page 7 of 12c©ASE 2012
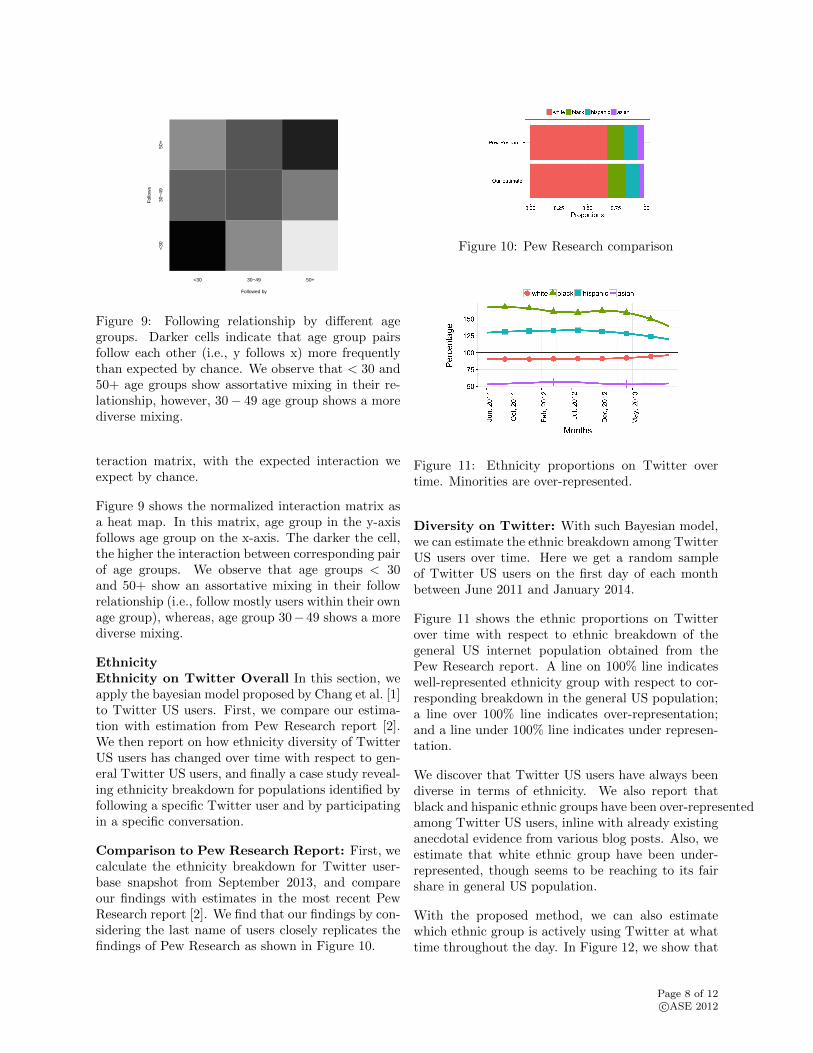
Followed by
Fol
low
s
<30 30−49 50+
<30
30−
4950
+
Figure 9: Following relationship by different agegroups. Darker cells indicate that age group pairsfollow each other (i.e., y follows x) more frequentlythan expected by chance. We observe that < 30 and50+ age groups show assortative mixing in their re-lationship, however, 30− 49 age group shows a morediverse mixing.
teraction matrix, with the expected interaction weexpect by chance.
Figure 9 shows the normalized interaction matrix asa heat map. In this matrix, age group in the y-axisfollows age group on the x-axis. The darker the cell,the higher the interaction between corresponding pairof age groups. We observe that age groups < 30and 50+ show an assortative mixing in their followrelationship (i.e., follow mostly users within their ownage group), whereas, age group 30− 49 shows a morediverse mixing.
EthnicityEthnicity on Twitter Overall In this section, weapply the bayesian model proposed by Chang et al. [1]to Twitter US users. First, we compare our estima-tion with estimation from Pew Research report [2].We then report on how ethnicity diversity of TwitterUS users has changed over time with respect to gen-eral Twitter US users, and finally a case study reveal-ing ethnicity breakdown for populations identified byfollowing a specific Twitter user and by participatingin a specific conversation.
Comparison to Pew Research Report: First, wecalculate the ethnicity breakdown for Twitter user-base snapshot from September 2013, and compareour findings with estimates in the most recent PewResearch report [2]. We find that our findings by con-sidering the last name of users closely replicates thefindings of Pew Research as shown in Figure 10.
Figure 10: Pew Research comparison
Figure 11: Ethnicity proportions on Twitter overtime. Minorities are over-represented.
Diversity on Twitter: With such Bayesian model,we can estimate the ethnic breakdown among TwitterUS users over time. Here we get a random sampleof Twitter US users on the first day of each monthbetween June 2011 and January 2014.
Figure 11 shows the ethnic proportions on Twitterover time with respect to ethnic breakdown of thegeneral US internet population obtained from thePew Research report. A line on 100% line indicateswell-represented ethnicity group with respect to cor-responding breakdown in the general US population;a line over 100% line indicates over-representation;and a line under 100% line indicates under represen-tation.
We discover that Twitter US users have always beendiverse in terms of ethnicity. We also report thatblack and hispanic ethnic groups have been over-representedamong Twitter US users, inline with already existinganecdotal evidence from various blog posts. Also, weestimate that white ethnic group have been under-represented, though seems to be reaching to its fairshare in general US population.
With the proposed method, we can also estimatewhich ethnic group is actively using Twitter at whattime throughout the day. In Figure 12, we show that
Page 8 of 12c©ASE 2012
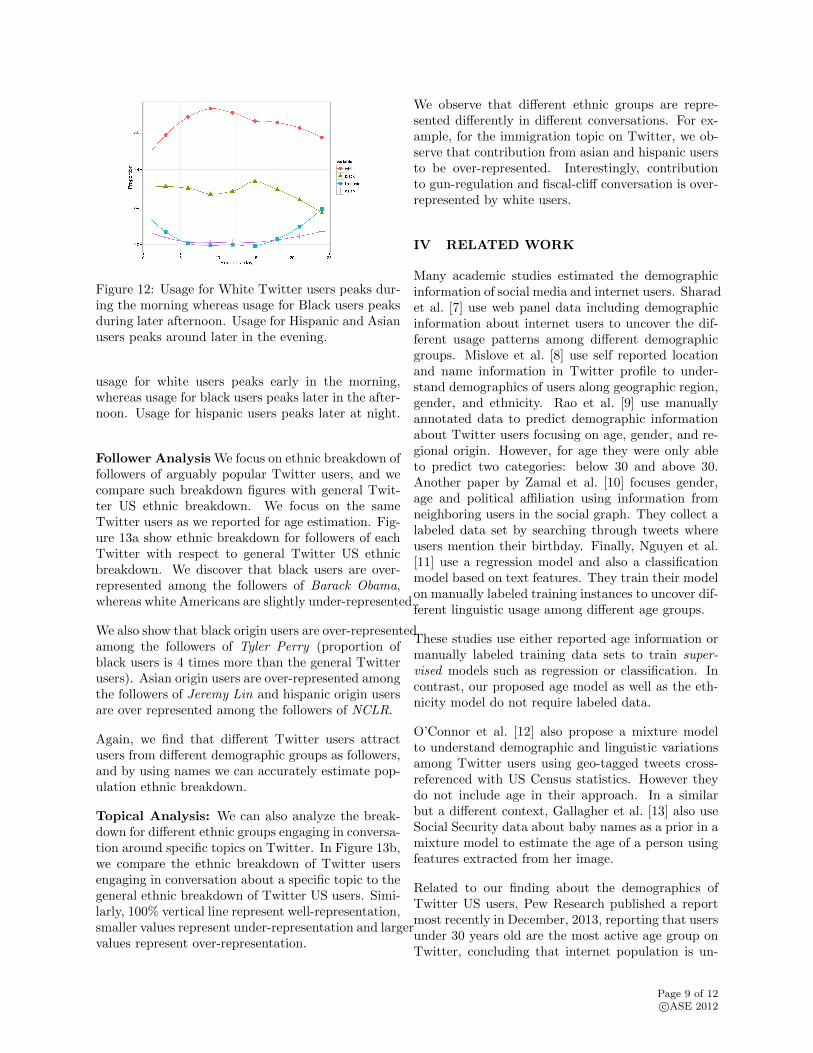
Figure 12: Usage for White Twitter users peaks dur-ing the morning whereas usage for Black users peaksduring later afternoon. Usage for Hispanic and Asianusers peaks around later in the evening.
usage for white users peaks early in the morning,whereas usage for black users peaks later in the after-noon. Usage for hispanic users peaks later at night.
Follower Analysis We focus on ethnic breakdown offollowers of arguably popular Twitter users, and wecompare such breakdown figures with general Twit-ter US ethnic breakdown. We focus on the sameTwitter users as we reported for age estimation. Fig-ure 13a show ethnic breakdown for followers of eachTwitter with respect to general Twitter US ethnicbreakdown. We discover that black users are over-represented among the followers of Barack Obama,whereas white Americans are slightly under-represented.
We also show that black origin users are over-representedamong the followers of Tyler Perry (proportion ofblack users is 4 times more than the general Twitterusers). Asian origin users are over-represented amongthe followers of Jeremy Lin and hispanic origin usersare over represented among the followers of NCLR.
Again, we find that different Twitter users attractusers from different demographic groups as followers,and by using names we can accurately estimate pop-ulation ethnic breakdown.
Topical Analysis: We can also analyze the break-down for different ethnic groups engaging in conversa-tion around specific topics on Twitter. In Figure 13b,we compare the ethnic breakdown of Twitter usersengaging in conversation about a specific topic to thegeneral ethnic breakdown of Twitter US users. Simi-larly, 100% vertical line represent well-representation,smaller values represent under-representation and largervalues represent over-representation.
We observe that different ethnic groups are repre-sented differently in different conversations. For ex-ample, for the immigration topic on Twitter, we ob-serve that contribution from asian and hispanic usersto be over-represented. Interestingly, contributionto gun-regulation and fiscal-cliff conversation is over-represented by white users.
IV RELATED WORK
Many academic studies estimated the demographicinformation of social media and internet users. Sharadet al. [7] use web panel data including demographicinformation about internet users to uncover the dif-ferent usage patterns among different demographicgroups. Mislove et al. [8] use self reported locationand name information in Twitter profile to under-stand demographics of users along geographic region,gender, and ethnicity. Rao et al. [9] use manuallyannotated data to predict demographic informationabout Twitter users focusing on age, gender, and re-gional origin. However, for age they were only ableto predict two categories: below 30 and above 30.Another paper by Zamal et al. [10] focuses gender,age and political affiliation using information fromneighboring users in the social graph. They collect alabeled data set by searching through tweets whereusers mention their birthday. Finally, Nguyen et al.[11] use a regression model and also a classificationmodel based on text features. They train their modelon manually labeled training instances to uncover dif-ferent linguistic usage among different age groups.
These studies use either reported age information ormanually labeled training data sets to train super-vised models such as regression or classification. Incontrast, our proposed age model as well as the eth-nicity model do not require labeled data.
O’Connor et al. [12] also propose a mixture modelto understand demographic and linguistic variationsamong Twitter users using geo-tagged tweets cross-referenced with US Census statistics. However theydo not include age in their approach. In a similarbut a different context, Gallagher et al. [13] also useSocial Security data about baby names as a prior in amixture model to estimate the age of a person usingfeatures extracted from her image.
Related to our finding about the demographics ofTwitter US users, Pew Research published a reportmost recently in December, 2013, reporting that usersunder 30 years old are the most active age group onTwitter, concluding that internet population is un-
Page 9 of 12c©ASE 2012
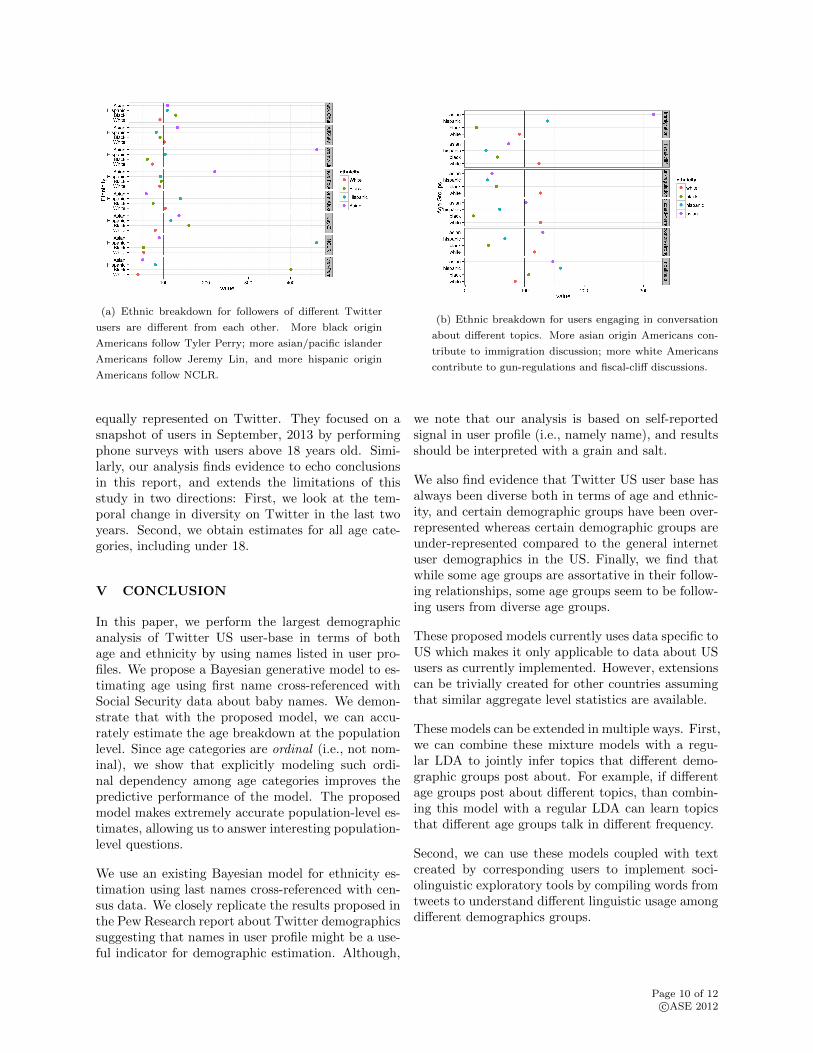
(a) Ethnic breakdown for followers of different Twitter
users are different from each other. More black origin
Americans follow Tyler Perry; more asian/pacific islander
Americans follow Jeremy Lin, and more hispanic origin
Americans follow NCLR.
(b) Ethnic breakdown for users engaging in conversation
about different topics. More asian origin Americans con-
tribute to immigration discussion; more white Americans
contribute to gun-regulations and fiscal-cliff discussions.
equally represented on Twitter. They focused on asnapshot of users in September, 2013 by performingphone surveys with users above 18 years old. Simi-larly, our analysis finds evidence to echo conclusionsin this report, and extends the limitations of thisstudy in two directions: First, we look at the tem-poral change in diversity on Twitter in the last twoyears. Second, we obtain estimates for all age cate-gories, including under 18.
V CONCLUSION
In this paper, we perform the largest demographicanalysis of Twitter US user-base in terms of bothage and ethnicity by using names listed in user pro-files. We propose a Bayesian generative model to es-timating age using first name cross-referenced withSocial Security data about baby names. We demon-strate that with the proposed model, we can accu-rately estimate the age breakdown at the populationlevel. Since age categories are ordinal (i.e., not nom-inal), we show that explicitly modeling such ordi-nal dependency among age categories improves thepredictive performance of the model. The proposedmodel makes extremely accurate population-level es-timates, allowing us to answer interesting population-level questions.
We use an existing Bayesian model for ethnicity es-timation using last names cross-referenced with cen-sus data. We closely replicate the results proposed inthe Pew Research report about Twitter demographicssuggesting that names in user profile might be a use-ful indicator for demographic estimation. Although,
we note that our analysis is based on self-reportedsignal in user profile (i.e., namely name), and resultsshould be interpreted with a grain and salt.
We also find evidence that Twitter US user base hasalways been diverse both in terms of age and ethnic-ity, and certain demographic groups have been over-represented whereas certain demographic groups areunder-represented compared to the general internetuser demographics in the US. Finally, we find thatwhile some age groups are assortative in their follow-ing relationships, some age groups seem to be follow-ing users from diverse age groups.
These proposed models currently uses data specific toUS which makes it only applicable to data about USusers as currently implemented. However, extensionscan be trivially created for other countries assumingthat similar aggregate level statistics are available.
These models can be extended in multiple ways. First,we can combine these mixture models with a regu-lar LDA to jointly infer topics that different demo-graphic groups post about. For example, if differentage groups post about different topics, than combin-ing this model with a regular LDA can learn topicsthat different age groups talk in different frequency.
Second, we can use these models coupled with textcreated by corresponding users to implement soci-olinguistic exploratory tools by compiling words fromtweets to understand different linguistic usage amongdifferent demographics groups.
Page 10 of 12c©ASE 2012
VI ACKNOWLEDGEMENTS
Discussions with David Arbour contributed to the pa-per. Helpful comments and patient editing were madeby Cynthia Loiselle. Crimson Hexagon Forsight plat-form was very useful in getting the necessary datasets.
VII APPENDIX
Here we list the keywords we use to filter tweets re-lated to given topic.
Immigration Act–#cir OR #immigration OR #CIROR #immyouth OR #DREAMact OR #cirasap OR#dwn OR #StopICE
Fiscal Cliff–(”fiscal cliff” OR fiscalcliff)
Gun Control–(obama OR romney) AND ”gun con-trol”
Blizzard Nemo–(”winter storm” OR blizzard ORNemo OR winterstorm OR (snow AND storm) ORsnowstorm OR snow
Boston Strong–BostonStrong OR ”Boston Strong”OR OneFundBoston OR ”One Fund” OR ”BostonMarathon” OR BostonMarathon OR WeAreBostonOR BostonStrongest OR BelieveInBoston OR WeAre-OneBoston OR PrayForBoston
NBA Finals–(”San Antonio” OR spurs OR ”timduncan” OR ”tony parker” OR miami OR ”the heat”OR ”dwayne wade” OR lebron OR MIA OR SA)AND (finals OR nbafinals OR win OR winning ORchampion OR champions OR ring OR ”win finals”)AND -(eastern OR east OR west OR western ORindiana OR pacers OR ”game 7” OR memphis ORgrizzlies OR http OR ”moving on”)
References
[1] J. Chang, I. Rosenn, L. Backstrom, and C. Mar-low, “epluribus: Ethnicity on social networks,”in Proceedings of the Fourth International Con-ference on Weblogs and Social Media (ICWSM-10), (Washington DC), AAAI Press, May 2010.
[2] M. Duggan and J. Brenner, “The demo-graphics of social media users,” in Postedon http://pewinternet.org/Reports/2013/Social-Media-Update.aspx, December 2013.
[3] D. M. Blei, A. Y. Ng, and M. I. Jordan, “La-tent dirichlet allocation,” J. Mach. Learn. Res.,vol. 3, pp. 993–1022, Mar. 2003.
[4] D. M. Blei and J. D. Lafferty, “Correlated topicmodels,” in Advances in Neural InformationProcessing Systems 18 (Y. Weiss, B. Scholkopf,and J. Platt, eds.), pp. 147–154, 2005.
[5] A. Agresti, Analysis of Ordinal Categorical Data.No. Chapter 11 in Probability and Statistics,Wiley, second ed., 2010.
[6] R. Li, S. Wang, H. Deng, R. Wang, and K. C.-C. Chang, “Towards social user profiling: unifiedand discriminative influence model for inferringhome locations,” in KDD, pp. 1023–1031, 2012.
[7] S. Goel, J. M. Hofman, and M. I. Sirer, “Whodoes what on the web: A large-scale study ofbrowsing behavior,” in International AAAI Con-ference on Weblogs and Social Media, 2012.
[8] A. Mislove, S. Lehmann, Y.-Y. Ahn, J.-P. On-nela, and J. N. Rosenquist, “Understanding theDemographics of Twitter Users,” in Proceedingsof the 5th International AAAI Conference onWeblogs and Social Media, (Barcelona, Spain),July 2011.
[9] D. Rao, D. Yarowsky, A. Shreevats, andM. Gupta, “Classifying latent user attributes intwitter,” in Proceedings of the 2nd internationalworkshop on Search and mining user-generatedcontents, SMUC ’10, (New York, NY, USA),pp. 37–44, ACM, 2010.
[10] F. A. Zamal, W. Liu, and D. Ruths, “Homophilyand latent attribute inference: Inferring latentattributes of twitter users from neighbors.,” inICWSM (J. G. Breslin, N. B. Ellison, J. G.Shanahan, and Z. Tufekci, eds.), The AAAIPress, 2012.
[11] D. Nguyen, R. Gravel, D. Trieschnigg, andT. Meder, ““how old do you think i am?”:A study of language and age in twitter,” inProceedings of the Seventh International AAAIConference on Weblogs and Social Media, 2013.
[12] B. O’Connor, J. Eisenstein, E. P. Xing, andN. A. Smith, “A mixture model of demo-graphic lexical variation,” Proceedings of theNIPS Workshop on Machine Learning for SocialComputing, 2010.
[13] A. Gallagher and T. Chen, “Estimating age, gen-der and identity using first name priors,” in Proc.CVPR, 2008.
Page 11 of 12c©ASE 2012
Related Documents