625 Journal of Vegetation Science 16: 625-634, 2005 © IAVS; Opulus Press Uppsala. Abstract Questions: Which demographic and life-history differences are found among 95 sympatric tree species? Are there correla- tions among demographic parameters within this assemblage? Location: Central Amazonian rain forest. Methods: Using long-term data from 24 1-ha permanent plots, eight characteristics were estimated for each species: wood density, annual mortality rate, annual recruitment rate, mean stem diameter, maximum stem diameter, mean stem- growth rate, maximum stem-growth rate, population density. Results: An ordination analysis revealed that tree characteris- tics varied along two major axes of variation, the major gradient expressing light requirements and successional sta- tus, and the second gradient related to tree size. Along these gradients, four relatively discrete tree guilds could be distin- guished: fast-growing pioneer species, shade-tolerant sub- canopy species, canopy trees, and emergent species. Pioneers were uncommon and most trees were canopy or emergent species, which frequently had low mortality and recruitment. Wood density was negatively associated with tree mortality, recruitment, and growth rates when all species were consid- ered. Growth rates varied markedly among and within species, with pioneers exhibiting far faster and less variable growth rates than did the other species. Slow growth in subcanopy species relative to canopy and emergent trees was not a simple consequence of mean tree size, but apparently resulted from physiological constraints imposed by low-light and other con- ditions in the forest understorey. Conclusions: Trees of Amazonian rain forests could be clas- sified with some success into four relatively distinctive guilds. However, several demographic and life-history traits, such as those that distinguish early and late successional species, probably vary along a continuum, rather than being naturally grouped into relatively discrete categories. Keywords: Amazon; Growth; Mortality; Rain forest; Recruit- ment; Tree guild; Tree life history; Wood density. Nomenclature: Ribeiro et al. (1999). Abbreviation: BDFFP = Biological Dynamics of Forest Frag- ments Project. Demographic and life-history correlates for Amazonian trees Nascimento, Henrique E.M. 1,2* ; Laurance, William F. 1,2,3 ; Condit, Richard 1,4 ; Laurance, Susan G. 1,5 ; D’Angelo, Sammya 2,6 & Andrade, Ana C. 2,7 1 Smithsonian Tropical Research Institute, Apartado 2072, Balboa, Republic of Panamá; 2 Biological Dynamics of Forest Fragments Project (BDFFP), National Institute for Amazonian Research (INPA), C.P. 478, Manaus, AM 69011-970, Brazil; 3 E-mail [email protected]; 4 E-mail [email protected]; 5 E-mail [email protected]; 6 E-mail [email protected]; 7 E-mail [email protected]; * Corresponding author; E-mail [email protected] Introduction Amazonian forests are the world’s most diverse in tree species (Gentry 1990; Oliveira & Mori 1999; Turner 2001) and are experiencing very high rates of logging and deforestation (Nepstad et al. 1999; Laurance et al. 2001a). Demographic studies of individual tree species are needed to provide baseline ecological data that are essential for effective forest management and conserva- tion in the tropics. Unfortunately, even basic informa- tion is unavailable for many Amazonian tree species, which have been understudied relative to other tropical regions and are often locally rare and patchily distrib- uted (Laurance 2001). Much of what is known about the demography and life history of tropical trees has been derived from long- term forest-dynamics studies in permanent plots (e.g. Lieberman et al. 1985; Primack et al. 1985; Hubbell & Foster 1986; Clark & Clark 1992; Condit et al. 1995, 1996a, b; O’Brien et al. 1995; Laurance et al. 2004). Such studies have revealed large variability in species- specific mortality, recruitment, and incremental-growth rates, which are frequently associated with life-history differences along a continuum between early and late successional trees (Condit et al. 1996a, b; Turner 2001); however, this simple gradient obscures considerable ecological variation among species (Welden et al. 1991; Clark & Clark 1992; Davies 1998). Additional features, such as wood density and allometric relationships among diameter, height and crown shape, also vary greatly among species and can be correlated with factors such as tree age, successional status, growth form, local envi- ronmental conditions, and phylogenetic affinities (Williamson 1984; Primack et al. 1985; O’Brien et al. 1995; Turner 2001; Poorter et al. 2003). In this study we use long-term (18 years) data from 24 permanent 1-ha study plots, augmented with an extensive literature survey, to estimate a number of demographic and life-history parameters for 95 tree

Welcome message from author
This document is posted to help you gain knowledge. Please leave a comment to let me know what you think about it! Share it to your friends and learn new things together.
Transcript
- Demographic and life-history correlates for Amazonian trees - 625
Journal of Vegetation Science 16: 625-634, 2005© IAVS; Opulus Press Uppsala.
AbstractQuestions: Which demographic and life-history differencesare found among 95 sympatric tree species? Are there correla-tions among demographic parameters within this assemblage?Location: Central Amazonian rain forest.Methods: Using long-term data from 24 1-ha permanentplots, eight characteristics were estimated for each species:wood density, annual mortality rate, annual recruitment rate,mean stem diameter, maximum stem diameter, mean stem-growth rate, maximum stem-growth rate, population density.Results: An ordination analysis revealed that tree characteris-tics varied along two major axes of variation, the majorgradient expressing light requirements and successional sta-tus, and the second gradient related to tree size. Along thesegradients, four relatively discrete tree guilds could be distin-guished: fast-growing pioneer species, shade-tolerant sub-canopy species, canopy trees, and emergent species. Pioneerswere uncommon and most trees were canopy or emergentspecies, which frequently had low mortality and recruitment.Wood density was negatively associated with tree mortality,recruitment, and growth rates when all species were consid-ered. Growth rates varied markedly among and within species,with pioneers exhibiting far faster and less variable growthrates than did the other species. Slow growth in subcanopyspecies relative to canopy and emergent trees was not a simpleconsequence of mean tree size, but apparently resulted fromphysiological constraints imposed by low-light and other con-ditions in the forest understorey.Conclusions: Trees of Amazonian rain forests could be clas-sified with some success into four relatively distinctive guilds.However, several demographic and life-history traits, such asthose that distinguish early and late successional species,probably vary along a continuum, rather than being naturallygrouped into relatively discrete categories.
Keywords: Amazon; Growth; Mortality; Rain forest; Recruit-ment; Tree guild; Tree life history; Wood density.
Nomenclature: Ribeiro et al. (1999).
Abbreviation: BDFFP = Biological Dynamics of Forest Frag-ments Project.
Demographic and life-history correlatesfor Amazonian trees
Nascimento, Henrique E.M.1,2*; Laurance, William F.1,2,3; Condit, Richard1,4; Laurance,Susan G.1,5; D’Angelo, Sammya2,6 & Andrade, Ana C.2,7
1Smithsonian Tropical Research Institute, Apartado 2072, Balboa, Republic of Panamá; 2Biological Dynamics of ForestFragments Project (BDFFP), National Institute for Amazonian Research (INPA), C.P. 478, Manaus, AM 69011-970,
Brazil; 3E-mail [email protected]; 4E-mail [email protected]; 5E-mail [email protected];6E-mail [email protected]; 7E-mail [email protected]; *Corresponding author; E-mail [email protected]
Introduction
Amazonian forests are the world’s most diverse intree species (Gentry 1990; Oliveira & Mori 1999; Turner2001) and are experiencing very high rates of loggingand deforestation (Nepstad et al. 1999; Laurance et al.2001a). Demographic studies of individual tree speciesare needed to provide baseline ecological data that areessential for effective forest management and conserva-tion in the tropics. Unfortunately, even basic informa-tion is unavailable for many Amazonian tree species,which have been understudied relative to other tropicalregions and are often locally rare and patchily distrib-uted (Laurance 2001).
Much of what is known about the demography andlife history of tropical trees has been derived from long-term forest-dynamics studies in permanent plots (e.g.Lieberman et al. 1985; Primack et al. 1985; Hubbell &Foster 1986; Clark & Clark 1992; Condit et al. 1995,1996a, b; O’Brien et al. 1995; Laurance et al. 2004).Such studies have revealed large variability in species-specific mortality, recruitment, and incremental-growthrates, which are frequently associated with life-historydifferences along a continuum between early and latesuccessional trees (Condit et al. 1996a, b; Turner 2001);however, this simple gradient obscures considerableecological variation among species (Welden et al. 1991;Clark & Clark 1992; Davies 1998). Additional features,such as wood density and allometric relationships amongdiameter, height and crown shape, also vary greatlyamong species and can be correlated with factors suchas tree age, successional status, growth form, local envi-ronmental conditions, and phylogenetic affinities(Williamson 1984; Primack et al. 1985; O’Brien et al.1995; Turner 2001; Poorter et al. 2003).
In this study we use long-term (18 years) data from24 permanent 1-ha study plots, augmented with anextensive literature survey, to estimate a number ofdemographic and life-history parameters for 95 tree
626 Nascimento, H.E.M. et al.
species of the central Amazonian rain forest. We thentest for associations among these traits to identify eco-logical differences and relationships within this speciesassemblage. The group of species we examined in-cludes many of the most widespread and abundant treesin central Amazonia.
Methods
Study area
The study was conducted within the experimentallyfragmented landscape of the Biological Dynamics ofForest Fragments Project (BDFFP), which is locatedabout 80 km north of Manaus, Brazil (2°30' S, 60° W).Rain forests in the area are evergreen and terra firme(not seasonally flooded), occurring in the altitudinalrange 50 - 100 m (Lovejoy et al. 1986). Rainfall variesbetween 1900 and 3500 mm annually with a pronounceddry season from June to October (Laurance 2001). Theforest canopy is typically 30 - 37 m tall, with emergenttrees to 55 m. Species richness of trees is very high andcan exceed 280 species (≥ 10 cm DBH) per ha (Oliveira& Mori 1999).
The dominant soils in the study area are xanthicferralsols, which are heavily weathered, acidic and verypoor in nutrients such as P, Ca and K (Chauvel et al.1987). Cation concentrations tend to be higher in moreclayey soils, which are prevalent in flatter areas andridge tops; these areas generally support greater treebiomass than do gullies and slopes, which have highersand contents and lower cation concentrations (Lauranceet al. 1999).
Plot description and species analysed
Since 1980, a long-term study of tree-communitydynamics, biomass and composition has been conductedin fragmented and continuous forests in the BDFFPstudy area. For this study, data were pooled from 24 1-ha plots in undisturbed (unfragmented and unlogged)forest arrayed across an area spanning ca. 1000 km2. Allplots were located more than 300 m from the nearestforest-pasture edge to minimize the influence of edgeeffects on tree communities.
Following an initial, exhaustive census of all trees inthe early mid-1980s, each plot was recensused 2-3 timesat regular (typically 4 - 7 year) intervals to assess treemortality, recruitment, and growth, with the final censusconducted in mid-1999. Tree diameters were measured(to the nearest 1 mm) with DBH tapes at 1.3 m height orabove any buttresses. Species identifications (often byrecognized taxonomic experts; see Acknowledgements)
were based on sterile or fertile herbarium material col-lected for each tree, which is lodged in the BDFFPreference collection, Manaus, Brazil. About 1260 treespecies (≥ 10 cm DBH) have been identified in the studyarea to date.
The 95 tree species examined (App. 1) in this studyaccount for 23.1% of all stems, 8.8% of all identifiedtree species, 26% (61 of 235) of all tree genera, and 43%(25 of 61) of all tree families found in our 24 plots. Thissubset includes all species that were confidently identi-fied to species level, for which at least ten individualswere present in the plots (mean sample size was 33.5trees per species), and for which wood-density esti-mates were available. Wood density (specific gravity ofdry wood) data were gleaned from a review of wood-density values in Amazonian trees (Fearnside 1997) andfrom an exhaustive survey of more than 130 publica-tions and graduate theses (W.F. Laurance, S. D’Angelo,I. Ferraz, unpubl. database). When multiple wood-den-sity estimates were available for a particular tree species,the mean of the estimates was used. Selected speciesencompassed a wide range of variation in growth form,stature, and successional status. Prior to undertaking ouranalysis, we tentatively assigned each species into oneof four different tree guilds (pioneer, subcanopy, canopy,and emergent species) based on species descriptions inRibeiro et al. (1999) and online data sources from theNew York and Missouri Botanical Gardens. We thenused our quantitative data on tree demography and lifehistory of each species to assess the robustness of the apriori botanical and field-guild classifications.
Mortality, recruitment, and growth rates for indi-vidual species
Annualized mortality and recruitment rates wereestimated by finding parameters describing these ratesthat maximized the likelihood of observing our data.This technique allows for variable census intervals be-tween plots and censuses. Each species was consideredseparately, and the following refers to records of justone species.
Mortality. Let Nij be the number of individuals foundalive in plot i at the start of census interval j, and Sij bethe number of those found alive at the end of the inter-val. A single time interval, Tij, is assumed for all indi-viduals in a plot and census, and recorded to the nearestmonth (it took less than a month to finish a census of asingle plot). Define the mortality parameter p as oneminus the probability that a single individual tree sur-vives one year, so the probability of a tree surviving Tyears is (1 – p)T; assume this probability is constant forall individuals of the given species. For any arbitrary p,
- Demographic and life-history correlates for Amazonian trees - 627
the likelihood Lij of observing the Sij survivors at time
T L N S pij ij ij ij
Tij= −( )( ) binom , , 1
the binomial probability of observing Sij successes outof Nij trials, given a probability of success per trial of(1–p)Tij. The likelihood Ltot of observing all the data forthis species is the product of the probabilities Lij for allplots i and census intervals j:
L Ltot iji j
= ∏,
(1)
We located the value of p that maximizes Ltot, but as inany likelihood approach, we worked with log(Ltot) andmaximized the sum of log(Lij). We located the optimal pusing the functions dbinom and optimize in the compu-ter language R, version 1.6.2, starting with p = 0.0125and constraining p to the interval [0,1], otherwise usingdefault settings. For compatibility with recruitment rate,we report the instantaneous mortality parameter, m =log(1–p), which equals the derivative of the number ofsurvivors with respect to time, dS/dt (Condit et al. 1995,1999).
To assign 95% confidence limits to p (and, hence,m), we bootstrapped across plots. If a species occurredin nine plots, we randomly drew nine plots, 1000 times,with replacement, and fit p each time; the 25th and975th ranking values are the 95% confidence limits.When we selected a plot, all censuses of that plot and allindividuals within the plot were included. By boot-strapping across plots, we assume that the plot is the unitof data, not the individual tree nor the individual censusof a plot; thus, our confidence limits acknowledge thatmortality events for individuals within a plot, even indifferent censuses, are not independent.
A problem arose with the bootstrap method for cal-culating confidence when no trees of a species died. Themaximum likelihood value for p is of course 0, but allbootstrap replicates also return 0, because no dead treescan be chosen. To avoid the conclusion that no individualof this species will ever die, we estimated confidenceintervals using the method of Condit et al. (1995). Let
N N S Sij ij= = = ∑∑be the number of individuals of this species summedover all plots and censuses, and let
TT
ij
i ji j=∑ ,,
be the arithmetic mean census interval for this species,across all plots and censuses. Then the upper 95%confidence limit pu is the mortality parameter for whichbinom(N, S, (1–pu)
T) = 0.025 (half of 5% because it is atwo-tailed test). Since the binomial probability ofobserving N successes out of N trials is (1–pu)
NT, itfollows that: and
This is the highest mortality rate consistent with observ-ing all N trees surviving, that is, the mortality at whichthe probability of observing all trees survive is 0.025.The lower confidence limit is 0. This same method canbe used for calculating upper and lower confidencelimits for any species, even with N ≠ S (Condit et al.1995); we compared this method with the bootstrapmethods, and the results were very similar.
Recruitment. The recruitment parameter r is analogousto the mortality parameter m, and
dN
dTr m N= −( ) (3)
describes the rate of population change in a species; thisdescribes recruitment as a birth process, with r being therate at which single individuals produce new trees. Withthis description of population change, the number ofrecruits R observed after T years is R = S(erT – 1), whereS is the number of survivors (the initial population) Ndoes not appear in the formula for R). Given any arbi-trary recruitment parameter, r, the likelihood Lij of ob-serving Sij survivors and Rij recruits after a census inter-val of Tij years is
L Poisson R S eij ij ijrTij= −( )( ), 1 (4)
the probability of observing Rij events according to aPoisson with expectation S(erT – 1). We located thevalue of r that maximized this probability across allplots and census intervals for each species, again usingoptimize in R, with an initial value of r = 0.0125 andconstraining r to the interval [0,1]. Confidence limitswere calculated with a bootstrap as for mortality. Whenno recruits were observed, an upper confidence limitwas estimated as for mortality, but using the Poisson,not binomial; then
rT Su = +
1 401ln
ln( )(5)
A problem arose with these calculations in plots withrecruitment but no survivors. In this situation, the modelproduces a probability of zero for finding any recruits.Since a few species did recruit in plots where no treeswere present, we had to use a separate likelihood modelwhen Sij = 0: the predicted value of R = erT / 2 –1. Thismeans the predicted recruitment with no survivors presentis roughly half what it would be with one survivor. This isrealistic in that it allows recruitment even with no treespresent, but predicts less recruitment than with one treepresent. The term rT / 2 is, however, arbitrary. We com-pared the likelihood estimate of r with the method used inCondit et al. (1999), and the two agree almost exactly inall species except the two Cecropia species; in bothpu
Nt= 0 025.
m pNtu u= − − =log( )
log( )1
40(2)
628 Nascimento, H.E.M. et al.
species, most recruits appeared in plots where therewere no Cecropia present, forcing use of the arbitrarylikelihood calculation just described. Regardless, bothmethods estimated very high recruitment in Cecropiawith broad and overlapping confidence intervals (dueto the low number of samples).
Growth. The mean annual growth rate for each indi-vidual tree was estimated by subtracting its initial DBH(from the first census) from its final DBH (from the lastcensus), and dividing this value by the total number ofyears between the two censuses. For each species, twoestimates of growth rate were determined: the mediangrowth rate; and the upper decile of the growth rate,which was used as an estimate of maximum growth ratefor each species. The use of median and decile values,rather than the mean and absolute highest value, helpedto minimize possible bias from outliers.
Data analysis
An ordination analysis, Global Non-metric Multidi-mensional Scaling (GNMDS), with the Sørensen simi-larity index, performing on PC-ORD package (McCune& Mefford 1999), was used to summarize major gradi-ents in eight demographic and life-history features oftrees (wood density, mean DBH, maximum DBH, me-dian growth rate, maximum growth rate, mean mortalityrate, mean recruitment rate, mean population density).All variables were equally weighted prior to analysis,using the standardization by the maximum method (Noy-Meir et al. 1975). Randomization tests were used todetermine the number of ordination axes that explainedsignificantly more variation in the data set than expectedby chance (McCune & Mefford 1999).
We used one-way ANOVAs to assess differencesamong the four tree guilds for each demographic andlife-history feature, followed by Tukey’s tests to con-trast sample means. Low growth rates in subcanopytrees might arise because they are smaller in size thancanopy and emergent trees and as a result of physi-ological adaptation to low-light and other environmen-tal conditions beneath the forest canopy (Thomas 1996).We attempted to discriminate between these two ex-planations by comparing relative effects of tree size(mean DBH) and tree guild on species growth ratesusing an ANCOVA. Linear regressions were used toassess interrelationships between demographic and life-history attributes. Because these are parametric tests,appropriate data transformations were used to reduceheteroscedasticity, improve normality, and increase lin-earity of relationships between response and predictorvariables (tree mortality and recruitment rates, mediangrowth rate, mean DBH, and maximum DBH).
Results
General differences among guilds
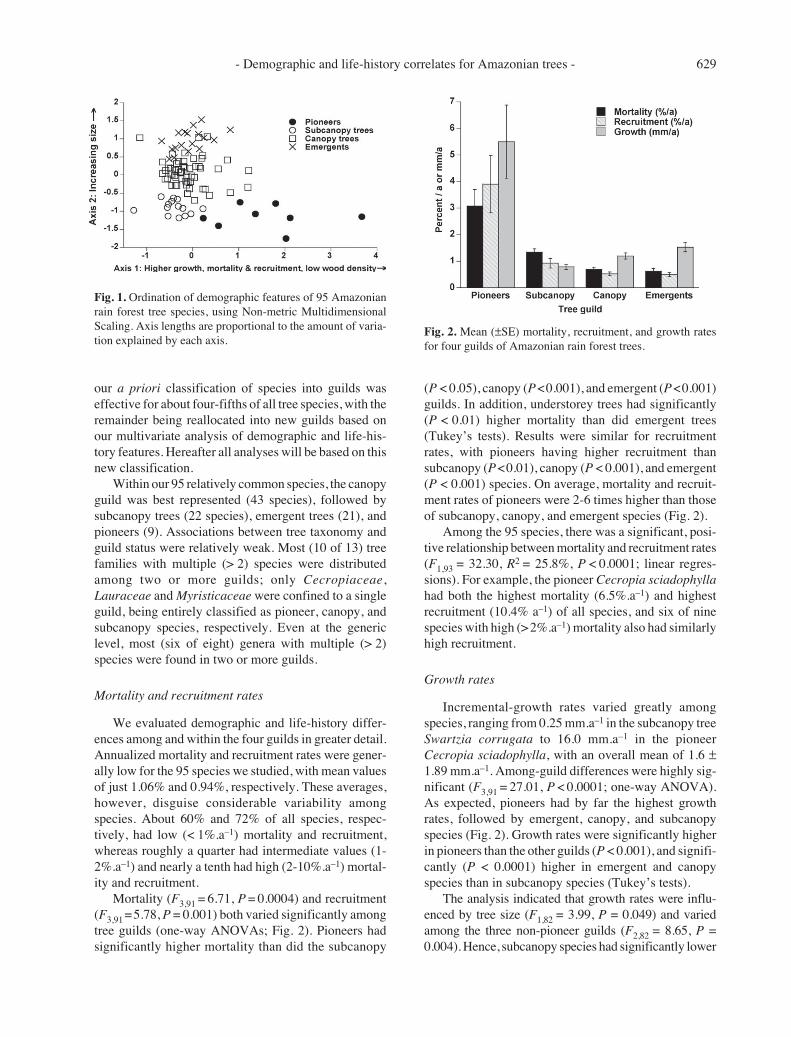
Two major gradients of variation among the 95species were revealed by ordination analysis of the eightkey demographic and life-history characteristics (Table1). A randomization test (n = 50 runs) confirmed that thetwo axes explained significantly more variation thanexpected by chance (P < 0.02 in both cases). Axis 1,which captured 58% of the total variation in the data set,described a gradient from old-growth species with slowgrowth, high wood density, and low mortality and re-cruitment rates, to fast-growing pioneer species withopposite traits. Axis 2 captured 36% of the total varia-tion and mainly described a gradient in tree size (meanand maximum DBH). Larger trees also exhibited sometendency to have lower mortality and recruitment, higherwood density, and higher population densities, than didsmaller species (Table 1).
We then assessed the efficacy of our a priori classi-fication of tree species into pioneer, subcanopy, canopy,and emergent guilds, based on the ordination analysis.Although species in the four guilds were moderatelywell separated in two-dimensional ordination space (Fig.1), 18 species were re-allocated to different guilds basedon their ordination scores. Two species initially classi-fied as pioneers, Inga capitata and Jacaranda copaia,had low scores on axis 1 and were placed in the subcanopygroup. Among emergent trees, two Lecythidaceae species(Couratari stellata and Eschweilera amazoniciformis)were re-allocated to the canopy guild, based on their lowscores on axis 2. Substantial variation was evident withinthe canopy guild, and 14 species were re-allocated to thethree other guilds (see the Appendix for details). Thus,
Table 1. Product-moment correlations between eight demo-graphic features of Amazonian trees and two ordination axes(DBH = trunk diameter at breast height). Asterisks indicatesignificant correlations, using a Bonferroni-corrected prob-ability value (P = 0.003) to reduce the likelihood of spuriouscorrelations.
Variable Axis 1 Axis 2
Wood density –0.629 * 0.320 *Mortality rate 0.728 * –0.527 *Recruitment rate 0.710 * –0.395 *Mean DBH –0.017 0.839 *Maximum DBH –0.058 0.878 *Median growth rate 0.849 * –0.122Maximum growth rate 0.890 * –0.007Population density –0.300 0.319 *
Variation explained* 58.1% 36.1%
*Based on coefficients of determination for correlations between ordina-tion distances and distances in the original n-dimensional space.
- Demographic and life-history correlates for Amazonian trees - 629
our a priori classification of species into guilds waseffective for about four-fifths of all tree species, with theremainder being reallocated into new guilds based onour multivariate analysis of demographic and life-his-tory features. Hereafter all analyses will be based on thisnew classification.
Within our 95 relatively common species, the canopyguild was best represented (43 species), followed bysubcanopy trees (22 species), emergent trees (21), andpioneers (9). Associations between tree taxonomy andguild status were relatively weak. Most (10 of 13) treefamilies with multiple (> 2) species were distributedamong two or more guilds; only Cecropiaceae,Lauraceae and Myristicaceae were confined to a singleguild, being entirely classified as pioneer, canopy, andsubcanopy species, respectively. Even at the genericlevel, most (six of eight) genera with multiple (> 2)species were found in two or more guilds.
Mortality and recruitment rates
We evaluated demographic and life-history differ-ences among and within the four guilds in greater detail.Annualized mortality and recruitment rates were gener-ally low for the 95 species we studied, with mean valuesof just 1.06% and 0.94%, respectively. These averages,however, disguise considerable variability amongspecies. About 60% and 72% of all species, respec-tively, had low (< 1%.a–1) mortality and recruitment,whereas roughly a quarter had intermediate values (1-2%.a–1) and nearly a tenth had high (2-10%.a–1) mortal-ity and recruitment.
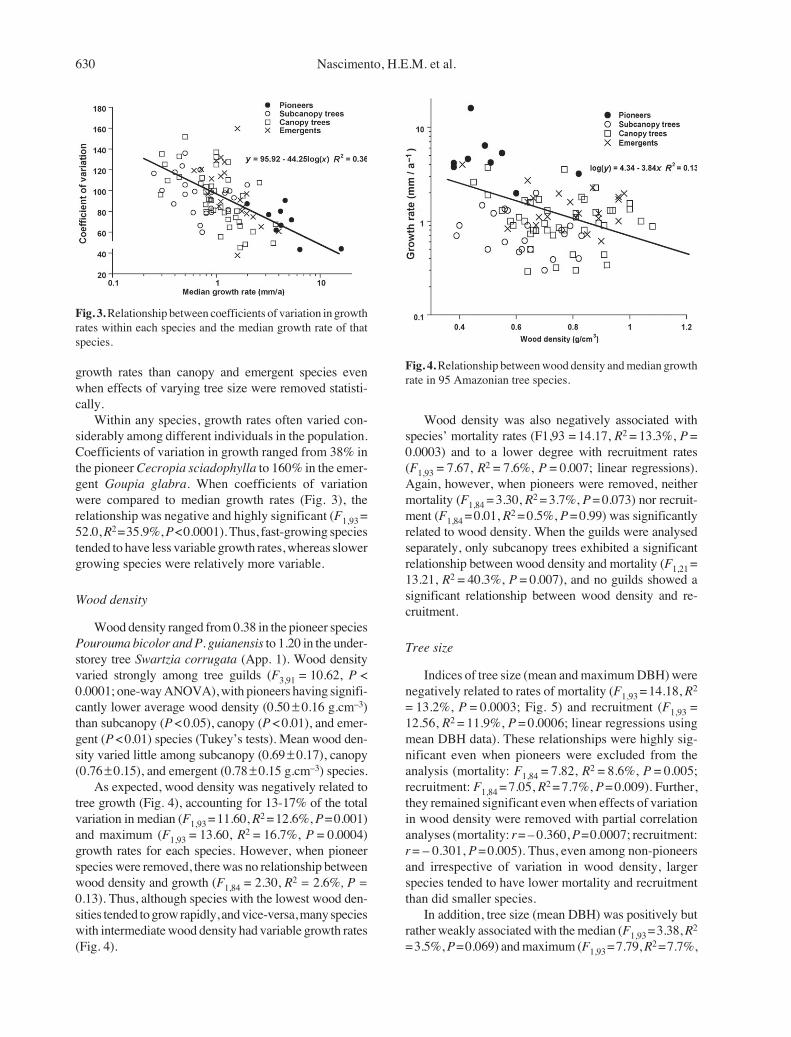
Mortality (F3,91 = 6.71, P = 0.0004) and recruitment(F3,91 = 5.78, P = 0.001) both varied significantly amongtree guilds (one-way ANOVAs; Fig. 2). Pioneers hadsignificantly higher mortality than did the subcanopy
(P < 0.05), canopy (P < 0.001), and emergent (P < 0.001)guilds. In addition, understorey trees had significantly(P < 0.01) higher mortality than did emergent trees(Tukey’s tests). Results were similar for recruitmentrates, with pioneers having higher recruitment thansubcanopy (P < 0.01), canopy (P < 0.001), and emergent(P < 0.001) species. On average, mortality and recruit-ment rates of pioneers were 2-6 times higher than thoseof subcanopy, canopy, and emergent species (Fig. 2).
Among the 95 species, there was a significant, posi-tive relationship between mortality and recruitment rates(F1,93 = 32.30, R2 = 25.8%, P < 0.0001; linear regres-sions). For example, the pioneer Cecropia sciadophyllahad both the highest mortality (6.5%.a–1) and highestrecruitment (10.4% a–1) of all species, and six of ninespecies with high (> 2%.a–1) mortality also had similarlyhigh recruitment.
Growth rates
Incremental-growth rates varied greatly amongspecies, ranging from 0.25 mm.a–1 in the subcanopy treeSwartzia corrugata to 16.0 mm.a–1 in the pioneerCecropia sciadophylla, with an overall mean of 1.6 ±1.89 mm.a–1. Among-guild differences were highly sig-nificant (F3,91 = 27.01, P < 0.0001; one-way ANOVA).As expected, pioneers had by far the highest growthrates, followed by emergent, canopy, and subcanopyspecies (Fig. 2). Growth rates were significantly higherin pioneers than the other guilds (P < 0.001), and signifi-cantly (P < 0.0001) higher in emergent and canopyspecies than in subcanopy species (Tukey’s tests).
The analysis indicated that growth rates were influ-enced by tree size (F1,82 = 3.99, P = 0.049) and variedamong the three non-pioneer guilds (F2,82 = 8.65, P =0.004). Hence, subcanopy species had significantly lower
Fig. 1. Ordination of demographic features of 95 Amazonianrain forest tree species, using Non-metric MultidimensionalScaling. Axis lengths are proportional to the amount of varia-tion explained by each axis.
Fig. 2. Mean (±SE) mortality, recruitment, and growth ratesfor four guilds of Amazonian rain forest trees.
630 Nascimento, H.E.M. et al.
growth rates than canopy and emergent species evenwhen effects of varying tree size were removed statisti-cally.
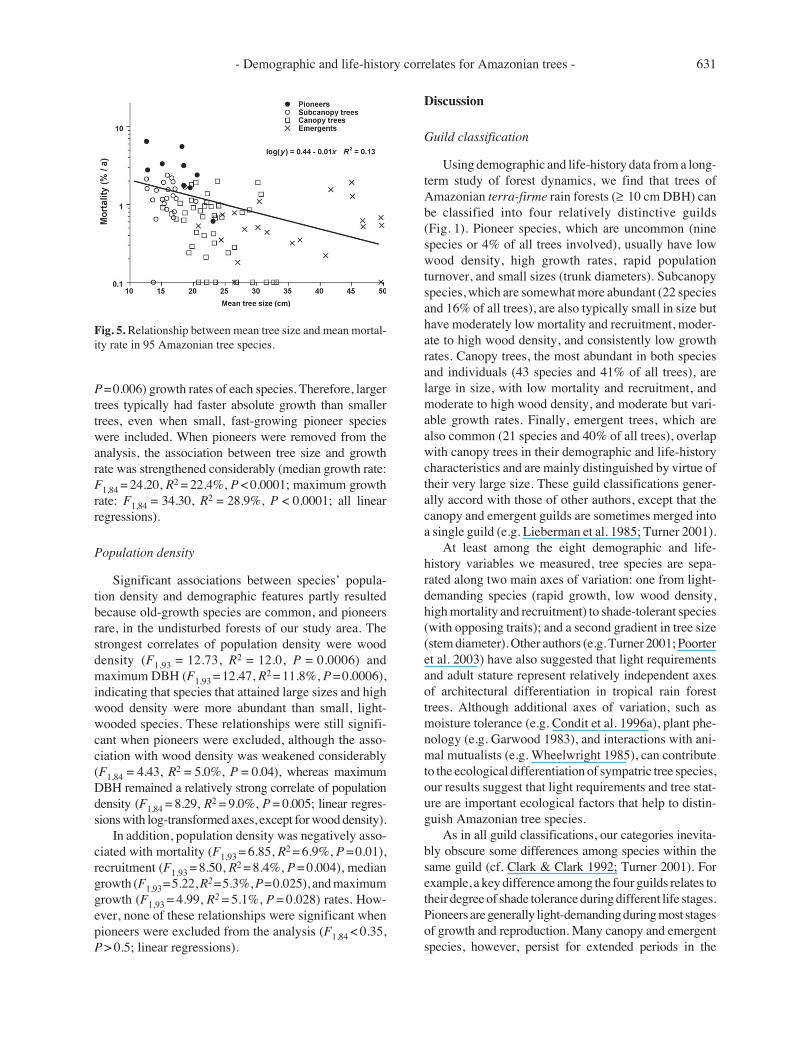
Within any species, growth rates often varied con-siderably among different individuals in the population.Coefficients of variation in growth ranged from 38% inthe pioneer Cecropia sciadophylla to 160% in the emer-gent Goupia glabra. When coefficients of variationwere compared to median growth rates (Fig. 3), therelationship was negative and highly significant (F1,93 =52.0, R2 = 35.9%, P < 0.0001). Thus, fast-growing speciestended to have less variable growth rates, whereas slowergrowing species were relatively more variable.
Wood density
Wood density ranged from 0.38 in the pioneer speciesPourouma bicolor and P. guianensis to 1.20 in the under-storey tree Swartzia corrugata (App. 1). Wood densityvaried strongly among tree guilds (F3,91 = 10.62, P <0.0001; one-way ANOVA), with pioneers having signifi-cantly lower average wood density (0.50 ± 0.16 g.cm–3)than subcanopy (P < 0.05), canopy (P < 0.01), and emer-gent (P < 0.01) species (Tukey’s tests). Mean wood den-sity varied little among subcanopy (0.69 ± 0.17), canopy(0.76 ± 0.15), and emergent (0.78 ± 0.15 g.cm–3) species.
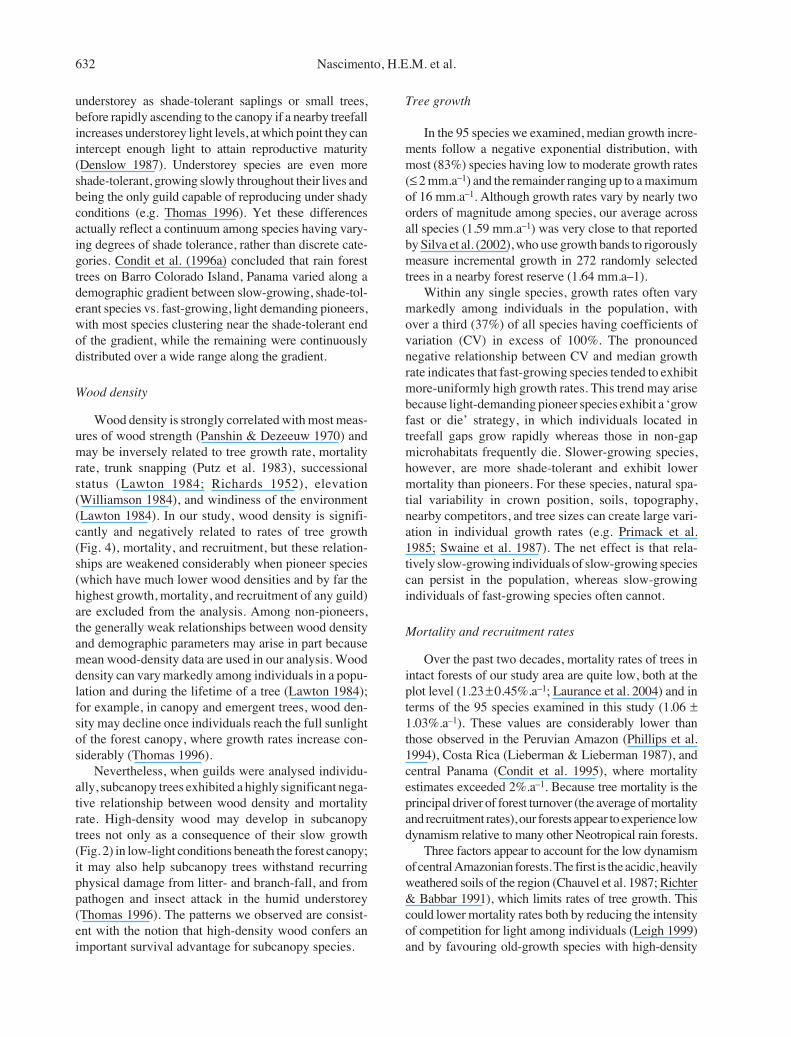
As expected, wood density was negatively related totree growth (Fig. 4), accounting for 13-17% of the totalvariation in median (F1,93 = 11.60, R2 = 12.6%, P = 0.001)and maximum (F1,93 = 13.60, R2 = 16.7%, P = 0.0004)growth rates for each species. However, when pioneerspecies were removed, there was no relationship betweenwood density and growth (F1,84 = 2.30, R2 = 2.6%, P =0.13). Thus, although species with the lowest wood den-sities tended to grow rapidly, and vice-versa, many specieswith intermediate wood density had variable growth rates(Fig. 4).
Wood density was also negatively associated withspecies’ mortality rates (F1,93 = 14.17, R2 = 13.3%, P =0.0003) and to a lower degree with recruitment rates(F1,93 = 7.67, R2 = 7.6%, P = 0.007; linear regressions).Again, however, when pioneers were removed, neithermortality (F1,84 = 3.30, R2 = 3.7%, P = 0.073) nor recruit-ment (F1,84 = 0.01, R2 = 0.5%, P = 0.99) was significantlyrelated to wood density. When the guilds were analysedseparately, only subcanopy trees exhibited a significantrelationship between wood density and mortality (F1,21 =13.21, R2 = 40.3%, P = 0.007), and no guilds showed asignificant relationship between wood density and re-cruitment.
Tree size
Indices of tree size (mean and maximum DBH) werenegatively related to rates of mortality (F1,93 = 14.18, R2
= 13.2%, P = 0.0003; Fig. 5) and recruitment (F1,93 =12.56, R2 = 11.9%, P = 0.0006; linear regressions usingmean DBH data). These relationships were highly sig-nificant even when pioneers were excluded from theanalysis (mortality: F1,84 = 7.82, R2 = 8.6%, P = 0.005;recruitment: F1,84 = 7.05, R2 = 7.7%, P = 0.009). Further,they remained significant even when effects of variationin wood density were removed with partial correlationanalyses (mortality: r = – 0.360, P = 0.0007; recruitment:r = – 0.301, P = 0.005). Thus, even among non-pioneersand irrespective of variation in wood density, largerspecies tended to have lower mortality and recruitmentthan did smaller species.
In addition, tree size (mean DBH) was positively butrather weakly associated with the median (F1,93 = 3.38, R2
= 3.5%, P = 0.069) and maximum (F1,93 = 7.79, R2 = 7.7%,
Fig. 3. Relationship between coefficients of variation in growthrates within each species and the median growth rate of thatspecies.
Fig. 4. Relationship between wood density and median growthrate in 95 Amazonian tree species.
- Demographic and life-history correlates for Amazonian trees - 631
P = 0.006) growth rates of each species. Therefore, largertrees typically had faster absolute growth than smallertrees, even when small, fast-growing pioneer specieswere included. When pioneers were removed from theanalysis, the association between tree size and growthrate was strengthened considerably (median growth rate:F1,84 = 24.20, R2 = 22.4%, P < 0.0001; maximum growthrate: F1,84 = 34.30, R2 = 28.9%, P < 0.0001; all linearregressions).
Population density
Significant associations between species’ popula-tion density and demographic features partly resultedbecause old-growth species are common, and pioneersrare, in the undisturbed forests of our study area. Thestrongest correlates of population density were wooddensity (F1,93 = 12.73, R2 = 12.0, P = 0.0006) andmaximum DBH (F1,93 = 12.47, R2 = 11.8%, P = 0.0006),indicating that species that attained large sizes and highwood density were more abundant than small, light-wooded species. These relationships were still signifi-cant when pioneers were excluded, although the asso-ciation with wood density was weakened considerably(F1,84 = 4.43, R2 = 5.0%, P = 0.04), whereas maximumDBH remained a relatively strong correlate of populationdensity (F1,84 = 8.29, R2 = 9.0%, P = 0.005; linear regres-sions with log-transformed axes, except for wood density).
In addition, population density was negatively asso-ciated with mortality (F1,93 = 6.85, R2 = 6.9%, P = 0.01),recruitment (F1,93 = 8.50, R2 = 8.4%, P = 0.004), mediangrowth (F1,93 = 5.22, R2 = 5.3%, P = 0.025), and maximumgrowth (F1,93 = 4.99, R2 = 5.1%, P = 0.028) rates. How-ever, none of these relationships were significant whenpioneers were excluded from the analysis (F1,84 < 0.35,P > 0.5; linear regressions).
Discussion
Guild classification
Using demographic and life-history data from a long-term study of forest dynamics, we find that trees ofAmazonian terra-firme rain forests (≥ 10 cm DBH) canbe classified into four relatively distinctive guilds(Fig. 1). Pioneer species, which are uncommon (ninespecies or 4% of all trees involved), usually have lowwood density, high growth rates, rapid populationturnover, and small sizes (trunk diameters). Subcanopyspecies, which are somewhat more abundant (22 speciesand 16% of all trees), are also typically small in size buthave moderately low mortality and recruitment, moder-ate to high wood density, and consistently low growthrates. Canopy trees, the most abundant in both speciesand individuals (43 species and 41% of all trees), arelarge in size, with low mortality and recruitment, andmoderate to high wood density, and moderate but vari-able growth rates. Finally, emergent trees, which arealso common (21 species and 40% of all trees), overlapwith canopy trees in their demographic and life-historycharacteristics and are mainly distinguished by virtue oftheir very large size. These guild classifications gener-ally accord with those of other authors, except that thecanopy and emergent guilds are sometimes merged intoa single guild (e.g. Lieberman et al. 1985; Turner 2001).
At least among the eight demographic and life-history variables we measured, tree species are sepa-rated along two main axes of variation: one from light-demanding species (rapid growth, low wood density,high mortality and recruitment) to shade-tolerant species(with opposing traits); and a second gradient in tree size(stem diameter). Other authors (e.g. Turner 2001; Poorteret al. 2003) have also suggested that light requirementsand adult stature represent relatively independent axesof architectural differentiation in tropical rain foresttrees. Although additional axes of variation, such asmoisture tolerance (e.g. Condit et al. 1996a), plant phe-nology (e.g. Garwood 1983), and interactions with ani-mal mutualists (e.g. Wheelwright 1985), can contributeto the ecological differentiation of sympatric tree species,our results suggest that light requirements and tree stat-ure are important ecological factors that help to distin-guish Amazonian tree species.
As in all guild classifications, our categories inevita-bly obscure some differences among species within thesame guild (cf. Clark & Clark 1992; Turner 2001). Forexample, a key difference among the four guilds relates totheir degree of shade tolerance during different life stages.Pioneers are generally light-demanding during most stagesof growth and reproduction. Many canopy and emergentspecies, however, persist for extended periods in the
Fig. 5. Relationship between mean tree size and mean mortal-ity rate in 95 Amazonian tree species.
632 Nascimento, H.E.M. et al.
understorey as shade-tolerant saplings or small trees,before rapidly ascending to the canopy if a nearby treefallincreases understorey light levels, at which point they canintercept enough light to attain reproductive maturity(Denslow 1987). Understorey species are even moreshade-tolerant, growing slowly throughout their lives andbeing the only guild capable of reproducing under shadyconditions (e.g. Thomas 1996). Yet these differencesactually reflect a continuum among species having vary-ing degrees of shade tolerance, rather than discrete cate-gories. Condit et al. (1996a) concluded that rain foresttrees on Barro Colorado Island, Panama varied along ademographic gradient between slow-growing, shade-tol-erant species vs. fast-growing, light demanding pioneers,with most species clustering near the shade-tolerant endof the gradient, while the remaining were continuouslydistributed over a wide range along the gradient.
Wood density
Wood density is strongly correlated with most meas-ures of wood strength (Panshin & Dezeeuw 1970) andmay be inversely related to tree growth rate, mortalityrate, trunk snapping (Putz et al. 1983), successionalstatus (Lawton 1984; Richards 1952), elevation(Williamson 1984), and windiness of the environment(Lawton 1984). In our study, wood density is signifi-cantly and negatively related to rates of tree growth(Fig. 4), mortality, and recruitment, but these relation-ships are weakened considerably when pioneer species(which have much lower wood densities and by far thehighest growth, mortality, and recruitment of any guild)are excluded from the analysis. Among non-pioneers,the generally weak relationships between wood densityand demographic parameters may arise in part becausemean wood-density data are used in our analysis. Wooddensity can vary markedly among individuals in a popu-lation and during the lifetime of a tree (Lawton 1984);for example, in canopy and emergent trees, wood den-sity may decline once individuals reach the full sunlightof the forest canopy, where growth rates increase con-siderably (Thomas 1996).
Nevertheless, when guilds were analysed individu-ally, subcanopy trees exhibited a highly significant nega-tive relationship between wood density and mortalityrate. High-density wood may develop in subcanopytrees not only as a consequence of their slow growth(Fig. 2) in low-light conditions beneath the forest canopy;it may also help subcanopy trees withstand recurringphysical damage from litter- and branch-fall, and frompathogen and insect attack in the humid understorey(Thomas 1996). The patterns we observed are consist-ent with the notion that high-density wood confers animportant survival advantage for subcanopy species.
Tree growth
In the 95 species we examined, median growth incre-ments follow a negative exponential distribution, withmost (83%) species having low to moderate growth rates(≤ 2 mm.a–1) and the remainder ranging up to a maximumof 16 mm.a–1. Although growth rates vary by nearly twoorders of magnitude among species, our average acrossall species (1.59 mm.a–1) was very close to that reportedby Silva et al. (2002), who use growth bands to rigorouslymeasure incremental growth in 272 randomly selectedtrees in a nearby forest reserve (1.64 mm.a–1).
Within any single species, growth rates often varymarkedly among individuals in the population, withover a third (37%) of all species having coefficients ofvariation (CV) in excess of 100%. The pronouncednegative relationship between CV and median growthrate indicates that fast-growing species tended to exhibitmore-uniformly high growth rates. This trend may arisebecause light-demanding pioneer species exhibit a ‘growfast or die’ strategy, in which individuals located intreefall gaps grow rapidly whereas those in non-gapmicrohabitats frequently die. Slower-growing species,however, are more shade-tolerant and exhibit lowermortality than pioneers. For these species, natural spa-tial variability in crown position, soils, topography,nearby competitors, and tree sizes can create large vari-ation in individual growth rates (e.g. Primack et al.1985; Swaine et al. 1987). The net effect is that rela-tively slow-growing individuals of slow-growing speciescan persist in the population, whereas slow-growingindividuals of fast-growing species often cannot.
Mortality and recruitment rates
Over the past two decades, mortality rates of trees inintact forests of our study area are quite low, both at theplot level (1.23 ± 0.45%.a–1; Laurance et al. 2004) and interms of the 95 species examined in this study (1.06 ±1.03%.a–1). These values are considerably lower thanthose observed in the Peruvian Amazon (Phillips et al.1994), Costa Rica (Lieberman & Lieberman 1987), andcentral Panama (Condit et al. 1995), where mortalityestimates exceeded 2%.a–1. Because tree mortality is theprincipal driver of forest turnover (the average of mortalityand recruitment rates), our forests appear to experience lowdynamism relative to many other Neotropical rain forests.
Three factors appear to account for the low dynamismof central Amazonian forests. The first is the acidic, heavilyweathered soils of the region (Chauvel et al. 1987; Richter& Babbar 1991), which limits rates of tree growth. Thiscould lower mortality rates both by reducing the intensityof competition for light among individuals (Leigh 1999)and by favouring old-growth species with high-density
- Demographic and life-history correlates for Amazonian trees - 633
wood, which are less prone to stem breakage and otherphysical damage (Putz et al. 1983; ter Steege & Hammond2001). Second, forest disturbances by convectional wind-storms (Nelson et al. 1994), fires (Piperno & Becker 1996),lightning strikes (Magnusson et al. 1996), and wet-seasonflooding (Mori & Becker 1991) are limited in frequencyand extent, further reducing tree mortality. Finally, centralAmazonian forests have a relatively low density of lianas(Laurance et al. 2001b), which are major structural para-sites of trees, and many small-statured trees (Nascimento& Laurance 2002), which may tend to limit the size oftreefall gaps. Collectively, these factors may reduce thefrequency and size of forest disturbances, thereby contrib-uting to the low dynamism of forests in this region.
As a direct result of their low dynamism, centralAmazonian rain forests are dominated by long-lived, old-growth tree species, with short-lived pioneers comprisingonly a small fraction of the tree community. Over 95% ofthe tree species we examined in this study were non-pioneers, and two-thirds of these had mortality rates of <1%.a–1. On average, emergent species exhibited the low-est mortality, followed by canopy, subcanopy, and pio-neer species (Fig. 2), a pattern similar to that observed inPanamanian (Condit et al. 1995) and Malaysian(Manokaran & Kochummen 1987) rain forests.
An important implication of low mortality rates is thatmany central-Amazonian trees are expected to grow old.Among the species examined in this study, nearly 60%have estimated maximum longevities of 200-500 years,and 15% had maximum longevities of 500-1000 years,based on extrapolations from long-term growth and mor-tality data (Laurance et al. 2004). Such pronounced treelongevity has key implications for understanding forestdynamics, quantifying rates of carbon cycling, and im-proving forest-management strategies (Chambers et al.1998; Martinez-Ramos & Alvarez-Buylla 1998). Of ob-vious relevance is that polycyclic logging may requireunusually long intervals between cutting cycles, giventhe low growth rates and slow regeneration of manycentral-Amazonian tree species.
Acknowledgements. We thank R. Økland, P. Fine, N. Enright, N.Pitman, and C. Dick for commenting on the manuscript and manytaxonomic experts who kindly identified tree species in our studyarea, especially W. Anderson, R. Barneby, C. Berg, B. Boom, M.Campos, L. Coelho, Paulo Apóstolo, J. Costa, D. Daly, A.Gentry, M. Kawasaki, N. Lepsch-Cunha, M. Hopkins, S. Mori,R. Hutchings, P. Maas, M. Nee, T. Pennington, G. Prance, R.Rankin-de Merona, W. Rodrigues, S. Renner, A. de Souza, L.Teixeira, M. Uehling, A. Vincentini and H. van der Werff.Support was provided by the NASA-LBA program, A.W. MellonFoundation, Conservation, Food and Health Foundation, andSmithsonian Tropical Research Institute. This is Publication number453 in the BDFFP technical series.
References
Chambers, J. Q., Higuchi, N. & Schimel, J.P. 1998. Ancient treesin Amazonia. Nature 391: 135-136.
Chauvel, A., Lucas, Y. & Boulet, R. 1987. On the genesis of thesoil mantle of the region of Manaus, Central Amazonia,Brazil. Experientia 43: 234-240.
Clark, D.A. & Clark, D.B. 1992. Life history diversity of canopyand emergent trees in a neotropical rain forest. Ecol. Monogr.62: 315-344.
Condit, R., Hubbell, S.P. & Foster, R.B. 1995. Mortality rates of205 neotropical tree and shrub species and the impact of asevere drought. Ecol. Monogr. 65: 419-439.
Condit, R., Hubbell, S.P. & Foster, R.B. 1996a. Assessing theresponse of plant functional types to climatic change intropical forests. J. Veg. Sci. 7: 405-416.
Condit, R., Hubbell, S.P. & Foster, R.B. 1996b. Changes in treespecies abundance in a neotropical forest: impacts of climatechange. J. Trop. Ecol. 12: 231-256.
Condit, R., Ashton, P.S., Manokaran, N., Lafrankie, J.V., Hubbell,S.P. & Foster, R.B. 1999. Dynamics of the forest communi-ties at Pasoh and Barro Colorado: comparing two 50 ha plots.Philos. Trans. R. Soc. Lond. Ser. B Biol. Sci. 354: 1739-1748.
Davies, S.J. 1998. Photosynthesis of nine pioneer Macarangaspecies from Borneo in relation to life history. Ecology 79:2292-2308.
Denslow, J.S. 1987. Tropical rainforest gaps and tree speciesdiversity. Annu. Rev. Ecol. Syst. 18: 431-451.
Fearnside, P.M. 1997. Wood density for estimating forest biomassin Brazilian Amazonia. For. Ecol. Manage. 90: 59-87.
Garwood, N.C. 1983. Seed germination in a seasonal tropicalforest in Panama: a community study. Ecol. Monogr. 53: 159-181.
Gentry, A.H. 1990. Floristic similarities and differences betweensouthern Central America and upper and central Amazonia.In: Gentry, A.H. (ed.) Four neotropical rainforests, pp. 141-157. Yale University Press, New Haven, CT, US.
Hubbell, S.P. & Foster, R.B. 1986. Commonness and rarity in aneotropical forest: implications for tropical tree conservation.In: Soulé, M.E. (ed.) Conservation biology: the science ofscarcity and diversity, pp. 205-231. Sinauer Associates, Sun-derland, MA, US.
Laurance, W.F. 2001. The hyper-diverse flora of the centralAmazon: an overview. In: Bierregaard, R.O., Gascon, C.,Lovejoy, T.E. & Mesquita, R. (eds.) Lessons from Amazonia:ecology and conservation of a fragmented forest, pp. 47-53.Yale University Press, New Haven, CT, US.
Laurance, W.F., Fearnside, P.M., Laurance, S.G., Delamonica, P.,Lovejoy, T.E., Rankin-de Merona, J.M., Chambers, J.Q. &Gascon, C. 1999. Relationship between soils and Amazonforest biomass: a landscape-scale study. For. Ecol. Manage.118: 127-138.
Laurance, W.F., Albernaz, A. & da Costa, C. 2001a. Is deforesta-tion accelerating in the Brazilian Amazon? Environ. Conserv.28: 305-311.
Laurance, W.F., Perez-Salicrup, D., Delamonica, P., Fearnside,P.M., D’Angelo, S., Jerozolinski, A., Pohl, L. & T.E. Lovejoy.2001b. Rain forest fragmentation and the structure of Amazo-nian liana communities. Ecology 82: 105-116.
634 Nascimento, H.E.M. et al.
Laurance, W.F., Nascimento, H.E.M., Laurance, S.G., Condit, R.,D’Angelo, S. & Andrade, A. 2004. Inferred longevity ofAmazonian rainforest trees based on a long-term demo-graphic study. For. Ecol. Manage. 190: 131-143.
Lawton, R.O. 1984. Ecological constraints on wood density in atropical montane rain forest. Am. J. Bot. 71: 261-267.
Leigh, E.G. 1999. Tropical forest ecology: a view from BarroColorado Island. Oxford University Press, Oxford, UK.
Lieberman, D. & Lieberman, M. 1987. Forest tree growth anddynamics at La Selva, Costa Rica (1969-1982). J. Trop. Ecol.10: 151-166.
Lieberman, D., Lieberman, M., Hartshorn, G. & Peralta, R. 1985.Growth rates and age-size relationships of tropical wet foresttrees in Costa Rica. J. Trop. Ecol. 1: 97-109.
Lovejoy, T.E., Bierregaard, R.O., Rylands, A.B., Malcolm, J.R.,Quintela, C.E., Harper, L.H., Brown, K.S., Powell, A.H., Powell,G.V.N., Schubart, H.O.R. & Hays, M.B. 1986. Edge and othereffects of isolation on Amazon forest fragments. In: Soulé.M.E. (ed.) Conservation biology: the science of scarcity anddiversity, pp. 257-285. Sinauer Associates, Sunderland, MA,US.
Magnusson, W.E., Lima, A.P. & Lima, O.P. 1996. Group light-ning mortality of trees in a neotropical forest. J. Trop. Ecol.12: 899-903.
Manokaran, N. & Kochummen, K.M. 1987. Recruitment, growthand mortality of tree species in a lowland dipterocarp forest inpeninsular Malaysia. J. Trop. Ecol. 3: 315-330.
Martinez-Ramos, M. & Alvarez-Buylla, H. 1998. How old aretropical rain forest trees? Trends Plant Sci. 3: 400-405.
McCune, B. & Mefford, M.J. 1999. PC-ORD: Multivariate analy-sis of ecological data, version 4.17. MjM Software, GlenendenBeach, OR, US.
Mori, S. & Becker, P. 1991. Flooding affects survival ofLecythidaceae in terra-firme forest near Manaus, Brazil.Biotropica 23: 87-90.
Nascimento, H.E.M. & Laurance, W.F. 2002. Total abovegroundbiomass in central Amazonian rainforests: a landscape-scalestudy. For. Ecol. Manage. 168: 311-321.
Nelson, B.W., Kapos, V., Adams, J., Oliveira, W., Braun, O. & doAmaral, I. 1994. Forest disturbance by large blowdowns inthe Brazilian Amazon. Ecology 75: 853-858.
Nepstad, D.C., Verissimo, A., Alencar, A., Nobre, C., Lima, E.,Lefebre, P., Schlesinger, P., Potter, C., Moutinho, P., Mendoza,E., Cochrane, M. & Brooks, V. 1999. Large-scale impover-ishment of Amazonian forests by logging and fire. Nature398: 505-508.
Noy-Meir, I., Walker, D. & Williams, W.T. 1975. Data transfor-mations in ecological ordination. II. On the meaning of datastandardization. J. Ecol. 63: 779-800.
O’Brien, S.T., Hubbell, S.P., Spiro, P., Condit, R. & Foster, R.B.1995. Diameter, height, crown, and age relationships in eightneotropical tree species. Ecology 76: 1926-1939.
Oliveira, A.A. & Mori, S.A. 1999. A central Amazonian terrafirme forest. I. High tree species richness on poor soils.Biodiv. Conserv. 8: 1219-1244.
Panshin, A.J. & Dezeeuw, C. 1970. Textbook of wood technology.Vol. I. Structure, identification, uses, and properties of thecommercial woods of the United States and Canada. McGraw-Hill, New York, NY, US.
Phillips, O., Hall, P., Gentry, A., Sawyer, S.A. & Vásquez, R.1994. Dynamics and species richness of tropical forests. Proc.Nat. Acad. Sci. 91: 2805-2809.
Piperno, D.R. & Becker, P. 1996. Vegetation history of a site in thecentral Amazon Basin derived from phytolith and charcoalrecords from natural soils. Quat. Res. 45: 202-209.
Poorter, L., Bongers, F., Sterck, F.J. & Wöll, H. 2003. Architec-ture of 53 rain forest tree species differing in adult stature andshade tolerance. Ecology 84: 602-608.
Primack, R.B., Ashton, P.S., Chai, P. & Lee, H.S. 1985. Growthrates and population structure of Moraceae trees in Sarawak,East Malaysia. Ecology 66: 577-588.
Putz, F.E., Coley, P.D., Lu, K., Montalva, A. & Aiello, A. 1983.Uprooting and snapping of trees: structural determinants andecological consequences. Can. J. For. Res. 13: 1011-1020.
Ribeiro, J.E.L., Hopkins, M.J.G., Vicentini, A., Sothers, C., Costa,M., Brito, J., Souza, M., Martins, L., Lohmann, L., Assunção,P.A., Pereira, E., Silva, C., Mesquita, M. & Procópio, L. 1999.Flora da Reserva Ducke: Guia de identificação das plantasvasculares de uma floresta de terra-firme na Amazônia cen-tral. National Institute for Amazonian Research (INPA),Manaus, BR.
Richards, P.W. 1952. The tropical rain forest. Cambridge Univer-sity Press, Cambridge, UK.
Richter, D.D. & Babbar, L.I. 1991. Soil diversity in the tropics.Adv. Ecol. Res. 21: 315-389.
Silva, R.P., dos Santos, J., Tribuzy, E.S., Chambers, J.Q.,Nakamura, S. & Higuchi, N. 2002. Diameter increment andgrowth patterns for individual trees growing in central Ama-zon, Brazil. For. Ecol. Manage. 166: 295-301.
Swaine, M.D., Hall, J.B. & Alexander, I. J. 1987. Tree populationdynamics at Kade, Ghana. J. Trop. Ecol. 3: 331-345.
ter Steege, H. & Hammond, D.S. 2001. Character convergence,diversity, and disturbance in tropical rain forest in Guyana.Ecology 82: 3197-3212.
Thomas, S.C. 1996. Asymptotic height as a predictor of growthand allometric characteristics in Malaysian rain forest trees.Am. J. Bot. 83: 556-566.
Turner, I.M. 2001. The ecology of trees in the tropical rain forest.Cambridge University Press, Cambridge, UK.
Welden, C.W., Hewett, S.W., Hubbell, S.P. & Foster, R.B. 1991.Sapling survival, growth, and recruitment: relationship tocanopy height in a neotropical forest. Ecology 72: 35-50.
Wheelwright, N.T. 1985. Fruit size, gap width, and the diets offruit-eating birds. Ecology 66: 808-818.
Williamson, G.B. 1984. Gradients in wood specific gravity oftrees. Bull. Torr. Bot. Club 111: 51-55.
Received 23 August 2004;Accepted 26 October 2005.
Co-ordinating Editor: R.H. Økland.
For App. 1, see JVS/AVS Electronic Archives;www.opuluspress.se/
Related Documents


![SOCIO-DEMOGRAPHIC CORRELATES OF UNIPOLAR MAJOR DEPRESSION … · depression is segregated based on ethnicity, and the prevalence for Malay elderly is 6.5% [5].Additionally, a south](https://static.cupdf.com/doc/110x72/5f0d7b1a7e708231d43a91d6/socio-demographic-correlates-of-unipolar-major-depression-depression-is-segregated.jpg)


