HAL Id: halshs-03215872 https://halshs.archives-ouvertes.fr/halshs-03215872 Preprint submitted on 3 May 2021 HAL is a multi-disciplinary open access archive for the deposit and dissemination of sci- entific research documents, whether they are pub- lished or not. The documents may come from teaching and research institutions in France or abroad, or from public or private research centers. L’archive ouverte pluridisciplinaire HAL, est destinée au dépôt et à la diffusion de documents scientifiques de niveau recherche, publiés ou non, émanant des établissements d’enseignement et de recherche français ou étrangers, des laboratoires publics ou privés. Democratization and the Construction of Class Cleavages in Thailand, the Philippines, Malaysia, and Indonesia, 1992-2019 Amory Gethin, Thanasak Jenmana To cite this version: Amory Gethin, Thanasak Jenmana. Democratization and the Construction of Class Cleavages in Thailand, the Philippines, Malaysia, and Indonesia, 1992-2019. 2021. halshs-03215872

Welcome message from author
This document is posted to help you gain knowledge. Please leave a comment to let me know what you think about it! Share it to your friends and learn new things together.
Transcript

HAL Id: halshs-03215872https://halshs.archives-ouvertes.fr/halshs-03215872
Preprint submitted on 3 May 2021
HAL is a multi-disciplinary open accessarchive for the deposit and dissemination of sci-entific research documents, whether they are pub-lished or not. The documents may come fromteaching and research institutions in France orabroad, or from public or private research centers.
L’archive ouverte pluridisciplinaire HAL, estdestinée au dépôt et à la diffusion de documentsscientifiques de niveau recherche, publiés ou non,émanant des établissements d’enseignement et derecherche français ou étrangers, des laboratoirespublics ou privés.
Democratization and the Construction of ClassCleavages in Thailand, the Philippines, Malaysia, and
Indonesia, 1992-2019Amory Gethin, Thanasak Jenmana
To cite this version:Amory Gethin, Thanasak Jenmana. Democratization and the Construction of Class Cleavages inThailand, the Philippines, Malaysia, and Indonesia, 1992-2019. 2021. �halshs-03215872�

World Inequality Lab – Working Paper N° 2021/09
Democratization and the Construction of Class Cleavages
in Thailand, the Philippines, Malaysia, and Indonesia, 1992-2019
Amory Gethin Thanasak Jenmana
March 2021

1
Democratization and the Construction of Class Cleavages
in Thailand, the Philippines, Malaysia, and Indonesia, 1992-2019
Amory Gethin
Thanasak Jenmana†
Abstract
This paper analyzes how democratization in Southeast Asia has led to the politicization of social
and economic inequalities since the 1990s. Drawing on political attitudes surveys, we document
how historical legacies, the structure of inequality, and institutional dynamics contributed to
differentially structure political cleavages in Indonesia, Malaysia, Thailand, and the
Philippines. Ethnic inequalities in Malaysia and regional inequalities in Thailand played a key
role in fostering the emergence of strong class divides in these two countries. In Indonesia, by
contrast, the rise of new parties mainly used as political vehicles to support their leaders has
eroded pre-existing religious and socioeconomic cleavages. The Philippines’ highly unstable
party system led to a third trajectory, whereby class divides have been strong, but have lacked
the conditions required for their institutionalization and stabilization over time.
We are grateful to Clara Martínez-Toledano, Thomas Piketty, Dirk Tomsa, and Andreas Ufen for their useful
comments.
† Amory Gethin, Thanasak Jenmana: Paris School of Economics – World Inequality Lab.
2
Introduction
What determines the emergence of class cleavages and the political representation of social
inequalities in new democracies? This paper approaches this question by exploiting existing
political attitudes surveys to document the determinants of voting behaviors in four recent
Southeast Asian democracies: Thailand, the Philippines, Malaysia, and Indonesia. In Thailand
and Indonesia, mounting opposition and economic distress in the 1990s put an end to military
rule and led to the organization of freer and fairer elections. In the Philippines, the People Power
Revolution of 1986 triggered the collapse of the Marcos authoritarian regime and the restoration
of democracy. In Malaysia, the gradual consolidation of the opposition starting at the end of the
twentieth century led to the decline of the ruling National Front coalition and eventually to the
victory of the Alliance of Hope in 2018.
The emergence and stabilization of new political forces nonetheless followed very different
trajectories in these four countries. In Thailand, democratization was associated with the rise of
Thaksin Shinawatra’s Thai Rak Thai party, strongly supported by low-income voters and
especially by the poorer northern regions of the country. In Malaysia, where regular elections
have been held since 1959, opposition to the dominant National Front coalition mainly came
from two sides, Islamic parties and secular parties supported by ethnic minorities. The political
systems of Indonesia and the Philippines, in contrast, have displayed growing instability, with
political parties increasingly serving as vehicles providing electoral resources to charismatic
leaders.
These diverging dynamics resulted in significant variations in the link between socioeconomic
status and the vote, and thus in the political representation of inequality. While class cleavages
clearly materialized in Thailand and Malaysia, they have been more variable in the Philippines
and have dwindled in Indonesia. We argue that these differences in class polarization can be
better understood in light of the strength of other cleavages (in particular ethnic, religious, and
regional cleavages) and of the extent to which these cleavages have interacted with
socioeconomic concerns, consistently with what we observe in many other democracies, for
3
instance in Pakistan (Gethin, Mehmood & Piketty 2020), in East Asia (Durrer de la Sota &
Gethin 2021), or in Sub-Saharan Africa (Baleyte, Gethin, Govind & Piketty 2020).
This mechanism appears to be particularly relevant to explain the trajectories of Thailand and
Malaysia. In Thailand, extreme regional inequalities, among the highest observed in the world,
have fostered the emergence of a center-periphery cleavage with an exceptionally pronounced
class dimension, which crystallized political identities and proved to be critical to Thaksin’s
success. In Malaysia, it was persisting ethnic inequalities between the Chinese elites and the
Bumiputra majority that partly aligned ethnic and class conflicts. Regional identities in
Thailand and ethnic identities in Malaysia therefore proved to be powerful catalyzers for the
emergence of what could become class-based party systems in the future, if democratization
was to be achieved and political organizations were to become more institutionalized in these
two countries.
Ethnoregional identities and inequalities in Indonesia and the Philippines, by contrast, have not
encouraged the movement towards class-based party systems. This can partly be explained by
the fact that ethnic and regional inequalities were never as strong and as binary in these two
countries as they were in Malaysia and Thailand. The weakness of these cleavages can also be
traced back to the history of colonial rule and independence movements, which delegitimized
political parties and deliberately downplayed ethnic conflicts. While the lower classes did find
a voice in the electoral arena since democratization, and social class has in practice been a
significant determinant of electoral behaviors, this association has primarily been driven by
specific candidates rather than by political parties. In Indonesia, the rise of opportunistic leaders
has led to a remarkable dealignment of existing political cleavages. In the Philippines’
exceptionally unstable party system, low-income voters have been more supportive of “pro-
poor candidates”, but this has not translated into the formation of stable party-voter linkages.
Furthermore, center-periphery and class divides have represented crosscutting dimensions of
political conflicts, a separation that culminated in Rodrigo Duterte’s success at gathering the
votes of both peripheral regions and the urban middle class. In summary, the diverging
trajectories of Thai, Filipino, Malaysian, and Indonesian political cleavages lie at the

4
intersection of the structure of social inequalities, the legacy of colonial and post-colonial
history, and the making of democratic electoral systems.
Thailand
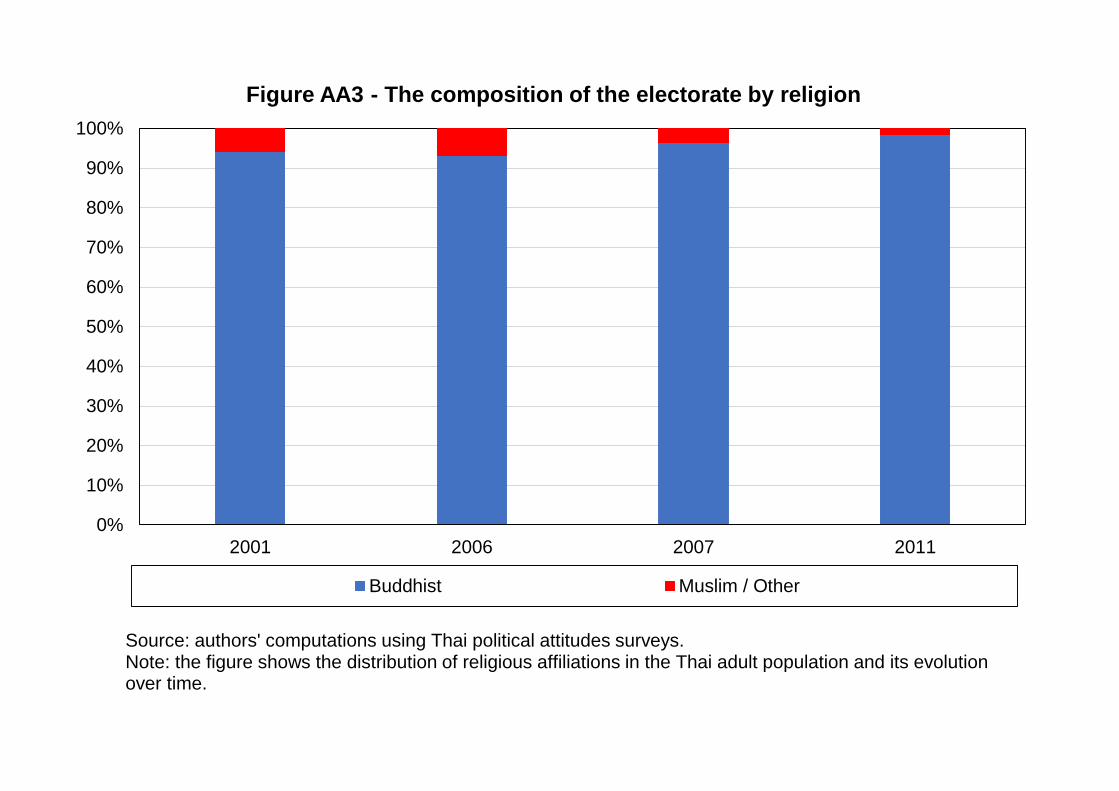
Among Southeast Asian countries, Thailand is unique both in the ethnic and religious
homogeneity of its population – with over 95 percent of the electorate following Theravada
Buddhism and speaking Thai – and in the distinctive regional structure of its inequalities. In
this section, we argue that these two factors played a key role in generating a strong polarization
of the electorate along class lines during the democratization era of the 2000s. These dynamics
were driven by political supply, with the redistributive policies implemented by Thaksin
Shinawatra leading to the mass mobilization of the poor; they trumped other dimensions of
political conflict and had a strong regional component; and they led to a democratic backlash,
with the middle and upper classes uniting to support military-inspired political leadership.
Democratization and Inequality in Thailand
Thailand engaged in a process of democratization at the turn of the twenty-first century. The
military governments of the post-war era supported by the monarchy, with the help of export-
led industrialization, US financial aid, and foreign direct investment, had been highly successful
at continuously fueling economic growth since the 1960s (Satitniramai 2013). However, much
of this prosperity was shared by a small proportion of the population: the majority of the
working population remained employed in agriculture, while much of the fruits of development
accrued to those involved in large enterprises, export industries, and the banking sector
(Jenmana 2018). The 1997 Asian Financial Crisis marked a new era for Thailand. The public
discontent that arose from economic shocks, along with the general dissatisfaction towards
military rule that had grown since the beginning of the 1990s, fueled a growing demand for
political and economic reforms. The 1997 Constitution thus introduced a number of innovations
in the democratic process, strengthening the executive, allowing the upper house to be fully
elected, and improving the separation between executive and legislative bodies.
5
What followed was the era of Thaksin Shinawatra, the leader of the then Thai Rak Thai (TRT)
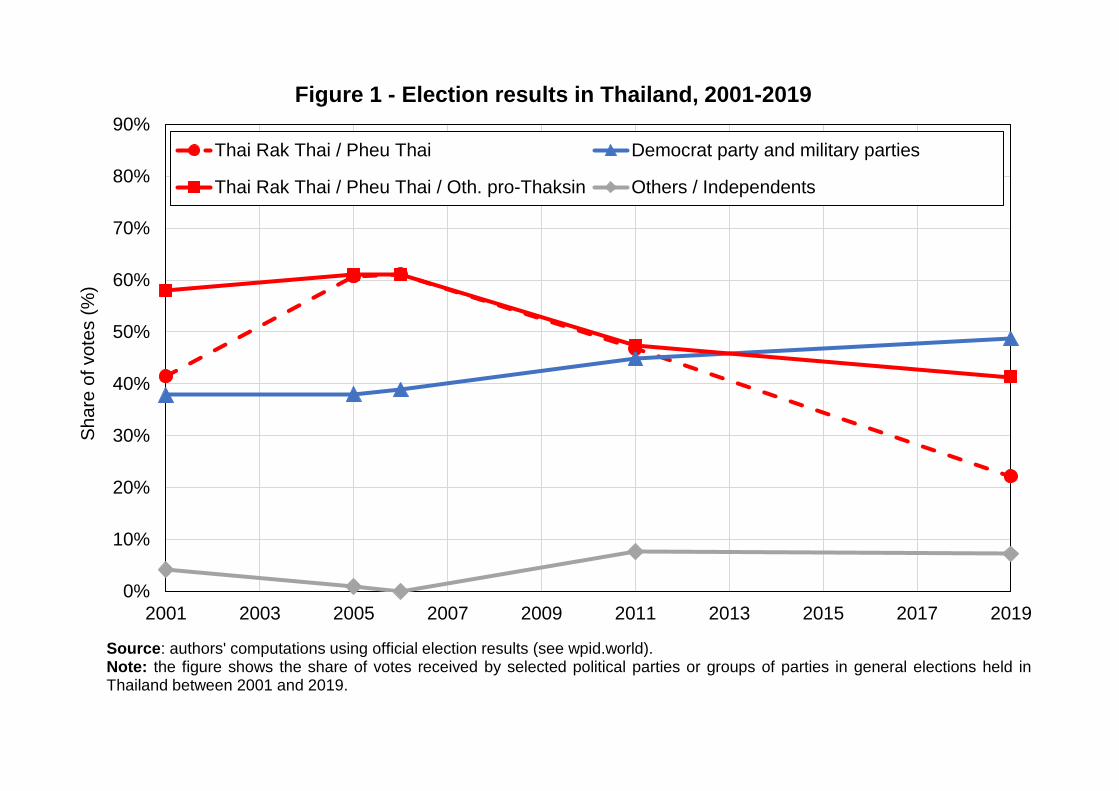
party, who was elected for office in 2001 with more than 40 percent of popular votes (see Figure
12.1). At first, Thaksin mainly presented himself and the party as the ones that would restore
economic growth, but the accumulation of political scandals and the elites’ associated
discontent led the TRT to shift to more redistributive appeals. Amongst many of the policies
implemented during his mandate were the universal healthcare plan, farmers’ debt
rescheduling, affordable social housing, and major village microcredit schemes.
The years that followed were associated with relative political instability. A 2006 coup d’état
sent Thaksin into exile. His sister Yingluck Shinawatra, running for the newly created Pheu
Thai Party (PTP), nonetheless won the 2011 elections with a program promising to pursue his
policies, notably increasing substantially the minimum wage. On 22 May 2014, however, Royal
Army General Prayut Chan-o-cha launched another coup d’état, the twelfth in Thailand’s
contemporary history (Baker & Phongpaichit 2014). The new 2017 Constitution drafted under
the junta finally gave the military decisive advantages, including the appointment of the Senate
and the possibility for the Prime Minister to be elected by the bicameral legislature without
being one of its members. This allowed Prayut to become Prime Minister in 2019, following
elections widely perceived as unfree and unfair.1
Social Inequalities in Thailand and the Strength of Regional Divides
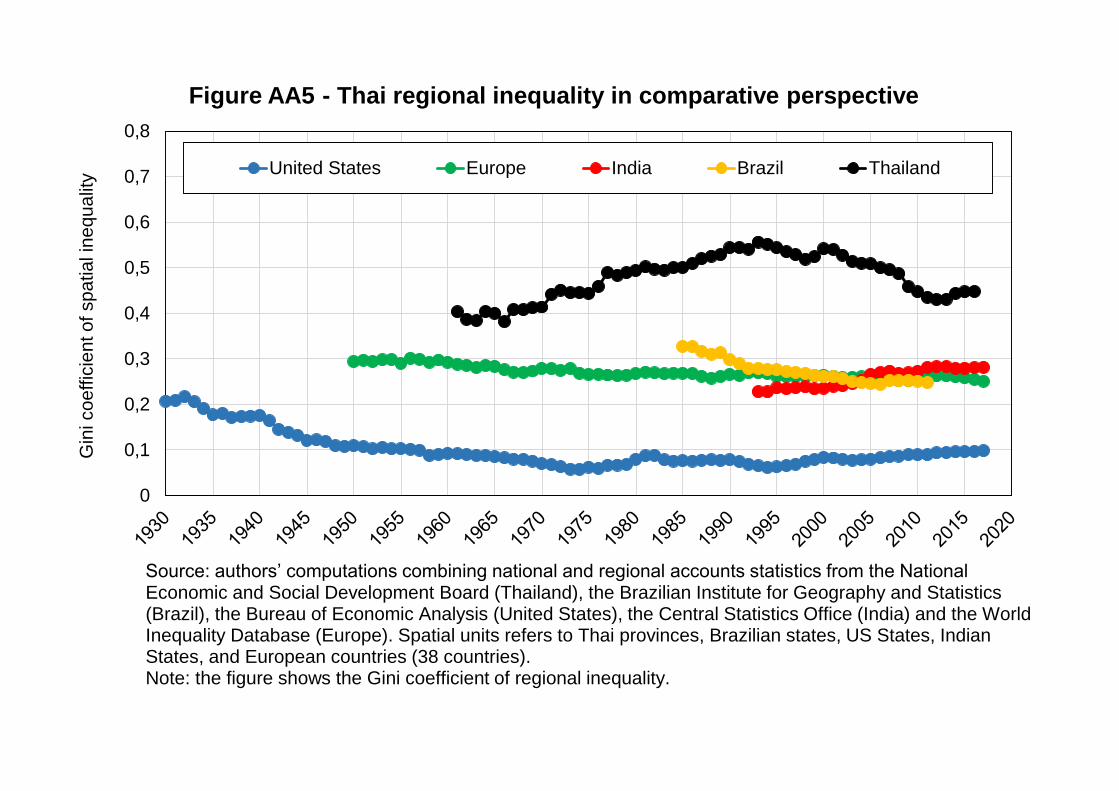
Thailand’s inequalities are not particularly well-known, yet they appear to be among the highest
in the world and the highest among Southeast Asian countries (Jenmana 2018). The specificity
of Thailand’s inequalities lies in the extreme concentration of regional economic resources:
since the 1960s, Thailand’s richest provinces have always earned over 6 times the average
1 Given the lack of data on these elections, the following analysis is limited to the evolution of electoral behaviors
between 2001 and 2011.
6
income of the poorest provinces, while corresponding figures do not exceed 4 in Brazil, India,
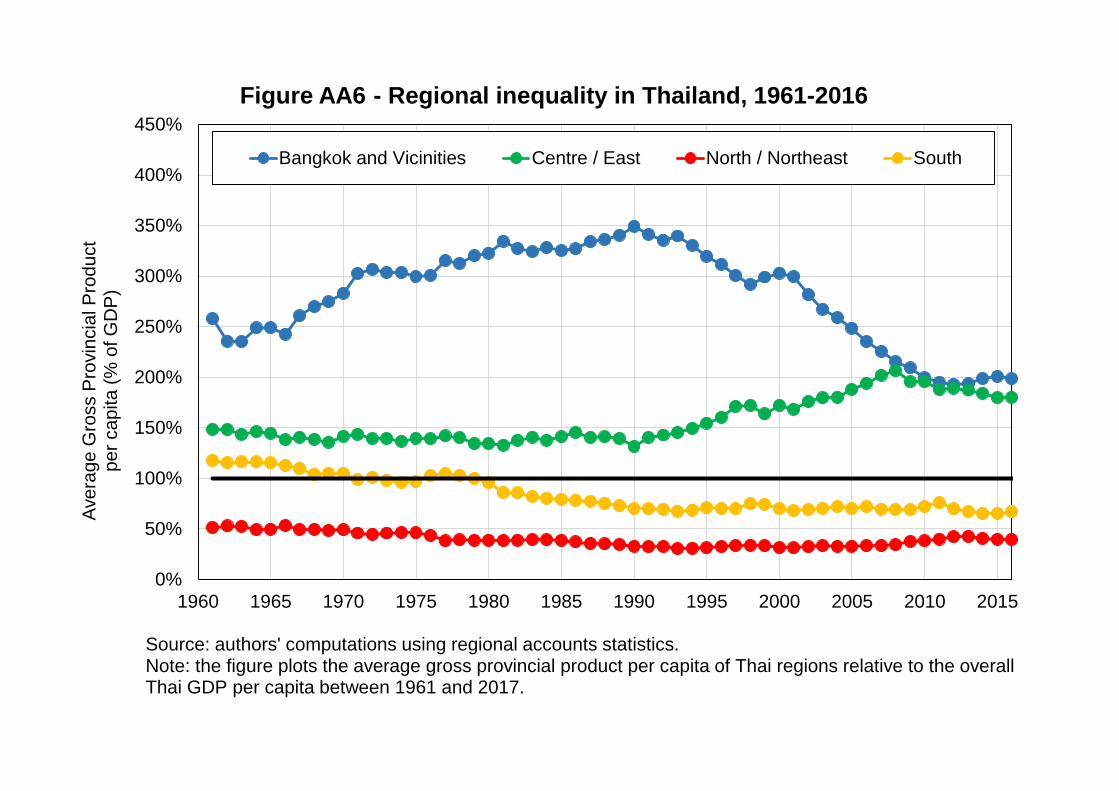
and Europe.2 This inequality is tightly linked to the division between the center and the
periphery, which has been at the heart of the Thai developmental state since the end of World
War II, as the policies implemented by successive military regimes disproportionately benefited
Bangkok (Ouyyanont 2018).
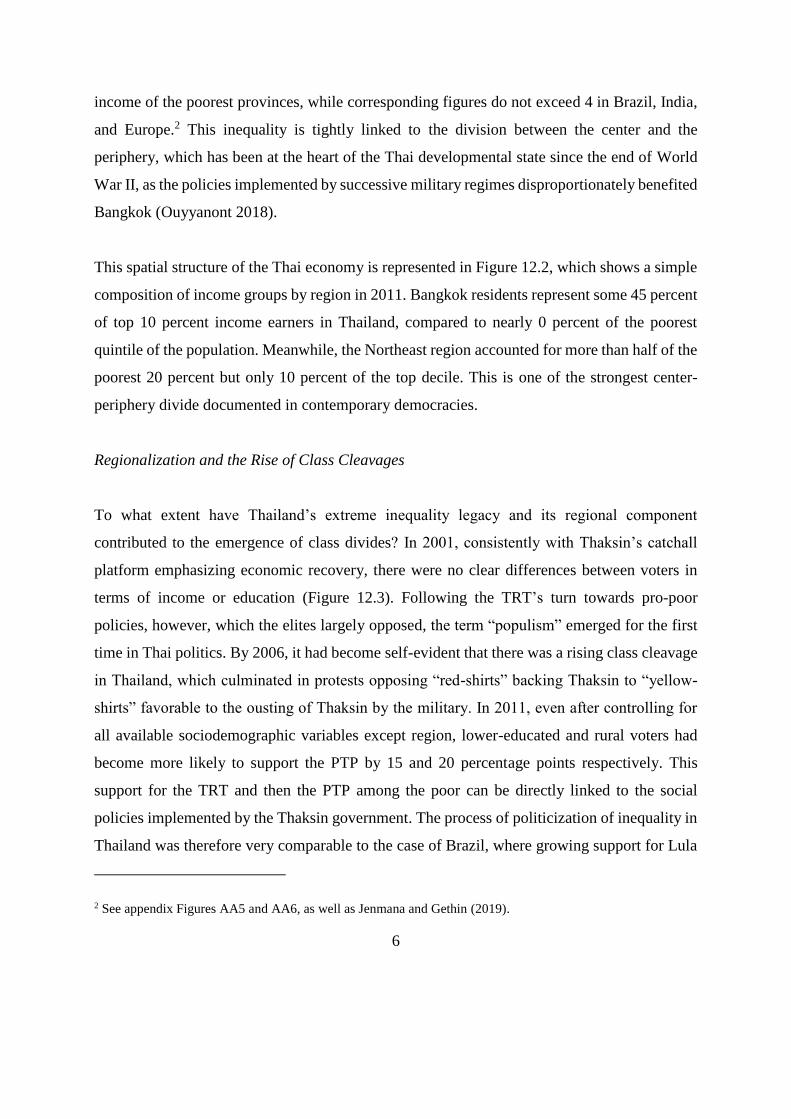
This spatial structure of the Thai economy is represented in Figure 12.2, which shows a simple
composition of income groups by region in 2011. Bangkok residents represent some 45 percent
of top 10 percent income earners in Thailand, compared to nearly 0 percent of the poorest
quintile of the population. Meanwhile, the Northeast region accounted for more than half of the
poorest 20 percent but only 10 percent of the top decile. This is one of the strongest center-
periphery divide documented in contemporary democracies.
Regionalization and the Rise of Class Cleavages
To what extent have Thailand’s extreme inequality legacy and its regional component
contributed to the emergence of class divides? In 2001, consistently with Thaksin’s catchall
platform emphasizing economic recovery, there were no clear differences between voters in
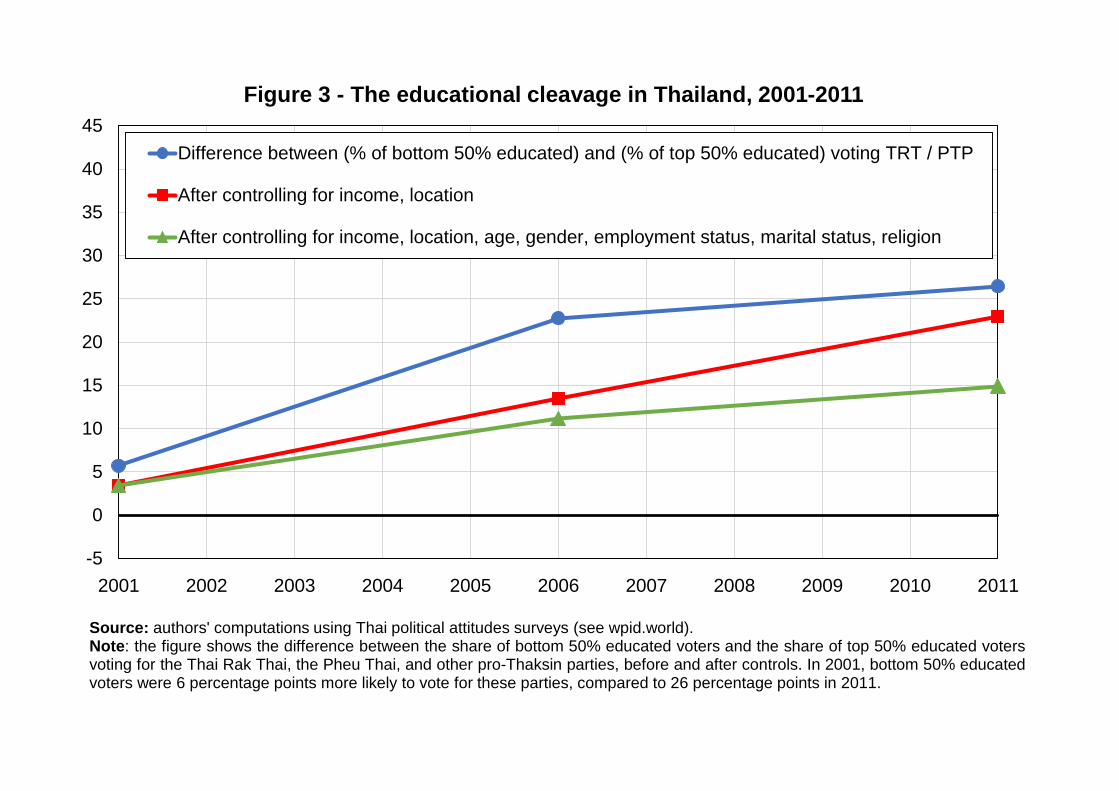
terms of income or education (Figure 12.3). Following the TRT’s turn towards pro-poor
policies, however, which the elites largely opposed, the term “populism” emerged for the first
time in Thai politics. By 2006, it had become self-evident that there was a rising class cleavage
in Thailand, which culminated in protests opposing “red-shirts” backing Thaksin to “yellow-
shirts” favorable to the ousting of Thaksin by the military. In 2011, even after controlling for
all available sociodemographic variables except region, lower-educated and rural voters had
become more likely to support the PTP by 15 and 20 percentage points respectively. This
support for the TRT and then the PTP among the poor can be directly linked to the social
policies implemented by the Thaksin government. The process of politicization of inequality in
Thailand was therefore very comparable to the case of Brazil, where growing support for Lula
2 See appendix Figures AA5 and AA6, as well as Jenmana and Gethin (2019).

7
da Silva’s Workers’ Party among low-income citizens was triggered by the implementation of
redistributive policies during Lula’s first mandate (Gethin & Morgan 2021).
The difference between Thailand and Brazil, however, is that in Thailand regional and rural-
urban inequalities explain almost entirely these divides. In 2011, lower-educated and low-
income voters were indeed much more likely to support the PTP than other voters, but this gap
drops substantially and becomes statistically non-significant after controlling for region of
residence.3 The rise of class cleavages in Thailand thus appears to have been driven by
exceptional regional divides, which provided a solid foundation for the mobilization of the
masses. This mobilization allowed Thaksin and Yingluck Shinawatra to achieve important
electoral victories, as policies such as the minimum wage or interventions on agricultural prices
played a key role in increasing the incomes of the populated poorer regions, which turned out
to benefit the lower classes as a whole, in a country where center-periphery inequalities are
amongst the highest in the world.
The Philippines
In comparison to Indonesia, Malaysia, and Thailand, the Philippines’ party system has been
exceptionally chaotic since the country’s transition to democracy in 1986. In this section, we
study how the interactions between ethnicity, class, and regional structures have shaped the
political representation of social inequalities in the new democracy. Three main findings
emerge from our analysis. First, we document that ethnic and regional specificities are only
moderately linked to inequality, more than in Indonesia, but less than in Thailand, with Luzon
and in particular the National Capital Region being overrepresented in top-income groups.
Secondly, we show that while regional inequalities have contributed to consolidating class
cleavages in Thailand, this is not the case in the Philippines, where educational and regional
divides have represented crosscutting dimensions of political conflict. Thirdly, we show that
the 2016 presidential election led for the first time to the complete separation of these two
3 See appendix Figure A5.

8
dimensions: support for Rodrigo Duterte in the 2016 presidential election was unique in
bringing together both urban middle-class voters and poorer peripheral regions.
Elections and Political Parties in the Philippines since 1986
In no other country of Southeast Asia has democracy been experienced for such a long time as
the Philippines, yet Filipino party systems never translated social cleavages into the political
representation of interest groups. Instead, Filipino parties have always been opportunistic
organizations building support through patron-client relationships, with the objective of
securing the benefits of office and getting access to state resources (Teehankee 2013). This
persisting feature of Filipino politics has its roots in the process of state-building that occurred
during the twentieth century. As the US colonial administration gradually introduced elections
at the beginning of the twentieth century, parties came to articulate the interests of local clans,
or principalia, rather than to develop cleavages along social lines. While the rise of left-wing
movements such as the peasant organization Hukbalahap (HUK) could have enabled the
mobilization of counter-elites, these were altogether excluded from the democratic arena
through harsh repression (Nadeau 2008). During the Third Republic (1946-1965), electoral
competition hence pitted the Nacionalista Party against the Liberal Party, two virtually identical
entities in terms of policy proposals and ideological affiliations.
After over twenty years of military rule under Ferdinand Marcos (1965-1986), the “People
Power Revolution” of 1986 enabled the return of democracy, but the clientelistic nature of
Filipino parties was left untouched. The lack of stable party loyalties among legislators, the
presidential form of government, and the one-round first-past-the-post system adopted for
presidential elections have since then been powerful incentives pushing individuals to
constantly launch new parties and run for the presidency (Kasuya 2009).
Five presidential elections have been held in the Philippines since the People Power Revolution
of 1986. In 1992, General Fidel Ramos was elected with less than 24 percent of votes against
six other candidates. The 1992 election showed little variations in the determinants of support
9
for candidates across social classes, and only regional and ethnolinguistic affiliations were
significantly associated with candidate choices (Landé 1996). This changed in 1998, however,
when movie star Joseph Estrada won the presidency with nearly 40 percent of popular votes, a
large share of which came from the lower classes. The 1998 election marked a rupture in that
Estrada had not used existing patronage networks as his first resource, but had rather directly
appealed to the poor through a “dialectic of recognition and appropriation”, promising to help
the common people against the elites with his slogan “Erap [Estrada’s nickname] for the poor”
(Hedman 2001). However, while Thaksin Shinawatra’s pro-poor campaign had been followed
by concrete redistributive policies in Thailand, this was not the case of Estrada, who in fact
largely continued the liberal economic agenda that his predecessors had initiated before him
(Thompson 2013).
What followed was a period of political polarization, which culminated in the “Second EDSA
Revolution”, a mass mobilization of mostly reformist elites amidst corruption scandals, and in
Estrada’s resignation, replaced by Gloria Macapagal-Arroyo in 2001. In the 2004 elections,
Estrada’s close associate Fernando Poe ran for the presidency against Arroyo, but was defeated.
Estrada ran again for president in 2010 and lost against the Liberal Party candidate Benigno
Aquino.
The 2016 presidential election marked again another turning point in Filipino politics. Rodrigo
Duterte, former mayor of Davao City in the island of Mindanao, was elected president with 39
percent of votes. His platform focused on the “war on drugs” and on his explicit support for the
extrajudicial killings of drug users and criminals. This was key to his success among the “angry
new middle class”, who were afraid that growing insecurity would wipe out the benefits they
had gained from recent economic growth (Thompson & Teehankee 2016; Teehankee &
Thompson 2016). Four other candidates ran for the presidency: Mar Roxas and Miriam
Defensor Santiago represented the continuity of the reformist Aquino government, while Grace
Poe (the adopted daughter of Fernando Poe) and Jejomar Binay campaigned with pro-poor
appeals comparable to that held by Estrada and Fernando Poe between 1998 and 2010
(Teehankee & Thompson 2016b).
10
Figure 12.5 gives a sense of these transformations by distinguishing three groups of candidates.
The first group gathers candidates from traditional “reformist” or “liberal” elites running under
the banners of the Lakas-CMD, the Liberal Party, or the Aksyon Party. The second group
includes “pro-poor” candidates: Joseph Estrada in 1998 and 2010, Fernando Poe in 2004, and
Grace Poe and Jejomar Binay in 2016. We finally treat Rodrigo Duterte separately as a third
group. Again, let us stress that these classifications are highly artificial. However, they do
represent distinguishable “perceptions” or “appeals” which, as we will now show, have indeed
led to sharp electoral divides.
Regional Inequalities in the Philippines
The Philippines can be divided into three regions: the northern island of Luzon (about 60
percent of the electorate, of which 14 percent in the capital Manila), the southern island of
Mindanao (about 20 percent), and the Visayas islands in between Luzon and Mindanao (about
20 percent). More than 170 ethnolinguistic groups, the biggest being the Visayas (about 25
percent) and the Tagalog (about 25 percent), populate these islands.4 Despite this diversity,
ethnic antagonism has been relatively rare in the history of the Philippines (Arugay & Slater
2018). The exception is Mindanao, where migration from Luzon after World War II led to
repeated conflicts in Muslim areas opposing the armed forces to separatist movements.
Regional inequalities in the Philippines are significant, though not as large as in Thailand: the
National Capital Region has concentrated a greater share of higher-income citizens compared
to Mindanao and Visayas.5 Regional specificities and inequalities thus pave the way to the
emergence of a center-periphery cleavage, but which does not have a class dimension as strong
as in Thailand and could therefore represent a separate political cleavage.
4 See appendix Table BA2.
5 See appendix Figures BA9 and BA10.
11
The Persistence of Class Polarization
As we discussed above, Filipino politics since 1998 have seen the emergence of “pro-poor”
presidential candidates emphasizing their proximity with the masses, albeit in a more rhetorical
rather than programmatic way. Figure 12.6 shows that grouping Joseph Estrada, Fernando Poe,
Grace Poe, and Jejomar Binay together reveals the persistence of remarkably strong cleavages:
university graduates have been less likely to vote for pro-poor candidates by between 10 and
22 percentage points. This gap only marginally decreases after controls.
Such divisions are large in comparative perspective, and as large as what we observed in
Thailand. Class cleavages therefore do not seem to have been a purely temporary feature of
Filipino politics. The main difference between the Philippines and Thailand, however, is that
this dimension has manifested itself in “moral” appeals rather than in competing economic
programs or grassroots organizations (Thompson 2013).
Have class cleavages been reinforced by, or coupled with, center-periphery cleavages? Figure
12.7 shows that support for pro-poor candidates has generally been lower in Visayas than in
Mindanao and Luzon, so that they have attracted voters from both the poorer periphery
(Mindanao) and the center (the National Capital Region). The 2016 elections, however,
signaled a change in this pattern: Grace Poe and Jejomar Binay made better scores in Luzon
than in Visayas and Mindanao. This, as we will show below, is due to Rodrigo Duterte’s success
at capturing votes in the periphery. Regional differences therefore seem to have represented a
clearly independent dimension of electoral behaviors in the Philippines, unlike in Thailand.
The Structure of Political Cleavages in the 2016 Presidential Election
Table 12.1 provides a detailed description of the structure of the vote for each candidate in the
2016 presidential election. Two key results are visible. First, while class polarization appeared
to be lower than in 2004, it was still significant in the case of Grace Poe and Jejomar Binay,

12
who made better scores among lower-educated voters. Secondly, center-periphery divides were
more clearly materialized in the 2016 election than before, but went in a direction opposite to
that of class cleavages. Poe and Binay were the candidates of the poor, but they were also the
candidates of the center. Duterte was on the contrary the candidate of the urban middle class,
but also of the periphery and of the Muslim minority, with over 60 percent of voters from
Mindanao supporting him.
These two facts largely explain why Duterte’s voting base was so socially diverse. On the one
hand, the candidate’s radical proposal of a “war on drugs” was successful among the new,
younger educated middle class who valued his emphasis on law and order. On the other hand,
Duterte’s stronghold in Mindanao enabled him to gain votes from poorer regions, a support that
he reinforced with his proposal of moving towards a federal form of government (Teehankee
2018).
Malaysia
Post-colonial Malaysia, inheriting a large and ethnically diverse territory, established itself as a
federal constitutional monarchy in 1963. A one-party dominant system soon emerged, as the
National Front coalition (Barisan Nasional, BN) succeeded in amalgamating the interests of
the majority of Malay, Chinese, and Indian elites. The Asian Financial Crisis in 1997 shook the
foundations of this regime and initiated a period of consolidation of the opposition, which
culminated in the victory of the Alliance of Hope and in the first handover in the country’s
history in 2018. In this section, we show that the decline of the BN has been associated with
growing ethnic and class cleavages, as not only Chinese voters but also top-income and highest-
educated voters from other ethnic groups have gradually shifted towards the opposition.
Democratization and the Erosion of the One-Party Dominant System
After over a century of British rule, Malaysia became an independent nation in 1957. The new
country brought together heterogeneous populations. The Bumiputras, divided into Muslim
13
Malays and indigenous peoples, represented and still represent the majority of the population
(about 70 percent in 2020) (Department of Statistics Malaysia 2020). They coexisted with
significant Chinese and Indian minorities (about 23 and 7 percent in 2020 respectively), most
of which descended from workers brought by the colonial power throughout the nineteenth
century. Unlike other major independence movements such as in Senegal, Botswana or India,
Malaysia’s political movements soon took a strong ethnic dimension. While the Young Malays
Union, founded in 1938 in Kuala Lumpur, advocated for the union of British Malaya and the
Dutch East Indies regardless of ethnic origin, it never managed to reach mass support. Similarly,
the Malayan Communist Party called for an independent state with equality for all the races,
but it remained a primarily Chinese organization until it was eventually crushed by the British
during the Malayan Emergency (1948-1960).
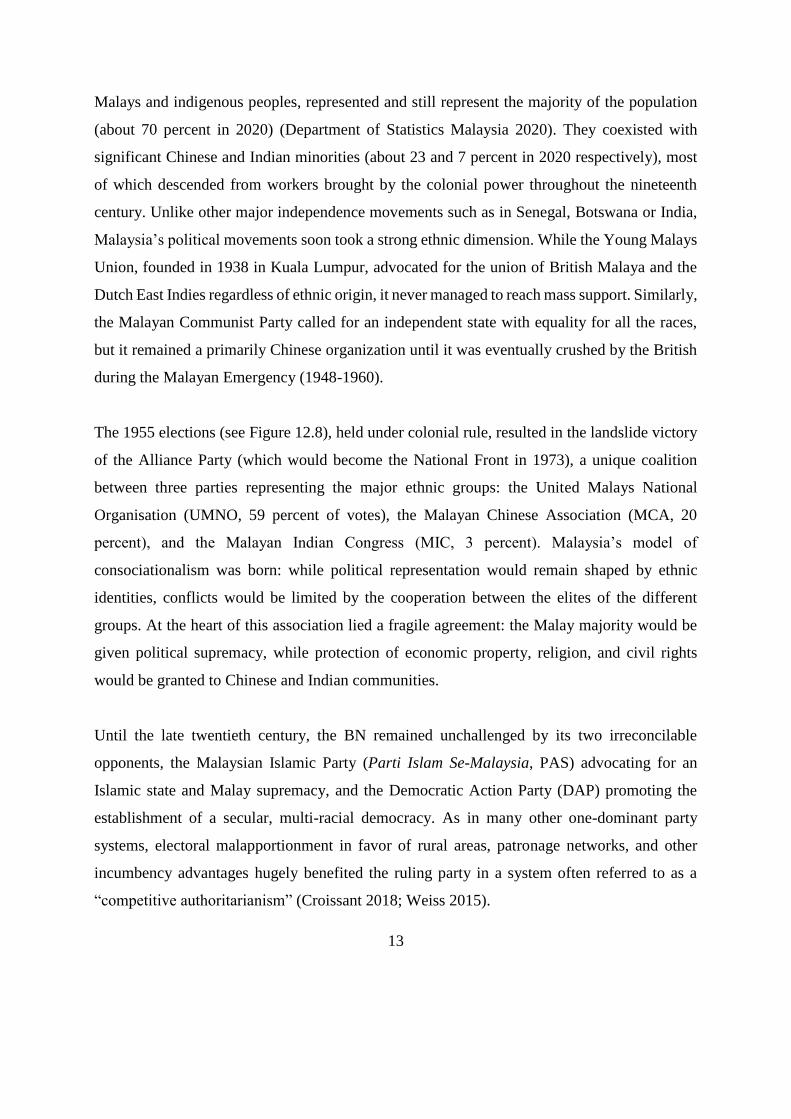
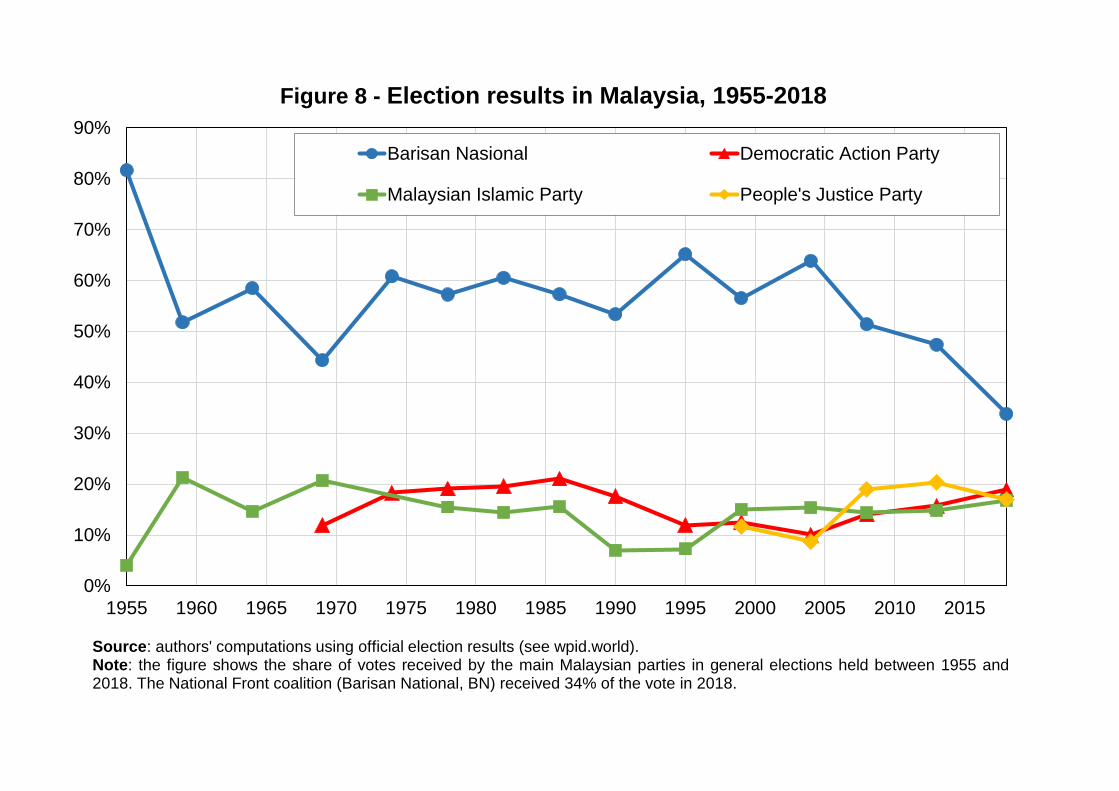
The 1955 elections (see Figure 12.8), held under colonial rule, resulted in the landslide victory
of the Alliance Party (which would become the National Front in 1973), a unique coalition
between three parties representing the major ethnic groups: the United Malays National
Organisation (UMNO, 59 percent of votes), the Malayan Chinese Association (MCA, 20
percent), and the Malayan Indian Congress (MIC, 3 percent). Malaysia’s model of
consociationalism was born: while political representation would remain shaped by ethnic
identities, conflicts would be limited by the cooperation between the elites of the different
groups. At the heart of this association lied a fragile agreement: the Malay majority would be
given political supremacy, while protection of economic property, religion, and civil rights
would be granted to Chinese and Indian communities.
Until the late twentieth century, the BN remained unchallenged by its two irreconcilable
opponents, the Malaysian Islamic Party (Parti Islam Se-Malaysia, PAS) advocating for an
Islamic state and Malay supremacy, and the Democratic Action Party (DAP) promoting the
establishment of a secular, multi-racial democracy. As in many other one-dominant party
systems, electoral malapportionment in favor of rural areas, patronage networks, and other
incumbency advantages hugely benefited the ruling party in a system often referred to as a
“competitive authoritarianism” (Croissant 2018; Weiss 2015).

14
The Asian Financial Crisis yet triggered the rise of opposition movements in a context of
internal struggles within UMNO (Freedman 2006). As divisions between Prime Minister
Mahathir bin Mohamad and Deputy Prime Minister Anwar Ibrahim grew over economic policy
in 1998, in particular, Anwar was fired, expelled from UMNO, and arrested on charges of
corruption and sodomy perceived by many as illegitimate. This triggered the emergence of the
reformasi movement calling for democratic reforms, and to the formation of the National
Justice Party in 1999, which became the People’s Justice Party (Parti Keadilan Rakyat, PKR)
in 2003 and gathered over 20 percent of popular votes at its peak in 2013. After several alliances
failed to coalesce sufficient support to defeat the incumbent, the 2018 elections finally enabled
the first handover in the country’s history: the progressive and reformist Alliance of Hope
(Pakatan Harapan, PH), bringing together the PKR, the DAP, and two other small parties,
received 46 percent of popular votes against 34 percent for the BN. This victory was possible
thanks to the consolidation of a more coherent and comprehensive coalition emphasizing
political reforms, anti-corruption measures, and enhanced liberties, as well as unprecedented
mobilization through online social media (Ufen 2020).
Ethnic Inequalities in Malaysia
At the time of independence, colonial legacy had left high inequalities with an important ethnic
component: the Bumiputera majority were substantially poorer than the Chinese, who held the
lion’s share of wealth thanks to their overrepresentation in the industry and in the banking and
insurance sectors (Ravallion 2019). Malaysia’s socioeconomic structure was therefore very
comparable to that of Taiwan and South Africa at the same period, two other countries where
ethnic minorities have historically dominated the control of economic resources (Durrer de la
Sota & Gethin 2021; Gethin 2020). As ethnic riots broke in 1969 in Kuala Lumpur, the
government was prompted to put these inequalities at the center of its policy agenda. This led
to the implementation of the New Economic Policy (NEP) in 1971 and to the multiplication of
positive discrimination policies in the decades that followed, which enabled the Bumiputera to

15
be favored in many dimensions such as access to education, public sector employment, housing,
and corporate share ownership.
In part as the result of these measures, ethnic inequalities have declined, even though they have
remained significant until today. In 2014, the Chinese represented 16 percent of the poorest half
of the population but 60 percent of the top 1 percent (Khalid & Yang 2019). Ethnic income
gaps in Malaysia therefore appear to be lower than in South Africa, but higher than in Taiwan,
where the mainlander-native income gap has today almost completely disappeared.
Ethnic Divides and Cross-Ethnic Class Cleavages
How has the push for democratization, the subsequent decline of the BN, and the dynamics of
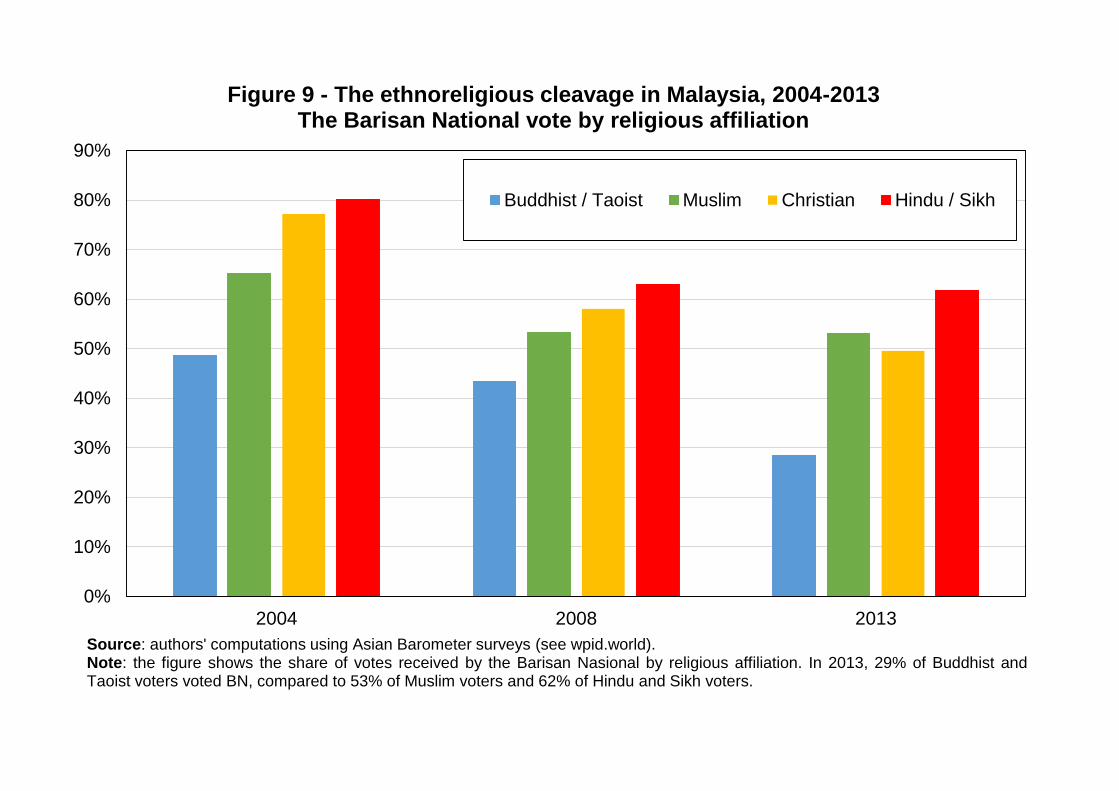
inequality affected political cleavages in Malaysia? As shown in Figure 12.9, ethnic divides
have risen in the past two decades: while variables on ethnic identities are unfortunately not
available in the surveys used in this paper, Buddhists and Taoists (most of which are Chinese)
have become much less supportive of the BN than Muslims (most of which are Bumiputera).
This is a well-known fact, which led BN politicians and state-controlled media to speak of an
electoral “Chinese Tsunami” and to accuse the Chinese of being ungrateful after the publication
of election results in 2013 (Ufen 2020). Survey data on the most recent election was not
available at the time of writing, but this dynamic seems to have continued in 2018: according
to existing polls, an estimated 95 percent of Chinese voted for the PH, compared to about two-
thirds of Indians and a third of Malays (The New Paper 2018).
The erosion of Malaysia’s one-party system, or rather of its “one-coalition system”, has
therefore led to the rise of ethnic voting. However, support for the BN has declined among all
ethnic groups, not only among the Chinese minority, and the BN remains a multi-ethnic
coalition. Strikingly, socioeconomic differentiation within ethnic groups appeared to be a major
and rising factor distinguishing the BN from the opposition: in 2013, top-income voters were
more likely to vote against the BN by 17 percentage points, a gap that remains significant after
controlling for religion and other factors (Figure 12.10). This suggests that class has become
16
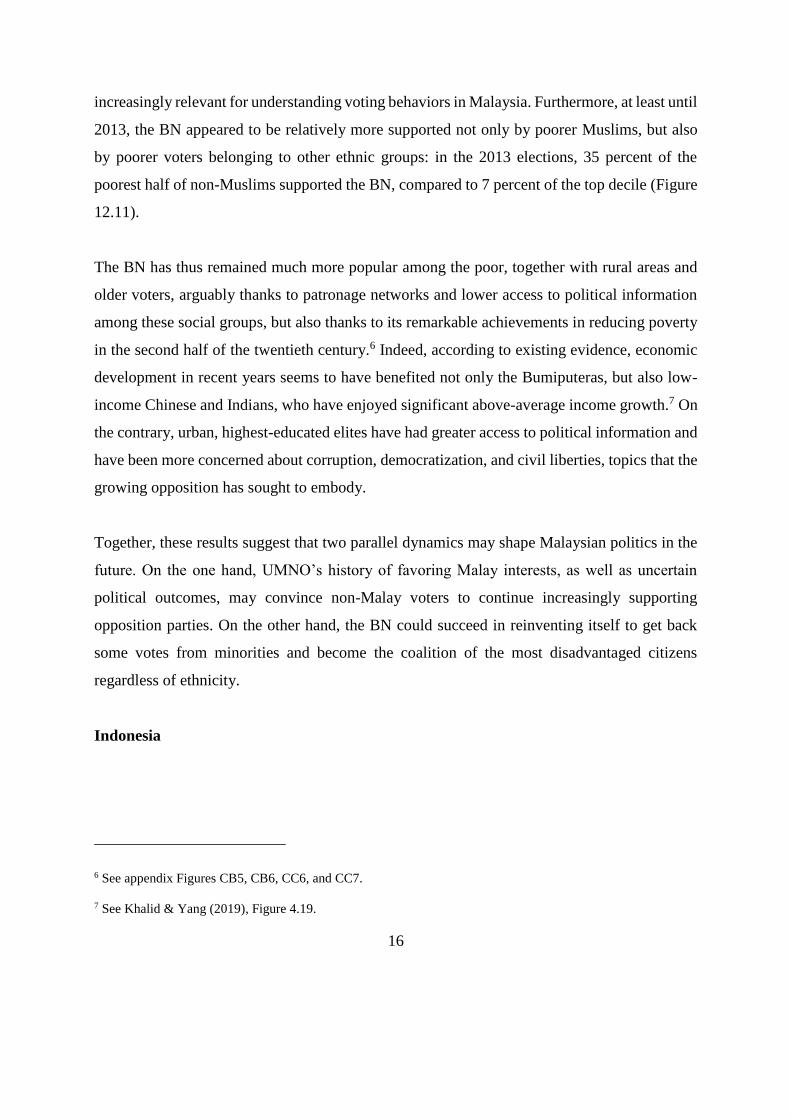
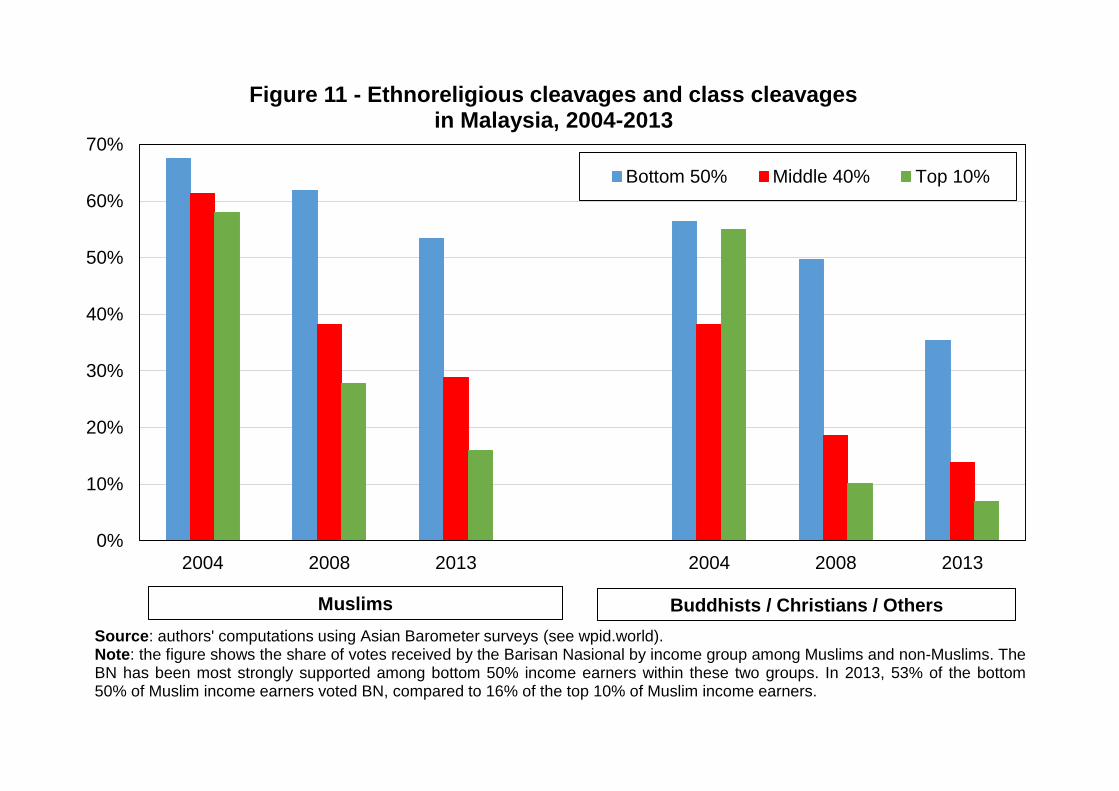
increasingly relevant for understanding voting behaviors in Malaysia. Furthermore, at least until
2013, the BN appeared to be relatively more supported not only by poorer Muslims, but also
by poorer voters belonging to other ethnic groups: in the 2013 elections, 35 percent of the
poorest half of non-Muslims supported the BN, compared to 7 percent of the top decile (Figure
12.11).
The BN has thus remained much more popular among the poor, together with rural areas and
older voters, arguably thanks to patronage networks and lower access to political information
among these social groups, but also thanks to its remarkable achievements in reducing poverty
in the second half of the twentieth century.6 Indeed, according to existing evidence, economic
development in recent years seems to have benefited not only the Bumiputeras, but also low-
income Chinese and Indians, who have enjoyed significant above-average income growth.7 On
the contrary, urban, highest-educated elites have had greater access to political information and
have been more concerned about corruption, democratization, and civil liberties, topics that the
growing opposition has sought to embody.
Together, these results suggest that two parallel dynamics may shape Malaysian politics in the
future. On the one hand, UMNO’s history of favoring Malay interests, as well as uncertain
political outcomes, may convince non-Malay voters to continue increasingly supporting
opposition parties. On the other hand, the BN could succeed in reinventing itself to get back
some votes from minorities and become the coalition of the most disadvantaged citizens
regardless of ethnicity.
Indonesia
6 See appendix Figures CB5, CB6, CC6, and CC7.
7 See Khalid & Yang (2019), Figure 4.19.

17
After three decades of authoritarian rule, Indonesia held in 1999 its first free election since
1955. In this section, we show that political cleavages in the world’s largest Muslim-majority
country have followed a very different trajectory from that of Thailand, the Philippines, and
Malaysia: instead of undergoing a process of polarization, Indonesia’s party system seems on
the contrary to have been characterized by increasing dealignment. As a result, while religion,
income, and other factors do continue to play a role, the rise of catchall parties has weakened
the political representation of social inequalities in the new democracy.
The Making of Indonesian Democracy
After four years of resistance against the Dutch, who had sought to get back their colony from
the Japanese at the end of World War II, Indonesia was recognized as an independent nation by
the Netherlands in 1949. At that time, unlike in Malaysia, the political movements that had
flourished in the archipelago since the beginning of the twentieth century were not communal.
The key point of tension was, instead, between Islam and Marxism. On the one hand were the
Masyumi Party and the Nahdlatul Ulama, which respectively represented modernist and
traditionalist Islamic movements. On the other hand was the Indonesian Communist Party
(Partai Komunis Indonesia, PKI) promoting a strongly secular vision of the new nation. In
between, the Indonesian National Party (Partai Nasional Indonesia, PNI), associated to
founding father Sukarno, emphasized secular-nationalism and state centralism. Each of these
parties received between 16 and 22 percent of votes in the legislative elections of 1955 (Brown
2003).
As tensions and political instability grew, Indonesian democracy soon deteriorated, until
President Sukarno proclaimed the transition to a “Guided Democracy” in 1957, in which the
key poles of the nation – the military, communists, and some Muslim movements – would be
allowed to participate in a cooperative government. A coup attempt, followed by a counter-
coup organized by General Suharto, nonetheless led to the dissolution of the regime in 1965-
1966. The PKI was blamed for having organized the coup, and the massive anti-communist
purge that followed left between 500,000 and 1 million dead, effectively annihilating the left-

18
wing pole of Indonesian politics. These series of events, together with Sukarno and Suharto’s
general delegitimization of political parties depicted as divisive and corrupted, had long-lasting
effects on Indonesian democracy and on the personalization of political power (Tan 2014).
Under Suharto’s New Order (1965-1998), Islamic movements were forced to unite in the United
Development Party (Partai Persatuan Pembangunan, PPP), while nationalist and Christian
parties were compelled to gather in the Indonesian Democratic Party (Partai Demokrasi
Indonesia, PDI). Meanwhile, the Party of Functional Groups (Partai Golongan Karya, Golkar)
was set up as the government’s electoral vehicle, and gathered a majority of votes in elections
mainly used to back the authoritarian regime. While divisions were downplayed and efforts
made to depoliticize the population, opposition to the regime was stronger in Java and urban
areas. Golkar, on the contrary, was most supported in the peripheral regions of the country and
in rural areas, a cleavage that would perpetuate to the present day (Ufen 2013).
After decades of exceptional economic development, the Asian Financial Crisis put a sudden
end to the regime, and Suharto stepped down in 1998. The post-Suharto era came with the
reestablishment of democracy and the organization of legislative elections in 1999. Strikingly,
with the exception of the communist element, the emerging party system seemed to reproduce
many of the cleavages that had characterized the 1955 election (King 2003). The secular-
nationalist and pro-poor Indonesian Democratic Party – Struggle (Partai Demokrasi Indonesia
Perjuangan, PDI-P), led by Sukarno’s daughter Megawati Sukarnoputri, arrived first with 34
percent of votes, followed by Golkar with 22 percent (Figure 12.12). A variety of Islam-based
parties came next, together gathering about a third of popular votes, the most important being
the traditionalist National Awakening Party (Partai Kebangkitan Bangsa, PKB), the PPP, and
the modernist National Mandate Party (Partai Amanat Nasional, PAN).
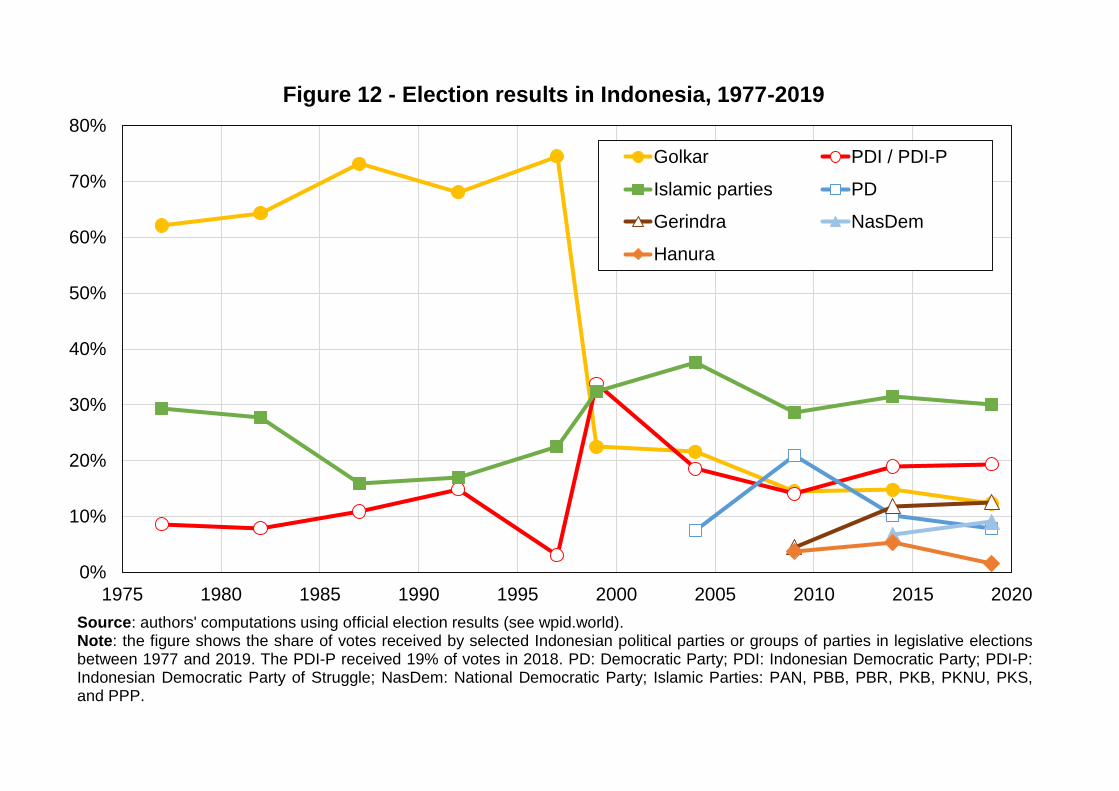
This party system was soon to be upset by growing personalization and instability. In 2001, the
catchall Democratic Party (Partai Demokrat, PD) was formed to support former general Susilo
Bambang Yudhoyono. Yudhoyono won the 2004 and 2009 presidential elections, and the PD
arrived first in the 2009 legislative elections with 21 percent of votes, but its success was short-

19
lived, and only 8 percent of voters supported the PD in the 2019 legislative elections. Similarly,
the Great Indonesia Movement Party (Partai Gerakan Indonesia Raya, Gerindra) has mainly
served as the political platform of former general Prabowo Subianto, who lost against PDI-P
candidate Joko Widodo in the 2014 and 2019 presidential races. Other new parties have also
included the Nasdem Party and Hanura, both splits from Golkar. As shown in Figure 12.12, the
scores achieved by the PDI-P and especially by Golkar, Indonesia’s most institutionalized party
(Tomsa 2008), have never reached back their 1999 peak as these new political forces emerged.
The Indonesian party system has therefore been characterized by extraordinary fragmentation
in recent years, with no party securing more than 20 percent of votes in 2014 and 2019. Rather
than reflecting a complexification of social divides, this process seems to have been driven by
opportunistic actors and “presidentialized parties” often avoiding ideology and aiming to
transcend cleavages (Ufen 2008). While historical divides materialized in the 1955 election do
still seem to play a role, manifested by the persistence of traditional parties, they have become
increasingly blurred.
Political Cleavages and Socioeconomic Divides
To what extent has the Indonesian party system represented socioeconomic inequalities since
democratization? In comparison to Malaysia, the major pre-independence political movements
were not restricted to specific ethnic groups in Indonesia, and ethnic inequalities and ethnic
conflicts have remained limited in comparative perspective (Aspinall 2011). Ethnicity has
accordingly never been a strong determinant of the vote: the PDI-P has been more popular in
Java and Golkar in peripheral regions, but all parties have relied on large cross-ethnic and cross-
regional coalitions since 1999.8 This lack of cleavage has been reinforced by the electoral
system, as only parties with sufficient national scope have been allowed to participate in
8 See appendix Figures DB11, DC11, and DH11, and Mujani, Liddle & Ambardi (2018), chapter 4. The exception
is the PKB, whose base of support has been almost exclusively located in Java.

20
elections (Ufen 2008b). Thus, since 2011, only parties present in all provinces, in 75 percent of
the municipalities of each of these provinces, and in 50 percent of the subdistricts of each of
these municipalities have been allowed to contest national elections (International Foundation
for Electoral Systems 2019). As a result of these various factors, regional or ethnic identities
have not been major drivers of electoral and socioeconomic differentiation in contemporary
Indonesia, in contrast to the Thai and Malaysian cases.
Religion has proved to be a much stronger determinant of partisan affiliations. As shown in
Figures 12.13 and 12.14, Muslims participating “often” or “always” to collective prayers have
been much more likely to support Islamic parties, while the PDI-P and Nasdem have been more
popular among non-practicing Muslims and especially among religious minorities (mostly
Christians and Hindus, about 10 percent of the electorate since 19999). Golkar, Gerindra, and
Hanura have lied in between, with vote shares varying little across religious groups, consistently
with Golkar’s historical ability to amalgamate elites from various streams.10 Pluralism,
secularism, and attitudes towards minorities therefore appear to have represented an important
dimension of Indonesian politics, a divide that has also been visible in party members’
diverging attitudes towards these issues (Fossati & Warburton 2018).
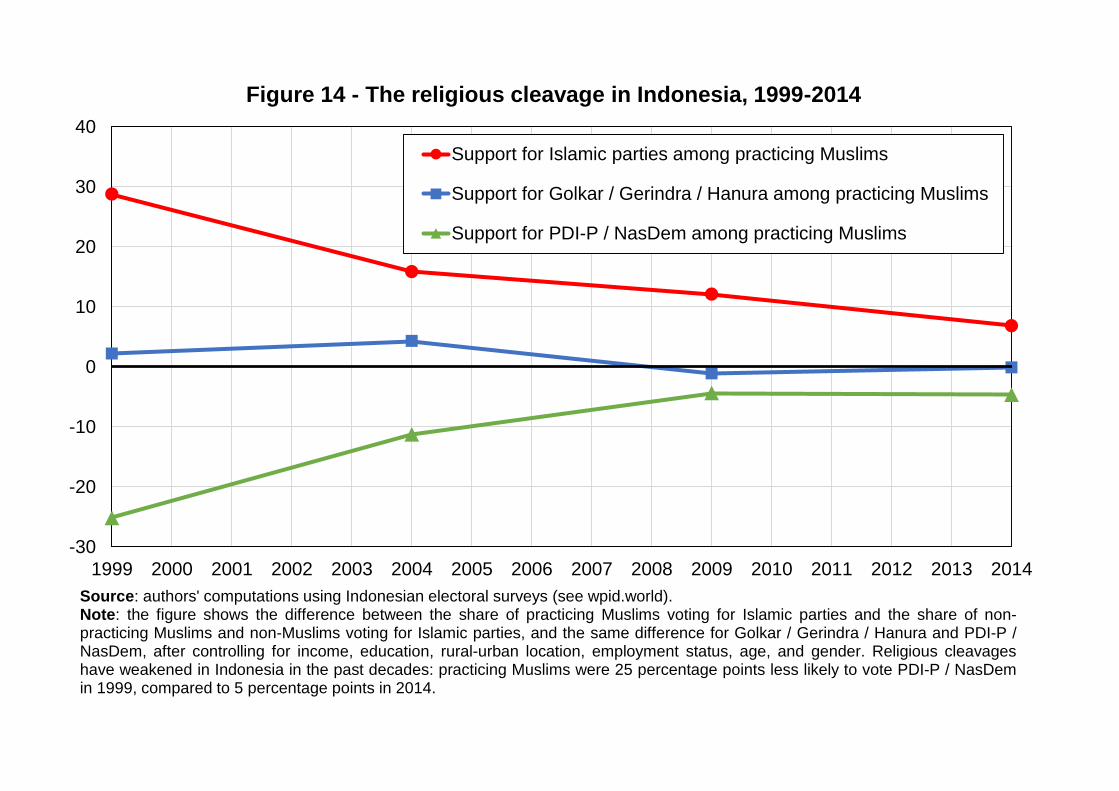
This cleavage, however, lost much of its electoral significance between 1999 and 2014,
especially between practicing and non-practicing Muslims, who only differed marginally in
their voting behaviors in 2014. This is consistent with the fact that conflicts between Indonesian
parties on religious matters have weakened, as historically secular parties have had to govern
in large coalitions, often with Islamic parties (Ufen 2013). As in the case of ethnicity,
furthermore, the religious-secular cleavage has only had a weak socioeconomic component in
contrast to the Malaysian case, as overall inequalities between Muslims and non-Muslims are
9 See appendix Table AD2.
10 We group Nasdem with PDI-P here given the more secular and pro-poor orientation of Nasdem, but all our
results are strongly robust to considering PDI-P alone: see appendix Figures DI1 to DI12.
21
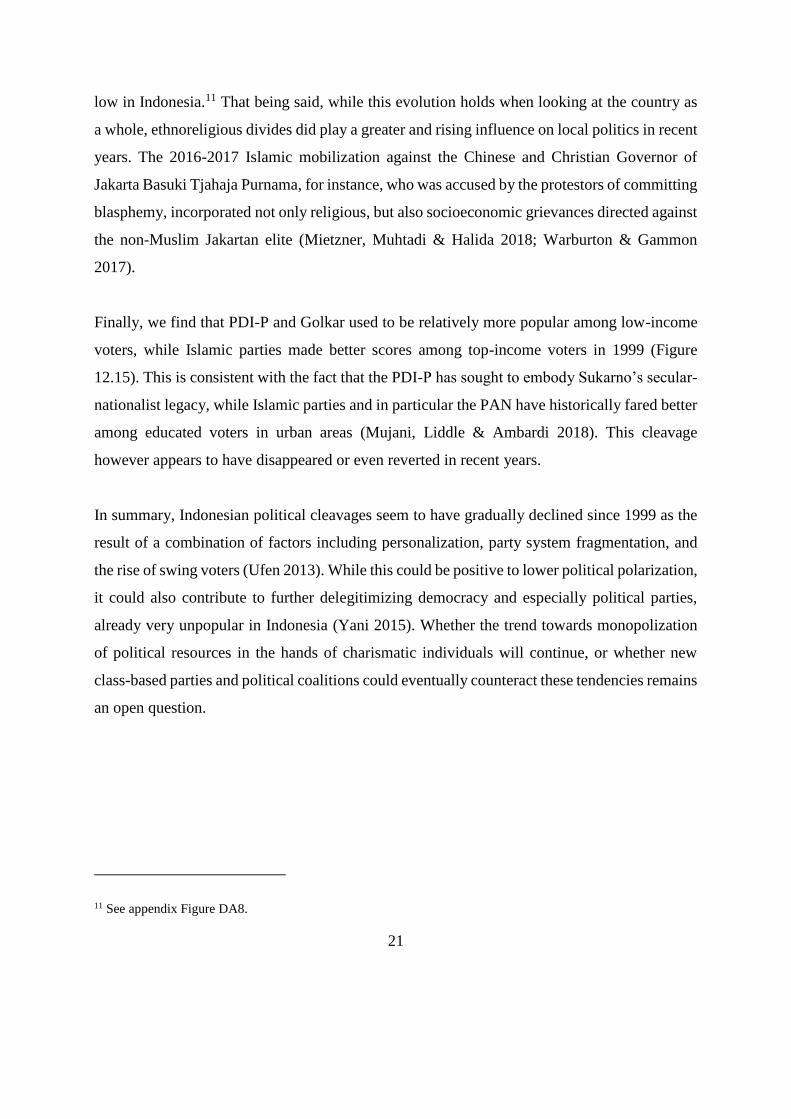
low in Indonesia.11 That being said, while this evolution holds when looking at the country as
a whole, ethnoreligious divides did play a greater and rising influence on local politics in recent
years. The 2016-2017 Islamic mobilization against the Chinese and Christian Governor of
Jakarta Basuki Tjahaja Purnama, for instance, who was accused by the protestors of committing
blasphemy, incorporated not only religious, but also socioeconomic grievances directed against
the non-Muslim Jakartan elite (Mietzner, Muhtadi & Halida 2018; Warburton & Gammon
2017).
Finally, we find that PDI-P and Golkar used to be relatively more popular among low-income
voters, while Islamic parties made better scores among top-income voters in 1999 (Figure
12.15). This is consistent with the fact that the PDI-P has sought to embody Sukarno’s secular-
nationalist legacy, while Islamic parties and in particular the PAN have historically fared better
among educated voters in urban areas (Mujani, Liddle & Ambardi 2018). This cleavage
however appears to have disappeared or even reverted in recent years.
In summary, Indonesian political cleavages seem to have gradually declined since 1999 as the
result of a combination of factors including personalization, party system fragmentation, and
the rise of swing voters (Ufen 2013). While this could be positive to lower political polarization,
it could also contribute to further delegitimizing democracy and especially political parties,
already very unpopular in Indonesia (Yani 2015). Whether the trend towards monopolization
of political resources in the hands of charismatic individuals will continue, or whether new
class-based parties and political coalitions could eventually counteract these tendencies remains
an open question.
11 See appendix Figure DA8.

22
References
E. Aspinall, “Democratization and Ethnic Politics in Indonesia: Nine Theses,” Journal of East
Asian Studies 11, no. 2 (2011): 289–319.
A. A. Arugay and D. Slater, “Polarization Without Poles: Machiavellian Conflicts and the
Philippines’ Lost Decade of Democracy, 2000–2010,” Annals of the American Academy of
Political and Social Science 681, no. 1 (2018): 122–136.
C. J. Baker and P. Phongpaichit, A History of Thailand (Cambridge University Press, 2014).
J. Baleyte, A. Gethin, Y. Govind, and T. Piketty, “Social Inequalities and the Politicization of
Ethnic Cleavages in Botswana, Ghana, Nigeria, and Senegal, 1999-2019” (WID.world Working
Paper, 2020).
C. Brown, A Short History of Indonesia (Allen & Unwin, 2003).
A. Croissant, “Malaysia: Competitive Authoritarianism in a Plural Society,” in Comparative
Politics of Southeast Asia, ed. A. Croissant and P. Lorenz (Springer International, 2018): 141–
176
Department of Statistics Malaysia, “Current Population Estimates, Malaysia, 2020”,
www.dosm.gov.my, July 15 2020 (accessed September 8 2020).
C. Durrer de la Sota and A. Gethin, “Inequality, Identity, and the Structure of Political
Cleavages in South Korea, Taiwan, and Hong Kong, 1996-2016” (WID.world Working Paper,
2020).
D. Fossati and E. Warburton, “Indonesia’s Political Parties and Minorities” (ISEAS Institute,
2018).
A. L. Freedman, Political Change and Consolidation : Democracy’s Rocky Road in Thailand,
Indonesia, South Korea, and Malaysia (Palgrave Macmillan, 2006).
A. Gethin, “Extreme Inequality and the Structure of Political Cleavages in South Africa, 1994-
2019” (WID.world Working Paper, 2020).

23
A. Gethin, S. Mehmood, and T. Piketty, “Social Inequality and the Dynamics of Political and
Ethnolinguistic Divides in Pakistan, 1970-2018” (WID.world Working Paper, 2020).
A. Gethin and M. Morgan, “Democracy and the Politicization of Inequality in Brazil, 1989-
2018” (WID.world Working Paper, 2021).
E. E. Hedman, “The Spectre of Populism in Philippine Politics and Society: Artista, Masa,
Eraption!,” South East Asia Research 9, no. 1 (2001): 5–44.
International Foundation for Electoral Systems, “Elections in Indonesia: 2019 Concurrent
Presidential and Legislative Elections” (2019).
T. Jenmana, “Democratisation and the Emergence of Class Conflicts. Income Inequality in
Thailand, 2001-2016” (WID.world Working Paper, 2018).
T. Jenmana and A. Gethin, “Extreme Inequality, Democratisation and Class Struggles in
Thailand” (WID.world Issue Brief, 2019).
Y. Kasuya, Presidential Bandwagons: Parties and Party Systems in the Philippines (Anvil
Publishing, 2009).
M. Khalid and L. Yang, “Income Inequality and Ethnic Cleavages in Malaysia: Evidence from
Distributional National Accounts (1984-2014)” (WID.world Working Paper, 2019).
D. King, Half-Hearted Reform: Electoral Institutions and the Struggle for Democracy in
Indonesia (Praeger, 2003).
C. H. Landé, Post-Marcos Politics: A Geographical and Statistical Analysis of the 1992
Presidential Election (Institute of Southeast Asian Studies, 1996).
M. Mietzner, B. Muhtadi, and R. Halida, “Entrepreneurs of Grievance: Drivers and Effects of
Indonesia’s Islamist Mobilization,” Bijdragen tot de taal-, land- en volkenkunde / Journal of
the Humanities and Social Sciences of Southeast Asia 174, no. 2-3 (2018): 159-187.
S. Mujani, R. W. Liddle, and K. Ambardi, Voting Behavior in Indonesia since Democratization:
Critical Democrats (Cambridge University Press, 2018).
K. Nadeau, The History of the Philippines (Greenwood, 2008).

24
P. Ouyyanont, A Regional Economic History of Thailand (ISEAS–Yusof Ishak Institute, 2018).
M. Ravallion, “Ethnic Inequality and Poverty in Malaysia since 1969” (NBER Working Paper,
2019).
A. Satitniramai, The Rise and Fall of the Bankers’ Capitalism: 60 Years of the Thai Political
Economy (SameSkybooks, 2013) [in thai].
P. J. Tan, “Explaining Party System Institutionalization in Indonesia,” in Party System
Institutionalization in Asia: Democracies, Autocracies, and the Shadows of the Past, ed. A.
Hicken and E. Kuhonta (Cambridge University Press, 2014): 236–259.
J. C. Teehankee, “Clientelism and Party Politics in the Philippines,” in Party Politics in
Southeast Asia, ed. D. Tomsa and A. Ufen (Routledge, 2013).
J. C. Teehankee, “Regional Dimensions of the 2016 General Elections in the Philippines:
Emerging Contours of Federalism,” Regional and Federal Studies 28, no. 3 (2018): 383–394.
J. C. Teehankee and M. R. Thompson, “Duterte and the Politics of Anger in the Philippines,”
East Asia Forum, May 8, 2016.
J. C. Teehankee and M. R. Thompson, “The Vote in the Philippines: Electing a Strongman,”
Journal of Democracy 27, no. 4 (2016): 125–134.
The New Paper, “Malaysia election: 3-way split in Malay vote, most Chinese voted PH”, The
New Paper, https://www.tnp.sg/news/world/malaysia-election-3-way-split-malay-vote-most-
chinese-voted-ph, June 14 2018 (accessed September 7 2020).
M. R. Thompson, “Class, Charisma, and Clientelism in Thai and Philippines Populist Parties,”
in Party Politics in Southeast Asia, ed. D. Tomsa and A. Ufen (Routledge, 2013).
M. R. Thompson and J. C. Teehankee, “Duterte Victory: A Repudiation of Aquino”, Nikkei
Asian Review, May 12, 2016.
D. Tomsa, Party Politics and Democratization in Indonesia: Golkar in the Post-Suharto Era
(Routledge, 2008).
25
A. Ufen, “The Evolution of Cleavages in the Indonesian Party System” (GIGA Working Paper
74, 2008).
A. Ufen, “From Aliran to Dealignment: Political Parties in Post-Suharto Indonesia,” South East
Asia Research 16, no. 1 (2008): 5–41.
A. Ufen, “Lipset and Rokkan in Southeast Asia: Indonesia in comparative perspective,” in Party
Politics in Southeast Asia: Clientelism and Electoral Competition in Indonesia, Thailand and
the Philippines, ed. D. Tomsa and A. Ufen (Routledge, 2013): 40–61.
A. Ufen, “Opposition in Transition: Pre-Electoral Coalitions and the 2018 Electoral
Breakthrough in Malaysia,” Democratization 27, no. 2 (2020): 167–184.
E. Warbuton and L. Gammon, “Class Dismissed? Economic Fairness and Identity Politics in
Indonesia,” New Mandala, 5 May 2017, https://www.newmandala.org/economic-injustice-
identity-politics-indonesia/ (accessed 10 October 2020).
M. L. Weiss, “The Antidemocratic Potential of Party System Institutionalization: Malaysia as
Morality Tale?,” in Party System Institutionalization in Asia: Democracies, Autocracies, and
the Shadows of the Past, ed. A. Hicken and E. M. Kuhonta (Cambridge University Press, 2015):
25–48.
A. A. Yani, “The Dynamic of Indonesian Political Trust in the Beginning of Reform Era”,
Politik 12, no. 1 (2015): 55–68.
0%
10%
20%
30%
40%
50%
60%
70%
80%
90%
2001 2003 2005 2007 2009 2011 2013 2015 2017 2019
Sh
are
of vo
tes (
%)
Figure 1 - Election results in Thailand, 2001-2019
Thai Rak Thai / Pheu Thai Democrat party and military parties
Thai Rak Thai / Pheu Thai / Oth. pro-Thaksin Others / Independents
Source: authors' computations using official election results (see wpid.world).Note: the figure shows the share of votes received by selected political parties or groups of parties in general elections held inThailand between 2001 and 2019.

0%
10%
20%
30%
40%
50%
60%
70%
80%
90%
100%
Q1 Q2 Q3 Q4 Q5 D10
Figure 2 - Regional inequalities in Thailand
Northeast North Central South Bangkok
Source: authors' computations using Thai political attitudes surveys (see wpid.world).Note: the figure shows the composition of income groups (quintiles (Q1 to Q5) and the top decile (D10)) by region in 2011. In2011, 45% of top 10% income earners lived in Bangkok, compared to only 12% in the Northeast. This region concentrated alonemore than half of bottom 20% income earners.
-5
0
5
10
15
20
25
30
35
40
45
2001 2002 2003 2004 2005 2006 2007 2008 2009 2010 2011
Figure 3 - The educational cleavage in Thailand, 2001-2011
Difference between (% of bottom 50% educated) and (% of top 50% educated) voting TRT / PTP
After controlling for income, location
After controlling for income, location, age, gender, employment status, marital status, religion
Source: authors' computations using Thai political attitudes surveys (see wpid.world).Note: the figure shows the difference between the share of bottom 50% educated voters and the share of top 50% educated votersvoting for the Thai Rak Thai, the Pheu Thai, and other pro-Thaksin parties, before and after controls. In 2001, bottom 50% educatedvoters were 6 percentage points more likely to vote for these parties, compared to 26 percentage points in 2011.

-10
-5
0
5
10
15
20
25
30
35
40
45
50
2001 2002 2003 2004 2005 2006 2007 2008 2009 2010 2011
Figure 4 - The rural-urban cleavage in Thailand, 2001-2011
Difference between (% of rural areas) and (% of urban areas) voting TRT / PTP
After controlling for income, education
After controlling for income, education, age, gender, employment status, marital status, religion
Source: authors' computations using Thai political attitudes surveys (see wpid.world).Note: the figure shows the difference between the share of rural areas and the share of urban areas voting for the Thai Rak Thai,the Pheu Thai, and other pro-Thaksin parties, before and after controls. In 2001, the vote share of these parties was 3 percentagepoints lower in rural areas than in urban areas; by 2011, it had become 28 percentage points higher.

0%
10%
20%
30%
40%
50%
60%
70%
80%
1992 1994 1996 1998 2000 2002 2004 2006 2008 2010 2012 2014 2016
Sh
are
of vo
tes (
%)
Figure 5 - Election results in the Philippines, 1992-2016
Lakas / Liberal / Aksyon J. Estrada / F. Poe / G. Poe / J. Binay
R. Duterte Other parties / candidates
Source: authors' computations using official election results (see wpid.world).Note: the figure shows the share of votes received in the first round of presidential elections by selected parties, group of parties,or candidates in the Philippines. The candidate Rodrigo Duterte received 39% of votes in the 2016 election.

-30
-25
-20
-15
-10
-5
0
5
10
15
20
1998 2000 2002 2004 2006 2008 2010 2012 2014 2016
Figure 6 - The educational cleavage in the Philippines, 1998-2016
Difference between (% of top 10% educated) and (% bottom 90% educ.) voting Estrada / Poe / Binay
After controlling for region, ethnicity, employment status, age, gender, religion, religious attendance
After controlling for region, ethnicity, employment status, age, gender, religion, religious attendance,income, location
Source: authors' computations using Filipino electoral surveys (see wpid.world).Note: the figure shows the difference between the share of top 10% educated voters and the share of bottom 90% educated votersvoting for Joseph Estrada (1998, 2010), Fernando Poe (2004), Grace Poe (2016), and Jejomar Binay (2016) in the first round ofpresidential elections, before and after controls. These candidates all received higher support among the least educated. In 2004,higher-educated voters were less likely to vote for Joseph Estrada by 22 percentage points.

-40
-30
-20
-10
0
10
20
30
40
50
1998 2000 2002 2004 2006 2008 2010 2012 2014 2016
Figure 7 - The regional cleavage in the Philippines, 1998-2016
Difference between (% of Visayas) and (% of other regions) voting Estrada / Poe / Binay
After controls
Difference between (% of Mindanao) and (% of other regions) voting Estrada / Poe / Binay
After controls
Source: authors' computations using Filipino electoral surveys (see wpid.world).Note: the figure shows the difference between the share of voters living in the Visayas geographical zone and the share of votersliving in other regions of the Philippines voting for the candidates Joseph Estrada (1998, 2010), Fernando Poe (2004), Grace Poe(2016), and Jejomar Binay (2016) in the first round of presidential elections, as well as the same difference between Mindanao andthe rest of the country, before and after controlling for education, employment status, age, gender, religion, religious attendance,income, and rural-urban location. In 2016, the vote share of Grace Poe and Jejomar Binay was 20 percentage points lower inMindanao than in other regions.

Rodrigo Duterte
PDP-Laban
Mar Roxas
Liberal Party
Grace Poe
Independent
Jejomar Binay
UNA
Education
Primary 42% 24% 19% 13%
Secondary 35% 24% 24% 12%
Tertiary 43% 21% 21% 12%
Region
National Capital Region 33% 16% 27% 19%
Luzon 29% 26% 27% 16%
Visayas 39% 31% 17% 8%
Mindanao 62% 16% 12% 7%
Religion
Catholic 37% 25% 22% 12%
Protestant 31% 21% 30% 18%
Muslim 75% 5% 3% 13%
Location
Urban areas 43% 15% 21% 15%
Rural areas 36% 30% 22% 11%
Table 1 - Structure of the vote in the 2016 Filipino presidential election
Source: authors' computations using Filipino electoral surveys.
Notes: the table shows the share of votes received by the main Filipino presidential candidates by selected individual
characteristics in 2016. Rodrigo Duterte received his highest vote share in Mindanao (62%) and in urban areas (43%).
0%
10%
20%
30%
40%
50%
60%
70%
80%
90%
1955 1960 1965 1970 1975 1980 1985 1990 1995 2000 2005 2010 2015
Figure 8 - Election results in Malaysia, 1955-2018
Barisan Nasional Democratic Action Party
Malaysian Islamic Party People's Justice Party
Source: authors' computations using official election results (see wpid.world).Note: the figure shows the share of votes received by the main Malaysian parties in general elections held between 1955 and2018. The National Front coalition (Barisan National, BN) received 34% of the vote in 2018.
0%
10%
20%
30%
40%
50%
60%
70%
80%
90%
2004 2008 2013
Figure 9 - The ethnoreligious cleavage in Malaysia, 2004-2013The Barisan National vote by religious affiliation
Buddhist / Taoist Muslim Christian Hindu / Sikh
Source: authors' computations using Asian Barometer surveys (see wpid.world).Note: the figure shows the share of votes received by the Barisan Nasional by religious affiliation. In 2013, 29% of Buddhist andTaoist voters voted BN, compared to 53% of Muslim voters and 62% of Hindu and Sikh voters.

-20
-15
-10
-5
0
5
10
15
2004 2005 2006 2007 2008 2009 2010 2011 2012 2013
Figure 10 - Vote and income in Malaysia, 2004-2013
Difference between (% of top 10% earners) and (% of bottom 90% earners) voting BN
After controlling for religion, location
After controlling for religion, location, age, gender, employment status, marital status, education
Source: authors' computations using Asian Barometer surveys (see wpid.world).Note: the figure shows the difference between the share of top 10% earners and the share of bottom 90% earners voting for theBarisan Nasional, before and after controls. In 2013, bottom 50% income earners were 17 percentage points less likely to vote BN.After controls (all other things being equal), this difference is reduced to 5 percentage points.
0%
10%
20%
30%
40%
50%
60%
70%
2004 2008 2013 2004 2008 2013
Figure 11 - Ethnoreligious cleavages and class cleavagesin Malaysia, 2004-2013
Bottom 50% Middle 40% Top 10%
Source: authors' computations using Asian Barometer surveys (see wpid.world).Note: the figure shows the share of votes received by the Barisan Nasional by income group among Muslims and non-Muslims. TheBN has been most strongly supported among bottom 50% income earners within these two groups. In 2013, 53% of the bottom50% of Muslim income earners voted BN, compared to 16% of the top 10% of Muslim income earners.
Muslims Buddhists / Christians / Others
0%
10%
20%
30%
40%
50%
60%
70%
80%
1975 1980 1985 1990 1995 2000 2005 2010 2015 2020
Figure 12 - Election results in Indonesia, 1977-2019
Golkar PDI / PDI-P
Islamic parties PD
Gerindra NasDem
Hanura
Source: authors' computations using official election results (see wpid.world).Note: the figure shows the share of votes received by selected Indonesian political parties or groups of parties in legislative electionsbetween 1977 and 2019. The PDI-P received 19% of votes in 2018. PD: Democratic Party; PDI: Indonesian Democratic Party; PDI-P:Indonesian Democratic Party of Struggle; NasDem: National Democratic Party; Islamic Parties: PAN, PBB, PBR, PKB, PKNU, PKS,and PPP.

0%
10%
20%
30%
40%
50%
60%
70%
1999 2004 2009 2014
Figure 13 - The PDI-P / NasDem vote by religious affiliation in Indonesia, 1999-2014
Practicing Muslims Non-practicing Muslims Non-Muslims
Source: authors' computations using Indonesian electoral surveys (see wpid.world).Note: the figure shows the share of votes received by the Indonesian Democratic Party of Struggle (PDI-P) and the NationalDemocratic Party (NasDem) by religious affiliation. In 2014, 51% of non-Muslims supported these two parties, compared to 22% ofpracticing Muslims (reporting participating "Often" or "Very often / Always" to collective prayers).
-30
-20
-10
0
10
20
30
40
1999 2000 2001 2002 2003 2004 2005 2006 2007 2008 2009 2010 2011 2012 2013 2014
Figure 14 - The religious cleavage in Indonesia, 1999-2014
Support for Islamic parties among practicing Muslims
Support for Golkar / Gerindra / Hanura among practicing Muslims
Support for PDI-P / NasDem among practicing Muslims
Source: authors' computations using Indonesian electoral surveys (see wpid.world).Note: the figure shows the difference between the share of practicing Muslims voting for Islamic parties and the share of non-practicing Muslims and non-Muslims voting for Islamic parties, and the same difference for Golkar / Gerindra / Hanura and PDI-P /NasDem, after controlling for income, education, rural-urban location, employment status, age, and gender. Religious cleavageshave weakened in Indonesia in the past decades: practicing Muslims were 25 percentage points less likely to vote PDI-P / NasDemin 1999, compared to 5 percentage points in 2014.

-10
-5
0
5
10
15
1999 2000 2001 2002 2003 2004 2005 2006 2007 2008 2009 2010 2011 2012 2013 2014
Figure 15 - Vote and income in Indonesia, 1999-2014
Support for Islamic parties among top-income voters
Support for Golkar / Gerindra / Hanura among top-income voters
Support for PDI-P / NasDem among top-income voters
Source: authors' computations using Indonesian electoral surveys (see wpid.world).Note: the figure shows the difference between the share of top 10% earners and the share of bottom 90% earners voting for Islamicparties, and the same difference for Golkar / Gerindra / Hanura and PDI-P / Nasdem, after controlling for religion, education, rural-urban location, employment status, age, and gender. The link between income and the vote has weakened in Indonesia in the pastdecades: top 10% earners were 9 percentage points less likely to vote PDI-P / NasDem in 1999, while they were 2 percentagepoints more likely to do so in 2014.

0%
10%
20%
30%
40%
50%
60%
70%
80%
90%
1955 1960 1965 1970 1975 1980 1985 1990 1995 2000 2005 2010 2015 2020
Sh
are
of p
op
ula
r vo
te (
%)
Figure AA1 - Election results in Thailand, 1957-2019
Democrat party and allies Military parties Thai Rak Thai / Pheu Thai / Left parties
Source: authors' computations using official election results.Note: the figure shows the share of votes received by selected groups of Thai political parties in general elections between 1957 and 2019.
0%
10%
20%
30%
40%
50%
60%
70%
80%
90%
100%
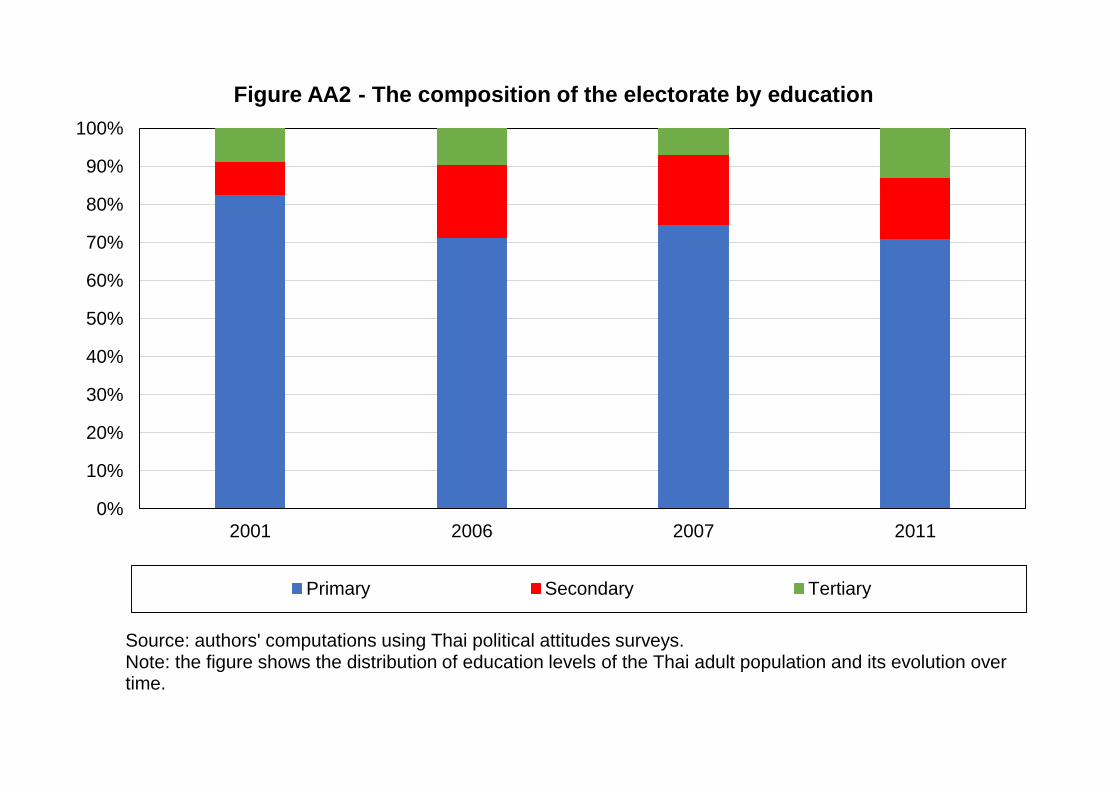
2001 2006 2007 2011
Figure AA2 - The composition of the electorate by education
Primary Secondary Tertiary
Source: authors' computations using Thai political attitudes surveys.Note: the figure shows the distribution of education levels of the Thai adult population and its evolution over time.
0%
10%
20%
30%
40%
50%
60%
70%
80%
90%
100%
2001 2006 2007 2011
Figure AA3 - The composition of the electorate by religion
Buddhist Muslim / Other
Source: authors' computations using Thai political attitudes surveys.Note: the figure shows the distribution of religious affiliations in the Thai adult population and its evolution over time.
0%
10%
20%
30%
40%
50%
60%
70%
80%
90%
100%
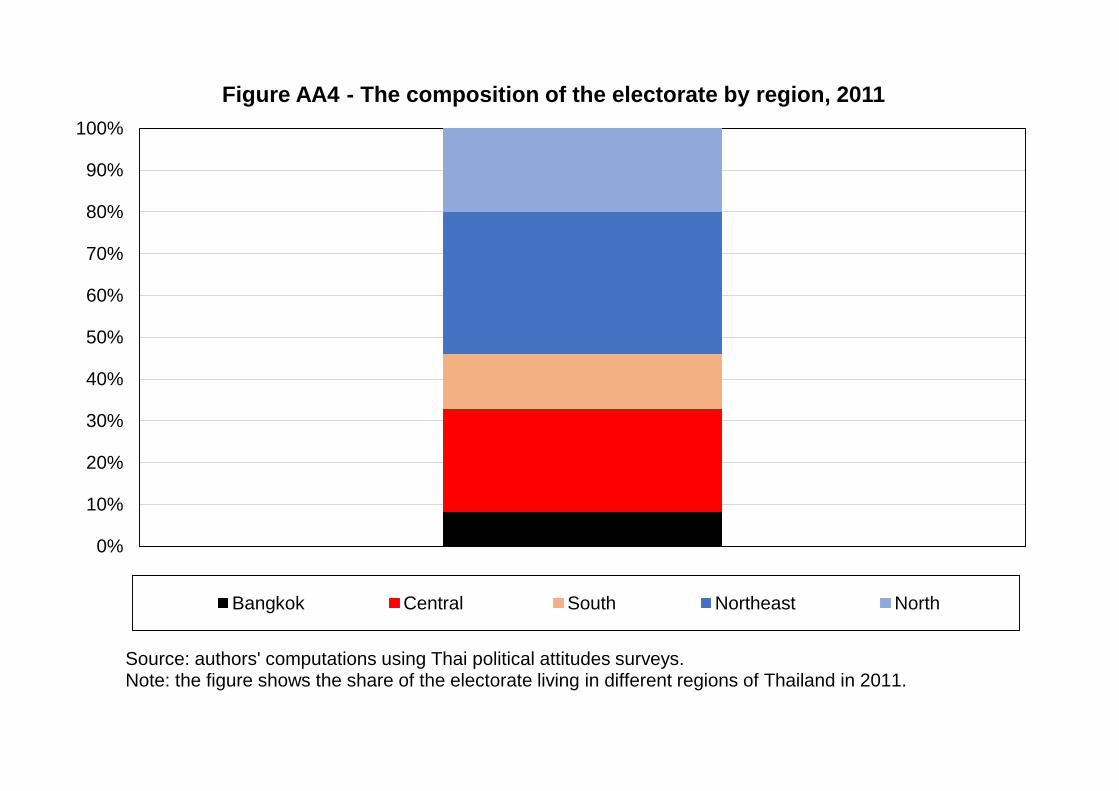
Figure AA4 - The composition of the electorate by region, 2011
Bangkok Central South Northeast North
Source: authors' computations using Thai political attitudes surveys.Note: the figure shows the share of the electorate living in different regions of Thailand in 2011.
0
0,1
0,2
0,3
0,4
0,5
0,6
0,7
0,8
Gin
i co
effic
ien
t o
f sp
atia
l in
eq
ua
lity
Figure AA5 - Thai regional inequality in comparative perspective
United States Europe India Brazil Thailand
Source: authors’ computations combining national and regional accounts statistics from the National Economic and Social Development Board (Thailand), the Brazilian Institute for Geography and Statistics (Brazil), the Bureau of Economic Analysis (United States), the Central Statistics Office (India) and the World Inequality Database (Europe). Spatial units refers to Thai provinces, Brazilian states, US States, Indian States, and European countries (38 countries).Note: the figure shows the Gini coefficient of regional inequality.
0%
50%
100%
150%
200%
250%
300%
350%
400%
450%
1960 1965 1970 1975 1980 1985 1990 1995 2000 2005 2010 2015
Ave
rag
e G
ross P
rovin
cia
l P
rod
uct
pe
r ca
pita
(%
of G
DP
)Figure AA6 - Regional inequality in Thailand, 1961-2016
Bangkok and Vicinities Centre / East North / Northeast South
Source: authors' computations using regional accounts statistics.Note: the figure plots the average gross provincial product per capita of Thai regions relative to the overall Thai GDP per capita between 1961 and 2017.

0%
10%
20%
30%
40%
50%
60%
70%
80%
90%
100%
Q1 Q2 Q3 Q4 Q5 D10
Figure AA7 - Regional composition of income deciles, 2011
Northeast North Central South Bangkok
Source: authors' computations using Thai political attitudes surveys.Note: the figure shows the distribution of income groups by region in 2011.
0%
10%
20%
30%
40%
50%
60%
70%
80%
90%
100%
D1 D2 D3 D4 D5 D6 D7 D8 D9 D10
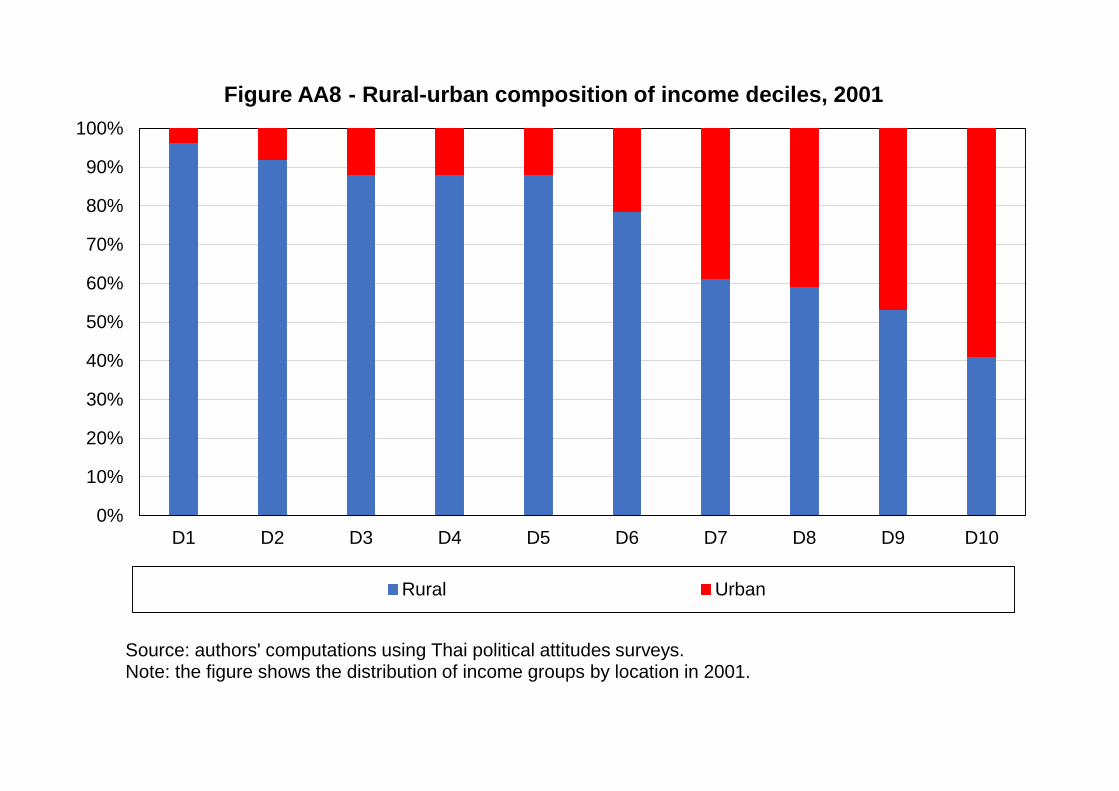
Figure AA8 - Rural-urban composition of income deciles, 2001
Rural Urban
Source: authors' computations using Thai political attitudes surveys.Note: the figure shows the distribution of income groups by location in 2001.
0%
10%
20%
30%
40%
50%
60%
70%
80%
90%
100%
D1 D2 D3 D4 D5 D6 D7 D8 D9 D10
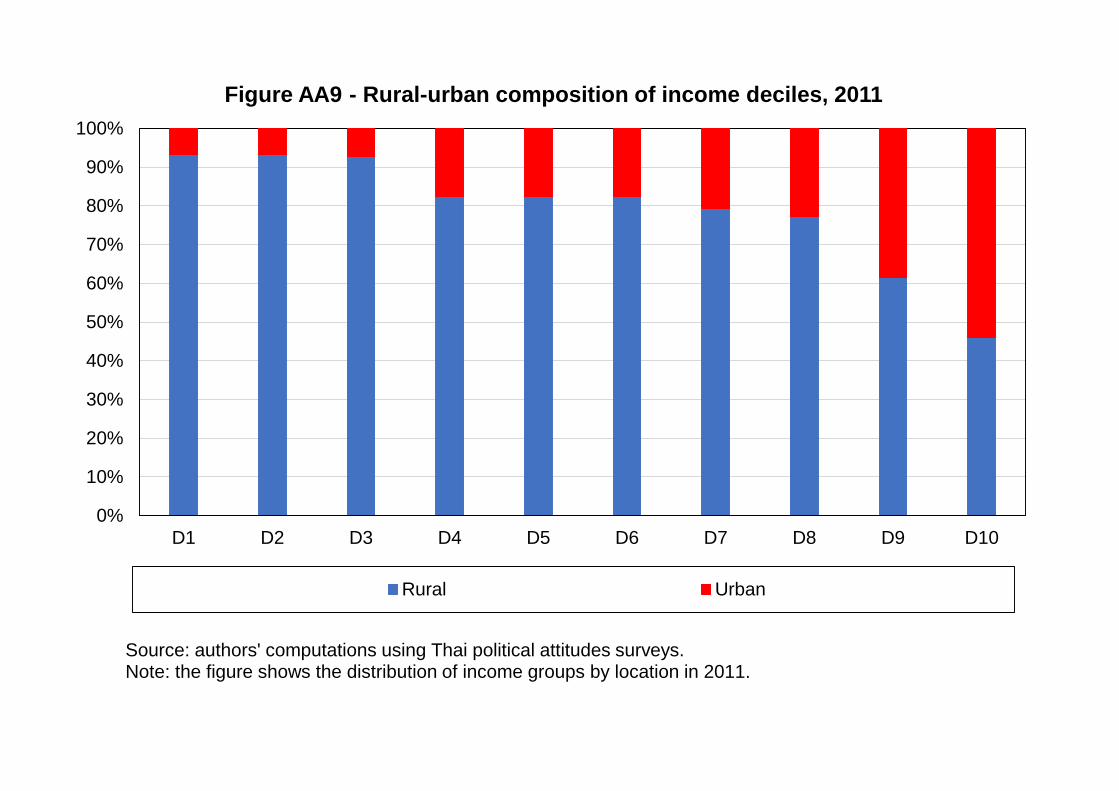
Figure AA9 - Rural-urban composition of income deciles, 2011
Rural Urban
Source: authors' computations using Thai political attitudes surveys.Note: the figure shows the distribution of income groups by location in 2011.

0%
10%
20%
30%
40%
50%
60%
70%
80%
90%
100%
D1 D2 D3 D4 D5 D6 D7 D8 D9 D10
Figure AA10 - Educational composition of income deciles, 2001
Primary Secondary Tertiary
Source: authors' computations using Thai political attitudes surveys.Note: the figure shows the distribution of income groups by education level of the Thai population in 2001.

0%
10%
20%
30%
40%
50%
60%
70%
80%
90%
100%
D1 D2 D3 D4 D5 D6 D7 D8 D9 D10
Figure AA11 - Educational composition of income deciles, 2011
Primary Secondary Tertiary
Source: authors' computations using Thai political attitudes surveys.Note: the figure shows the distribution of income groups by education level of the Thai population in 2011.
0%
10%
20%
30%
40%
50%
60%
70%
80%
90%
100%
2001 2006 2011
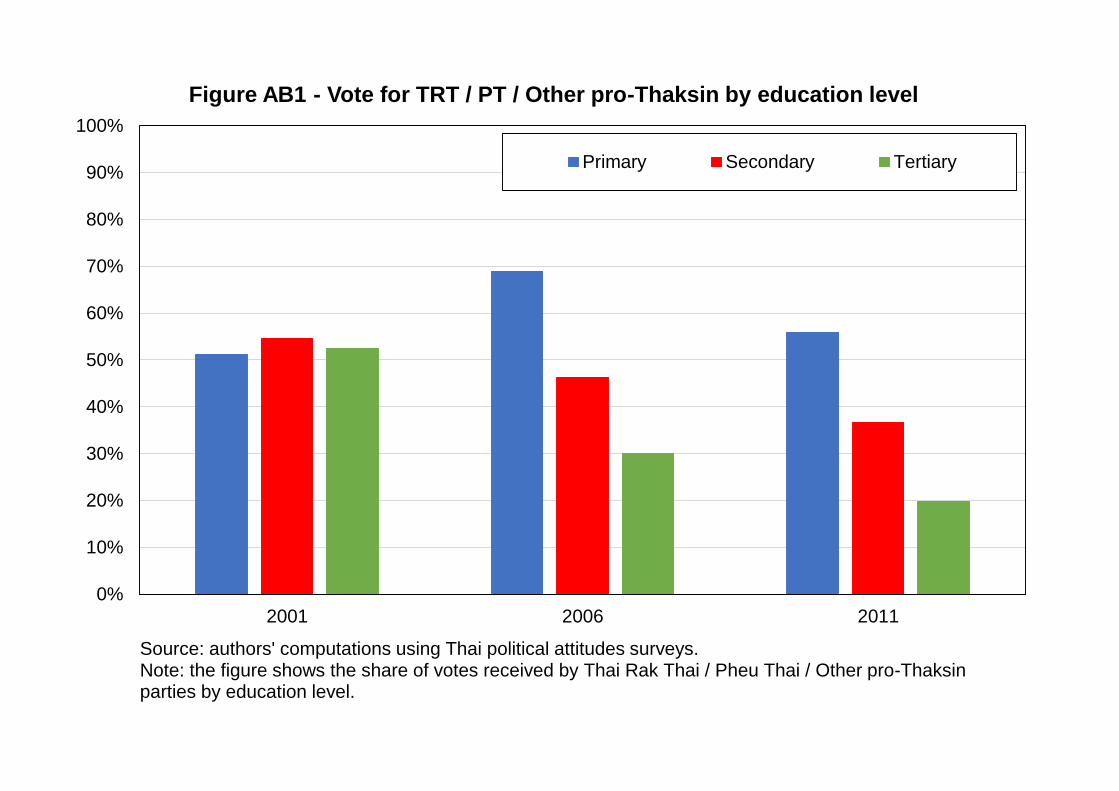
Figure AB1 - Vote for TRT / PT / Other pro-Thaksin by education level
Primary Secondary Tertiary
Source: authors' computations using Thai political attitudes surveys.Note: the figure shows the share of votes received by Thai Rak Thai / Pheu Thai / Other pro-Thaksin parties by education level.

0%
10%
20%
30%
40%
50%
60%
70%
80%
90%
100%
2001 2006 2011
Figure AB2 - Vote for TRT / PT / Other pro-Thaksin by education group
Bottom 50% Middle 40% Top 10%
Source: authors' computations using Thai political attitudes surveys.Note: the figure shows the share of votes received by Thai Rak Thai / Pheu Thai / Other pro-Thaksin parties by education group.
0%
10%
20%
30%
40%
50%
60%
70%
80%
90%
2001 2006 2011
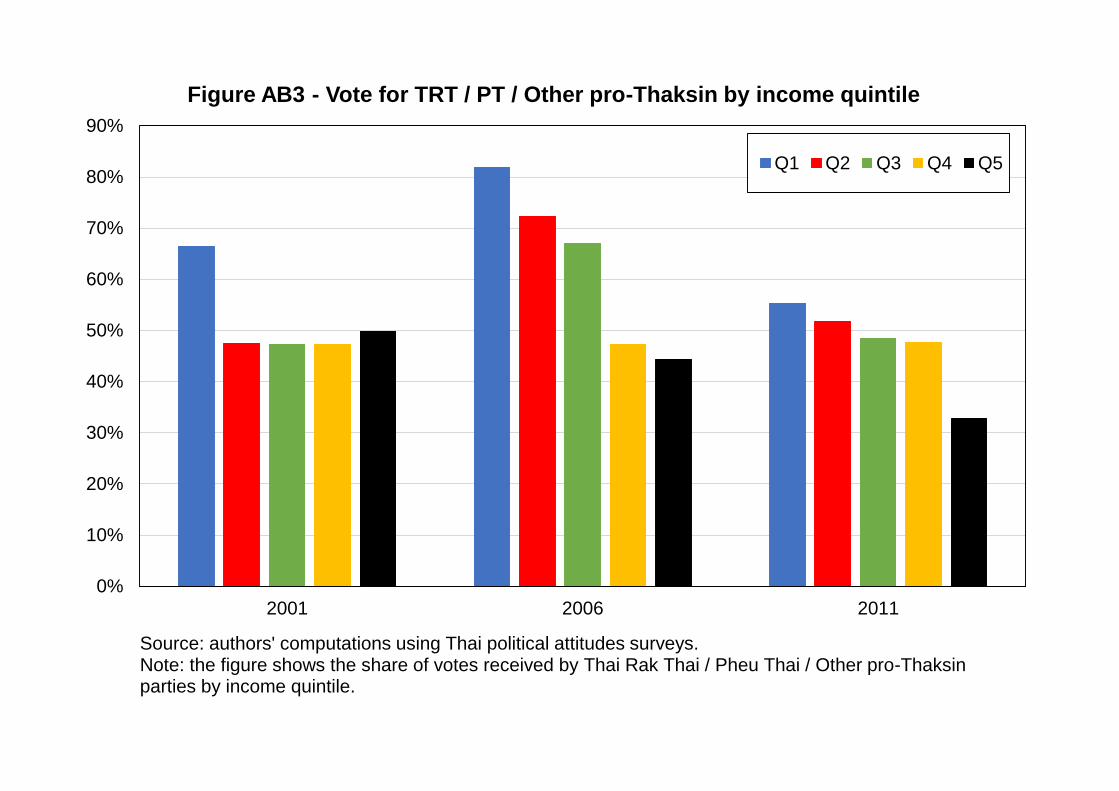
Figure AB3 - Vote for TRT / PT / Other pro-Thaksin by income quintile
Q1 Q2 Q3 Q4 Q5
Source: authors' computations using Thai political attitudes surveys.Note: the figure shows the share of votes received by Thai Rak Thai / Pheu Thai / Other pro-Thaksin parties by income quintile.
0%
10%
20%
30%
40%
50%
60%
70%
80%
90%
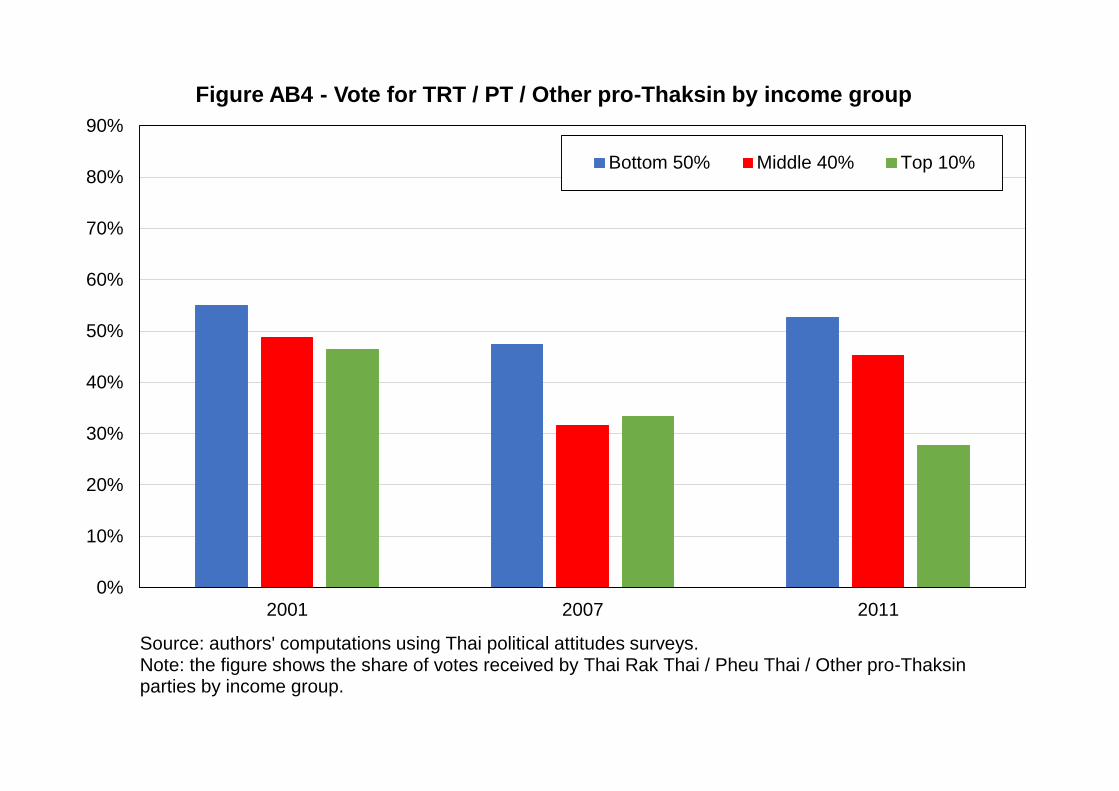
2001 2007 2011
Figure AB4 - Vote for TRT / PT / Other pro-Thaksin by income group
Bottom 50% Middle 40% Top 10%
Source: authors' computations using Thai political attitudes surveys.Note: the figure shows the share of votes received by Thai Rak Thai / Pheu Thai / Other pro-Thaksin parties by income group.
0%
10%
20%
30%
40%
50%
60%
70%
80%
90%
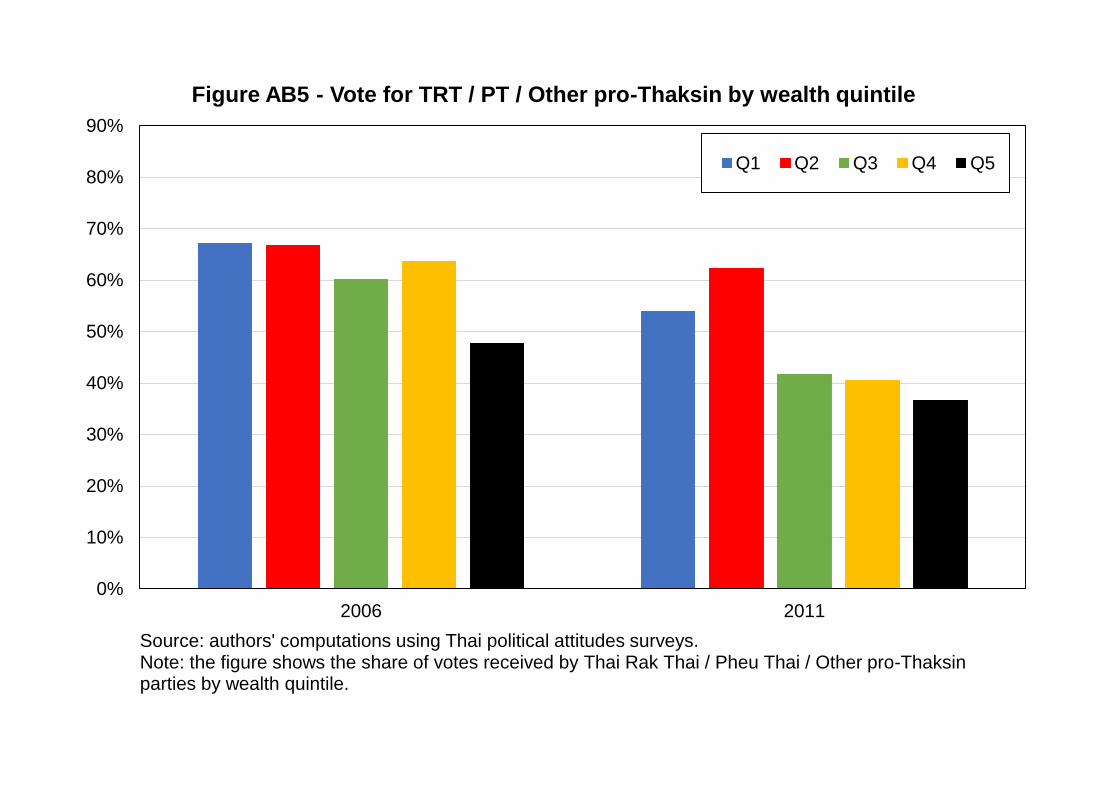
2006 2011
Figure AB5 - Vote for TRT / PT / Other pro-Thaksin by wealth quintile
Q1 Q2 Q3 Q4 Q5
Source: authors' computations using Thai political attitudes surveys.Note: the figure shows the share of votes received by Thai Rak Thai / Pheu Thai / Other pro-Thaksin parties by wealth quintile.
0%
10%
20%
30%
40%
50%
60%
70%
80%
90%
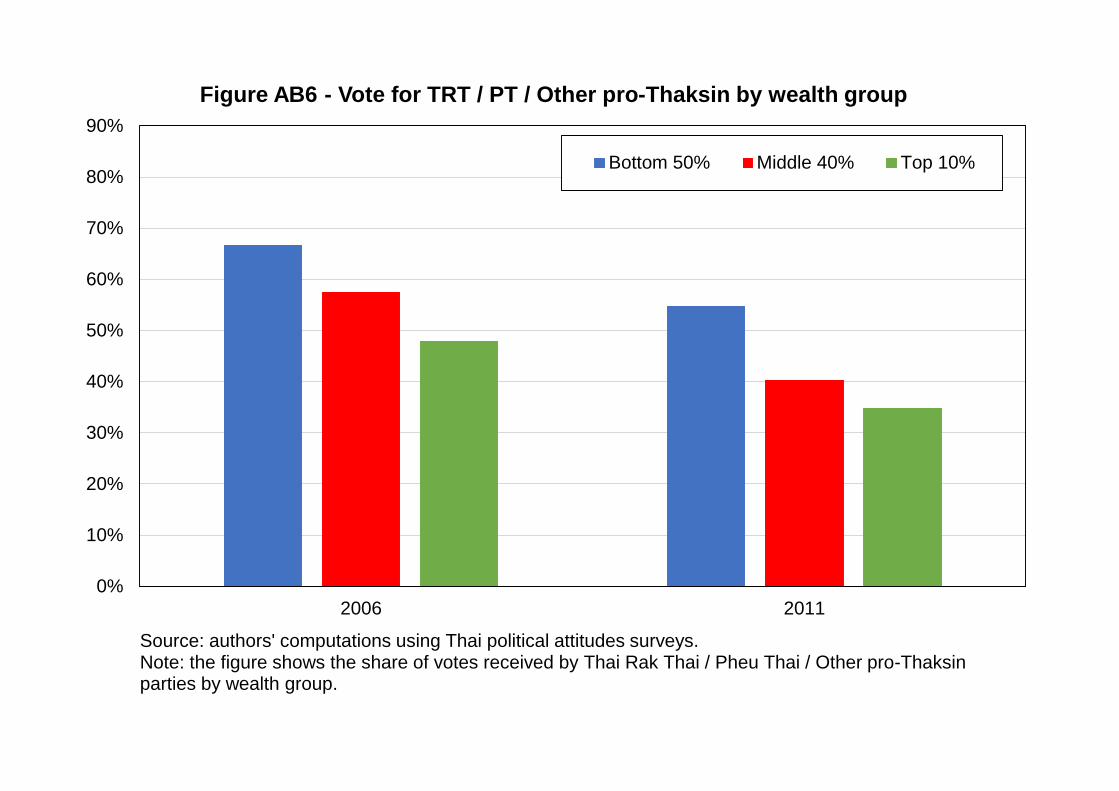
2006 2011
Figure AB6 - Vote for TRT / PT / Other pro-Thaksin by wealth group
Bottom 50% Middle 40% Top 10%
Source: authors' computations using Thai political attitudes surveys.Note: the figure shows the share of votes received by Thai Rak Thai / Pheu Thai / Other pro-Thaksin parties by wealth group.

0%
10%
20%
30%
40%
50%
60%
70%
80%
2001 2006 2011
Figure AB7 - Vote for TRT / PT / Other pro-Thaksin by location
Rural Urban
Source: authors' computations using Thai political attitudes surveys.Note: the figure shows the share of votes received by Thai Rak Thai / Pheu Thai / Other pro-Thaksin parties by location.
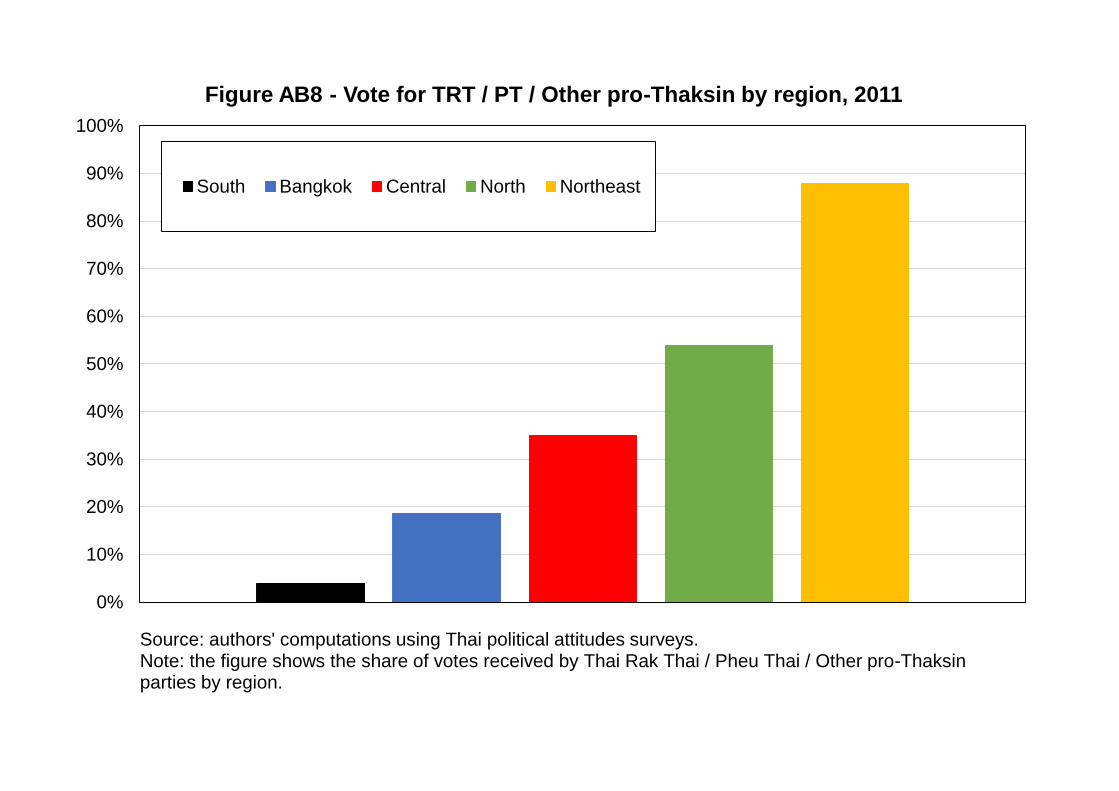
0%
10%
20%
30%
40%
50%
60%
70%
80%
90%
100%
Figure AB8 - Vote for TRT / PT / Other pro-Thaksin by region, 2011
South Bangkok Central North Northeast
Source: authors' computations using Thai political attitudes surveys.Note: the figure shows the share of votes received by Thai Rak Thai / Pheu Thai / Other pro-Thaksin parties by region.
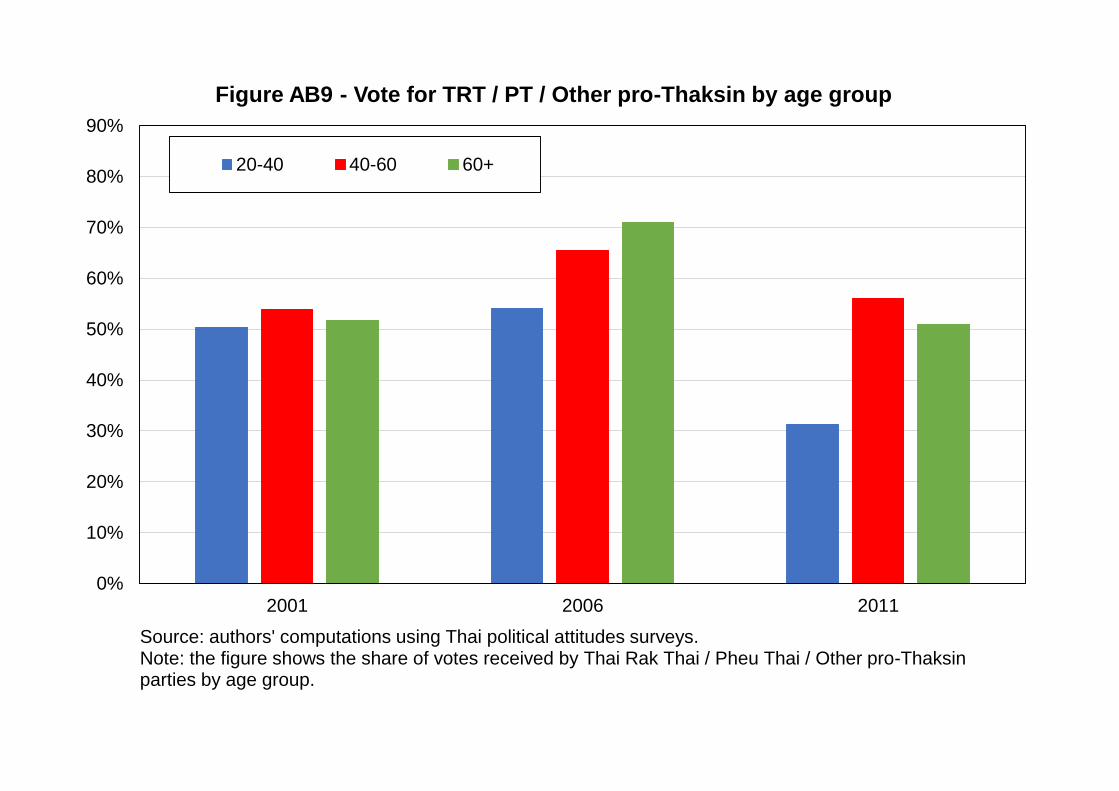
0%
10%
20%
30%
40%
50%
60%
70%
80%
90%
2001 2006 2011
Figure AB9 - Vote for TRT / PT / Other pro-Thaksin by age group
20-40 40-60 60+
Source: authors' computations using Thai political attitudes surveys.Note: the figure shows the share of votes received by Thai Rak Thai / Pheu Thai / Other pro-Thaksin parties by age group.
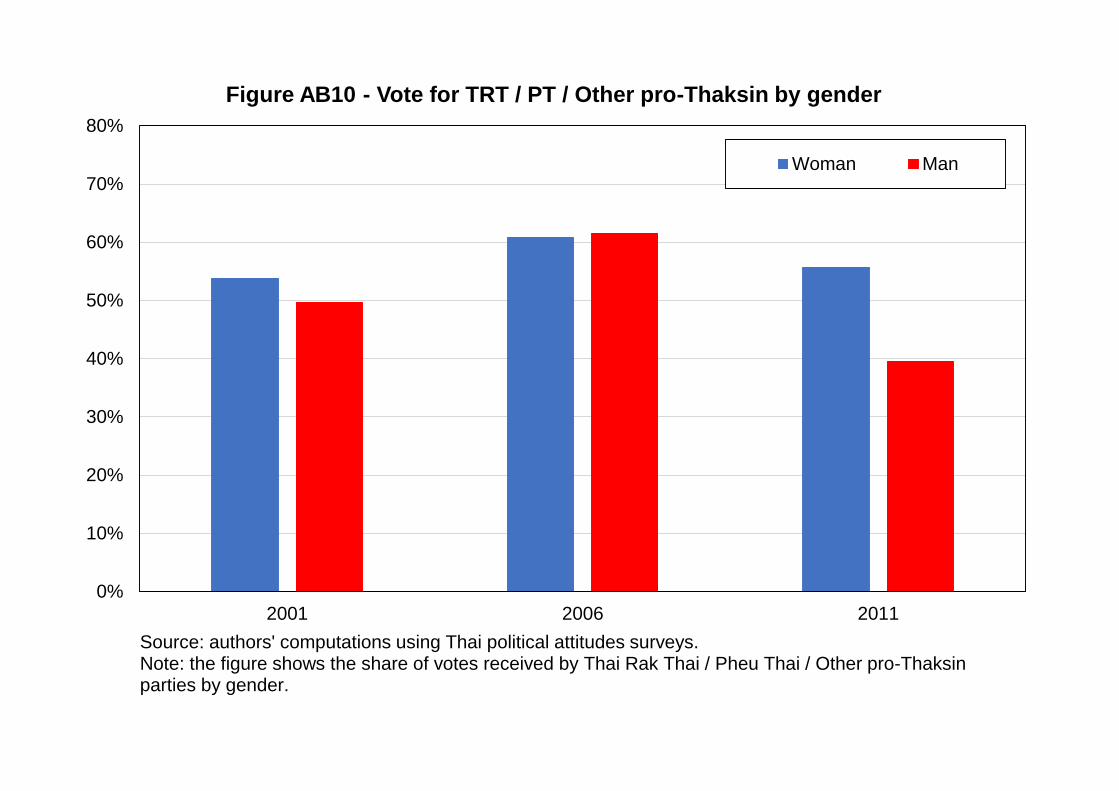
0%
10%
20%
30%
40%
50%
60%
70%
80%
2001 2006 2011
Figure AB10 - Vote for TRT / PT / Other pro-Thaksin by gender
Woman Man
Source: authors' computations using Thai political attitudes surveys.Note: the figure shows the share of votes received by Thai Rak Thai / Pheu Thai / Other pro-Thaksin parties by gender.
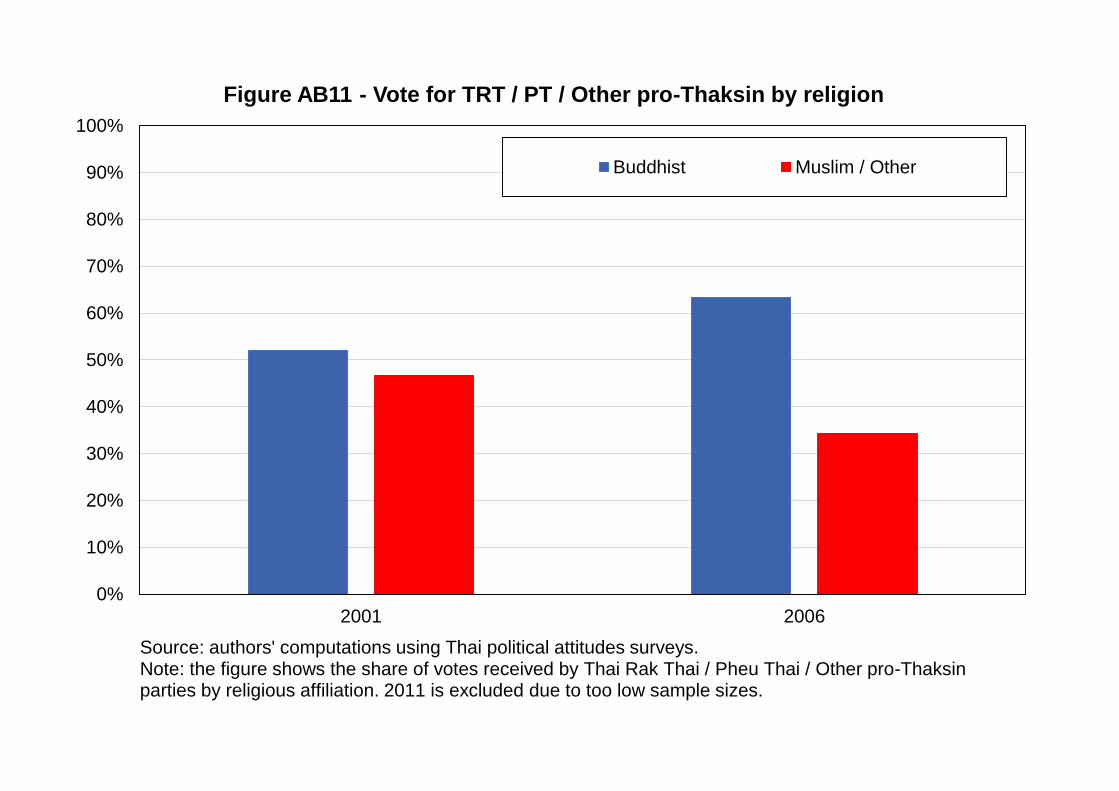
0%
10%
20%
30%
40%
50%
60%
70%
80%
90%
100%
2001 2006
Figure AB11 - Vote for TRT / PT / Other pro-Thaksin by religion
Buddhist Muslim / Other
Source: authors' computations using Thai political attitudes surveys.Note: the figure shows the share of votes received by Thai Rak Thai / Pheu Thai / Other pro-Thaksin parties by religious affiliation. 2011 is excluded due to too low sample sizes.
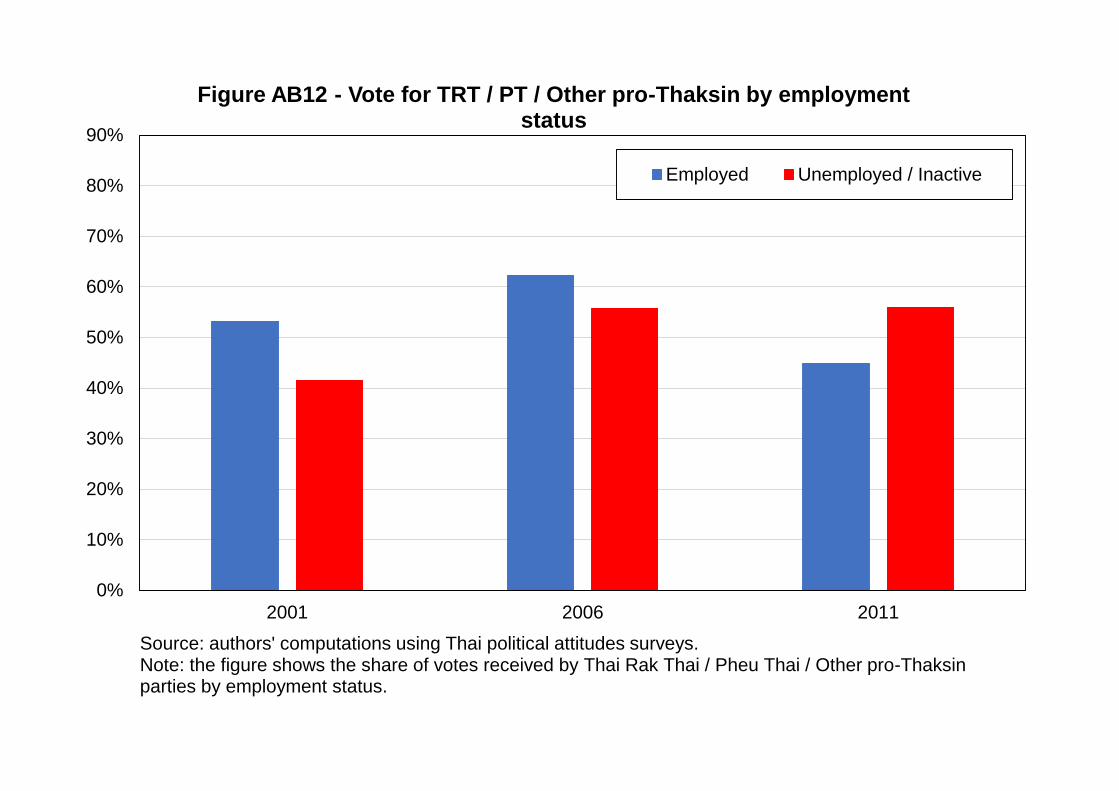
0%
10%
20%
30%
40%
50%
60%
70%
80%
90%
2001 2006 2011
Figure AB12 - Vote for TRT / PT / Other pro-Thaksin by employment status
Employed Unemployed / Inactive
Source: authors' computations using Thai political attitudes surveys.Note: the figure shows the share of votes received by Thai Rak Thai / Pheu Thai / Other pro-Thaksin parties by employment status.
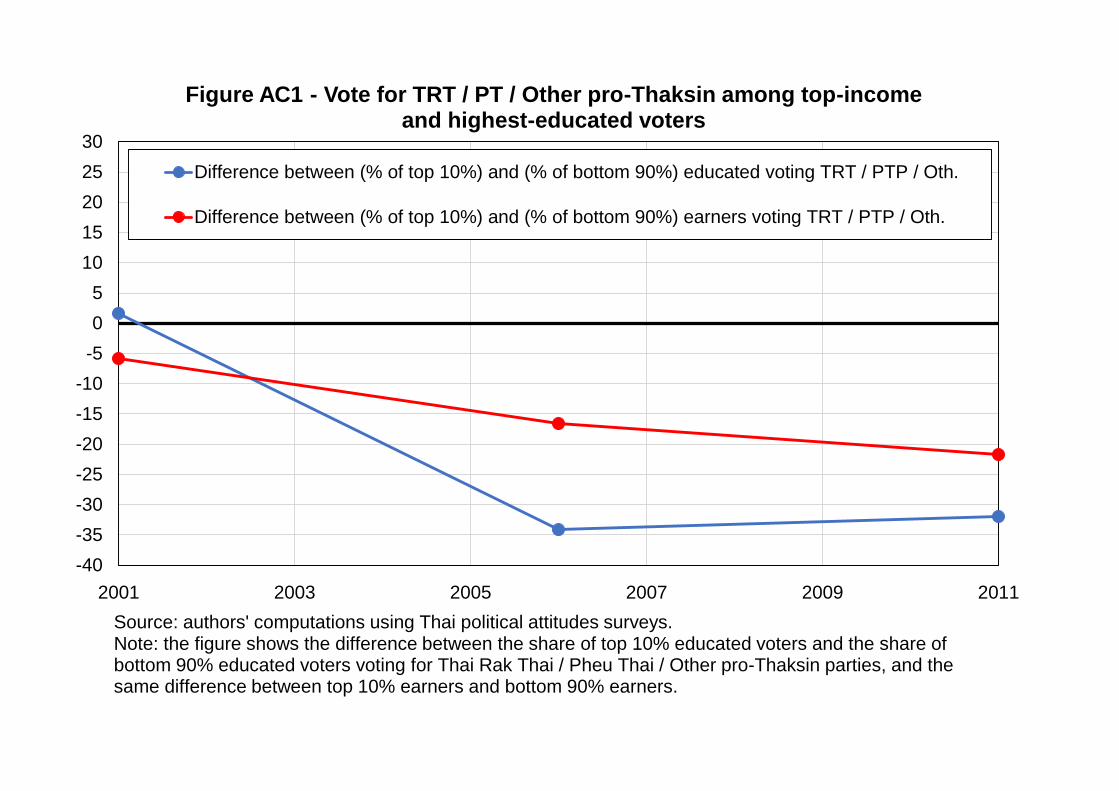
-40
-35
-30
-25
-20
-15
-10
-5
0
5
10
15
20
25
30
2001 2003 2005 2007 2009 2011
Figure AC1 - Vote for TRT / PT / Other pro-Thaksin among top-income and highest-educated voters
Difference between (% of top 10%) and (% of bottom 90%) educated voting TRT / PTP / Oth.
Difference between (% of top 10%) and (% of bottom 90%) earners voting TRT / PTP / Oth.
Source: authors' computations using Thai political attitudes surveys.Note: the figure shows the difference between the share of top 10% educated voters and the share of bottom 90% educated voters voting for Thai Rak Thai / Pheu Thai / Other pro-Thaksin parties, and the same difference between top 10% earners and bottom 90% earners.
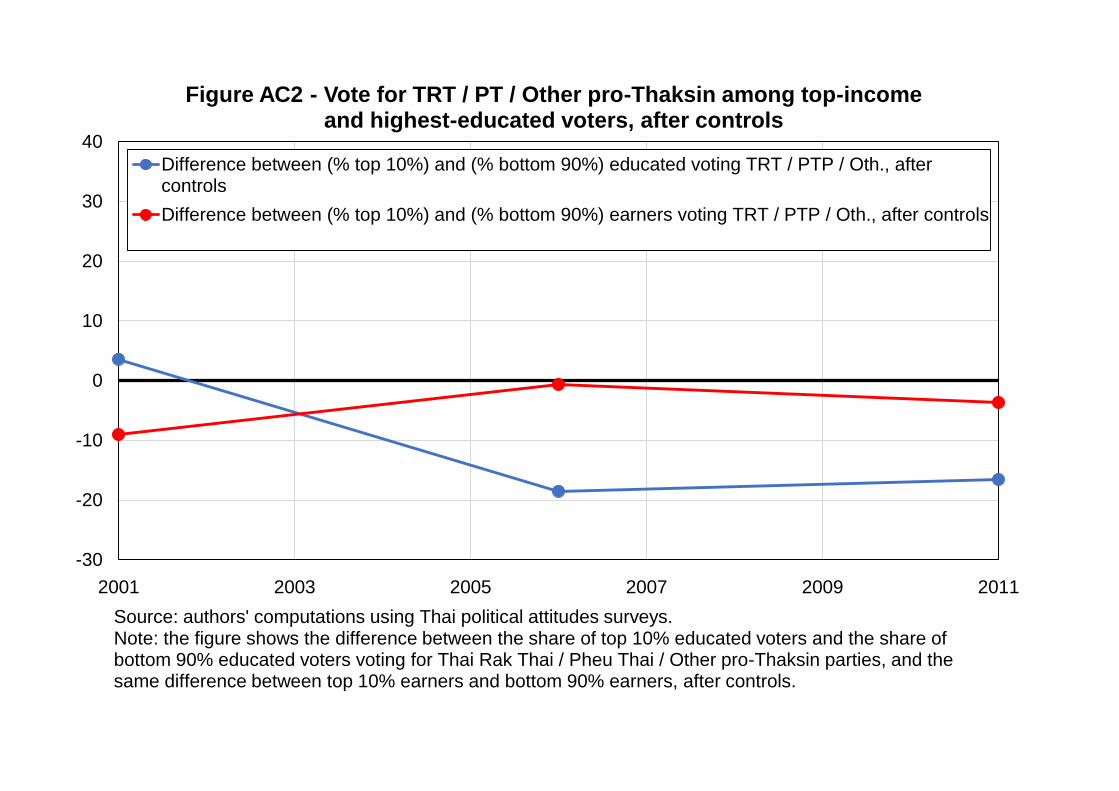
-30
-20
-10
0
10
20
30
40
2001 2003 2005 2007 2009 2011
Figure AC2 - Vote for TRT / PT / Other pro-Thaksin among top-income and highest-educated voters, after controls
Difference between (% top 10%) and (% bottom 90%) educated voting TRT / PTP / Oth., aftercontrols
Difference between (% top 10%) and (% bottom 90%) earners voting TRT / PTP / Oth., after controls
Source: authors' computations using Thai political attitudes surveys.Note: the figure shows the difference between the share of top 10% educated voters and the share of bottom 90% educated voters voting for Thai Rak Thai / Pheu Thai / Other pro-Thaksin parties, and the same difference between top 10% earners and bottom 90% earners, after controls.
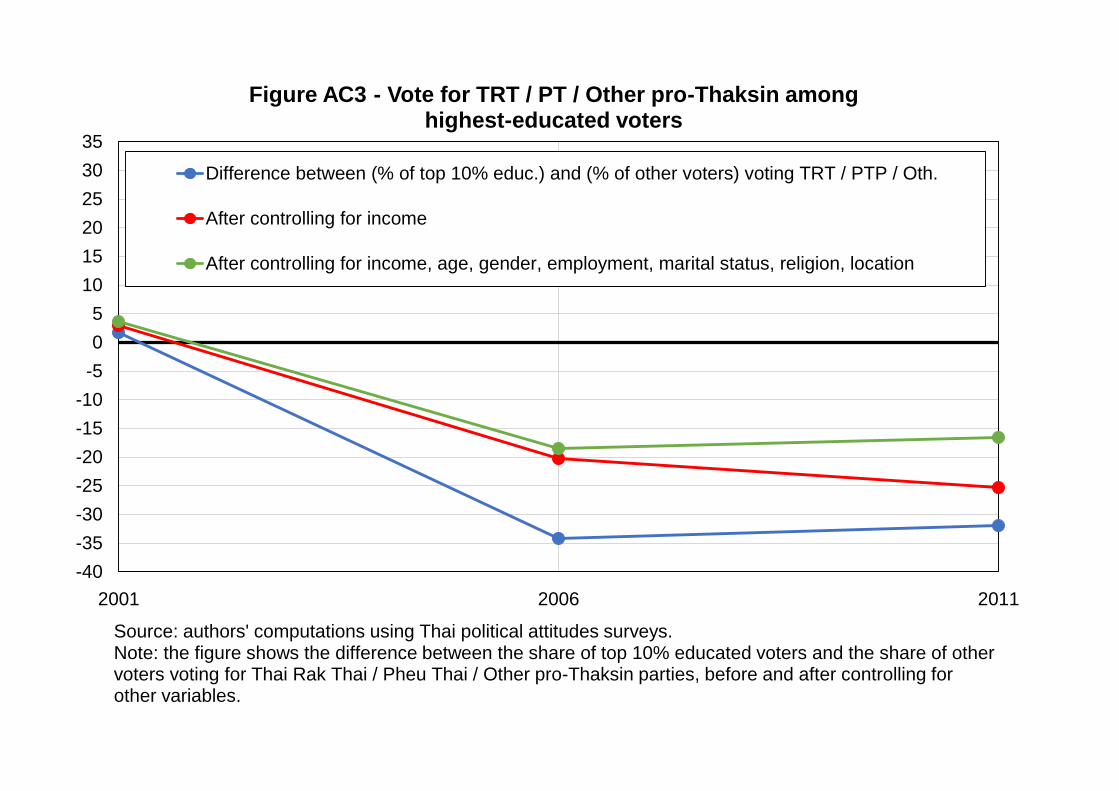
-40
-35
-30
-25
-20
-15
-10
-5
0
5
10
15
20
25
30
35
2001 2006 2011
Figure AC3 - Vote for TRT / PT / Other pro-Thaksin amonghighest-educated voters
Difference between (% of top 10% educ.) and (% of other voters) voting TRT / PTP / Oth.
After controlling for income
After controlling for income, age, gender, employment, marital status, religion, location
Source: authors' computations using Thai political attitudes surveys.Note: the figure shows the difference between the share of top 10% educated voters and the share of other voters voting for Thai Rak Thai / Pheu Thai / Other pro-Thaksin parties, before and after controlling for other variables.
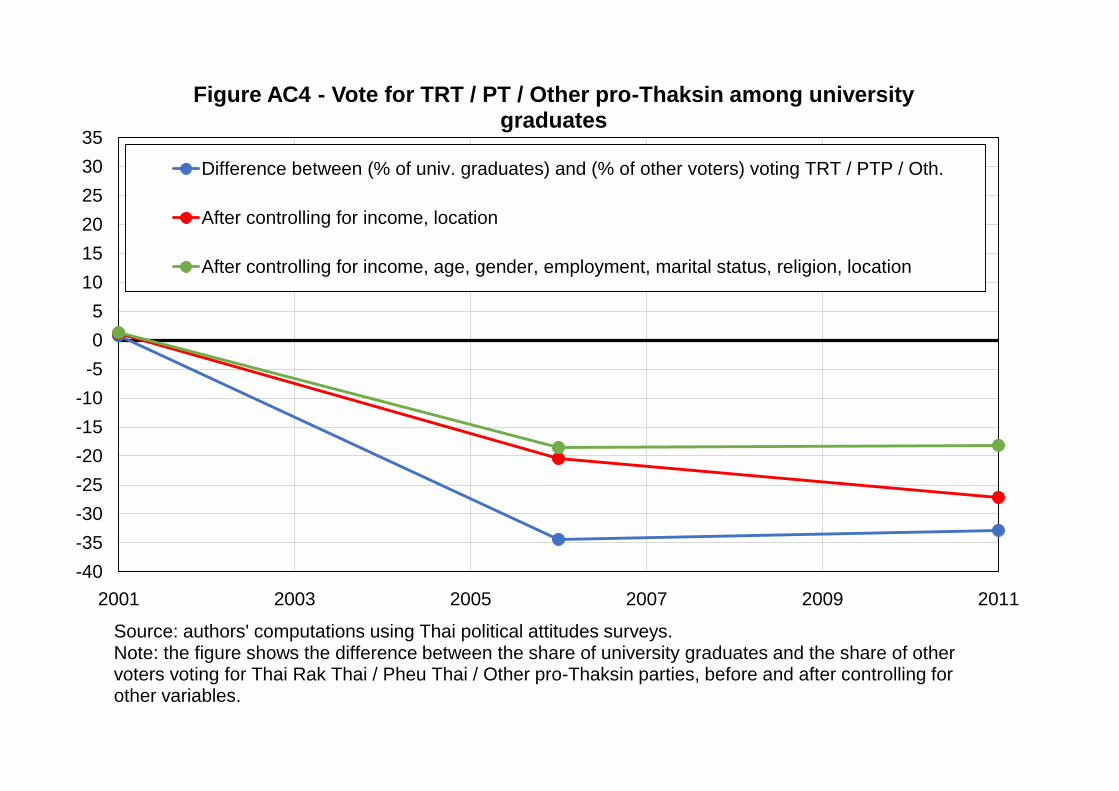
-40
-35
-30
-25
-20
-15
-10
-5
0
5
10
15
20
25
30
35
2001 2003 2005 2007 2009 2011
Figure AC4 - Vote for TRT / PT / Other pro-Thaksin among university graduates
Difference between (% of univ. graduates) and (% of other voters) voting TRT / PTP / Oth.
After controlling for income, location
After controlling for income, age, gender, employment, marital status, religion, location
Source: authors' computations using Thai political attitudes surveys.Note: the figure shows the difference between the share of university graduates and the share of other voters voting for Thai Rak Thai / Pheu Thai / Other pro-Thaksin parties, before and after controlling for other variables.

-10
-5
0
5
10
15
20
25
30
35
40
45
2001 2003 2005 2007 2009 2011
Figure AC5 - Vote for TRT / PT / Other pro-Thaksin among bottom 50% earners
Difference between (bottom 50% earners) and (top 50% earners) voting TRT / PTP / Oth.
After controlling for education, location
After controlling for education, age, gender, employment, marital status, religion, location
Source: authors' computations using Thai political attitudes surveys.Note: the figure shows the difference between the share of bottom 50% earners and the share of other voters voting for Thai Rak Thai / Pheu Thai / Other pro-Thaksin parties, before and after controlling for other variables.

-35
-30
-25
-20
-15
-10
-5
0
5
10
15
20
25
30
2006 2008 2010
Figure AC6 - Vote for TRT / PT / Other pro-Thaksin among top 10% earners
Difference between (% of top 10% earners) and (% of other voters) voting TRT / PTP / Oth.
After controlling for education, location
After controlling for education, age, gender, employment, marital status, religion, location
Source: authors' computations using Thai political attitudes surveys.Note: the figure shows the difference between the share of top 10% earners and the share of other voters voting for Thai Rak Thai / Pheu Thai / Other pro-Thaksin parties, before and after controlling for other variables.
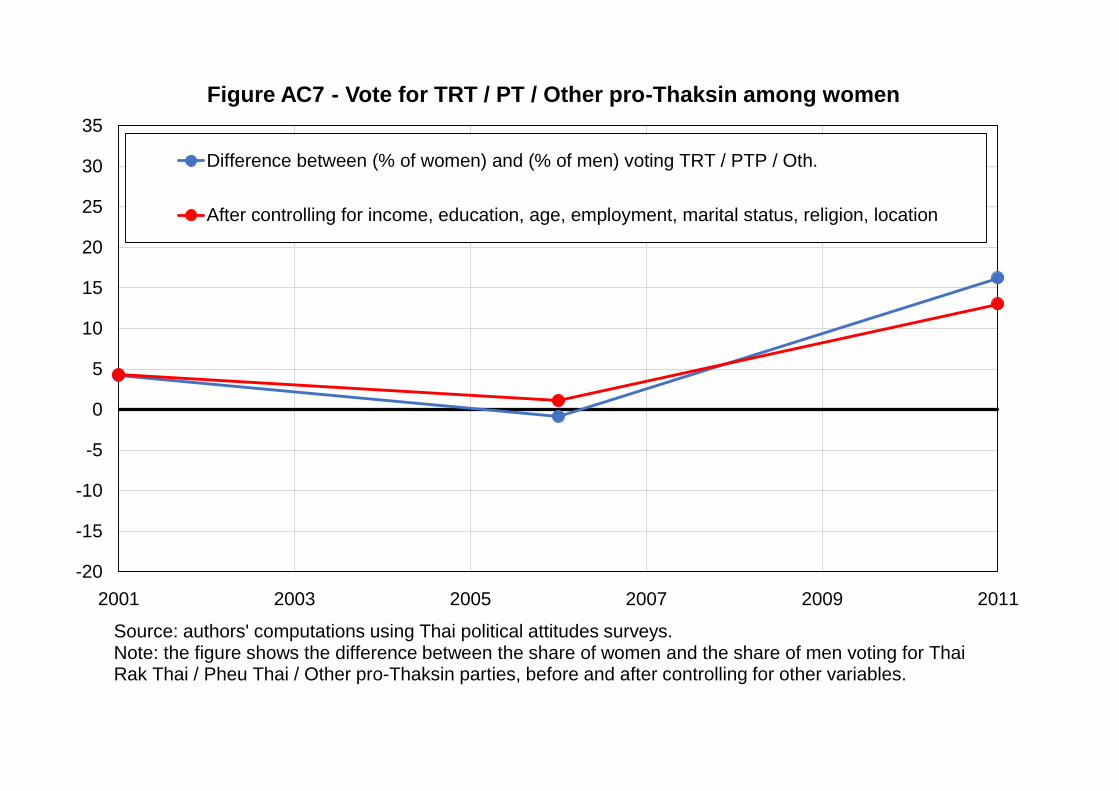
-20
-15
-10
-5
0
5
10
15
20
25
30
35
2001 2003 2005 2007 2009 2011
Figure AC7 - Vote for TRT / PT / Other pro-Thaksin among women
Difference between (% of women) and (% of men) voting TRT / PTP / Oth.
After controlling for income, education, age, employment, marital status, religion, location
Source: authors' computations using Thai political attitudes surveys.Note: the figure shows the difference between the share of women and the share of men voting for Thai Rak Thai / Pheu Thai / Other pro-Thaksin parties, before and after controlling for other variables.
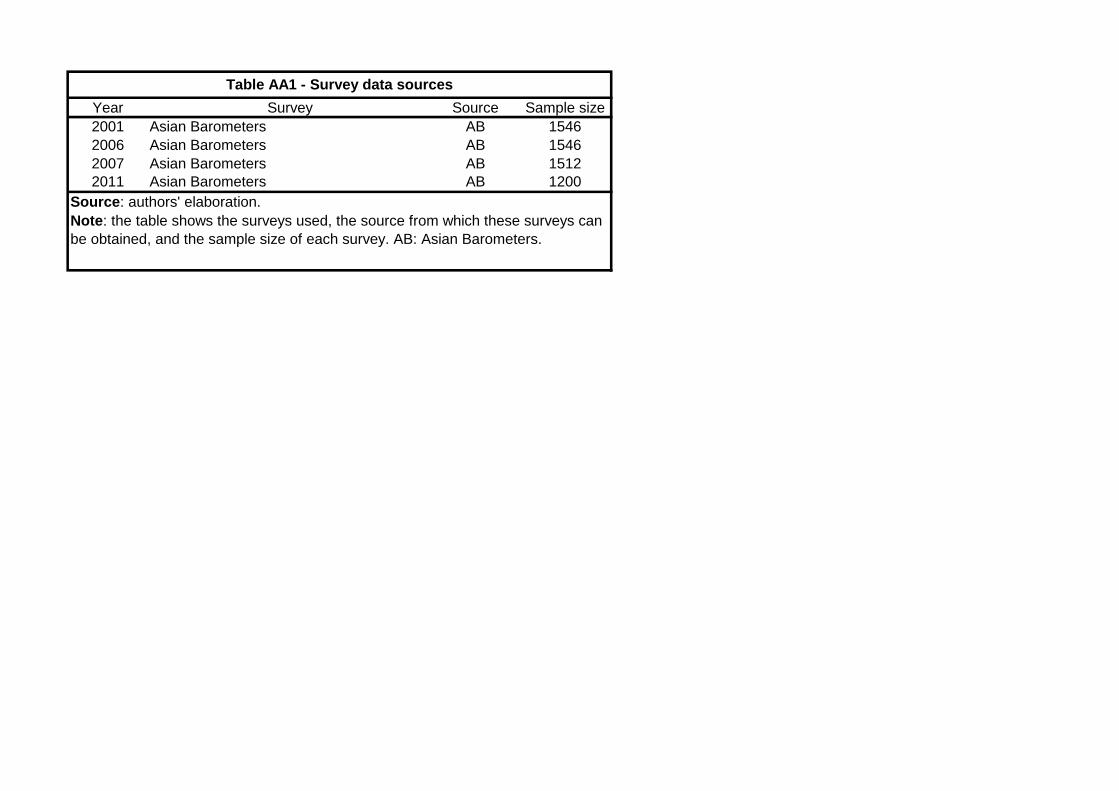
Year Survey Source Sample size
2001 Asian Barometers AB 1546
2006 Asian Barometers AB 1546
2007 Asian Barometers AB 1512
2011 Asian Barometers AB 1200
Table AA1 - Survey data sources
Source: authors' elaboration.
Note: the table shows the surveys used, the source from which these surveys can
be obtained, and the sample size of each survey. AB: Asian Barometers.

2001 2006 2007 2011
Education: Primary 83% 71% 75% 71%
Education: Secondary 9% 19% 18% 16%
Education: Tertiary 9% 9% 7% 13%
Age: 20-40 53% 45% 30% 33%
Age: 40-60 33% 41% 52% 52%
Age: 60+ 14% 14% 18% 14%
Gender: Man 49% 48% 48% 48%
Employment status: Employed 85% 85% 75% 89%
Employment status: Unemployed 0% 4% 6% 1%
Employment status: Inactive 15% 12% 19% 10%
Marital status: Married / Partner 72% 71% 80% 73%
Religion: Buddhist 94% 93% 96% 99%
Religion: Muslim / Other 6% 7% 4% 1%
Location: Rural areas 74% 80% 87% 80%
Region: Bangkok 8%
Region: Central 25%
Region: North 20%
Region: Northeast 34%
Region: South 13%
Table AA2 - Composition of the electorate
Source: authors' computations using Thai political attitudes surveys.
Note: the table shows descriptive statistics by year for selected available variables.
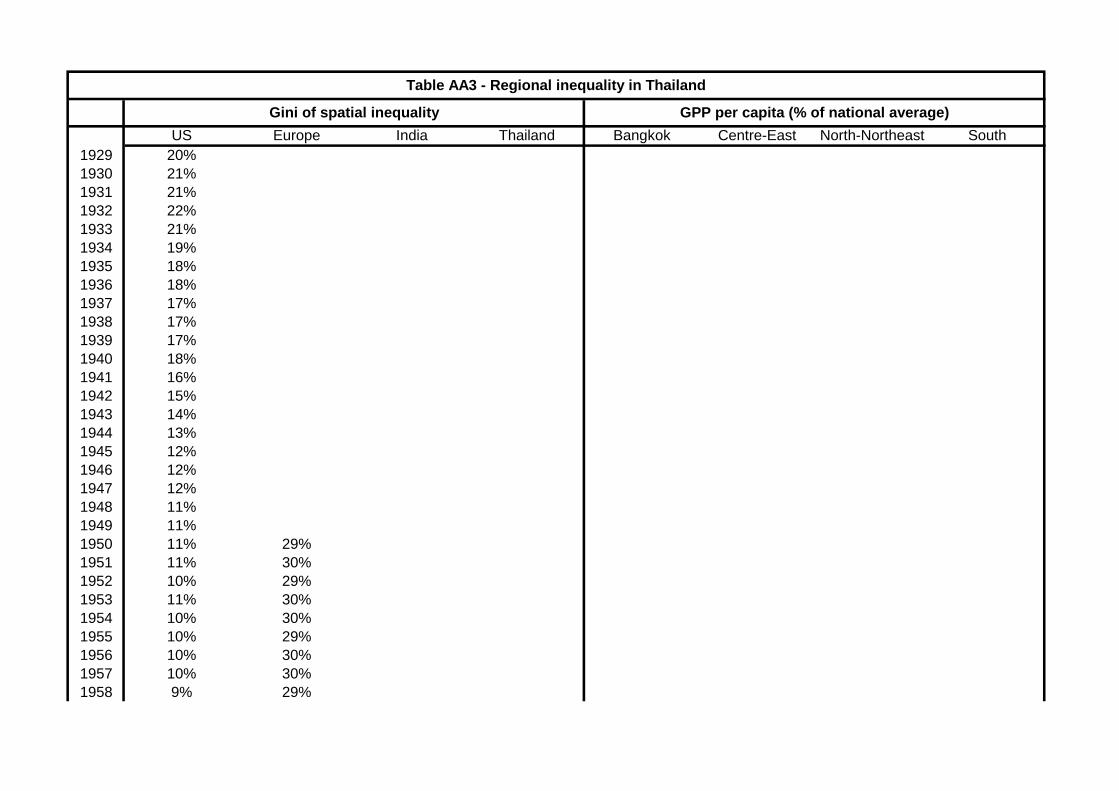
US Europe India Thailand Bangkok Centre-East North-Northeast South
1929 20%
1930 21%
1931 21%
1932 22%
1933 21%
1934 19%
1935 18%
1936 18%
1937 17%
1938 17%
1939 17%
1940 18%
1941 16%
1942 15%
1943 14%
1944 13%
1945 12%
1946 12%
1947 12%
1948 11%
1949 11%
1950 11% 29%
1951 11% 30%
1952 10% 29%
1953 11% 30%
1954 10% 30%
1955 10% 29%
1956 10% 30%
1957 10% 30%
1958 9% 29%
Table AA3 - Regional inequality in Thailand
Gini of spatial inequality GPP per capita (% of national average)

1959 9% 30%
1960 9% 29%
1961 9% 29% 40% 258% 149% 51%
1962 9% 29% 39% 236% 148% 53%
1963 9% 28% 38% 235% 144% 52%
1964 9% 29% 40% 249% 146% 49%
1965 8% 28% 40% 249% 145% 50%
1966 8% 28% 38% 243% 138% 53%
1967 8% 27% 41% 261% 140% 49%
1968 8% 27% 41% 270% 139% 49%
1969 8% 27% 41% 275% 136% 48%
1970 7% 28% 41% 283% 142% 49%
1971 7% 28% 44% 303% 143% 46%
1972 6% 27% 45% 307% 139% 45%
1973 6% 28% 45% 303% 139% 46%
1974 6% 27% 45% 304% 137% 46%
1975 6% 27% 44% 300% 140% 46%
1976 6% 27% 46% 301% 139% 43%
1977 7% 26% 49% 315% 142% 38%
1978 7% 26% 48% 313% 140% 39%
1979 7% 26% 49% 320% 134% 39%
1980 8% 27% 49% 323% 134% 39%
1981 9% 27% 50% 335% 133% 38%
1982 9% 27% 50% 327% 138% 39%
1983 8% 27% 49% 324% 141% 39%
1984 8% 27% 50% 328% 138% 39%
1985 8% 27% 50% 33% 325% 141% 39%
1986 8% 27% 51% 33% 327% 145% 37%
1987 8% 26% 52% 32% 334% 140% 36%
1988 8% 26% 53% 31% 336% 141% 35%
1989 8% 26% 53% 31% 340% 139% 34%
1990 8% 27% 54% 30% 349% 132% 33%
1991 7% 26% 54% 29% 341% 140% 32%
1992 7% 27% 54% 28% 336% 143% 32%
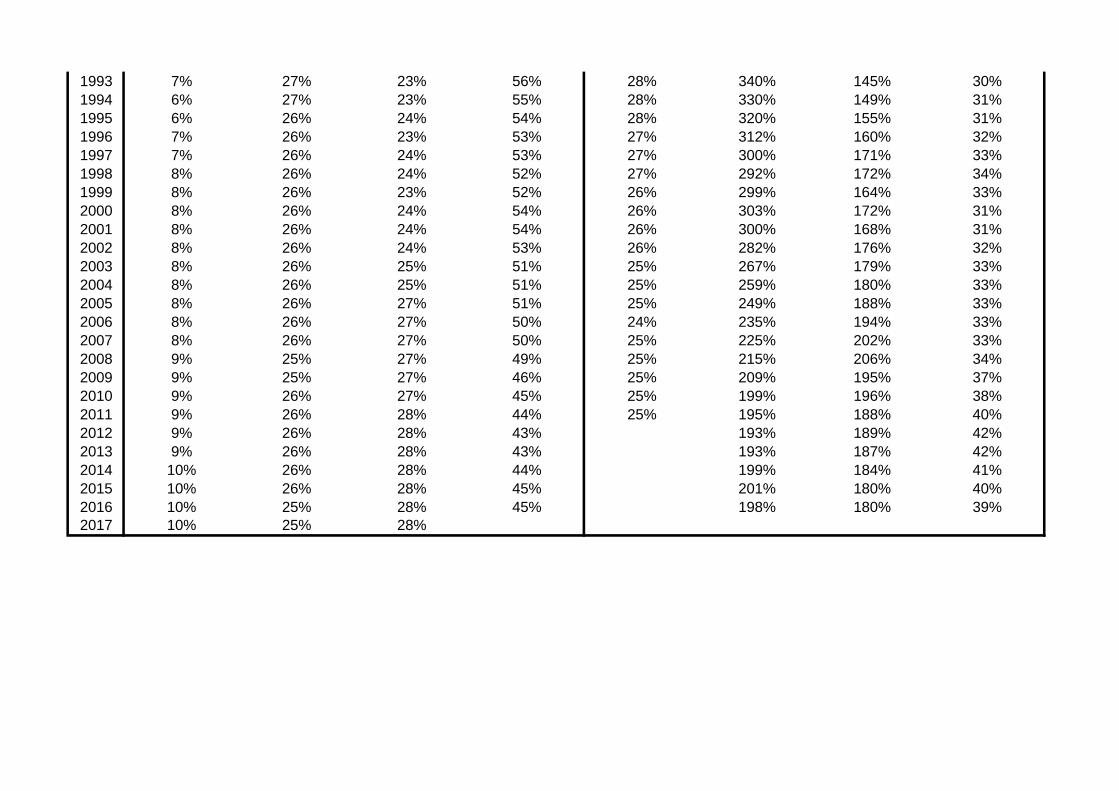
1993 7% 27% 23% 56% 28% 340% 145% 30%
1994 6% 27% 23% 55% 28% 330% 149% 31%
1995 6% 26% 24% 54% 28% 320% 155% 31%
1996 7% 26% 23% 53% 27% 312% 160% 32%
1997 7% 26% 24% 53% 27% 300% 171% 33%
1998 8% 26% 24% 52% 27% 292% 172% 34%
1999 8% 26% 23% 52% 26% 299% 164% 33%
2000 8% 26% 24% 54% 26% 303% 172% 31%
2001 8% 26% 24% 54% 26% 300% 168% 31%
2002 8% 26% 24% 53% 26% 282% 176% 32%
2003 8% 26% 25% 51% 25% 267% 179% 33%
2004 8% 26% 25% 51% 25% 259% 180% 33%
2005 8% 26% 27% 51% 25% 249% 188% 33%
2006 8% 26% 27% 50% 24% 235% 194% 33%
2007 8% 26% 27% 50% 25% 225% 202% 33%
2008 9% 25% 27% 49% 25% 215% 206% 34%
2009 9% 25% 27% 46% 25% 209% 195% 37%
2010 9% 26% 27% 45% 25% 199% 196% 38%
2011 9% 26% 28% 44% 25% 195% 188% 40%
2012 9% 26% 28% 43% 193% 189% 42%
2013 9% 26% 28% 43% 193% 187% 42%
2014 10% 26% 28% 44% 199% 184% 41%
2015 10% 26% 28% 45% 201% 180% 40%
2016 10% 25% 28% 45% 198% 180% 39%
2017 10% 25% 28%

0%
10%
20%
30%
40%
50%
60%
1992 1994 1996 1998 2000 2002 2004 2006 2008 2010 2012 2014 2016
Sh
are
of p
op
ula
r vo
te (
%)
Figure BA1 - Detailed election results in the Philippines, 1992-2016
Lakas-CMD Liberal Party
PMP / KMP PDP-Laban
Aksyon Nationalist People's Coalition
People's Reform Party
Source: authors' computations using official election results.Note: the figure shows the share of votes received by specific groups of parties in the first round of presidential elections.

0%
10%
20%
30%
40%
50%
60%
70%
80%
90%
100%
1992 1998 2004 2010
Figure BA2 - Composition of the electorate by age
20-39 40-59 60+
Source: authors' computations using Filipino political attitudes surveys.Note: the figure shows the composition of the electorate by age group.
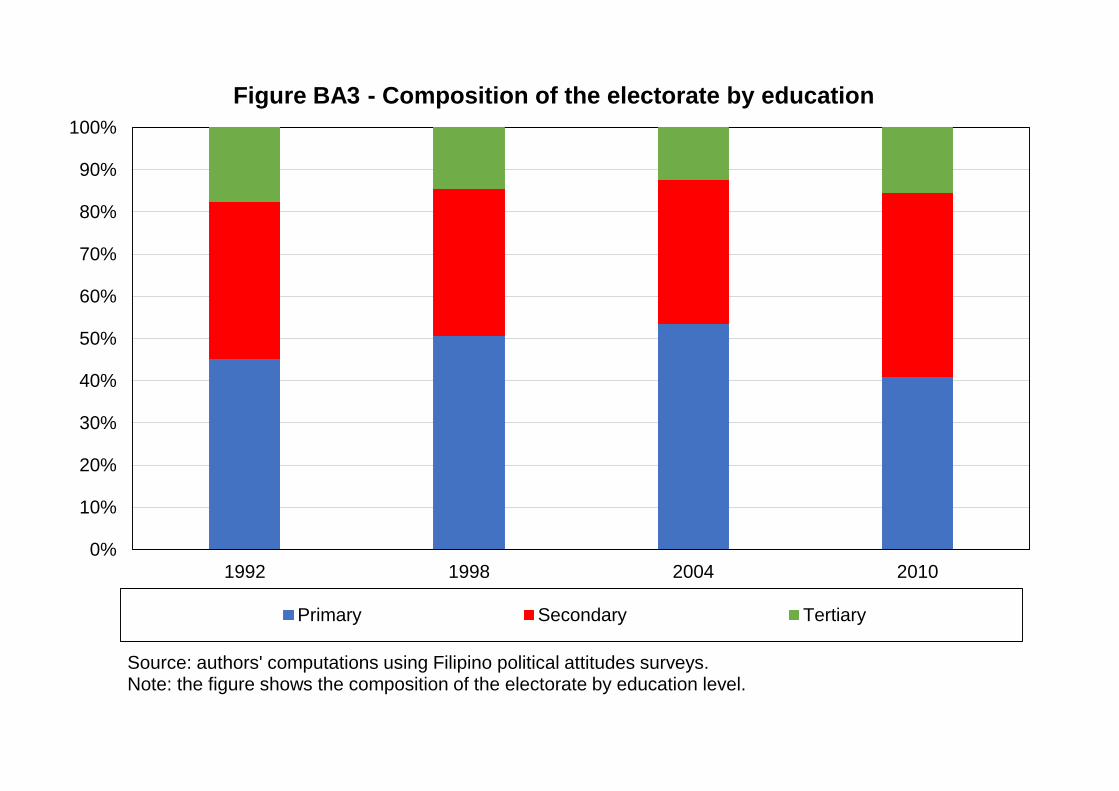
0%
10%
20%
30%
40%
50%
60%
70%
80%
90%
100%
1992 1998 2004 2010
Figure BA3 - Composition of the electorate by education
Primary Secondary Tertiary
Source: authors' computations using Filipino political attitudes surveys.Note: the figure shows the composition of the electorate by education level.
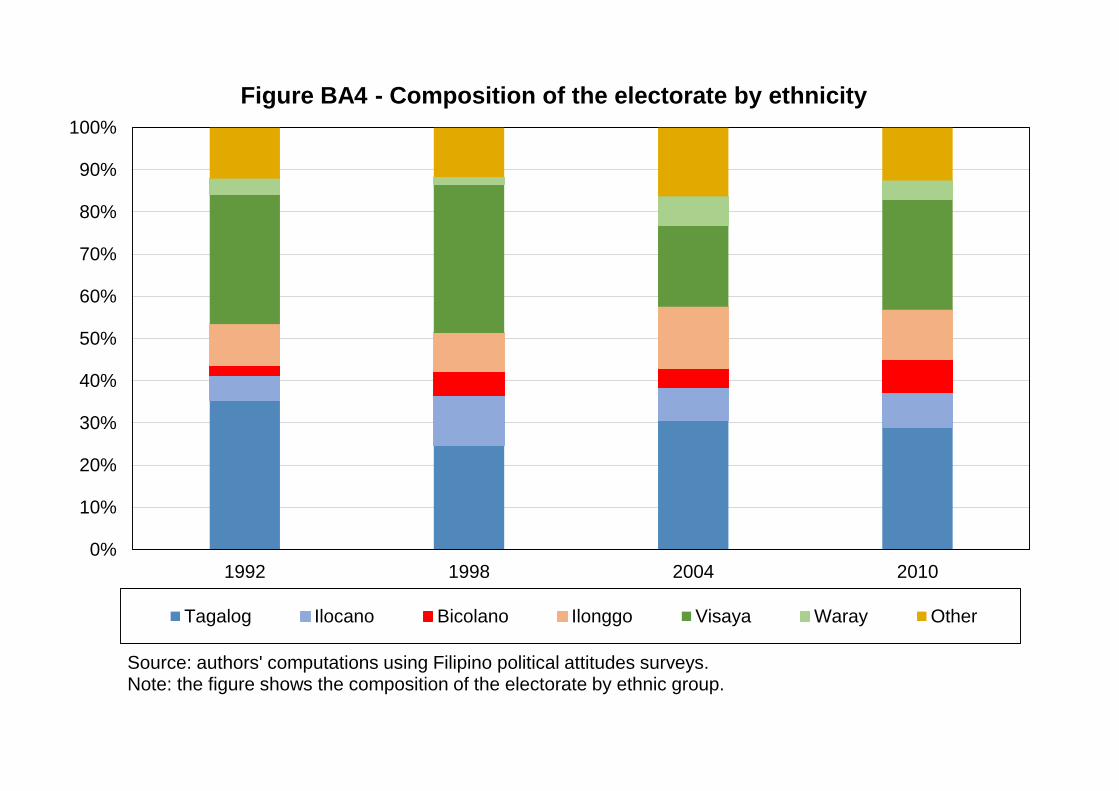
0%
10%
20%
30%
40%
50%
60%
70%
80%
90%
100%
1992 1998 2004 2010
Figure BA4 - Composition of the electorate by ethnicity
Tagalog Ilocano Bicolano Ilonggo Visaya Waray Other
Source: authors' computations using Filipino political attitudes surveys.Note: the figure shows the composition of the electorate by ethnic group.
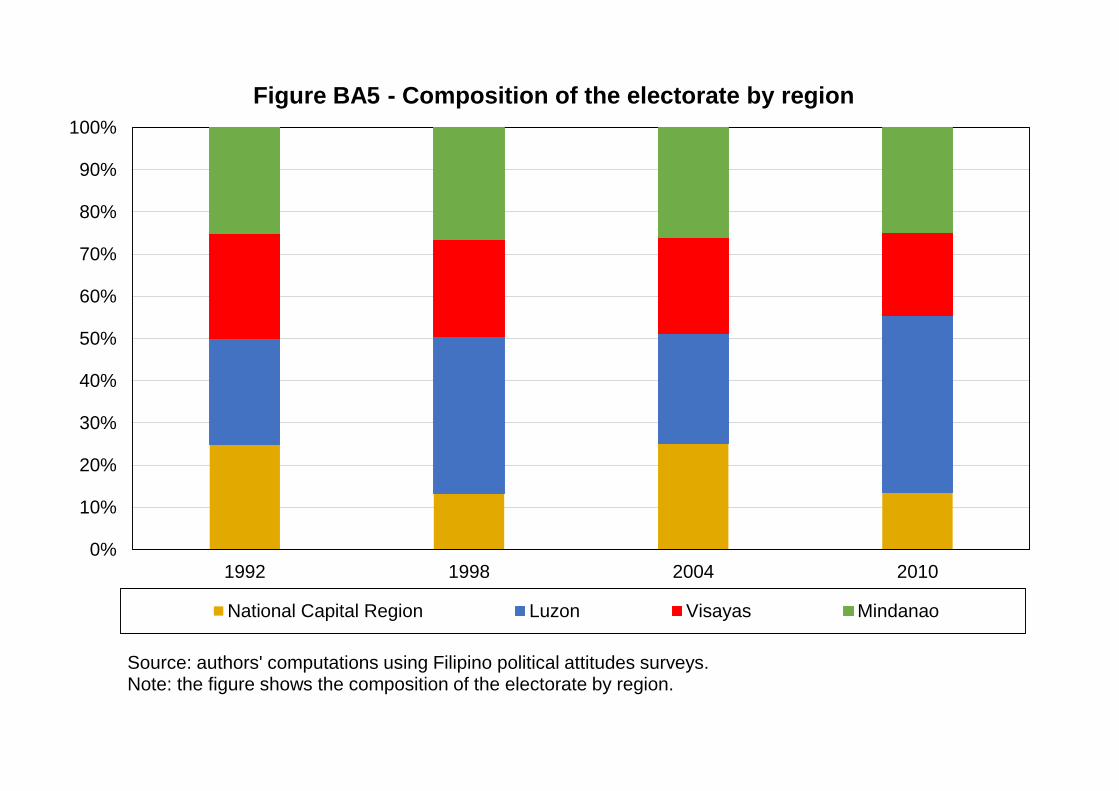
0%
10%
20%
30%
40%
50%
60%
70%
80%
90%
100%
1992 1998 2004 2010
Figure BA5 - Composition of the electorate by region
National Capital Region Luzon Visayas Mindanao
Source: authors' computations using Filipino political attitudes surveys.Note: the figure shows the composition of the electorate by region.
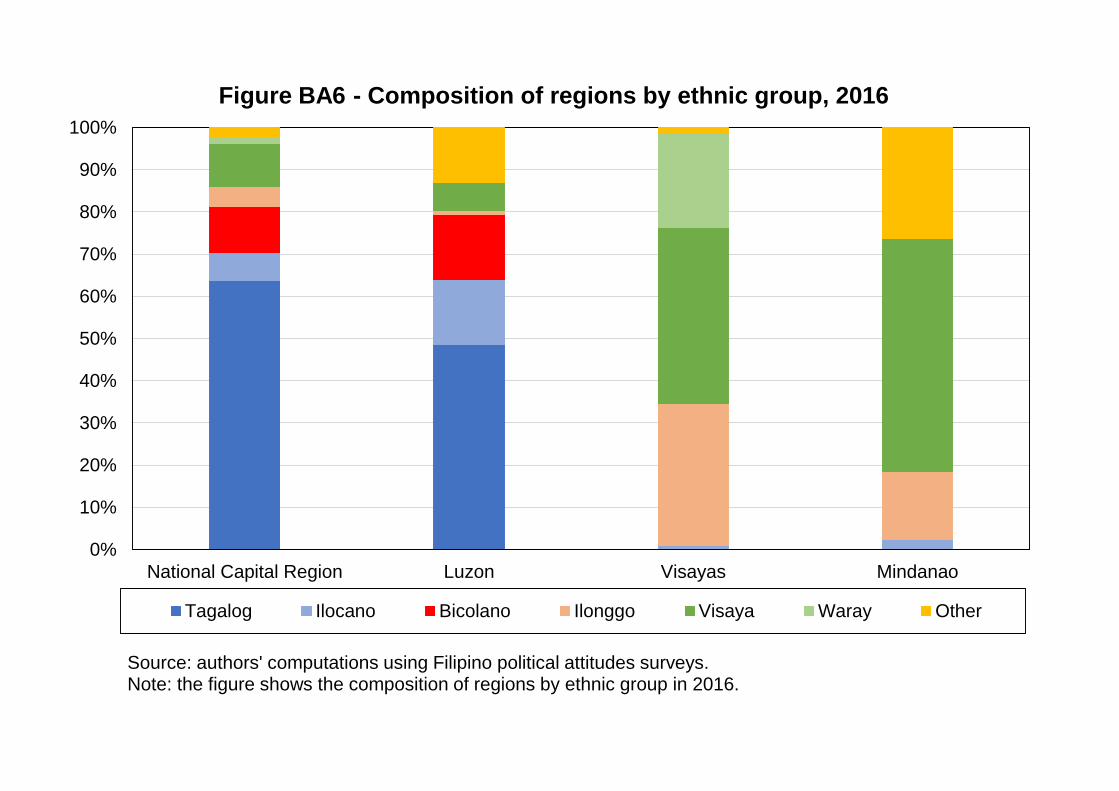
0%
10%
20%
30%
40%
50%
60%
70%
80%
90%
100%
National Capital Region Luzon Visayas Mindanao
Figure BA6 - Composition of regions by ethnic group, 2016
Tagalog Ilocano Bicolano Ilonggo Visaya Waray Other
Source: authors' computations using Filipino political attitudes surveys.Note: the figure shows the composition of regions by ethnic group in 2016.

0%
10%
20%
30%
40%
50%
60%
70%
80%
90%
100%
Q1 Q2 Q3 Q4 Q5
Figure BA7 - Composition of income quintiles by education, 2004
Primary Secondary Tertiary
Source: authors' computations using Filipino political attitudes surveys.Note: the figure shows the composition of income quintiles by education level in 2004.

0%
10%
20%
30%
40%
50%
60%
70%
80%
90%
100%
Q1 Q2 Q3 Q4 Q5
Figure BA8 - Composition of income quintiles by education, 2016
Primary Secondary Tertiary
Source: authors' computations using Filipino political attitudes surveys.Note: the figure shows the composition of income quintiles by education level in 2016.
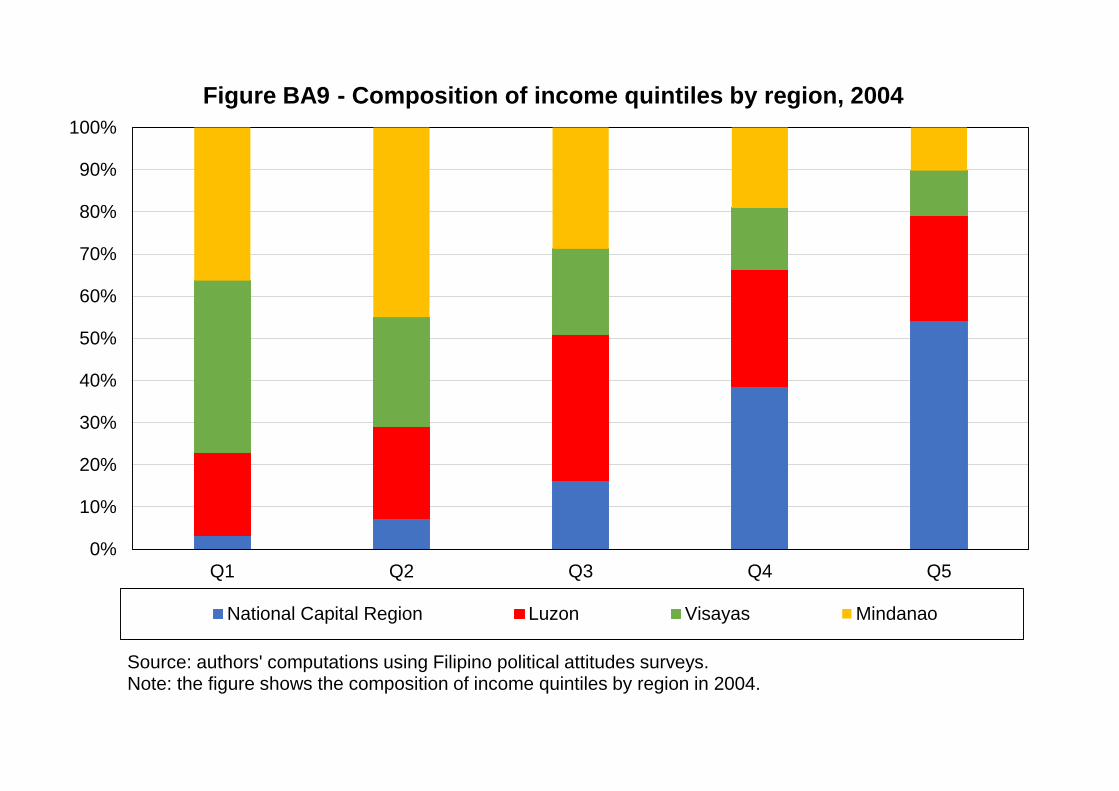
0%
10%
20%
30%
40%
50%
60%
70%
80%
90%
100%
Q1 Q2 Q3 Q4 Q5
Figure BA9 - Composition of income quintiles by region, 2004
National Capital Region Luzon Visayas Mindanao
Source: authors' computations using Filipino political attitudes surveys.Note: the figure shows the composition of income quintiles by region in 2004.

0%
10%
20%
30%
40%
50%
60%
70%
80%
90%
100%
Q1 Q2 Q3 Q4 Q5
Figure BA10 - Composition of income quintiles by region, 2016
National Capital Region Luzon Visayas Mindanao
Source: authors' computations using Filipino political attitudes surveys.Note: the figure shows the composition of income quintiles by region in 2016.

0%
10%
20%
30%
40%
50%
60%
70%
80%
90%
100%
Q1 Q2 Q3 Q4 Q5
Figure BA11 - Composition of income quintiles by location, 2004
Urban Rural
Source: authors' computations using Filipino political attitudes surveys.Note: the figure shows the composition of income quintiles by rural-urban location in 2004.
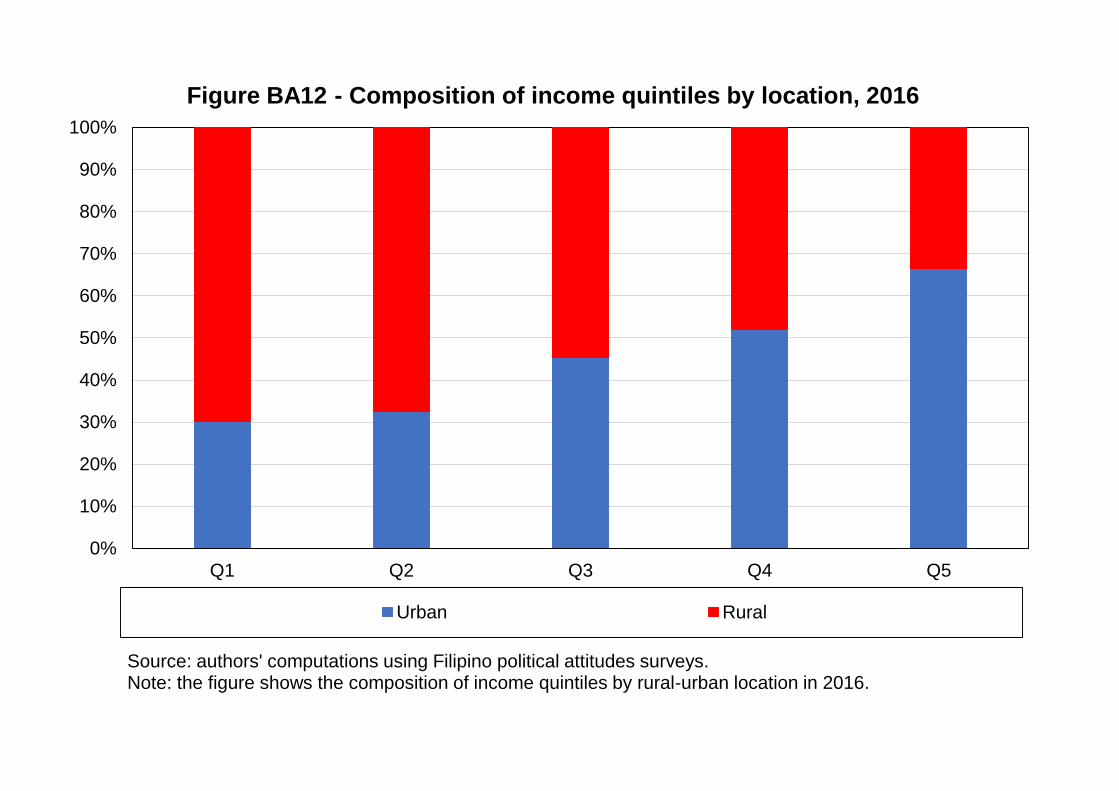
0%
10%
20%
30%
40%
50%
60%
70%
80%
90%
100%
Q1 Q2 Q3 Q4 Q5
Figure BA12 - Composition of income quintiles by location, 2016
Urban Rural
Source: authors' computations using Filipino political attitudes surveys.Note: the figure shows the composition of income quintiles by rural-urban location in 2016.
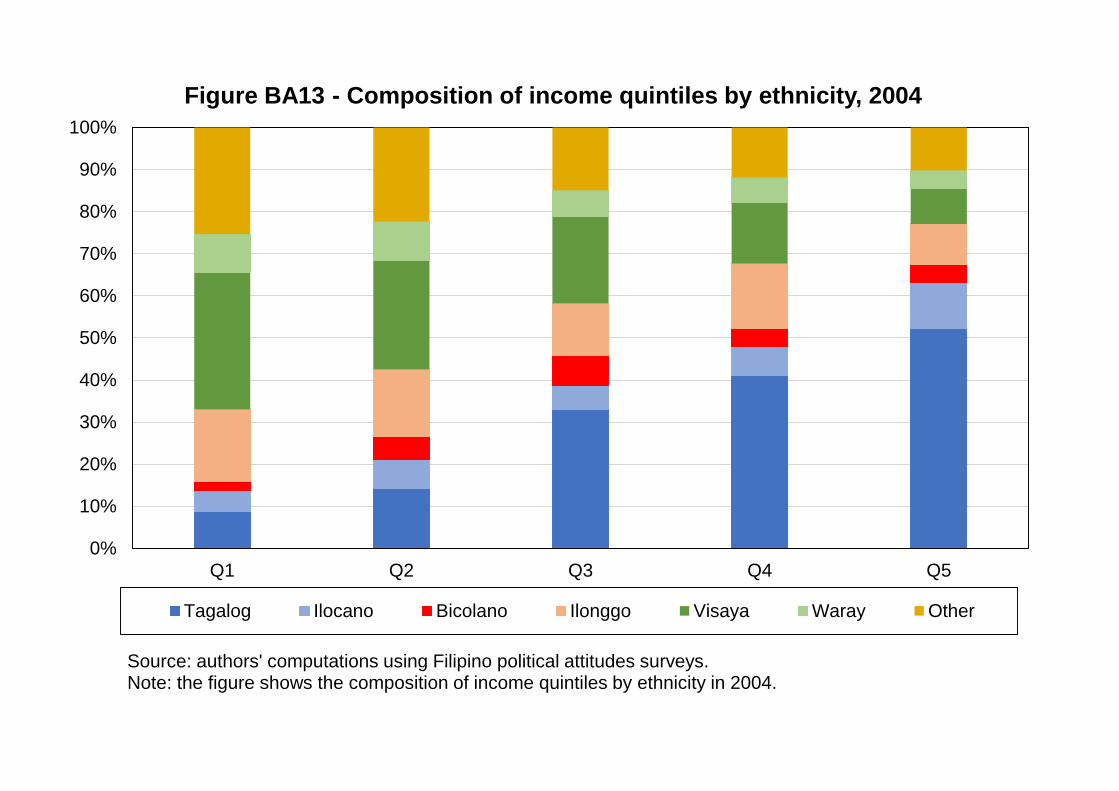
0%
10%
20%
30%
40%
50%
60%
70%
80%
90%
100%
Q1 Q2 Q3 Q4 Q5
Figure BA13 - Composition of income quintiles by ethnicity, 2004
Tagalog Ilocano Bicolano Ilonggo Visaya Waray Other
Source: authors' computations using Filipino political attitudes surveys.Note: the figure shows the composition of income quintiles by ethnicity in 2004.

0%
10%
20%
30%
40%
50%
60%
70%
80%
90%
100%
Q1 Q2 Q3 Q4 Q5
Figure BA14 - Composition of income quintiles by ethnicity, 2016
Tagalog Ilocano Bicolano Ilonggo Visaya Waray Other
Source: authors' computations using Filipino political attitudes surveys.Note: the figure shows the composition of income quintiles by ethnicity in 2016.

0%
10%
20%
30%
40%
50%
60%
70%
80%
90%
100%
Q1 Q2 Q3 Q4 Q5
Figure BA9 - Composition of income quintiles by religion, 2004
Catholic Protestant Muslim
Source: authors' computations using Filipino political attitudes surveys.Note: the figure shows the composition of income quintiles by religious affiliation in 2004.

0%
10%
20%
30%
40%
50%
60%
70%
80%
90%
100%
Q1 Q2 Q3 Q4 Q5
Figure BA9 - Composition of income quintiles by religion, 2016
Catholic Protestant Muslim
Source: authors' computations using Filipino political attitudes surveys.Note: the figure shows the composition of income quintiles by religious affiliation in 2016.
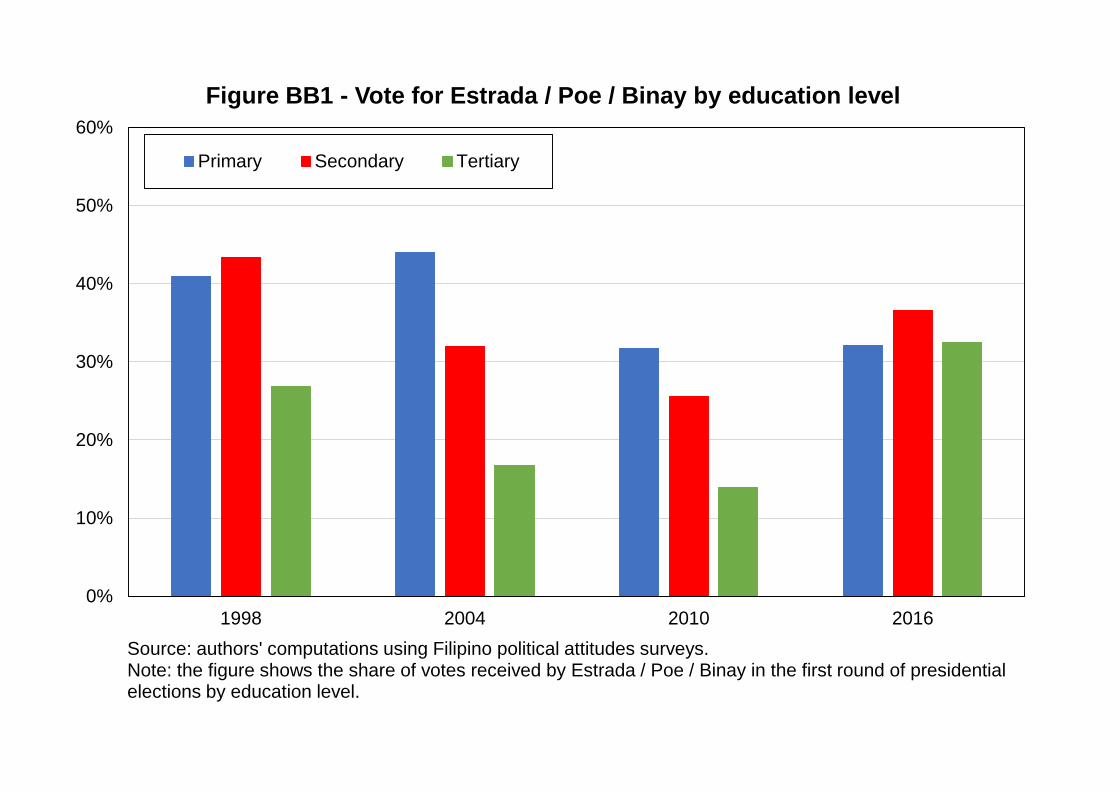
0%
10%
20%
30%
40%
50%
60%
1998 2004 2010 2016
Figure BB1 - Vote for Estrada / Poe / Binay by education level
Primary Secondary Tertiary
Source: authors' computations using Filipino political attitudes surveys.Note: the figure shows the share of votes received by Estrada / Poe / Binay in the first round of presidential elections by education level.

0%
10%
20%
30%
40%
50%
60%
1998 2004 2010 2016
Figure BB2 - Vote for Estrada / Poe / Binay by education group
Bottom 50% Middle 40% Top 10%
Source: authors' computations using Filipino political attitudes surveys.Note: the figure shows the share of votes received by Estrada / Poe / Binay in the first round of presidential elections by education group.
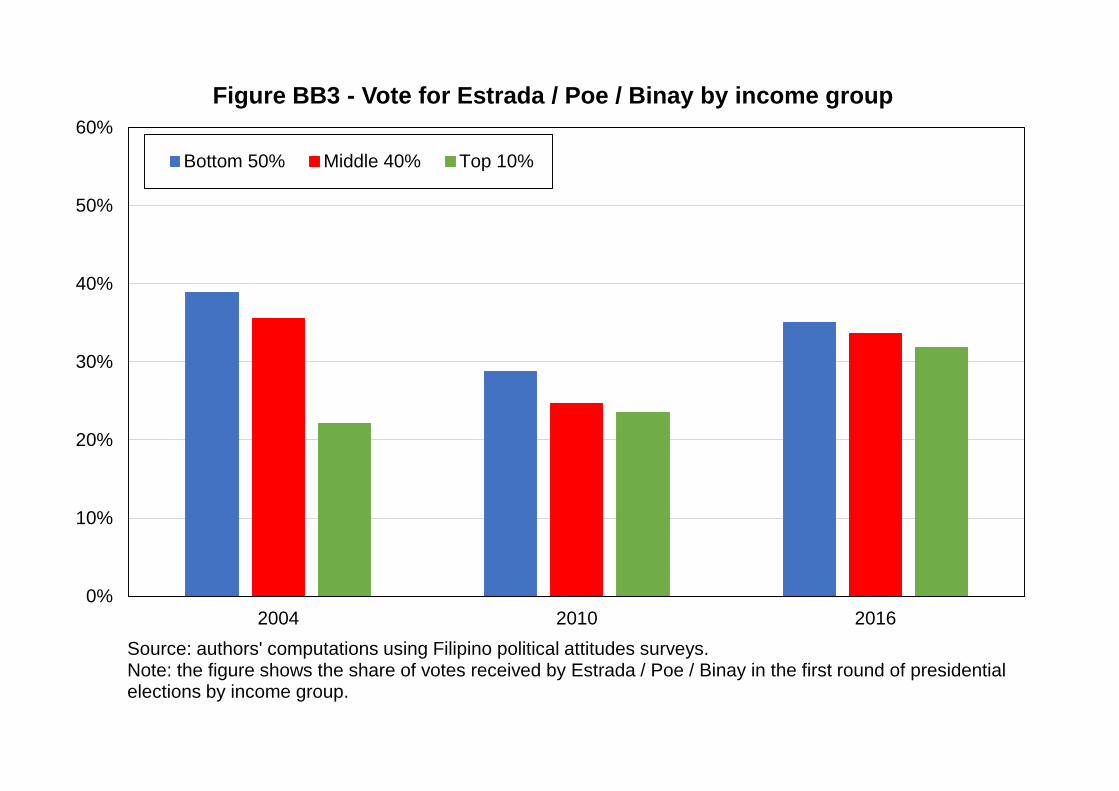
0%
10%
20%
30%
40%
50%
60%
2004 2010 2016
Figure BB3 - Vote for Estrada / Poe / Binay by income group
Bottom 50% Middle 40% Top 10%
Source: authors' computations using Filipino political attitudes surveys.Note: the figure shows the share of votes received by Estrada / Poe / Binay in the first round of presidential elections by income group.

0%
10%
20%
30%
40%
50%
60%
1998 2004 2010 2016
Figure BB4 - Vote for Estrada / Poe / Binay by region
Visayas Mindanao Luzon National Capital Region
Source: authors' computations using Filipino political attitudes surveys.Note: the figure shows the share of votes received by Estrada / Poe / Binay in the first round of presidential elections by region.
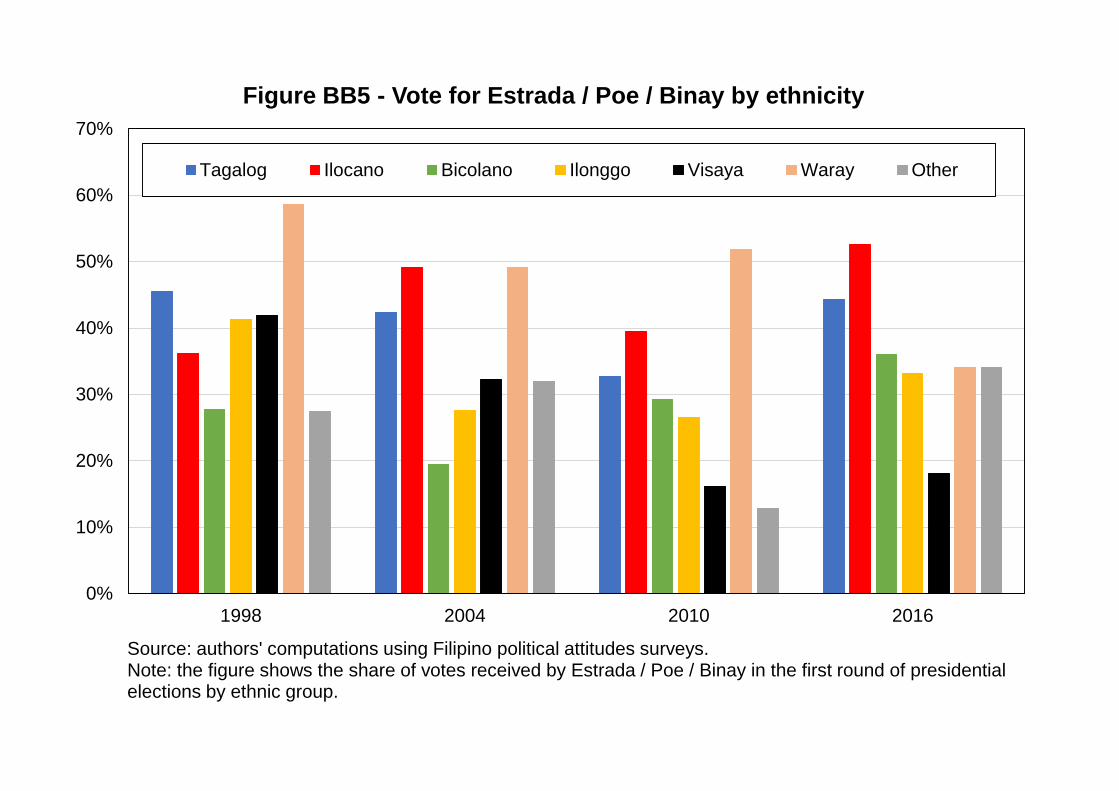
0%
10%
20%
30%
40%
50%
60%
70%
1998 2004 2010 2016
Figure BB5 - Vote for Estrada / Poe / Binay by ethnicity
Tagalog Ilocano Bicolano Ilonggo Visaya Waray Other
Source: authors' computations using Filipino political attitudes surveys.Note: the figure shows the share of votes received by Estrada / Poe / Binay in the first round of presidential elections by ethnic group.

0%
10%
20%
30%
40%
50%
60%
70%
1998 2004 2010
Figure BB6 - Vote for Estrada / Poe / Binay by religion
Catholic Protestant Muslim
Source: authors' computations using Filipino political attitudes surveys.Note: the figure shows the share of votes received by Estrada / Poe / Binay in the first round of presidential elections by religion.

-30
-25
-20
-15
-10
-5
0
5
10
15
20
1998 2000 2002 2004 2006 2008 2010 2012 2014 2016
Figure BC1 - Support for Estrada / Poe / Binay amonghighest-educated voters
Difference between (% of top 10% educated) and (% of other voters) voting Estrada / Poe / Binay
After controlling for region, ethnicity, employment status, age, gender, religion, religious attendance
After controlling for region, ethnicity, employment status, age, gender, religion, religious attendance,income, rural/urban
Source: authors' computations using Filipino political attitudes surveys.Note: the figure shows the difference between the share of top 10% educated voters voting Estrada / Poe / Binay and the share of bottom 90% educated voters voting Estrada / Poe / Binay in the first round of presidential elections, before and after controls.
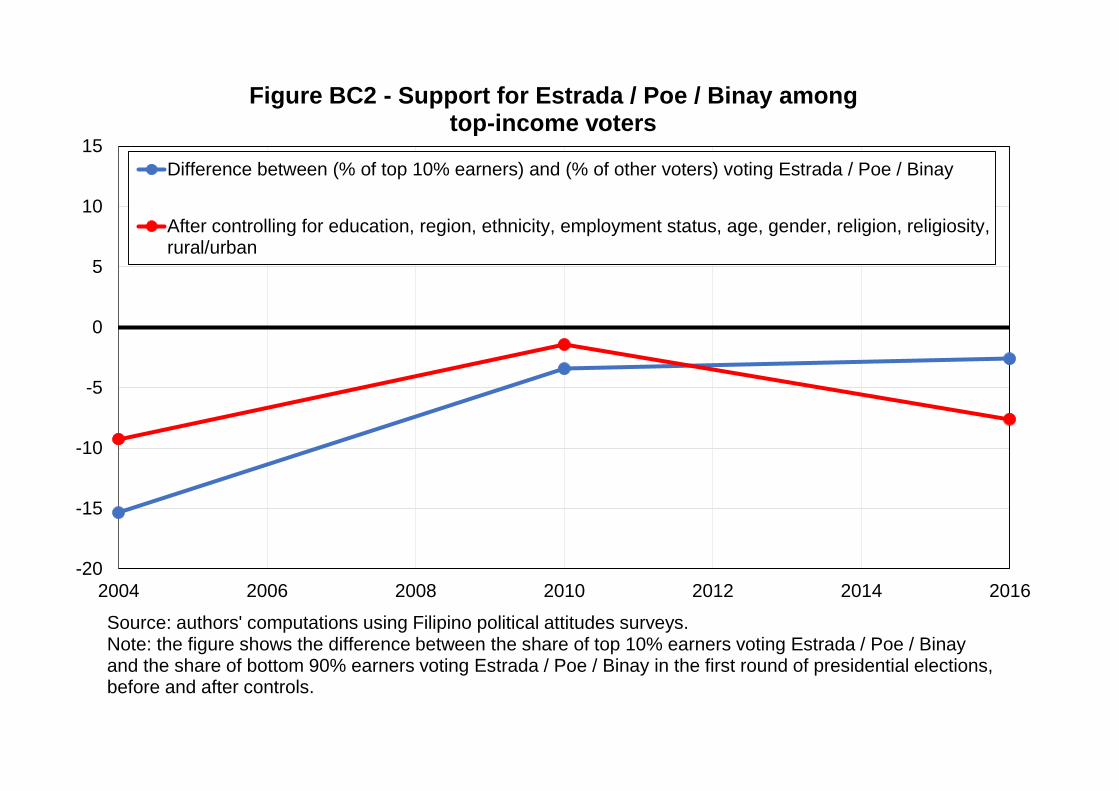
-20
-15
-10
-5
0
5
10
15
2004 2006 2008 2010 2012 2014 2016
Figure BC2 - Support for Estrada / Poe / Binay amongtop-income voters
Difference between (% of top 10% earners) and (% of other voters) voting Estrada / Poe / Binay
After controlling for education, region, ethnicity, employment status, age, gender, religion, religiosity,rural/urban
Source: authors' computations using Filipino political attitudes surveys.Note: the figure shows the difference between the share of top 10% earners voting Estrada / Poe / Binay and the share of bottom 90% earners voting Estrada / Poe / Binay in the first round of presidential elections, before and after controls.
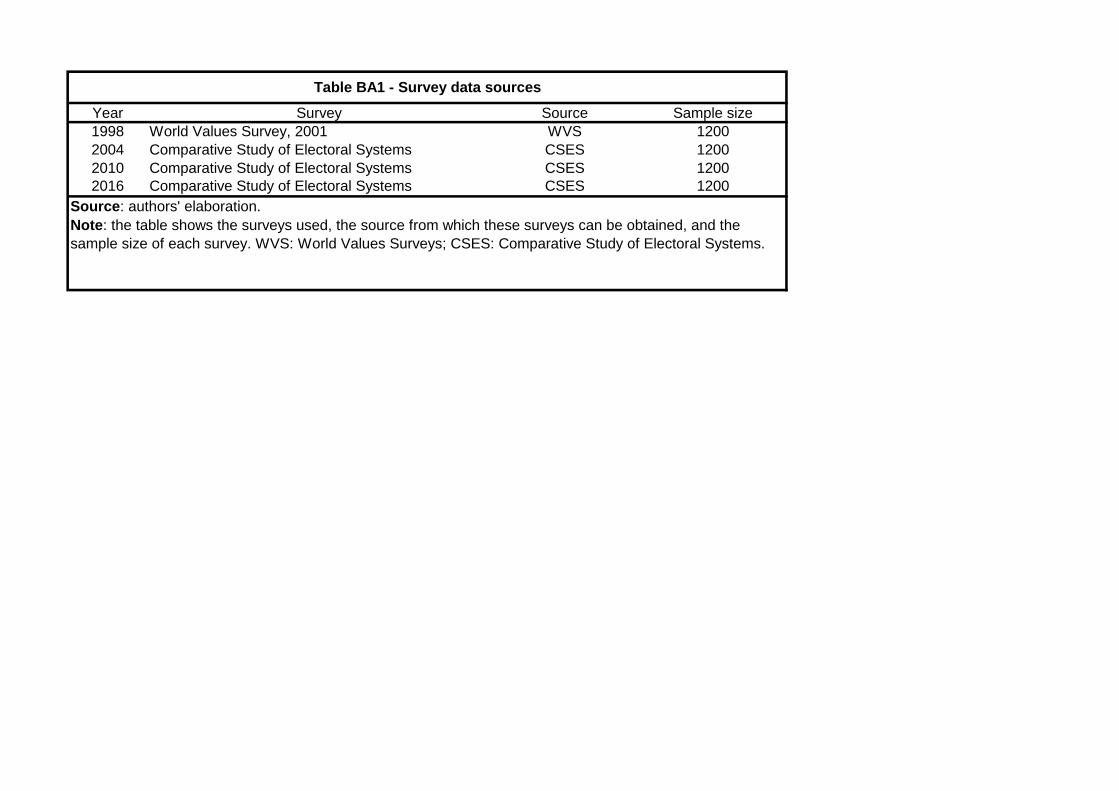
Year Survey Source Sample size
1998 World Values Survey, 2001 WVS 1200
2004 Comparative Study of Electoral Systems CSES 1200
2010 Comparative Study of Electoral Systems CSES 1200
2016 Comparative Study of Electoral Systems CSES 1200
Table BA1 - Survey data sources
Source: authors' elaboration.
Note: the table shows the surveys used, the source from which these surveys can be obtained, and the
sample size of each survey. WVS: World Values Surveys; CSES: Comparative Study of Electoral Systems.
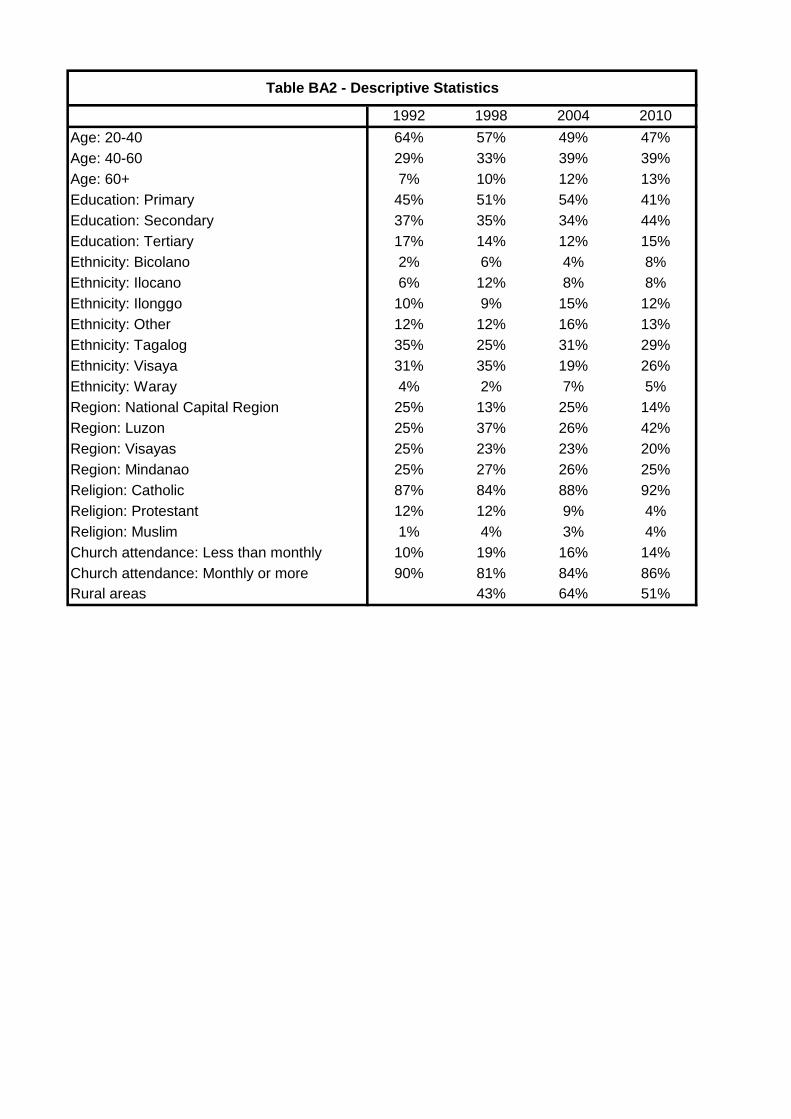
1992 1998 2004 2010
Age: 20-40 64% 57% 49% 47%
Age: 40-60 29% 33% 39% 39%
Age: 60+ 7% 10% 12% 13%
Education: Primary 45% 51% 54% 41%
Education: Secondary 37% 35% 34% 44%
Education: Tertiary 17% 14% 12% 15%
Ethnicity: Bicolano 2% 6% 4% 8%
Ethnicity: Ilocano 6% 12% 8% 8%
Ethnicity: Ilonggo 10% 9% 15% 12%
Ethnicity: Other 12% 12% 16% 13%
Ethnicity: Tagalog 35% 25% 31% 29%
Ethnicity: Visaya 31% 35% 19% 26%
Ethnicity: Waray 4% 2% 7% 5%
Region: National Capital Region 25% 13% 25% 14%
Region: Luzon 25% 37% 26% 42%
Region: Visayas 25% 23% 23% 20%
Region: Mindanao 25% 27% 26% 25%
Religion: Catholic 87% 84% 88% 92%
Religion: Protestant 12% 12% 9% 4%
Religion: Muslim 1% 4% 3% 4%
Church attendance: Less than monthly 10% 19% 16% 14%
Church attendance: Monthly or more 90% 81% 84% 86%
Rural areas 43% 64% 51%
Table BA2 - Descriptive Statistics

PMP Lakas Laban Aksyon Kilusang Liberal NPC PROMDI
Education
Primary 41% 13% 4% 16% 2% 9% 2% 12%
Secondary 43% 15% 4% 12% 2% 8% 1% 13%
Tertiary 27% 29% 5% 11% 1% 10% 2% 13%
Bicolano 28% 3% 3% 47% 1% 14% 4% 0%
Ethnicity
Ilocano 36% 12% 4% 26% 4% 9% 1% 6%
Ilonggo 41% 24% 3% 11% 2% 5% 2% 9%
Other 27% 26% 6% 17% 1% 14% 2% 6%
Tagalog 45% 15% 3% 12% 3% 10% 1% 7%
Visaya 42% 14% 4% 6% 1% 5% 1% 25%
Waray 59% 16% 8% 0% 1% 14% 0% 0%
Region
NCR 44% 9% 4% 21% 3% 12% 2% 3%
Luzon 38% 14% 4% 20% 3% 11% 2% 7%
Visayas 31% 16% 3% 7% 1% 7% 2% 31%
Mindanao 48% 21% 5% 8% 1% 6% 1% 9%
Religion
Catholic 41% 15% 4% 14% 2% 8% 1% 13%
Protestant 36% 13% 4% 12% 3% 13% 3% 14%
Muslim 20% 54% 3% 9% 1% 12% 0% 0%
Location
Urban 40% 15% 4% 12% 2% 9% 1% 14%
Rural 39% 17% 4% 16% 2% 9% 1% 10%
Age
20-40 42% 15% 5% 15% 2% 4% 1% 14%
40-60 37% 17% 3% 13% 2% 15% 2% 9%
60+ 39% 17% 2% 11% 1% 13% 1% 14%
Gender
Woman 41% 13% 4% 15% 2% 9% 1% 14%
Man 39% 19% 4% 13% 2% 8% 2% 11%
Table BA3 - Structure of the vote in 1998
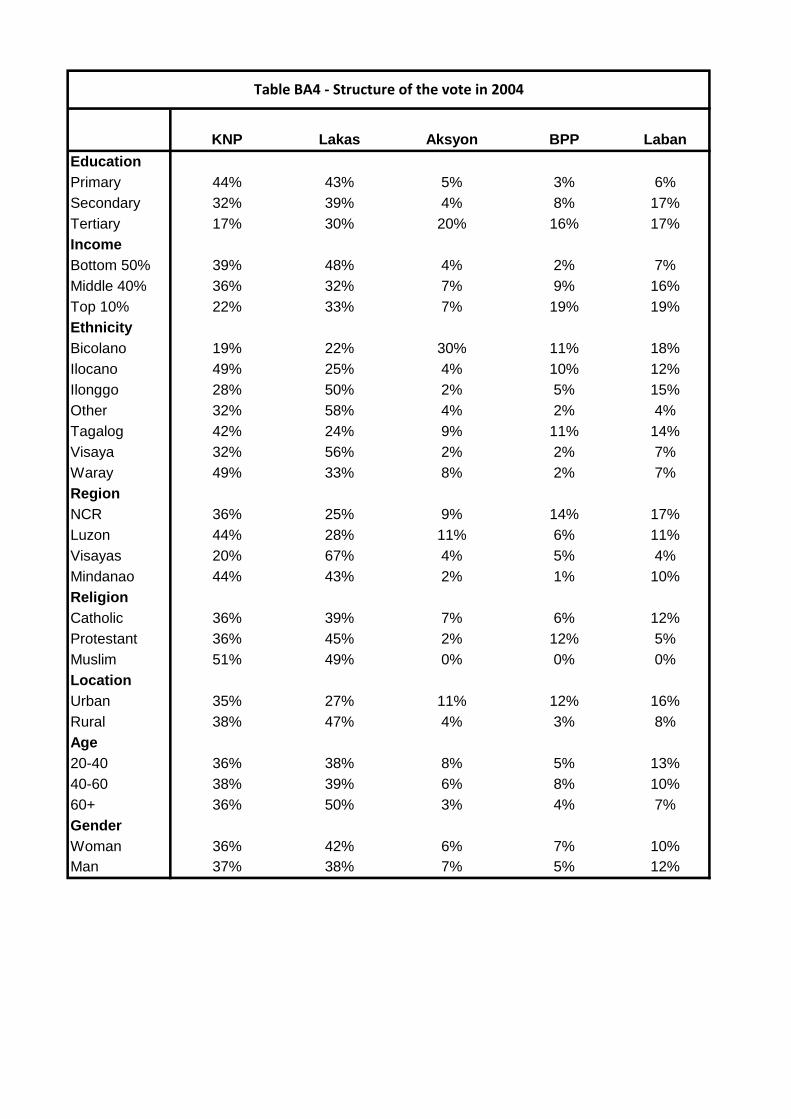
KNP Lakas Aksyon BPP Laban
Education
Primary 44% 43% 5% 3% 6%
Secondary 32% 39% 4% 8% 17%
Tertiary 17% 30% 20% 16% 17%
Income
Bottom 50% 39% 48% 4% 2% 7%
Middle 40% 36% 32% 7% 9% 16%
Top 10% 22% 33% 7% 19% 19%
Ethnicity
Bicolano 19% 22% 30% 11% 18%
Ilocano 49% 25% 4% 10% 12%
Ilonggo 28% 50% 2% 5% 15%
Other 32% 58% 4% 2% 4%
Tagalog 42% 24% 9% 11% 14%
Visaya 32% 56% 2% 2% 7%
Waray 49% 33% 8% 2% 7%
Region
NCR 36% 25% 9% 14% 17%
Luzon 44% 28% 11% 6% 11%
Visayas 20% 67% 4% 5% 4%
Mindanao 44% 43% 2% 1% 10%
Religion
Catholic 36% 39% 7% 6% 12%
Protestant 36% 45% 2% 12% 5%
Muslim 51% 49% 0% 0% 0%
Location
Urban 35% 27% 11% 12% 16%
Rural 38% 47% 4% 3% 8%
Age
20-40 36% 38% 8% 5% 13%
40-60 38% 39% 6% 8% 10%
60+ 36% 50% 3% 4% 7%
Gender
Woman 36% 42% 6% 7% 10%
Man 37% 38% 7% 5% 12%
Table BA4 - Structure of the vote in 2004
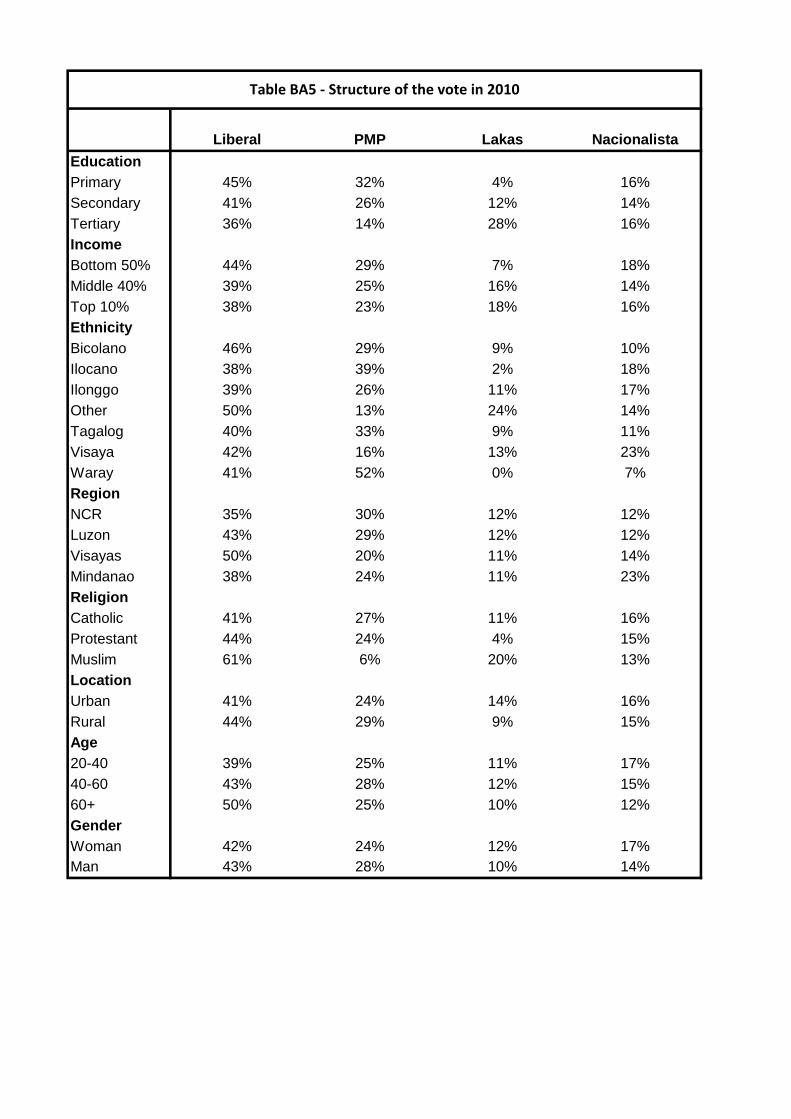
Liberal PMP Lakas Nacionalista
Education
Primary 45% 32% 4% 16%
Secondary 41% 26% 12% 14%
Tertiary 36% 14% 28% 16%
Income
Bottom 50% 44% 29% 7% 18%
Middle 40% 39% 25% 16% 14%
Top 10% 38% 23% 18% 16%
Ethnicity
Bicolano 46% 29% 9% 10%
Ilocano 38% 39% 2% 18%
Ilonggo 39% 26% 11% 17%
Other 50% 13% 24% 14%
Tagalog 40% 33% 9% 11%
Visaya 42% 16% 13% 23%
Waray 41% 52% 0% 7%
Region
NCR 35% 30% 12% 12%
Luzon 43% 29% 12% 12%
Visayas 50% 20% 11% 14%
Mindanao 38% 24% 11% 23%
Religion
Catholic 41% 27% 11% 16%
Protestant 44% 24% 4% 15%
Muslim 61% 6% 20% 13%
Location
Urban 41% 24% 14% 16%
Rural 44% 29% 9% 15%
Age
20-40 39% 25% 11% 17%
40-60 43% 28% 12% 15%
60+ 50% 25% 10% 12%
Gender
Woman 42% 24% 12% 17%
Man 43% 28% 10% 14%
Table BA5 - Structure of the vote in 2010
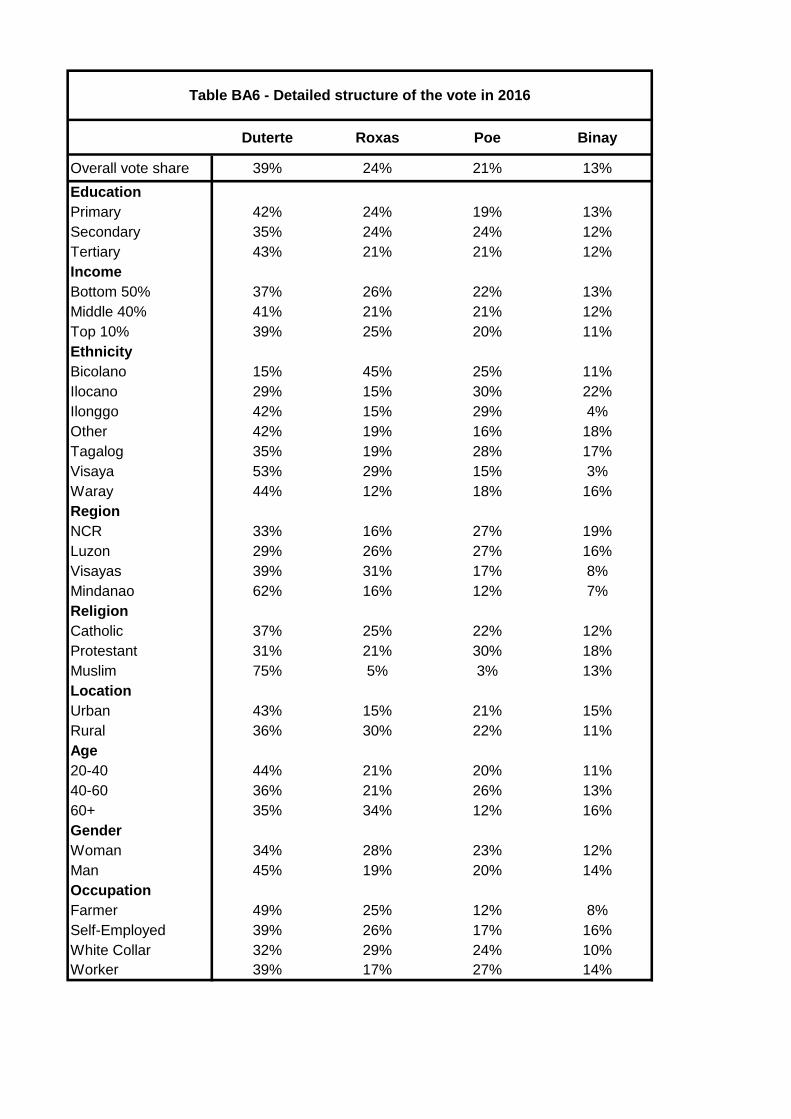
Duterte Roxas Poe Binay
Overall vote share 39% 24% 21% 13%
Education
Primary 42% 24% 19% 13%
Secondary 35% 24% 24% 12%
Tertiary 43% 21% 21% 12%
Income
Bottom 50% 37% 26% 22% 13%
Middle 40% 41% 21% 21% 12%
Top 10% 39% 25% 20% 11%
Ethnicity
Bicolano 15% 45% 25% 11%
Ilocano 29% 15% 30% 22%
Ilonggo 42% 15% 29% 4%
Other 42% 19% 16% 18%
Tagalog 35% 19% 28% 17%
Visaya 53% 29% 15% 3%
Waray 44% 12% 18% 16%
Region
NCR 33% 16% 27% 19%
Luzon 29% 26% 27% 16%
Visayas 39% 31% 17% 8%
Mindanao 62% 16% 12% 7%
Religion
Catholic 37% 25% 22% 12%
Protestant 31% 21% 30% 18%
Muslim 75% 5% 3% 13%
Location
Urban 43% 15% 21% 15%
Rural 36% 30% 22% 11%
Age
20-40 44% 21% 20% 11%
40-60 36% 21% 26% 13%
60+ 35% 34% 12% 16%
Gender
Woman 34% 28% 23% 12%
Man 45% 19% 20% 14%
Occupation
Farmer 49% 25% 12% 8%
Self-Employed 39% 26% 17% 16%
White Collar 32% 29% 24% 10%
Worker 39% 17% 27% 14%
Table BA6 - Detailed structure of the vote in 2016

Source: authors' computations using Filipino political attitudes surveys.
Notes: the table shows the vote share received by main parties among specific groups of
the Filipino voting population in the 2016 election.

(1) (2) (3) (4)
Duterte Roxas Poe Binay
Education: Primary (baseline) (baseline) (baseline) (baseline)
(.) (.) (.) (.)
Education: Secondary -0.058** 0.036 0.030 -0.015
(0.024) (0.026) (0.028) (0.019)
Education: Tertiary 0.002 0.034 -0.002 -0.028
(0.035) (0.038) (0.039) (0.029)
Income: Bottom 50% (baseline) (baseline) (baseline) (baseline)
(.) (.) (.) (.)
Income: Middle 40% 0.043* -0.012 -0.037 -0.021
(0.023) (0.025) (0.027) (0.019)
Income: Top 10% 0.036 0.048 -0.057 -0.044
(0.044) (0.047) (0.046) (0.033)
Age: 20-39 (baseline) (baseline) (baseline) (baseline)
(.) (.) (.) (.)
Age: 40-59 -0.088*** 0.012 0.061** 0.018
(0.023) (0.025) (0.027) (0.018)
Age: 60+ -0.103*** 0.130*** -0.070** 0.049*
(0.031) (0.037) (0.031) (0.026)
Gender: Man 0.101*** -0.084*** -0.033 0.011
(0.021) (0.023) (0.024) (0.017)
Ethnicity: Bicolano -0.158*** 0.184*** -0.032 -0.047
(0.037) (0.055) (0.054) (0.035)
Ethnicity: Ilocano -0.070 -0.056 0.021 0.079*
(0.045) (0.046) (0.055) (0.045)
Ethnicity: Ilonggo -0.068 -0.035 0.109 -0.083**
(0.058) (0.052) (0.067) (0.034)
Ethnicity: Other -0.018 -0.020 -0.062 0.062
Table BA7 - Determinants of the vote for main candidates in the
2016 Filipino presidential election

(0.042) (0.040) (0.044) (0.039)
Ethnicity: Tagalog (baseline) (baseline) (baseline) (baseline)
(.) (.) (.) (.)
Ethnicity: Visaya 0.044 0.091** -0.031 -0.081**
(0.043) (0.042) (0.051) (0.032)
Ethnicity: Waray 0.055 -0.110** -0.022 0.026
(0.061) (0.055) (0.061) (0.044)
Region: NCR (baseline) (baseline) (baseline) (baseline)
(.) (.) (.) (.)
Region: Luzon 0.046 0.014 -0.022 -0.032
(0.034) (0.033) (0.037) (0.030)
Region: Visayas 0.074* 0.070 -0.101** -0.084***
(0.043) (0.046) (0.049) (0.032)
Region: Mindanao 0.312*** -0.091** -0.167*** -0.077**
(0.042) (0.041) (0.045) (0.032)
Location: Rural area -0.065** 0.119*** 0.023 -0.031
(0.026) (0.026) (0.028) (0.021)
Constant 0.350*** 0.132*** 0.296*** 0.203***
Source: authors' computations based on Filipino surveys.
Note: the table shows the results of a multivariate regression assessing the determinants of support for the main candidates of the
2016 presidential election. All other things equal, voters aged 60 or older were significantly less likely to support Duterte than those
being younger than 40 years old.
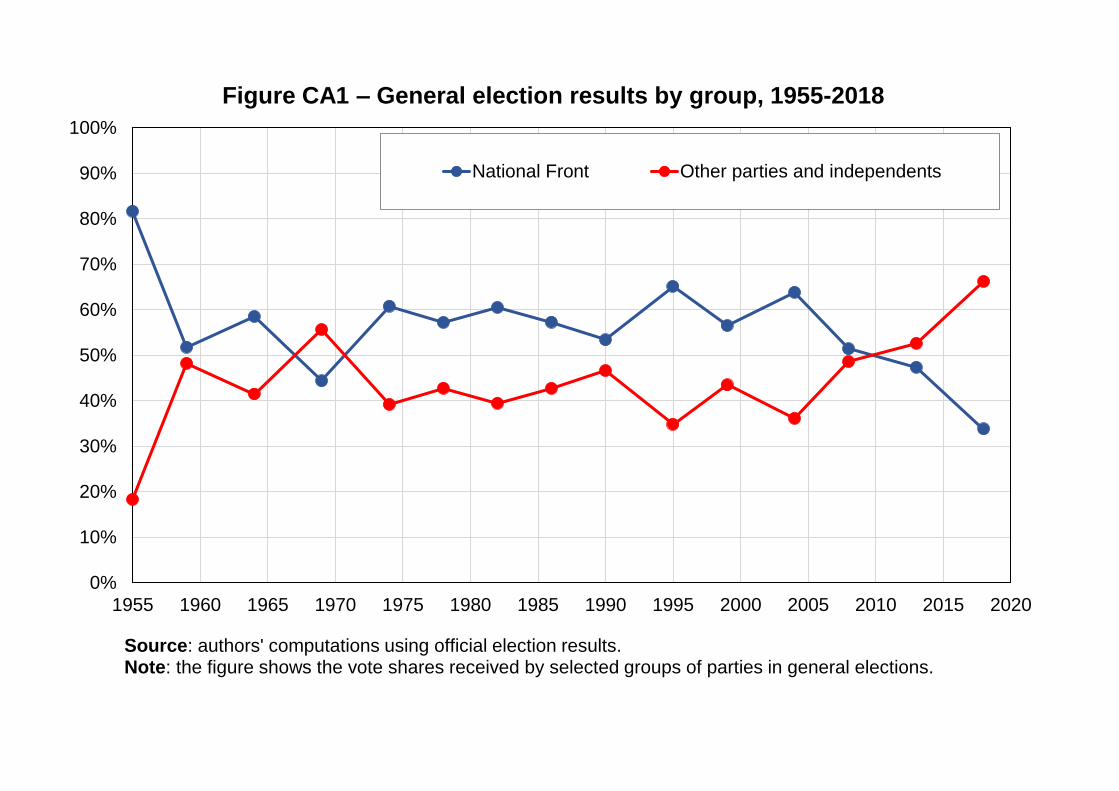
0%
10%
20%
30%
40%
50%
60%
70%
80%
90%
100%
1955 1960 1965 1970 1975 1980 1985 1990 1995 2000 2005 2010 2015 2020
Figure CA1 – General election results by group, 1955-2018
National Front Other parties and independents
Source: authors' computations using official election results.Note: the figure shows the vote shares received by selected groups of parties in general elections.
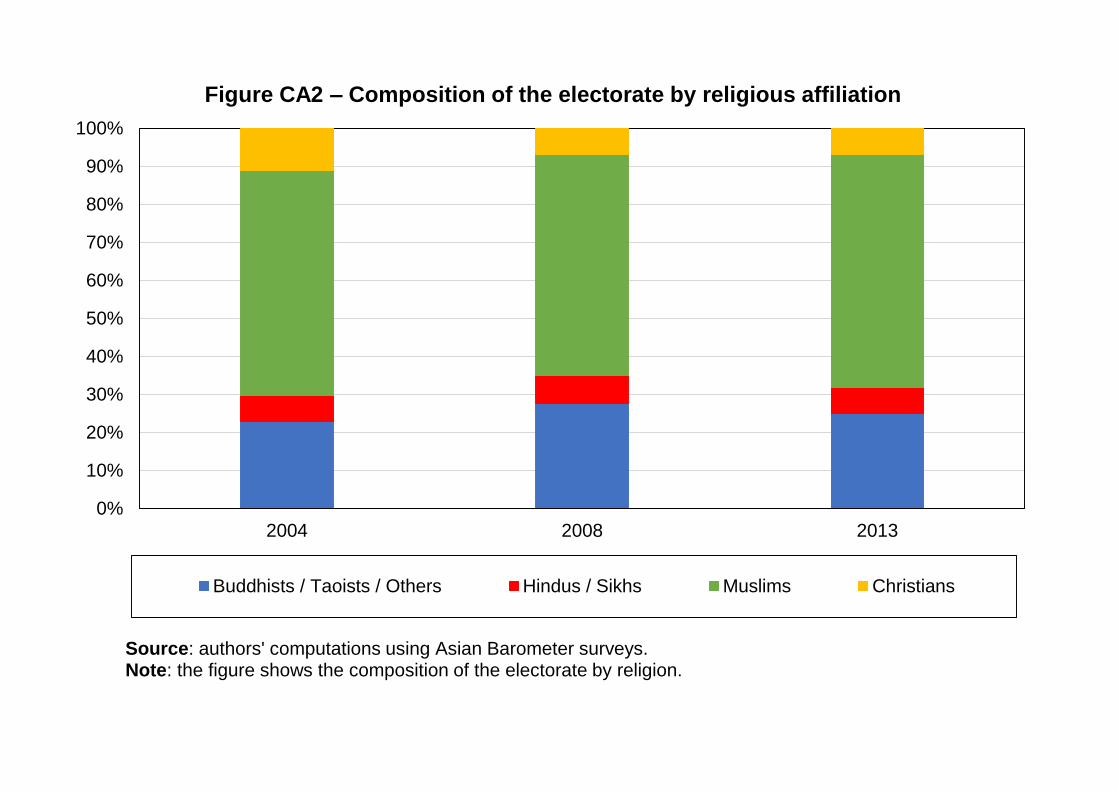
0%
10%
20%
30%
40%
50%
60%
70%
80%
90%
100%
2004 2008 2013
Figure CA2 – Composition of the electorate by religious affiliation
Buddhists / Taoists / Others Hindus / Sikhs Muslims Christians
Source: authors' computations using Asian Barometer surveys.Note: the figure shows the composition of the electorate by religion.

0%
10%
20%
30%
40%
50%
60%
70%
80%
90%
100%
2004 2008 2013
Figure CA3 – Composition of the electorate by education
Primary Secondary Tertiary
Source: authors' computations using Asian Barometer surveys.Note: the figure shows the composition of the electorate by education level.
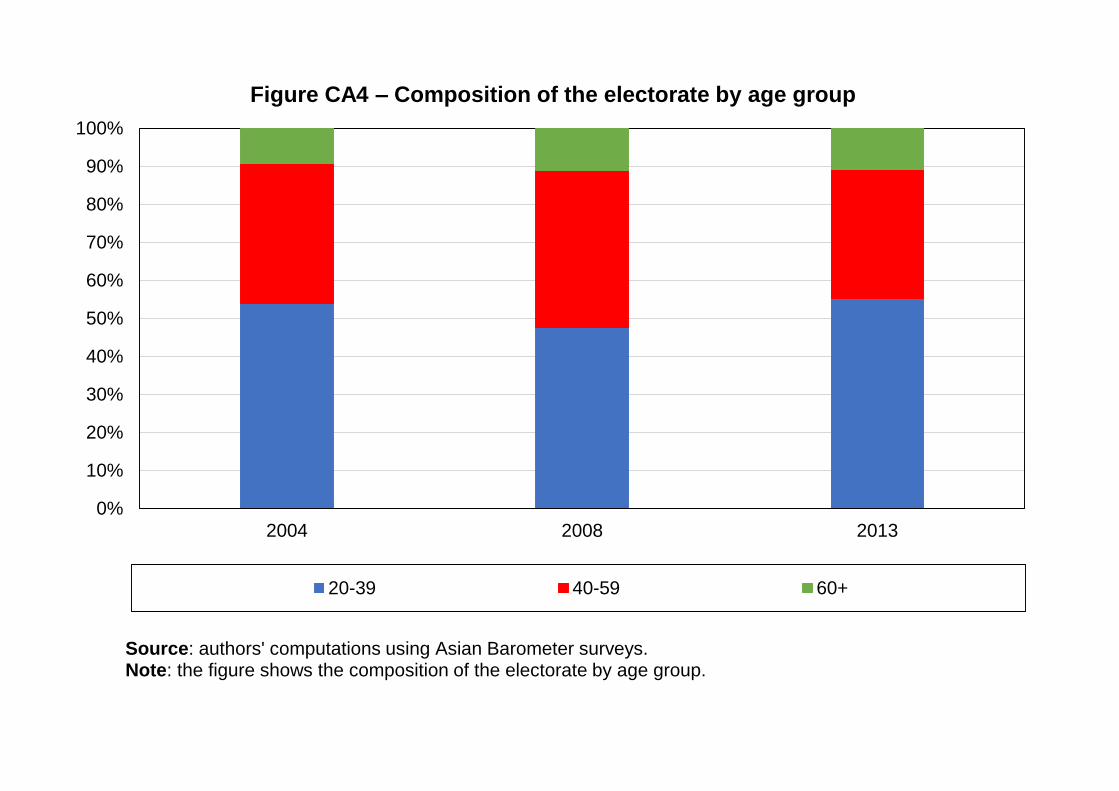
0%
10%
20%
30%
40%
50%
60%
70%
80%
90%
100%
2004 2008 2013
Figure CA4 – Composition of the electorate by age group
20-39 40-59 60+
Source: authors' computations using Asian Barometer surveys.Note: the figure shows the composition of the electorate by age group.
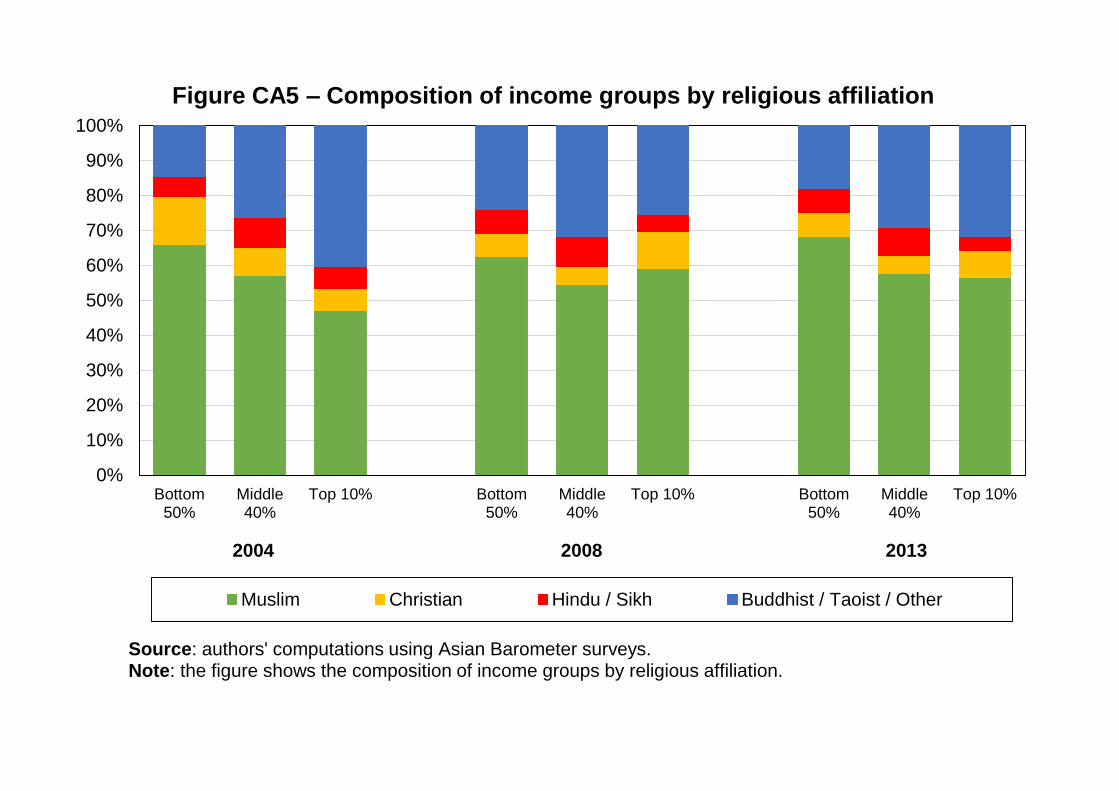
0%
10%
20%
30%
40%
50%
60%
70%
80%
90%
100%
Bottom50%
Middle40%
Top 10% Bottom50%
Middle40%
Top 10% Bottom50%
Middle40%
Top 10%
Figure CA5 – Composition of income groups by religious affiliation
Muslim Christian Hindu / Sikh Buddhist / Taoist / Other
2004 2008 2013
Source: authors' computations using Asian Barometer surveys.Note: the figure shows the composition of income groups by religious affiliation.

0%
10%
20%
30%
40%
50%
60%
70%
80%
2004 2008 2013
Figure CB1 – Vote for the National Front coalition by education level
Primary Secondary Tertiary
Source: authors' computations using Asian Barometer surveys.Note: the figure shows the share of votes received by the National Front by education level.

0%
10%
20%
30%
40%
50%
60%
70%
80%
2004 2008 2013
Figure CB2 – Vote for the National Front coalition by income quintile
Q1 Q2 Q3 Q4 Q5
Source: authors' computations using Asian Barometer surveys.Note: the figure shows the share of votes received by the National Front by income quintile.

0%
10%
20%
30%
40%
50%
60%
70%
80%
2004 2008 2013
Figure CB3 – Vote for the National Front coalition by income group
Bottom 50% Middle 40% Top 10%
Source: authors' computations using Asian Barometer surveys.Note: the figure shows the share of votes received by the National Front by income group.
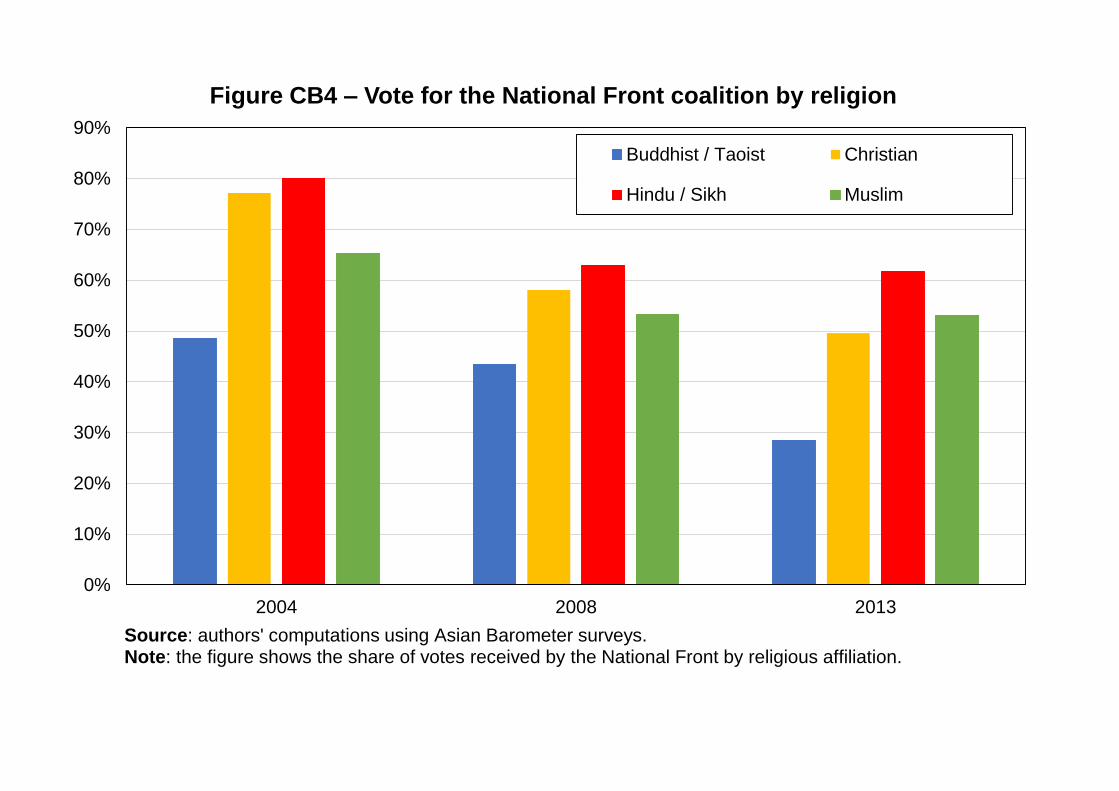
0%
10%
20%
30%
40%
50%
60%
70%
80%
90%
2004 2008 2013
Figure CB4 – Vote for the National Front coalition by religion
Buddhist / Taoist Christian
Hindu / Sikh Muslim
Source: authors' computations using Asian Barometer surveys.Note: the figure shows the share of votes received by the National Front by religious affiliation.
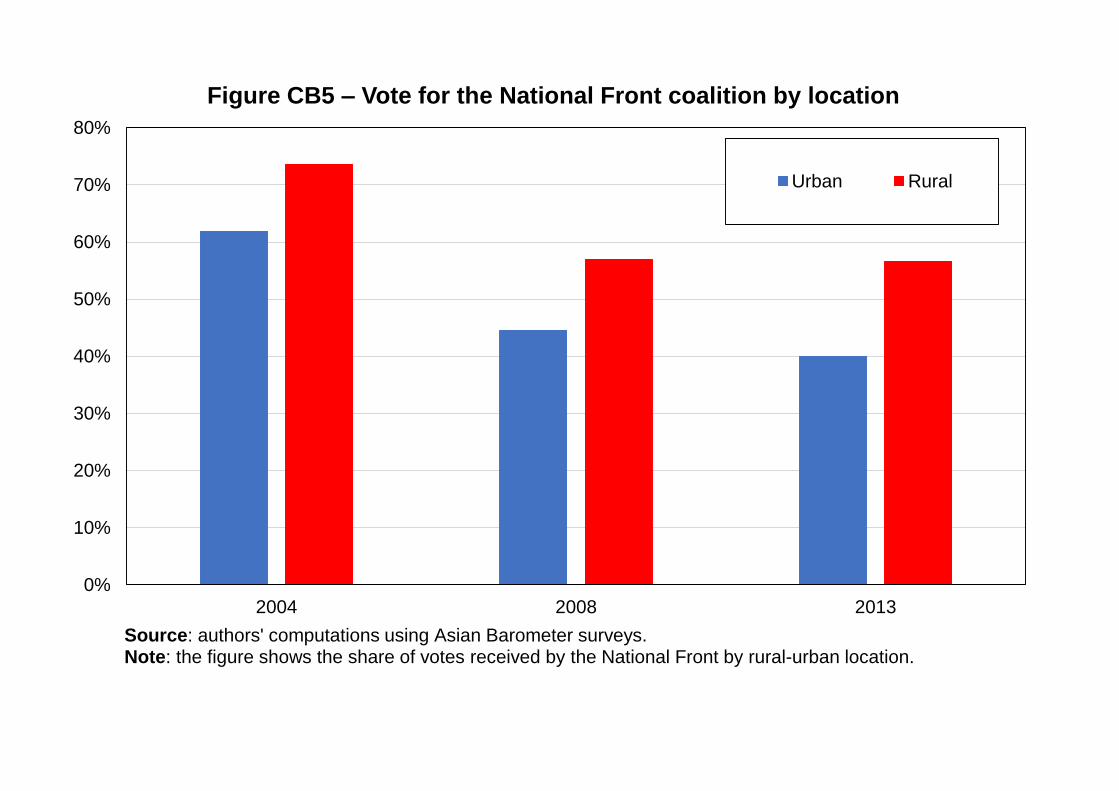
0%
10%
20%
30%
40%
50%
60%
70%
80%
2004 2008 2013
Figure CB5 – Vote for the National Front coalition by location
Urban Rural
Source: authors' computations using Asian Barometer surveys.Note: the figure shows the share of votes received by the National Front by rural-urban location.

0%
10%
20%
30%
40%
50%
60%
70%
80%
2004 2008 2013
Figure CB6 – Vote for the National Front coalition by age group
20-39 40-59 60+
Source: authors' computations using Asian Barometer surveys.Note: the figure shows the share of votes received by the National Front by age group.

0%
10%
20%
30%
40%
50%
60%
70%
2004 2008 2013
Figure CB7 – Vote for the National Front coalition by gender
Woman Man
Source: authors' computations using Asian Barometer surveys.Note: the figure shows the share of votes received by the National Front by gender.
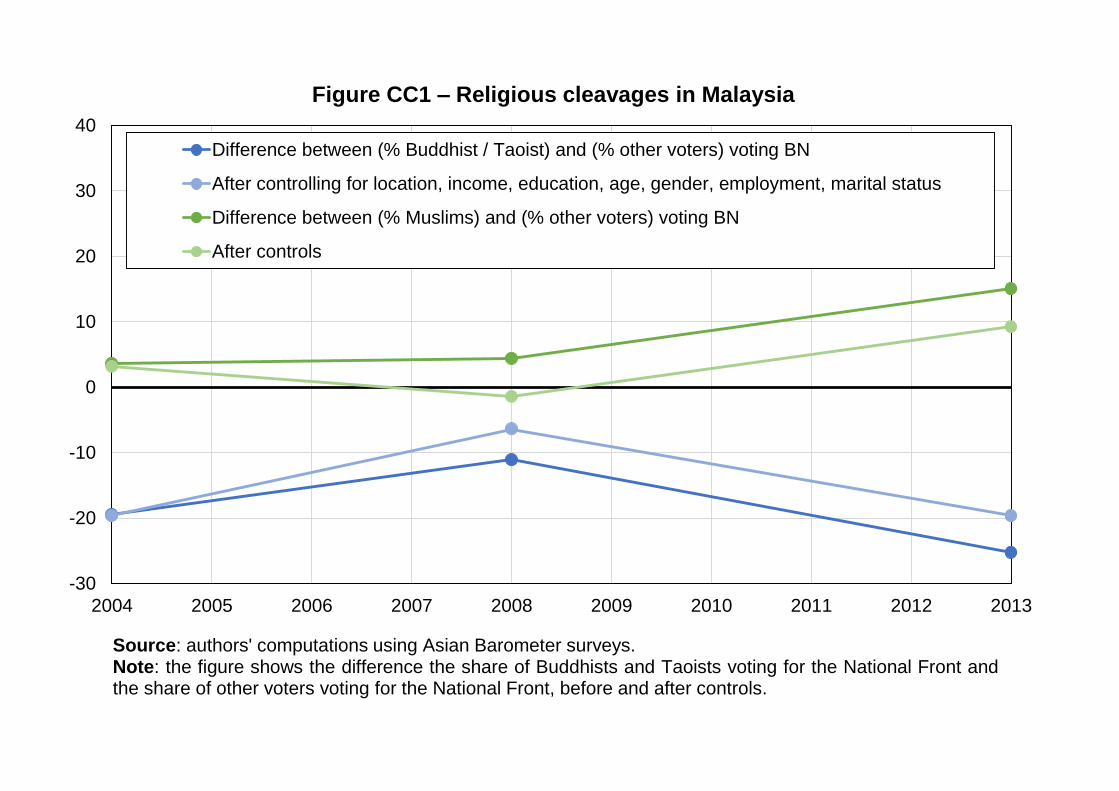
-30
-20
-10
0
10
20
30
40
2004 2005 2006 2007 2008 2009 2010 2011 2012 2013
Figure CC1 – Religious cleavages in Malaysia
Difference between (% Buddhist / Taoist) and (% other voters) voting BN
After controlling for location, income, education, age, gender, employment, marital status
Difference between (% Muslims) and (% other voters) voting BN
After controls
Source: authors' computations using Asian Barometer surveys.Note: the figure shows the difference the share of Buddhists and Taoists voting for the National Front andthe share of other voters voting for the National Front, before and after controls.
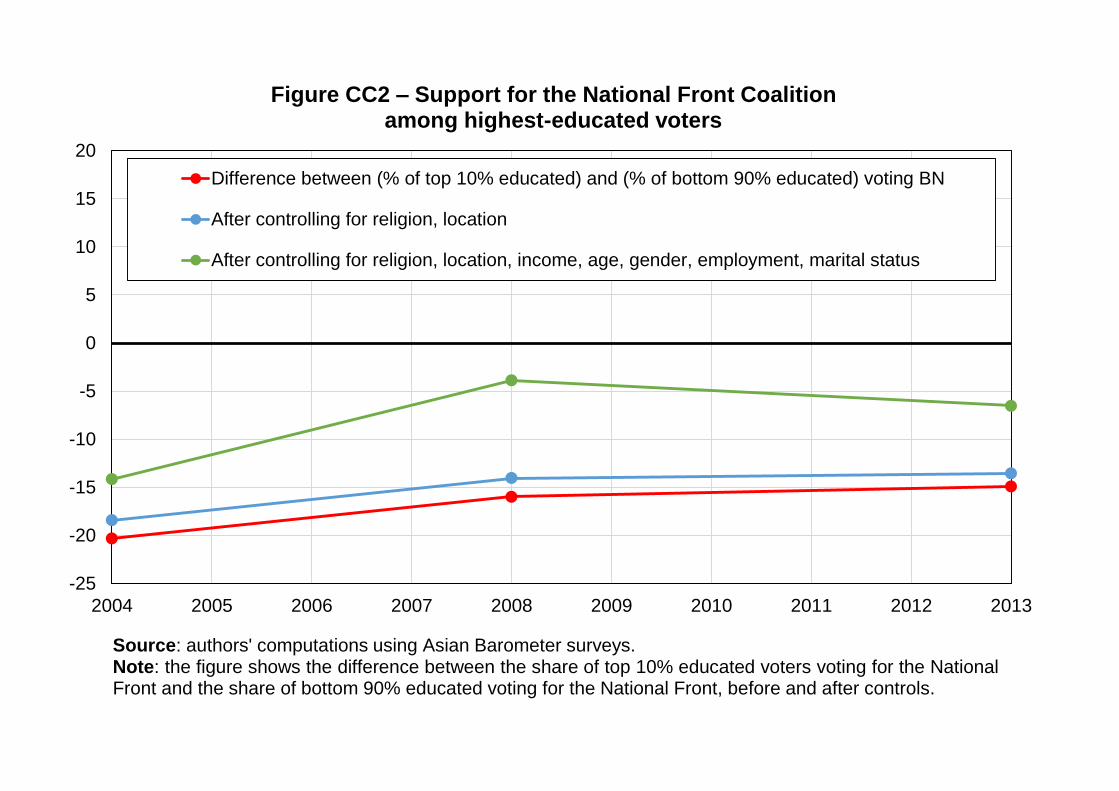
-25
-20
-15
-10
-5
0
5
10
15
20
2004 2005 2006 2007 2008 2009 2010 2011 2012 2013
Figure CC2 – Support for the National Front Coalition among highest-educated voters
Difference between (% of top 10% educated) and (% of bottom 90% educated) voting BN
After controlling for religion, location
After controlling for religion, location, income, age, gender, employment, marital status
Source: authors' computations using Asian Barometer surveys.Note: the figure shows the difference between the share of top 10% educated voters voting for the NationalFront and the share of bottom 90% educated voting for the National Front, before and after controls.
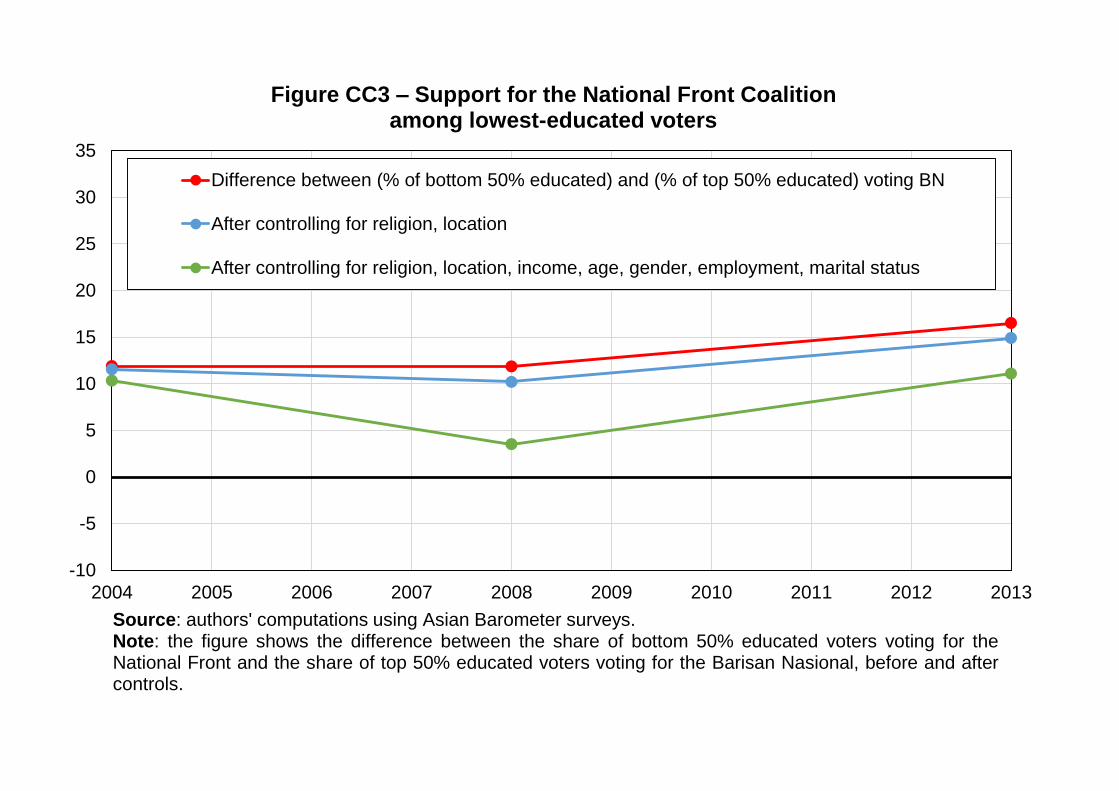
-10
-5
0
5
10
15
20
25
30
35
2004 2005 2006 2007 2008 2009 2010 2011 2012 2013
Figure CC3 – Support for the National Front Coalition among lowest-educated voters
Difference between (% of bottom 50% educated) and (% of top 50% educated) voting BN
After controlling for religion, location
After controlling for religion, location, income, age, gender, employment, marital status
Source: authors' computations using Asian Barometer surveys.Note: the figure shows the difference between the share of bottom 50% educated voters voting for theNational Front and the share of top 50% educated voters voting for the Barisan Nasional, before and aftercontrols.

-10
-5
0
5
10
15
20
25
30
35
2004 2005 2006 2007 2008 2009 2010 2011 2012 2013
Figure CC4 – Support for the National Front Coalition among low-income voters
Difference between (% of bottom 50% earners) and (% of top 50% earners) voting BN
After controlling for religion, location
After controlling for religion, location, age, gender, employment, marital status, income
Source: authors' computations using Asian Barometer surveys.Note: the figure shows the difference between the share of bottom 50% earners voting for the NationalFront and the share of top 50% earners voting for the National Front, before and after controls.

-30
-25
-20
-15
-10
-5
0
5
10
15
20
25
2004 2005 2006 2007 2008 2009 2010 2011 2012 2013
Figure CC5 – Support for the National Front Coalition among top-income voters
Difference between (% of top 10% earners) and (% of bottom 90% earners) voting BN
After controlling for religion, location
After controlling for religion, location, age, gender, employment, marital status, income
Source: authors' computations using Asian Barometer surveys.Note: the figure shows the difference between the share of top 10% earners voting for the Barisan Nasionaland the share of bottom 90% earners voting for the Barisan Nasional, before and after controls.

-10
-5
0
5
10
15
20
25
30
35
2004 2005 2006 2007 2008 2009 2010 2011 2012 2013
Figure CC6 – Support for the National Front Coalition among rural areas
Difference between (% rural areas) and (% urban areas) voting BN
After controlling for religion
After controlling for religion, age, gender, employment, marital status, income, education
Source: authors' computations using Asian Barometer surveys.Note: the figure shows the difference between the share of rural areas voting for the Barisan Nasional andthe share of urban areas voting for the Barisan Nasional, before and after controls.
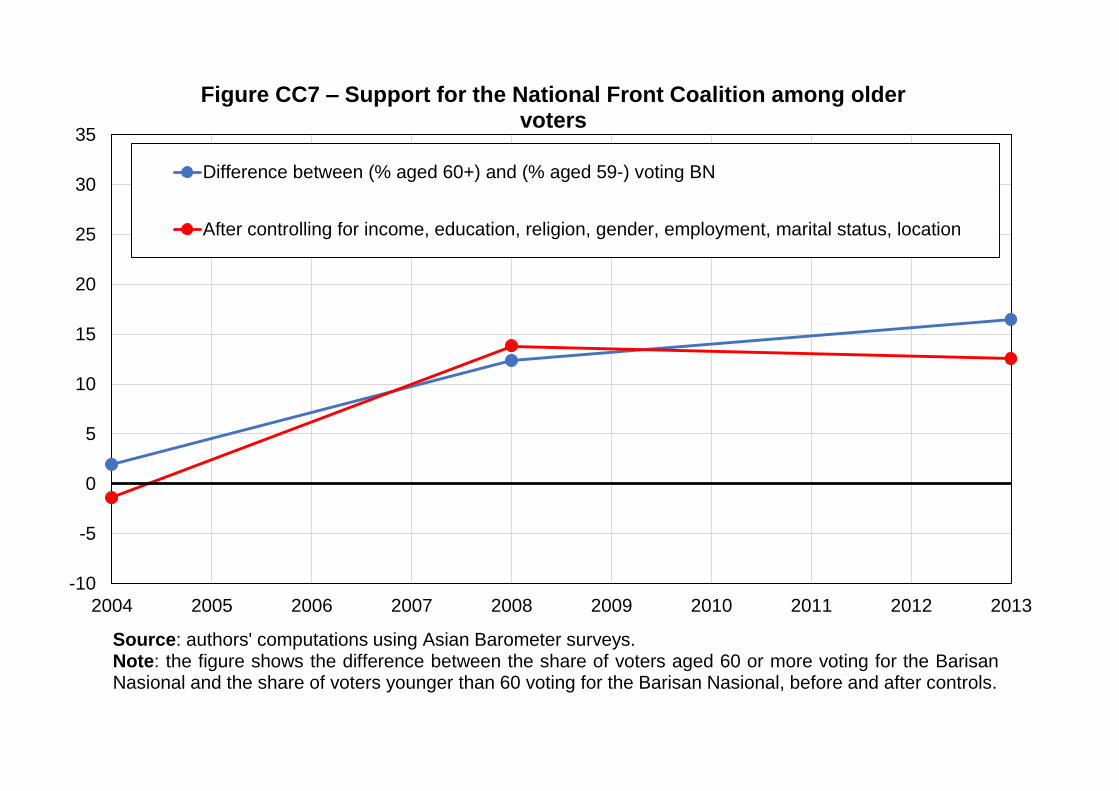
-10
-5
0
5
10
15
20
25
30
35
2004 2005 2006 2007 2008 2009 2010 2011 2012 2013
Figure CC7 – Support for the National Front Coalition among older voters
Difference between (% aged 60+) and (% aged 59-) voting BN
After controlling for income, education, religion, gender, employment, marital status, location
Source: authors' computations using Asian Barometer surveys.Note: the figure shows the difference between the share of voters aged 60 or more voting for the BarisanNasional and the share of voters younger than 60 voting for the Barisan Nasional, before and after controls.

-30
-20
-10
0
10
20
30
2004 2005 2006 2007 2008 2009 2010 2011 2012 2013
Figure CC8 – Support for the National Front Coalition among men
Difference between (% men) and (% women) voting BN
After controlling for income, education, religion, age, employment, marital status, location
Source: authors' computations using Asian Barometer surveys.Note: the figure shows the difference between the share of men voting for the Barisan Nasional and theshare of women voting for the Barisan Nasional, before and after controls.
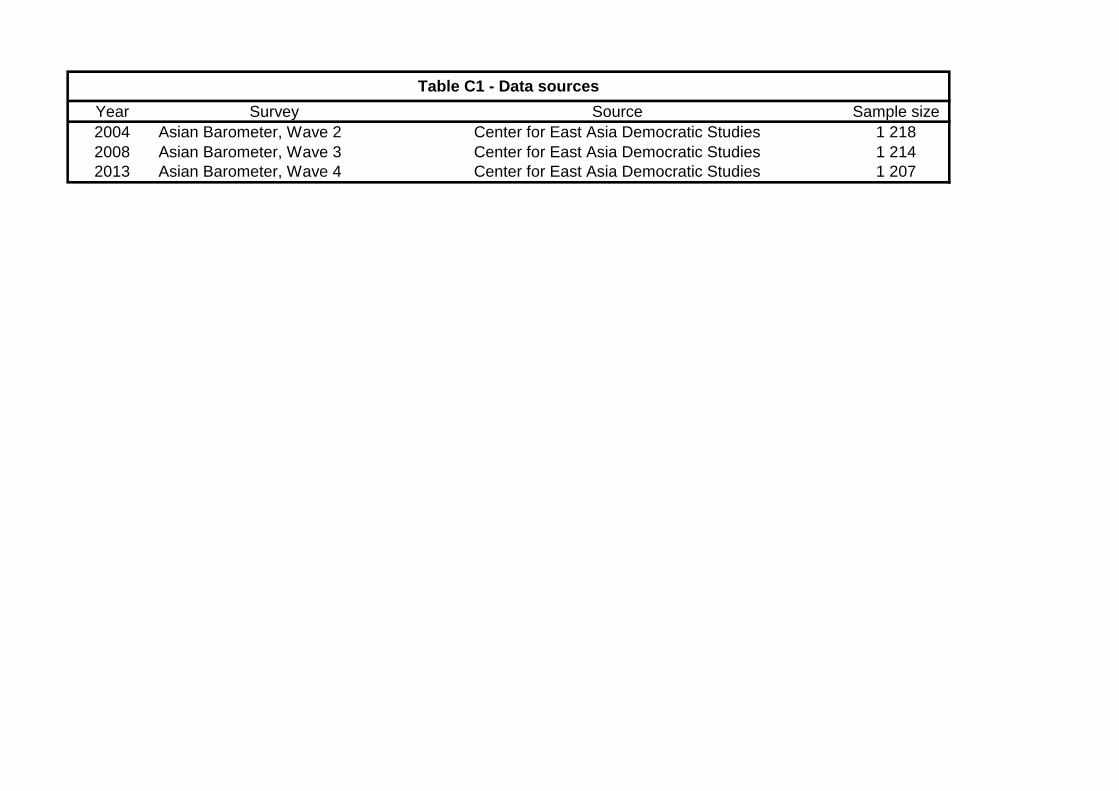
Year Survey Source Sample size
2004 Asian Barometer, Wave 2 Center for East Asia Democratic Studies 1 218
2008 Asian Barometer, Wave 3 Center for East Asia Democratic Studies 1 214
2013 Asian Barometer, Wave 4 Center for East Asia Democratic Studies 1 207
Table C1 - Data sources

2004 2008 2013
Location: Rural areas 17% 53% 44%
Education: Primary 59% 48% 49%
Education: Secondary 34% 37% 34%
Education: Tertiary 7% 15% 17%
Age: 20-39 54% 48% 55%
Age: 40-59 37% 41% 34%
Age: 60+ 9% 11% 11%
Gender: Men 51% 50% 51%
Employment status: Employed 58% 54% 62%
Employment status: Unemployed 2% 7% 3%
Employment status: Inactive 40% 39% 35%
Marital status: Married or with partner 65% 69% 65%
Religion: Buddhist / Taoist 23% 28% 25%
Religion: Hindu / Sikh 7% 7% 7%
Religion: Muslim 59% 58% 61%
Religion: Christian 11% 7% 7%
Table 2 - Composition of the electorate
Source: authors' computations using Asian Barometer Surveys.
Note: the table shows descriptive statistics by year for selected available variables.

0%
10%
20%
30%
40%
50%
60%
70%
80%
1975 1980 1985 1990 1995 2000 2005 2010 2015 2020
Figure DA1 - Election results in Indonesia, 1971-2019
Golkar PDI / PDI-P
Islamic parties PD
Nasdem Gerindra
Hanura
Source: authors' computations using official election results.Note: the figure shows the share of votes received by selected Indonesian political parties or groups of parties in legislative elections between 1977 and 2019. Islamic parties include the PAN, PBB, PBR, PKB, PKNU, PKS, and PPP.

0%
10%
20%
30%
40%
50%
60%
70%
80%
90%
100%
1975 1980 1985 1990 1995 2000 2005 2010 2015 2020
Figure DA2 - Election results in Indonesia by group, 1971-2019
Secular parties Islamic parties Other
Source: authors' computations using official election results.Note: the figure shows the share of votes received by selected Indonesian political parties or groups of parties in legislative elections between 1977 and 2019. Islamic parties include the PAN, PBB, PBR, PKB, PKNU, PKS, and PPP.

0%
10%
20%
30%
40%
50%
60%
70%
80%
90%
100%
1999 2004 2009 2014
Figure DA3 – Composition of the electorate by education level
Elementary or lower Primary Lower secondary Upper secondary Tertiary
Source: authors' computations using Indonesian political attitudes surveys.Note: the figure shows the composition of the electorate by education level.
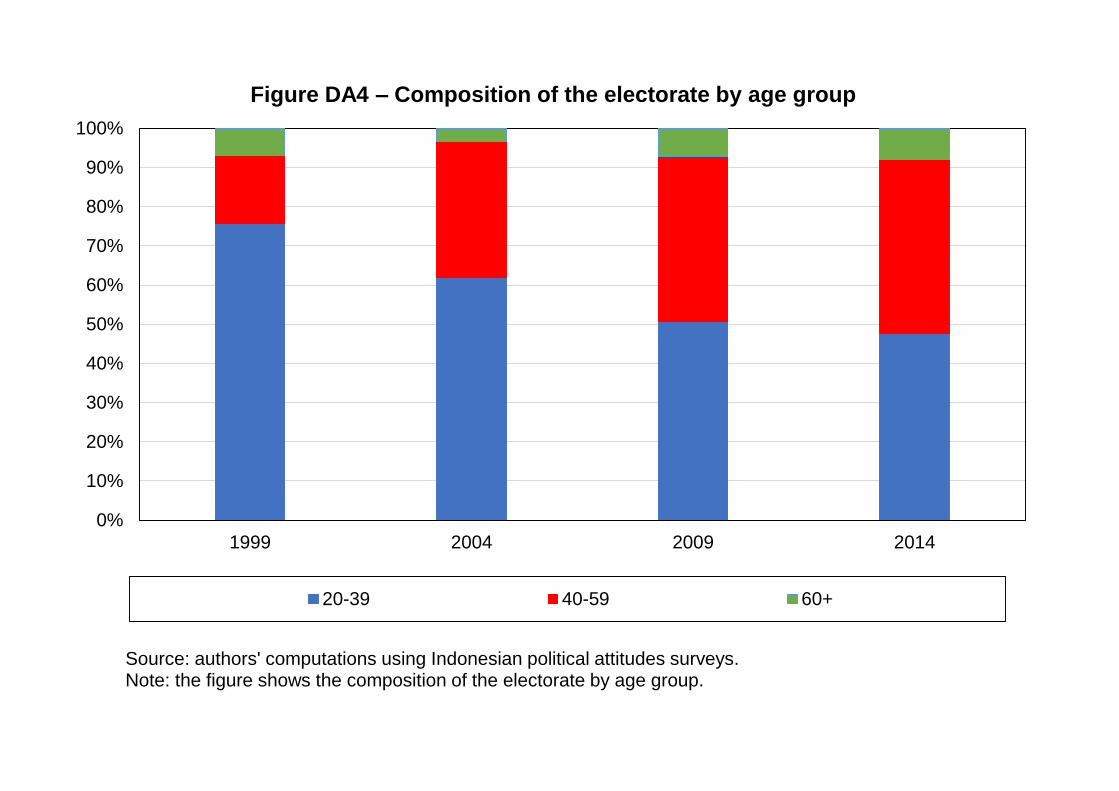
0%
10%
20%
30%
40%
50%
60%
70%
80%
90%
100%
1999 2004 2009 2014
Figure DA4 – Composition of the electorate by age group
20-39 40-59 60+
Source: authors' computations using Indonesian political attitudes surveys.Note: the figure shows the composition of the electorate by age group.
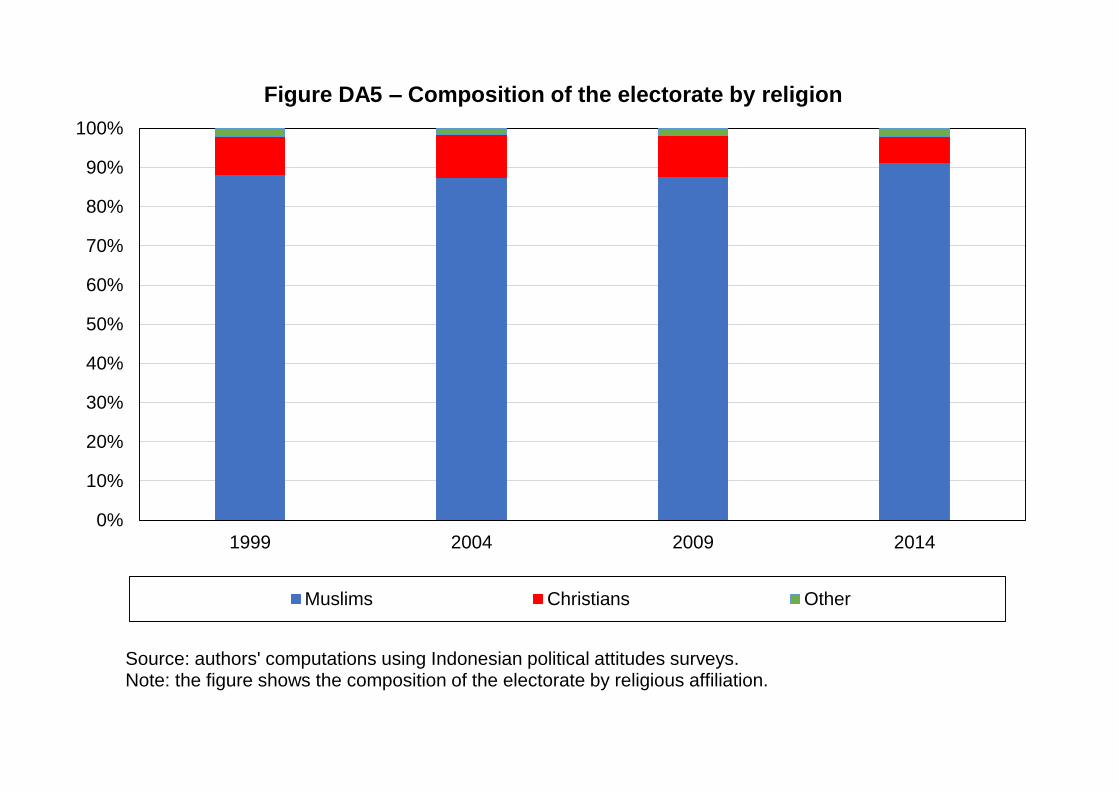
0%
10%
20%
30%
40%
50%
60%
70%
80%
90%
100%
1999 2004 2009 2014
Figure DA5 – Composition of the electorate by religion
Muslims Christians Other
Source: authors' computations using Indonesian political attitudes surveys.Note: the figure shows the composition of the electorate by religious affiliation.

0%
10%
20%
30%
40%
50%
60%
70%
80%
90%
100%
1999 2004 2009 2014
Figure DA6 – Composition of the electorate by rural-urban location
Rural Urban
Source: authors' computations using Indonesian political attitudes surveys.Note: the figure shows the composition of the electorate by rural-urban location.

0%
10%
20%
30%
40%
50%
60%
70%
80%
90%
100%
Q1 Q2 Q3 Q4 Q5
Figure DA7 – Composition of income quintiles by religion, 1999
Muslims Christians Other
Source: authors' computations using Indonesian political attitudes surveys.Note: the figure shows the composition of income quintiles by religious affiliation in 1999.
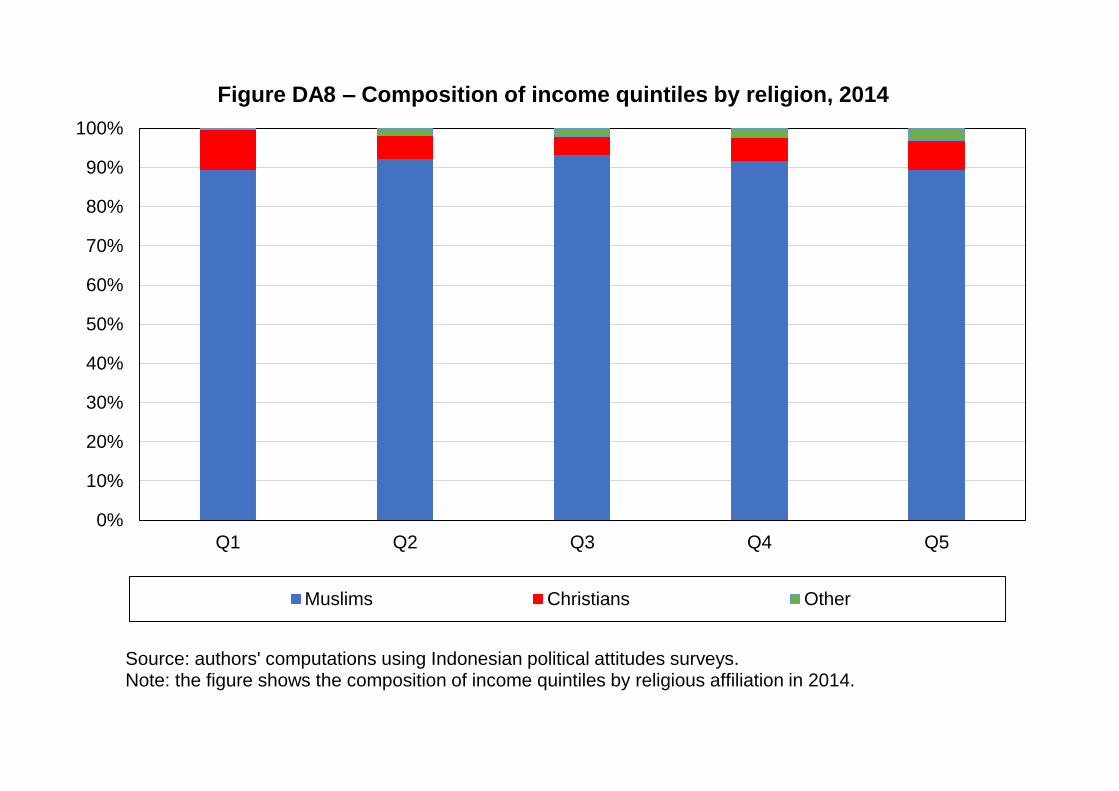
0%
10%
20%
30%
40%
50%
60%
70%
80%
90%
100%
Q1 Q2 Q3 Q4 Q5
Figure DA8 – Composition of income quintiles by religion, 2014
Muslims Christians Other
Source: authors' computations using Indonesian political attitudes surveys.Note: the figure shows the composition of income quintiles by religious affiliation in 2014.

0%
10%
20%
30%
40%
50%
60%
70%
80%
90%
100%
Q1 Q2 Q3 Q4 Q5
Figure DA9 – Composition of income quintiles by education, 1999
Elementary or lower Primary Lower secondary Upper secondary Tertiary
Source: authors' computations using Indonesian political attitudes surveys.Note: the figure shows the composition of income quintiles by education level in 1999.
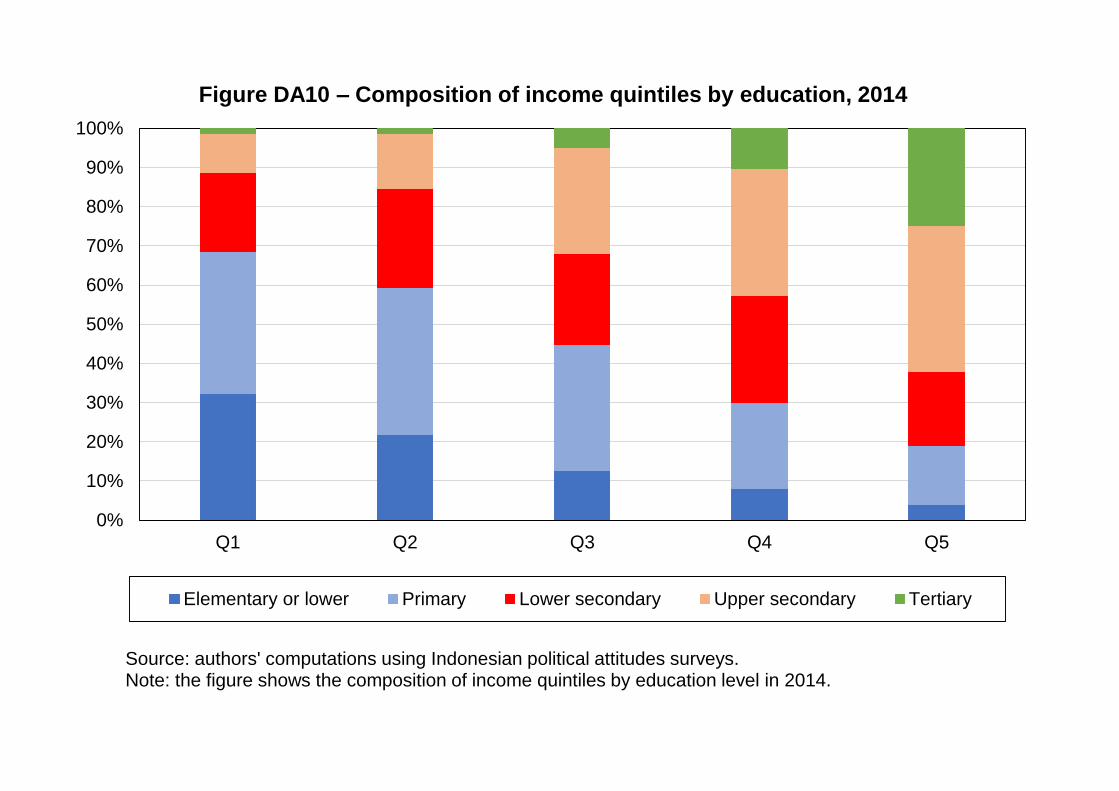
0%
10%
20%
30%
40%
50%
60%
70%
80%
90%
100%
Q1 Q2 Q3 Q4 Q5
Figure DA10 – Composition of income quintiles by education, 2014
Elementary or lower Primary Lower secondary Upper secondary Tertiary
Source: authors' computations using Indonesian political attitudes surveys.Note: the figure shows the composition of income quintiles by education level in 2014.
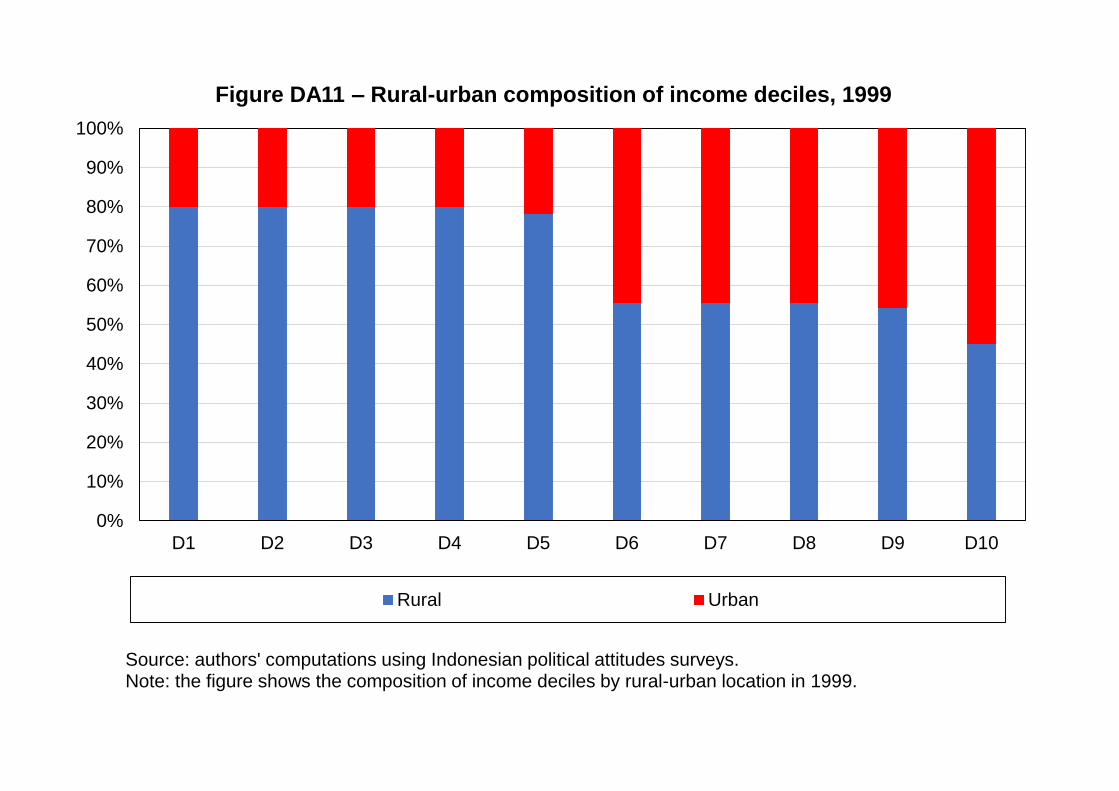
0%
10%
20%
30%
40%
50%
60%
70%
80%
90%
100%
D1 D2 D3 D4 D5 D6 D7 D8 D9 D10
Figure DA11 – Rural-urban composition of income deciles, 1999
Rural Urban
Source: authors' computations using Indonesian political attitudes surveys.Note: the figure shows the composition of income deciles by rural-urban location in 1999.

0%
10%
20%
30%
40%
50%
60%
70%
80%
90%
100%
D1 D2 D3 D4 D5 D6 D7 D8 D9 D10
Figure DA12 – Rural-urban composition of income deciles, 2014
Rural Urban
Source: authors' computations using Indonesian political attitudes surveys.Note: the figure shows the composition of income deciles by rural-urban location in 2014.
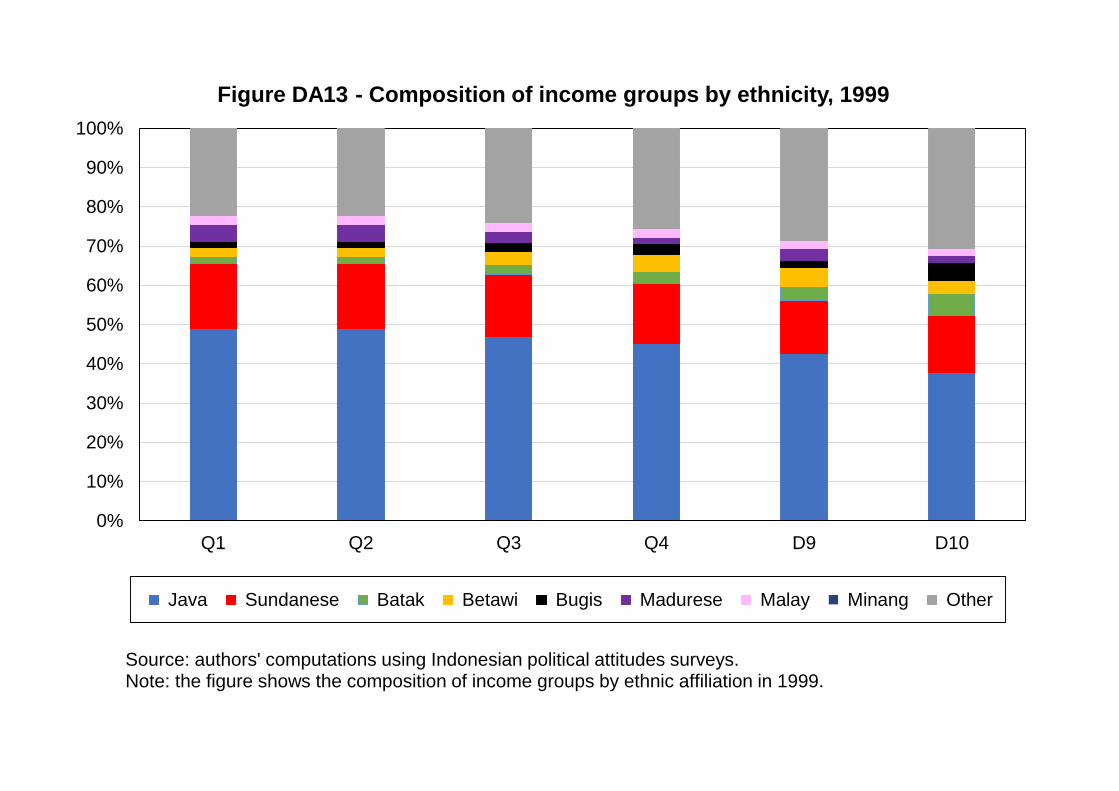
0%
10%
20%
30%
40%
50%
60%
70%
80%
90%
100%
Q1 Q2 Q3 Q4 D9 D10
Figure DA13 - Composition of income groups by ethnicity, 1999
Java Sundanese Batak Betawi Bugis Madurese Malay Minang Other
Source: authors' computations using Indonesian political attitudes surveys.Note: the figure shows the composition of income groups by ethnic affiliation in 1999.

0%
10%
20%
30%
40%
50%
60%
70%
80%
90%
100%
Q1 Q2 Q3 Q4 D9 D10
Figure DA14 - Composition of income groups by ethnicity, 2014
Java Sundanese Batak Betawi Bugis Madurese Malay Minang Other
Source: authors' computations using Indonesian political attitudes surveys.Note: the figure shows the composition of income groups by ethnic affiliation in 2014.
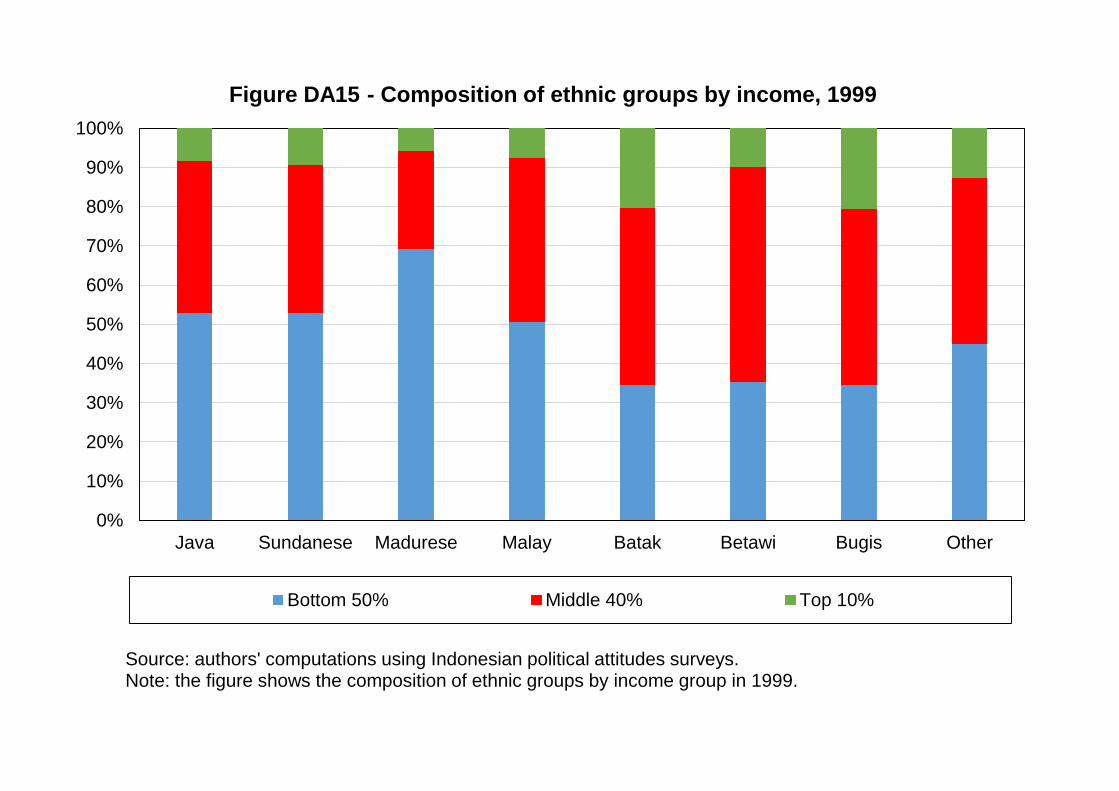
0%
10%
20%
30%
40%
50%
60%
70%
80%
90%
100%
Java Sundanese Madurese Malay Batak Betawi Bugis Other
Figure DA15 - Composition of ethnic groups by income, 1999
Bottom 50% Middle 40% Top 10%
Source: authors' computations using Indonesian political attitudes surveys.Note: the figure shows the composition of ethnic groups by income group in 1999.
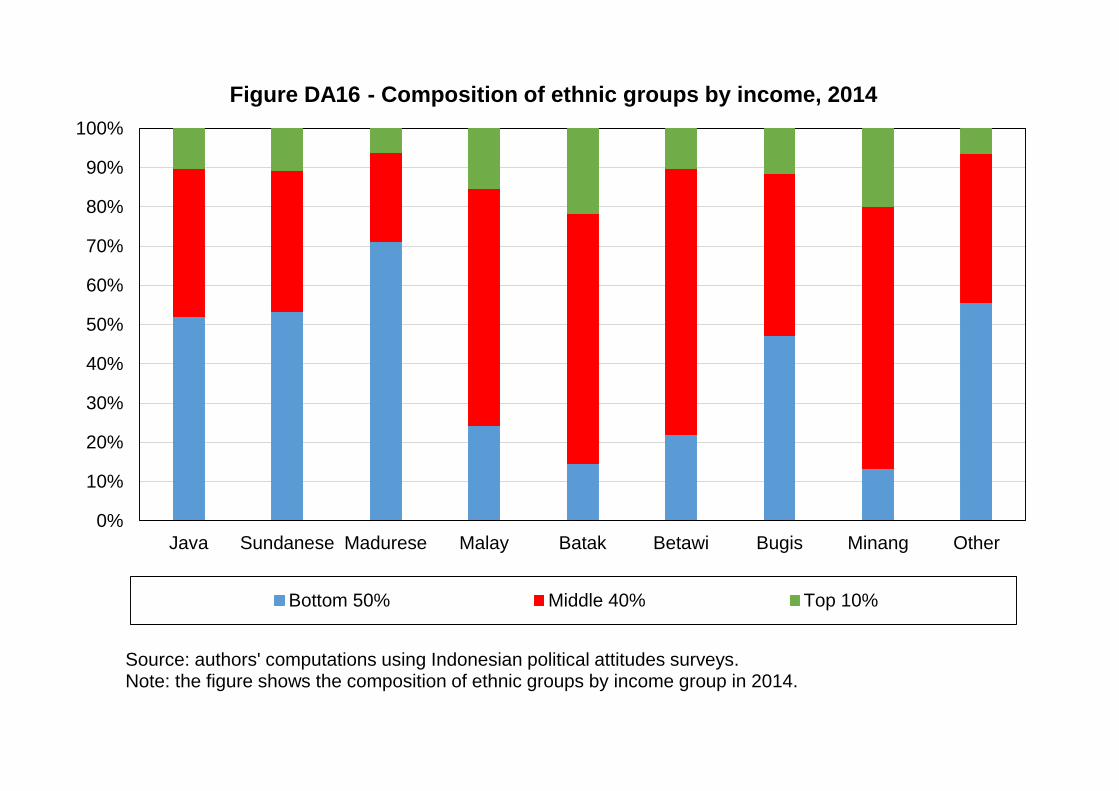
0%
10%
20%
30%
40%
50%
60%
70%
80%
90%
100%
Java Sundanese Madurese Malay Batak Betawi Bugis Minang Other
Figure DA16 - Composition of ethnic groups by income, 2014
Bottom 50% Middle 40% Top 10%
Source: authors' computations using Indonesian political attitudes surveys.Note: the figure shows the composition of ethnic groups by income group in 2014.
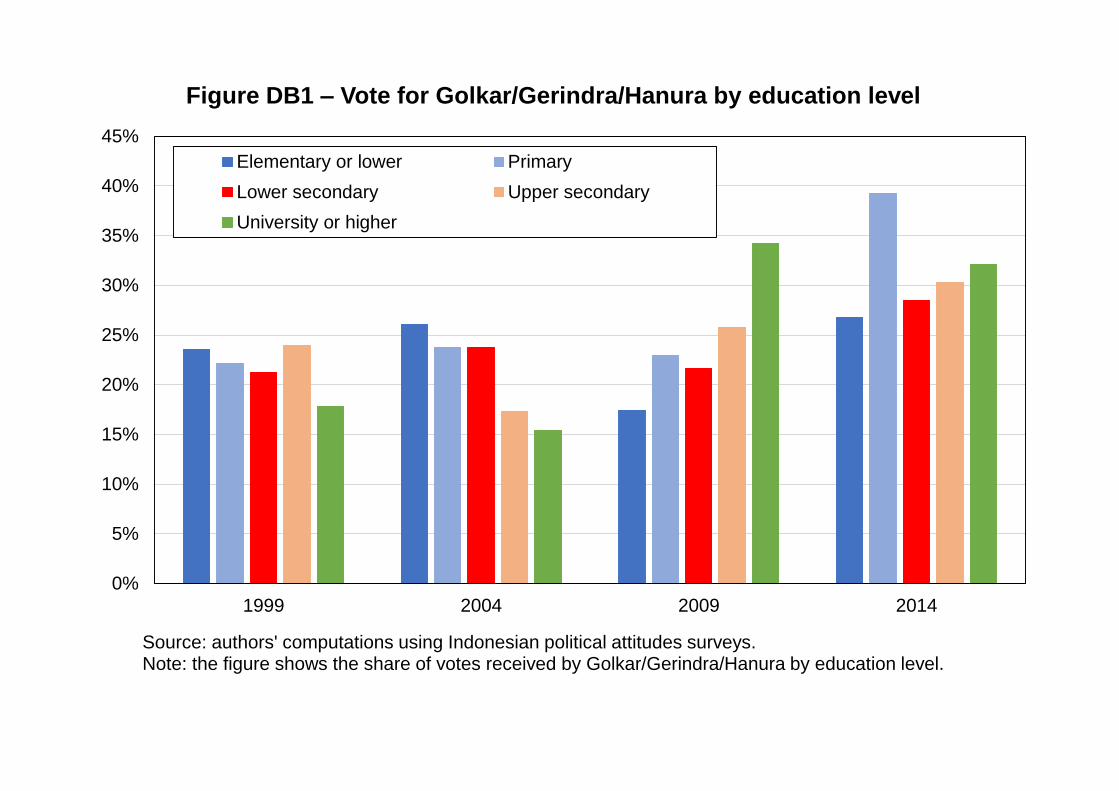
0%
5%
10%
15%
20%
25%
30%
35%
40%
45%
1999 2004 2009 2014
Figure DB1 – Vote for Golkar/Gerindra/Hanura by education level
Elementary or lower Primary
Lower secondary Upper secondary
University or higher
Source: authors' computations using Indonesian political attitudes surveys.Note: the figure shows the share of votes received by Golkar/Gerindra/Hanura by education level.
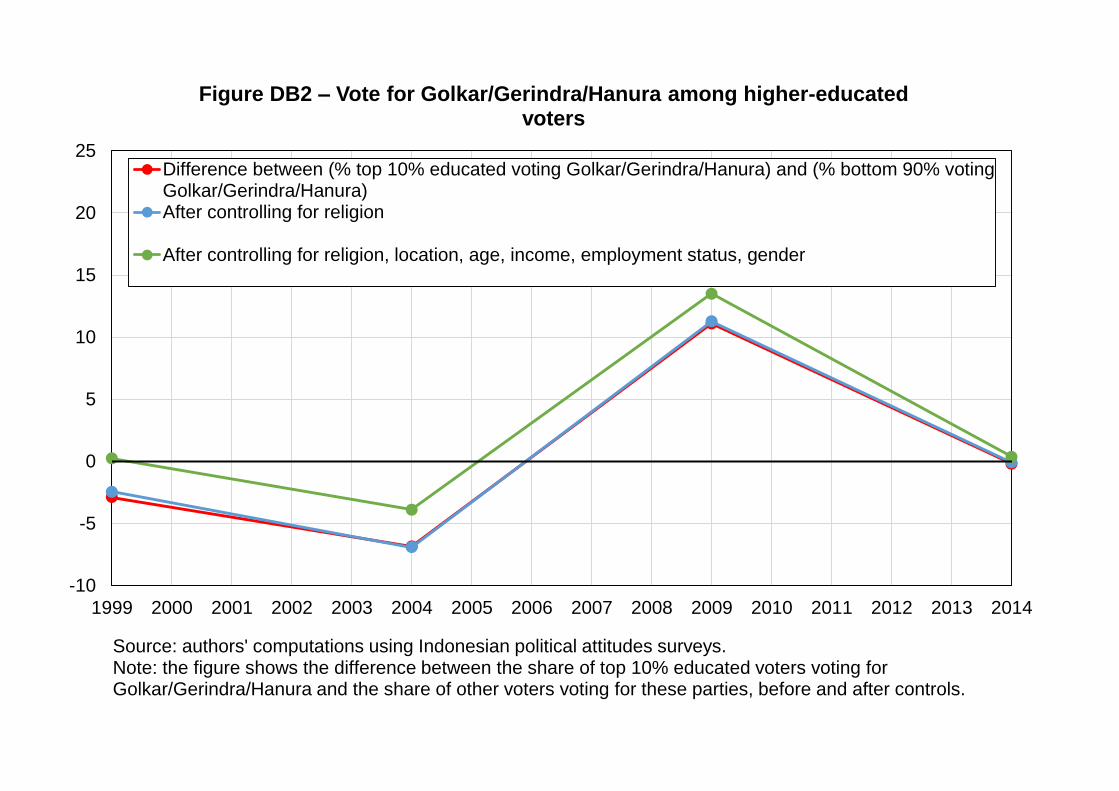
-10
-5
0
5
10
15
20
25
1999 2000 2001 2002 2003 2004 2005 2006 2007 2008 2009 2010 2011 2012 2013 2014
Figure DB2 – Vote for Golkar/Gerindra/Hanura among higher-educated voters
Difference between (% top 10% educated voting Golkar/Gerindra/Hanura) and (% bottom 90% votingGolkar/Gerindra/Hanura)After controlling for religion
After controlling for religion, location, age, income, employment status, gender
Source: authors' computations using Indonesian political attitudes surveys.Note: the figure shows the difference between the share of top 10% educated voters voting for Golkar/Gerindra/Hanura and the share of other voters voting for these parties, before and after controls.
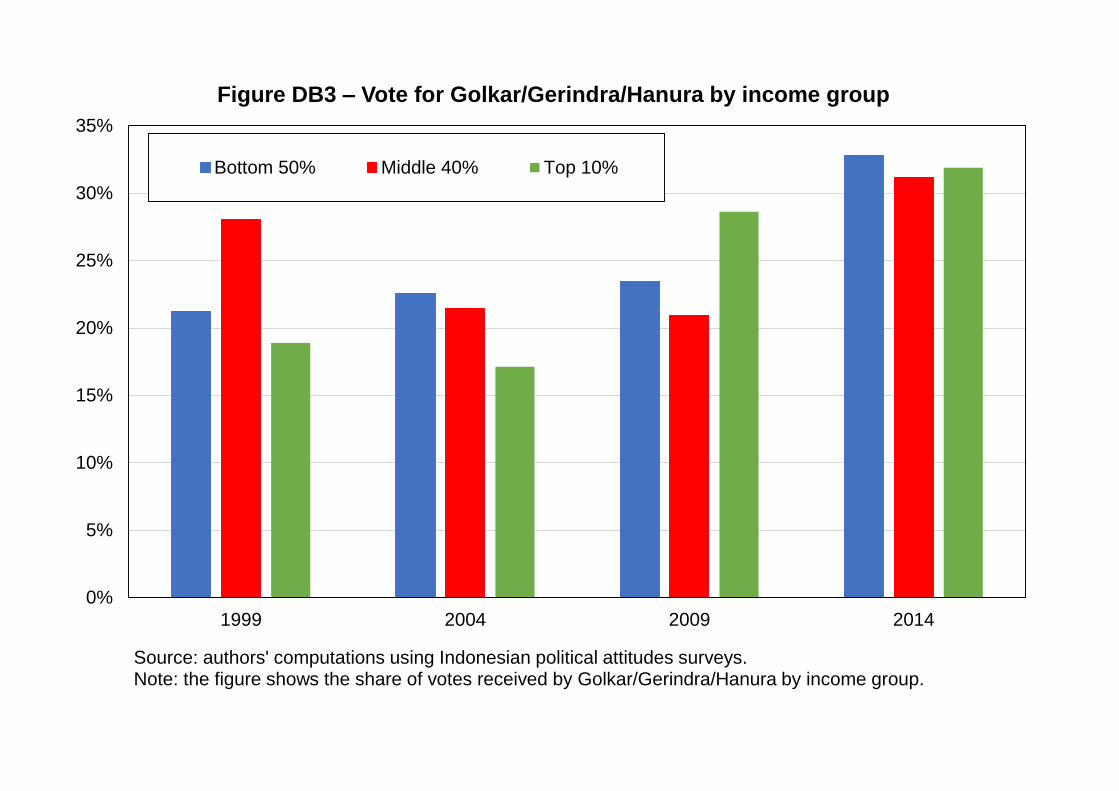
0%
5%
10%
15%
20%
25%
30%
35%
1999 2004 2009 2014
Figure DB3 – Vote for Golkar/Gerindra/Hanura by income group
Bottom 50% Middle 40% Top 10%
Source: authors' computations using Indonesian political attitudes surveys.Note: the figure shows the share of votes received by Golkar/Gerindra/Hanura by income group.
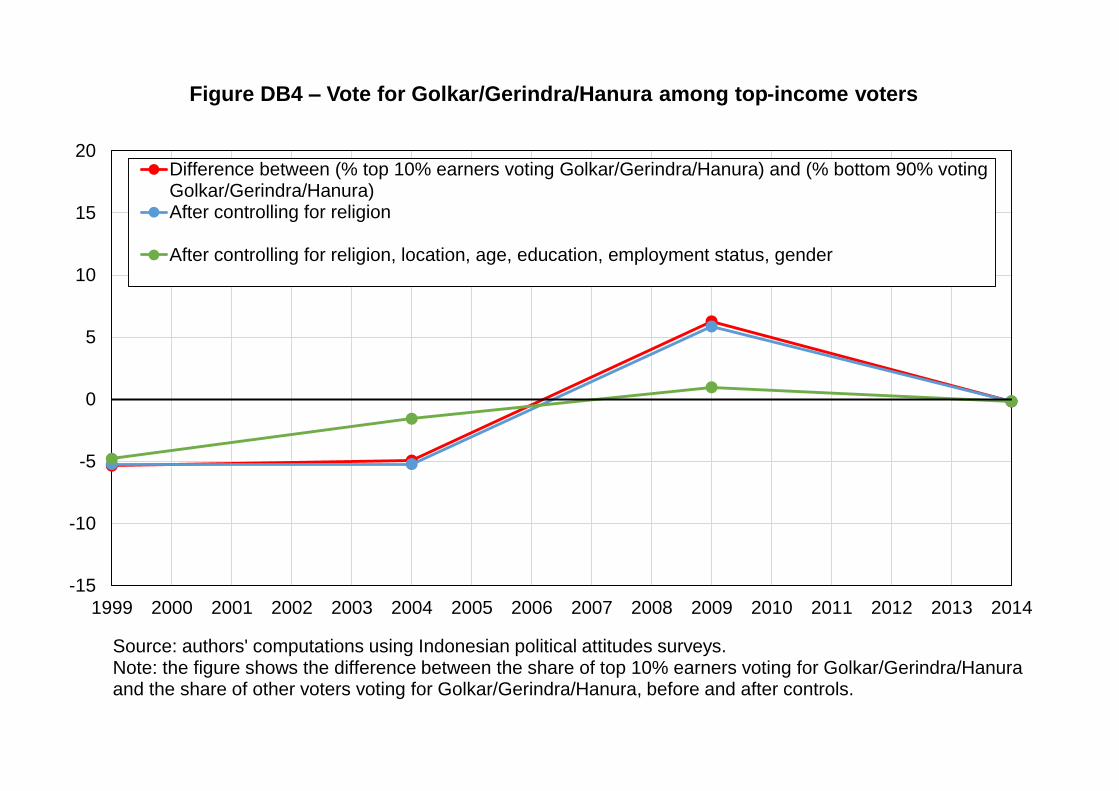
-15
-10
-5
0
5
10
15
20
1999 2000 2001 2002 2003 2004 2005 2006 2007 2008 2009 2010 2011 2012 2013 2014
Figure DB4 – Vote for Golkar/Gerindra/Hanura among top-income voters
Difference between (% top 10% earners voting Golkar/Gerindra/Hanura) and (% bottom 90% votingGolkar/Gerindra/Hanura)After controlling for religion
After controlling for religion, location, age, education, employment status, gender
Source: authors' computations using Indonesian political attitudes surveys.Note: the figure shows the difference between the share of top 10% earners voting for Golkar/Gerindra/Hanura and the share of other voters voting for Golkar/Gerindra/Hanura, before and after controls.
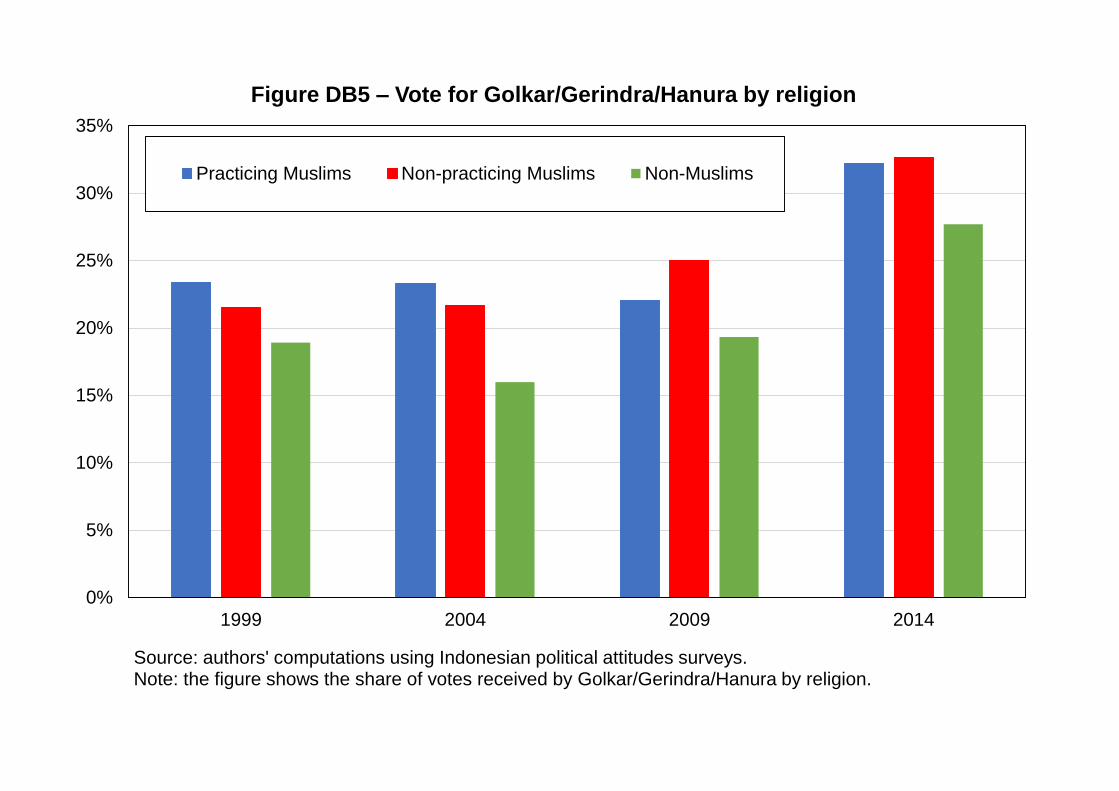
0%
5%
10%
15%
20%
25%
30%
35%
1999 2004 2009 2014
Figure DB5 – Vote for Golkar/Gerindra/Hanura by religion
Practicing Muslims Non-practicing Muslims Non-Muslims
Source: authors' computations using Indonesian political attitudes surveys.Note: the figure shows the share of votes received by Golkar/Gerindra/Hanura by religion.
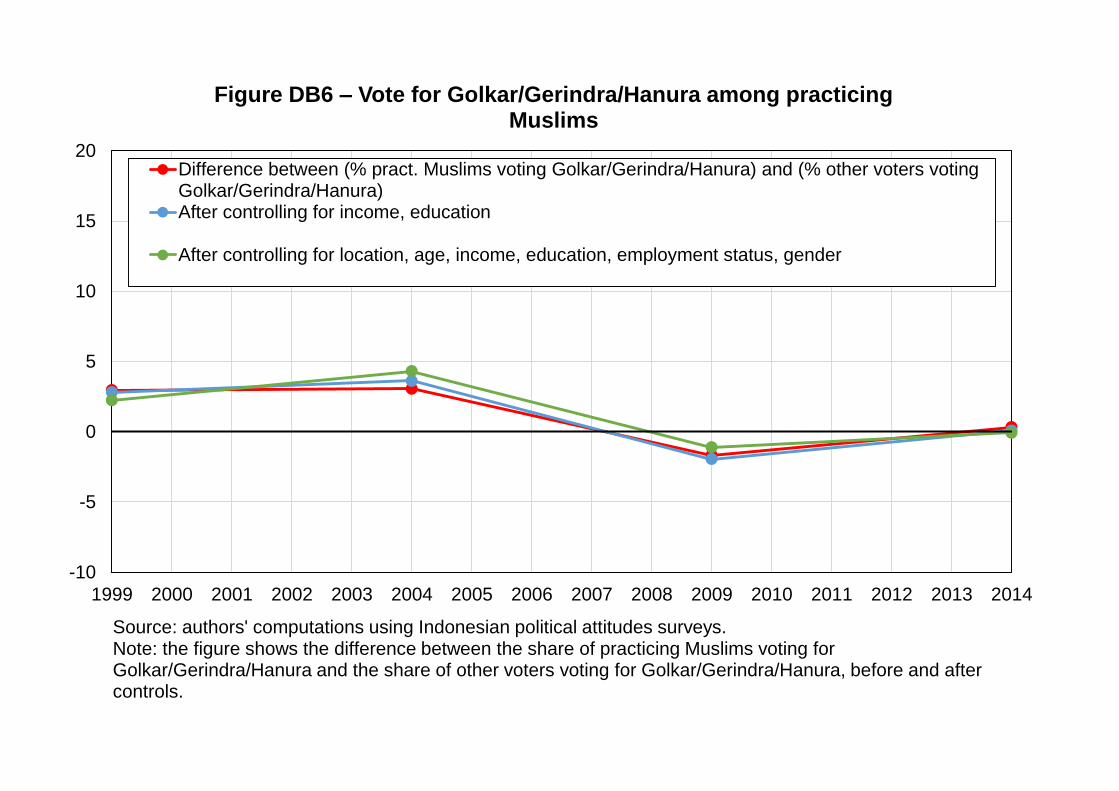
-10
-5
0
5
10
15
20
1999 2000 2001 2002 2003 2004 2005 2006 2007 2008 2009 2010 2011 2012 2013 2014
Figure DB6 – Vote for Golkar/Gerindra/Hanura among practicing Muslims
Difference between (% pract. Muslims voting Golkar/Gerindra/Hanura) and (% other voters votingGolkar/Gerindra/Hanura)After controlling for income, education
After controlling for location, age, income, education, employment status, gender
Source: authors' computations using Indonesian political attitudes surveys.Note: the figure shows the difference between the share of practicing Muslims voting for Golkar/Gerindra/Hanura and the share of other voters voting for Golkar/Gerindra/Hanura, before and after controls.
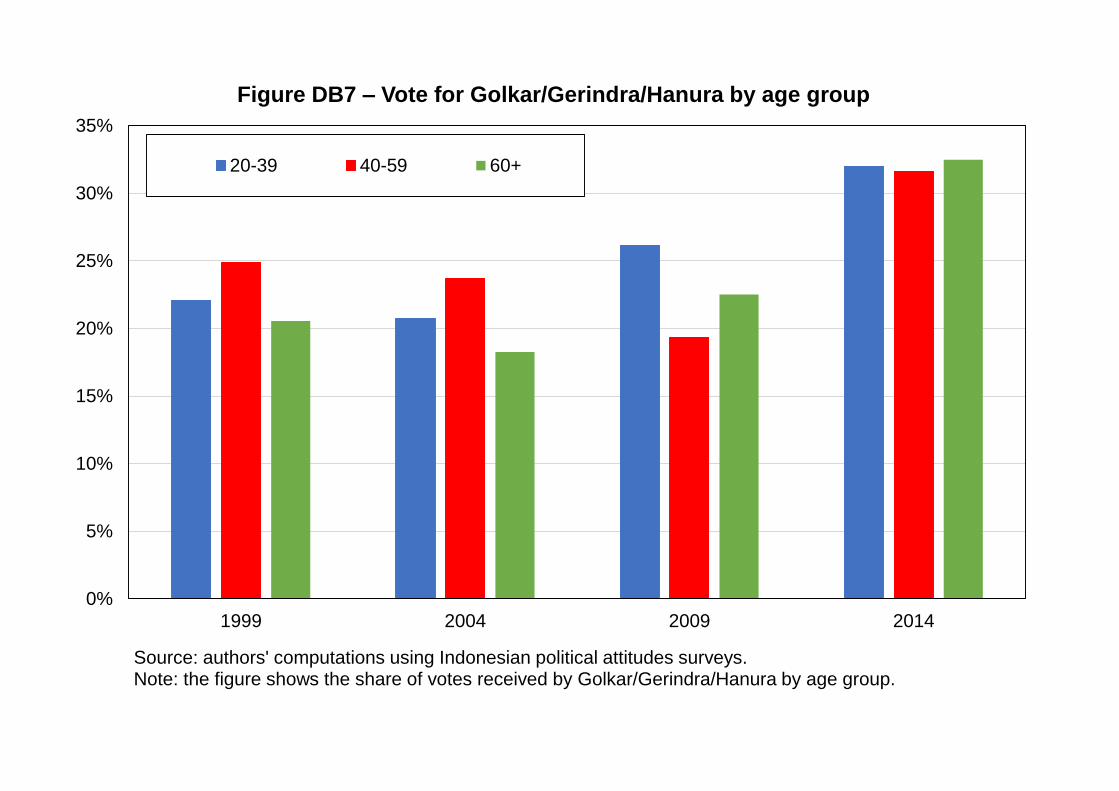
0%
5%
10%
15%
20%
25%
30%
35%
1999 2004 2009 2014
Figure DB7 – Vote for Golkar/Gerindra/Hanura by age group
20-39 40-59 60+
Source: authors' computations using Indonesian political attitudes surveys.Note: the figure shows the share of votes received by Golkar/Gerindra/Hanura by age group.

-10
-5
0
5
10
15
20
1999 2000 2001 2002 2003 2004 2005 2006 2007 2008 2009 2010 2011 2012 2013 2014
Figure DB8 – Vote for Golkar/Gerindra/Hanura among young voters
Difference between (% voters aged 20-39 voting Golkar/Gerindra/Hanura) and (% other voters votingGolkar/Gerindra/Hanura)After controlling for income, education
After controlling for location, income, education, religion, employment status, gender
Source: authors' computations using Indonesian political attitudes surveys.Note: the figure shows the difference between the share of voters aged 20 to 39 voting for Golkar/Gerindra/Hanura and the share of other voters voting for Golkar/Gerindra/Hanura, before and after controls.
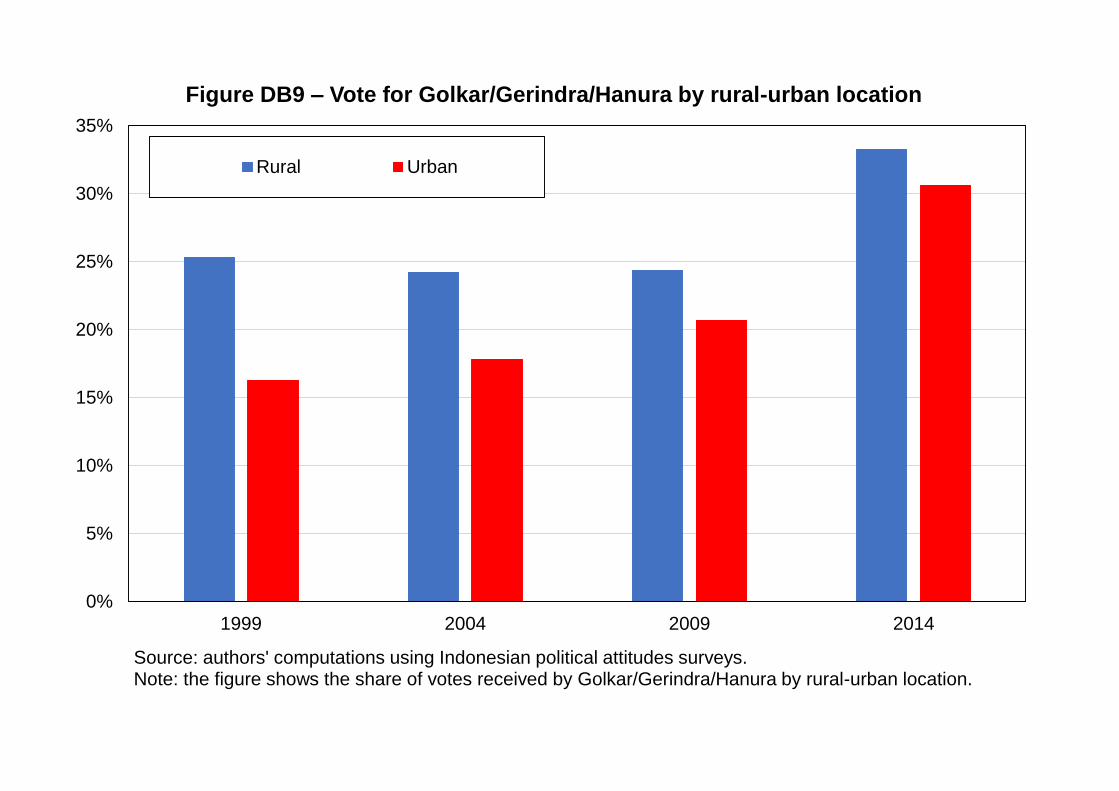
0%
5%
10%
15%
20%
25%
30%
35%
1999 2004 2009 2014
Figure DB9 – Vote for Golkar/Gerindra/Hanura by rural-urban location
Rural Urban
Source: authors' computations using Indonesian political attitudes surveys.Note: the figure shows the share of votes received by Golkar/Gerindra/Hanura by rural-urban location.
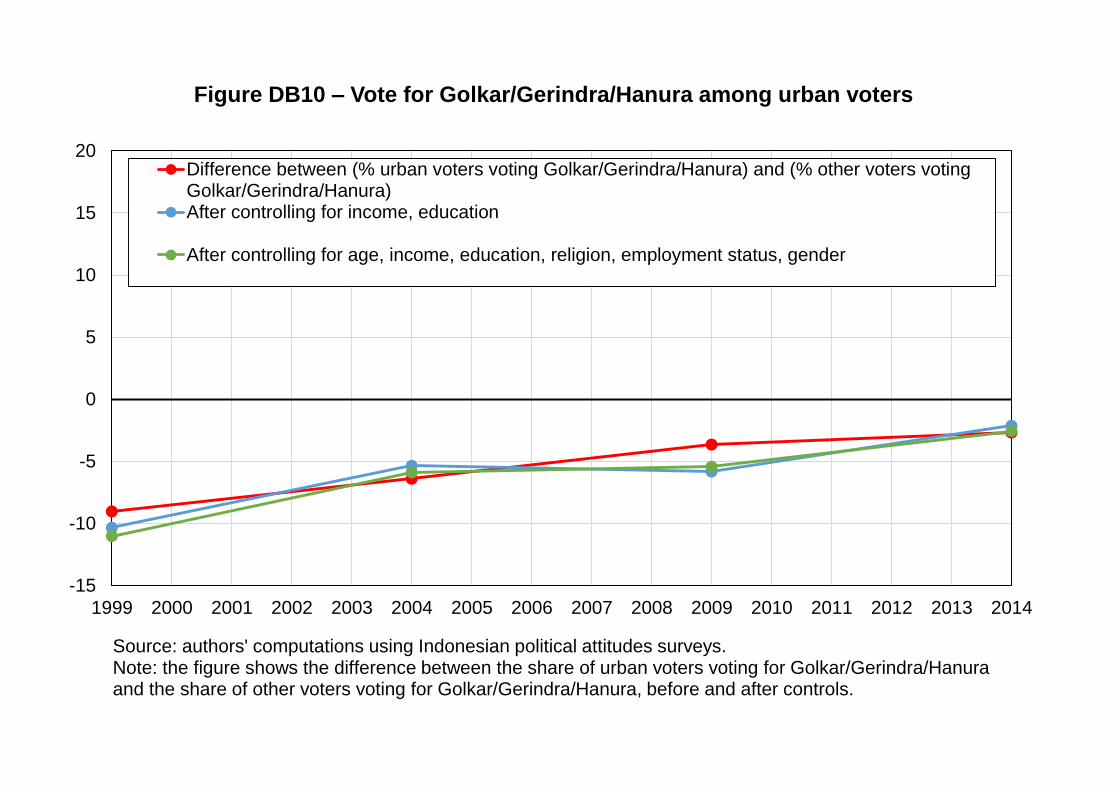
-15
-10
-5
0
5
10
15
20
1999 2000 2001 2002 2003 2004 2005 2006 2007 2008 2009 2010 2011 2012 2013 2014
Figure DB10 – Vote for Golkar/Gerindra/Hanura among urban voters
Difference between (% urban voters voting Golkar/Gerindra/Hanura) and (% other voters votingGolkar/Gerindra/Hanura)After controlling for income, education
After controlling for age, income, education, religion, employment status, gender
Source: authors' computations using Indonesian political attitudes surveys.Note: the figure shows the difference between the share of urban voters voting for Golkar/Gerindra/Hanura and the share of other voters voting for Golkar/Gerindra/Hanura, before and after controls.

0%
10%
20%
30%
40%
50%
60%
70%
80%
90%
1999 2004 2009 2014
Figure DB11 – Vote for Golkar/Gerindra/Hanura by ethnicity
Batak Betawi Bugis Java Madurese
Malay Minang Sundanese Other
Source: authors' computations using Indonesian political attitudes surveys.Note: the figure shows the share of votes received by Golkar/Gerindra/Hanura by ethnic affiliation.
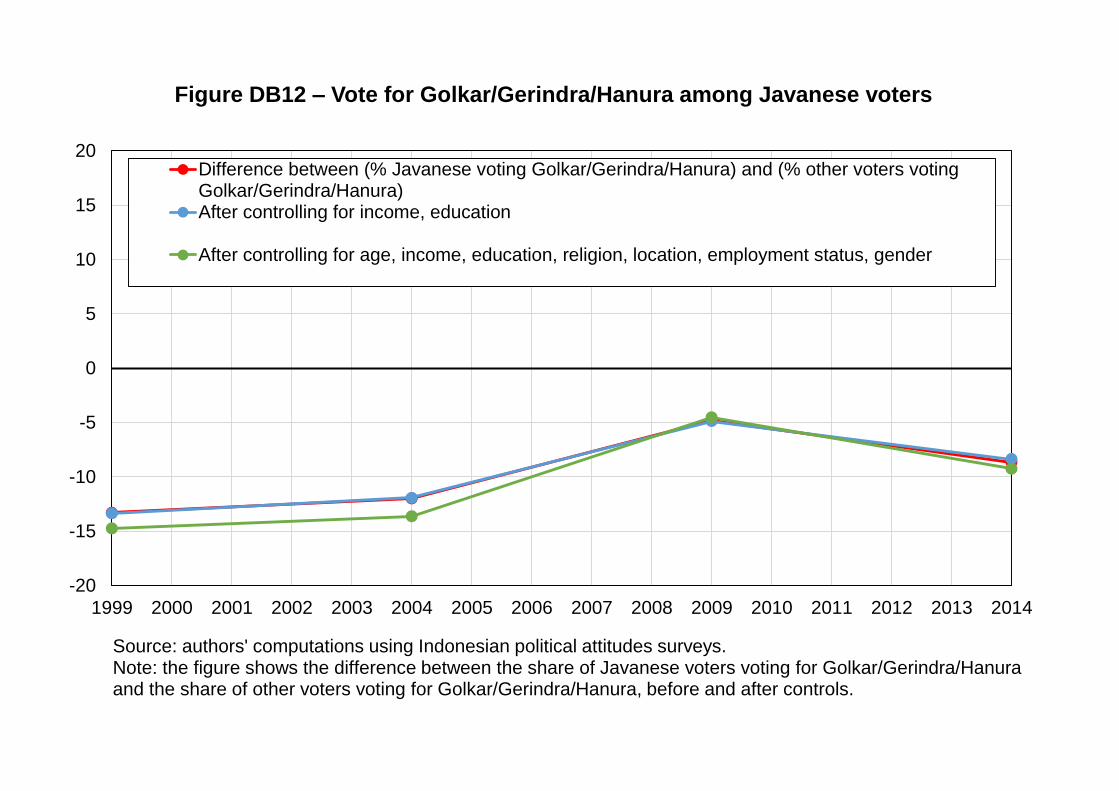
-20
-15
-10
-5
0
5
10
15
20
1999 2000 2001 2002 2003 2004 2005 2006 2007 2008 2009 2010 2011 2012 2013 2014
Figure DB12 – Vote for Golkar/Gerindra/Hanura among Javanese voters
Difference between (% Javanese voting Golkar/Gerindra/Hanura) and (% other voters votingGolkar/Gerindra/Hanura)After controlling for income, education
After controlling for age, income, education, religion, location, employment status, gender
Source: authors' computations using Indonesian political attitudes surveys.Note: the figure shows the difference between the share of Javanese voters voting for Golkar/Gerindra/Hanura and the share of other voters voting for Golkar/Gerindra/Hanura, before and after controls.
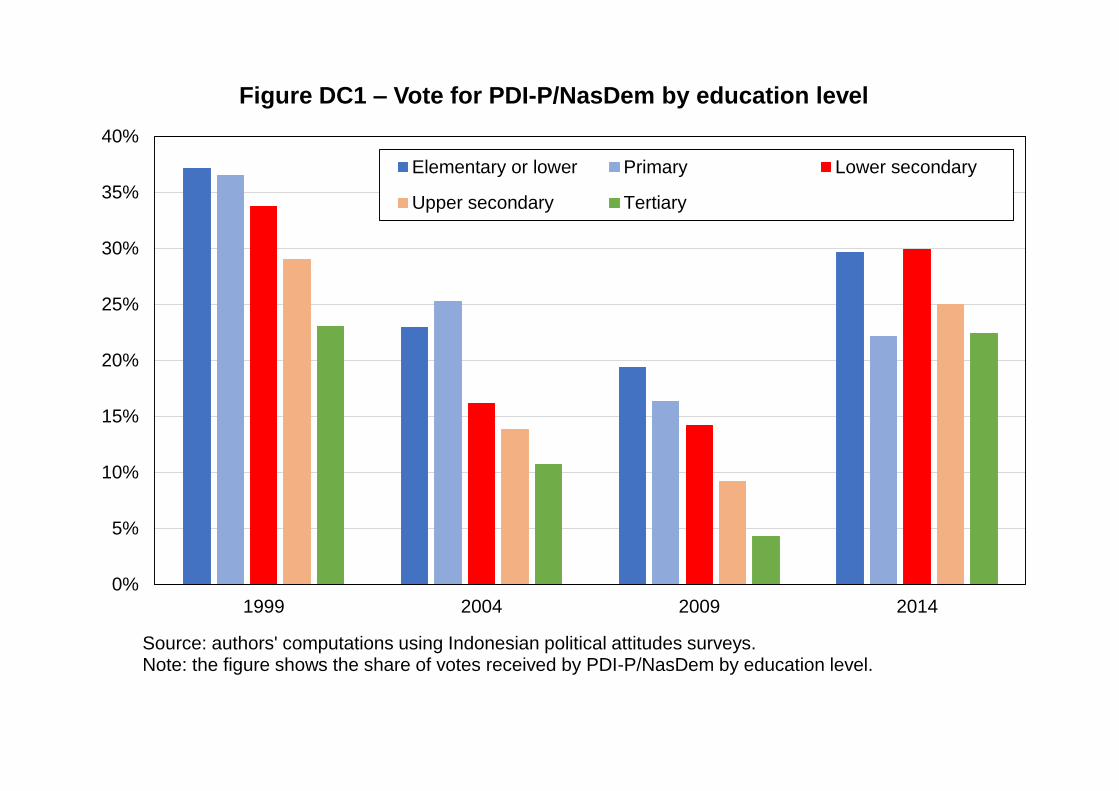
0%
5%
10%
15%
20%
25%
30%
35%
40%
1999 2004 2009 2014
Figure DC1 – Vote for PDI-P/NasDem by education level
Elementary or lower Primary Lower secondary
Upper secondary Tertiary
Source: authors' computations using Indonesian political attitudes surveys.Note: the figure shows the share of votes received by PDI-P/NasDem by education level.

-20
-15
-10
-5
0
5
10
15
20
1999 2000 2001 2002 2003 2004 2005 2006 2007 2008 2009 2010 2011 2012 2013 2014
Figure DC2 – Vote for PDI-P/NasDem among higher-educated voters
Difference between (% top 10% educated voting PDI-P/NasDem) and (% bottom 90% voting PDI-P/NasDem)After controlling for religion
After controlling for religion, location, age, income, employment status, gender
Source: authors' computations using Indonesian political attitudes surveys.Note: the figure shows the difference between the share of top 10% educated voters voting for PDI-P/NasDem and the share of other voters voting for these parties, before and after controls.
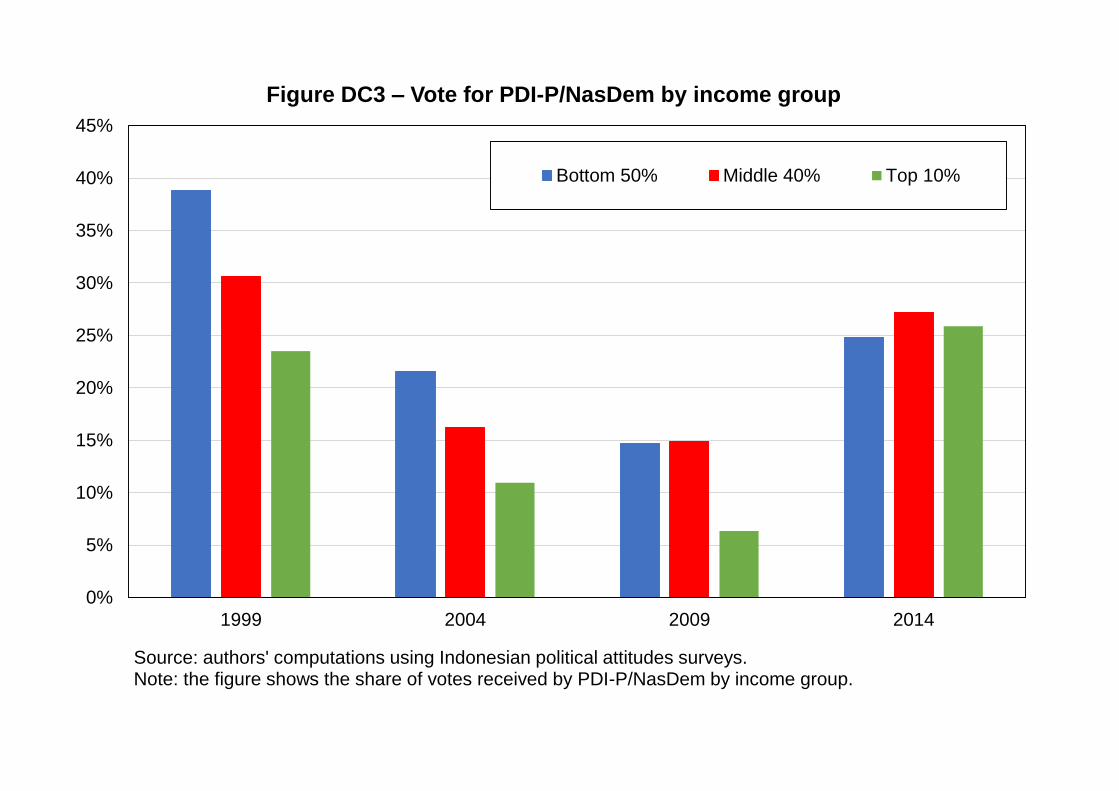
0%
5%
10%
15%
20%
25%
30%
35%
40%
45%
1999 2004 2009 2014
Figure DC3 – Vote for PDI-P/NasDem by income group
Bottom 50% Middle 40% Top 10%
Source: authors' computations using Indonesian political attitudes surveys.Note: the figure shows the share of votes received by PDI-P/NasDem by income group.

-20
-15
-10
-5
0
5
10
15
20
1999 2000 2001 2002 2003 2004 2005 2006 2007 2008 2009 2010 2011 2012 2013 2014
Figure DC4 – Vote for PDI-P/NasDem among top-income voters
Difference between (% top 10% earners voting PDI-P/NasDem) and (% bottom 90% voting PDI-P/NasDem)After controlling for religion
After controlling for religion, location, age, education, employment status, gender
Source: authors' computations using Indonesian political attitudes surveys.Note: the figure shows the difference between the share of top 10% earners voting for PDI-P/NasDem and the share of other voters voting for PDI-P/NasDem, before and after controls.

0%
10%
20%
30%
40%
50%
60%
1999 2004 2009 2014
Figure DC5 – Vote for PDI-P/NasDem by religion
Practicing Muslims Non-practicing Muslims Non-Muslims
Source: authors' computations using Indonesian political attitudes surveys.Note: the figure shows the share of votes received by PDI-P/NasDem by religion.
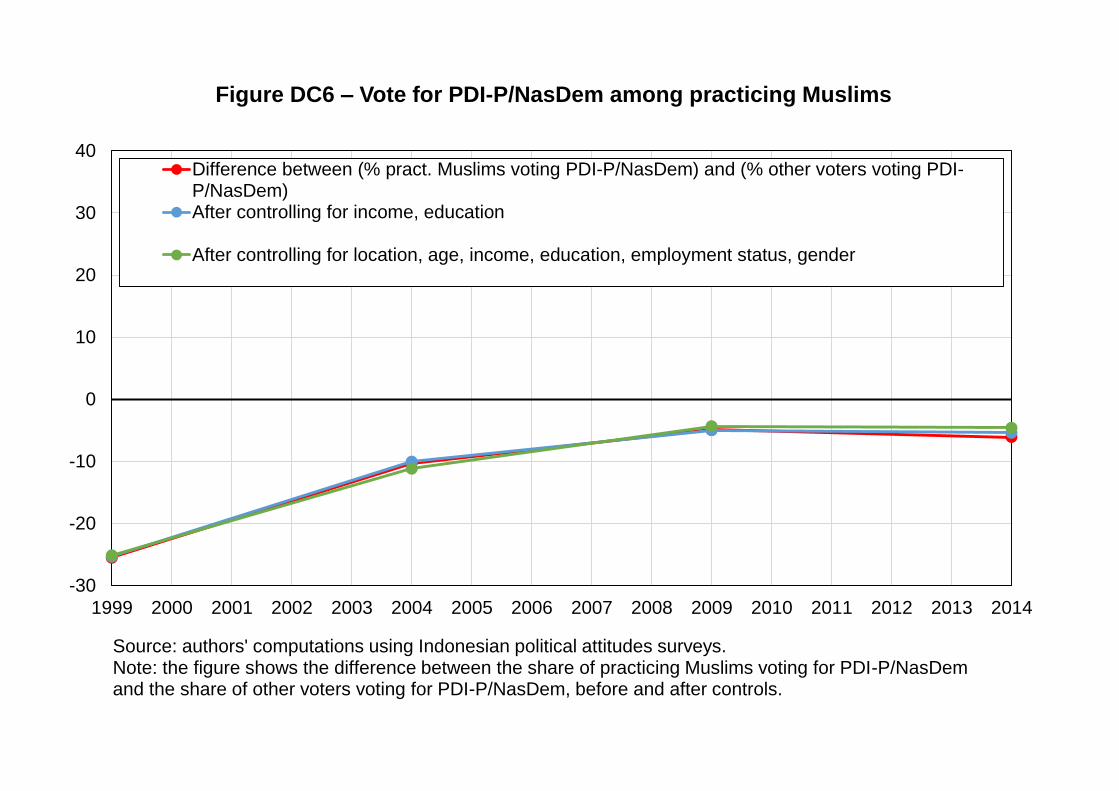
-30
-20
-10
0
10
20
30
40
1999 2000 2001 2002 2003 2004 2005 2006 2007 2008 2009 2010 2011 2012 2013 2014
Figure DC6 – Vote for PDI-P/NasDem among practicing Muslims
Difference between (% pract. Muslims voting PDI-P/NasDem) and (% other voters voting PDI-P/NasDem)After controlling for income, education
After controlling for location, age, income, education, employment status, gender
Source: authors' computations using Indonesian political attitudes surveys.Note: the figure shows the difference between the share of practicing Muslims voting for PDI-P/NasDem and the share of other voters voting for PDI-P/NasDem, before and after controls.

0%
5%
10%
15%
20%
25%
30%
35%
40%
45%
1999 2004 2009 2014
Figure DC7 – Vote for PDI-P/NasDem by age group
20-39 40-59 60+
Source: authors' computations using Indonesian political attitudes surveys.Note: the figure shows the share of votes received by PDI-P/NasDem by age group.
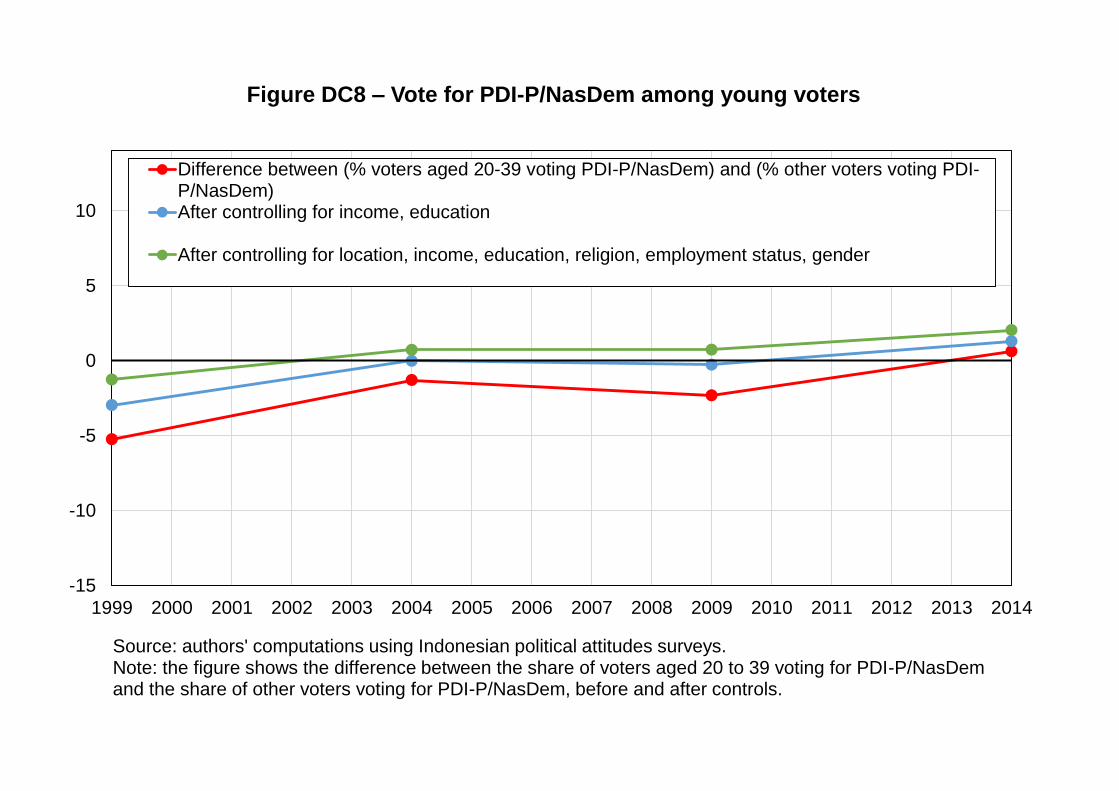
-15
-10
-5
0
5
10
1999 2000 2001 2002 2003 2004 2005 2006 2007 2008 2009 2010 2011 2012 2013 2014
Figure DC8 – Vote for PDI-P/NasDem among young voters
Difference between (% voters aged 20-39 voting PDI-P/NasDem) and (% other voters voting PDI-P/NasDem)After controlling for income, education
After controlling for location, income, education, religion, employment status, gender
Source: authors' computations using Indonesian political attitudes surveys.Note: the figure shows the difference between the share of voters aged 20 to 39 voting for PDI-P/NasDem and the share of other voters voting for PDI-P/NasDem, before and after controls.
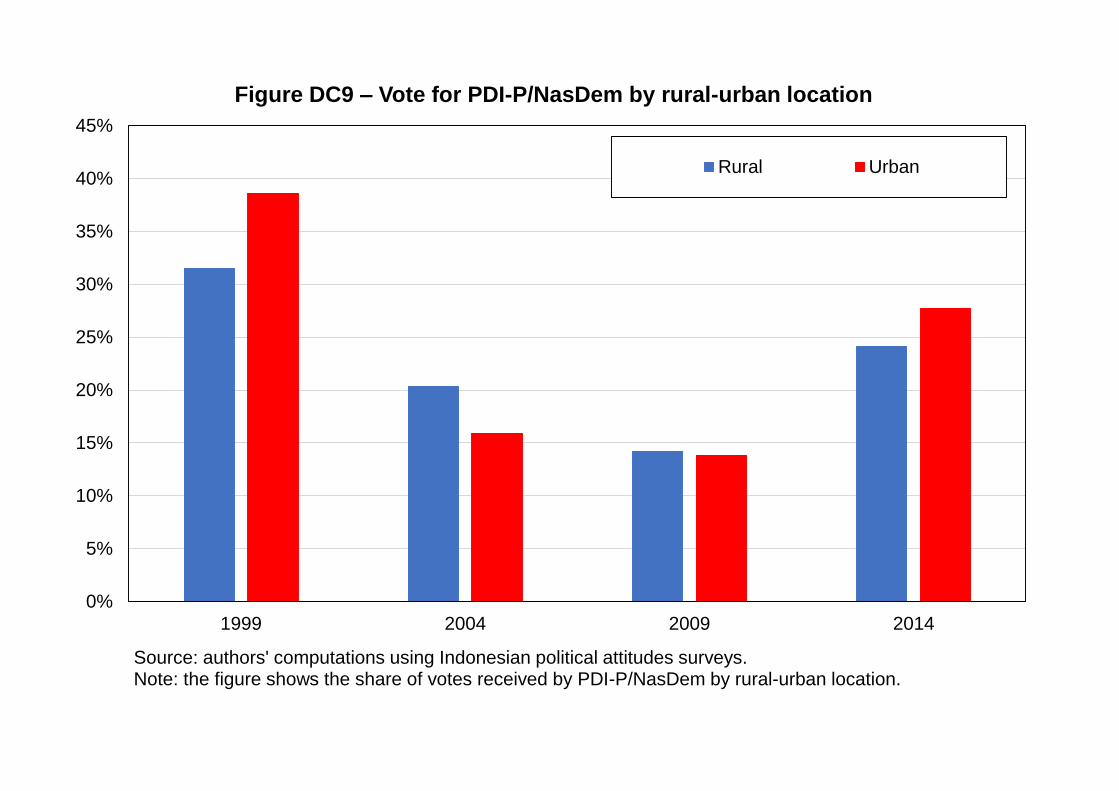
0%
5%
10%
15%
20%
25%
30%
35%
40%
45%
1999 2004 2009 2014
Figure DC9 – Vote for PDI-P/NasDem by rural-urban location
Rural Urban
Source: authors' computations using Indonesian political attitudes surveys.Note: the figure shows the share of votes received by PDI-P/NasDem by rural-urban location.
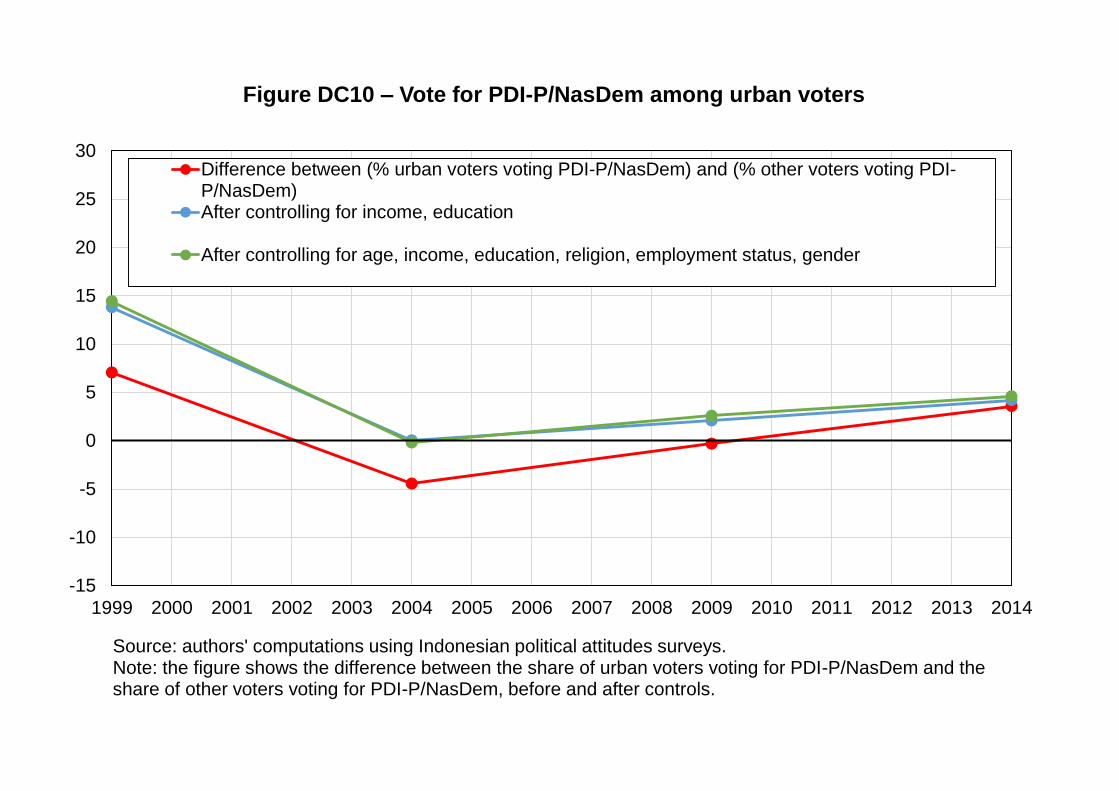
-15
-10
-5
0
5
10
15
20
25
30
1999 2000 2001 2002 2003 2004 2005 2006 2007 2008 2009 2010 2011 2012 2013 2014
Figure DC10 – Vote for PDI-P/NasDem among urban voters
Difference between (% urban voters voting PDI-P/NasDem) and (% other voters voting PDI-P/NasDem)After controlling for income, education
After controlling for age, income, education, religion, employment status, gender
Source: authors' computations using Indonesian political attitudes surveys.Note: the figure shows the difference between the share of urban voters voting for PDI-P/NasDem and the share of other voters voting for PDI-P/NasDem, before and after controls.

0%
5%
10%
15%
20%
25%
30%
35%
40%
45%
1999 2004 2009 2014
Figure DC11 – Vote for PDI-P/NasDem by ethnicity
Batak Betawi Bugis
Java Madurese Malay
Minang Sundanese Other
Source: authors' computations using Indonesian political attitudes surveys.Note: the figure shows the share of votes received by PDI-P/NasDem by ethnic affiliation.
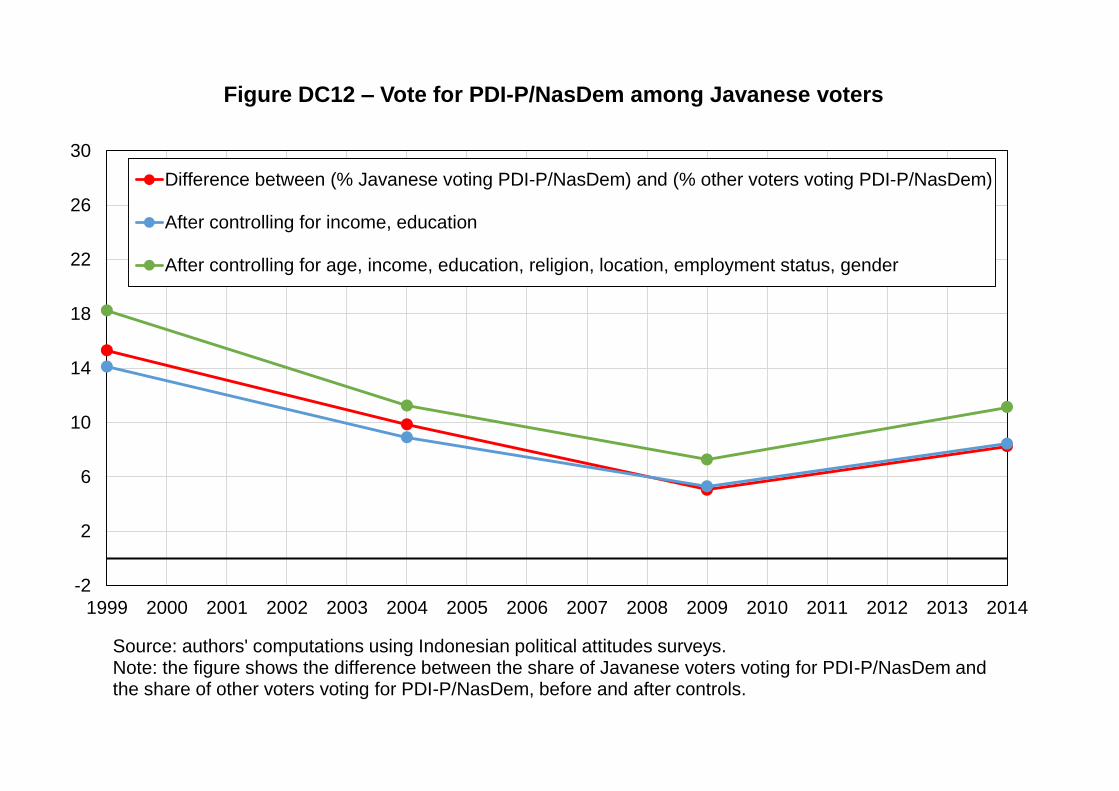
-2
2
6
10
14
18
22
26
30
1999 2000 2001 2002 2003 2004 2005 2006 2007 2008 2009 2010 2011 2012 2013 2014
Figure DC12 – Vote for PDI-P/NasDem among Javanese voters
Difference between (% Javanese voting PDI-P/NasDem) and (% other voters voting PDI-P/NasDem)
After controlling for income, education
After controlling for age, income, education, religion, location, employment status, gender
Source: authors' computations using Indonesian political attitudes surveys.Note: the figure shows the difference between the share of Javanese voters voting for PDI-P/NasDem and the share of other voters voting for PDI-P/NasDem, before and after controls.
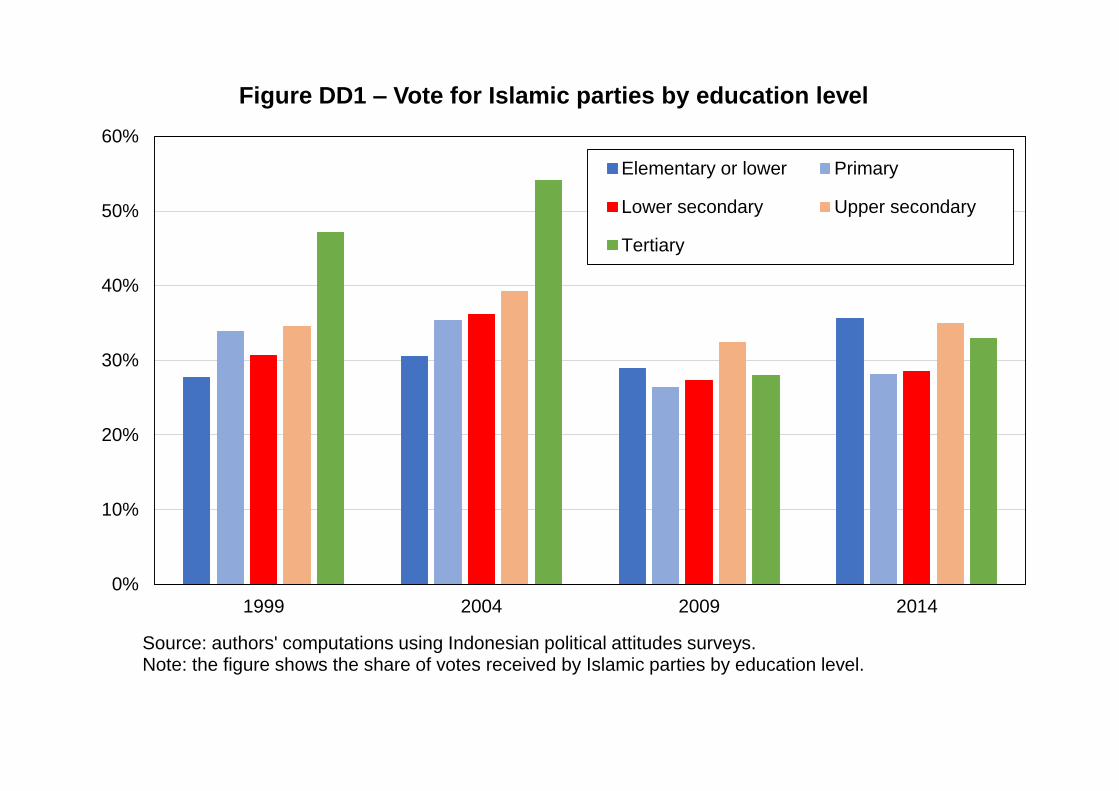
0%
10%
20%
30%
40%
50%
60%
1999 2004 2009 2014
Figure DD1 – Vote for Islamic parties by education level
Elementary or lower Primary
Lower secondary Upper secondary
Tertiary
Source: authors' computations using Indonesian political attitudes surveys.Note: the figure shows the share of votes received by Islamic parties by education level.

-5
0
5
10
15
20
25
30
35
40
1999 2000 2001 2002 2003 2004 2005 2006 2007 2008 2009 2010 2011 2012 2013 2014
Figure DD2 – Vote for Islamic parties among higher-educated voters
Difference between (% top 10% educated voting Islamic parties) and (% bottom 90% voting Islamicparties)After controlling for religion
After controlling for religion, location, age, income, employment status, gender
Source: authors' computations using Indonesian political attitudes surveys.Note: the figure shows the difference between the share of top 10% educated voters voting for Islamic parties and the share of other voters voting for Islamic parties, before and after controls.
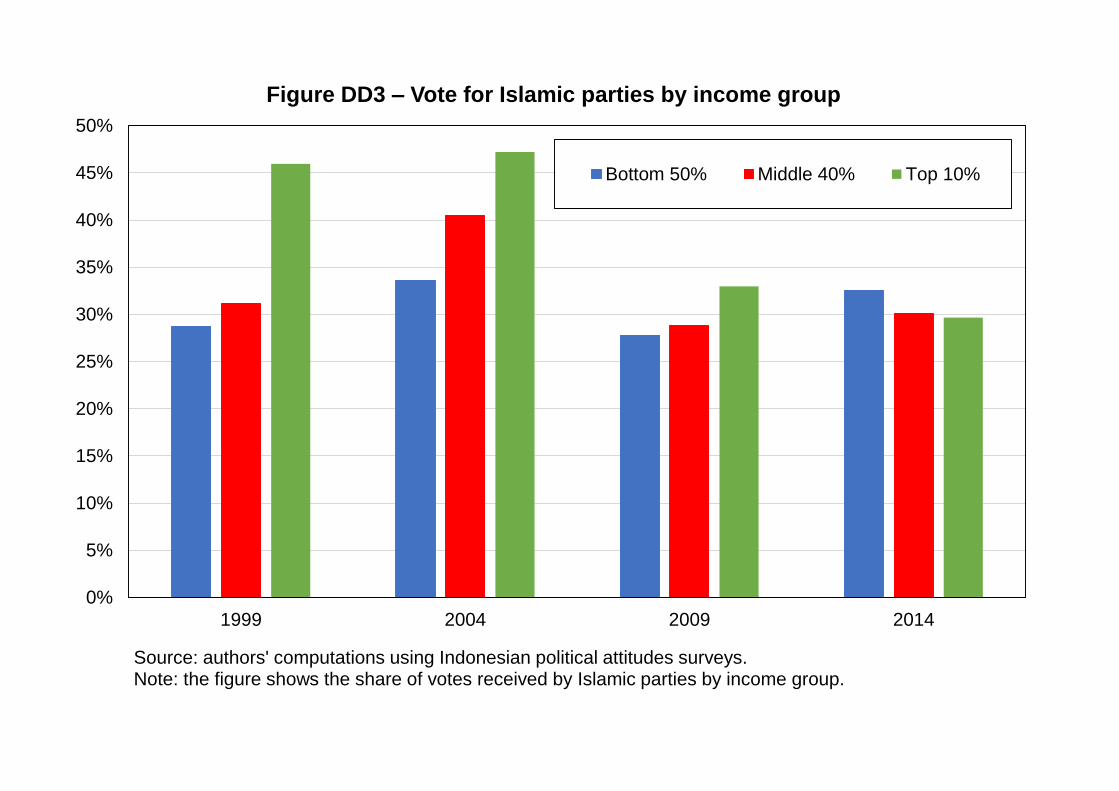
0%
5%
10%
15%
20%
25%
30%
35%
40%
45%
50%
1999 2004 2009 2014
Figure DD3 – Vote for Islamic parties by income group
Bottom 50% Middle 40% Top 10%
Source: authors' computations using Indonesian political attitudes surveys.Note: the figure shows the share of votes received by Islamic parties by income group.

-10
-5
0
5
10
15
20
25
30
35
1999 2000 2001 2002 2003 2004 2005 2006 2007 2008 2009 2010 2011 2012 2013 2014
Figure DD4 – Vote for Islamic parties among top-income voters
Difference between (% top 10% earners voting Islamic parties) and (% bottom 90% voting Islamicparties)After controlling for religion
After controlling for religion, location, age, education, employment status, gender
Source: authors' computations using Indonesian political attitudes surveys.Note: the figure shows the difference between the share of top 10% earners voting for Islamic parties and the share of other voters voting for Islamic parties, before and after controls.
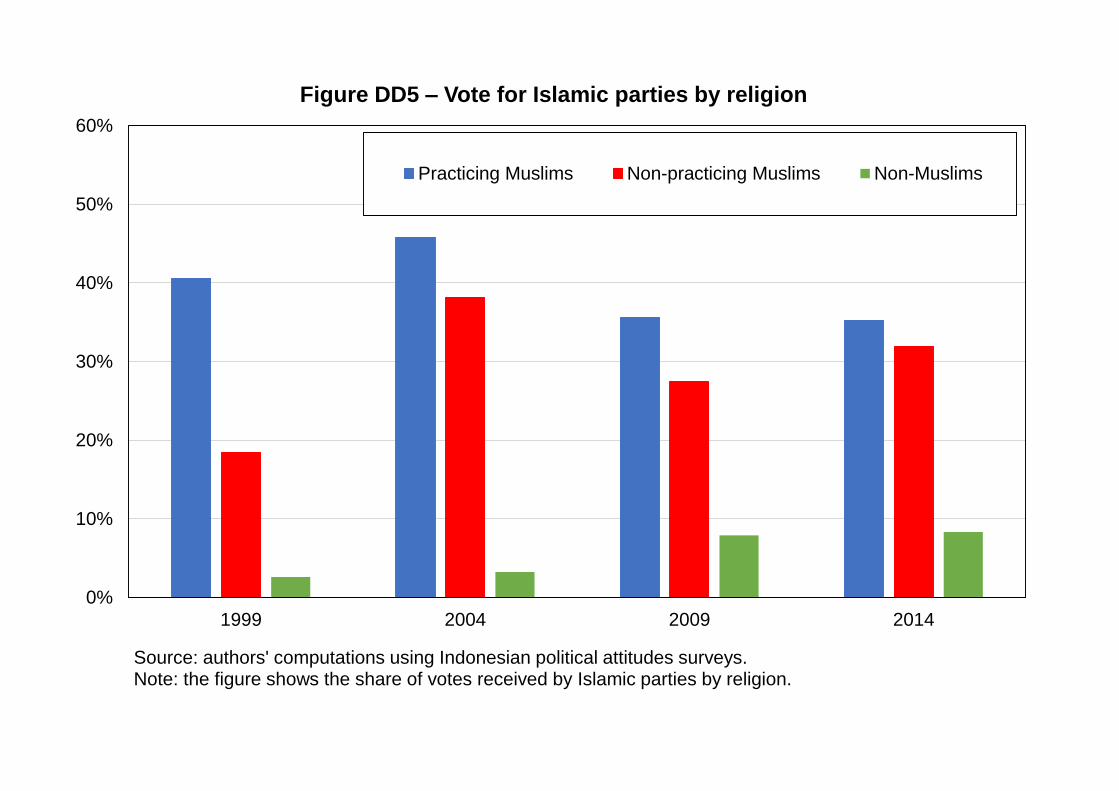
0%
10%
20%
30%
40%
50%
60%
1999 2004 2009 2014
Figure DD5 – Vote for Islamic parties by religion
Practicing Muslims Non-practicing Muslims Non-Muslims
Source: authors' computations using Indonesian political attitudes surveys.Note: the figure shows the share of votes received by Islamic parties by religion.

-10
0
10
20
30
40
50
60
70
1999 2000 2001 2002 2003 2004 2005 2006 2007 2008 2009 2010 2011 2012 2013 2014
Figure DD6 – Vote for Islamic parties among practicing Muslims
Difference between (% pract. Muslims voting Islamic parties) and (%other voters voting Islamicparties)After controlling for income, education
After controlling for location, age, income, education, employment status, gender
Source: authors' computations using Indonesian political attitudes surveys.Note: the figure shows the difference between the share of practicing Muslims voting for Islamic parties and the share of other voters voting for Islamic parties, before and after controls.
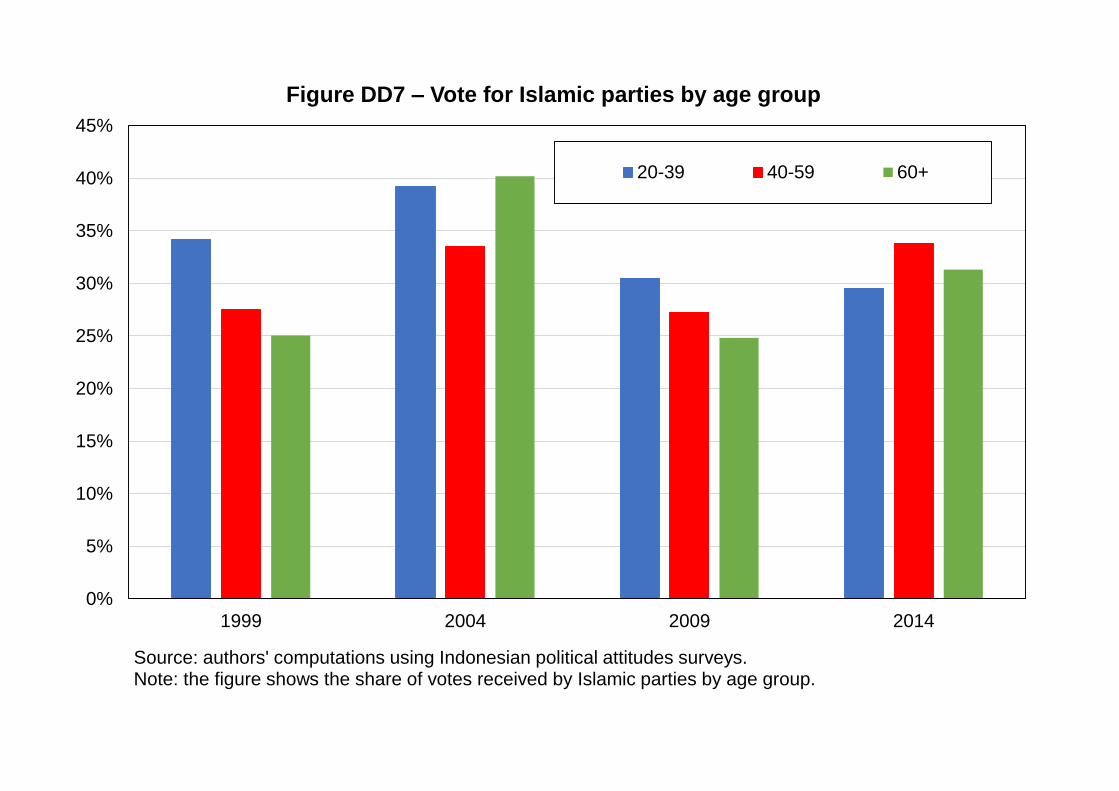
0%
5%
10%
15%
20%
25%
30%
35%
40%
45%
1999 2004 2009 2014
Figure DD7 – Vote for Islamic parties by age group
20-39 40-59 60+
Source: authors' computations using Indonesian political attitudes surveys.Note: the figure shows the share of votes received by Islamic parties by age group.
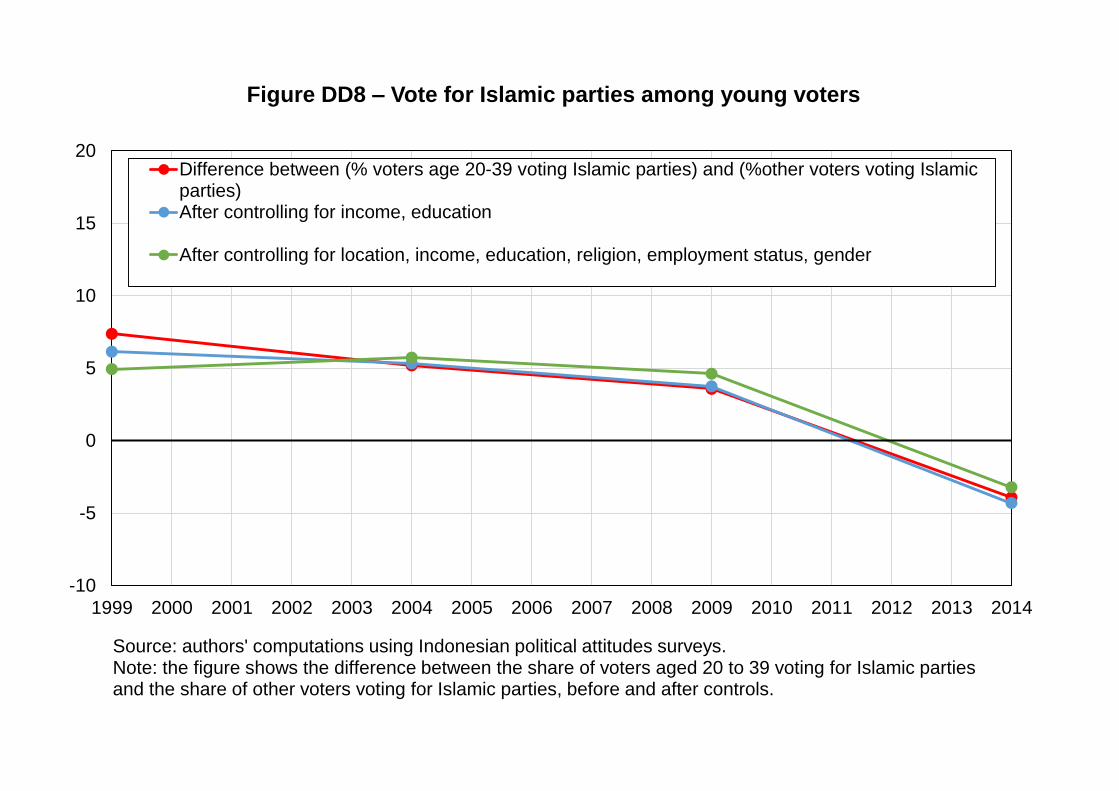
-10
-5
0
5
10
15
20
1999 2000 2001 2002 2003 2004 2005 2006 2007 2008 2009 2010 2011 2012 2013 2014
Figure DD8 – Vote for Islamic parties among young voters
Difference between (% voters age 20-39 voting Islamic parties) and (%other voters voting Islamicparties)After controlling for income, education
After controlling for location, income, education, religion, employment status, gender
Source: authors' computations using Indonesian political attitudes surveys.Note: the figure shows the difference between the share of voters aged 20 to 39 voting for Islamic parties and the share of other voters voting for Islamic parties, before and after controls.

0%
5%
10%
15%
20%
25%
30%
35%
40%
45%
1999 2004 2009 2014
Figure DD9 – Vote for Islamic parties by rural-urban location
Rural Urban
Source: authors' computations using Indonesian political attitudes surveys.Note: the figure shows the share of votes received by Islamic parties by rural-urban location.
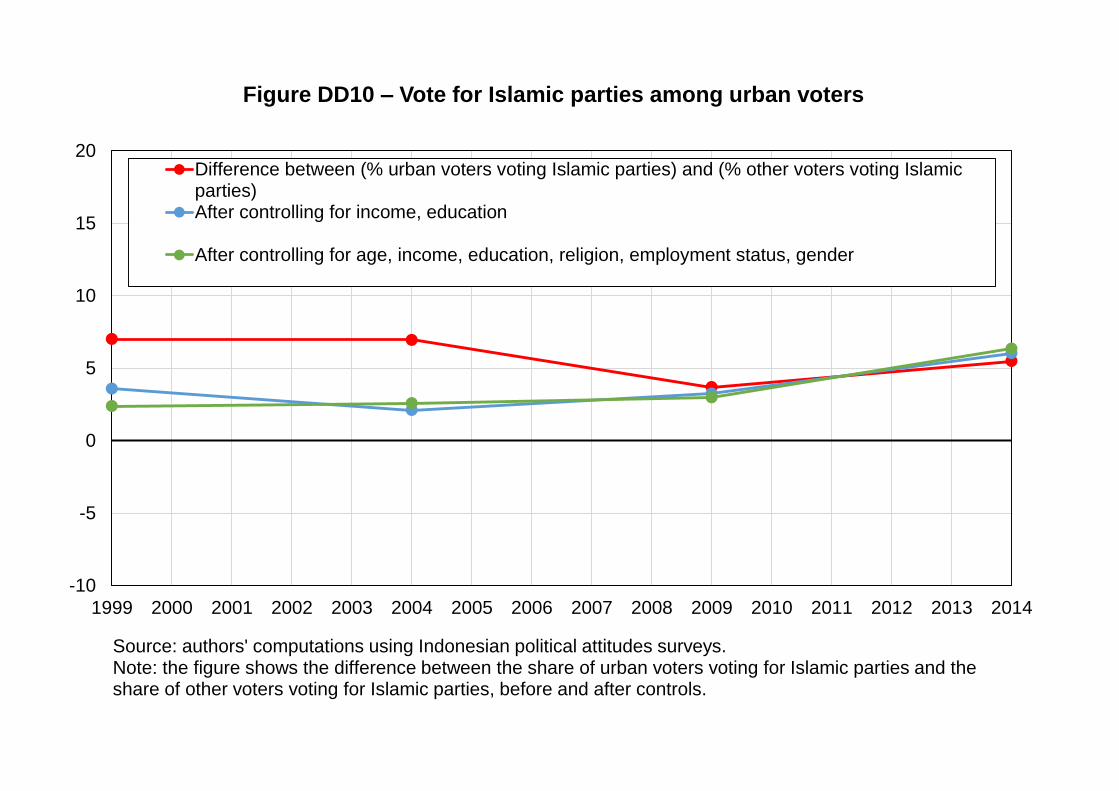
-10
-5
0
5
10
15
20
1999 2000 2001 2002 2003 2004 2005 2006 2007 2008 2009 2010 2011 2012 2013 2014
Figure DD10 – Vote for Islamic parties among urban voters
Difference between (% urban voters voting Islamic parties) and (% other voters voting Islamicparties)After controlling for income, education
After controlling for age, income, education, religion, employment status, gender
Source: authors' computations using Indonesian political attitudes surveys.Note: the figure shows the difference between the share of urban voters voting for Islamic parties and the share of other voters voting for Islamic parties, before and after controls.
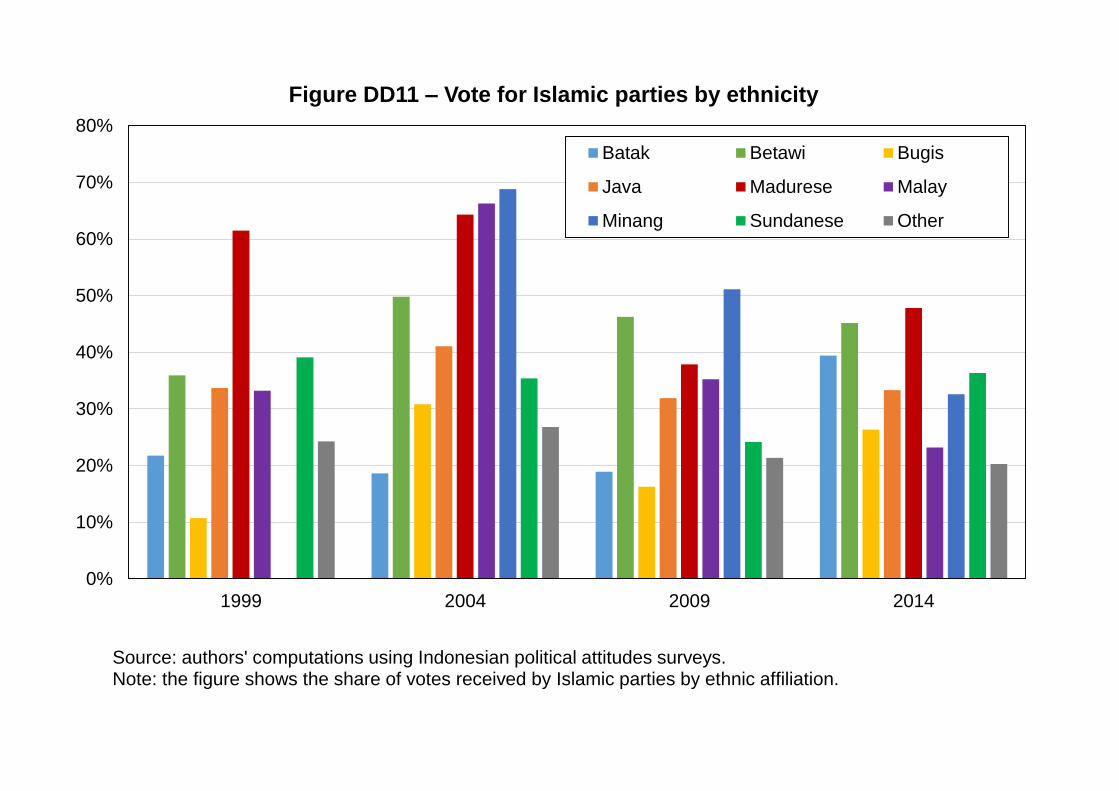
0%
10%
20%
30%
40%
50%
60%
70%
80%
1999 2004 2009 2014
Figure DD11 – Vote for Islamic parties by ethnicity
Batak Betawi Bugis
Java Madurese Malay
Minang Sundanese Other
Source: authors' computations using Indonesian political attitudes surveys.Note: the figure shows the share of votes received by Islamic parties by ethnic affiliation.
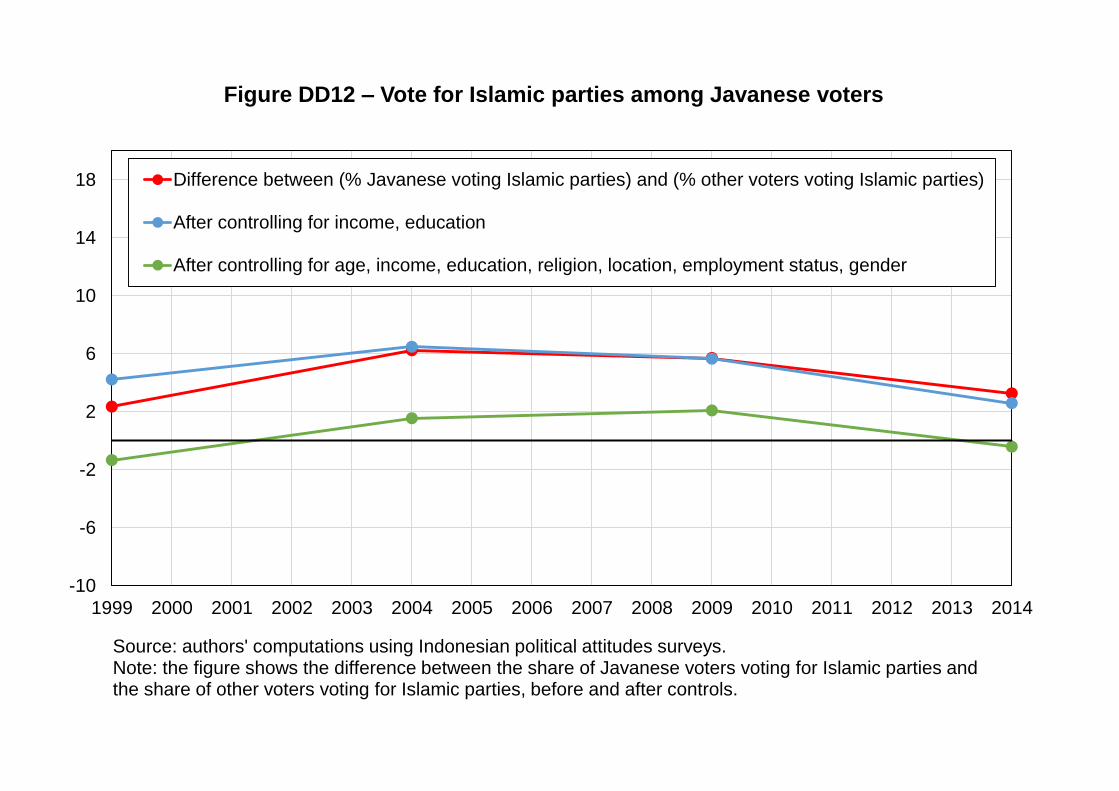
-10
-6
-2
2
6
10
14
18
1999 2000 2001 2002 2003 2004 2005 2006 2007 2008 2009 2010 2011 2012 2013 2014
Figure DD12 – Vote for Islamic parties among Javanese voters
Difference between (% Javanese voting Islamic parties) and (% other voters voting Islamic parties)
After controlling for income, education
After controlling for age, income, education, religion, location, employment status, gender
Source: authors' computations using Indonesian political attitudes surveys.Note: the figure shows the difference between the share of Javanese voters voting for Islamic parties and the share of other voters voting for Islamic parties, before and after controls.

0%
5%
10%
15%
20%
25%
30%
35%
2004 2009 2014
Figure DE1 – Vote for PD by education level
Elementary or lower Primary
Lower secondary Upper secondary
Tertiary
Source: authors' computations using Indonesian political attitudes surveys.Note: the figure shows the share of votes received by PD by education level.

-10
-5
0
5
10
15
20
2004 2005 2006 2007 2008 2009 2010 2011 2012 2013 2014
Figure DE2 – Vote for PD among higher-educated voters
Difference between (% top 10% educated voting PD) and (% bottom 90% voting PD)
After controlling for religion
After controlling for religion, location, age, income, employment status, gender
Source: authors' computations using Indonesian political attitudes surveys.Note: the figure shows the difference between the share of top 10% educated voters voting for the Democratic Party and the share of other voters voting for the Democratic Party, before and after controls.
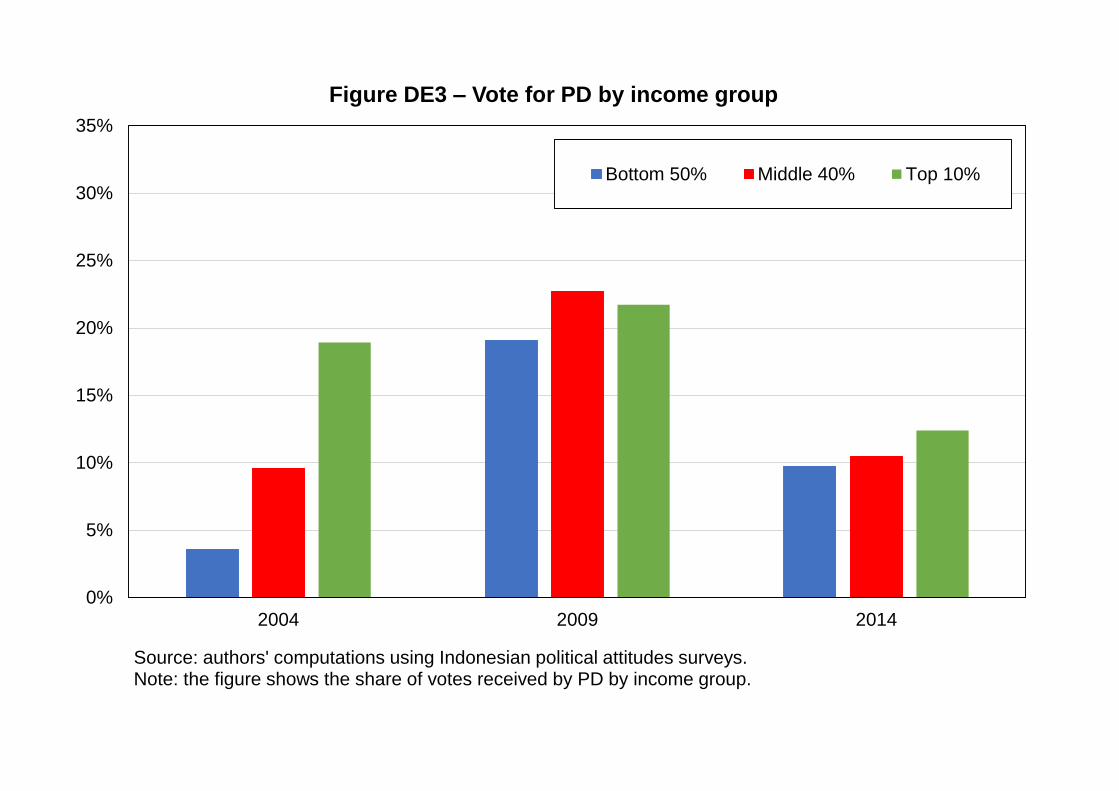
0%
5%
10%
15%
20%
25%
30%
35%
2004 2009 2014
Figure DE3 – Vote for PD by income group
Bottom 50% Middle 40% Top 10%
Source: authors' computations using Indonesian political attitudes surveys.Note: the figure shows the share of votes received by PD by income group.

-5
0
5
10
15
20
25
2004 2005 2006 2007 2008 2009 2010 2011 2012 2013 2014
Figure DE4 – Vote for PD among top-income voters
Difference between (% top 10% earners voting PD) and (% bottom 90% voting PD)
After controlling for religion
After controlling for religion, location, age, education, employment status, gender
Source: authors' computations using Indonesian political attitudes surveys.Note: the figure shows the difference between the share of top 10% earners voting for the Democratic Party and the share of other voters voting for the Democratic Party, before and after controls.
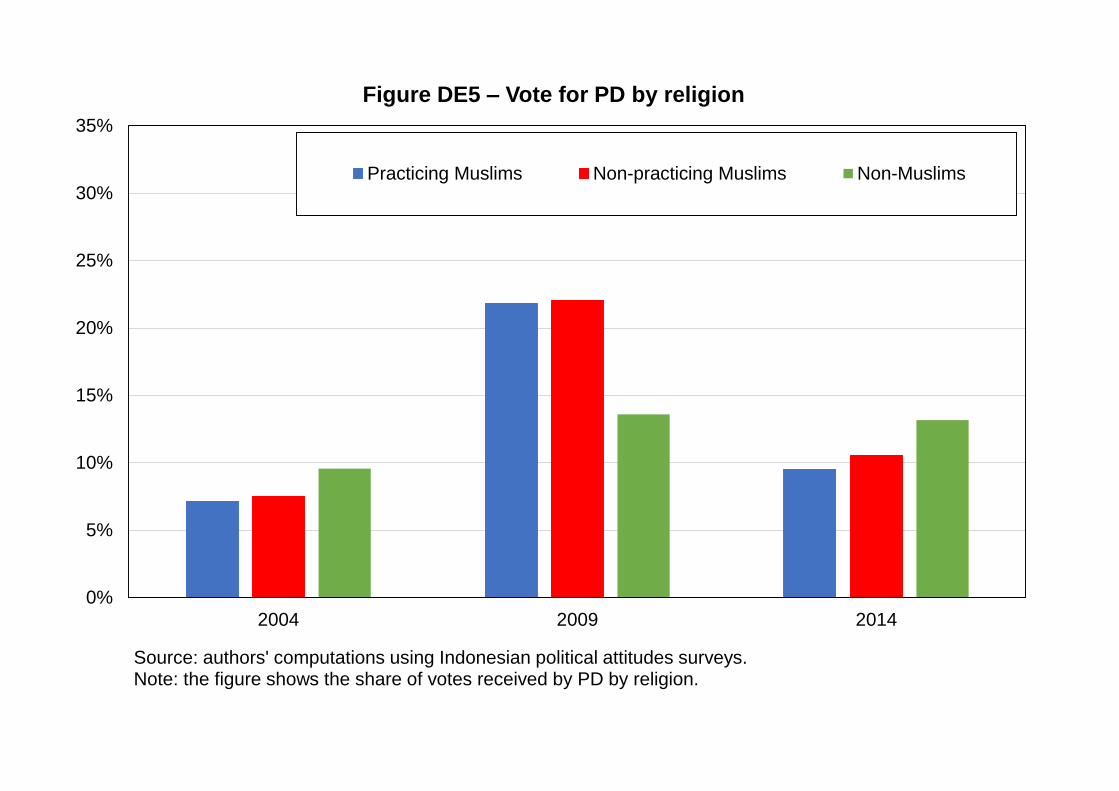
0%
5%
10%
15%
20%
25%
30%
35%
2004 2009 2014
Figure DE5 – Vote for PD by religion
Practicing Muslims Non-practicing Muslims Non-Muslims
Source: authors' computations using Indonesian political attitudes surveys.Note: the figure shows the share of votes received by PD by religion.

-5
0
5
10
15
2004 2005 2006 2007 2008 2009 2010 2011 2012 2013 2014
Figure DE6 – Vote for PD among practicing Muslims
Difference between (% pract. Muslims voting PD) and (% other voters voting PD)
After controlling for income, education
After controlling for location, age, income, education, employment status, gender
Source: authors' computations using Indonesian political attitudes surveys.Note: the figure shows the difference between the share of practicing Muslims voting for the Democratic Party and the share of other voters voting for the Democratic Party, before and after controls.
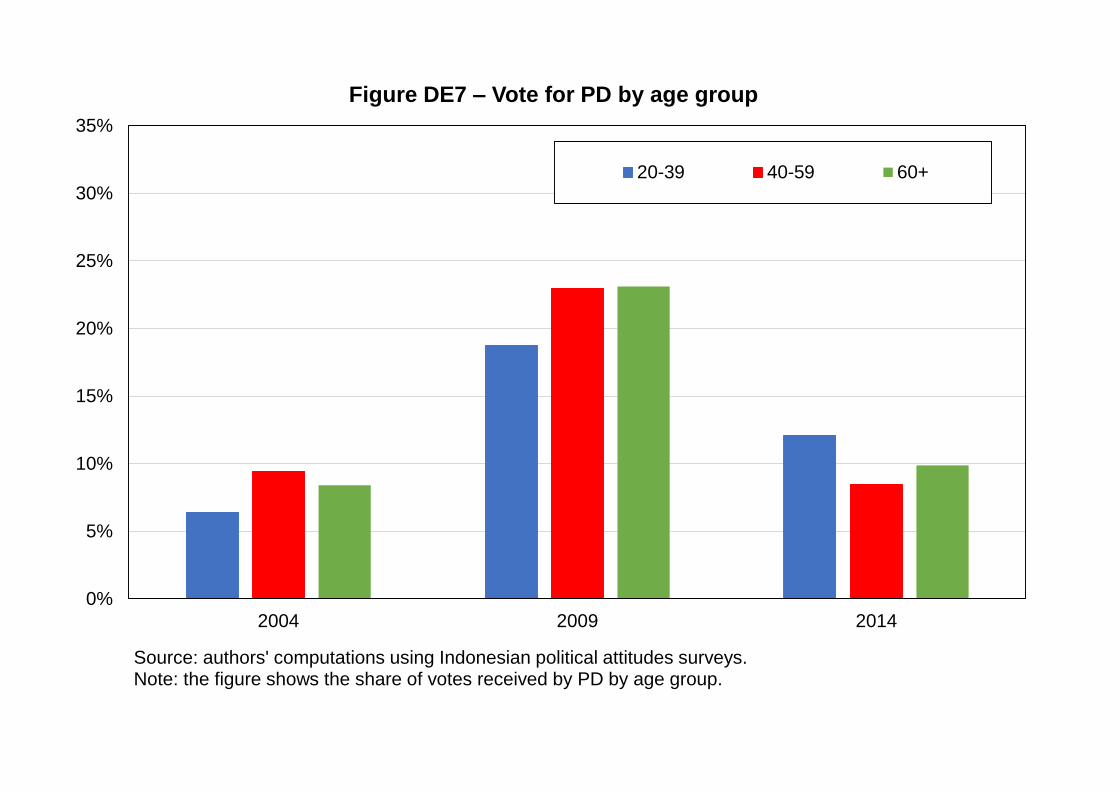
0%
5%
10%
15%
20%
25%
30%
35%
2004 2009 2014
Figure DE7 – Vote for PD by age group
20-39 40-59 60+
Source: authors' computations using Indonesian political attitudes surveys.Note: the figure shows the share of votes received by PD by age group.
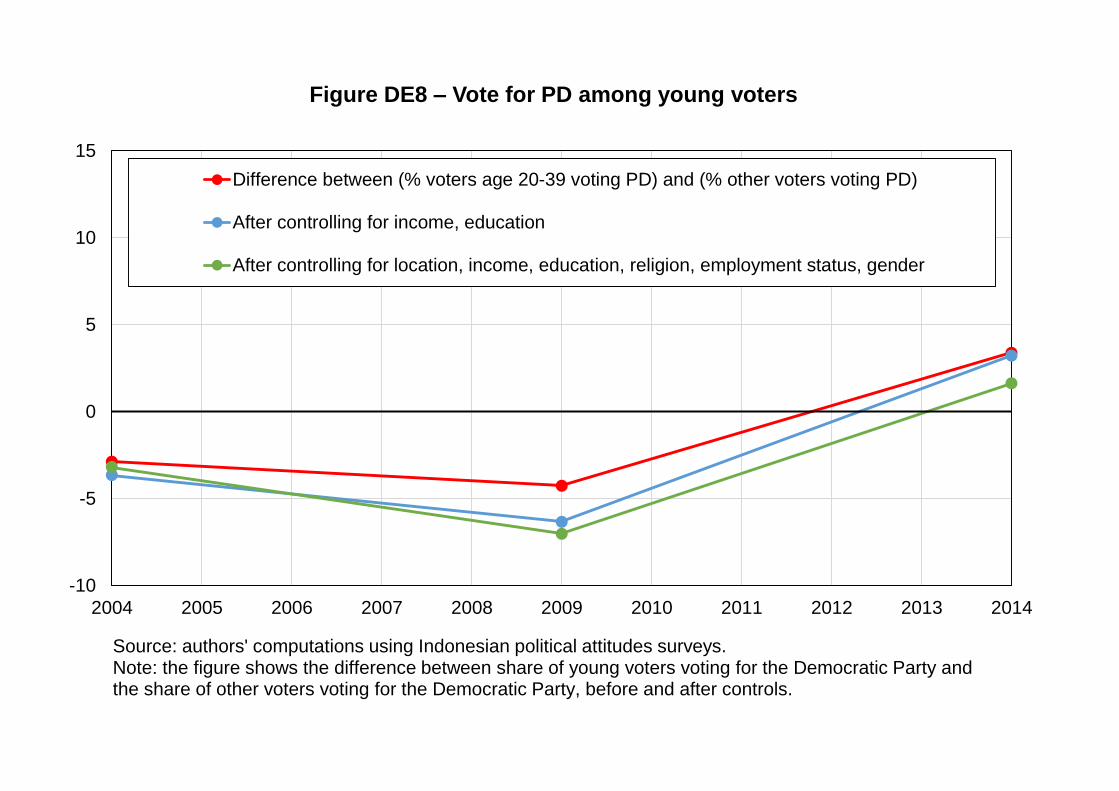
-10
-5
0
5
10
15
2004 2005 2006 2007 2008 2009 2010 2011 2012 2013 2014
Figure DE8 – Vote for PD among young voters
Difference between (% voters age 20-39 voting PD) and (% other voters voting PD)
After controlling for income, education
After controlling for location, income, education, religion, employment status, gender
Source: authors' computations using Indonesian political attitudes surveys.Note: the figure shows the difference between share of young voters voting for the Democratic Party and the share of other voters voting for the Democratic Party, before and after controls.
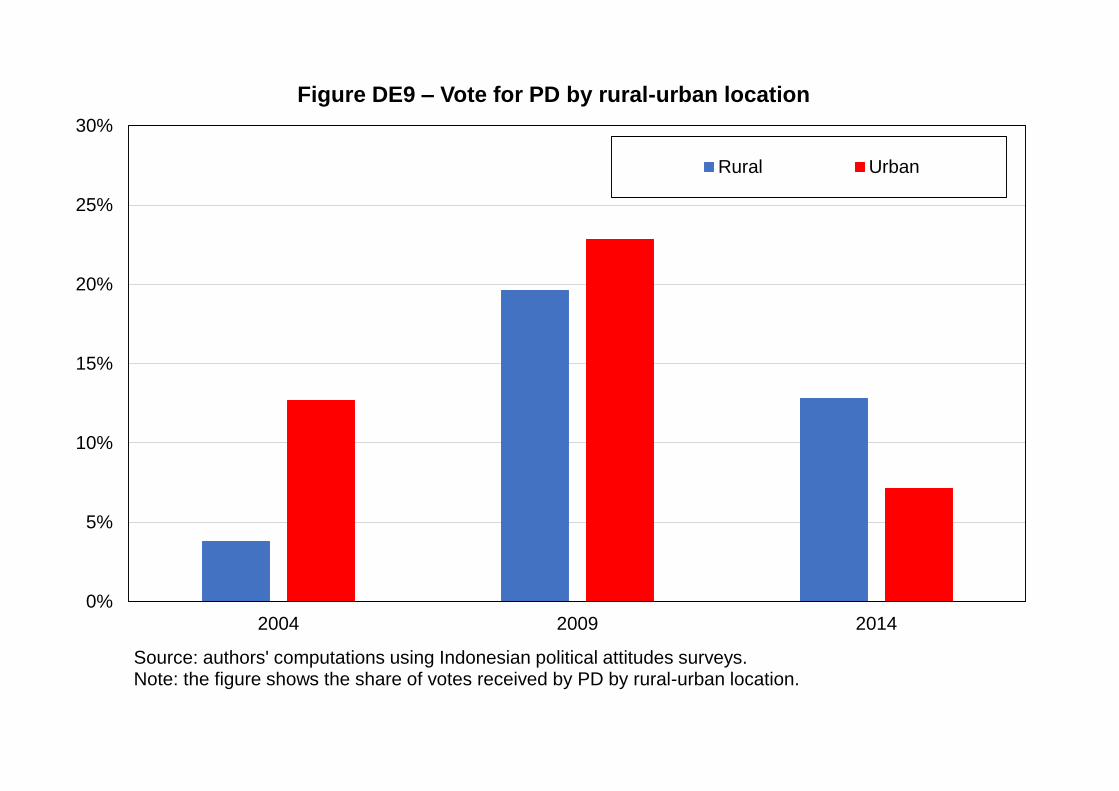
0%
5%
10%
15%
20%
25%
30%
2004 2009 2014
Figure DE9 – Vote for PD by rural-urban location
Rural Urban
Source: authors' computations using Indonesian political attitudes surveys.Note: the figure shows the share of votes received by PD by rural-urban location.

-15
-10
-5
0
5
10
15
20
25
2004 2005 2006 2007 2008 2009 2010 2011 2012 2013 2014
Figure DE10 – Vote for PD among urban voters
Difference between (% urban voters voting PD) and (% other voters voting PD)
After controlling for income, education
After controlling for age, income, education, religion, employment status, gender
Source: authors' computations using Indonesian political attitudes surveys.Note: the figure shows the difference between the share of urban voters voting for PD and the share of other voters voting for PD, before and after controls.

0%
5%
10%
15%
20%
25%
30%
35%
40%
2004 2009 2014
Figure DE11 – Vote for PD by ethnicity
Batak Betawi Bugis Java Madurese Malay Minang Sundanese Other
Source: authors' computations using Indonesian political attitudes surveys.Note: the figure shows the share of votes received by PD by ethnic affiliation.
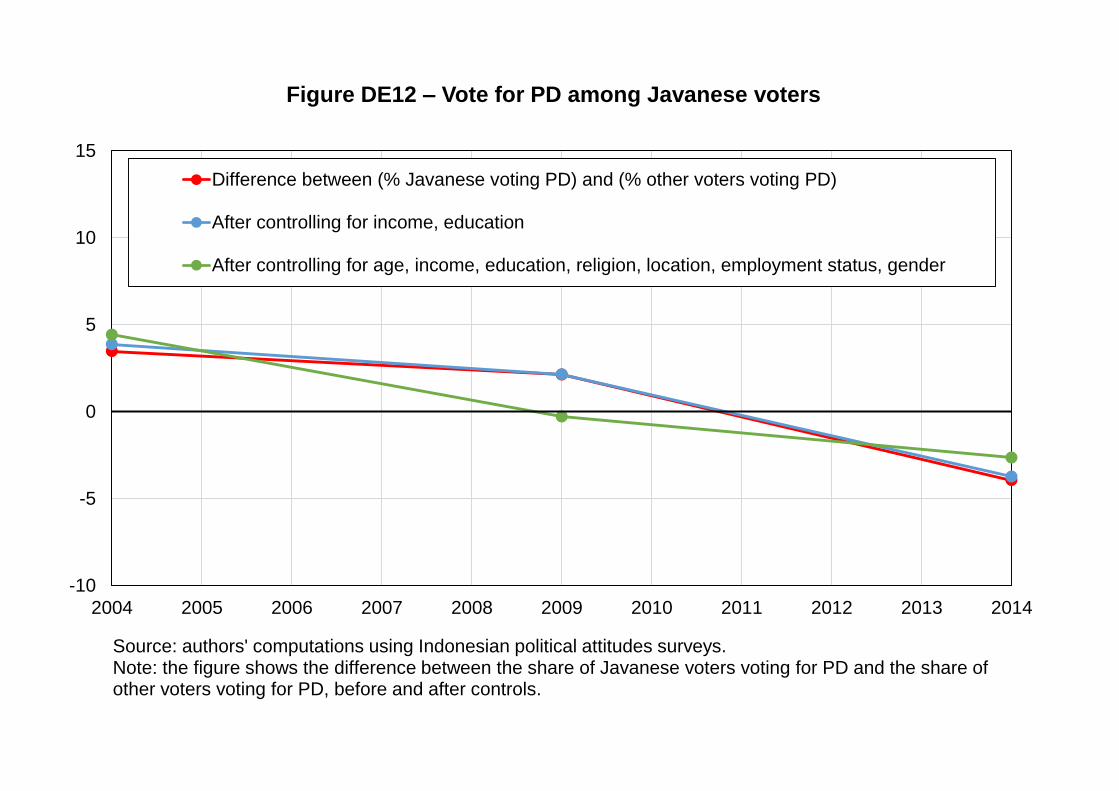
-10
-5
0
5
10
15
2004 2005 2006 2007 2008 2009 2010 2011 2012 2013 2014
Figure DE12 – Vote for PD among Javanese voters
Difference between (% Javanese voting PD) and (% other voters voting PD)
After controlling for income, education
After controlling for age, income, education, religion, location, employment status, gender
Source: authors' computations using Indonesian political attitudes surveys.Note: the figure shows the difference between the share of Javanese voters voting for PD and the share of other voters voting for PD, before and after controls.

0%
5%
10%
15%
20%
25%
30%
35%
2009 2014
Figure DF1 – Vote for Gerindra by education level
Elementary or lower Primary
Lower secondary Upper secondary
Tertiary
Source: authors' computations using Indonesian political attitudes surveys.Note: the figure shows the share of votes received by Gerindra by education level.
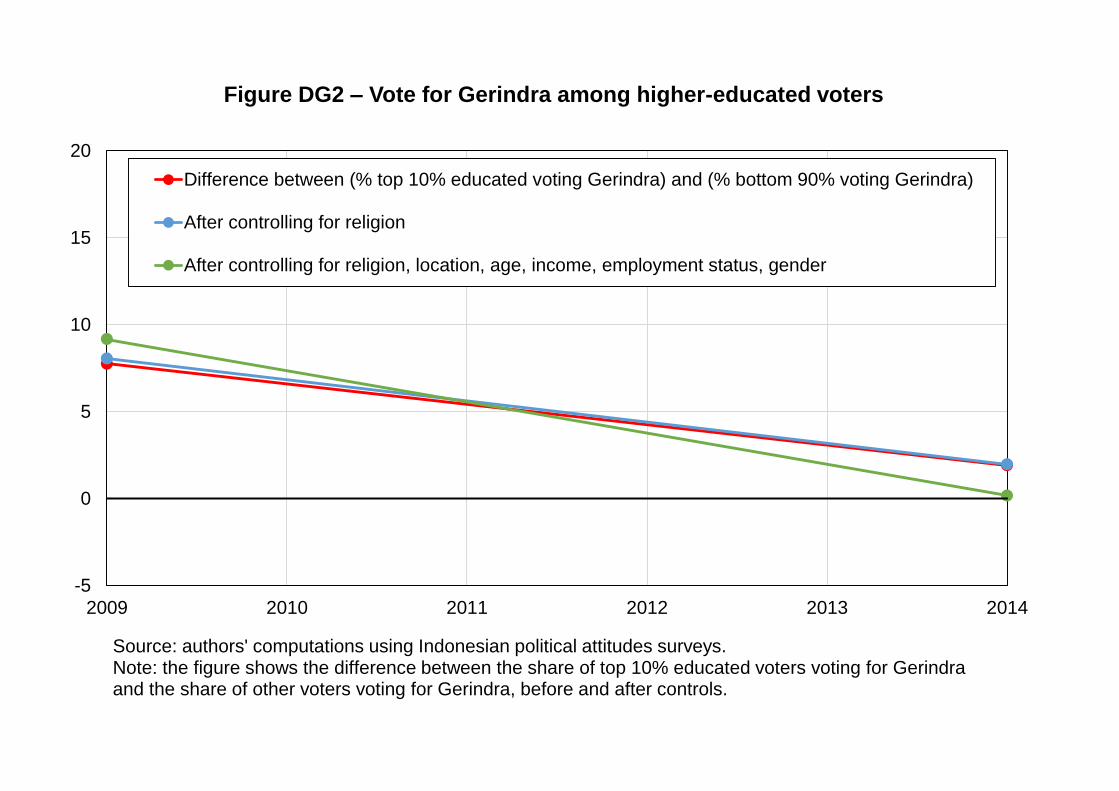
-5
0
5
10
15
20
2009 2010 2011 2012 2013 2014
Figure DG2 – Vote for Gerindra among higher-educated voters
Difference between (% top 10% educated voting Gerindra) and (% bottom 90% voting Gerindra)
After controlling for religion
After controlling for religion, location, age, income, employment status, gender
Source: authors' computations using Indonesian political attitudes surveys.Note: the figure shows the difference between the share of top 10% educated voters voting for Gerindra and the share of other voters voting for Gerindra, before and after controls.
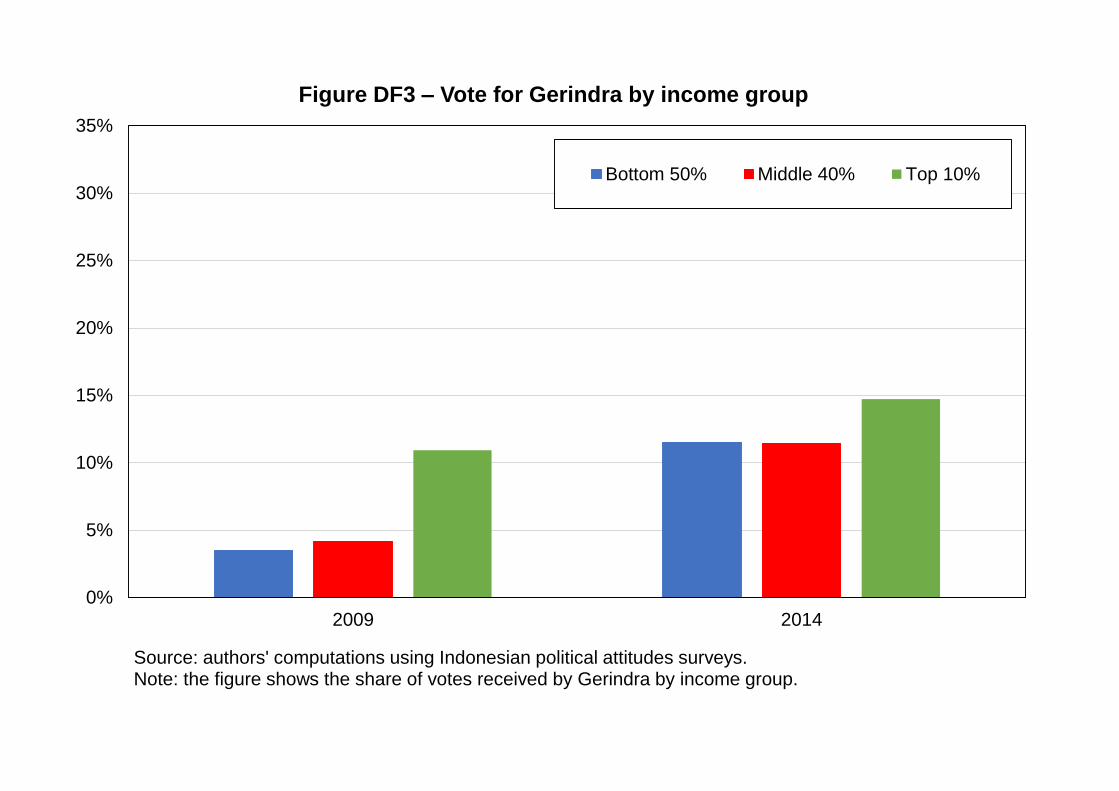
0%
5%
10%
15%
20%
25%
30%
35%
2009 2014
Figure DF3 – Vote for Gerindra by income group
Bottom 50% Middle 40% Top 10%
Source: authors' computations using Indonesian political attitudes surveys.Note: the figure shows the share of votes received by Gerindra by income group.

0
2
4
6
8
10
12
14
2009 2010 2011 2012 2013 2014
Figure DF4 – Vote for Gerindra among top-income voters
Difference between (% top 10% earners voting Gerindra) and (% bottom 90% voting Gerindra)
After controlling for religion
After controlling for religion, location, age, education, employment status, gender
Source: authors' computations using Indonesian political attitudes surveys.Note: the figure shows the difference between the share of top 10% earners voting for Gerindra and the share of other voters voting for Gerindra, before and after controls.
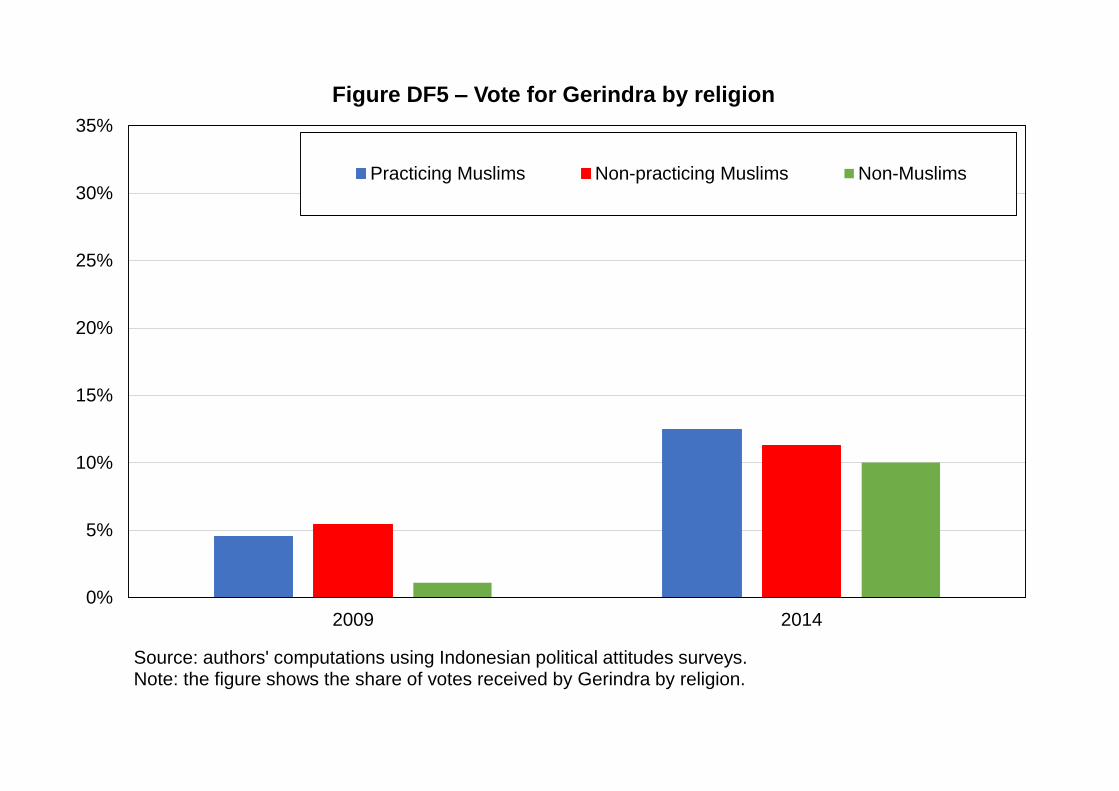
0%
5%
10%
15%
20%
25%
30%
35%
2009 2014
Figure DF5 – Vote for Gerindra by religion
Practicing Muslims Non-practicing Muslims Non-Muslims
Source: authors' computations using Indonesian political attitudes surveys.Note: the figure shows the share of votes received by Gerindra by religion.

-5
0
5
10
15
2009 2010 2011 2012 2013 2014
Figure DF6 – Vote for Gerindra among practicing Muslims
Difference between (% pract. Muslims voting Gerindra) and (% other voters voting Gerindra)
After controlling for income, education
After controlling for location, age, income, education, employment status, gender
Source: authors' computations using Indonesian political attitudes surveys.Note: the figure shows the difference between the share of practicing Muslims voting for Gerindra and the share of other voters voting for Gerindra, before and after controls.
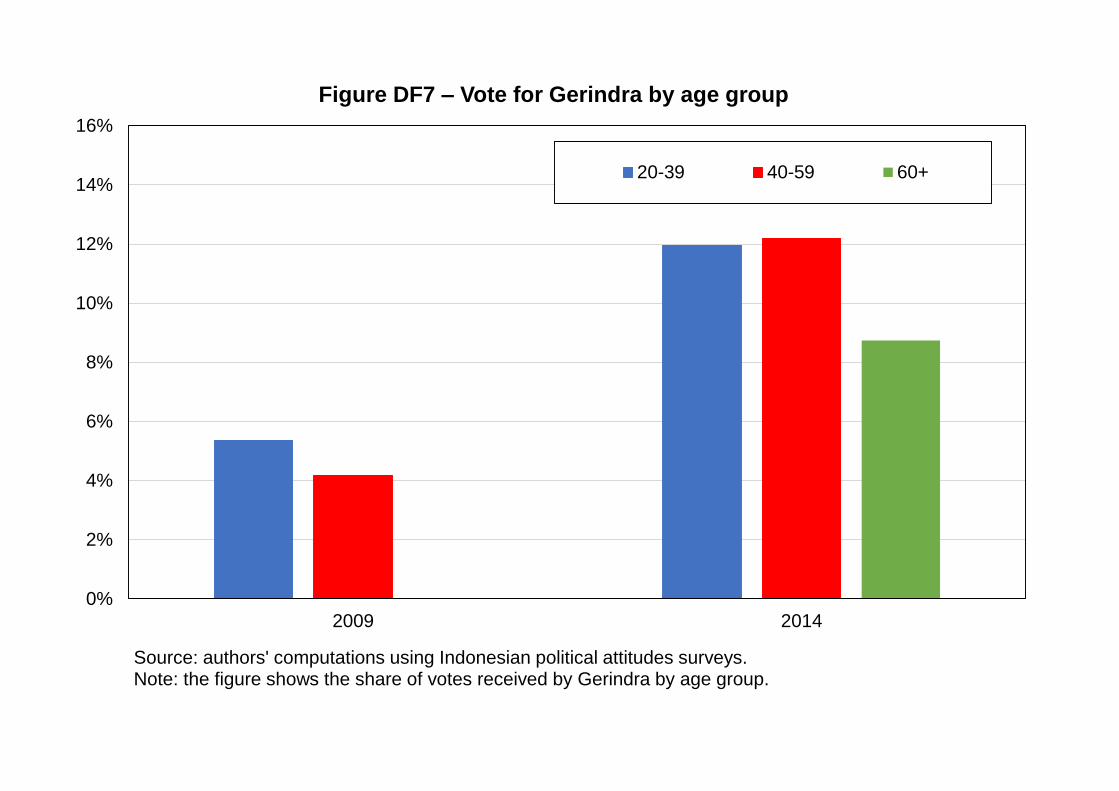
0%
2%
4%
6%
8%
10%
12%
14%
16%
2009 2014
Figure DF7 – Vote for Gerindra by age group
20-39 40-59 60+
Source: authors' computations using Indonesian political attitudes surveys.Note: the figure shows the share of votes received by Gerindra by age group.

-2
0
2
4
6
8
10
2009 2010 2011 2012 2013 2014
Figure DF8 – Vote for Gerindra among young voters
Difference between (% voters age 20-39 voting Gerindra) and (% other voters voting Gerindra)
After controlling for income, education
After controlling for location, income, education, religion, employment status, gender
Source: authors' computations using Indonesian political attitudes surveys.Note: the figure shows the difference between share of young voters voting for Gerindra and the share of other voters voting for Gerindra, before and after controls.
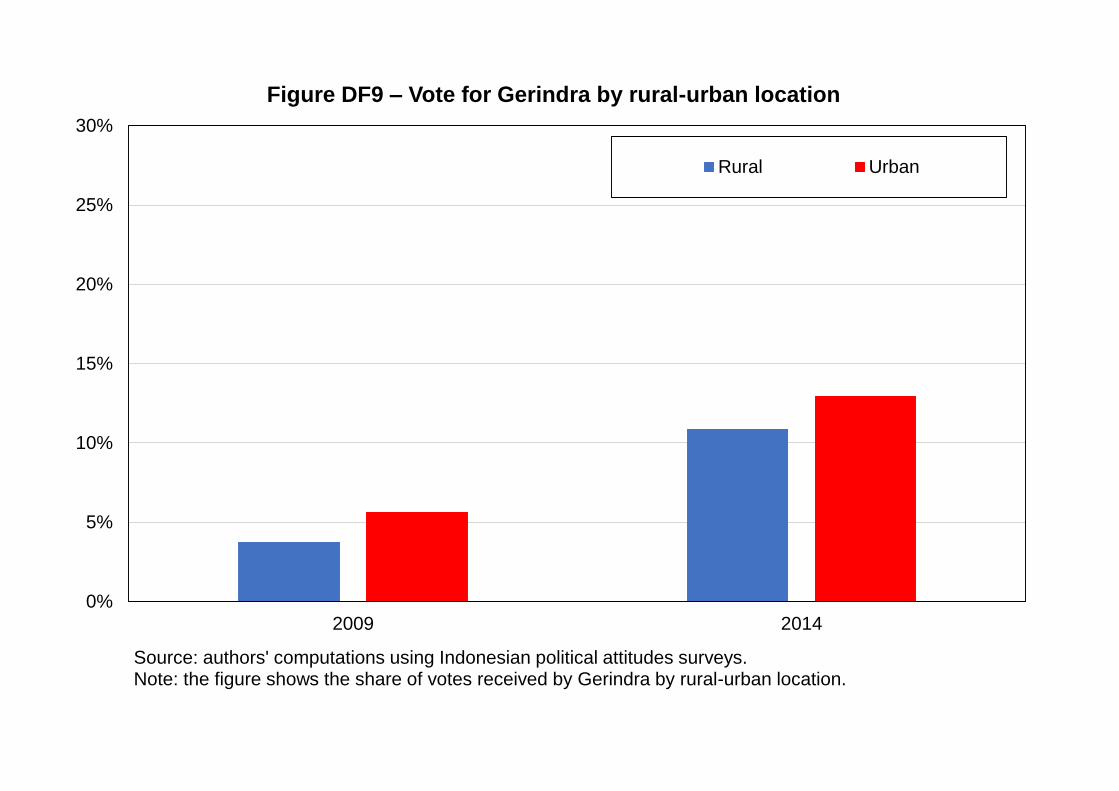
0%
5%
10%
15%
20%
25%
30%
2009 2014
Figure DF9 – Vote for Gerindra by rural-urban location
Rural Urban
Source: authors' computations using Indonesian political attitudes surveys.Note: the figure shows the share of votes received by Gerindra by rural-urban location.
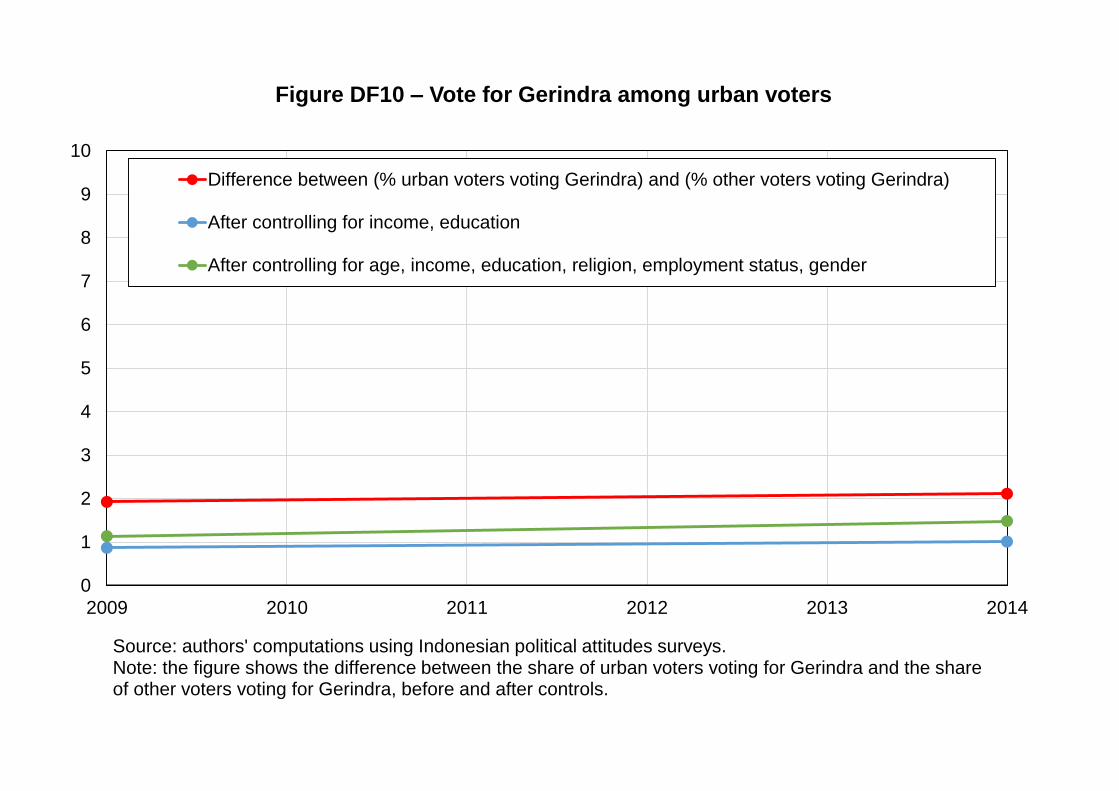
0
1
2
3
4
5
6
7
8
9
10
2009 2010 2011 2012 2013 2014
Figure DF10 – Vote for Gerindra among urban voters
Difference between (% urban voters voting Gerindra) and (% other voters voting Gerindra)
After controlling for income, education
After controlling for age, income, education, religion, employment status, gender
Source: authors' computations using Indonesian political attitudes surveys.Note: the figure shows the difference between the share of urban voters voting for Gerindra and the share of other voters voting for Gerindra, before and after controls.

0%
2%
4%
6%
8%
10%
12%
14%
16%
2009 2014
Figure DG1 – Vote for Hanura by education level
Elementary or lower Primary
Lower secondary Upper secondary
Tertiary
Source: authors' computations using Indonesian political attitudes surveys.Note: the figure shows the share of votes received by Hanura by education level.
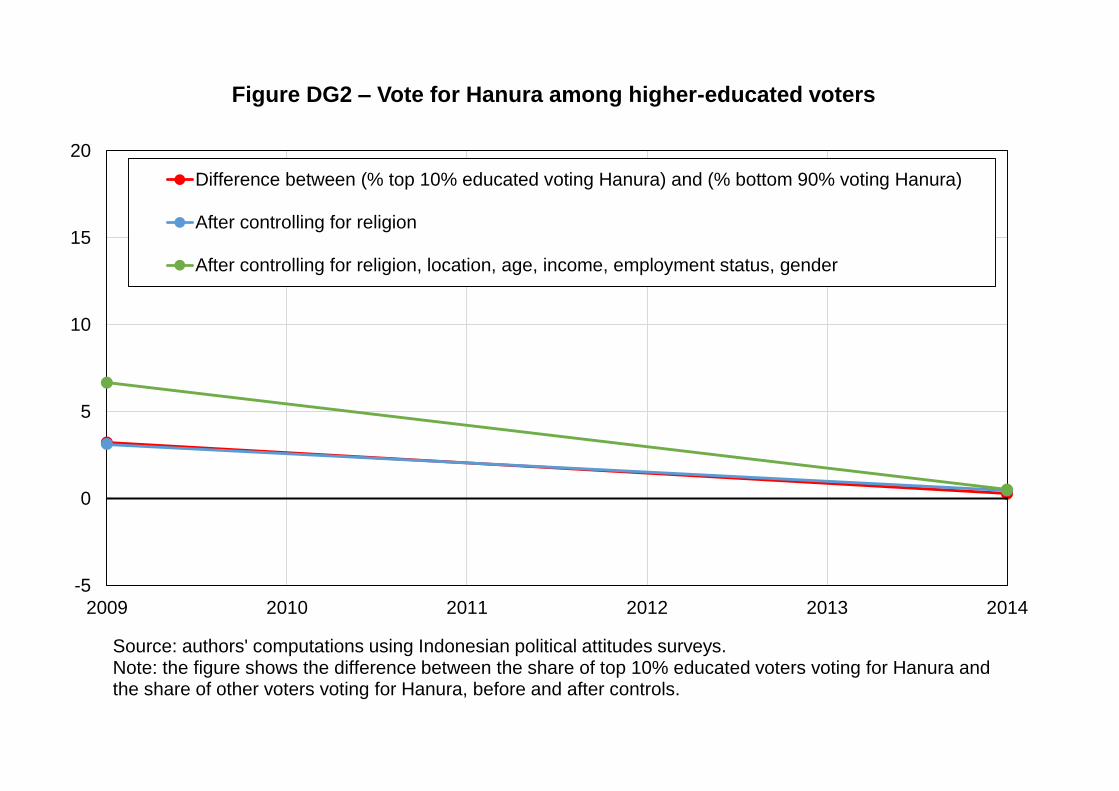
-5
0
5
10
15
20
2009 2010 2011 2012 2013 2014
Figure DG2 – Vote for Hanura among higher-educated voters
Difference between (% top 10% educated voting Hanura) and (% bottom 90% voting Hanura)
After controlling for religion
After controlling for religion, location, age, income, employment status, gender
Source: authors' computations using Indonesian political attitudes surveys.Note: the figure shows the difference between the share of top 10% educated voters voting for Hanura and the share of other voters voting for Hanura, before and after controls.
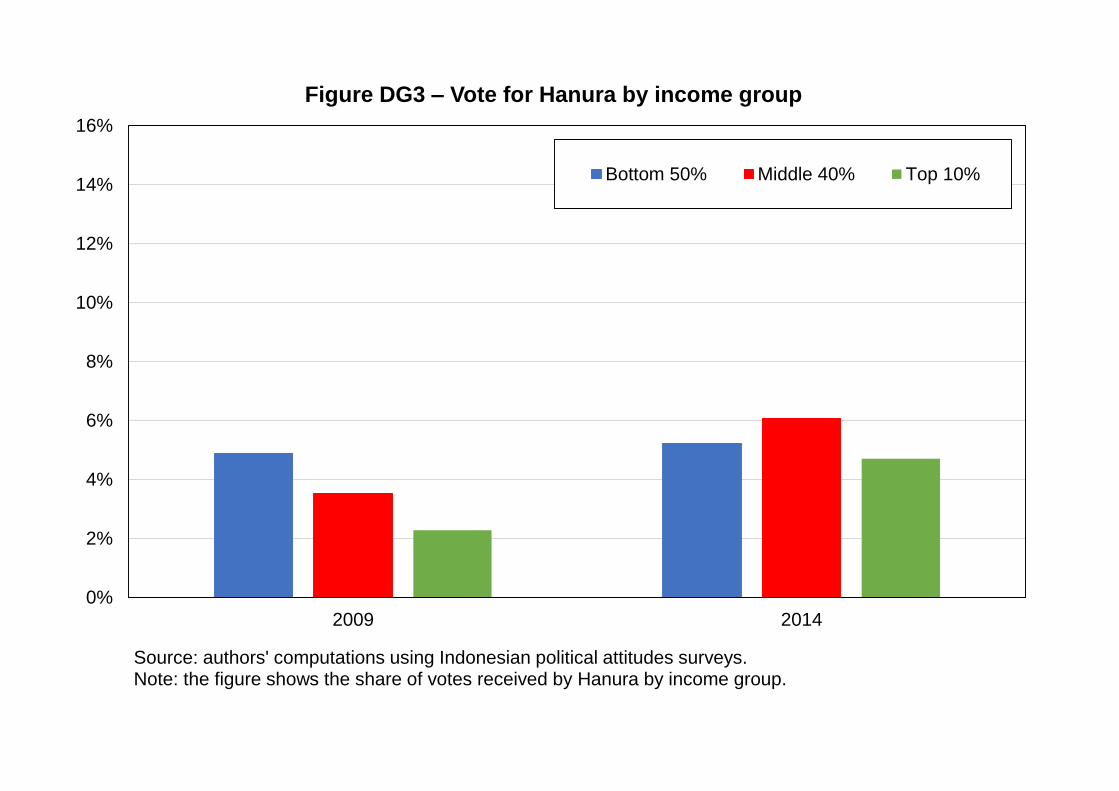
0%
2%
4%
6%
8%
10%
12%
14%
16%
2009 2014
Figure DG3 – Vote for Hanura by income group
Bottom 50% Middle 40% Top 10%
Source: authors' computations using Indonesian political attitudes surveys.Note: the figure shows the share of votes received by Hanura by income group.
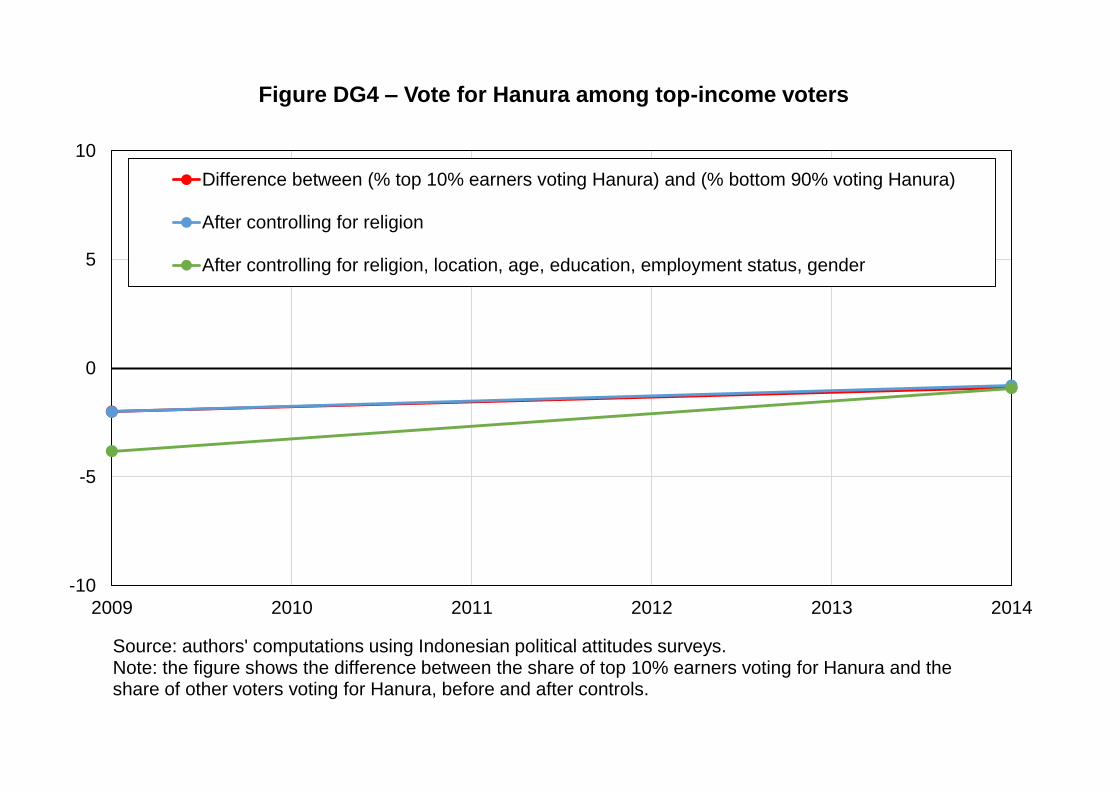
-10
-5
0
5
10
2009 2010 2011 2012 2013 2014
Figure DG4 – Vote for Hanura among top-income voters
Difference between (% top 10% earners voting Hanura) and (% bottom 90% voting Hanura)
After controlling for religion
After controlling for religion, location, age, education, employment status, gender
Source: authors' computations using Indonesian political attitudes surveys.Note: the figure shows the difference between the share of top 10% earners voting for Hanura and the share of other voters voting for Hanura, before and after controls.

0%
2%
4%
6%
8%
10%
12%
14%
16%
2009 2014
Figure DG5 – Vote for Hanura by religion
Practicing Muslims Non-practicing Muslims Non-Muslims
Source: authors' computations using Indonesian political attitudes surveys.Note: the figure shows the share of votes received by Hanura by religion.

-4
-2
0
2
4
6
8
10
2009 2010 2011 2012 2013 2014
Figure DG6 – Vote for Hanura among practicing Muslims
Difference between (% pract. Muslims voting Hanura) and (% other voters voting Hanura)
After controlling for income, education
After controlling for location, age, income, education, employment status, gender
Source: authors' computations using Indonesian political attitudes surveys.Note: the figure shows the difference between the share of practicing Muslims voting for Hanura and the share of other voters voting for Hanura, before and after controls.

0%
2%
4%
6%
8%
10%
12%
14%
16%
2009 2014
Figure DG7 – Vote for Hanura by age group
20-39 40-59 60+
Source: authors' computations using Indonesian political attitudes surveys.Note: the figure shows the share of votes received by Hanura by age group.

-10
-5
0
5
10
15
2009 2010 2011 2012 2013 2014
Figure DG8 – Vote for Hanura among young voters
Difference between (% voters age 20-39 voting Hanura) and (% other voters voting Hanura)
After controlling for income, education
After controlling for location, income, education, religion, employment status, gender
Source: authors' computations using Indonesian political attitudes surveys.Note: the figure shows the difference between share of young voters voting for Hanura and the share of other voters voting for Hanura, before and after controls.
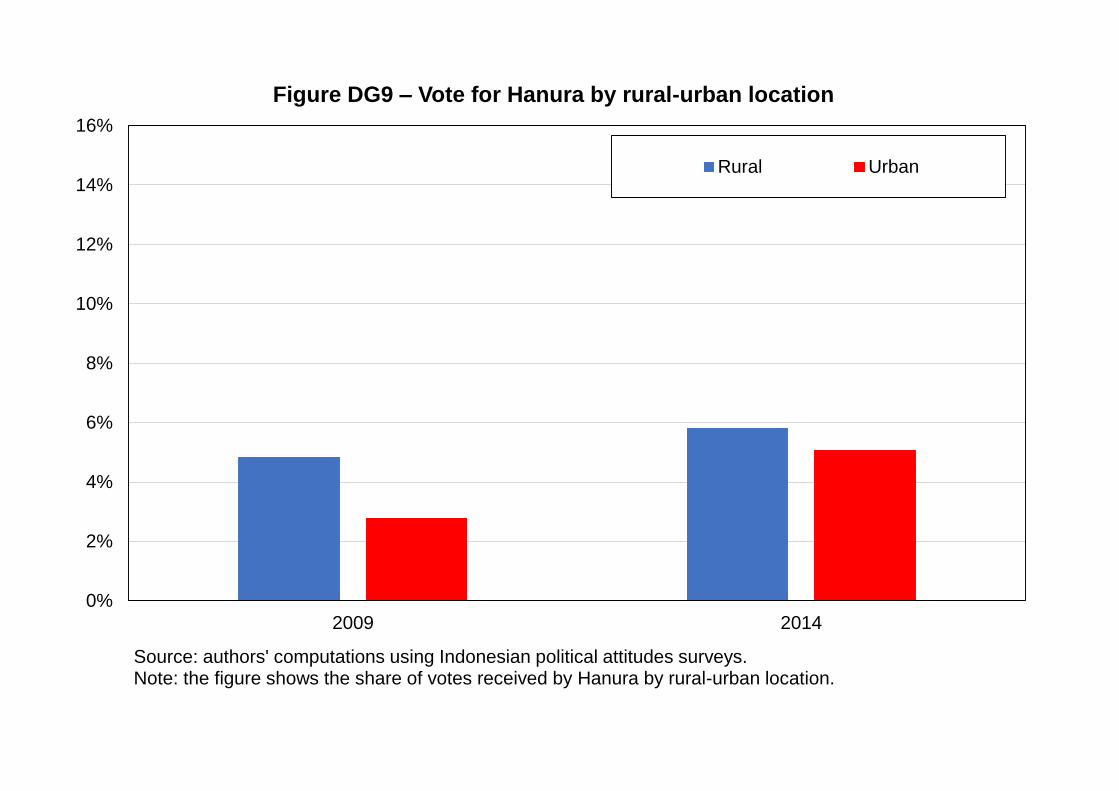
0%
2%
4%
6%
8%
10%
12%
14%
16%
2009 2014
Figure DG9 – Vote for Hanura by rural-urban location
Rural Urban
Source: authors' computations using Indonesian political attitudes surveys.Note: the figure shows the share of votes received by Hanura by rural-urban location.

-10
-8
-6
-4
-2
0
2
4
6
8
10
2009 2010 2011 2012 2013 2014
Figure DG10 – Vote for Hanura among urban voters
Difference between (% urban voters voting Hanura) and (% other voters voting Hanura)
After controlling for income, education
After controlling for age, income, education, religion, employment status, gender
Source: authors' computations using Indonesian political attitudes surveys.Note: the figure shows the difference between the share of urban voters voting for Gerindra and the share of other voters voting for Gerindra, before and after controls.
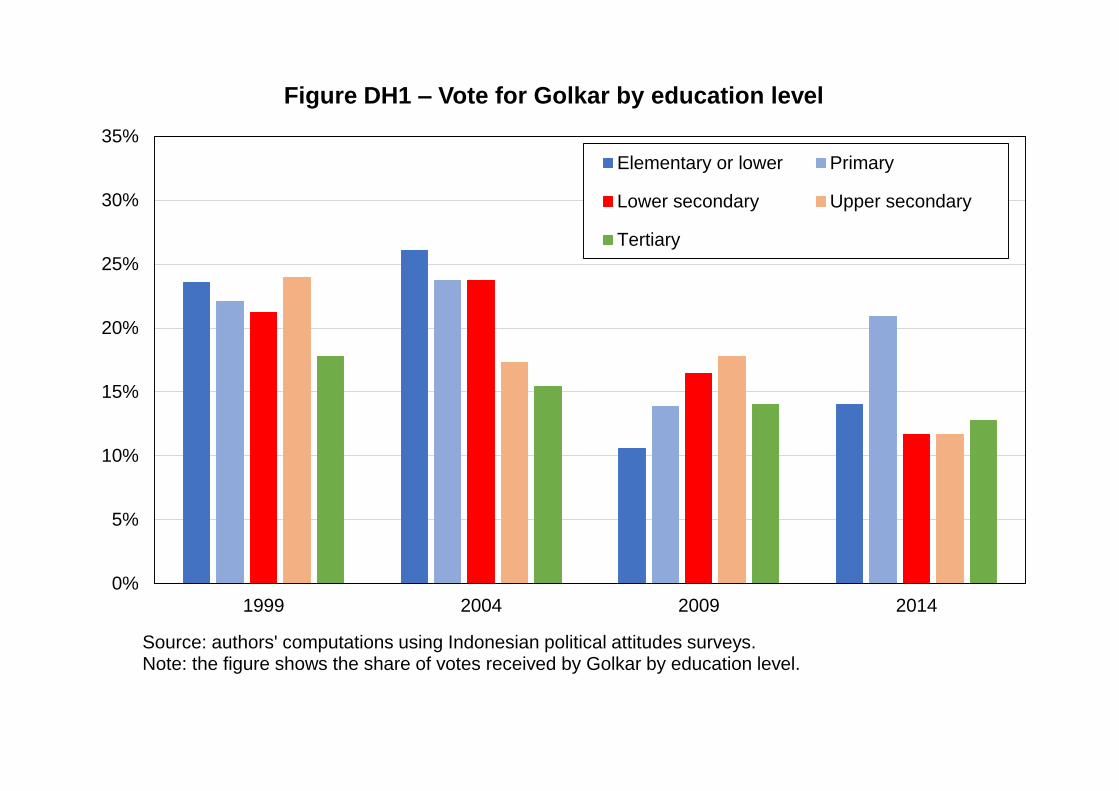
0%
5%
10%
15%
20%
25%
30%
35%
1999 2004 2009 2014
Figure DH1 – Vote for Golkar by education level
Elementary or lower Primary
Lower secondary Upper secondary
Tertiary
Source: authors' computations using Indonesian political attitudes surveys.Note: the figure shows the share of votes received by Golkar by education level.

-20
-15
-10
-5
0
5
10
15
20
1999 2000 2001 2002 2003 2004 2005 2006 2007 2008 2009 2010 2011 2012 2013 2014
Figure DH2 – Vote for Golkar among higher-educated voters
Difference between (% top 10% educated voting Golkar) and (% bottom 90% voting Golkar)
After controlling for religion
After controlling for religion, location, age, income, employment status, gender
Source: authors' computations using Indonesian political attitudes surveys.Note: the figure shows the difference between the share of top 10% educated voters voting for Golkar and the share of other voters voting for Golkar, before and after controls.
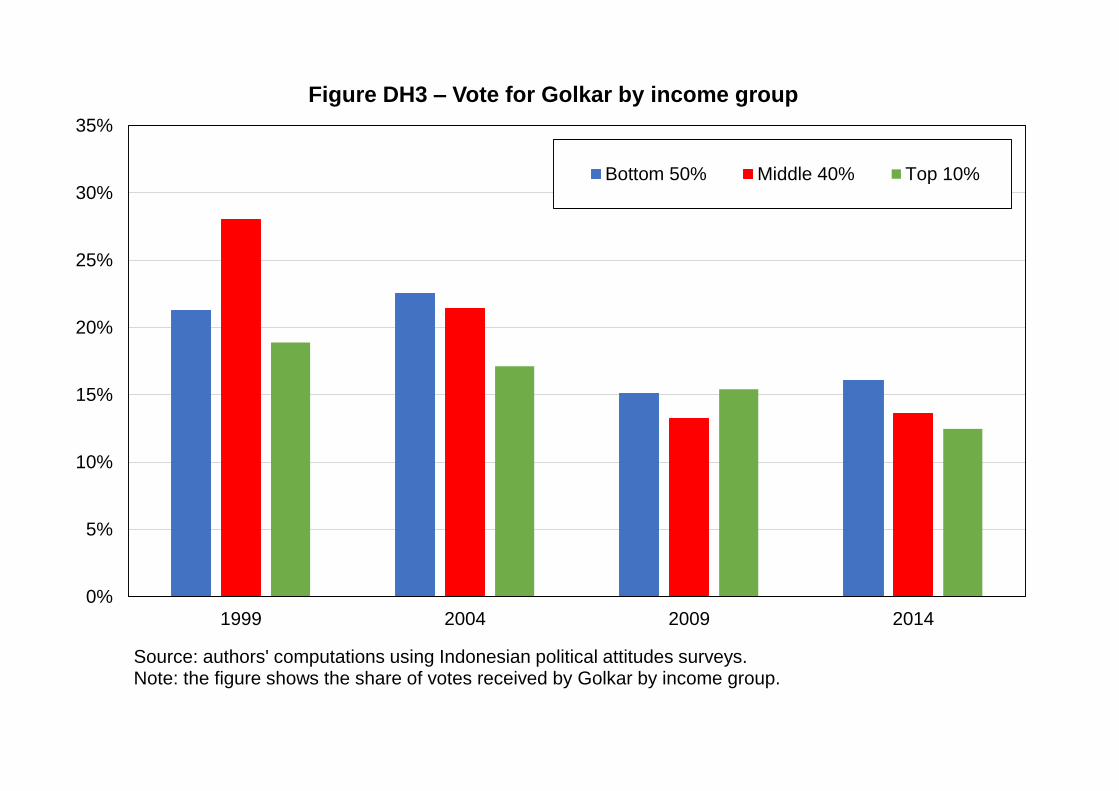
0%
5%
10%
15%
20%
25%
30%
35%
1999 2004 2009 2014
Figure DH3 – Vote for Golkar by income group
Bottom 50% Middle 40% Top 10%
Source: authors' computations using Indonesian political attitudes surveys.Note: the figure shows the share of votes received by Golkar by income group.
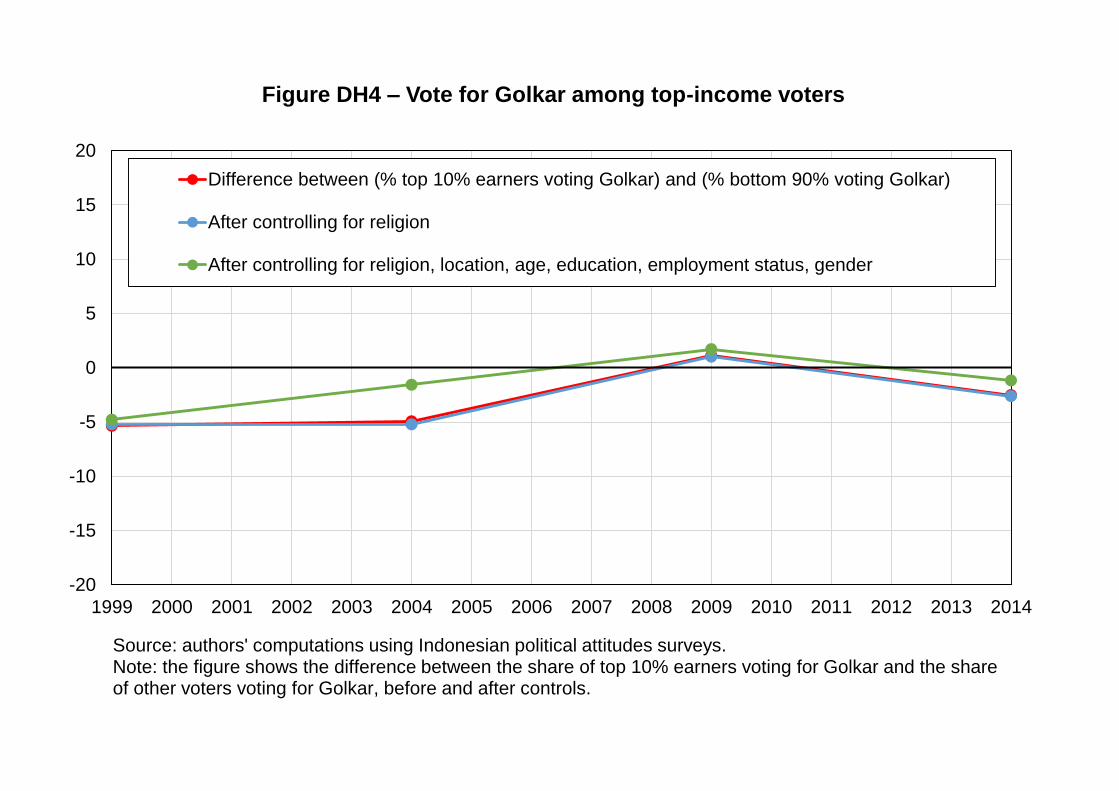
-20
-15
-10
-5
0
5
10
15
20
1999 2000 2001 2002 2003 2004 2005 2006 2007 2008 2009 2010 2011 2012 2013 2014
Figure DH4 – Vote for Golkar among top-income voters
Difference between (% top 10% earners voting Golkar) and (% bottom 90% voting Golkar)
After controlling for religion
After controlling for religion, location, age, education, employment status, gender
Source: authors' computations using Indonesian political attitudes surveys.Note: the figure shows the difference between the share of top 10% earners voting for Golkar and the share of other voters voting for Golkar, before and after controls.
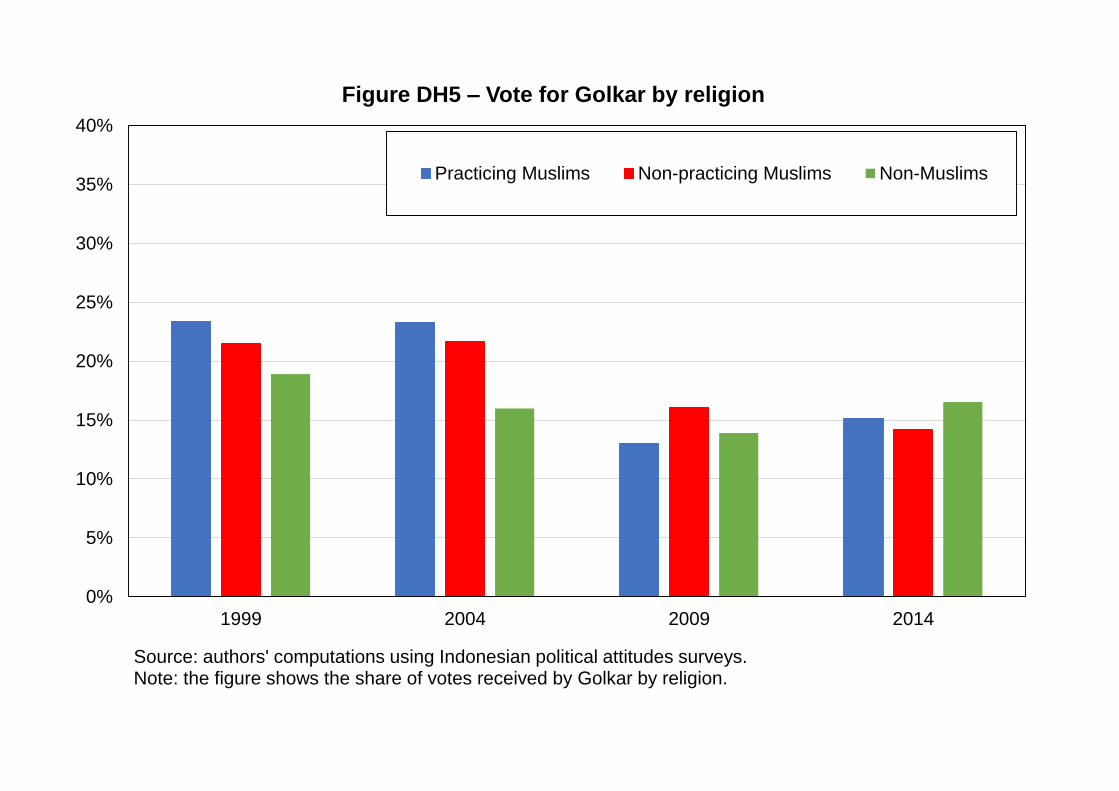
0%
5%
10%
15%
20%
25%
30%
35%
40%
1999 2004 2009 2014
Figure DH5 – Vote for Golkar by religion
Practicing Muslims Non-practicing Muslims Non-Muslims
Source: authors' computations using Indonesian political attitudes surveys.Note: the figure shows the share of votes received by Golkar by religion.
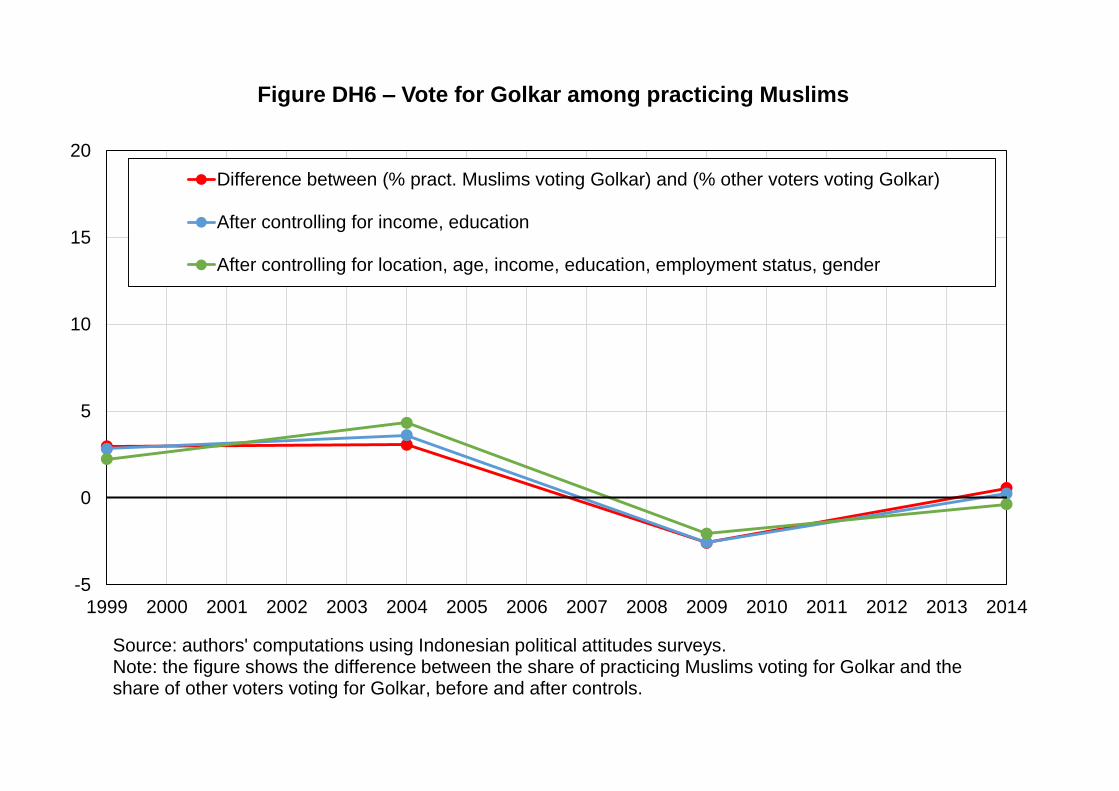
-5
0
5
10
15
20
1999 2000 2001 2002 2003 2004 2005 2006 2007 2008 2009 2010 2011 2012 2013 2014
Figure DH6 – Vote for Golkar among practicing Muslims
Difference between (% pract. Muslims voting Golkar) and (% other voters voting Golkar)
After controlling for income, education
After controlling for location, age, income, education, employment status, gender
Source: authors' computations using Indonesian political attitudes surveys.Note: the figure shows the difference between the share of practicing Muslims voting for Golkar and the share of other voters voting for Golkar, before and after controls.
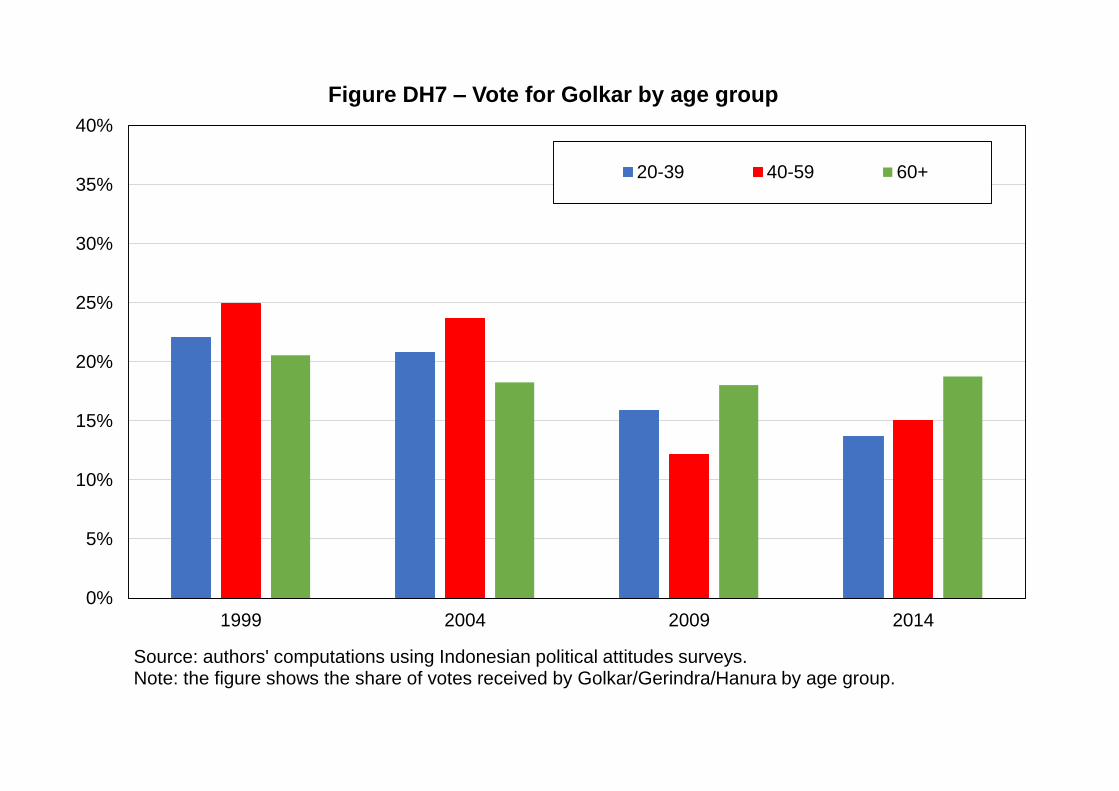
0%
5%
10%
15%
20%
25%
30%
35%
40%
1999 2004 2009 2014
Figure DH7 – Vote for Golkar by age group
20-39 40-59 60+
Source: authors' computations using Indonesian political attitudes surveys.Note: the figure shows the share of votes received by Golkar/Gerindra/Hanura by age group.

-15
-10
-5
0
5
10
15
1999 2000 2001 2002 2003 2004 2005 2006 2007 2008 2009 2010 2011 2012 2013 2014
Figure DH8 – Vote for Golkar among young voters
Difference between (% voters aged 20-39 voting Golkar) and (% other voters voting Golkar)
After controlling for income, education
After controlling for location, income, education, religion, employment status, gender
Source: authors' computations using Indonesian political attitudes surveys.Note: the figure shows the difference between share of voters aged 20-40 voting for Golkar and the share of other voters voting for Golkar, before and after controls.
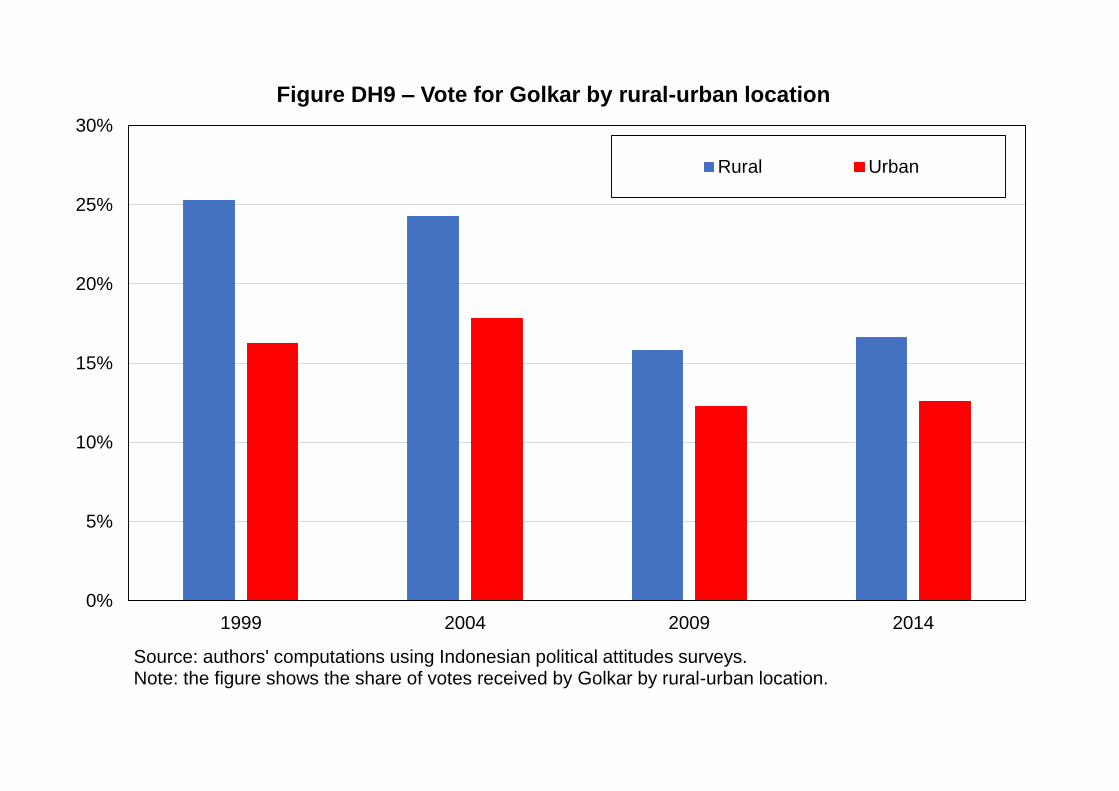
0%
5%
10%
15%
20%
25%
30%
1999 2004 2009 2014
Figure DH9 – Vote for Golkar by rural-urban location
Rural Urban
Source: authors' computations using Indonesian political attitudes surveys.Note: the figure shows the share of votes received by Golkar by rural-urban location.

-15
-10
-5
0
5
10
15
20
25
1999 2000 2001 2002 2003 2004 2005 2006 2007 2008 2009 2010 2011 2012 2013 2014
Figure DH10 – Vote for Golkar among urban voters
Difference between (% urban voters voting Golkar) and (% other voters voting Golkar)
After controlling for income, education
After controlling for age, income, education, religion, employment status, gender
Source: authors' computations using Indonesian political attitudes surveys.Note: the figure shows the difference between the share of urban voters voting for Golkar and the share of other voters voting for Golkar, before and after controls.
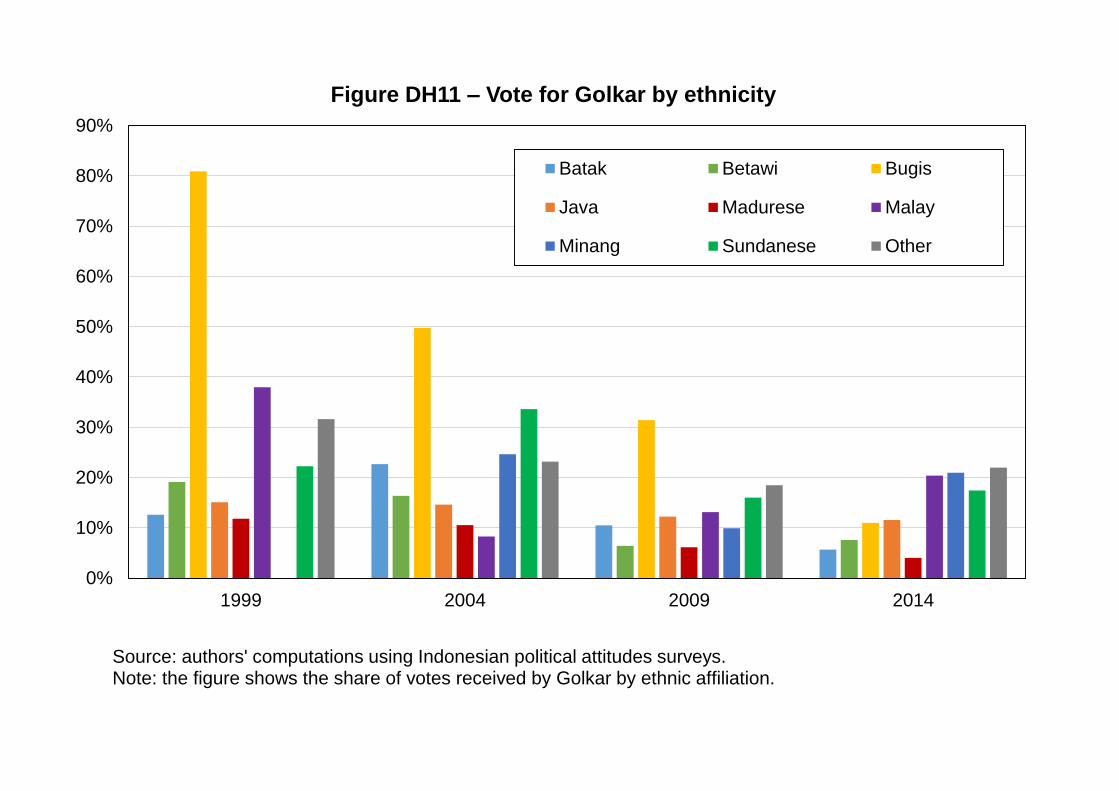
0%
10%
20%
30%
40%
50%
60%
70%
80%
90%
1999 2004 2009 2014
Figure DH11 – Vote for Golkar by ethnicity
Batak Betawi Bugis
Java Madurese Malay
Minang Sundanese Other
Source: authors' computations using Indonesian political attitudes surveys.Note: the figure shows the share of votes received by Golkar by ethnic affiliation.
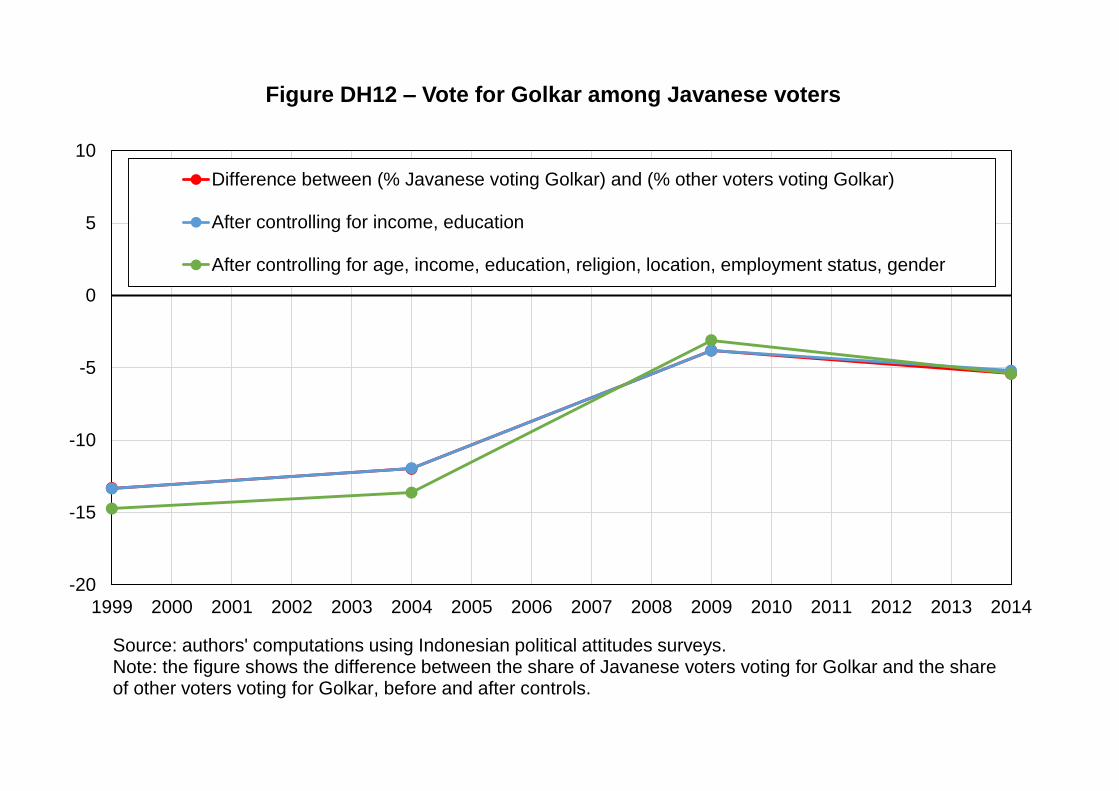
-20
-15
-10
-5
0
5
10
1999 2000 2001 2002 2003 2004 2005 2006 2007 2008 2009 2010 2011 2012 2013 2014
Figure DH12 – Vote for Golkar among Javanese voters
Difference between (% Javanese voting Golkar) and (% other voters voting Golkar)
After controlling for income, education
After controlling for age, income, education, religion, location, employment status, gender
Source: authors' computations using Indonesian political attitudes surveys.Note: the figure shows the difference between the share of Javanese voters voting for Golkar and the share of other voters voting for Golkar, before and after controls.
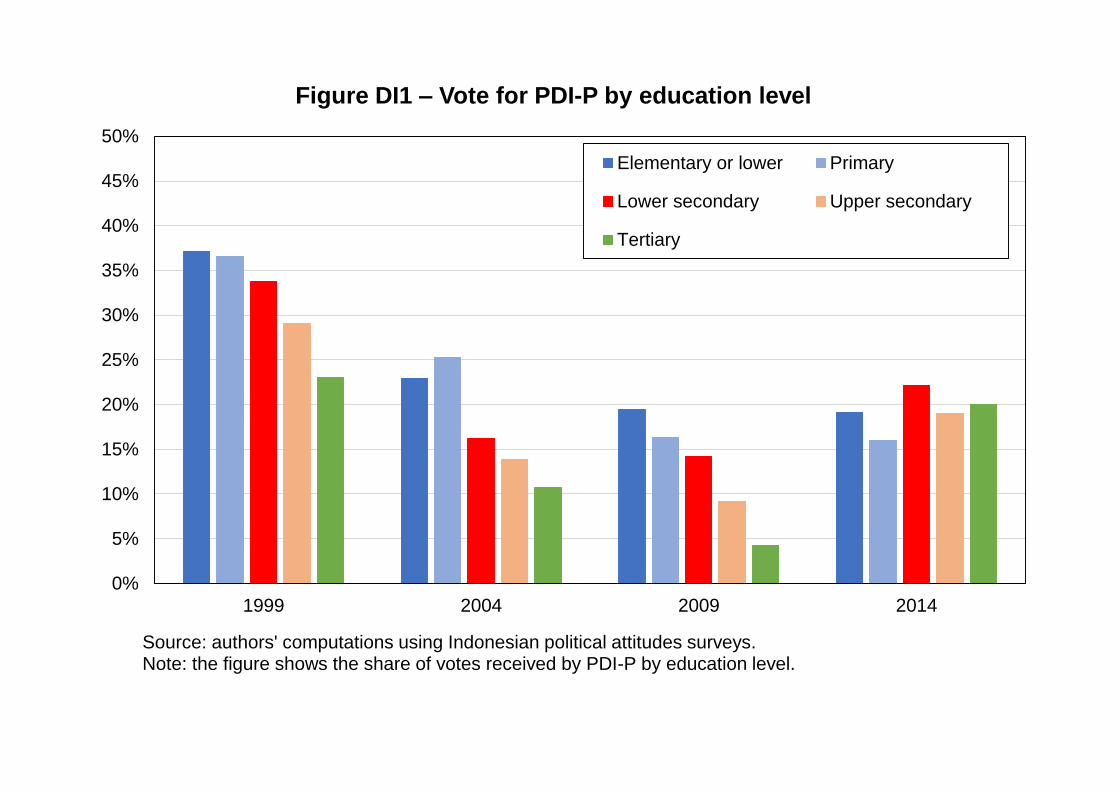
0%
5%
10%
15%
20%
25%
30%
35%
40%
45%
50%
1999 2004 2009 2014
Figure DI1 – Vote for PDI-P by education level
Elementary or lower Primary
Lower secondary Upper secondary
Tertiary
Source: authors' computations using Indonesian political attitudes surveys.Note: the figure shows the share of votes received by PDI-P by education level.

-15
-10
-5
0
5
10
15
1999 2000 2001 2002 2003 2004 2005 2006 2007 2008 2009 2010 2011 2012 2013 2014
Figure DI2 – Vote for PDI-P among higher-educated voters
Difference between (% top 10% educated voting PDI-P) and (% bottom 90% voting PDI-P)
After controlling for religion
After controlling for religion, location, age, income, employment status, gender
Source: authors' computations using Indonesian political attitudes surveys.Note: the figure shows the difference between the share of top 10% educated voters voting for PDI-P and the share of other voters voting for PDI-P, before and after controls.

0%
5%
10%
15%
20%
25%
30%
35%
40%
45%
50%
1999 2004 2009 2014
Figure DI3 – Vote for PDI-P by income group
Bottom 50% Middle 40% Top 10%
Source: authors' computations using Indonesian political attitudes surveys.Note: the figure shows the share of votes received by PDI-P by income group.
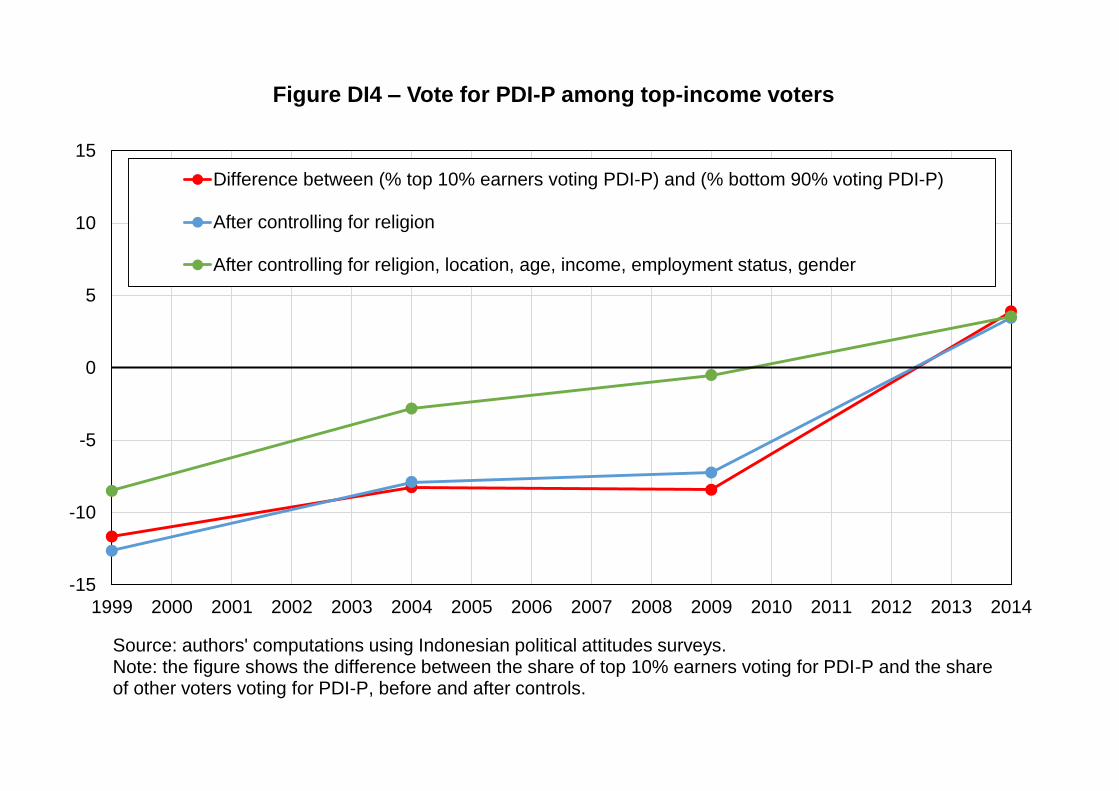
-15
-10
-5
0
5
10
15
1999 2000 2001 2002 2003 2004 2005 2006 2007 2008 2009 2010 2011 2012 2013 2014
Figure DI4 – Vote for PDI-P among top-income voters
Difference between (% top 10% earners voting PDI-P) and (% bottom 90% voting PDI-P)
After controlling for religion
After controlling for religion, location, age, income, employment status, gender
Source: authors' computations using Indonesian political attitudes surveys.Note: the figure shows the difference between the share of top 10% earners voting for PDI-P and the share of other voters voting for PDI-P, before and after controls.
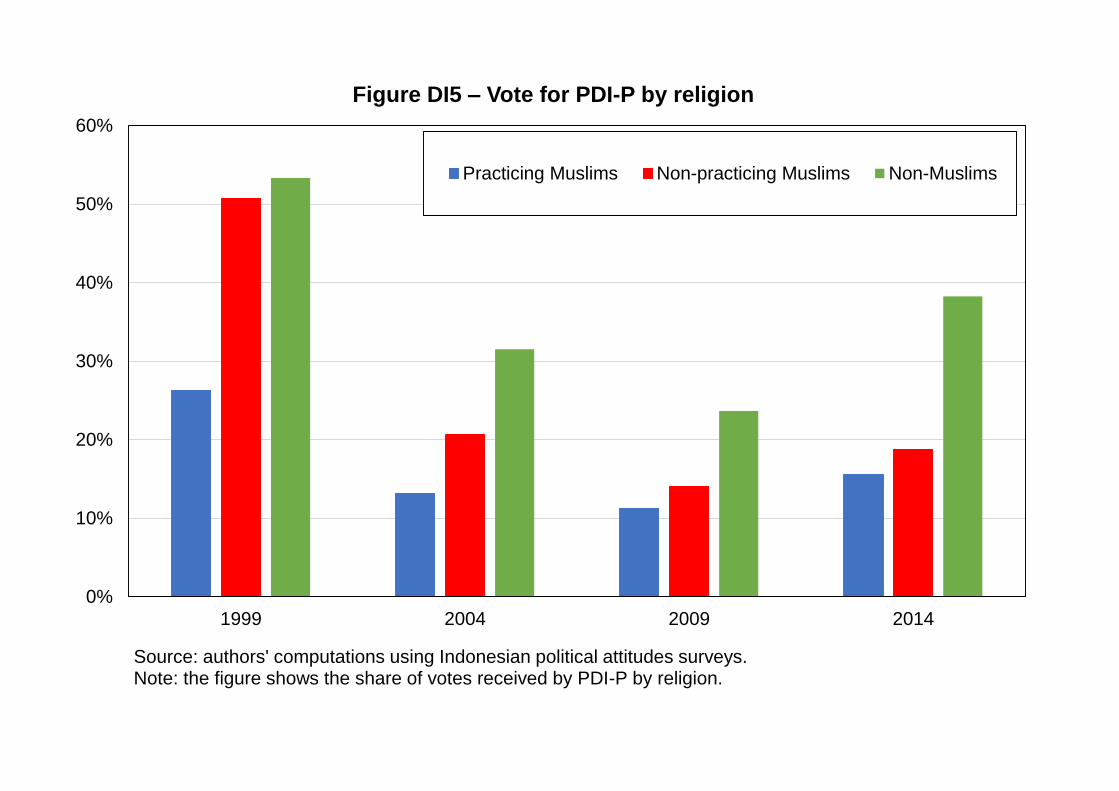
0%
10%
20%
30%
40%
50%
60%
1999 2004 2009 2014
Figure DI5 – Vote for PDI-P by religion
Practicing Muslims Non-practicing Muslims Non-Muslims
Source: authors' computations using Indonesian political attitudes surveys.Note: the figure shows the share of votes received by PDI-P by religion.

-40
-30
-20
-10
0
10
20
30
40
1999 2000 2001 2002 2003 2004 2005 2006 2007 2008 2009 2010 2011 2012 2013 2014
Figure DI6 – Vote for PDI-P among practicing Muslims
Difference between (% pract. Muslims voting PDI-P) and (% other voters voting PDI-P)
After controlling for income, education
After controlling for location, age, income, education, employment status, gender
Source: authors' computations using Indonesian political attitudes surveys.Note: the figure shows the difference between the share of practicing Muslims voting for PDI-P and the share of other voters voting for PDI-P, before and after controls.

-15
-10
-5
0
5
10
15
1999 2000 2001 2002 2003 2004 2005 2006 2007 2008 2009 2010 2011 2012 2013 2014
Figure DI7 – Vote for PDI-P among young voters
Difference between (% voters aged 20-39 voting PDI-P) and (% other voters voting PDI-P)
After controlling for income, education
After controlling for location, income, education, religion, employment status, gender
Source: authors' computations using Indonesian political attitudes surveys.Note: the figure shows the difference between share of voters aged 20-40 voting for PDI-P and the share of other voters voting for PDI-P, before and after controls.

0%
5%
10%
15%
20%
25%
30%
35%
40%
45%
50%
1999 2004 2009 2014
Figure DI8 – Vote for PDI-P by rural-urban location
Rural Urban
Source: authors' computations using Indonesian political attitudes surveys.Note: the figure shows the share of votes received by PDI-P by rural-urban location.

-10
-5
0
5
10
15
20
25
1999 2000 2001 2002 2003 2004 2005 2006 2007 2008 2009 2010 2011 2012 2013 2014
Figure DI9 – Vote for PDI-P among urban voters
Difference between (% urban voters voting PDI-P) and (% other voters voting PDI-P)
After controlling for income, education
After controlling for age, income, education, religion, employment status, gender
Source: authors' computations using Indonesian political attitudes surveys.Note: the figure shows the difference between the share of urban voters voting for PDI-P and the share of other voters voting for PDI-P, before and after controls.

0%
5%
10%
15%
20%
25%
30%
35%
40%
45%
1999 2004 2009 2014
Figure DI10 – Vote for PDI-P by ethnicity
Batak Betawi Bugis
Java Madurese Malay
Minang Sundanese Other
Source: authors' computations using Indonesian political attitudes surveys.Note: the figure shows the share of votes received by PDI-P by ethnic affiliation.
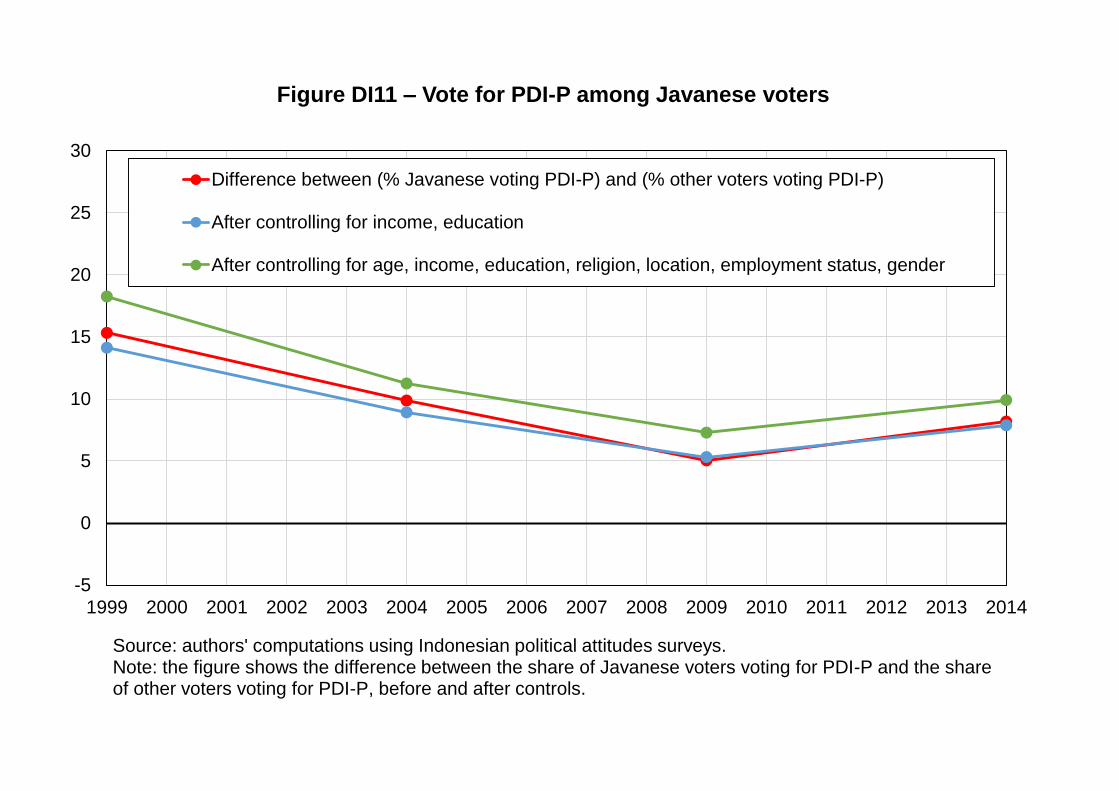
-5
0
5
10
15
20
25
30
1999 2000 2001 2002 2003 2004 2005 2006 2007 2008 2009 2010 2011 2012 2013 2014
Figure DI11 – Vote for PDI-P among Javanese voters
Difference between (% Javanese voting PDI-P) and (% other voters voting PDI-P)
After controlling for income, education
After controlling for age, income, education, religion, location, employment status, gender
Source: authors' computations using Indonesian political attitudes surveys.Note: the figure shows the difference between the share of Javanese voters voting for PDI-P and the share of other voters voting for PDI-P, before and after controls.
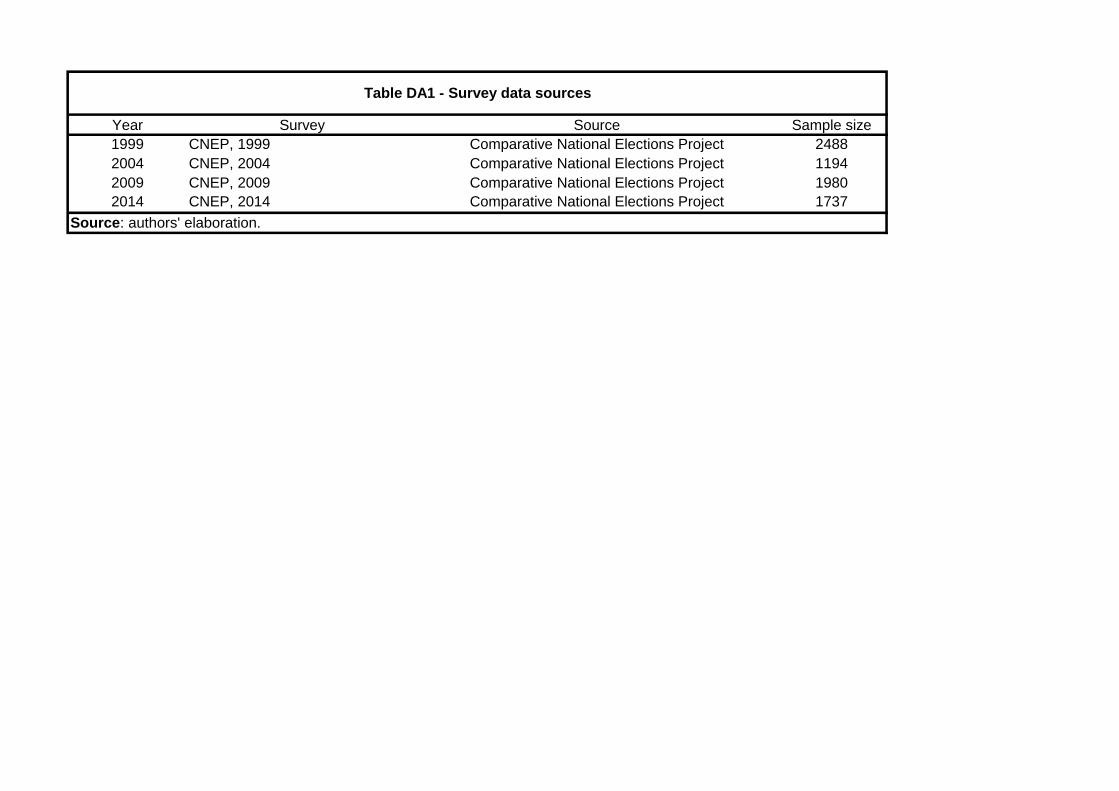
Year Survey Source Sample size
1999 CNEP, 1999 Comparative National Elections Project 2488
2004 CNEP, 2004 Comparative National Elections Project 1194
2009 CNEP, 2009 Comparative National Elections Project 1980
2014 CNEP, 2014 Comparative National Elections Project 1737
Table DA1 - Survey data sources
Source: authors' elaboration.
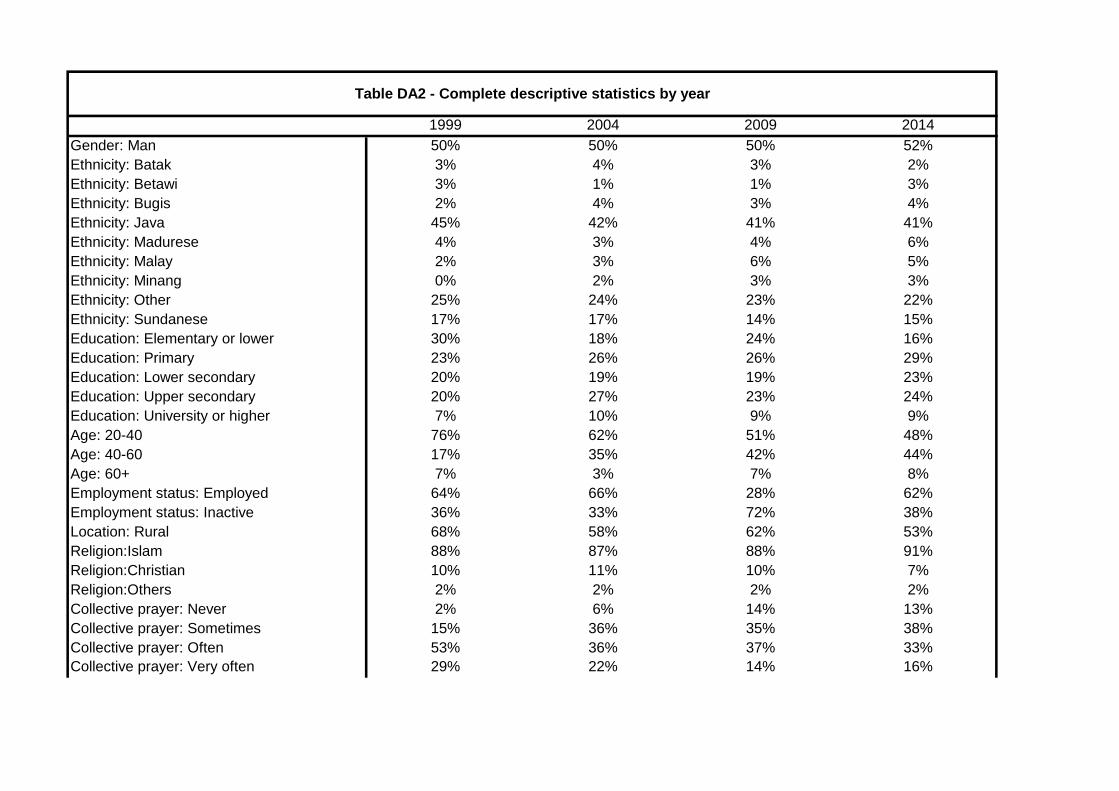
1999 2004 2009 2014
Gender: Man 50% 50% 50% 52%
Ethnicity: Batak 3% 4% 3% 2%
Ethnicity: Betawi 3% 1% 1% 3%
Ethnicity: Bugis 2% 4% 3% 4%
Ethnicity: Java 45% 42% 41% 41%
Ethnicity: Madurese 4% 3% 4% 6%
Ethnicity: Malay 2% 3% 6% 5%
Ethnicity: Minang 0% 2% 3% 3%
Ethnicity: Other 25% 24% 23% 22%
Ethnicity: Sundanese 17% 17% 14% 15%
Education: Elementary or lower 30% 18% 24% 16%
Education: Primary 23% 26% 26% 29%
Education: Lower secondary 20% 19% 19% 23%
Education: Upper secondary 20% 27% 23% 24%
Education: University or higher 7% 10% 9% 9%
Age: 20-40 76% 62% 51% 48%
Age: 40-60 17% 35% 42% 44%
Age: 60+ 7% 3% 7% 8%
Employment status: Employed 64% 66% 28% 62%
Employment status: Inactive 36% 33% 72% 38%
Location: Rural 68% 58% 62% 53%
Religion:Islam 88% 87% 88% 91%
Religion:Christian 10% 11% 10% 7%
Religion:Others 2% 2% 2% 2%
Collective prayer: Never 2% 6% 14% 13%
Collective prayer: Sometimes 15% 36% 35% 38%
Collective prayer: Often 53% 36% 37% 33%
Collective prayer: Very often 29% 22% 14% 16%
Table DA2 - Complete descriptive statistics by year
Source: authors' computations using Indonesian political attitudes surveys.
Note: the table shows descriptive statistics by year for selected available variables.

PDI-P PD Golkar Nasdem Hanura Gerindra Islamic Parties
Overall vote share 18,95% 10,19% 14,75% 6,72% 5,26% 11,81% 31,41%
Education
Primary or lower 17% 9% 18% 8% 5% 11% 31%
Secondary 21% 11% 12% 7% 5% 12% 32%
Tertiary 20% 13% 13% 2% 6% 14% 33%
Income
Bottom 50% 17% 10% 16% 8% 5% 11% 33%
Middle 40% 21% 10% 14% 6% 6% 11% 30%
Top 10% 23% 12% 12% 3% 5% 15% 30%
Religion
Practicing Muslims 16% 9% 15% 7% 5% 12% 35%
Non-practicing Muslims 19% 10% 14% 6% 7% 11% 32%
Non-Muslims 38% 13% 17% 13% 1% 10% 8%
Location
Urban 23% 7% 13% 5% 5% 13% 34%
Rural 15% 13% 17% 9% 6% 11% 29%
Gender
Woman 20% 10% 16% 6% 6% 9% 32%
Man 18% 10% 13% 8% 5% 15% 31%
Age
20-39 20% 12% 14% 6% 6% 12% 29%
40-59 18% 8% 15% 7% 4% 12% 34%
60+ 18% 10% 19% 9% 5% 9% 31%
Ethnic group
Madurese 12% 2% 4% 7% 9% 18% 48%
Bugis 20% 14% 11% 5% 0% 24% 26%
Minang 2% 14% 21% 4% 0% 26% 33%
Sundanese 18% 10% 17% 4% 5% 9% 36%
Betawi 19% 7% 8% 7% 3% 11% 45%
Java 24% 8% 12% 7% 5% 10% 33%
Table DA3 - Full structure of the vote in the 2014 Indonesian election
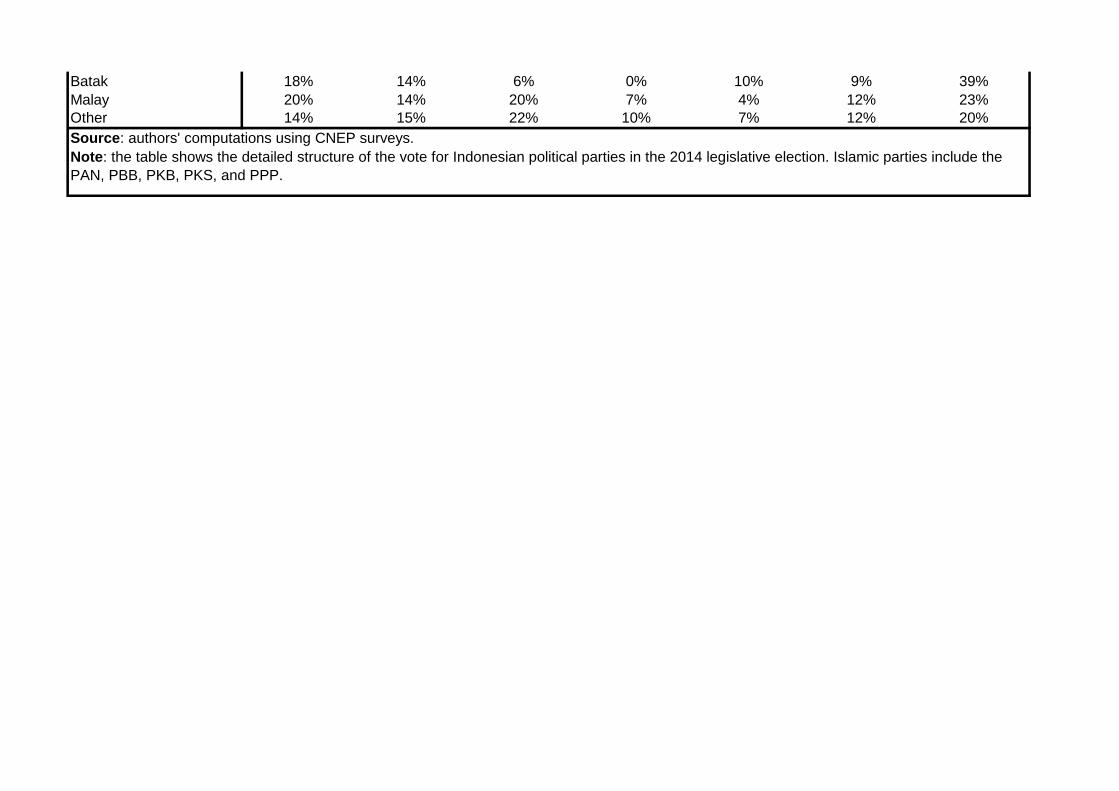
Batak 18% 14% 6% 0% 10% 9% 39%
Malay 20% 14% 20% 7% 4% 12% 23%
Other 14% 15% 22% 10% 7% 12% 20%
Source: authors' computations using CNEP surveys.
Note: the table shows the detailed structure of the vote for Indonesian political parties in the 2014 legislative election. Islamic parties include the
PAN, PBB, PKB, PKS, and PPP.
Related Documents