Democratic Waves? Global Patterns of Democratization, 1816–2008 * H˚ avard Strand 1 , H˚ avard Hegre 1,2 , Scott Gates 1,3 , and Marianne Dahl 1 1 Department of Political Science, University of Oslo 2 Centre for the Study of Civil War, PRIO 3 Department of Sociology and Political Science, Norwegian University of Science and Technology January 6, 2012 Summary Samuel Huntington’s (1991) thesis of democratic waves has come under strong criticism from scholars such as Renske Doorenspleet and Adam Przeworski and colleagues. We take issue with all of these authors’ (including Huntington’s) use of a dichotomous measure of democracy, which we believe creates the potential for inaccurate analysis of democracy and democratic/autocratic transitions. Using a more refined measure of democracy and of political system change we find substantial support for Huntington’s wave thesis, and little support for the position of his critics who argue that there are no democratic waves. We proceed to locate the sources of the democratic waves. Reformulating and expanding on Huntington, we hypothesize that a combination of the ‘stickiness’ of certain institutional configurations, the influence of neighboring countries, and shocks to the interstate system such as the world wars are the main explanation of waves, in combination with the slow but certain impact of economic development. Using multinomial logit analyses of political transitions, we find considerable support for these hypotheses. * Paper prepared for the 3rd International Conference on Democracy as Idea and Practice, Oslo, 12-13 January 2012. The paper has been funded by the Polarization and Conflict Project CIT-2-CT-2004-506084 funded by the European Commission-DG Research Sixth Framework Program and the Research Council of Norway project V-204454. We thank Mark Crescenzi, Ewan Harrison, Tim McKeown, Michael MacKuen, John MacMillan and Zeev Maoz for their comments on previous versions of this paper. 1

Welcome message from author
This document is posted to help you gain knowledge. Please leave a comment to let me know what you think about it! Share it to your friends and learn new things together.
Transcript
Democratic Waves? Global Patterns of Democratization, 1816–2008 ∗
Havard Strand1, Havard Hegre1,2, Scott Gates1,3, and Marianne Dahl1
1Department of Political Science, University of Oslo2Centre for the Study of Civil War, PRIO
3Department of Sociology and Political Science, Norwegian University of Science and Technology
January 6, 2012
Summary
Samuel Huntington’s (1991) thesis of democratic waves has come under strong criticism fromscholars such as Renske Doorenspleet and Adam Przeworski and colleagues. We take issue withall of these authors’ (including Huntington’s) use of a dichotomous measure of democracy, whichwe believe creates the potential for inaccurate analysis of democracy and democratic/autocratictransitions. Using a more refined measure of democracy and of political system change we findsubstantial support for Huntington’s wave thesis, and little support for the position of his criticswho argue that there are no democratic waves. We proceed to locate the sources of the democraticwaves. Reformulating and expanding on Huntington, we hypothesize that a combination of the‘stickiness’ of certain institutional configurations, the influence of neighboring countries, andshocks to the interstate system such as the world wars are the main explanation of waves, incombination with the slow but certain impact of economic development. Using multinomial logitanalyses of political transitions, we find considerable support for these hypotheses.
∗Paper prepared for the 3rd International Conference on Democracy as Idea and Practice, Oslo, 12-13 January 2012.The paper has been funded by the Polarization and Conflict Project CIT-2-CT-2004-506084 funded by the EuropeanCommission-DG Research Sixth Framework Program and the Research Council of Norway project V-204454. Wethank Mark Crescenzi, Ewan Harrison, Tim McKeown, Michael MacKuen, John MacMillan and Zeev Maoz for theircomments on previous versions of this paper.
1

1 Introduction
The recent demise of Zine El Abidine Ben Ali, Hosni Mubarak, and Muammar al-Gaddafi, and
the subsequent intense pressure on other authoritarian leaders in the Middle East/North Africa
region, indicate that democratic change tend to occur in conjunction. Huntington (Samuel 1991),
observing similar clustering of events, described the pattern of global democratization as a series of
three waves and reverse waves. Although the notion of waves is widely accepted, their existence is
contested by scholars such as Przeworski et al. (2000) and Doorenspleet (2000b).
In this article, we show that democratization indeed occurs in waves. We argue that transitions
are best analyzed in small steps, and define change to political systems accordingly. Our ‘small
steps’ measure precisely reflect the waves identified by Huntington. We use this precise measure to
show that the wave structure can be traced back to a set of general patterns: (1) Economic devel-
opment functions as a slowly changing backdrop to democratization; (2) the internal consistency of
institutions initially prevents change, but opens up for series of changes as soon as this consistency
is broken; (3) the neighborhood of a country exerts a forcefull pull on the setup of its political
system, resulting in a clustering of changes in similar directions; (4) newly formed states tend to
be more democratic than otherwise similar states, so that clustered formation of states gives rise to
clustered changes to global democracy; (5) new democracies are frequently nonsustainable, so that
clustered state formation creates subsequent reverse waves.
Section 2 shows that Huntington’s waves are adequate descriptions of the historical patterns of
democratization. In section 3, we sketch a set of explanations of these waves. In Section 4 we take
a closer look at the importance of systemic shocks. In Section 5, we summarize our research design,
and we present our results in Section 6.
2 Are there democratic waves?
Huntington (1991)’s analysis of the waves of democratization is based on measuring the proportion
of democratic regimes over time, as represented in the solid line in Figure 1. The first wave of
democratization started in the early 19th century and persisted until the 1920s, after which many
democracies backslided to autocracy (i.e., the first reverse wave). With the end of World War Two
came a second wave of democratization. This wave was relatively brief, with a large proportion
1
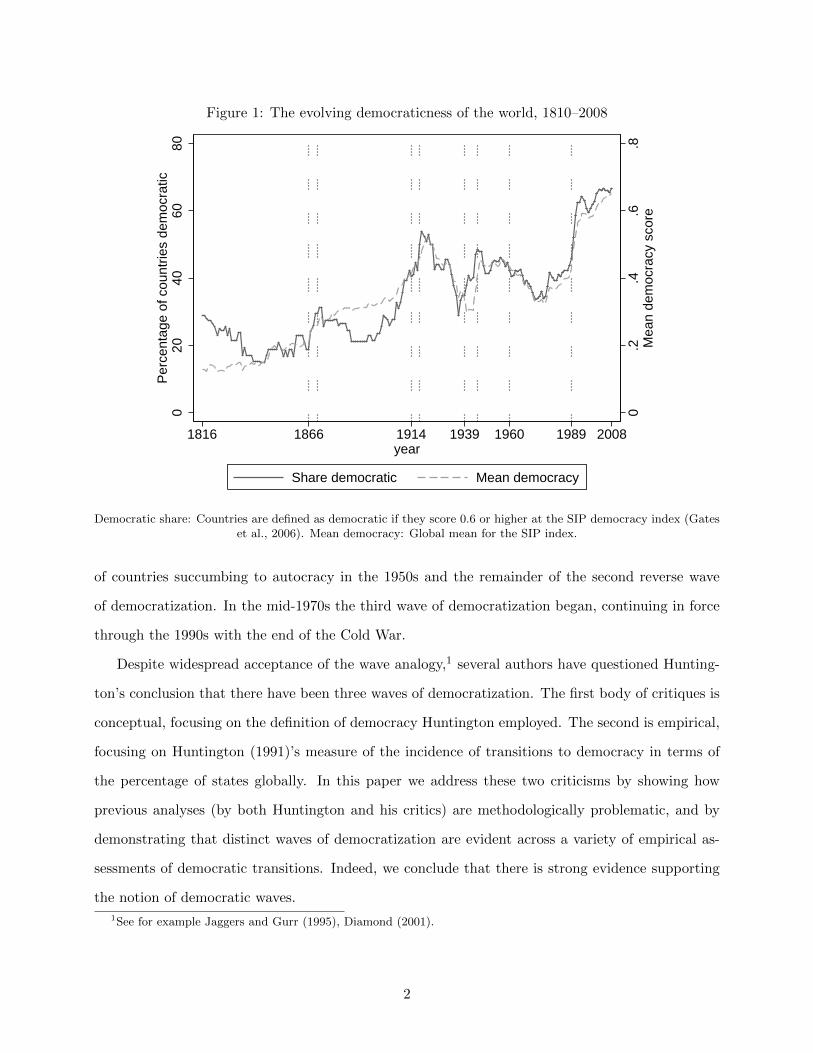
Figure 1: The evolving democraticness of the world, 1810–2008
0.2
.4.6
.8M
ean
dem
ocra
cy s
core
020
4060
80P
erce
ntag
e of
cou
ntrie
s de
moc
ratic
1816 1866 1914 1939 1960 1989 2008year
Share democratic Mean democracy
Democratic share: Countries are defined as democratic if they score 0.6 or higher at the SIP democracy index (Gateset al., 2006). Mean democracy: Global mean for the SIP index.
of countries succumbing to autocracy in the 1950s and the remainder of the second reverse wave
of democratization. In the mid-1970s the third wave of democratization began, continuing in force
through the 1990s with the end of the Cold War.
Despite widespread acceptance of the wave analogy,1 several authors have questioned Hunting-
ton’s conclusion that there have been three waves of democratization. The first body of critiques is
conceptual, focusing on the definition of democracy Huntington employed. The second is empirical,
focusing on Huntington (1991)’s measure of the incidence of transitions to democracy in terms of
the percentage of states globally. In this paper we address these two criticisms by showing how
previous analyses (by both Huntington and his critics) are methodologically problematic, and by
demonstrating that distinct waves of democratization are evident across a variety of empirical as-
sessments of democratic transitions. Indeed, we conclude that there is strong evidence supporting
the notion of democratic waves.
1See for example Jaggers and Gurr (1995), Diamond (2001).
2
2.1 Definition of democracy
The first criticism of Huntington (1991) regards his definition of democracy. The foundation for
Huntington’s definition is derived from Dahl (1971)’s classic definition of democracy contained in
Polyarchy, which focused on the concepts of contestation and participation. Huntington’s coding
of democracy is based on the level or extent of: open, free and fair elections; limitations on po-
litical power; institutionalization and stability; and electoral competition and widespread voting
participation (Huntington, 1991, 7–13). Moreover, regarding ‘the issue of whether to treat democ-
racy and nondemocracy as a dichotomous or continuous variable,’ Huntington (1991, 11) employs
a dichotomous classification.
Doorenspleet (2000b, 384–406) criticizes Huntington’s operationalization of democracy. She
argues that Huntington fails to incorporate a dimension of inclusiveness in his measure, and proposes
a remedy partially based on participation figures. Her ‘minimal democracy’ measure, is dichotomous
and based on the concepts of participation and competition. In order to qualify for the democracy
label, a country must grant participatory rights to at least 80% of the total population and meet
a series of institutional criteria related to political competition. This measure is stricter than
Huntington’s original measure, and its use results in fewer countries being coded as democracy in
the early periods.
Przeworski et al. (2000, 36–50) employ a dichotomous definition of democracy based on whether
or not the executive and members of the legislature obtained office via at least semi-competitive
multi-party elections.2 This definition is substantially more less strict than that used by Huntington,
and Przeworski et al. code more countries as democratic than does Huntington. By the same token,
the bar for maintaining democratic status is much lower according to the Przeworski et al. definition
than to Huntington’s. Consequently, Przeworski et al. are less likely to code a country as switching
from democracy to autocracy than is Huntington. It is possible that the different conclusions these
authors reach regarding waves is due to the different definitions employed.
2A caveat to the Przeworski et al. (2000, 29) definition is that a country can satisfy the conditions of at leastsemicompetitive multi-party elections and still not be coded as democratic if there has been no alternation in powerduring the period analyzed. For a critique of this questionable coding rule see Gleditsch (2002).
3
2.2 Empirical issues
Both Doorenspleet (2000b) and Przeworski et al. (2000, 36–50) argue against the notion of waves.
Both criticize Huntington for classifying waves using a measure based on the percentage of states
that were democratic over time. The problem with this measure is that the number of states in
the global system increased dramatically during Huntington’s analysis period. Przeworski et al.
find that transitions between democracies and autocracies in the 1950–1990 period occur mostly in
Latin America, and that the rest of the world was relatively stable during this period. Focusing
on transitions rather than fractions of democracies, the authors find no clear wave structure. They
conclude that transitions occurred both to and from democracies between 1950 and 1990, with a
monotonic increase in favor of democracies during the period. However, it should be remembered
that these authors use a very narrow definition of democracy, with a similarly strong threshold for
a regime change.
Doorenspleet argues along the lines of Przeworski et al. (2000) and focuses on transitions in
order to remedy the effect of the different number of observations over time. Weighting transitions
by the size of the international system, she finds three periods of growth, but no reverse trends. She
concludes that further research ‘should be careful in comparing and explaining different waves of
democratization. ... [F]uture studies in which reverse waves are compared will be useless, because
there are no reverse waves’ (Doorenspleet, 2000b, 400).
In sum, the case made by Doorenspleet and Przeworski et al. is that there are no waves, only
Huntington’s misconception of democracy and problems with his methodology. However, both
Doorenspleet and Przeworski et al. base their analysis on a dichotomous definition of democracy
that is simply too blunt to be able to adequately assess transitions from one type of regime to
another, and hence to be of much use for understanding the refined concept of democratic and
autocratic transitions.
2.3 Waves assessed in small steps
Binary distinctions between democracy and non-democracy are sensitive to where one makes the
cut. This is particularly problematic when evaluating regime transitions. With a dichotomous
measure of democracy, only one kind of political transition can be evaluated – the shift from non-
4
democracy to democracy or vice-versa. A continuous index of democracy is better suited, since all
types of political transitions can be evaluated and the magnitude of a transition can be assessed.
Such a methodology allows us to better understand the nature of political transitions and how they
relate to the patterns of global democratization.
The SIP index (Gates et al., 2006) condenses a three-dimensional conceptualization of democracy
to one dimension.3 The SIP is the average of the three (normalized) components of the three-
dimensional indicator. The entire scale of the index ranges from 0 (a perfect autocracy) to 1 (a
perfect democracy). The dotted line in Figure 1 shows the average democracy value in the system
for the 1810–2008 period.
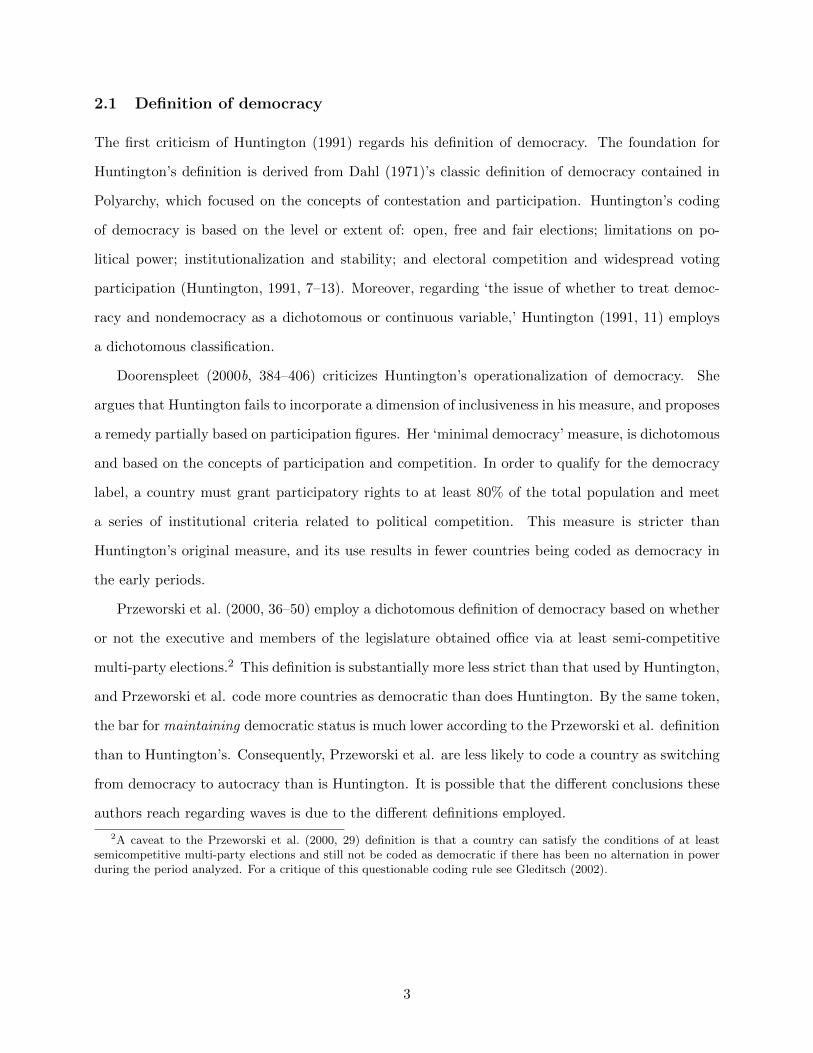
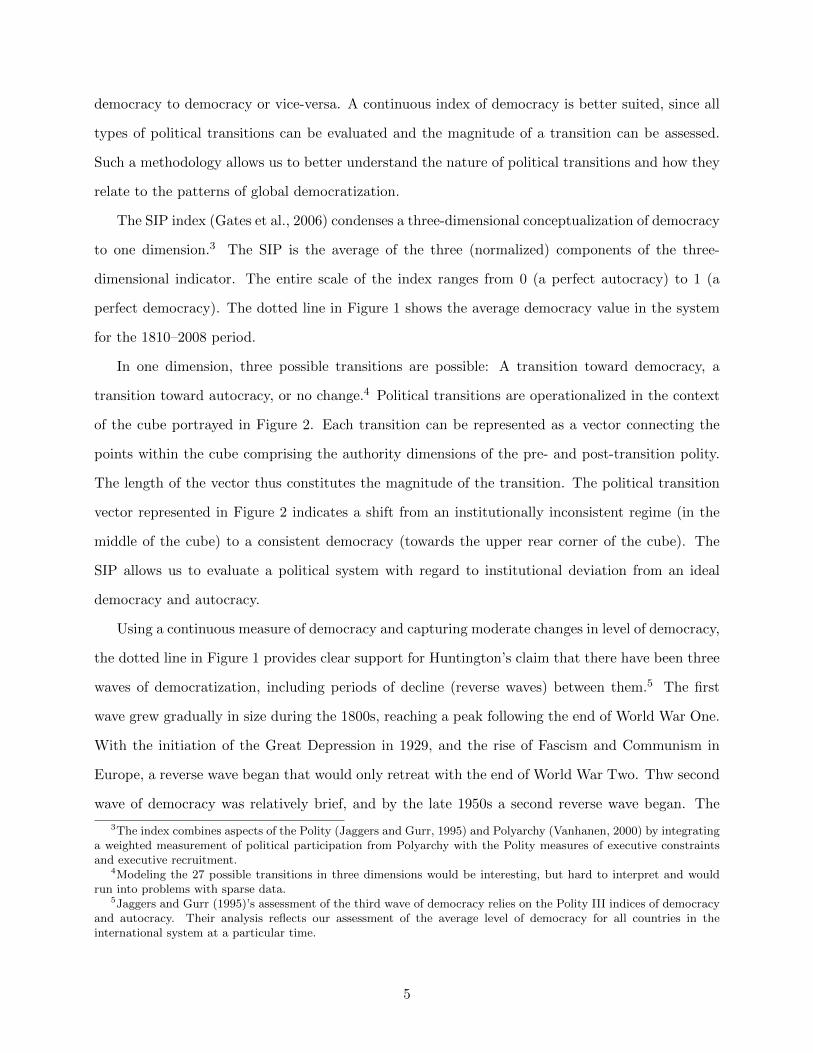
In one dimension, three possible transitions are possible: A transition toward democracy, a
transition toward autocracy, or no change.4 Political transitions are operationalized in the context
of the cube portrayed in Figure 2. Each transition can be represented as a vector connecting the
points within the cube comprising the authority dimensions of the pre- and post-transition polity.
The length of the vector thus constitutes the magnitude of the transition. The political transition
vector represented in Figure 2 indicates a shift from an institutionally inconsistent regime (in the
middle of the cube) to a consistent democracy (towards the upper rear corner of the cube). The
SIP allows us to evaluate a political system with regard to institutional deviation from an ideal
democracy and autocracy.
Using a continuous measure of democracy and capturing moderate changes in level of democracy,
the dotted line in Figure 1 provides clear support for Huntington’s claim that there have been three
waves of democratization, including periods of decline (reverse waves) between them.5 The first
wave grew gradually in size during the 1800s, reaching a peak following the end of World War One.
With the initiation of the Great Depression in 1929, and the rise of Fascism and Communism in
Europe, a reverse wave began that would only retreat with the end of World War Two. Thw second
wave of democracy was relatively brief, and by the late 1950s a second reverse wave began. The
3The index combines aspects of the Polity (Jaggers and Gurr, 1995) and Polyarchy (Vanhanen, 2000) by integratinga weighted measurement of political participation from Polyarchy with the Polity measures of executive constraintsand executive recruitment.
4Modeling the 27 possible transitions in three dimensions would be interesting, but hard to interpret and wouldrun into problems with sparse data.
5Jaggers and Gurr (1995)’s assessment of the third wave of democracy relies on the Polity III indices of democracyand autocracy. Their analysis reflects our assessment of the average level of democracy for all countries in theinternational system at a particular time.
5
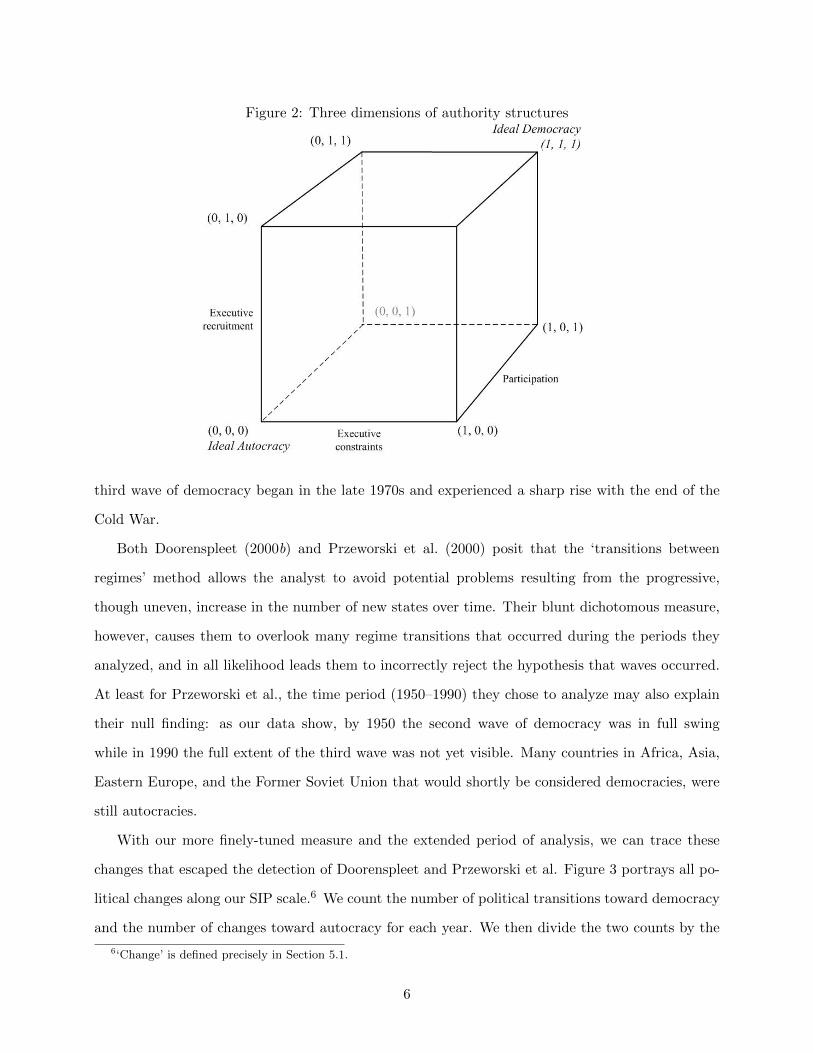
Figure 2: Three dimensions of authority structures
third wave of democracy began in the late 1970s and experienced a sharp rise with the end of the
Cold War.
Both Doorenspleet (2000b) and Przeworski et al. (2000) posit that the ‘transitions between
regimes’ method allows the analyst to avoid potential problems resulting from the progressive,
though uneven, increase in the number of new states over time. Their blunt dichotomous measure,
however, causes them to overlook many regime transitions that occurred during the periods they
analyzed, and in all likelihood leads them to incorrectly reject the hypothesis that waves occurred.
At least for Przeworski et al., the time period (1950–1990) they chose to analyze may also explain
their null finding: as our data show, by 1950 the second wave of democracy was in full swing
while in 1990 the full extent of the third wave was not yet visible. Many countries in Africa, Asia,
Eastern Europe, and the Former Soviet Union that would shortly be considered democracies, were
still autocracies.
With our more finely-tuned measure and the extended period of analysis, we can trace these
changes that escaped the detection of Doorenspleet and Przeworski et al. Figure 3 portrays all po-
litical changes along our SIP scale.6 We count the number of political transitions toward democracy
and the number of changes toward autocracy for each year. We then divide the two counts by the
6‘Change’ is defined precisely in Section 5.1.
6
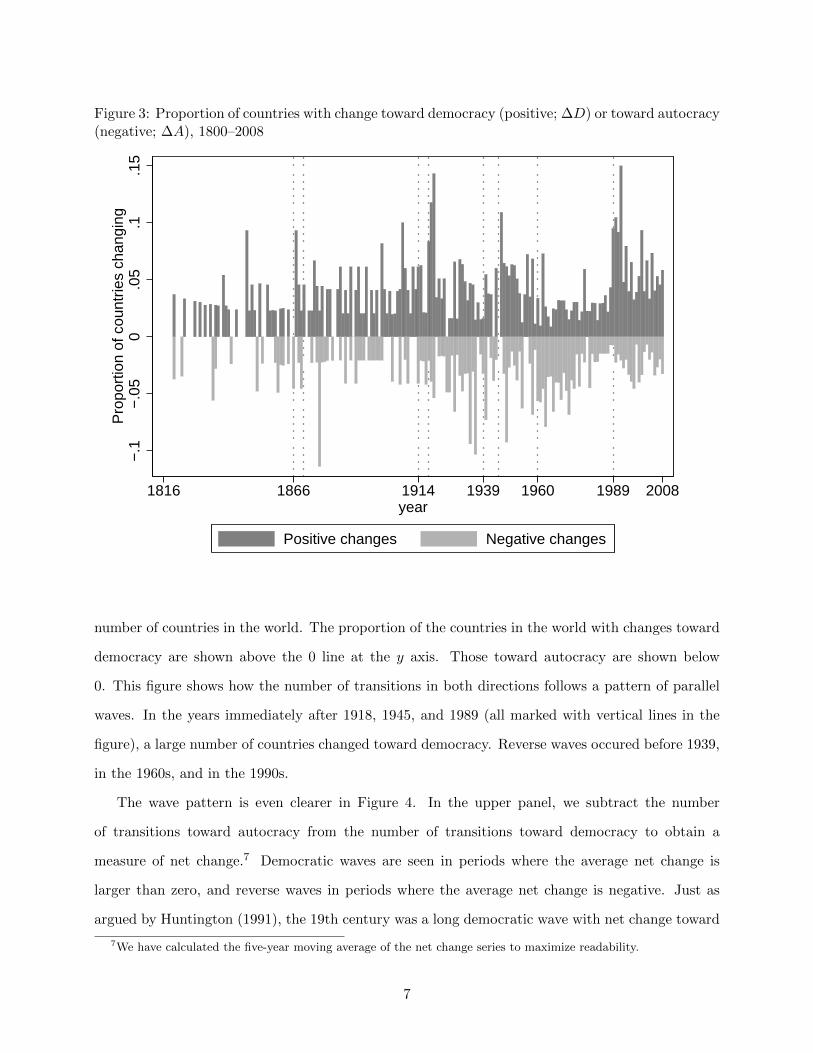
Figure 3: Proportion of countries with change toward democracy (positive; ∆D) or toward autocracy(negative; ∆A), 1800–2008
−.1
−.0
50
.05
.1.1
5P
ropo
rtio
n of
cou
ntrie
s ch
angi
ng
1816 1866 1914 1939 1960 1989 2008year
Positive changes Negative changes
number of countries in the world. The proportion of the countries in the world with changes toward
democracy are shown above the 0 line at the y axis. Those toward autocracy are shown below
0. This figure shows how the number of transitions in both directions follows a pattern of parallel
waves. In the years immediately after 1918, 1945, and 1989 (all marked with vertical lines in the
figure), a large number of countries changed toward democracy. Reverse waves occured before 1939,
in the 1960s, and in the 1990s.
The wave pattern is even clearer in Figure 4. In the upper panel, we subtract the number
of transitions toward autocracy from the number of transitions toward democracy to obtain a
measure of net change.7 Democratic waves are seen in periods where the average net change is
larger than zero, and reverse waves in periods where the average net change is negative. Just as
argued by Huntington (1991), the 19th century was a long democratic wave with net change toward
7We have calculated the five-year moving average of the net change series to maximize readability.
7
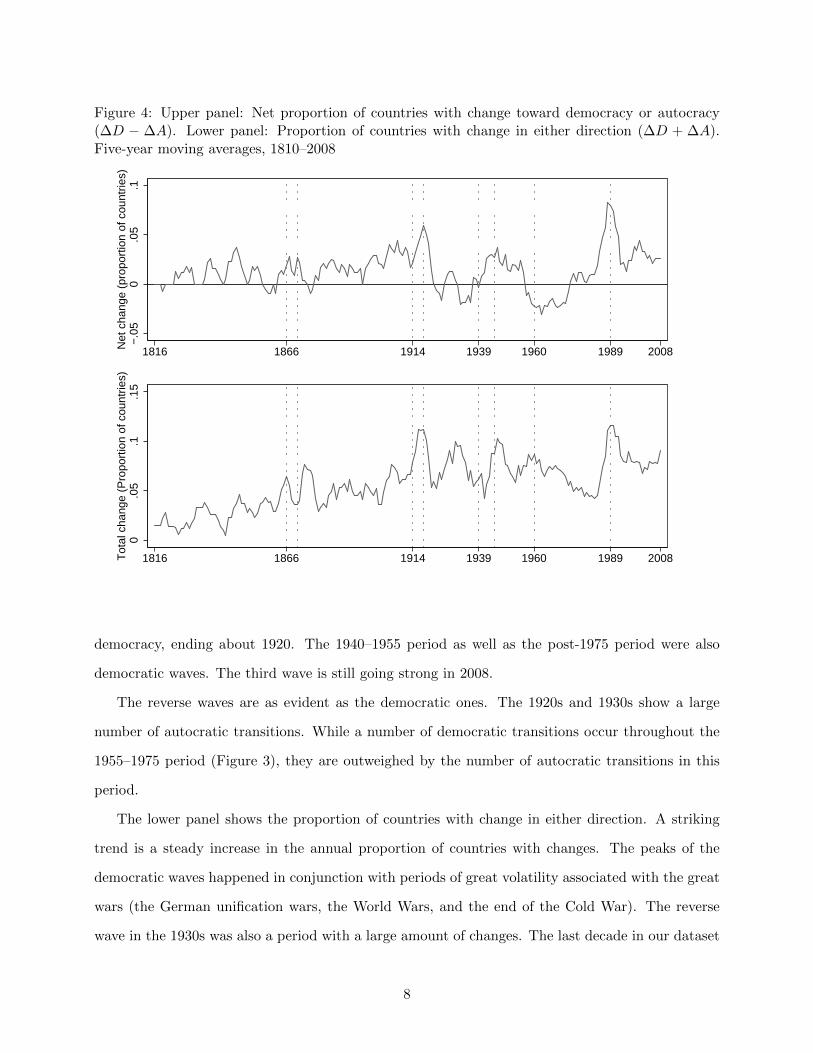
Figure 4: Upper panel: Net proportion of countries with change toward democracy or autocracy(∆D − ∆A). Lower panel: Proportion of countries with change in either direction (∆D + ∆A).Five-year moving averages, 1810–2008
−.0
50
.05
.1N
et c
hang
e (p
ropo
rtio
n of
cou
ntrie
s)
1816 1866 1914 1939 1960 1989 2008
0.0
5.1
.15
Tot
al c
hang
e (P
ropo
rtio
n of
cou
ntrie
s)
1816 1866 1914 1939 1960 1989 2008
democracy, ending about 1920. The 1940–1955 period as well as the post-1975 period were also
democratic waves. The third wave is still going strong in 2008.
The reverse waves are as evident as the democratic ones. The 1920s and 1930s show a large
number of autocratic transitions. While a number of democratic transitions occur throughout the
1955–1975 period (Figure 3), they are outweighed by the number of autocratic transitions in this
period.
The lower panel shows the proportion of countries with change in either direction. A striking
trend is a steady increase in the annual proportion of countries with changes. The peaks of the
democratic waves happened in conjunction with periods of great volatility associated with the great
wars (the German unification wars, the World Wars, and the end of the Cold War). The reverse
wave in the 1930s was also a period with a large amount of changes. The last decade in our dataset
8
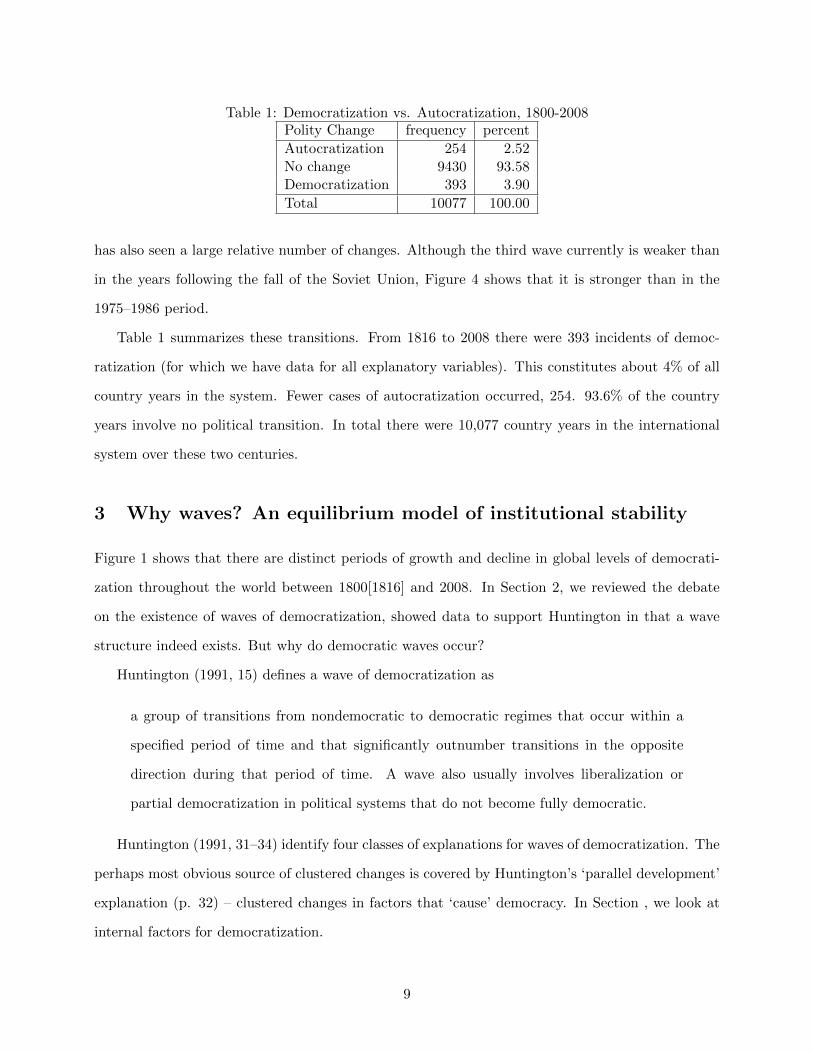
Table 1: Democratization vs. Autocratization, 1800-2008Polity Change frequency percent
Autocratization 254 2.52No change 9430 93.58Democratization 393 3.90
Total 10077 100.00
has also seen a large relative number of changes. Although the third wave currently is weaker than
in the years following the fall of the Soviet Union, Figure 4 shows that it is stronger than in the
1975–1986 period.
Table 1 summarizes these transitions. From 1816 to 2008 there were 393 incidents of democ-
ratization (for which we have data for all explanatory variables). This constitutes about 4% of all
country years in the system. Fewer cases of autocratization occurred, 254. 93.6% of the country
years involve no political transition. In total there were 10,077 country years in the international
system over these two centuries.
3 Why waves? An equilibrium model of institutional stability
Figure 1 shows that there are distinct periods of growth and decline in global levels of democrati-
zation throughout the world between 1800[1816] and 2008. In Section 2, we reviewed the debate
on the existence of waves of democratization, showed data to support Huntington in that a wave
structure indeed exists. But why do democratic waves occur?
Huntington (1991, 15) defines a wave of democratization as
a group of transitions from nondemocratic to democratic regimes that occur within a
specified period of time and that significantly outnumber transitions in the opposite
direction during that period of time. A wave also usually involves liberalization or
partial democratization in political systems that do not become fully democratic.
Huntington (1991, 31–34) identify four classes of explanations for waves of democratization. The
perhaps most obvious source of clustered changes is covered by Huntington’s ‘parallel development’
explanation (p. 32) – clustered changes in factors that ‘cause’ democracy. In Section , we look at
internal factors for democratization.
9

Most of the internal factors we can observe cross-nationally, however, rarely change sufficiently
rapidly to give rise to waves. External factors that fall in under the ‘single-cause’ heading (Hunt-
ington, 1991, 31–32), on the other hand, such as swift changes in global norms toward democracy
or a change in the attitudes or global influence of a superpower, can change quickly. In Section we
look into the importance of systemic shocks and the creation of new states for the three waves of
democratization over the last 200 years.
Huntington builds his argument on a dichotomous conception of democracy, and his account
of what stabilizes democracy only accounts for non-institutional factors such as the size of the
middle class or influence by other powers (as do Przeworski et al., 2000). Studies following Gurr
(1974), however, indicate that gradual democratizations also introduce institutional tensions that
we argue add to the propensity for wave-like behavior. In Section 3.1.2, we argue that these tensions
supplement Huntington’s explanation. They give rise to a reformulation of his notions of ‘prevailing
nostrum’ and ‘snowballing’ (Huntington, 1991, 33–34). In addition, the ‘stickiness’ of self-reinforcing
institutional configurations is a source of wave behavior not covered by Huntington.
Our explanation of waves, then, has three components: Aspects of each country’s institutions,
non-institutional factors internal to each country, and factors external to each country. We discuss
these in turn and then derive a set of propositions that we test in Section 6.
3.1 Internal determinants of stability and change
An explanation of waves and reverse waves is incomplete without a model of how democratization
and autocratization occurs. First, we discuss two non-institutional factors that are prominent in
the literature.
3.1.1 Internal non-institutional factors: the ‘economic’ model
A huge literature demonstrates the strong relationship between socio-economic development and
democratization (e.g. Lipset, 1959, Vanhanen, 1997, Przeworski et al., 2000). The relationship may
be explained by a large number of mechanisms. Lipset (1959) argued that higher income and
better education for ‘the lower strata’ would lead to more compromise-oriented view of politics,
and to greater surpluses to distribute. Lipset (1959) and Dahl (1971) focus on the importance of
a diversified economy with ample economic opportunities without direct access to political office.
10

Boix (2003) and Acemoglu and Robinson (2000) highlight how economic development increases
the relative share of assets that cannot be appropriated by means of force, making it less costly for
elites to allow for redistribution. These mechanisms make autocratic institutions sustainable in low-
income, natural resource dependent, illiterate societies, whereas democracy thrives in high-income
countries dependent on skilled labor and financial capital.
These socio-economic factors have changed immensely in most parts of the world over the two
centuries studied here. They all change gradually, however. Although development certainly is
a major explanation of the long-term increase in democracy seen in Figure 1, it cannot in itself
easily explain the tendency for democratization to cluster, except in the unlikely case that several
countries simultaneously reaches a ‘development threshold’ over which democracy is sustainable.
Another regularity, however, points to how development can lead to wave patterns. All regimes,
autocratic, democratic, and inconsistent ones, are considerably more stable when countries have
solid economic growth (Gasiorowski, 1995, Przeworski et al., 2000, Gates et al., 2006). Economic
growth, then, simultaneously supports non-democratic and inconsistent regimes in the short run
while steadily undermining the conditions that sustain non-democratic regimes in the long run.8
This adds a new aspect to our model of stable constellations of institutions. Economic diversification
increases the amount of non-institutional sources of political leverage for the opposition. Strikes
and demonstrations are much more costly in economies dependent on manufacturing or tourism
than in those mainly based on agriculture or oil extraction.
Economic development, then, can gradually render non-democratic countries more and more
‘ripe for revolution’. Since economic development often happens in parallel in neighboring countries,
it is likely that regions become institutionally volatile in concert. We would argue that the Middle
East (at least the non-oil producing parts) has reached such a state. Small sparks, then, have a
potential to set a fire. Our two first propositions are:
Proposition 1 Economic development increases the probability of transition toward democracy
Proposition 2 Economic growth decreases the the probability of political transition
8Olson (1993) points to related mechanisms with similar long-term consequences.
11

3.1.2 Internal institutional factors
There is a limit to how much wave behavior economic development can explain, however, since it
changes only gradually. But slowly changing factors can give rise to waves if two other characteristics
are present: (1) a ‘stickiness’ that prevents any change, and (2) dependence between events and
situations in different entities (giving rise to ‘snowballing’).
There are at least three sources of stickiness in political institutions. The first relates to the
inherent stability of certain institutions. Gurr (1974) and Gates et al. (2006) demonstrate that
‘consistent’ political institutions – institutions that are either autocratic or democratic in all their
constituent components – are much more stable than inconsistent institutions.9 Autocracies and
democracies exhibit consistent patterns of authority, where authority is concentrated in autocracies
and dispersed in democracies. Polities with aspects of both concentrated and dispersed authority
patterns provide institutional opportunities for political entrepreneurs to attempt to further concen-
trate or distribute power. In the language of evolutionary game theory, autocracy and democracy
are evolutionary stable strategies (ESS), while institutionally inconsistent polities are not. If the
opposition attempts to change one single aspect of an autocratic political system in a democratic
direction, the elites controlling the other components will have strong incentives and ample oppor-
tunities to prevent the reform. If a partial reform succeeds, they are in a strong position to reverse
the reform after some time. To be reasonably certain to succeed in democratizing a consistently
autocratic regime, the opposition must replace the incumbent with one elected in open, fair, and
regulated elections as well as establishing effective systems of checks and balances to constrain the
newly elected leader. In such situations, the external impetus for change must be exceedingly strong
to produce a lasting effect.
Another source of stickiness is consolidation of institutions – as the elites and the opposition
within the political system adapt to existing institutions, bolstering their power and acknowledge
situations of stalemate, the constellation of components becomes more stable.
A third source of stickiness elaborated by Kuran (1989) is due to a combination of collective
9See Eckstein (1969; 1973). We focus on three authority dimensions, executive recruitment, executive constraints,and participation. Consistent democracies exhibit completely open executive recruitment patterns (associated withopen free elections), constrained executives, and high levels of political participation. Consistent autocracies exhibitclosed and limited (yet institutionalized) executive recruitment, no constraints on executive power, and no publicpolitical participation. Institutionally inconsistent regimes exhibit a mix of these authority patterns.
12
action and coordination problems and incentives for preference falsification among the supporters of
the opposition. Since the autocratic regime routinely punishes individuals issuing public statements
of support for the opposition, individuals will refrain from revealing their preferences. Even in cases
where a sufficient proportion of the population privately supports a revolution to make it feasible, it
will not occur because they are not aware of how large this support is. In such a situation, the regime
is very unstable without anybody knowing it. It will only take a spark such as the self-immolation
of Mohammed Bouazizi in Tunisia to ignite the ‘prairie fire’ of revolution.
These expectations are summarized in the following propositions:
Proposition 3 Inconsistent regimes are more likely to experience political transition
Proposition 4 Inconsistent regimes are more likely to change toward the most proximate consistent
regime type
Proposition 5 A constellation of institutions becomes less likely to change the longer it exists
3.2 External factors
We identify three external-factor explanations for the wave structure observed in the figures above.
In this section, we treat a set of political neighborhood effects. In the next section, we return
to shocks to the international system (such as global war) and the birth of new states with weak
institutions (often born out of such systemic shocks).
3.2.1 Political neighborhood
Political neighborhoods are also important (Gleditsch and Ward, 2000, Gleditsch, 2002, Gleditsch
and Ward, 2006). Kuran’s argument also provides a partial explanation for snowballing – the
preference revelation in Tunisia observed at the end of 2010 provided information on preferences
also to the potential opposition in Egypt and Libya. Changes to political systems, then, depend on
the situation and events in other countries, in particular in the immediate neighborhood. Assuming
that autocratic elites in neighboring countries have joint interests in preserving the status quo, they
are also likely to assist each other, just as a strong opposition movement may strengthen that of a
neighboring country. In cases where the power balance between the incumbent and the opposition
13

is already precarious, the shift in power due to changes in foreign support may be sufficient to tip
the balance. Given this, autocratic systems should be more stable in autocratic neighborhoods, and
vice versa.
Likewise, democracies (especially new democracies) are most likely to collapse when surrounded
by autocracies. The biggest problem is that such autocracies may serve as a security threat. If a
country is located in a region of warfare or a security threat, democratic institutions are compro-
mised (Gates, Knutsen and Moses, 1996, Thompson, 1996). Examples of restricted freedom during
wartime, e.g. martial law, demonstrate how democratization can be hindered by a security threat.
The expectation, then, is that political systems are less stable when surrounded by regimes
different from themselves, and tend to change in the direction of the prevailing regime type in the
neighborhood:
Proposition 6 The more a country differs from its political neighborhood, the more likely it is to
experience a political transition.
Proposition 7 States are more likely to have polity changes towards the average democracy value
(SIP value) in its neighborhood.
Proposition 8 Polity changes are likely to cascade: a regime change in one country is likely to be
followed by a regime change in the same direction in a neighboring country.
3.2.2 Systemic wars
War and system shock are the most important external factors for explaining why waves crest when
they do. As demonstrated by the analysis of the international system 1816–1992 in Mitchell, Gates
and Hegre (1999), the dominant systemic effect of war is to increase democratization. They conclude
that ‘an increase in the proportion of nations fighting war in the international system will increase
the proportion of democracies due in large part to the finding that non-democracies are more likely
to experience regime change than democracies as a result of war’ (789).10
Kadera, Crescenzi and Shannon (2003)) further link the relationship between war and democ-
racy. Their article concludes that the survival of democracies depends on the capabilities of the
10Mitchell, Gates and Hegre (1999) find that the dynamic whereby non-democratic regimes tend not to survivewars does not hold with lower-level military conflict (e.g., MIDs). Non-democracies tend to persist despite losing suchconflicts.
14
democratic group relative to other political systems in the international community. Bueno de
Mesquita, Siverson and Woller (1992) show that regime changes occur almost twice as often during
and immediately after wars than in peacetime and most of these regime changes affect autocracies.
Given democracies’ greater propensity to win wars and autocracies’ greater propensity to expire in
defeat, war is associated with greater democratization (Lake, 1992, Stam, 1996, Reiter and Stam III,
1998).11 This pattern is evident in the three systemic shocks associated with the genesis of new
states. World War One was clearly won by the democratic alliance. World War Two was a shared
victory by the Western democracies and the Communist states. The Cold War was won by the
Western democracies. As was evident after both World Wars, democracies promoted and even im-
posed their form of government on the vanquished in the war’s aftermath.12 In this way, systemic
shocks result in the creation of a number of new democracies, which in turn account for the crests
of the waves characterizing the pattern of global democratization.
This argument gives rise to the following propositions:
Proposition 9 Shocks to the international system (systemic wars) will result in significant in-
creases in the likelihood of democratization.
Proposition 10 States are more likely to have polity changes towards the average democracy value
(SIP value) in its neighborhood.
The effect of systemic change in the global level of democracy of course does not occur uniformly
around the world. Indeed political transitions cluster regionally (Gleditsch, 2002, Gleditsch and
Ward, 2006). In this way, the effects of a country’s neighborhood, expressed as propositions 6 and
7 are associated with the systemic factors expressed above.
3.2.3 New states
In the aftermath of systemic shocks, a number of new states have emerged. World War One saw
the breakup of the Austro-Hungarian and Ottoman Empires. World War Two brought about
11See Gleditsch and Hegre (1997), Crescenzi and Enterline (1999), and Cederman (2001), for studies of the systemiclinks between democracy and war. See Stam (1996), Reiter and Stam III (1998), and Bueno de Mesquita et al. (2003)for explanations as to why democracies are more likely to win wars than non-democracies.
12It should be noted, however, that the analysis in Werner (1996) of foreign imposed regime changes suggeststhat there is little empirical support that fighting against a democratic opponent in war increases the chances for animposed regime change.
15
decolonialization. The end of the Cold War resulted in the break-up of the Soviet Union. Each
of these systemic shocks produced a number of new states. The first political systems in these
states, we hypothesize, were relatively democratic. If so, the emergence of new states give rise to
democratic waves if independence is clustered in time.
Reverse waves, however, are also linked to these new states. In particular, reverse waves are
caused by the fragile nature of the political institutions created in the wake of international systemic
shocks. New states eventually encounter economic or security problems and soon backslide towards
autocracy. Indeed the pattern amongst newly independent states is one of instability. Given the
dispersal of power inherent in democracies, consolidation of democratic institutions is critical to their
survival. This is not to say that unconsolidated democracies cannot survive, but that unconsolidated
regimes are more vulnerable than consolidated regimes. We thus posit the following propositions:
Proposition 11 New states are more likely it is to experience political changes in either direction.
Proposition 12 New states tend to be more democratic than old states with similar characteristics
Proposition 13 New states are more likely it is to experience political changes towards autocracy.
4 International shocks, new states, and political neighborhoods:
A look at global trends
The pattern of spikes observable during the 20th Century in Figure 3 indicates the big role played
by international shocks and newly independent states. The first spike occurs in the aftermath of
World War One. The Treaty of Versailles created a number of new states in Central and Eastern
Europe. Most of them were born as fledgling democracies and are reflected in this positive spike as
well as the clear positive wave. By the 1930s, in the face of the Great Depression and the rise of
fascism and communism in Europe, most of these countries lapsed into autocracy. These transitions
to autocracy are evident in the large negative spikes in the 1930s.
16
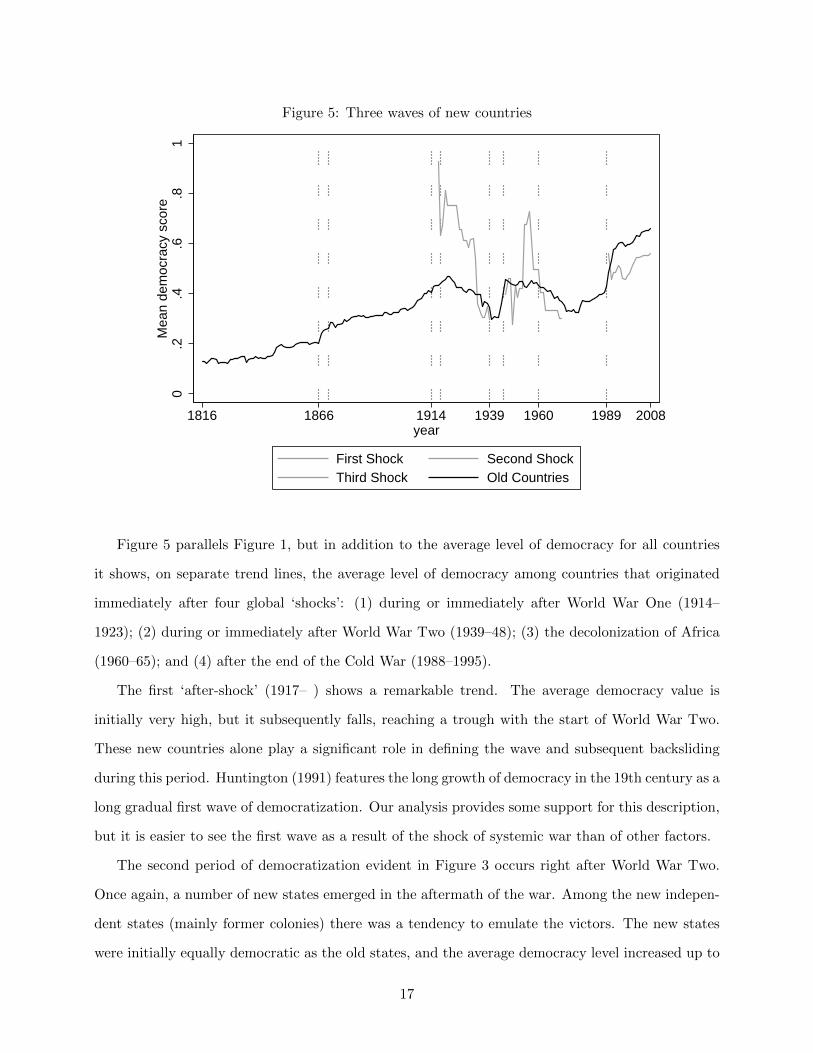
Figure 5: Three waves of new countries
0.2
.4.6
.81
Mea
n de
moc
racy
sco
re
1816 1866 1914 1939 1960 1989 2008year
First Shock Second ShockThird Shock Old Countries
Figure 5 parallels Figure 1, but in addition to the average level of democracy for all countries
it shows, on separate trend lines, the average level of democracy among countries that originated
immediately after four global ‘shocks’: (1) during or immediately after World War One (1914–
1923); (2) during or immediately after World War Two (1939–48); (3) the decolonization of Africa
(1960–65); and (4) after the end of the Cold War (1988–1995).
The first ‘after-shock’ (1917– ) shows a remarkable trend. The average democracy value is
initially very high, but it subsequently falls, reaching a trough with the start of World War Two.
These new countries alone play a significant role in defining the wave and subsequent backsliding
during this period. Huntington (1991) features the long growth of democracy in the 19th century as a
long gradual first wave of democratization. Our analysis provides some support for this description,
but it is easier to see the first wave as a result of the shock of systemic war than of other factors.
The second period of democratization evident in Figure 3 occurs right after World War Two.
Once again, a number of new states emerged in the aftermath of the war. Among the new indepen-
dent states (mainly former colonies) there was a tendency to emulate the victors. The new states
were initially equally democratic as the old states, and the average democracy level increased up to
17

1995. After that, these countries changed in an autocratic direction.
The third positive spike in Figure 3 occurs in 1992.13 It reflects the end of the Cold War and
the subsequent disintegration of the Soviet Union. The Cold War’s aftermath produced an effect
similar to that seen following the end of both World War One and World War Two; the birth of
fledgling democracies. Figure 5 shows initially high levels of democracy in the group of new states,
followed by a precipitous drop in average value of democracy. What is different from the previous
waves is that the sharp backslide begins immediately – these newly independent states are relatively
more democratic than other states only in 1989. Nonetheless, it should be noted that these states
did not autocratize too seriously and the relative level of democracy was much higher in the 1990s
than it had been in previous periods.
Figure 5 provides support for Propositions 12 and 13. Systemic shocks are associated with global
bursts of political transformation. Democratizing spikes are associated with the end of World War
One, World War Two, and the Cold War. By singling out the states created in conjunction with
these shocks, we see one reason why democratic waves crest. This disaggregation also allows us
to track the reverse waves, which tend to be disproportionately associated with the backsliding of
these newly created states.
We now turn to a multivariate analysis, which will allow us to better evaluate our propositions.
5 An empirical model of political transitions
The figures presented so far in this paper provide visual evidence to support our proposition that
there are waves of democratization and that these waves are caused by international shocks and the
creation of newly independent states. We now turn to a multivariate statistical analysis of political
instability to rigorously test these propositions, controlling for other variables as well.
To test these propositions, we need an empirical model that satisfies the following criteria: It
relates the probabilities of change toward democracy, change toward autocracy, and no change
to each other, specifies these probabilities as functions of the explanatory variables of interest,
captures sufficiently fine-grained changes to the SIP index, and allows the transition probabilities
to be dependent on the initial type of institution.
13This is two years after the year (1990) in which Przeworski et al. ended their analysis.
18
We want to model changes as small as 0.03 on our unit-scale democracy index. Modeling the
entire transition matrix between the 33 intervals formed by subdividing the index into similar-size
segments would be infeasible. Nor is it necessary. Our interest lies mainly in whether there was
democratization, autocratization, or no change. We model this as two types of transitions: we code
an observation as a democratization if the SIP score at time t is at least 0.03 higher than the SIP
score at t− 1. Likewise, we code an autocratization if SIPt < SIPt−1 − 0.03. In any other case, we
code the observation as no change. To compensate for the lack of flexibility in this model relative to
the full Markov Chain model, we code a set of covariates modeling the status at t− 1 that reflects
our a priori knowledge about these transitions.
From Gates et al. (2006), we know that polity changes are far more common in inconsistent
polities; the mid-range of the SIP index. We enter the SIP value at t − 1 and its square term to
model this. We also know that further democratization is impossible when the country has reached
the upper end of the scale and autocratization is impossible at the lower end. We model this by
coding indicator variables for whether SIPt−1 < 0.06 (lower end) and SIPt−1 > 0.91 (upper end).
With these adjustments, we can employ a multivariate logit model to evaluate our propositions
regarding the factors underlying the wave-like pattern of global democratization.
5.1 Dependent variable
Institutional change: Whether the present value of the SIP index has changed by a value of more
than 0.03 from the previous year, either upwards (democratization) or downwards (autocratization).
5.2 Independent variables in our four models
We will specify four different models to organize the testing of our propositions. The first two models
include internal factors only, the third includes neighborhood factors, and the final the impact of
system-wide shocks and the creation of new states.
All models include two terms that capture the fact that with a dependent variable bounded
between 0 and 1, the probability of change toward an end point is very small close to these end
points:
19
Upper end: A dummy variable that denotes whether the SIP index last year was higher than
.91.
Lower end: A dummy variable that denotes whether the SIP index last year was lower than .06.
5.2.1 The ‘economic’ model
In this model, we test propositions 1 and 2. It includes two variables:
GDP per capita: The natural logarithm of constant-dollar GDP per capita. The variable is
lagged by one year. We also include the square of log GDP per capita to be able to model a possible
non-linear relationship.
GDP growth: Growth in constant-dollar GDP per capita. The variable is measured as the
difference in log GDP per capita between year t − 1 and t, and is lagged by one year. Sources are
the same as for GDP per capita.
5.2.2 The ‘internal’ model
In the ‘internal’ model, we add three variables to the ‘economic’ model that allow us to test Propo-
sitions 3, 4, and 5:
SIP: The unidimensional index of democracy, lagged to model the relationship between the level
of democracy and the probability of democratizations or autocratizations. It is constructed as the
mean of the three dimensions of the MIRPS model, which are Decision constraints on the executive,
Regulation of executive recruitment, and Participation in competitive elections (cf. Gates et al,
2006; Appendix I).
SIP squared: The variable is squared to model the higher instability of regimes in the interme-
diate range of the democracy index (cf. Gates et al., 2006).
Brevity of polity: The probability of a regime change is likely to be dependent on whether there
has recently been a change in the country. We include two terms to capture this. Both variables are
20

decaying functions of the time since the last change in either direction. One of them is constructed
with a half-life of 16 years, the other with a half-life of 4 years.
5.2.3 The ‘internal-external’ model
In this model, we add another three variables that facilitate testing of propositions 6, 7, 8, and 10.
Global SIP: The difference between average democracy in the world and the democracy level of
the country under observation. The variable is lagged by one year. It is used an indictor of the pull
effect of the global level of democratization.
Neighborhood: The difference between the country’s SIP value and the average SIP in the
country’s immediate neighborhood. We define the neighborhood of country A as the countries that
are directly contiguous to A as coded by Stinnett et al. (2002). The variable is lagged by one year.
It accounts for the pull from one’s contiguous neighbors.
Change in neighborhood: Change in neighbors’ average SIP score from yeart−2 till yeart−1.
The variable is weighted on population. For those countries that have missing SIP score for yeart−2,
but not for yeart−1 and yeart−3, yeart−2 has been replaced by yeart−3.
5.2.4 The ‘system shock’ model
The final model subsumes the variables in the three preceding models. In addition, we add two
variables that allow testing of propositions 9, 11, and 13.
Shock: The shock variable is coded as 1 for all countries for the years 1914–23, 1939–49, and
1989–96.
Proximity of Independence: The variable is a decaying function of the time since the country
gained independence, with a half-life of 8 years.
6 Results and Discussion
Our main results are presented Table 2. The table has one column for each of our four models.
21
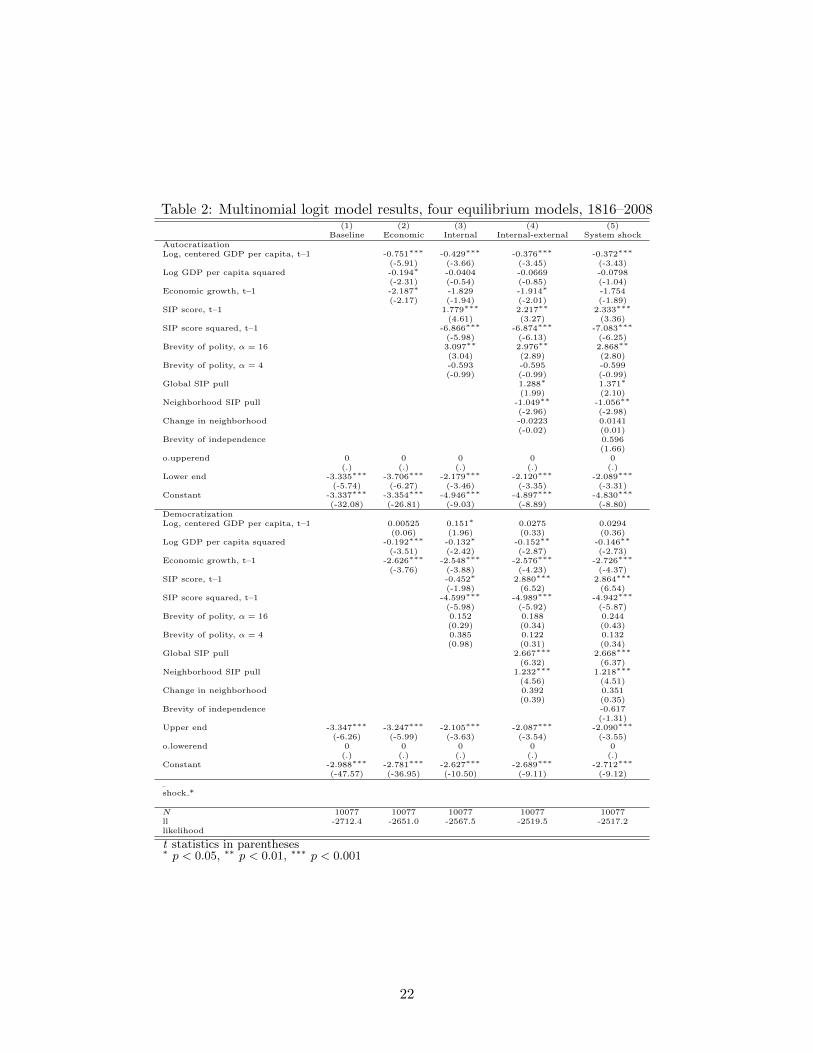
Table 2: Multinomial logit model results, four equilibrium models, 1816–2008(1) (2) (3) (4) (5)
Baseline Economic Internal Internal-external System shockAutocratizationLog, centered GDP per capita, t–1 -0.751∗∗∗ -0.429∗∗∗ -0.376∗∗∗ -0.372∗∗∗
(-5.91) (-3.66) (-3.45) (-3.43)Log GDP per capita squared -0.194∗ -0.0404 -0.0669 -0.0798
(-2.31) (-0.54) (-0.85) (-1.04)Economic growth, t–1 -2.187∗ -1.829 -1.914∗ -1.754
(-2.17) (-1.94) (-2.01) (-1.89)SIP score, t–1 1.779∗∗∗ 2.217∗∗ 2.333∗∗∗
(4.61) (3.27) (3.36)SIP score squared, t–1 -6.866∗∗∗ -6.874∗∗∗ -7.083∗∗∗
(-5.98) (-6.13) (-6.25)Brevity of polity, α = 16 3.097∗∗ 2.976∗∗ 2.868∗∗
(3.04) (2.89) (2.80)Brevity of polity, α = 4 -0.593 -0.595 -0.599
(-0.99) (-0.99) (-0.99)Global SIP pull 1.288∗ 1.371∗
(1.99) (2.10)Neighborhood SIP pull -1.049∗∗ -1.056∗∗
(-2.96) (-2.98)Change in neighborhood -0.0223 0.0141
(-0.02) (0.01)Brevity of independence 0.596
(1.66)o.upperend 0 0 0 0 0
(.) (.) (.) (.) (.)Lower end -3.335∗∗∗ -3.706∗∗∗ -2.179∗∗∗ -2.120∗∗∗ -2.089∗∗∗
(-5.74) (-6.27) (-3.46) (-3.35) (-3.31)Constant -3.337∗∗∗ -3.354∗∗∗ -4.946∗∗∗ -4.897∗∗∗ -4.830∗∗∗
(-32.08) (-26.81) (-9.03) (-8.89) (-8.80)DemocratizationLog, centered GDP per capita, t–1 0.00525 0.151∗ 0.0275 0.0294
(0.06) (1.96) (0.33) (0.36)Log GDP per capita squared -0.192∗∗∗ -0.132∗ -0.152∗∗ -0.146∗∗
(-3.51) (-2.42) (-2.87) (-2.73)Economic growth, t–1 -2.626∗∗∗ -2.548∗∗∗ -2.576∗∗∗ -2.726∗∗∗
(-3.76) (-3.88) (-4.23) (-4.37)SIP score, t–1 -0.452∗ 2.880∗∗∗ 2.864∗∗∗
(-1.98) (6.52) (6.54)SIP score squared, t–1 -4.599∗∗∗ -4.989∗∗∗ -4.942∗∗∗
(-5.98) (-5.92) (-5.87)Brevity of polity, α = 16 0.152 0.188 0.244
(0.29) (0.34) (0.43)Brevity of polity, α = 4 0.385 0.122 0.132
(0.98) (0.31) (0.34)Global SIP pull 2.667∗∗∗ 2.668∗∗∗
(6.32) (6.37)Neighborhood SIP pull 1.232∗∗∗ 1.218∗∗∗
(4.56) (4.51)Change in neighborhood 0.392 0.351
(0.39) (0.35)Brevity of independence -0.617
(-1.31)Upper end -3.347∗∗∗ -3.247∗∗∗ -2.105∗∗∗ -2.087∗∗∗ -2.090∗∗∗
(-6.26) (-5.99) (-3.63) (-3.54) (-3.55)o.lowerend 0 0 0 0 0
(.) (.) (.) (.) (.)Constant -2.988∗∗∗ -2.781∗∗∗ -2.627∗∗∗ -2.689∗∗∗ -2.712∗∗∗
(-47.57) (-36.95) (-10.50) (-9.11) (-9.12)
shock *
N 10077 10077 10077 10077 10077ll -2712.4 -2651.0 -2567.5 -2519.5 -2517.2likelihood
t statistics in parentheses∗ p < 0.05, ∗∗ p < 0.01, ∗∗∗ p < 0.001
22

Figure 6: Log odds of change, internal model: toward democracy (blue), toward autocracy (red)
-10
-8
-6
-4
-2
0
-12
-10
Log odds of autocratization Log odds of democratization
6.1 The economic model
The first column presents the results from the ‘economic’ model. Our propositions 1 and 2 receive
considerable support in this model. In line with the results in Lipset (1959), Przeworski et al.
(2000), and other studies, per-capita income is negatively correlated with the risk of autocratization
and positively correlated with democratization. The estimated relationship is strong – the odds of
change toward autocracy for a poor country like Niger is almost 10 times higher than that of a rich
country like South Korea.14 Correspondingly, the odds of change toward democracy are 70% higher
in South Korea than in Niger.
Figure 6 shows that the relationship between GDP per capita and the likelihood of change in
either direction is non-monotonic. The non-monotonicity is consistent with modernization theory
– at low modernization levels (proxied by low average income here), countries tend to be stably
autocratic. As income levels increase, a struggle over the setup of institutions emerges. At high
income levels, most countries have become either democratic or reached a stable autocratic system
where the opposition is regularly bought off (as in oil-rich states). We estimate that changes toward
autocracy are most likely at about USD 500, and democratizations most likely at about USD 4,000.
Economic growth reduces the odds of change in either direction – a five-percent increase in
annual growth reduces odds of autocratization by about 7% and that of democratization by about
2%.15
14GDP per capita for Niger in 2008 is USD 485. That of South Korea is USD 19,200. The difference in log GDPper capita is 3.68.
15The growth variable is measured as difference in log GDP per capita, so that a change of 0.01 roughly corresponds
23
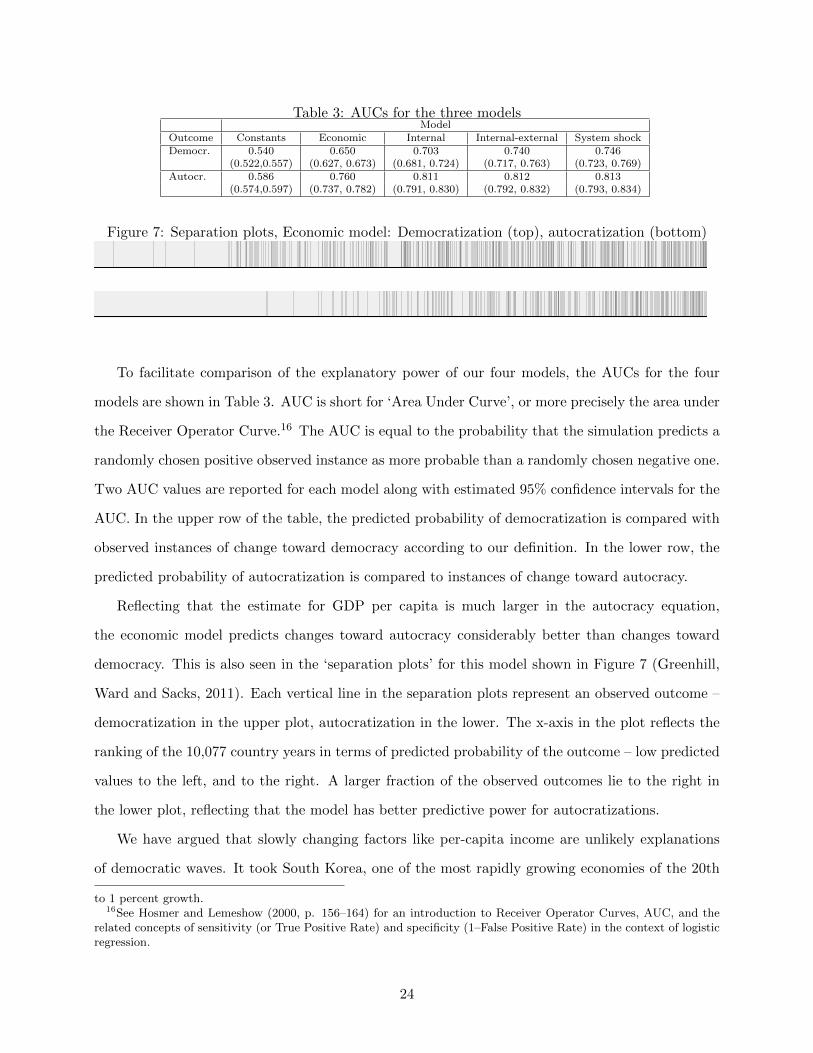
Table 3: AUCs for the three modelsModel
Outcome Constants Economic Internal Internal-external System shockDemocr. 0.540 0.650 0.703 0.740 0.746
(0.522,0.557) (0.627, 0.673) (0.681, 0.724) (0.717, 0.763) (0.723, 0.769)Autocr. 0.586 0.760 0.811 0.812 0.813
(0.574,0.597) (0.737, 0.782) (0.791, 0.830) (0.792, 0.832) (0.793, 0.834)
Figure 7: Separation plots, Economic model: Democratization (top), autocratization (bottom)
To facilitate comparison of the explanatory power of our four models, the AUCs for the four
models are shown in Table 3. AUC is short for ‘Area Under Curve’, or more precisely the area under
the Receiver Operator Curve.16 The AUC is equal to the probability that the simulation predicts a
randomly chosen positive observed instance as more probable than a randomly chosen negative one.
Two AUC values are reported for each model along with estimated 95% confidence intervals for the
AUC. In the upper row of the table, the predicted probability of democratization is compared with
observed instances of change toward democracy according to our definition. In the lower row, the
predicted probability of autocratization is compared to instances of change toward autocracy.
Reflecting that the estimate for GDP per capita is much larger in the autocracy equation,
the economic model predicts changes toward autocracy considerably better than changes toward
democracy. This is also seen in the ‘separation plots’ for this model shown in Figure 7 (Greenhill,
Ward and Sacks, 2011). Each vertical line in the separation plots represent an observed outcome –
democratization in the upper plot, autocratization in the lower. The x-axis in the plot reflects the
ranking of the 10,077 country years in terms of predicted probability of the outcome – low predicted
values to the left, and to the right. A larger fraction of the observed outcomes lie to the right in
the lower plot, reflecting that the model has better predictive power for autocratizations.
We have argued that slowly changing factors like per-capita income are unlikely explanations
of democratic waves. It took South Korea, one of the most rapidly growing economies of the 20th
to 1 percent growth.16See Hosmer and Lemeshow (2000, p. 156–164) for an introduction to Receiver Operator Curves, AUC, and the
related concepts of sensitivity (or True Positive Rate) and specificity (1–False Positive Rate) in the context of logisticregression.
24
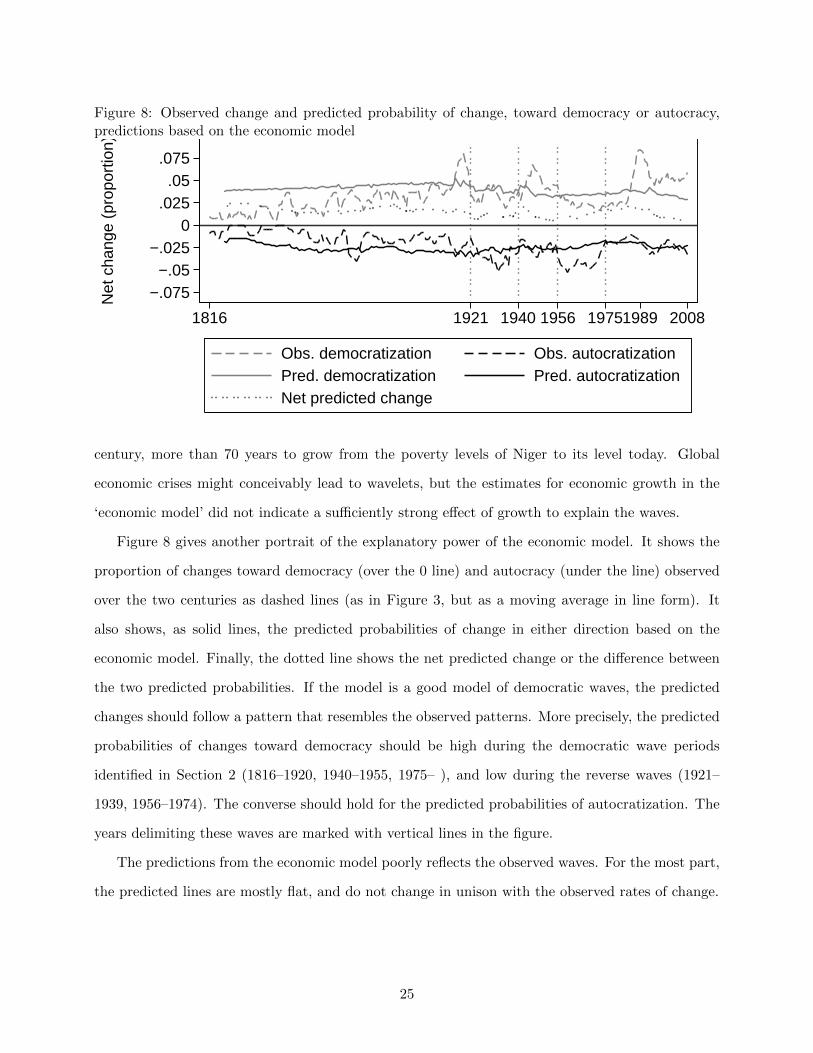
Figure 8: Observed change and predicted probability of change, toward democracy or autocracy,predictions based on the economic model
−.075−.05
−.0250
.025.05
.075
Net
cha
nge
(pro
port
ion)
1816 1921 1940 1956 19751989 2008
Obs. democratization Obs. autocratizationPred. democratization Pred. autocratizationNet predicted change
century, more than 70 years to grow from the poverty levels of Niger to its level today. Global
economic crises might conceivably lead to wavelets, but the estimates for economic growth in the
‘economic model’ did not indicate a sufficiently strong effect of growth to explain the waves.
Figure 8 gives another portrait of the explanatory power of the economic model. It shows the
proportion of changes toward democracy (over the 0 line) and autocracy (under the line) observed
over the two centuries as dashed lines (as in Figure 3, but as a moving average in line form). It
also shows, as solid lines, the predicted probabilities of change in either direction based on the
economic model. Finally, the dotted line shows the net predicted change or the difference between
the two predicted probabilities. If the model is a good model of democratic waves, the predicted
changes should follow a pattern that resembles the observed patterns. More precisely, the predicted
probabilities of changes toward democracy should be high during the democratic wave periods
identified in Section 2 (1816–1920, 1940–1955, 1975– ), and low during the reverse waves (1921–
1939, 1956–1974). The converse should hold for the predicted probabilities of autocratization. The
years delimiting these waves are marked with vertical lines in the figure.
The predictions from the economic model poorly reflects the observed waves. For the most part,
the predicted lines are mostly flat, and do not change in unison with the observed rates of change.
25
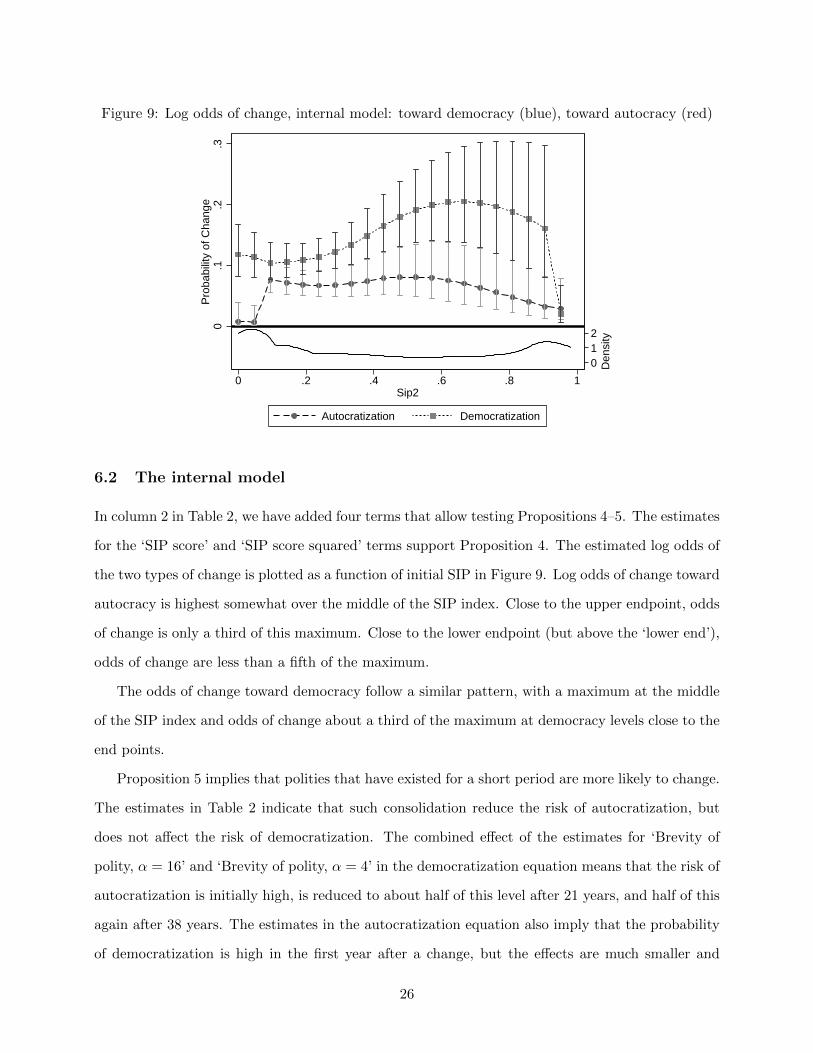
Figure 9: Log odds of change, internal model: toward democracy (blue), toward autocracy (red)
012
Den
sity
0.1
.2.3
Pro
babi
lity
of C
hang
e
0 .2 .4 .6 .8 1 Sip2
Autocratization Democratization
6.2 The internal model
In column 2 in Table 2, we have added four terms that allow testing Propositions 4–5. The estimates
for the ‘SIP score’ and ‘SIP score squared’ terms support Proposition 4. The estimated log odds of
the two types of change is plotted as a function of initial SIP in Figure 9. Log odds of change toward
autocracy is highest somewhat over the middle of the SIP index. Close to the upper endpoint, odds
of change is only a third of this maximum. Close to the lower endpoint (but above the ‘lower end’),
odds of change are less than a fifth of the maximum.
The odds of change toward democracy follow a similar pattern, with a maximum at the middle
of the SIP index and odds of change about a third of the maximum at democracy levels close to the
end points.
Proposition 5 implies that polities that have existed for a short period are more likely to change.
The estimates in Table 2 indicate that such consolidation reduce the risk of autocratization, but
does not affect the risk of democratization. The combined effect of the estimates for ‘Brevity of
polity, α = 16’ and ‘Brevity of polity, α = 4’ in the democratization equation means that the risk of
autocratization is initially high, is reduced to about half of this level after 21 years, and half of this
again after 38 years. The estimates in the autocratization equation also imply that the probability
of democratization is high in the first year after a change, but the effects are much smaller and
26
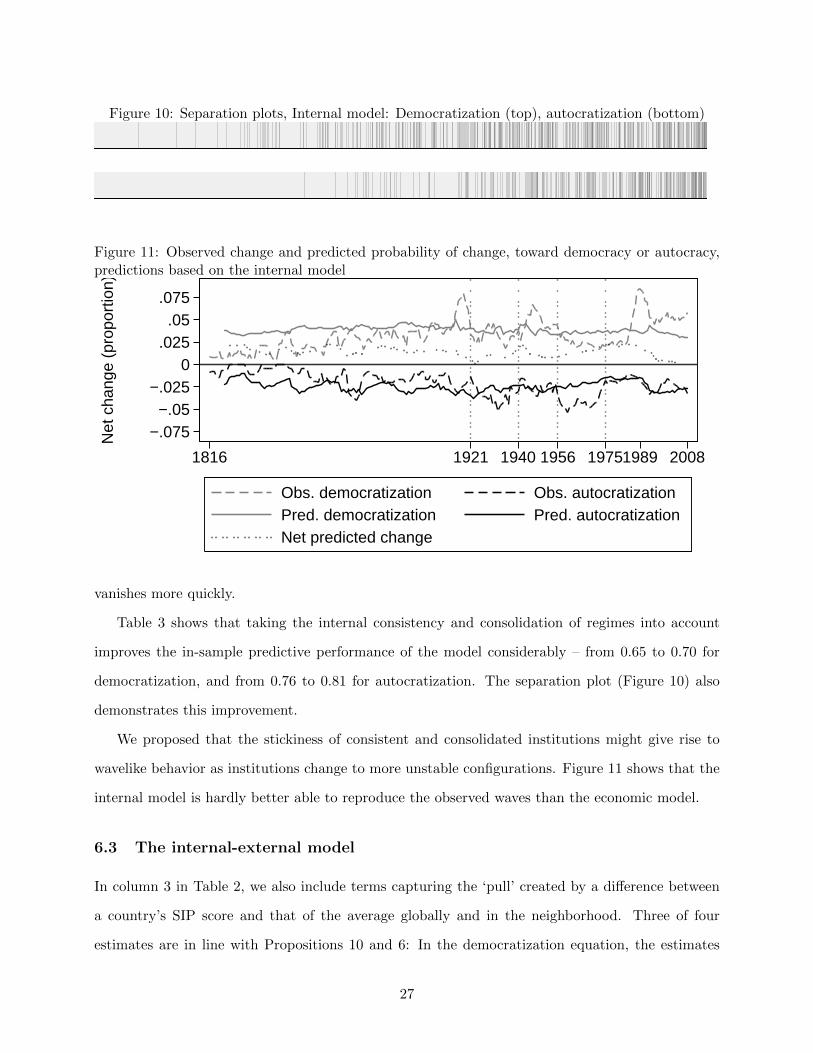
Figure 10: Separation plots, Internal model: Democratization (top), autocratization (bottom)
Figure 11: Observed change and predicted probability of change, toward democracy or autocracy,predictions based on the internal model
−.075−.05
−.0250
.025.05
.075
Net
cha
nge
(pro
port
ion)
1816 1921 1940 1956 19751989 2008
Obs. democratization Obs. autocratizationPred. democratization Pred. autocratizationNet predicted change
vanishes more quickly.
Table 3 shows that taking the internal consistency and consolidation of regimes into account
improves the in-sample predictive performance of the model considerably – from 0.65 to 0.70 for
democratization, and from 0.76 to 0.81 for autocratization. The separation plot (Figure 10) also
demonstrates this improvement.
We proposed that the stickiness of consistent and consolidated institutions might give rise to
wavelike behavior as institutions change to more unstable configurations. Figure 11 shows that the
internal model is hardly better able to reproduce the observed waves than the economic model.
6.3 The internal-external model
In column 3 in Table 2, we also include terms capturing the ‘pull’ created by a difference between
a country’s SIP score and that of the average globally and in the neighborhood. Three of four
estimates are in line with Propositions 10 and 6: In the democratization equation, the estimates
27
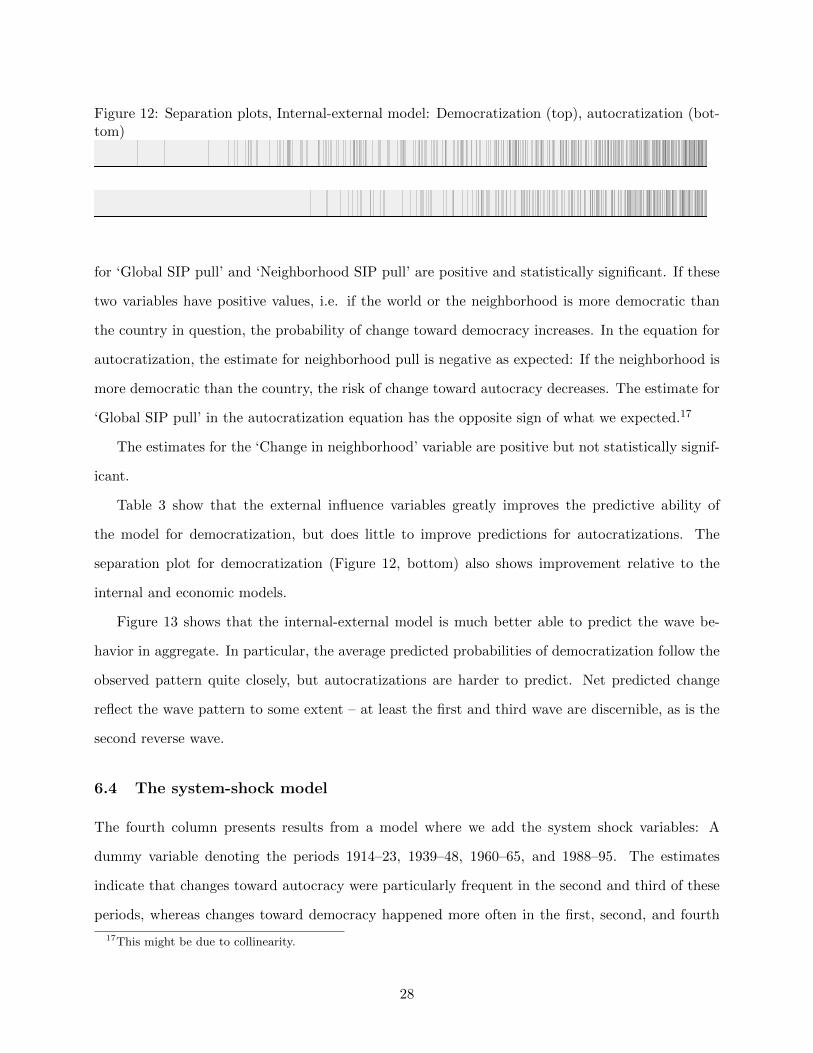
Figure 12: Separation plots, Internal-external model: Democratization (top), autocratization (bot-tom)
for ‘Global SIP pull’ and ‘Neighborhood SIP pull’ are positive and statistically significant. If these
two variables have positive values, i.e. if the world or the neighborhood is more democratic than
the country in question, the probability of change toward democracy increases. In the equation for
autocratization, the estimate for neighborhood pull is negative as expected: If the neighborhood is
more democratic than the country, the risk of change toward autocracy decreases. The estimate for
‘Global SIP pull’ in the autocratization equation has the opposite sign of what we expected.17
The estimates for the ‘Change in neighborhood’ variable are positive but not statistically signif-
icant.
Table 3 show that the external influence variables greatly improves the predictive ability of
the model for democratization, but does little to improve predictions for autocratizations. The
separation plot for democratization (Figure 12, bottom) also shows improvement relative to the
internal and economic models.
Figure 13 shows that the internal-external model is much better able to predict the wave be-
havior in aggregate. In particular, the average predicted probabilities of democratization follow the
observed pattern quite closely, but autocratizations are harder to predict. Net predicted change
reflect the wave pattern to some extent – at least the first and third wave are discernible, as is the
second reverse wave.
6.4 The system-shock model
The fourth column presents results from a model where we add the system shock variables: A
dummy variable denoting the periods 1914–23, 1939–48, 1960–65, and 1988–95. The estimates
indicate that changes toward autocracy were particularly frequent in the second and third of these
periods, whereas changes toward democracy happened more often in the first, second, and fourth
17This might be due to collinearity.
28
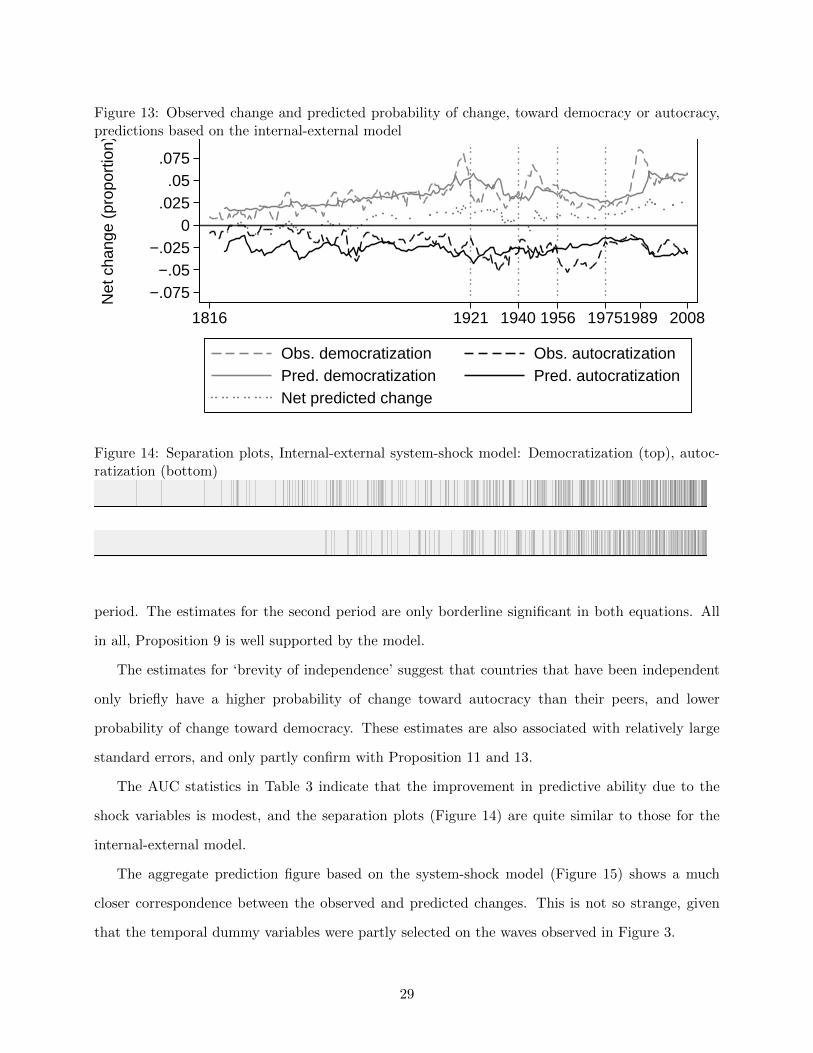
Figure 13: Observed change and predicted probability of change, toward democracy or autocracy,predictions based on the internal-external model
−.075−.05
−.0250
.025.05
.075
Net
cha
nge
(pro
port
ion)
1816 1921 1940 1956 19751989 2008
Obs. democratization Obs. autocratizationPred. democratization Pred. autocratizationNet predicted change
Figure 14: Separation plots, Internal-external system-shock model: Democratization (top), autoc-ratization (bottom)
period. The estimates for the second period are only borderline significant in both equations. All
in all, Proposition 9 is well supported by the model.
The estimates for ‘brevity of independence’ suggest that countries that have been independent
only briefly have a higher probability of change toward autocracy than their peers, and lower
probability of change toward democracy. These estimates are also associated with relatively large
standard errors, and only partly confirm with Proposition 11 and 13.
The AUC statistics in Table 3 indicate that the improvement in predictive ability due to the
shock variables is modest, and the separation plots (Figure 14) are quite similar to those for the
internal-external model.
The aggregate prediction figure based on the system-shock model (Figure 15) shows a much
closer correspondence between the observed and predicted changes. This is not so strange, given
that the temporal dummy variables were partly selected on the waves observed in Figure 3.
29
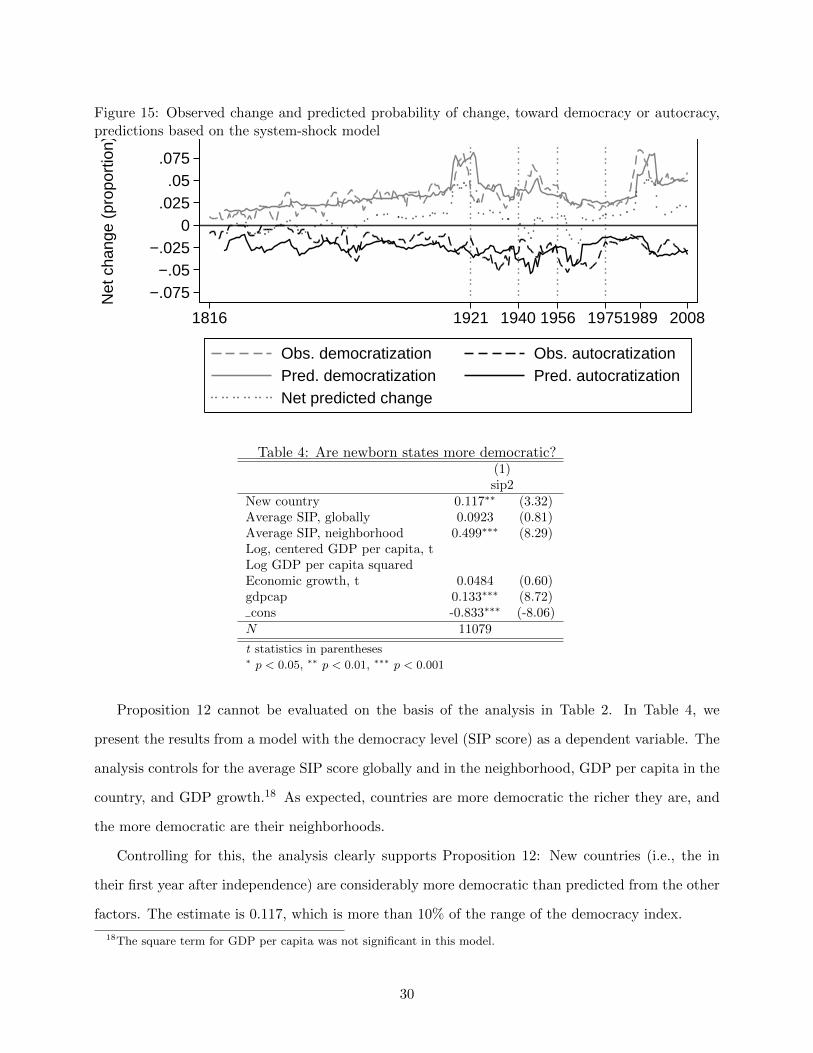
Figure 15: Observed change and predicted probability of change, toward democracy or autocracy,predictions based on the system-shock model
−.075−.05
−.0250
.025.05
.075
Net
cha
nge
(pro
port
ion)
1816 1921 1940 1956 19751989 2008
Obs. democratization Obs. autocratizationPred. democratization Pred. autocratizationNet predicted change
Table 4: Are newborn states more democratic?(1)sip2
New country 0.117∗∗ (3.32)Average SIP, globally 0.0923 (0.81)Average SIP, neighborhood 0.499∗∗∗ (8.29)Log, centered GDP per capita, tLog GDP per capita squaredEconomic growth, t 0.0484 (0.60)gdpcap 0.133∗∗∗ (8.72)cons -0.833∗∗∗ (-8.06)N 11079
t statistics in parentheses∗ p < 0.05, ∗∗ p < 0.01, ∗∗∗ p < 0.001
Proposition 12 cannot be evaluated on the basis of the analysis in Table 2. In Table 4, we
present the results from a model with the democracy level (SIP score) as a dependent variable. The
analysis controls for the average SIP score globally and in the neighborhood, GDP per capita in the
country, and GDP growth.18 As expected, countries are more democratic the richer they are, and
the more democratic are their neighborhoods.
Controlling for this, the analysis clearly supports Proposition 12: New countries (i.e., the in
their first year after independence) are considerably more democratic than predicted from the other
factors. The estimate is 0.117, which is more than 10% of the range of the democracy index.
18The square term for GDP per capita was not significant in this model.
30

Figure 16: Probability of Autocratization and Democratization in 1950, 1965, 1989, and 2008
United States
Canada
Cuba
Mexico
Guatemala
HondurasNicaragua
Costa Rica
Panama
ColombiaVenezuela
Ecuador
Peru
Brazil
Bolivia
Paraguay
Chile
ArgentinaUruguay
United KingdomIrelandNetherlandsBelgiumFrance
Switzerland
Spain
Portugal
Poland
Austria
Hungary
Czechoslovakia
Italy/Sardinia
Albania Yugoslavia/Serbia
Greece
Bulgaria
Rumania
FinlandSwedenNorwayDenmark
Iran (Persia) Turkey
China
Korea, Rep. of
India
Burma
Sri Lanka
Nepal
Thailand
Philippines
Australia0.0
5.1
.15
.2P
roba
bilit
y of
dem
ocra
tizat
ion
0 .05 .1 .15 .2Probability of autocratization
1950
United StatesCanada
CubaHaiti
JamaicaTrinidad
Mexico
GuatemalaHonduras
El Salvador
Nicaragua
Costa Rica
Panama
Colombia
Venezuela
Ecuador
Peru
BoliviaParaguay
ChileArgentinaUruguay
United KingdomIrelandNetherlandsBelgiumLuxemburg
France
Switzerland
Spain Portugal
German Fed. Rep.
German Dem. Rep.Poland
Austria
HungaryCzechoslovakia
Italy/Sardinia
AlbaniaYugoslavia/Serbia
Greece
Bulgaria
RumaniaRussia (USSR)
FinlandSwedenNorwayDenmark
MaliSenegal
Mauritania
Niger
Ivory CoastGuinea Burkina Faso
Liberia
Sierra Leone
GhanaTogo
Cameroun
Nigeria
Gabon
Central Afr. Rep.Chad Congo
Uganda
KenyaTanzania
Rwanda
Somalia
Ethiopia
MoroccoAlgeriaTunisia
Libya
Iran (Persia)
Turkey
Iraq
Egypt/UAR
Syria
Lebanon
Jordan
Israel
Saudi ArabiaYemen Arab Rep.
KuwaitOman
Afghanistan
China Mongolia
Taiwan Korea, D.P.Rep.
Korea, Rep. of
Japan IndiaBhutan
PakistanBurma
Sri Lanka
Nepal
Thailand
KampucheaVietnam, Dem. Rep.
Malaysia
Philippines
Indonesia
Australia0.0
5.1
.15
.2P
roba
bilit
y of
dem
ocra
tizat
ion
0 .05 .1 .15 .2Probability of autocratization
1965
United StatesCanada
Cuba
Haiti
Jamaica
Trinidad
Mexico
Guatemala
Honduras
El Salvador
Nicaragua
Costa Rica
Panama
ColombiaVenezuela
Guyana
Ecuador
PeruBrazil
Bolivia
Paraguay
Chile
Argentina
Uruguay
United KingdomIrelandNetherlandsBelgiumLuxemburg
France
Switzerland
Spain
Portugal
German Fed. Rep.
Poland
Austria
Czechoslovakia
Italy/Sardinia
Albania
Yugoslavia/Serbia
GreeceCyprus
Bulgaria
Russia (USSR)
FinlandSwedenNorwayDenmark
Guinea−BissauEq. Guinea
Gambia
Mali
Senegal
Benin/Dahomey
MauritaniaNigerIvory Coast
GuineaBurkina Faso
LiberiaSierra Leone
GhanaTogo
Cameroun
Nigeria
GabonCentral Afr. Rep.
Chad
Congo
ZaireUganda
Kenya
TanzaniaBurundiRwandaSomalia
Djibouti
EthiopiaAngola
MozambiqueZambia
Zimbabwe
MalawiSouth Africa
Lesotho
Botswana
Swaziland
MoroccoAlgeria
Tunisia
Libya
Sudan
Iran (Persia)
Turkey
Iraq
Egypt/UAR
Syria
Jordan
Israel
Saudi Arabia
Yemen Arab Rep.
Yemen Peoples Rep.
KuwaitBahrein
Qatar
United Arab Emirates
Oman
ChinaMongolia
TaiwanKorea, D.P.Rep.
Korea, Rep. of
JapanIndia
Bhutan
Pakistan
BangladeshBurma
Sri Lanka
Nepal
Thailand
LaosVietnam, Dem. Rep.Malaysia
Singapore
Philippines
Indonesia
AustraliaPapua New Guniea
Solomon Islands
Fiji
0.0
5.1
.15
.2P
roba
bilit
y of
dem
ocra
tizat
ion
0 .05 .1 .15 .2Probability of autocratization
1989
United States
Canada
Haiti
Dominican Republic
Trinidad
Mexico
GuatemalaHondurasEl Salvador
NicaraguaCosta Rica
PanamaColombia
VenezuelaGuyana
Ecuador
Peru
BrazilBoliviaParaguay
Chile
Argentina
UruguayUnited KingdomIrelandNetherlandsBelgiumLuxemburg
France
Switzerland
Spain
Portugal
German Fed. Rep.
Poland
AustriaHungaryCzech Republic
Slovakia
Italy/SardiniaAlbaniaMacedoniaCroatiaSloveniaGreeceBulgariaMoldova
Rumania
Russia (USSR)
EstoniaLatvia
Lithuania
Ukraine
Belarus
ArmeniaGeorgia
Azerbaijan
FinlandSwedenNorwayDenmark
Guinea−Bissau
Eq. Guinea
Gambia
Mali
SenegalBenin/Dahomey
Mauritania
Niger
GuineaBurkina Faso
Liberia
Sierra LeoneGhana
Togo Cameroun
Nigeria
Gabon
Central Afr. Rep.
Chad
Congo
Zaire
Uganda
Kenya
Tanzania
Burundi
Rwanda
Djibouti
Ethiopia
Eritrea
Angola
Mozambique
Zambia
Zimbabwe
Malawi
South Africa
Namibia
LesothoBotswana
Swaziland
Morocco
AlgeriaTunisia
Libya
Sudan Iran (Persia)
Turkey
Egypt/UAR
Syria
Lebanon
Jordan
Israel
Saudi Arabia
Kuwait
Bahrein
Qatar
United Arab EmiratesOman
TurkmenistanTajikistan
Kyrgyszstan
UzbekistanKazakhstanChina
Mongolia
Korea, D.P.Rep.
Korea, Rep. of
India
Bhutan
Pakistan
Bangladesh
Burma
Sri Lanka
Nepal
Thailand
Kampuchea
Laos
Vietnam, Dem. Rep.Malaysia
Singapore
IndonesiaPapua New Guniea0.0
5.1
.15
.2P
roba
bilit
y of
dem
ocra
tizat
ion
0 .05 .1 .15 .2Probability of autocratization
2008
6.5 Individual predictions
Figure 16 shows the predicted probabilities of changes toward autocracy (x axis) and democracy (y
axis) for the years 1950, 1965, 1989, and 2008 based on the system-shock model.
The 1950 plot, located in the middle of the second wave of democratization, shows a high
probability of democratization for many countries, but also a considerable risk of autocratization.
The plot for 1965, some years into the following reverse wave shows a different picture – most
countries have low predicted probabilities of democratization but are at risk of autocratization. The
plot for 1989 shows very high chance of democratization for many countries, in particular in South
and Central America, and low risks of change in the reverse direction. In 2008, several countries
are predicted to democratize, but many also to reverse previous democratizations. Notably, Syria
and Pakistan have high probabilities of democratization, reflecting their middle-income status and
large democratic neighbors.
31
7 Conclusion
While taking issue with the methodology employed by Samuel Huntington in his seminal work,
The Third Wave, our analysis strongly supports his thesis of the existence of waves and counter-
waves in democratization during the past two centuries. In providing this support for Huntington,
we simultaneously raise some important reservations regarding both the methodology used and
conclusions drawn by two of the most prominent critics of Huntington’s wave thesis (Doorenspleet,
2000a, Przeworski et al., 2000).
We are also able to say something about why waves occur. We identify three major sources of
democratic waves, all of them partly fuelled by the slow impact of economic development: First, as
shown in Gleditsch and Ward (2006), the neighborhood of a country and the global context exerts
a forcefull pull on the setup of its political system, resulting in a clustering of changes in similar
directions. Moreover, the internal consistency of institutions initially prevents change, but opens
up for series of changes as soon as this consistency is broken. Finally, newly formed states tend to
be more democratic than otherwise similar states. Systemic shocks such as the two World Wars,
decolonialization in the 1960s, and the fall of the Soviet Union both opened up for change in existing
countries and led to the emergence of new countries. Such clustered formation of states gives rise
to clustered changes to global democracy. We also find that new democracies have tended to be
partly nonsustainable, so that clustered state formation creates subsequent reverse waves.
32
References
Acemoglu, Daron and James A. Robinson. 2000. “Why Did the West Extend the Franchise? Democracy,Inequality, and Growth in Historical Perspective.” Quarterly Journal of Economics 115(4):1167–1199.
Boix, Carles. 2003. Democracy and Redistribution. Cambridge: Cambridge University Press.
Bueno de Mesquita, Bruce, Alistair Smith, Randolph M. Siverson and James D. Morrow. 2003. The Logic ofPolitical Survival. Cambridge, Massachusetts: MIT Press.
Bueno de Mesquita, Bruce, Randolph M. Siverson and Gary Woller. 1992. “War and the Fate of Regimes: AComparative Analysis.” American Political Science Review 86(3):638–646.
Cederman, Lars-Erik. 2001. “Back to Kant: Reinterpreting the Democratic Peace as a MacrohistoricalLearning Process.” American Political Science Review 93(4):791–808.
Crescenzi, Mark J. C. and Andrew J. Enterline. 1999. “Ripples from the Waves? A Systemic, Time-SeriesAnalysis of Democracy, Democratization, and Interstate War.” Journal of Peace Research 36(1):75–94.
Dahl, Robert A. 1971. Polyarchy: Political Participation and Opposition. New Haven: Yale University Press.
Diamond, Larry. 2001. “Is Pakistan the (Reverse) Wave of the Future?” Journal of Democracy 12(3):91–106.
Doorenspleet, Renske. 2000a. Development and Democracy: Power and Problems of Empirical Research. InEuropean Consortium on Political Research Joint Sessions of Workshops. Copenhagen: .
Doorenspleet, Renske. 2000b. “Reassessing the Three Waves of Democratization.” World Politics 52(3):384–406.
Eckstein, Harry. 1969. “Authority Relations and Government Performance: A Theoretical Framework.”Comparative Political Studies 2(2):305–322.
Eckstein, Harry. 1973. “Authority Patterns: A Structural Pattern for Inquiry.” American Political ScienceReview 67(4):1142–1161.
Gasiorowski, Mark J. 1995. “Economic Crisis and Political Regime Change: An Event History Analysis.”American Political Science Review 89(4):882–897.
Gates, Scott, Havard Hegre, Mark P. Jones and Havard Strand. 2006. “Institutional Inconsistency andPolitical Instability: Polity Duration, 1800–2000.” American Journal of Political Science 50(4):893–908.
Gates, Scott, Torbjørn L. Knutsen and Jonathan W. Moses. 1996. “Democracy and Peace: A More SkepticalView.” Journal of Peace Research 33(1):1–10.
Gleditsch, Kristian S. and Michael D. Ward. 2000. “War and Peace in Space and Time: The Role ofDemocratization.” International Studies Quarterly 44(1):1–29.
Gleditsch, Kristian Skrede. 2002. All International Politics is Local: The Diffusion of Conflict, Integration,and Democratization. Ann Arbor, MI: University of Michigan Press.
Gleditsch, Kristian Skrede and Michael D. Ward. 2006. “Diffusion and the International Context of Democ-ratization.” International Organization 60(4):911–933.
Gleditsch, Nils Petter and Havard Hegre. 1997. “Peace and Democracy: Three Levels of Analysis.” Journalof Conflict Resolution 41(2):283–310.
Greenhill, Brian, Michael D. Ward and Audrey Sacks. 2011. “The Separation Plot: A New Visual Methodfor Evaluating the Fit of Binary Models.” American Journal of Political Science 55(4):990–1002.
33
Gurr, Ted Robert. 1974. “Persistence and Change in Political Systems, 1800–1971.” American PoliticalScience Review 68(4):1482–1504.
Hosmer, David W and Stanley Lemeshow. 2000. Applied Logistic Regression. Second Edititon. New York,NY: Wiley.
Huntington, Samuel P. 1991. The Third Wave: Democratization in the Late Twentieth Century. Norman,OK and London: University of Oklahoma Press.
Jaggers, Keith and Ted R. Gurr. 1995. “Transitions to Democracy: Tracking Democracy’s Third Wave withthe Polity III Data.” Journal of Peace Research 32(4):469 – 482.
Kadera, Kelly M., Mark J. C. Crescenzi and Megan L. Shannon. 2003. “Democratic Survival, Peace, andWar in the International System.” American Journal of Political Science 47(2):234–47.
Kuran, Timur. 1989. “Sparks and Prairie Fires: A Theory of Unanticipated Political Revolution.” PublicChoice 61(1):41–74.
Lake, David A. 1992. “Powerful Pacifists: Democratic States and War.” American Political Science Review86(1):24–37.
Lipset, Seymour Martin. 1959. “Some Social Requisites of Democracy: Economic Development and PoliticalLegitimacy.” American Political Science Review 53(1):69–105.
Mitchell, Sara McLaughlin, Scott Gates and Havard Hegre. 1999. “Evolution in Democracy-War Dynamics.”Journal of Conflict Resolution 43(6):771–792.
Olson, Mancur. 1993. “Democracy, Dictatorship and Development.” American Political Science Review87(3):567–576.
Przeworski, Adam, Michael E. Alvarez, Jose Antonio Cheibub and Fernando Limongi. 2000. Democracyand Development. Political Institutions and Well-Being in the World, 1950–1990. Cambridge: CambridgeUniversity Press.
Reiter, Dan and Allan C. Stam III. 1998. “Democracy, War Initiation, and Victory.” American PoliticalScience Review 92(2):377–389.
Stam, A. 1996. Win, Lose, or Draw: Domestic Politics and the Crucible of War. Ann Arbor, MI: Universityof Michigan Press.
Stinnett, Douglas M., Jaroslav Tir, Philip Schafer, Paul F. Diehl and Charles S. Gochman. 2002. “TheCorrrelates of War (COW) Project Direct Contiguity Data, Version 3.0.” Conflict Management and PeaceScience 19(2):59–67. file://R:project
Thompson, William R. 1996. “Democracy and Peace: Putting the Cart before the Horse?” InternationalOrganization 50(1):141–174.
Vanhanen, Tatu. 1997. Prospects of Democracy: A Study of 172 Countries. London: Routledge.
Vanhanen, Tatu. 2000. “A New Dataset for Measuring Democracy, 1810-1998.” Journal of Peace Research37(2):251–265.
Werner, Suzanne. 1996. “Absolute and Limited War: The Possibility of Foreign-Imposed Regime Change.”International Interactions 22(1):67–88.
34
Related Documents


![INGLES- RICARDO DAVID Vol. 7 Letters 1816-1818 [1816].pdf](https://static.cupdf.com/doc/110x72/577cdadc1a28ab9e78a6bae4/ingles-ricardo-david-vol-7-letters-1816-1818-1816pdf.jpg)