University of Groningen Optimizing clinical risk stratification in acute heart failure Demissei, Biniyam Gemechu IMPORTANT NOTE: You are advised to consult the publisher's version (publisher's PDF) if you wish to cite from it. Please check the document version below. Document Version Publisher's PDF, also known as Version of record Publication date: 2017 Link to publication in University of Groningen/UMCG research database Citation for published version (APA): Demissei, B. G. (2017). Optimizing clinical risk stratification in acute heart failure. University of Groningen. Copyright Other than for strictly personal use, it is not permitted to download or to forward/distribute the text or part of it without the consent of the author(s) and/or copyright holder(s), unless the work is under an open content license (like Creative Commons). The publication may also be distributed here under the terms of Article 25fa of the Dutch Copyright Act, indicated by the “Taverne” license. More information can be found on the University of Groningen website: https://www.rug.nl/library/open-access/self-archiving-pure/taverne- amendment. Take-down policy If you believe that this document breaches copyright please contact us providing details, and we will remove access to the work immediately and investigate your claim. Downloaded from the University of Groningen/UMCG research database (Pure): http://www.rug.nl/research/portal. For technical reasons the number of authors shown on this cover page is limited to 10 maximum. Download date: 24-07-2022

Welcome message from author
This document is posted to help you gain knowledge. Please leave a comment to let me know what you think about it! Share it to your friends and learn new things together.
Transcript
University of Groningen
Optimizing clinical risk stratification in acute heart failureDemissei, Biniyam Gemechu
IMPORTANT NOTE: You are advised to consult the publisher's version (publisher's PDF) if you wish to cite fromit. Please check the document version below.
Document VersionPublisher's PDF, also known as Version of record
Publication date:2017
Link to publication in University of Groningen/UMCG research database
Citation for published version (APA):Demissei, B. G. (2017). Optimizing clinical risk stratification in acute heart failure. University of Groningen.
CopyrightOther than for strictly personal use, it is not permitted to download or to forward/distribute the text or part of it without the consent of theauthor(s) and/or copyright holder(s), unless the work is under an open content license (like Creative Commons).
The publication may also be distributed here under the terms of Article 25fa of the Dutch Copyright Act, indicated by the “Taverne” license.More information can be found on the University of Groningen website: https://www.rug.nl/library/open-access/self-archiving-pure/taverne-amendment.
Take-down policyIf you believe that this document breaches copyright please contact us providing details, and we will remove access to the work immediatelyand investigate your claim.
Downloaded from the University of Groningen/UMCG research database (Pure): http://www.rug.nl/research/portal. For technical reasons thenumber of authors shown on this cover page is limited to 10 maximum.
Download date: 24-07-2022
Biniyam Gemechu Demissei
Optimizing clinical risk stratification in acute heart failure
Biniyam Gemechu DemisseiOptimizing clinical risk stratification in acute heart failure
Financial support for the publication of this thesis by the following companies/institutes is gratefully acknowledged.Sphingotec GmbHSingulexGraduate school of medical sciencesUniversity of Groningen
ISBN: 978-90-367-9370-4ISBN: 978-90-367-9369-8 (electronic version)
Copyright © 2017, B.G. DemisseiAll rights reserved. No part of this publication may be reproduced, stored in a retrieval system, or transmitted in any form or by any means, without the permission of the author.Cover design, layout and printing: Optima Grafische Communicatie, Rotterdam, The Netherlands
Optimizing clinical risk stratification in acute heart failure
PhD thesis
to obtain the degree of PhD at the University of Groningen on the authority of the
Rector Magnificus Prof. E. Sterken and in accordance with
the decision by the College of Deans. This thesis will be defended in public on Monday 9 January 2017 at 16.15 hours
by
Biniyam Gemechu Demissei
born on 11 March 1987
in Huruta, Ethiopia

PromotoresProf. dr. H.L. Hillege Prof. dr. A.A. Voors
CopromotorDr. D. Postmus
Assessment CommitteeProf. dr. P.A. de Graeff Prof. dr. H. Boersma Prof. dr. P. van der Harst

ParanymphsJulisca CesarJasper Tromp
Financial support by the Dutch Heart Foundation for the publication of this thesis is gratefully acknowledged.
Table of contents
Introduction 11
Part I: Competing risks in acute heart failure research 19
Chapter 1: Estimating cumulative incidences in the presence of right-censoring and competing risks: an introduction with illustrations from the COACH studyEuroIntervention 2016;11:e1322-4.
21
Chapter 2: Should non-cardiovascular mortality be considered in the SCORE model? Findings from the Prevention of Renal and Vascular End-stage Disease (PREVEND) cohortEuropean journal of epidemiology 2015;30:47-56.
31
Part II: Biomarker-based risk stratification in acute heart failure
57
Chapter 3: Optimizing clinical use of biomarkers in high risk acute heart failure patientsEuropean journal of heart failure 2016;18:269-280.
59
Chapter 4: A multimarker multi-time-point based risk stratification strategy in acute heart failure Accepted European journal of heart failure
119
Chapter 5: Procalcitonin-based indication of bacterial infection identifies high risk acute heart failure patientsInternational journal of cardiology 2016;204:164-171.
149
Chapter 6: Plasma biomarkers to predict or rule -out early post-discharge events in patients discharged after an acute heart failure hospital admissionAccepted European journal of heart failure
179
Part III: Risk-based evaluation of phase III clinical trials in acute heart failure
215
Chapter 7: Risk-based evaluation of efficacy of rolofylline in patients hospitalized with acute heart failure – post-hoc analysis of the PROTECT trial
217
International journal of cardiology 2016;223:967-975
General discussion and future perspectives 247
Appendices 287
Dutch summary/Nederlandse samenvatting 267
Acknowledgment 289
Bibliography 297
Curriculum vitae 295


Introduction

13
Introduction
Heart failure is a clinical syndrome characterized by a constellation of symptoms and signs caused by cardiac dysfunction. It is one of the ma-jor causes of morbidity and mortality in the developed countries, with a prevalence of 1-2%. Acute heart failure (AHF) is defined as a rapid onset of signs and symptoms of heart failure resulting in the need for urgent therapy which can occur as worsening of chronic heart failure or a pre-sentation of a new heart failure. AHF is the leading cause of hospitaliza-tion in adults older than 65 years of age. Despite marked improvements in the prognosis of chronic heart failure patients primarily related to therapeutic advances over the past few decades, both short- and long-term outcomes remain very poor once patients are hospitalized for decompensated heart failure. Nearly 25% of patients hospitalized for AHF need readmission within 30 days of hospital discharge while <50% survive beyond 5 years after hospitalization. In addition to significantly reducing survival and quality of life of affected patients, the monetary burden of AHF on health care systems is enormous. The total cost of heart failure care was estimated to be $31 billion in the US alone in 2012 and majority of this cost is associated with inhospital care. This cost is projected to increase to an unprecedented $70 billion in 2030 due to ageing of populations.
There is a huge unmet medical need for therapeutic strategies that can improve survival and curb the high rates of hospital readmissions as-sociated with hospitalization for AHF. Numerous strategies had been proposed and tested in randomized controlled trials with the goal of reducing the unacceptably high rates of readmission and mortality in AHF patients. However, development of such strategies remains highly elusive despite the massive effort to do so. A plethora of factors has been identified as contributing for the futility of these efforts among which the heterogeneous nature of the patient population in terms of etiology, pathophysiology and clinical needs is the most frequently cited. The ‘one-size-fits-all’ approach currently implemented both in the manage-ment of AHF and development of new therapeutic strategies fails to address this heterogeneity in the underlying patient population.
14
Introduction
The necessity for the implementation of more targeted, need-based treatment strategies to curb the enormous burden of AHF on patients and health care systems is well recognized at this stage. There is already a decades old experience in preventive cardiology supporting the ef-fectiveness of risk-based treatment strategies in terms of reducing both the humanitarian and monetary burdens of cardiovascular events in the general population. Interestingly, a glimpse of evidence suggesting that such strategies might also be promising in the management of AHF patients is available. Successful development of risk-based treatment strategies and translation into clinical practise require accurate and objective risk stratification tools. Nonetheless, risk stratification in AHF patients remains a clinical challenge.
Biomarkers are among the most promising contemporary tools for en-hancing prognosis and risk stratification in patients hospitalized with AHF. Plenty of prognostic biomarkers reflecting diverse pathophysi-ologic pathways involved in heart failure have been identified over the past years. Clinical utility of these prognostic biomarkers is, however, highly limited. There are several methodologic drawbacks in many of the studies evaluating prognostic value of biomarkers. An important methodologic aspect that is often overlooked, not just in prognostic biomarker studies but also in heart failure research in general, is the presence of competing risks. Failure to deal with competing risks, particularly while evaluating non-mortality outcomes like rehospital-ization, might lead to significantly biased findings. In addition, most studies focus on a single time-point, single biomarker-based strategy; an approach that fails to address the multitude of pathophysiologic mechanisms and clinical processes involved in the setting of AHF. Lack of data on optimal timing of measurement of biomarkers (besides the natriuretic peptides) is an additional factor that could hamper the clini-cal utility of prognostic biomarkers. Moreover, there is a significant gap with respect to defining mechanisms by which individual prognostic data can be utilized to facilitate the development and implementation of interventions that can improve outcome in AHF patients.
15
Introduction
Overview of the thesis
Part I focuses on competing risks in the setting of prognostic heart failure research. The competing risks situation is an aspect of survival analysis which comes into play when the occurrence of one event precludes another event from occurring. This, for instance, can occur when one is interested in a readmission outcome after discharge for hospitaliza-tion for AHF. In this case, mortality acts as a competing event since the occurrence of death, by definition, precludes subsequent readmissions. Although the competing risks phenomenon is rampant in prognostic heart failure research, it is hardly dealt with the proper statistical meth-odology. Unless dealt with the appropriate statistical techniques, the presence of competing risks could lead to biased estimates of risk. In addition, it might also lead to inflation of estimates of performance for a prognostic variable/model under consideration.
Chapter 1 illustrates estimation of cumulative incidence in the presence of competing events in the setting of AHF.
Chapter 2 evaluates the potential impact of ignoring competing events on cardiovascular risk prediction and stratification using a classic prognostic model utilized in preventive cardiology (i.e. the Systematic COronary Risk Evaluation (SCORE) model)
Part II addresses biomarker-based risk stratification in AHF patients. There is an ever growing interest in biomarkers in AHF based on the premise that they can serve as simple, objective yet inexpensive prog-nostic tools. These attributes make biomarkers ideally suited to augment risk stratification in AHF which is currently a significant challenge for the clinicians treating these patients. Plenty of prognostic biomarkers have been defined in AHF, yet clinical utility remains very limited. Current strategies focus on single biomarkers, a strategy that is highly unlikely to be adequate in the light of the complex array of patho-physiologic pathways involved. Moreover, serial evaluation might be needed for most biomarkers considering the multitude of clinical and hemodynamic changes that occur in these patients during the inhos-
16
Introduction
pital treatment phase and post-discharge. However, evidence on the optimal timing of measurements and added value of serial evaluation of biomarkers is lacking at this stage except for the natriuretic peptides. Chapter 3 assesses the added prognostic value of a combination of biomarkers reflecting diverse pathophysiologic pathways and further evaluates the timing of biomarker measurements, during hospitaliza-tion or early post-discharge phase, that maximize prognostic perfor-mance. Chapter 4 investigates the incremental value of a multimarker panel of serially evaluated biomarkers over a single time-point-based single marker strategy.
Assessment of added value on top of readily available patient-related parameters is an essential first step towards ascertaining the potential role of an individual biomarker or a multimarker panel for prognos-tication and risk stratification of AHF patients. Translation of this potential to clinical utility demands further evaluation of the role of biomarkers in terms of solving the day-to-day risk stratification related clinical challenges doctors involved in the management of AHF face. One of these clinical challenges is diagnosis of bacterial infections. Bacterial infections are among the major precipitating factors for AHF hospitalizations and carry worse outcome unless treated timely and adequately. However, diagnosis of bacterial infections in AHF, par-ticularly respiratory infections, is difficult primarily due to overlapping clinical and radiologic features. Procalcitonin is gaining prominence as a highly specific marker of bacterial infections and could play an essential role in facilitating identification of potentially high risk AHF patients with otherwise underdiagnosed bacterial infections. Chapter 5 examines the prognostic implications of significantly elevated procal-citonin levels in patients hospitalized with AHF with no overt clinical signs of bacterial infection. Another risk stratification related clinical problem in AHF patients is predischarge risk ascertainment. The need for objective decision-making regarding length of hospital stay and intensity of post-discharge care could not be overstated. A strategy that combines early discharge of patients at low-risk for post-discharge events and more intensive and extended hospital stay with intensive post-discharge care in high risk patients can play a crucial role in terms
17
Introduction
of facilitating efficient utilization of scarce health care resources and, ultimately, leading to improved outcomes. Chapter 6 presents findings of a comparative analysis evaluating the value of biomarkers evaluated close to discharge for the identification of hospitalized AHF patients at low and high risk for post-hospital discharge events.
Part III introduces one mechanism by which risk stratification tools could be used to facilitate the development and implementation of new interventions that can improve outcome in AHF patients. The presence of significant differences among the AHF patient population in terms of etiology, pathophysiology and plenty of clinical factors prompts the consideration of the possibility that different subpopulations of patients might differentially respond to a specific pharmacologic or non-pharmacologic therapeutic intervention. This concept, commonly referred to as heterogeneity in treatment effect (HTE), is well recognized in clinical trials involving AHF patients. The conventional approach for the evaluation of HTE in these trials, however, fails to address the com-plex interactions among factors that can influence treatment response besides being prone to notable methodologic deficiencies. Risk predic-tion models could serve as methodologically robust alternatives that can facilitate the detection, interpretation and extrapolation of clini-cally relevant differences in treatment response among subpopulations. Chapter 7 presents findings of a post-hoc analysis of the PROTECT trial in which risk-based heterogeneity in the efficacy of rolofylline in patients hospitalized with AHF was evaluated.

PART ICompeting risks in
AHF research


Chapter 1: Estimating cumulative incidences in the presence of right-censoring and competing risks: an introduction with illustrations from the COACH study
Douwe Postmus, Biniyam G. Demissei, Hans L. Hillege
EuroIntervention 2016;11:e1322-4.

23
Estimating cumulative incidences in the presence of right-censoring and competing risks
1In cardiovascular studies, it is common to assess the association between the risk of experiencing an event, such as death or hospitalization, and one or more exposure variables, such as different treatment regimens when the study under consideration is an intervention study or prog-nostic markers in prognostic studies. A frequently applied measure of risk in such studies is the cumulative incidence, which is defined as the probability of experiencing an event of interest over some specified time period, such as one year. When all subjects remain under study until event occurrence, the cumulative incidence at a certain time point can readily be estimated by dividing the number of cases up to that time point by the number of subjects in the study population. Unfortunately, event times in clinical studies are often subjected to right-censoring, which occurs when events are only observed if they happen prior to a censoring time that may vary from individual to individual (1). In such situations, one can no longer estimate the cumulative incidence based on the sample proportions as we don’t know how many of the subjects whose event time got censored should be counted as cases and how many as non-cases. We do know that these subjects were still event-free at their time of censoring, and this is information that should be taken into account in the estimation of the cumulative incidence.
Right-censored observations can occur for several reasons (2). First, in most clinical studies, there are subjects who are still event-free at the end of the study, resulting in right-censored event times at the end of the follow-up period. Second, it can happen that subjects withdraw from the study before the occurrence of the event of interest, result-ing in censored observations at the time of study withdrawal. Finally, it may happen that another event has occurred which precludes the observation of the event of interest, resulting in censored event times at the time of occurrence of the competing event. This latter type of censoring, for example, occurs when one is interested in analyzing the association between a treatment or prognostic marker with a rehospi-talization outcome in AHF patients and some of the subjects die during follow-up. Here, it is evident that the occurrence of death precludes the occurrence of rehospitalization and, therefore, acts as a competing risk for the outcome of interest. Competing risks also occur when the pri-
24
Chapter 1
mary study endpoint is a composite endpoint that combines fatal and non-fatal events, such as the Major Adverse Cardiac Events (MACE) endpoint, and interest centers around analyzing the individual compo-nents of this combined endpoint. Here, it is clear that the fatal events preclude the non-fatal ones from occurring, meaning that we are again in the setting of competing risks when interest centers around the non-fatal events.
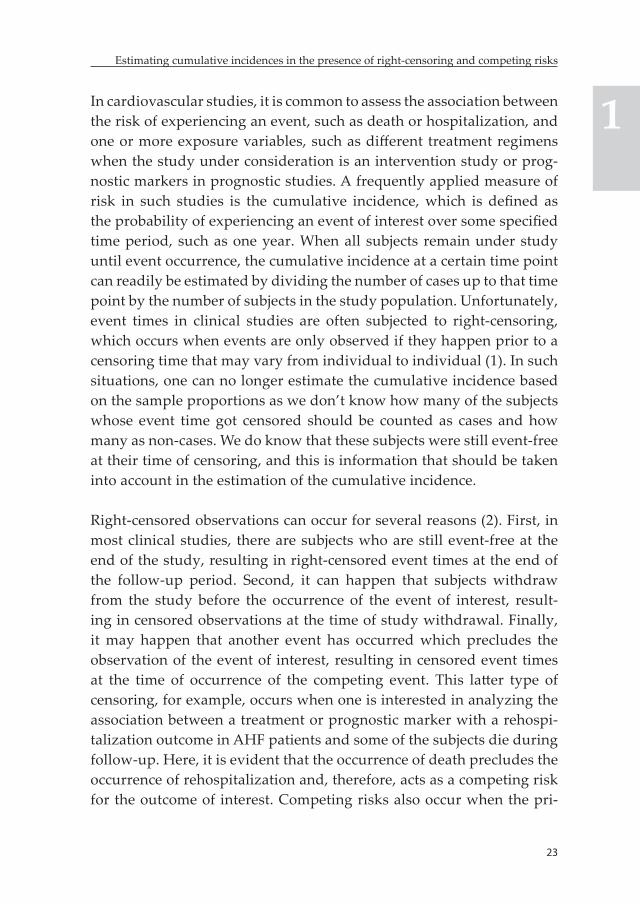
If censoring only occurs because of end of study or loss to follow-up, one can estimate the cumulative incidence of the event of interest at a certain time point by taking the complement (i.e., one minus) of the survival at the same time point, which can be estimated by applying “ordinary” survival analysis techniques, such as the Kaplan-Meier esti-mator. To illustrate how this works, the left panel of Figure 1 shows the Kaplan-Meier survival curve for the all-cause mortality endpoint from the Coordinating study evaluating Outcomes of Advising and Counsel-ing in Heart failure (COACH), a multicenter, randomized controlled trial in which 1023 patients who were discharged alive from hospital after having been admitted for reasons related to heart failure were followed for a maximum of 18 months (3). This curve was produced by taking the time the individual dies or is censored as the time variable and a dummy variable with the value 1 if the event is observed and 0 if the event is censored as the event indicator. The cumulative incidence curve that resulted from taking the complement of the Kaplan-Meier survival curve is shown in the right panel of Figure 1. From this curve, we can, for example, read that the one-year cumulative incidence of all-cause mortality in the COACH study was 0.203, with a 95% confidence interval of (0.178, 0.228).
25
Estimating cumulative incidences in the presence of right-censoring and competing risks
1
Figure 1: Survival curve (left panel) and cumulative incidence curve (right pan-el) of all-cause mortality in the COACH study. The dashed lines represent the 95% confidence intervals.
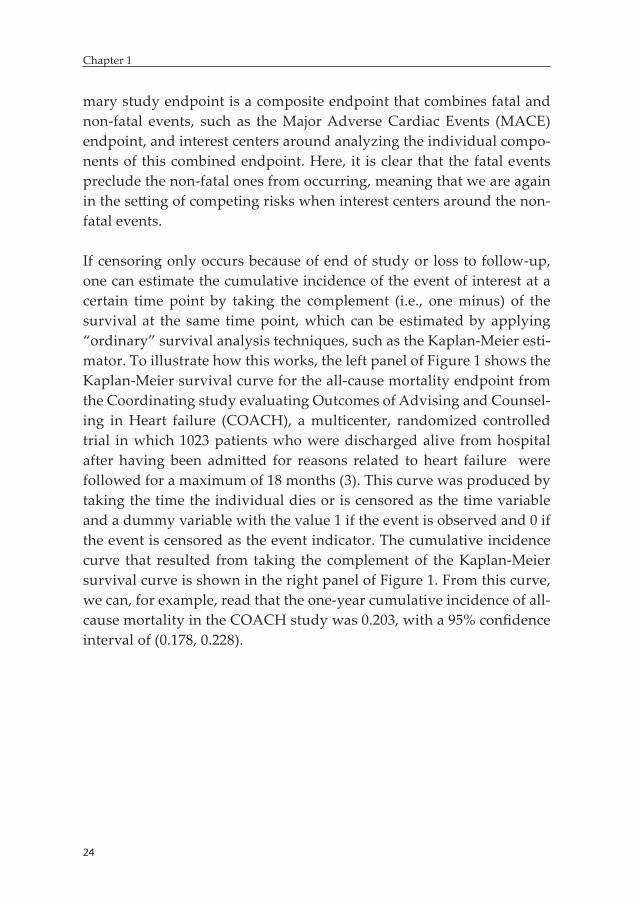
Now, consider the estimation of the cumulative incidence when there is censoring and subjects can fail from multiple event types. Techni-cally, it is still possible to obtain Kaplan-Meier survival curves for each event type by treating the occurrence of a competing event as a non-informative censored observation. However, these curves can no longer be interpreted as ordinary survival curves. Instead, they reflect the survival that would be observed in an ideal world where all com-peting causes of failure have been completely eliminated (2). In reality, subjects who experience a competing event can no longer fail from the event of interest, meaning that the survival for the event of interest will be higher, and, thus,the true cumulative incidence will be lower com-pared to what is estimated by the one-minus Kaplan-Meier estimator. This bias is illustrated in Figure 2 for the heart failure rehospitalization outcome of the COACH study, for which death occurring before hos-pitalization acts as a competing event. The dashed line represents the cumulative incidence curve that was obtained by using the one-minus Kaplan-Meier estimator, and the solid line represents the true cumu-lative incidence curve, which was obtained using the non-parametric approach described in Putter et al. (2). It follows from the figure that the true 18-month cumulative incidence of heart failurere hospitaliza-tion is 0.260, whereas the one-minus Kaplan-Meier estimator yields an
26
Chapter 1
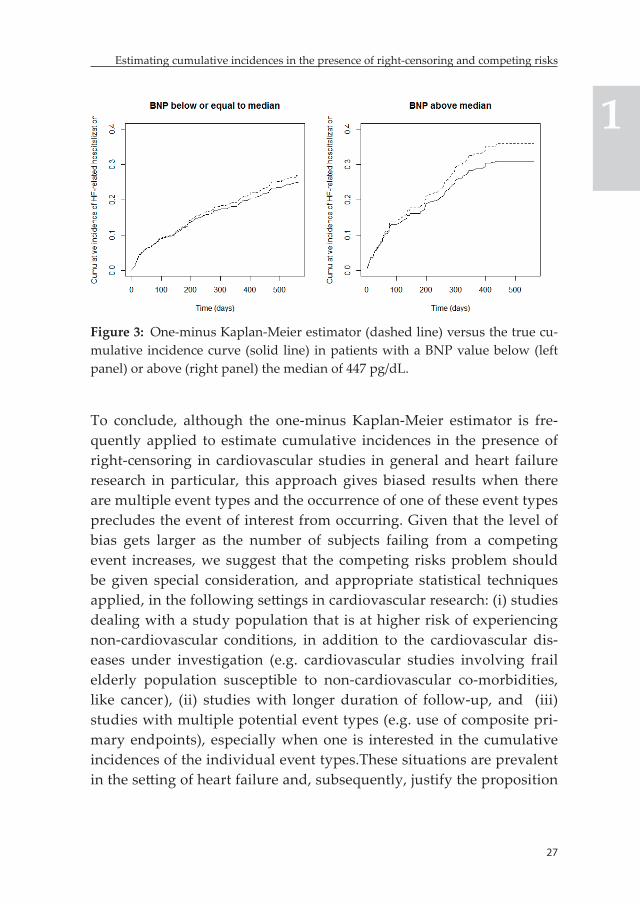
estimate of 0.284, resulting in a 2.4% overestimation of the risk of heart failure rehospitalization. The level of bias resulting from applying the one-minus Kaplan-Meier estimator depends both on the total event rate and the magnitude of the hazard of the competing event as compared to the hazard of the event of interest. This is demonstrated in Figure 3, where the true cumulative incidence curves and the ones obtained by using the one-minus Kaplan-Meier estimator are depicted separately for the subset of patients with a B-type natriuretic peptide (BNP) value below (left panel) or above (right panel) the median of 447 pg/dL. As it can be observed from the figure, the level of bias in the one-minus Kaplan-Meier estimator, represented by the difference between the two curves, is significantly greater in the high BNP group.
Figure 2: One-minus Kaplan-Meier estimator (dashed line) versus the true cu-mulative incidence curve (solid line) for the HF-related hospitalization outcome in the COACH study
27
Estimating cumulative incidences in the presence of right-censoring and competing risks
1
Figure 3: One-minus Kaplan-Meier estimator (dashed line) versus the true cu-mulative incidence curve (solid line) in patients with a BNP value below (left panel) or above (right panel) the median of 447 pg/dL.
To conclude, although the one-minus Kaplan-Meier estimator is fre-quently applied to estimate cumulative incidences in the presence of right-censoring in cardiovascular studies in general and heart failure research in particular, this approach gives biased results when there are multiple event types and the occurrence of one of these event types precludes the event of interest from occurring. Given that the level of bias gets larger as the number of subjects failing from a competing event increases, we suggest that the competing risks problem should be given special consideration, and appropriate statistical techniques applied, in the following settings in cardiovascular research: (i) studies dealing with a study population that is at higher risk of experiencing non-cardiovascular conditions, in addition to the cardiovascular dis-eases under investigation (e.g. cardiovascular studies involving frail elderly population susceptible to non-cardiovascular co-morbidities, like cancer), (ii) studies with longer duration of follow-up, and (iii) studies with multiple potential event types (e.g. use of composite pri-mary endpoints), especially when one is interested in the cumulative incidences of the individual event types.These situations are prevalent in the setting of heart failure and, subsequently, justify the proposition
28
Chapter 1
that the competing risks phenomenon should be given due consider-ation in heart failure research.
References 1. Klein JP, Moeschberger ML. Survival analysis: techniques for censored and
truncated data. Second edition. New York, NY, USA: Springer; 2003. 2. Putter H, Fiocco M, Geskus RB. Tutorial in biostatistics: competing risks
and multi-state models. Statistics in medicine. 2007;26:2389-2430. 3. Jaarsma T, van der Wal MH, Lesman-Leegte I, Luttik ML, Hogenhuis J,
Veeger NJ, Sanderman R, Hoes AW, van Gilst WH, Lok DJ, Dunselman PH, Tijssen JGP, Hillege HL, van Veldhuisen DJ. Effect of moderate or intensive disease management program on outcome in patients with heart failure: Coordinating Study Evaluating Outcomes of Advising and Counseling in Heart Failure (COACH). Archives of Internal Medicine. 2008;168:316-324.


Chapter 2: Should non-cardiovascular mortality be considered in the SCORE model? Findings from the Prevention of Renal and Vascular End-stage Disease (PREVEND) cohort
Biniyam G. Demissei, Douwe Postmus, Mattia A.E Valente, Pim van der Harst, Wiek H. van Gilst, Edwin R. Van den Heuvel, Hans L. Hillege
European journal of epidemiology 2015;30:47-56.
32
Chapter 2
Abstract
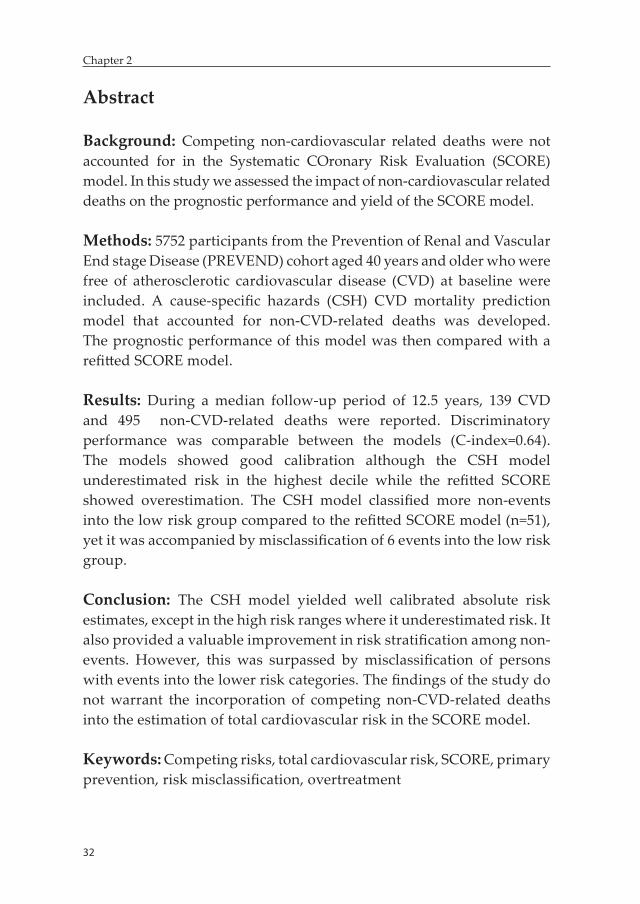
Background: Competing non-cardiovascular related deaths were not accounted for in the Systematic COronary Risk Evaluation (SCORE) model. In this study we assessed the impact of non-cardiovascular related deaths on the prognostic performance and yield of the SCORE model.
Methods: 5752 participants from the Prevention of Renal and Vascular End stage Disease (PREVEND) cohort aged 40 years and older who were free of atherosclerotic cardiovascular disease (CVD) at baseline were included. A cause-specific hazards (CSH) CVD mortality prediction model that accounted for non-CVD-related deaths was developed. The prognostic performance of this model was then compared with a refitted SCORE model.
Results: During a median follow-up period of 12.5 years, 139 CVD and 495 non-CVD-related deaths were reported. Discriminatory performance was comparable between the models (C-index=0.64). The models showed good calibration although the CSH model underestimated risk in the highest decile while the refitted SCORE showed overestimation. The CSH model classified more non-events into the low risk group compared to the refitted SCORE model (n=51), yet it was accompanied by misclassification of 6 events into the low risk group.
Conclusion: The CSH model yielded well calibrated absolute risk estimates, except in the high risk ranges where it underestimated risk. It also provided a valuable improvement in risk stratification among non-events. However, this was surpassed by misclassification of persons with events into the lower risk categories. The findings of the study do not warrant the incorporation of competing non-CVD-related deaths into the estimation of total cardiovascular risk in the SCORE model.
Keywords: Competing risks, total cardiovascular risk, SCORE, primary prevention, risk misclassification, overtreatment
33
Should non-cardiovascular mortality be considered in the SCORE model?
2
Introduction
European guideline on cardiovascular disease prevention in clinical practice recommends the utilization of total cardiovascular risk to guide the initiation of primary prevention interventions targeting ath-erosclerotic cardiovascular disease (CVD) in the general population [1]. This recommendation is primarily based on evidence suggesting that the higher the risk, the greater the benefit from interventions will be, thus justifying the need for the initiation of intensive risk factor man-agement at higher levels of predicted CVD-related mortality risk [1, 4-8]. In particular, if the predicted 10-year risk of CVD-related mortality exceeds 5%, individuals are classified as being at high cardiovascular risk and initiation of intensive risk factor management interventions is strongly recommended [1].The Systematic Coronary Risk Evaluation (SCORE) model is utilized in many European countries to facilitate total cardiovascular risk estimation in apparently healthy individuals in the general population. It estimates the 10-year absolute risk of CVD-related mortality using traditional cardiovascular risk factors [8].
Despite the fact that SCORE risk charts can be easily applied in daily clinical practice and are widely used, the approach utilized to derive absolute risk estimates is not without methodological limitations. One of these is the fact that occurrence of non-CVD-related deaths was not accounted for in the development of the current version of the SCORE model. Unless explicitly accounted for in the statistical analysis, the presence of non-CVD-related death as a competing risk can result in serious overestimation of absolute cardiovascular risk, which in turn may result in overestimation of the expected benefit of intensive risk factor management [9-11]. This can potentially result in overtreat-ment, particularly in older individuals who are more likely to be in the high-risk group while also having a high risk of death from non-CVD-related causes [11,14,21]. This will have significant implications from both medical (e.g. side effects of medications, pill burden) and health economic (e.g. cost of medications, increased burden on practitioners) perspectives.
34
Chapter 2
Although in theory it is clear that competing non-CVD-related deaths could lead to overestimation of total cardiovascular risk, the conse-quences of this overestimation on the prognostic performance and yield of the SCORE model had not been evaluated directly. The main objective of this study was to assess the potential impact of compet-ing non-CVD-related deaths on the prognostic ability and yield of the SCORE model by utilizing competing risks methodology.
Methods
Study populationData from the Prevention of Renal and Vascular End-stage Disease (PRE-VEND) cohort was utilized in this study. PREVEND is a population-based prospective cohort study primarily aimed at investigating the natural course of increased levels of urinary albumin excretion (UAE) and its as-sociation with long-term renal and cardiovascular outcomes in the general population. Details of the design and methodology of the study have been published elsewhere [15-18]. In summary, in the period 1997–1998, all in-habitants of the city of Groningen, the Netherlands, aged 28–75 years were sent a one-page postal questionnaire and a vial to collect an early morning urine sample (n=85,421). Of these subjects, 40,856 (47.8%) responded and sent a vial to a central laboratory where urinary albumin and creatinine concentrations were measured. After exclusion of subjects with IDDM and pregnant women, all subjects with a UAE ≥10 mg/L (n=7768) and a randomly selected control group with a UAE<10 mg/L (n=3395) were invited to visit an outpatient clinic for further investigations (total n= 11163). Of these, 6000 subjects with UAE≥10 mg/L and 2592 subjects with UAE<10mg/L completed the total screening program. These 8592 individ-uals comprise the actual PREVEND study cohort. The screening program at the outpatient clinic consisted of two different visits. Participants com-pleted a self-administered questionnaire on demographics, cardiovascular and renal history and the use of medication for diabetes, hypertension or hyperlipidemia. Anthropometric measurements and several laboratory and electrocardiographic assessments were also performed during these visits. These individuals were followed-up with a series of surveys every
35
Should non-cardiovascular mortality be considered in the SCORE model?
2
three to four years for the occurrence of several cardiovascular and renal outcomes, the last of which was conducted in 2010.
For this particular study, we included individuals from the PREVEND cohort aged 40 years and older who were free of CVD at baseline. We excluded individuals with a previous history of coronary heart disease (CHD) (n=372), cerebrovascular accident (CVA) (n=76) or surgery on leg arteries (n=70) at baseline. In total, 5752 individuals remained in the analyses.
Covariates and measurementsWe used the baseline levels of covariates utilized in the SCORE model [8]. These included traditional cardiovascular risk factors; sex, age, smoking, systolic blood pressure (SBP) and total serum cholesterol. Smoking was defined as current smoking or smoking cessation within the previous year. Blood pressure was measured in supine position, every minute, with an automatic Dinamap XL Model 9300 series device (Johnson and Johnson, Medical Inc., Arlington, TX) during both visits (for 10 and 8 minutes, respectively). SBP was calculated as the mean of the last two measurements during the two visits. Serum cholesterol levels were determined by Kodak Ektachem dry chemistry (Eastman Kodak, Rochester, NY, USA), an automatic enzymatic method. Low-density lipoprotein cholesterol (LDL-C) levels were estimated using the Friedewald’s method [19]. Hypertension was defined as having SBP ≥140 mmHg and/or diastolic blood pressure (DBP) ≥90 mmHg and/or use of anti-hypertensive medication. Hypercholesterolemia was defined as serum cholesterol ≥6.5 mmol/L or serum cholesterol ≥5.0 mmol/L if a history of hospital admission for myocardial infarction (MI) was reported or when lipid-lowering medication was used.
Outcome and definitionsThe primary outcome of this study was time-to-CVD-related mortality. Data on mortality were retrieved through the municipal registry. Cause of death was obtained by linking the death certificate to the primary cause of death as coded by Statistics Netherlands (CBS). These data were coded according to the International Classification of Diseases version
36
Chapter 2
10 (ICD-10). CVD-related mortality was defined as death secondary to CHD including; acute myocardial infarction (I21-23), acute and sub-acute ischaemic heart disease (I24-25), cardiac arrest (I46), other cardiac arrhythmias (I49), heart failure (I50) or atherosclerotic non-CHD en-compassing; subarachnoid hemorrhage (I60), intracerebral hemorrhage (I61), other intracranial hemorrhage (I62), occlusion or stenosis of the precerebral or cerebral arteries (I63-66), other cerebrovascular diseases (I67), sequalae of cerebrovascular diseases (I69), atherosclerosis (I70), aortic aneurysm and dissection (I71), arterial embolism and thrombosis (I74). Deaths due to all other causes were treated as non-CVD-related. Cause of death was unspecified in 1.3% (n=8) of cases. Around 12% (n=704) of the subjects were lost to follow-up because they moved to an unknown destination and were censored on the date they were removed from the municipal registry.
Statistical analysisBaseline characteristics were summarized with descriptive statistics; categorical variables with proportions, normally distributed continuous variables with mean ± SD, and those variables with skewed distributions with median and interquartile range. Actual 10-year risk of CVD and non-CVD-related mortality were estimated using the non-parametric estimate of the cumulative incidence function [9].
To assess the potential impact of competing non-CVD-related deaths on the prognostic performance of the SCORE model, two main steps were followed. In the first step, we obtained each individual’s 10-year predicted risk of CVD-related mortality under two models; the SCORE model and a competing risks model based on the cause-specific hazards (CSH) approach. As it is difficult to make direct comparison of two non-nested models developed in different study populations, we started by refitting the SCORE model in the PREVEND cohort. Model refitting is a procedure that allows for the adjustment of the performance of an exist-ing model to a different study population [20]. The SCORE was based on separate models for CHD and atherosclerotic non-CHD-related mortality that were developed with the Weibull proportional hazards modelling approach [8]. The models had two components; a baseline hazard func-
37
Should non-cardiovascular mortality be considered in the SCORE model?
2
tion (parameterized by shape (p) and scale (α) parameters) and relative risks associated with each risk factor. Baseline hazard functions were assumed to be different for men and women while relative risk estimates associated with each risk factor were considered to be similar for both sexes. To this end, stratified Weibull proportional hazards models were fit, that yielded estimates of relative risks derived from the whole popu-lation and sex-specific parameters for the baseline hazard functions. Age, rather than time under follow-up, was utilized as the time scale for the hazard functions. Consequently, age was not included in the models as a separate covariate. For this study, we utilized a model structure similar to that used in the SCORE model. The model refitting procedure involved modifying parameter estimates of the baseline hazard func-tions and relative risks associated with each risk factor for the CHD and atherosclerotic non-CHD related mortality models with estimates derived from our study population. Subsequently, 10-year risks of CHD and atherosclerotic non-CHD-related mortality were estimated using the standard survival analysis techniques. These two functions were then combined to obtain 10-year risk of CVD-related mortality. In this ap-proach, non-CVD-related deaths were treated as censored observations. For the competing risks model, three separate cause-specific proportional hazards Weibull models for CHD, atherosclerotic non-CHD and non-CVD-related mortality were fit using the same risk factors and model structure utilized in the SCORE model. Individual 10-year risks of CHD and atherosclerotic non-CHD related mortality were then estimated with the cumulative incidence function, which accounted for non-CVD-related deaths. This required incorporation of the cause-specific hazard function of non-CVD-related mortality into the estimation of 10-year cumulative incidence functions of both CHD and atherosclerotic non-CHD related mortality. In addition, failures from atherosclerotic non-CHD-related death were treated as a competing risk for the estimation of 10-year risk of CHD-related mortality and the latter for atherosclerotic non-CHD-related mortality. These two cumulative incidence functions were then summed up to obtain 10-year risk of CVD-related mortality. We observed a statistically significant interaction between total cholesterol and lipid lowering medication use at baseline and hence, this was accounted for in both the refitted SCORE and the competing risks models. The competing
38
Chapter 2
risks model will be referred to as the CSH model for the rest of this paper. Details of the specific procedures utilized to obtain individual 10-year risks of CVD-related mortality based on the two models are provided in Appendix B.
In the second step, the prognostic performance of the refitted SCORE and CSH models was compared by evaluating various measures of model performance. Calibration was assessed by plotting average predicted risk against average observed risk within each decile of 10-year predicted risk of CVD-related mortality. Discrimination was assessed by calculating the C-index based on the Wolbers et al. adapted definition of the risk set in the presence of competing risks [21]. Optimism corrected estimates of the C-index were calculated using basic bootstrap technique. Predictive-ness curves were plotted to evaluate model predictiveness [22]. Separate curves were plotted by event status for the graphical assessment of sen-sitivity and specificity. Risk reclassification graph is utilized to evaluate risk stratification [22, 23]. Separate risk reclassification graphs were plot-ted to assess movement of persons with CVD-related mortality and those without across risk thresholds of 5% and 10%. According to the European guidelines on cardiovascular disease prevention in clinical practice, these thresholds are used to define high and very high risk groups, respec-tively. The impact of risk reclassification by the CSH model on treatment decisions was evaluated using criteria proposed by the same guideline for the initiation of lipid lowering treatment [1]. Subjects were classified into categories of “no treatment”, “treatment considered” and “treat-ment recommended” based on their absolute risk and baseline LDL-C levels. Two-sided P-value of ≤5% was considered significant. Estimates of hazard ratios and cumulative incidence were summarized with 95% confidence intervals. The statistical analyses were performed using Stata version 11.0 (College Station, TX, USA) and R: A Language and Environ-ment for Statistical Computing, version 3.0.2 (R Foundation for Statistical Computing, Vienna, Austria).
39
Should non-cardiovascular mortality be considered in the SCORE model?
2
Results
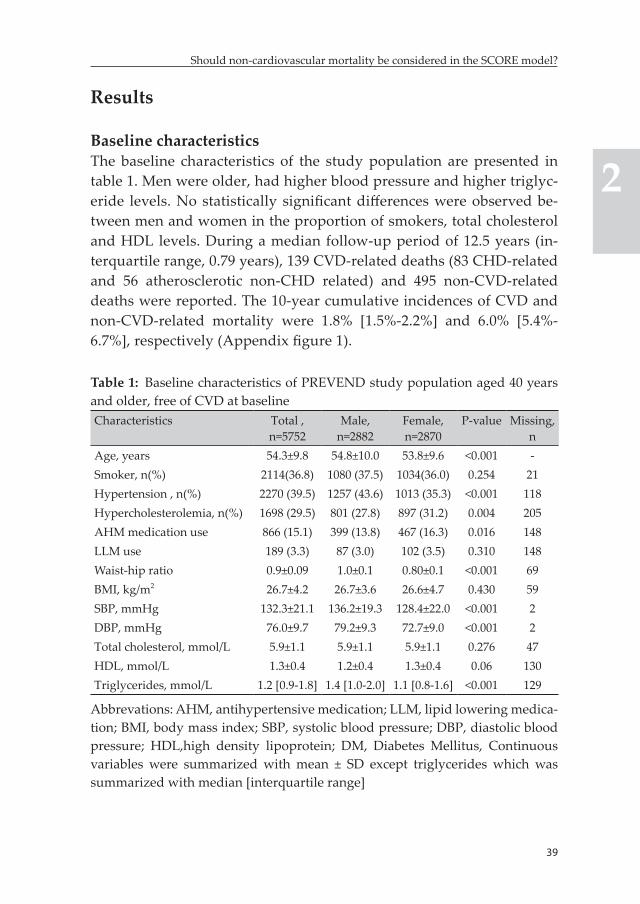
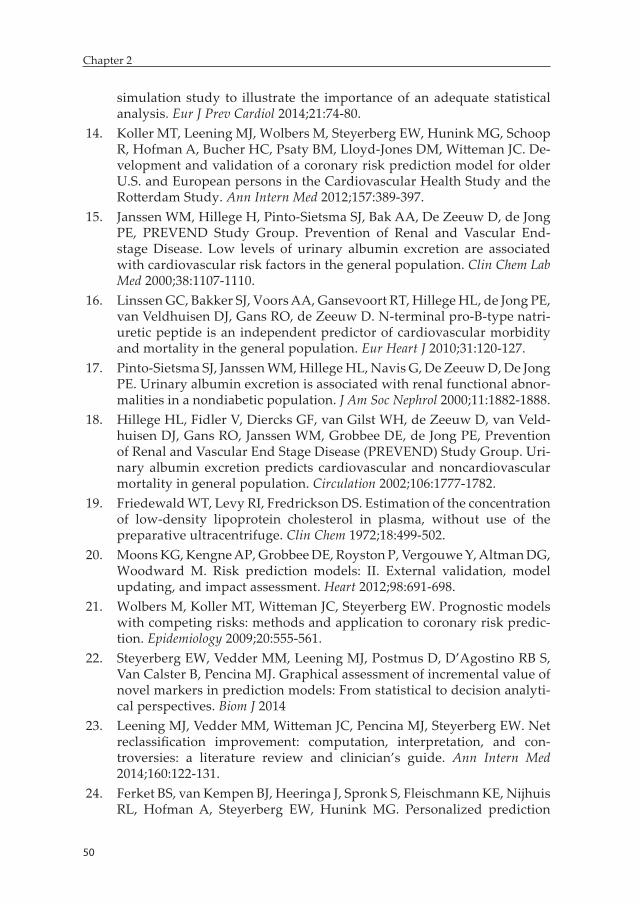
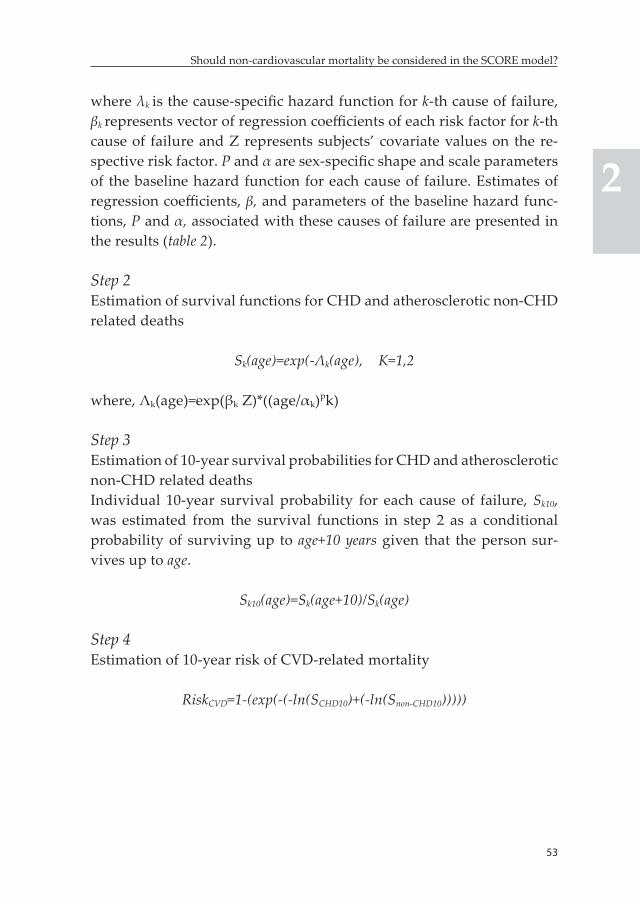
Baseline characteristicsThe baseline characteristics of the study population are presented in table 1. Men were older, had higher blood pressure and higher triglyc-eride levels. No statistically significant differences were observed be-tween men and women in the proportion of smokers, total cholesterol and HDL levels. During a median follow-up period of 12.5 years (in-terquartile range, 0.79 years), 139 CVD-related deaths (83 CHD-related and 56 atherosclerotic non-CHD related) and 495 non-CVD-related deaths were reported. The 10-year cumulative incidences of CVD and non-CVD-related mortality were 1.8% [1.5%-2.2%] and 6.0% [5.4%-6.7%], respectively (Appendix figure 1).
Table 1: Baseline characteristics of PREVEND study population aged 40 years and older, free of CVD at baselineCharacteristics Total ,
n=5752Male,
n=2882Female, n=2870
P-value Missing, n
Age, years 54.3±9.8 54.8±10.0 53.8±9.6 <0.001 -Smoker, n(%) 2114(36.8) 1080 (37.5) 1034(36.0) 0.254 21Hypertension , n(%) 2270 (39.5) 1257 (43.6) 1013 (35.3) <0.001 118Hypercholesterolemia, n(%) 1698 (29.5) 801 (27.8) 897 (31.2) 0.004 205AHM medication use 866 (15.1) 399 (13.8) 467 (16.3) 0.016 148LLM use 189 (3.3) 87 (3.0) 102 (3.5) 0.310 148Waist-hip ratio 0.9±0.09 1.0±0.1 0.80±0.1 <0.001 69BMI, kg/m2 26.7±4.2 26.7±3.6 26.6±4.7 0.430 59SBP, mmHg 132.3±21.1 136.2±19.3 128.4±22.0 <0.001 2DBP, mmHg 76.0±9.7 79.2±9.3 72.7±9.0 <0.001 2Total cholesterol, mmol/L 5.9±1.1 5.9±1.1 5.9±1.1 0.276 47HDL, mmol/L 1.3±0.4 1.2±0.4 1.3±0.4 0.06 130Triglycerides, mmol/L 1.2 [0.9-1.8] 1.4 [1.0-2.0] 1.1 [0.8-1.6] <0.001 129
Abbrevations: AHM, antihypertensive medication; LLM, lipid lowering medica-tion; BMI, body mass index; SBP, systolic blood pressure; DBP, diastolic blood pressure; HDL,high density lipoprotein; DM, Diabetes Mellitus, Continuous variables were summarized with mean ± SD except triglycerides which was summarized with median [interquartile range]
40
Chapter 2
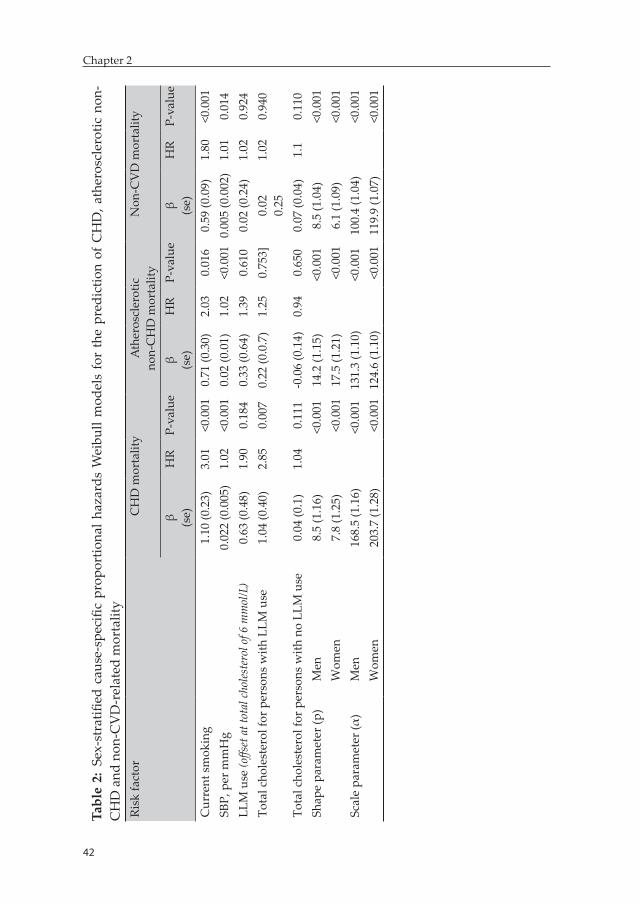
Smoking and SBP were strong predictors of both CHD and atheroscle-rotic non-CHD related mortality. Similarly, these two risk factors were signifi cantly associated with non-CVD related mortality. The eff ect of smoking was strongest for CHD-related mortality. There was a statisti-cally signifi cant interaction between total cholesterol and lipid lowering medication use at baseline for CHD-related CVD mortality (p=0.013). The eff ect of total cholesterol on CHD-related mortality was greater in those using lipid lowering medications (table 2).
Evaluation of prognostic performance
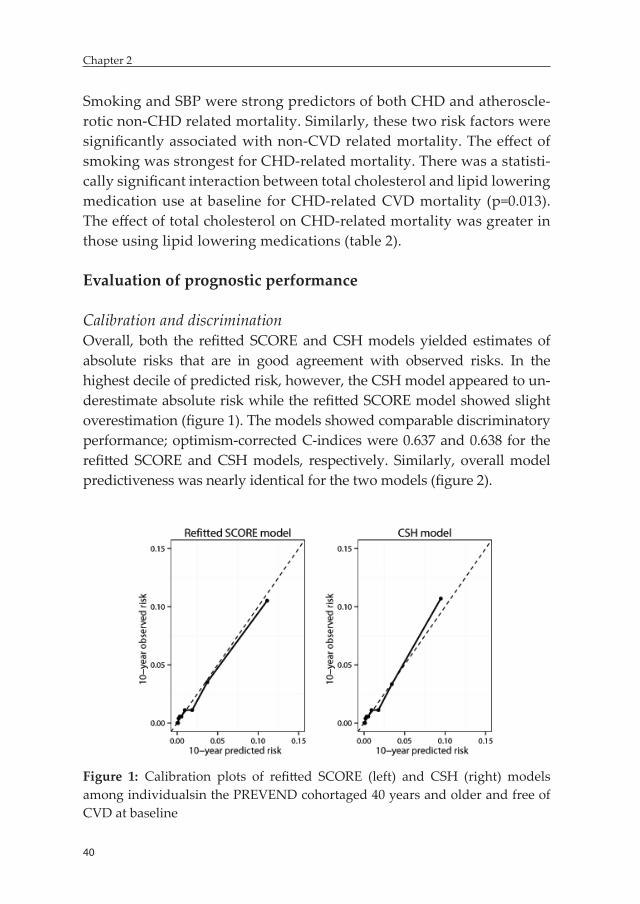
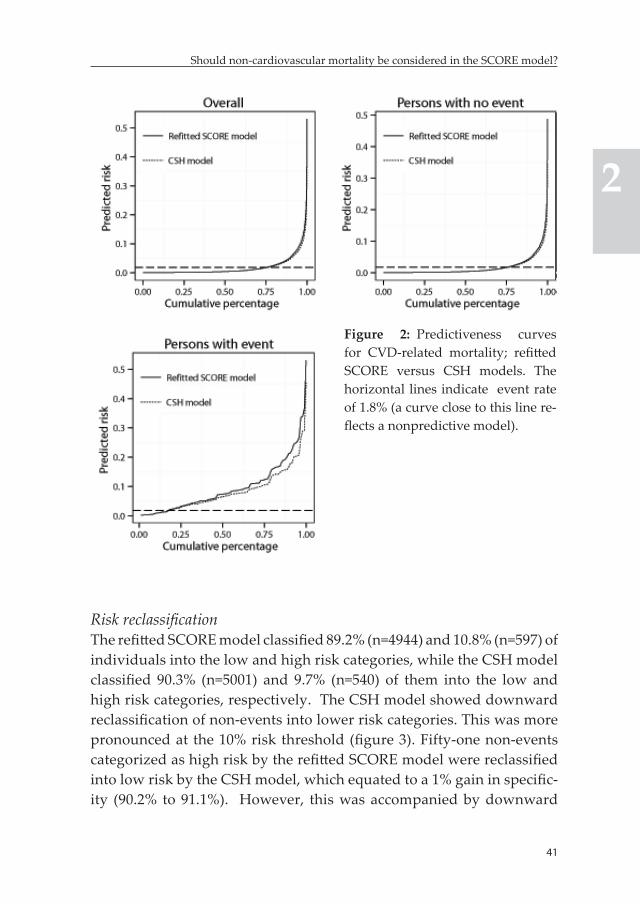
Calibration and discriminationOverall, both the refi tt ed SCORE and CSH models yielded estimates of absolute risks that are in good agreement with observed risks. In the highest decile of predicted risk, however, the CSH model appeared to un-derestimate absolute risk while the refi tt ed SCORE model showed slight overestimation (fi gure 1). The models showed comparable discriminatory performance; optimism-corrected C-indices were 0.637 and 0.638 for the refi tt ed SCORE and CSH models, respectively. Similarly, overall model predictiveness was nearly identical for the two models (fi gure 2).
Figure 1: Calibration plots of refi tt ed SCORE (left) and CSH (right) models among individualsin the PREVEND cohortaged 40 years and older and free of CVD at baseline
41
Should non-cardiovascular mortality be considered in the SCORE model?
2
Figure 2: Predictiveness curves for CVD-related mortality; refi tt ed SCORE versus CSH models. The horizontal lines indicate event rate of 1.8% (a curve close to this line re-fl ects a nonpredictive model).
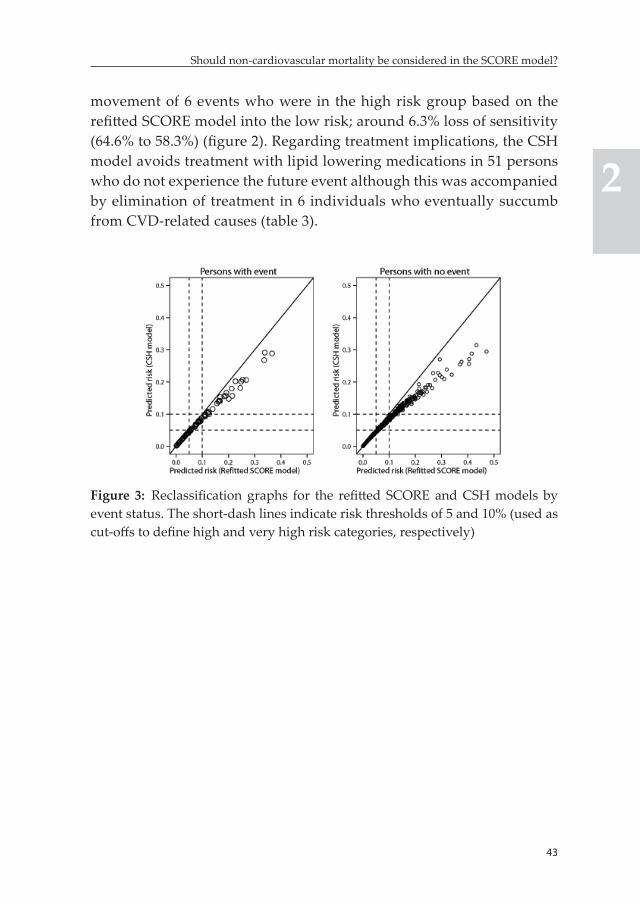
Risk reclassifi cationThe refi tt ed SCORE model classifi ed 89.2% (n=4944) and 10.8% (n=597) of individuals into the low and high risk categories, while the CSH model classifi ed 90.3% (n=5001) and 9.7% (n=540) of them into the low and high risk categories, respectively. The CSH model showed downward reclassifi cation of non-events into lower risk categories. This was more pronounced at the 10% risk threshold (fi gure 3). Fifty-one non-events categorized as high risk by the refi tt ed SCORE model were reclassifi ed into low risk by the CSH model, which equated to a 1% gain in specifi c-ity (90.2% to 91.1%). However, this was accompanied by downward
42
Chapter 2
Tabl
e 2:
Sex
-str
atifi
ed c
ause
-spe
cific
pro
port
iona
l haz
ards
Wei
bull
mod
els
for
the
pred
ictio
n of
CH
D, a
ther
oscl
erot
ic n
on-
CH
D a
nd n
on-C
VD
-rel
ated
mor
talit
yRi
sk fa
ctor
CH
D m
orta
lity
Ath
eros
cler
otic
non-
CH
D m
orta
lity
Non
-CV
D m
orta
lity
β (se)
HR
P-va
lue
β (se)
HR
P-va
lue
β (se)
HR
P-va
lue
Cur
rent
sm
okin
g1.
10 (0
.23)
3.01
<0.0
010.
71 (0
.30)
2.03
0.01
60.
59 (0
.09)
1.80
<0.0
01SB
P, p
er m
mH
g0.
022
(0.0
05)
1.02
<0.0
010.
02 (0
.01)
1.02
<0.0
010.
005
(0.0
02)
1.01
0.01
4LL
M u
se (o
ffset
at t
otal
chol
este
rol o
f 6 m
mol
/L)
0.63
(0.4
8)1.
900.
184
0.33
(0.6
4)1.
390.
610
0.02
(0.2
4)1.
020.
924
Tota
l cho
lest
erol
for p
erso
ns w
ith L
LM u
se1.
04 (0
.40)
2.85
0.00
70.
22 (0
.0.7
)1.
250.
753]
0.02
0.25
1.02
0.94
0
Tota
l cho
lest
erol
for p
erso
ns w
ith n
o LL
M u
se0.
04 (0
.1)
1.04
0.11
1-0
.06
(0.1
4)0.
940.
650
0.07
(0.0
4)1.
10.
110
Shap
e pa
ram
eter
(p)
Men
8.5
(1.1
6)<0
.001
14.2
(1.1
5)<0
.001
8.5
(1.0
4)<0
.001
Wom
en7.
8 (1
.25)
<0.0
0117
.5 (1
.21)
<0.0
016.
1 (1
.09)
<0.0
01Sc
ale
para
met
er (α
)M
en16
8.5
(1.1
6)<0
.001
131.
3 (1
.10)
<0.0
0110
0.4
(1.0
4)<0
.001
Wom
en20
3.7
(1.2
8)<0
.001
124.
6 (1
.10)
<0.0
0111
9.9
(1.0
7)<0
.001
43
Should non-cardiovascular mortality be considered in the SCORE model?
2
movement of 6 events who were in the high risk group based on the refi tt ed SCORE model into the low risk; around 6.3% loss of sensitivity (64.6% to 58.3%) (fi gure 2). Regarding treatment implications, the CSH model avoids treatment with lipid lowering medications in 51 persons who do not experience the future event although this was accompanied by elimination of treatment in 6 individuals who eventually succumb from CVD-related causes (table 3).
Figure 3: Reclassifi cation graphs for the refi tt ed SCORE and CSH models by event status. The short-dash lines indicate risk thresholds of 5 and 10% (used as cut-off s to defi ne high and very high risk categories, respectively)
44
Chapter 2
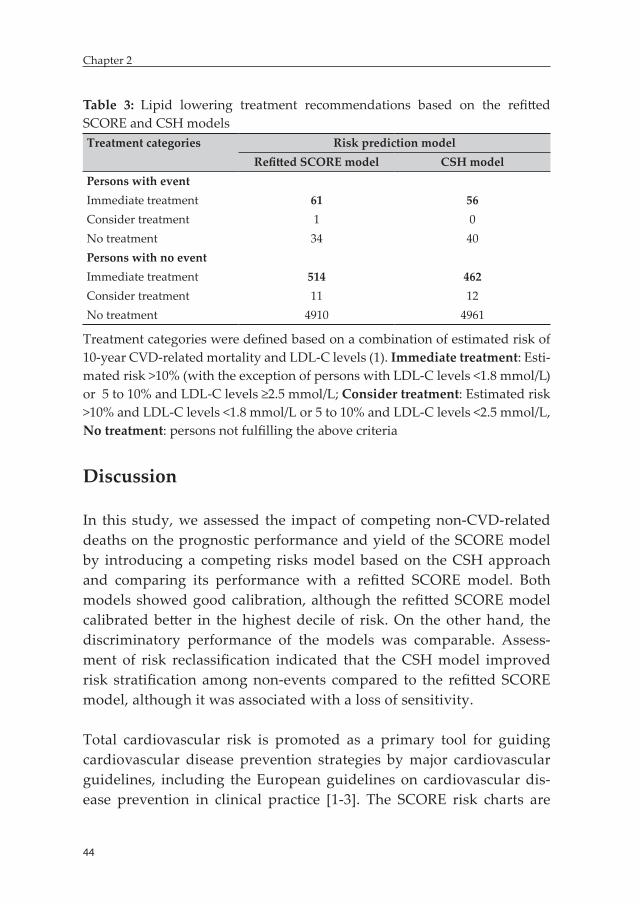
Table 3: Lipid lowering treatment recommendations based on the refitted SCORE and CSH modelsTreatment categories Risk prediction model
Refitted SCORE model CSH modelPersons with eventImmediate treatment 61 56Consider treatment 1 0No treatment 34 40Persons with no eventImmediate treatment 514 462Consider treatment 11 12No treatment 4910 4961
Treatment categories were defined based on a combination of estimated risk of 10-year CVD-related mortality and LDL-C levels (1). Immediate treatment: Esti-mated risk >10% (with the exception of persons with LDL-C levels <1.8 mmol/L) or 5 to 10% and LDL-C levels ≥2.5 mmol/L; Consider treatment: Estimated risk >10% and LDL-C levels <1.8 mmol/L or 5 to 10% and LDL-C levels <2.5 mmol/L, No treatment: persons not fulfilling the above criteria
Discussion
In this study, we assessed the impact of competing non-CVD-related deaths on the prognostic performance and yield of the SCORE model by introducing a competing risks model based on the CSH approach and comparing its performance with a refitted SCORE model. Both models showed good calibration, although the refitted SCORE model calibrated better in the highest decile of risk. On the other hand, the discriminatory performance of the models was comparable. Assess-ment of risk reclassification indicated that the CSH model improved risk stratification among non-events compared to the refitted SCORE model, although it was associated with a loss of sensitivity.
Total cardiovascular risk is promoted as a primary tool for guiding cardiovascular disease prevention strategies by major cardiovascular guidelines, including the European guidelines on cardiovascular dis-ease prevention in clinical practice [1-3]. The SCORE risk charts are
45
Should non-cardiovascular mortality be considered in the SCORE model?
2
widely used in many European countries to facilitate total cardiovas-cular risk estimation in apparently healthy individuals in the general population [1]. However, an essential characteristic of older popula-tions had not been accounted for in the development of the SCORE risk charts. Several studies indicated that non-CVD causes of death increasingly preclude CVD-related deaths with older age [14, 21, 24]. A similar finding was also observed in this study, as the 10-year risk of non-CVD-related mortality substantially exceeded that of CVD-related mortality. From a mathematical perspective, it is clear that the presence of non-CVD-related death as a competing risk results in overestimation of absolute risks unless appropriate methodology is applied [9].
The CSH model, which is a mathematically sound competing risk model that accounted for non-CVD causes of death, yielded well cali-brated absolute risk estimates. In the highest decile of risk, however, the model appeared to underestimate absolute risks while the refitted SCORE model showed a lesser degree of absolute risk overestimation. Both models had a C-index of 0.64. It must be emphasized that this C-index should not be interpreted the same way as the traditional C-in-dex. The traditional C-index had been indicated to overestimate model accuracy in the presence of competing risks, particularly in situations with strong competing risks. Interpretation of the Wolbers’ adapted C-index on the same scale as the traditional C-index can potentially lead to underestimation of predictive accuracy in the competing risks setting [21]. A recently published simulation study has shown that to achieve improvement in discriminative accuracy with a cause-specific hazards model, the risk factors for the events of interest should only be weakly or reversely associated with the cause-specific hazard of the competing event [25]. In our situation, however, the strongest risk factors for CVD-related mortality (i.e. smoking and SBP) were also strongly associated with the cause-specific hazards of non-CVD-related mortality. This can partly explain the absence of improvement in discriminative accuracy with the CSH model. Additionally, as depicted by the predictiveness curves of the models (figure 2), adjusting for non-CVD related deaths had a minimal impact on the distribution of predicted risks in persons with no event and only a modest impact on the distribution of predicted
46
Chapter 2
risks in persons with events. The small difference in the distribution of predicted risks from the two models can further justify the comparabil-ity of the discriminatory accuracy of the models.
On the other hand, the CSH model classified more non-events into the low risk group compared to the refitted SCORE model. It reclassified 51 non-events categorized into the high risk by the refitted SCORE model to the low risk, which equated to a 1% gain in specificity. But this came at the expense of a 6 % loss of sensitivity as 6 persons with future events were reclassified downwards to the low risk. The European guideline on cardiovascular disease prevention recommends initiation of inten-sive risk factor management, including treatment with lipid lowering medications, based on a set of criteria that combine total cardiovascular risk and LDL-C levels [1]. Immediate treatment with lipid lowering medications is indicated in persons with estimated 10-year risk of CVD-related morality >10% (with the exception of persons with LDL-C levels <1.8 mmol/L) and those having risk ranging from 5 to 10% and LDL-C levels ≥2.5 mmol/L. As a result, 557 individuals would qualify for immediate treatment with lipid lowering medications based on the refitted SCORE model. In contrast, immediate treatment with these medications is indicated in 518 individuals based on the CSH model. This model will avoid immediate treatment with lipid lowering medi-cations in 57 individuals, 5 of whom experience future events.
Statins are the most commonly used lipid lowering medications in primary prevention. Around 20% reduction in the risk of CVD-related mortality have been reported with the use of statins [5]. This will trans-late to numbers needed to treat (NNT) of 100 assuming a 5% threshold of risk for treatment initiation, implying that 100 individuals need to be treated to avoid a single CVD-related death. Based on NNT=100, elimination of overtreatment in 52 persons with no event by the CSH model does not justify the avoidance of treatment in 5 persons with event. On the other hand, treatment with lipid lowering mediations has been shown to be safe and effective. Serious side effects with medica-tions like statins, including rhabdomyolysis are extremely rare [1,5-7]. Additionally, it had been indicated that statins are cost-effective in
47
Should non-cardiovascular mortality be considered in the SCORE model?
2
primary prevention setting, particularly in high risk individuals [26]. These evidence suggest that the gain with the CSH model in reducing overtreatment of persons with no event is outweighed by the excess of persons with the event that would not have been treated.
The findings of our study partly mirror the results reported by Koller et al [14]. In their study, Koller and colleagues developed a CHD risk prediction model (CORE) for older European and U.S. persons using the Fine and Gray technique, taking non-CVD causes of death into account, and compared its performance with the Framingham point score (FPS) in the setting of cross-validation. Although the CORE model showed slightly better accuracy compared to the FPS, it did not show consistent improvement in risk stratification. The model classi-fied more individuals into the lower risk categories compared to the FPS among Europeans, although similar findings were not observed among US participants. In addition, the gain in true-negative rate was accompanied by an increased false-negative rate among European men, which was the same pattern observed in our study. On the other hand, Wolbers et al. showed that CHD risk prediction models for women aged 55-90 years based on both cause-specific hazards and Fine and Gray techniques (which took non-CVD deaths into account) showed superior performance in terms of calibration and risk stratification compared to a standard Cox-regression model [20]. Similar to our study, however, there was no difference between the discriminatory performance of the models.
Our study has a limitation. The PREVEND cohort is primarily enriched with individuals having elevated levels of UAE. This may interfere with the generalizability of our findings to the general population. In particular, given raised UAE levels are more strongly associated with CVD-related mortality than non-CVD-related mortality [18], it is pos-sible that the risk of death from non-CVD causes relative to death from CVD causes is underestimated in our study. Subsequently, the effect of ignoring non-CVD-related mortality and the prognostic gain with a competing risks model that accounts for the latter can be greater in a general population cohort compared to the one observed in this study.
48
Chapter 2
Conclusion
The occurrence of death from non-CVD related was not accounted for in many of the commonly utilized cardiovascular risk prediction models, including the SCORE model. Although, it is theoretically clear that the presence of non-CVD related deaths as a competing risk results in over-estimation of absolute risks, its practical consequence on the prognostic performance of the SCORE model had not been evaluated. In this study we assessed the potential consequence of non-CVD-related deaths by developing a mathematically sound competing risks model based on the CSH approach and comparing its performance with a refitted SCORE model. The CSH model yielded well calibrated absolute risk estimates, although it showed underestimation in the highest decile of risk. It also provided a valuable improvement in risk stratification among non-events. However, this was surpassed by misclassification of persons with events into the lower risk categories. Given the safety and cost-effectiveness of primary prevention strategies, our findings do not warrant the incorporation of competing non-CVD-related deaths into the estimation of total cardiovascular risk in the SCORE model.
References 1. Perk J, De Backer G, Gohlke H, Graham I, Reiner Z, Verschuren M, Albus C,
Benlian P, Boysen G, Cifkova R, Deaton C, Ebrahim S, Fisher M, Germano G, Hobbs R, Hoes A, Karadeniz S, Mezzani A, Prescott E, Ryden L, Scher-er M, Syvanne M, Scholte op Reimer WJ, Vrints C, Wood D, Zamorano JL, Zannad F, European Association for Cardiovascular Prevention & Rehabilitation (EACPR), ESC Committee for Practice Guidelines (CPG). European Guidelines on cardiovascular disease prevention in clinical practice (version 2012). The Fifth Joint Task Force of the European Society of Cardiology and Other Societies on Cardiovascular Disease Prevention in Clinical Practice (constituted by representatives of nine societies and by invited experts). Eur Heart J 2012;33:1635-1701.
2. Stone NJ, Robinson JG, Lichtenstein AH, Bairey Merz CN, Blum CB, Eckel RH, Goldberg AC, Gordon D, Levy D, Lloyd-Jones DM, McBride P, Schwartz JS, Shero ST, Smith SC,Jr, Watson K, Wilson PW, Eddleman KM, Jarrett NM, LaBresh K, Nevo L, Wnek J, Anderson JL, Halperin JL, Albert NM, Bozkurt B, Brindis RG, Curtis LH, DeMets D, Hochman JS, Kovacs RJ, Ohman EM, Pressler SJ, Sellke FW, Shen WK, Smith SC,Jr, Tomaselli
49
Should non-cardiovascular mortality be considered in the SCORE model?
2
GF, American College of Cardiology/American Heart Association Task Force on Practice Guidelines. 2013 ACC/AHA guideline on the treatment of blood cholesterol to reduce atherosclerotic cardiovascular risk in adults: a report of the American College of Cardiology/American Heart Association Task Force on Practice Guidelines. Circulation 2014;129:S1-45.
3. van Dis I, Geleijnse JM, Verschuren WM, Kromhout D. Cardiovascular risk management of hypertension and hypercholesterolaemia in the Netherlands: from unifactorial to multifactorial approach. Neth Heart J 2012;20:320-325.
4. Brugts JJ, Yetgin T, Hoeks SE, Gotto AM, Shepherd J, Westendorp RG, de Craen AJ, Knopp RH, Nakamura H, Ridker P, van Domburg R, Deckers JW. The benefits of statins in people without established cardiovascular disease but with cardiovascular risk factors: meta-analysis of randomised controlled trials. BMJ 2009;338:b2376.
5. Taylor F, Huffman MD, Macedo AF, Moore TH, Burke M, Davey Smith G, Ward K, Ebrahim S. Statins for the primary prevention of cardiovas-cular disease. Cochrane Database Syst Rev 2013;1:CD004816.
6. Jackson R, Lawes CM, Bennett DA, Milne RJ, Rodgers A. Treatment with drugs to lower blood pressure and blood cholesterol based on an individual’s absolute cardiovascular risk. Lancet 2005;365:434-441.
7. Mills EJ, Rachlis B, Wu P, Devereaux PJ, Arora P, Perri D. Primary pre-vention of cardiovascular mortality and events with statin treatments: a network meta-analysis involving more than 65,000 patients. J Am Coll Cardiol 2008;52:1769-1781.
8. Conroy RM, Pyorala K, Fitzgerald AP, Sans S, Menotti A, De Backer G, De Bacquer D, Ducimetiere P, Jousilahti P, Keil U, Njolstad I, Oganov RG, Thomsen T, Tunstall-Pedoe H, Tverdal A, Wedel H, Whincup P, Wilhelm-sen L, Graham IM, SCORE project group. Estimation of ten-year risk of fatal cardiovascular disease in Europe: the SCORE project. Eur Heart J 2003;24:987-1003.
9. Putter H, Fiocco M, Geskus RB. Tutorial in biostatistics: competing risks and multi-state models. Stat Med 2007;26:2389-2430.
10. Dignam JJ, Zhang Q, Kocherginsky M. The use and interpretation of com-peting risks regression models. Clin Cancer Res 2012;18:2301-2308.
11. Koller MT, Raatz H, Steyerberg EW, Wolbers M. Competing risks and the clinical community: irrelevance or ignorance? Stat Med 2012;31:1089-1097.
12. Allignol A, Schumacher M, Wanner C, Drechsler C, Beyersmann J. Un-derstanding competing risks: a simulation point of view. BMC Med Res Methodol 2011;11:86.
13. Rauch G, Kieser M, Ulrich S, Doherty P, Rauch B, Schneider S, Riemer T, Senges J. Competing time-to-event endpoints in cardiology trials: a
50
Chapter 2
simulation study to illustrate the importance of an adequate statistical analysis. Eur J Prev Cardiol 2014;21:74-80.
14. Koller MT, Leening MJ, Wolbers M, Steyerberg EW, Hunink MG, Schoop R, Hofman A, Bucher HC, Psaty BM, Lloyd-Jones DM, Witteman JC. De-velopment and validation of a coronary risk prediction model for older U.S. and European persons in the Cardiovascular Health Study and the Rotterdam Study. Ann Intern Med 2012;157:389-397.
15. Janssen WM, Hillege H, Pinto-Sietsma SJ, Bak AA, De Zeeuw D, de Jong PE, PREVEND Study Group. Prevention of Renal and Vascular End-stage Disease. Low levels of urinary albumin excretion are associated with cardiovascular risk factors in the general population. Clin Chem Lab Med 2000;38:1107-1110.
16. Linssen GC, Bakker SJ, Voors AA, Gansevoort RT, Hillege HL, de Jong PE, van Veldhuisen DJ, Gans RO, de Zeeuw D. N-terminal pro-B-type natri-uretic peptide is an independent predictor of cardiovascular morbidity and mortality in the general population. Eur Heart J 2010;31:120-127.
17. Pinto-Sietsma SJ, Janssen WM, Hillege HL, Navis G, De Zeeuw D, De Jong PE. Urinary albumin excretion is associated with renal functional abnor-malities in a nondiabetic population. J Am Soc Nephrol 2000;11:1882-1888.
18. Hillege HL, Fidler V, Diercks GF, van Gilst WH, de Zeeuw D, van Veld-huisen DJ, Gans RO, Janssen WM, Grobbee DE, de Jong PE, Prevention of Renal and Vascular End Stage Disease (PREVEND) Study Group. Uri-nary albumin excretion predicts cardiovascular and noncardiovascular mortality in general population. Circulation 2002;106:1777-1782.
19. Friedewald WT, Levy RI, Fredrickson DS. Estimation of the concentration of low-density lipoprotein cholesterol in plasma, without use of the preparative ultracentrifuge. Clin Chem 1972;18:499-502.
20. Moons KG, Kengne AP, Grobbee DE, Royston P, Vergouwe Y, Altman DG, Woodward M. Risk prediction models: II. External validation, model updating, and impact assessment. Heart 2012;98:691-698.
21. Wolbers M, Koller MT, Witteman JC, Steyerberg EW. Prognostic models with competing risks: methods and application to coronary risk predic-tion. Epidemiology 2009;20:555-561.
22. Steyerberg EW, Vedder MM, Leening MJ, Postmus D, D’Agostino RB S, Van Calster B, Pencina MJ. Graphical assessment of incremental value of novel markers in prediction models: From statistical to decision analyti-cal perspectives. Biom J 2014
23. Leening MJ, Vedder MM, Witteman JC, Pencina MJ, Steyerberg EW. Net reclassification improvement: computation, interpretation, and con-troversies: a literature review and clinician’s guide. Ann Intern Med 2014;160:122-131.
24. Ferket BS, van Kempen BJ, Heeringa J, Spronk S, Fleischmann KE, Nijhuis RL, Hofman A, Steyerberg EW, Hunink MG. Personalized prediction
51
Should non-cardiovascular mortality be considered in the SCORE model?
2
of lifetime benefits with statin therapy for asymptomatic individuals: a modeling study. PLoS Med 2012;9:e1001361.
25. Wolbers M, Blanche P, Koller MT, Witteman JC, Gerds TA. Concordance for prognostic models with competing risks. Biostatistics 2014;15:526-539.
26. Reiner Z. Statins in the primary prevention of cardiovascular disease. Nat Rev Cardiol 2013;10:453-464.
27. Varadhan R, Weiss CO, Segal JB, Wu AW, Scharfstein D, Boyd C. Evaluating health outcomes in the presence of competing risks: a review of statistical methods and clinical applications. Med Care 2010;48:S96-105.
28. Rapsomaniki E, White IR, Wood AM, Thompson SG, Emerging Risk Factors Collaboration. A framework for quantifying net benefits of alternative prognostic models. Stat Med 2012;31:114-130.
29. Steyerberg EW, Vickers AJ, Cook NR, Gerds T, Gonen M, Obuchowski N, Pencina MJ, Kattan MW. Assessing the performance of prediction models: a framework for traditional and novel measures. Epidemiology 2010;21:128-138.
30. Janes H, Pepe MS, Gu W. Assessing the value of risk predictions by using risk stratification tables. Ann Intern Med 2008;149:751-760.
31. Steyerberg EW, Pencina MJ. Reclassification calculations for persons with incomplete follow-up. Ann Intern Med 2010;152:195-6; author reply 196-7.
32. Graf E, Schmoor C, Sauerbrei W, Schumacher M. Assessment and com-parison of prognostic classification schemes for survival data. Stat Med 1999;18:2529-2545.
52
Chapter 2
Appendix A
Appendix fi gure 1 Cumulative incidence functions of CVD (solid line) and non-CVD (dott ed line) related mortality among individuals in the PREVEND cohort aged 40 years and older and free of CVD at baseline
Appendix B
Estimation of 10-year absolute risk of CVD-related mortality based on the refi tt ed SCORE model
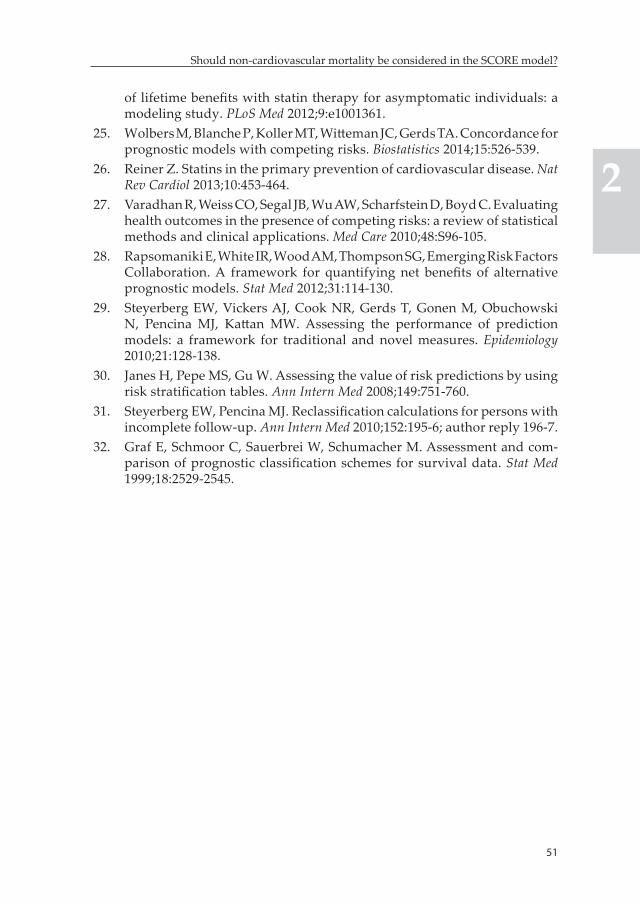
Step 1Sex-stratifi ed cause-specifi c proportional hazards Weibull models were fi t for CHD and atherosclerotic non-CHD related deaths using subject’s age as time-scale. For a cause of failure k, the models take the form:
λk (age; p, α, β, Z)=(pk / αk)(age / αk)pk-1exp(βk Z), K=1, 2
53
Should non-cardiovascular mortality be considered in the SCORE model?
2
where λk is the cause-specific hazard function for k-th cause of failure, βk represents vector of regression coefficients of each risk factor for k-th cause of failure and Z represents subjects’ covariate values on the re-spective risk factor. P and α are sex-specific shape and scale parameters of the baseline hazard function for each cause of failure. Estimates of regression coefficients, β, and parameters of the baseline hazard func-tions, P and α, associated with these causes of failure are presented in the results (table 2).
Step 2Estimation of survival functions for CHD and atherosclerotic non-CHD related deaths
Sk(age)=exp(-Λk(age), K=1,2
where, Λk(age)=exp(βk Z)*((age/αk)pk)
Step 3Estimation of 10-year survival probabilities for CHD and atherosclerotic non-CHD related deathsIndividual 10-year survival probability for each cause of failure, Sk10, was estimated from the survival functions in step 2 as a conditional probability of surviving up to age+10 years given that the person sur-vives up to age.
Sk10(age)=Sk(age+10)/Sk(age)
Step 4 Estimation of 10-year risk of CVD-related mortality
RiskCVD=1-(exp(-(-ln(SCHD10)+(-ln(Snon-CHD10)))))
54
Chapter 2
Estimation of 10-year absolute risk of CVD-related mortality based on the CSH model
Step 1The same cause-specific proportional hazards Weibull models for CHD and atherosclerotic non-CHD related mortality were used. In addition, a cause-specific hazards model which takes the form of equation instep 1 was fit for non-CVD-related death. The regression coefficients, βk, and the parameters of the baseline hazard function for this cause-specific hazards function are presented in table 2.
Step 2Estimation of overall survival functionThe cause-specific hazards functions of CHD, atherosclerotic non-CHD and non-CVD-related deaths were incorporated into the overall sur-vival function, S(age), through;
33
Step 4: Estimation of 10-year risk of CVD-related mortality
RiskCVD= 1-( exp (-(-ln(SCHD10)+(-ln(Snon-CHD10)))))
Estimation of 10-year absolute risk of CVD-related mortality based on the CSH model
Step 1: The same cause-specific proportional hazards Weibull models for CHD and
atherosclerotic non-CHD related mortality were used. In addition, a cause-specific hazards
model which takes the form of equation in step 1 was fit for non-CVD-related death. The
regression coefficients, βk , and the parameters of the baseline hazard function for this
cause-specific hazards function are presented in table 2.
Step 2: Estimation of overall survival function
The cause-specific hazards functions of CHD, atherosclerotic non-CHD and non-CVD-related
deaths were incorporated into the overall survival function, S(age), through;
)(ageΛexp(S(age)k
1kk
, where k=1,2,3
Step 3: Estimation of 10-year absolute risks of CHD and non-CHD related deaths
The absolute risks of CHD and atherosclerotic non-CHD related deaths were estimated as
cumulative incidence of each outcome at W=age+10 years given an individual is still a
survivor at age A. The competing risk of non-CVD-related mortality was accounted for in this
step as the cumulative incidence functions is determined by the cause-specific hazard
functions of all the three causes of failure through the overall survival function S(age). In
addition, this also accounts for the competing risk effect of atherosclerotic non-CHD related
deaths on CHD-related death and vice versa.
where k=1,2,3
Step 3Estimation of 10-year absolute risks of CHD and non-CHD related deathsThe absolute risks of CHD and atherosclerotic non-CHD related deaths were estimated as cumulative incidence of each outcome at W=age+10 years given an individual is still a survivor at age A. The competing risk of non-CVD-related mortality was accounted for in this step as the cu-mulative incidence functions is determined by the cause-specific hazard functions of all the three causes of failure through the overall survival function S(age). In addition, this also accounts for the competing risk effect of atherosclerotic non-CHD related deaths on CHD-related death and vice versa.
55
Should non-cardiovascular mortality be considered in the SCORE model?
2
34
S(A)
dSλWA
A(s)(s)k(s)
k A)K/TDW,AT(AI
, where k=1,2
Step 4: Estimation of 10-year risk of CVD-related mortality
RiskCVD=ICHD+Inon-CHD
where k=1,2
Step 4Estimation of 10-year risk of CVD-related mortality
RiskCVD=ICHD+Inon-CHD

PART IIBiomarker-based risk stratifi cation
in AHF

Chapter 3: Optimizing clinical use of biomarkers in high risk AHF patients
Biniyam G. Demissei, Mattia A.E. Valente, John G. Cleland, Christopher M. O’Connor, Marco Metra, Piotr Ponikowski, John R. Teerlink, Gad Cotter, Beth Davison, Michael M. Givertz, Daniel M. Bloomfield, Howard Dittrich, Peter van der Meer, Dirk J. van Veldhuisen, Hans L. Hillege, Adriaan A. Voors
European journal of heart failure 2016;18:269-280.
60
Chapter 3
Abstract
Aim: The clinical value of single biomarkers at single time-points to predict outcomes in patients with acute heart failure (AHF) is limited. We performed a multimarker, multi-time-point analysis of biomarkers for the prediction of post-discharge clinical outcomes in high risk AHF patients.
Methods: A set of 48 circulating biomarkers were measured in the PROTECT trial which enrolled 2033 patients with AHF. Associations between baseline levels of biomarkers and outcomes – 30-day all-cause mortality, 30-day death or rehospitalization for renal/cardiovascular causes and 180-day all-cause mortality – were evaluated. Prognostic accuracies of baseline, days 2 or 3, 7 and 14 biomarker measurements were estimated and compared utilizing a time-dependent AUC analysis.
Results: Forty-six biomarkers were significantly associated with outcomes, but 44 had limited prognostic value (C-index <0.70). However, multimarker models combining best performing biomarkers from different clusters had a much stronger prognostic value. Combining BUN, chloride, IL-6, cTnI, sST-2 and VEGFR-1 to a clinical model yielded a 11% increase in C-index to 0.84 and 0.78 for 30-day and 180-day all-cause mortality, respectively, and cNRI of 0.86 [0.55-1.12] and 0.76 [0.57-0.87]. Prognostic gain was modest for the 30-day death/rehospitalization for cardiovascular or renal causes endpoint. Comparative time-dependent AUC analysis indicated that late measurements provided superior accuracy for the prediction of all-cause mortality over 180 days, with few exceptions including BUN and galectin-3. However, the predictive value of most biomarkers showed a diminishing pattern over time irrespective of moment of measurement.
Conclusion: Multimarker models significantly improve risk prediction. Subsequent measurements, beyond admission, are needed for majority of biomarkers to maximize prognostic value over time, particularly in the long term.
Keywords: Acute heart failure, prognosis, risk stratification, multimarker strategy, time-dependent AUC analysis
61
Optimizing clinical use of biomarkers in high risk AHF patients
3
Introduction
A large number of patients that are hospitalized for AHF will die or have to be rehospitalized within 3-6 months after discharge (1-5). Ad-equate risk stratification in these patients results in early identification of vulnerable patients that might benefit from intensified therapy and care pre- and post-hospital discharge (6-7). Cleland et al, in a post-hoc analysis of data from the Placebo-controlled Randomized Study of the Selective A1 Adenosine Receptor Antagonist Rolofylline for Patients Hospitalized with Acute Decompensated Heart Failure and Volume Overload to Assess Treatment Effect on Congestion and Renal Function (PROTECT) trial, showed that a simple model using readily available clinical and laboratory parameters predicts adverse outcome in AHF patients, yet with only moderate accuracy. Subsequently, they highlighted the need for the evaluation of incremental value of novel biomarkers to improve prognostic accuracy (7).
Biomarkers are among the most promising contemporary tools to improve risk prediction and stratification in patients hospitalized with AHF. Although multiple biomarkers have been proposed for outcome prediction in AHF (8-11) clinical utility remains limited. Most studies have focused on single biomarkers or small number of selected biomark-ers, an approach that fails to address the multitude of complex patho-physiologic mechanisms involved in heart failure (12-18). Furthermore, many studies failed to examine the additive value of biomarkers on top of readily available clinical patient characteristics. In addition, optimal use of biomarkers in terms of added value and clinical usefulness re-quires identification of the optimal timing of measurements in order to maximize prognostic utility.
In this study, we examined the improvement in prognostic performance attained by adding the best combination of biomarkers on top of a clinical model after systematically evaluating 48 established and novel biomarkers. Additionally, we compared the time-dependent prognostic accuracy of biomarker measurements collected at different time points within 14 days of baseline assessment.
62
Chapter 3
Methods
Study populationThe PROTECT trial, a multicenter, randomized, double-blind, placebo-controlled trial, enrolled 2033 adult patients with a history of heart fail-ure hospitalized for AHF. Patients with BNP≥500 pg/mL or NT-proBNP ≥2000 pg/mL and mild to moderate renal impairment were included in the trial. Details of the design and main results of the study have been published previously (7, 19, 20). Additional inclusion and exclusion criteria directly relevant to the current analysis are also provided in supplementary table S1. All patients provided written informed con-sent. The study was conducted in compliance with the Declaration of Helsinki and was approved by all relevant local ethics committees.
Study procedures and measurementsForty-four established and novel circulating biomarkers were evalu-ated at baseline, and on days 3, 7 and 14. Albumin, alanine transami-nase, aspartate transaminase, bicarbonate, blood urea nitrogen (BUN), chloride, creatinine, glucose, hemoglobin, platelet count, potassium, red blood cell (RBC) count, sodium, total cholesterol, triglycerides, uric acid and white blood cell (WBC) count were measured in a central laboratory (ICON Laboratories, Farmingdale, New York). A panel of 26 novel biomarkers was measured by Alere Inc., San Diego, CA, USA in available frozen serum samples. Galectin-3, myeloperoxidase (MPO) and neutrophil gelatinase-associated lipocalin (NGAL) were measured using sandwich enzyme-linked immonsorbent assays (ELISA) on a mi-crotiter plate; angiogenin and C-reactive protein (CRP) were measured using competitive ELISAs on a Luminex® platform; D-dimer, endothe-lial cell-selective adhesion molecule (ESAM), growth differentiation factor 15 (GDF-15), lymphotoxin beta receptor (LTBR), mesothelin, neuropilin, N-terminal pro C-type natriuretic peptide (NT-proCNP), osteopontin, procalcitonin, pentraxin-3, periostin, polymeric immuno-globulin receptor (PIGR), pro-adrenomedullin (proADM), prosaposin B, receptor for advanced glycation endproducts (RAGE), soluble ST-2 (sST-2), syndecan-1, tumor necrosis factor alpha receptor 1 (TNFR-1), Troy, vascular endothelial growth receptor 1 (VEGFR-1) and WAP four-
63
Optimizing clinical use of biomarkers in high risk AHF patients
3
disulphide core domain protein HE4 (WAP-4c) were measured using sandwich ELISAs on a Luminex® platform. These research assays have not been standardized to the commercialized assays used in research or in clinical use and the extent to which each Alere assay correlates with the commercial assay is not fully characterized. Additionally, a panel of four biomarkers – endothelin-1 (ET-1), Interleukin-6 (IL-6), Kidney Injury Molecule 1 (KIM-1) and cardiac specific Troponin I (cTnI) – was measured in frozen plasma samples collected at baseline and on days 2, 7 and 14 using high sensitive single molecule counting (SMC™) tech-nology (RUO, Erenna® Immunoassay System, Singulex Inc., Alameda, CA, USA) (supplementary methods for details). N-terminal pro-brain natriuretic peptide (NT-proBNP) was measured during screening us-ing commercial assays available at the study sites or a point of care device provided to study sites when needed. The number of available measurements of each biomarker and details of assay information are presented in supplementary tables S2 and S3, respectively.
Study outcomesThree previously evaluated outcomes – (1) time-to-death from any cause through day 30, (2) time-to-death/rehospitalization for renal or cardiovascular causes through day 30 and (3) time-to-death through 180 days – were assessed (7).
Statistical analysesAll analyses were performed based on the intention-to-treat popula-tion. The study drug rolofylline did not have significant effect on any of the outcomes assessed in this study (20). Continuous variables are presented as mean ± standard deviation or median (interquartile range) for normally and non-normally distributed variables, respectively. Student’s t-tests and Wilcoxon tests were used to compare groups as appropriate. Multiple imputation was performed for missing values of clinical variables. No imputation was performed for missing biomarker data.
Univariable associations between baseline biomarker levels and outcomes were assessed with Cox proportional hazards models.
64
Chapter 3
Discrimination was quantified with the Harrell’s C-index. A C-index greater than 0.7 was considered good (21). Adjusted associations were evaluated with multivariable Cox proportional hazards models that included individual biomarkers and clinical variables. The variables included clinical characteristics – sex, age, BMI, systolic blood pressure, diastolic blood pressure, heart rate, respiratory rate, orthopnea, pulmo-nary rales, peripheral edema, JVP, NYHA class, study drug – medical history – atrial fibrillation, COPD, stroke, peripheral vascular disease, hypertension, diabetes mellitus, hypercholesterolemia, ischaemic heart disease, heart failure hospitalization within the previous year. Cleland et al – in their analysis aimed at developing a prognostic model using data from the PROTECT trial – identified these variables as candidate predictors for outcomes evaluated in the current study (7). Although variables related to medication and device use were not included in the previous analysis by Cleland et al (were considered to influence generalizability of the model), we have incorporated these variables in the baseline model as our main aim was not to develop a new prog-nostic model but rather to evaluate added value of biomarkers over a comprehensive clinical model. Subsequently, we have included prior use of ACE inhibitors/ARB’s, beta-blockers, calcium channel blockers, mineralocorticoid receptor antagonists (MRAs), implantable cardio-verter defibrillator (ICD) and study drug in the baseline clinical model.
A two-step approach was utilized to identify best combination of bio-markers to be included in the multimarker models. In the first step, pre-selection of candidate biomarkers was performed based on the level of significance of association with outcomes in the above multivariable analysis. A stringent criterion – p-value less than 5% (rather than 10-20%) – was utilized to reduce the potential untoward effect of multiple testing on model selection; primarily inclusion of noise variables. Added prognostic value of candidate markers was then quantified with change in the Harrell’s C-index and continuous net reclassification improve-ment (cNRI). The cNRI is a category-independent metric that quantifies the amount of correct change in model-based predicted probabilities obtained by adding a biomarker to an established model (22). Details of the calculation and interpretation of the cNRI are provided in the
65
Optimizing clinical use of biomarkers in high risk AHF patients
3
supplementary methods section. In the second step, exploratory factor analysis based on the principal component analysis technique was per-formed to address multicollinearity and facilitate biomarker selection (23-25) (supplementary methods for details). Best performing biomark-ers were then selected from each cluster based on the level of increment in the C-index and cNRI (particularly, important when gains in the C-index were comparable), and the combination was added to multivari-able Cox-models containing the clinical variables. The combination of biomarkers that provided the highest gain in prognostic performance was considered the best. This approach further reduces the likelihood that a biomarker is randomly (i.e. as a potential consequence of mul-tiple testing) included in the final multimarker models. Multivariable receiver-operating characteristic (ROC) curves for survival data were used for graphical assessment of discrimination improvement (26). Patients with complete baseline measurement of biomarkers that were considered candidates for multimarker models were included in this analysis (n=1391). NT-proBNP and WBC count were excluded from this analysis as they contributed to higher number of missing values while only providing small prognostic gains for the prediction of only one of the mortality outcomes.
Differences in the predictive value of biomarkers in heart failure with reduced ejection fraction (HFREF) versus heart failure with preserved ejection fraction (HFPEF) were evaluated in multivariable models that included clinical variables, EF status and individual biomarkers in ad-dition to interaction term between EF status and biomarkers. Patients with baseline LVEF<40% were considered to have HFREF while those with LVEF >40% were categorized as HFPEF.
Discriminatory accuracy of biomarker measurements obtained at base-line and on days 2 (for ET-1, IL-6 and cTnI) or 3 (for the other biomark-ers), 7 and 14 for all-cause mortality over 180 days was compared by plotting AUCs estimated at different time points within 180 days using survival ROC analysis proposed by Heagerty et al (supplementary methods for details) (26). All available biomarker values were utilized for each moment of measurement. Patients who died or were censored
66
Chapter 3
before day 14 (n=80) were excluded from this analysis to account for the potential impact of early deaths and survivor bias on the comparison of discriminatory accuracy of the different biomarker measurement mo-ments. The number of patients included in each stage of the statistical analysis is provided in supplementary table S4 and supplementary fig-ure S3. Estimates are presented with 95% confidence intervals. P-value <0.05 was considered statistically significant. Statistical analyses were performed with Stata version 11.0 (College Station, TX, USA) and R: A Language and Environment for Statistical Computing, version 3.0.2 (R Foundation for Statistical Computing, Vienna, Austria).
Results
Baseline characteristics and biomarker measurementsBaseline clinical characteristics and levels of 48 biomarkers are presented in table 1. Median age was 70 years and 67% of the patients were men. Among patients with available data, 71.6% (n=698) had LVEF <40%. The unique set of biomarkers consists of both well-established and novel biomarkers. These biomarkers are related to several pathophysiologic pathways, and the majority of the novel biomarkers are involved in inflammation and/or myocardial fibrosis and remodeling. An overview of biomarkers and associated pathophysiologic domains is presented in supplementary table S2.
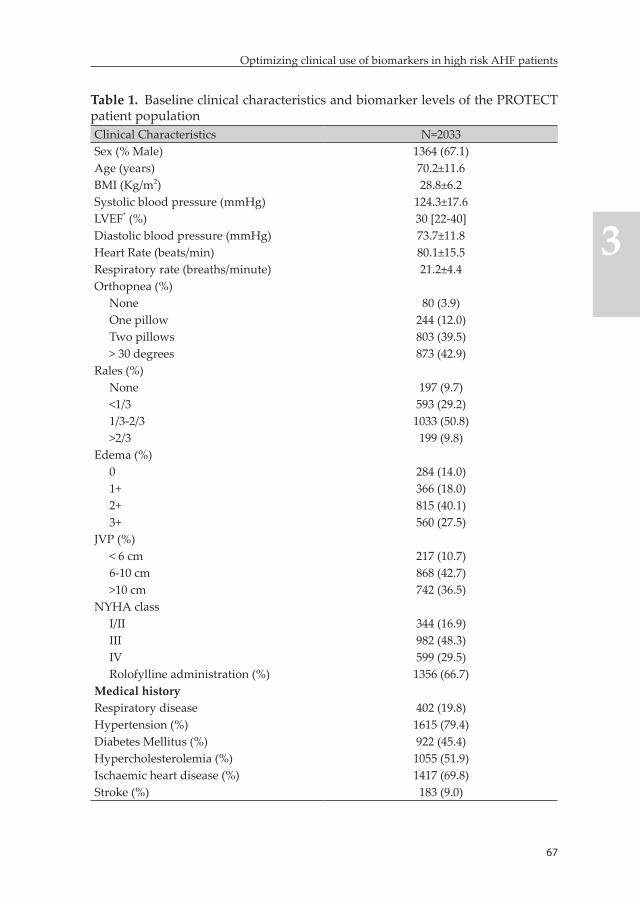
67
Optimizing clinical use of biomarkers in high risk AHF patients
3
Table 1. Baseline clinical characteristics and biomarker levels of the PROTECT patient populationClinical Characteristics N=2033Sex (% Male) 1364 (67.1)Age (years) 70.2±11.6BMI (Kg/m2) 28.8±6.2Systolic blood pressure (mmHg) 124.3±17.6LVEF* (%) 30 [22-40]Diastolic blood pressure (mmHg) 73.7±11.8Heart Rate (beats/min) 80.1±15.5Respiratory rate (breaths/minute) 21.2±4.4Orthopnea (%)
None 80 (3.9)One pillow 244 (12.0)Two pillows 803 (39.5)> 30 degrees 873 (42.9)
Rales (%)None 197 (9.7)<1/3 593 (29.2)1/3-2/3 1033 (50.8)>2/3 199 (9.8)
Edema (%)0 284 (14.0)1+ 366 (18.0)2+ 815 (40.1)3+ 560 (27.5)
JVP (%)< 6 cm 217 (10.7)6-10 cm 868 (42.7)>10 cm 742 (36.5)
NYHA classI/II 344 (16.9)III 982 (48.3)IV 599 (29.5)Rolofylline administration (%) 1356 (66.7)
Medical historyRespiratory disease 402 (19.8)Hypertension (%) 1615 (79.4)Diabetes Mellitus (%) 922 (45.4)Hypercholesterolemia (%) 1055 (51.9)Ischaemic heart disease (%) 1417 (69.8)Stroke (%) 183 (9.0)
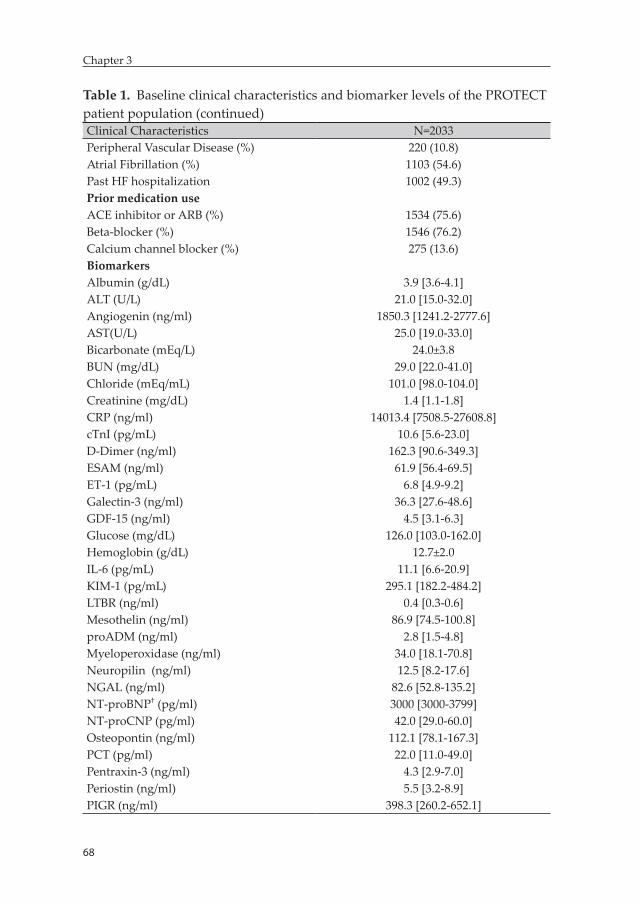
68
Chapter 3
Table 1. Baseline clinical characteristics and biomarker levels of the PROTECT patient population (continued)Clinical Characteristics N=2033Peripheral Vascular Disease (%) 220 (10.8)Atrial Fibrillation (%) 1103 (54.6)Past HF hospitalization 1002 (49.3)Prior medication useACE inhibitor or ARB (%) 1534 (75.6)Beta-blocker (%) 1546 (76.2)Calcium channel blocker (%) 275 (13.6)BiomarkersAlbumin (g/dL) 3.9 [3.6-4.1]ALT (U/L) 21.0 [15.0-32.0]Angiogenin (ng/ml) 1850.3 [1241.2-2777.6]AST(U/L) 25.0 [19.0-33.0]Bicarbonate (mEq/L) 24.0±3.8BUN (mg/dL) 29.0 [22.0-41.0]Chloride (mEq/mL) 101.0 [98.0-104.0]Creatinine (mg/dL) 1.4 [1.1-1.8]CRP (ng/ml) 14013.4 [7508.5-27608.8]cTnI (pg/mL) 10.6 [5.6-23.0]D-Dimer (ng/ml) 162.3 [90.6-349.3]ESAM (ng/ml) 61.9 [56.4-69.5]ET-1 (pg/mL) 6.8 [4.9-9.2]Galectin-3 (ng/ml) 36.3 [27.6-48.6]GDF-15 (ng/ml) 4.5 [3.1-6.3]Glucose (mg/dL) 126.0 [103.0-162.0]Hemoglobin (g/dL) 12.7±2.0IL-6 (pg/mL) 11.1 [6.6-20.9]KIM-1 (pg/mL) 295.1 [182.2-484.2]LTBR (ng/ml) 0.4 [0.3-0.6]Mesothelin (ng/ml) 86.9 [74.5-100.8]proADM (ng/ml) 2.8 [1.5-4.8]Myeloperoxidase (ng/ml) 34.0 [18.1-70.8]Neuropilin (ng/ml) 12.5 [8.2-17.6]NGAL (ng/ml) 82.6 [52.8-135.2]NT-proBNP† (pg/ml) 3000 [3000-3799]NT-proCNP (pg/ml) 42.0 [29.0-60.0]Osteopontin (ng/ml) 112.1 [78.1-167.3]PCT (pg/ml) 22.0 [11.0-49.0]Pentraxin-3 (ng/ml) 4.3 [2.9-7.0]Periostin (ng/ml) 5.5 [3.2-8.9]PIGR (ng/ml) 398.3 [260.2-652.1]
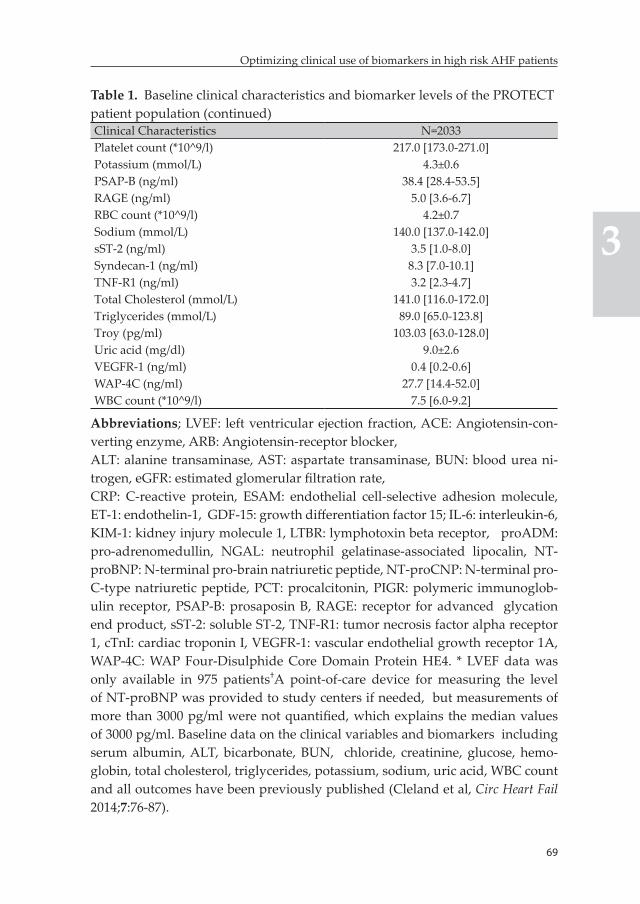
69
Optimizing clinical use of biomarkers in high risk AHF patients
3
Table 1. Baseline clinical characteristics and biomarker levels of the PROTECT patient population (continued)Clinical Characteristics N=2033Platelet count (*10^9/l) 217.0 [173.0-271.0]Potassium (mmol/L) 4.3±0.6PSAP-B (ng/ml) 38.4 [28.4-53.5]RAGE (ng/ml) 5.0 [3.6-6.7]RBC count (*10^9/l) 4.2±0.7Sodium (mmol/L) 140.0 [137.0-142.0]sST-2 (ng/ml) 3.5 [1.0-8.0]Syndecan-1 (ng/ml) 8.3 [7.0-10.1]TNF-R1 (ng/ml) 3.2 [2.3-4.7]Total Cholesterol (mmol/L) 141.0 [116.0-172.0]Triglycerides (mmol/L) 89.0 [65.0-123.8]Troy (pg/ml) 103.03 [63.0-128.0]Uric acid (mg/dl) 9.0±2.6VEGFR-1 (ng/ml) 0.4 [0.2-0.6]WAP-4C (ng/ml) 27.7 [14.4-52.0]WBC count (*10^9/l) 7.5 [6.0-9.2]
Abbreviations; LVEF: left ventricular ejection fraction, ACE: Angiotensin-con-verting enzyme, ARB: Angiotensin-receptor blocker,ALT: alanine transaminase, AST: aspartate transaminase, BUN: blood urea ni-trogen, eGFR: estimated glomerular filtration rate,CRP: C-reactive protein, ESAM: endothelial cell-selective adhesion molecule, ET-1: endothelin-1, GDF-15: growth differentiation factor 15; IL-6: interleukin-6, KIM-1: kidney injury molecule 1, LTBR: lymphotoxin beta receptor, proADM: pro-adrenomedullin, NGAL: neutrophil gelatinase-associated lipocalin, NT-proBNP: N-terminal pro-brain natriuretic peptide, NT-proCNP: N-terminal pro-C-type natriuretic peptide, PCT: procalcitonin, PIGR: polymeric immunoglob-ulin receptor, PSAP-B: prosaposin B, RAGE: receptor for advanced glycation end product, sST-2: soluble ST-2, TNF-R1: tumor necrosis factor alpha receptor 1, cTnI: cardiac troponin I, VEGFR-1: vascular endothelial growth receptor 1A, WAP-4C: WAP Four-Disulphide Core Domain Protein HE4. * LVEF data was only available in 975 patients†A point-of-care device for measuring the level of NT-proBNP was provided to study centers if needed, but measurements of more than 3000 pg/ml were not quantified, which explains the median values of 3000 pg/ml. Baseline data on the clinical variables and biomarkers including serum albumin, ALT, bicarbonate, BUN, chloride, creatinine, glucose, hemo-globin, total cholesterol, triglycerides, potassium, sodium, uric acid, WBC count and all outcomes have been previously published (Cleland et al, Circ Heart Fail 2014;7:76-87).
70
Chapter 3
OutcomesA total of 106 (5.2%) patients died within 30 days of the index hospital-ization, while 326 (16.0%) reached the 30-day composite endpoint, and 358 (17.6%) died within 180 days after hospitalization.
Univariable and multivariable association between baseline levels of individual biomarkers and outcomesBaseline levels of 46 biomarkers were significantly associated with at least one outcome (supplementary Table S6). However, discriminatory abilities were only modest (C-index <0.70), with the exceptions of IL-6 and sST-2 for the prediction of 30-day all-cause mortality (C-indices were 0.71 and 0.70, respectively). All biomarkers except glucose, hemo-globin, platelet count, RAGE and RBC count were significantly associ-ated with at least one of the outcomes in multivariable Cox models that included clinical variables and individual biomarkers.
Added prognostic value of individual biomarkers on top of clinical variablesPatients included in this analysis (n=1391) were well-matched with ex-cluded patients (supplementary Table S7). Event rates observed in this subgroup of patients were comparable to the whole study population. The clinical model, which included 27 variables, had a C-index of 0.75, 0.63 and 0.70 for the prediction of 30-day all-cause mortality, the 30-day composite and 180-day all-cause mortality, respectively.
Twenty-eight biomarkers independently predicted 30-day all-cause mortality in this subgroup of patients. The greatest increases in the C-index were observed for IL-6 and sST-2; a 6.6% (0.75 to 0.80) increase for both biomarkers. Corresponding cNRI estimates were 0.64 [0.34-0.89] and 0.49 [0.23-0.79], respectively. Sixteen additional biomarkers provided statistically significant improvement in risk classification.
Twenty-five biomarkers independently predicted the 30-day composite endpoint. Improvements in the C-index were, however, limited; the greatest increase attained was around 4% with the additions of sST-2 and VEGFR-1. Corresponding cNRI were 0.27 [0.11-0.41] and 0.18 [0.02-
71
Optimizing clinical use of biomarkers in high risk AHF patients
3
0.32]. Eleven biomarkers provided statistically significant improvement in risk classification.
Thirty-two biomarkers were independently predictive of 180-day all-cause mortality. BUN and IL-6 provided the biggest prognostic gains; the C-index increased by 4.4% (0.70 to 0.73) with both markers while the cNRIs were 0.45 [0.25-0.59] and 0.47 [0.31-0.63]. Another 22 biomarkers provided increases in the C-index and significant cNRI, which were more pronounced for proADM, sST-2, cTnI, VEGFR-1 and WAP-4c (table 2). Graphical presentation of the ranking of biomarkers in terms of improvement in risk classification for all outcomes is provided in supplementary figure S1.
Baseline multimarker modelsBest performing biomarkers selected from clusters identified based on principal component analysis were combined (supplementary table S8). The combination of BUN, chloride, IL-6, sST-2, cTnI and VEGFR-1 yielded the greatest prognostic improvement for all evaluated out-comes. A model containing these biomarkers on top of clinical variables had a C-index of 0.84 [0.77-0.90] for 30-day all-cause mortality; an 11.0% increment compared to the clinical model alone (p<0.001) (figure 1). The associated cNRI was 0.86 [0.55-1.11].
The addition of the same combination of biomarkers to the clinical model yielded an 8.8% increase in the C-index to 0.68, and cNRI=0.40 [0.23-0.57] for the 30-day composite endpoint. Regarding 180-day all-cause mortality, combined addition of BUN, chloride, IL-6, sST-2, cTnI and VEGFR-1 to the clinical model resulted in a 11.0% increase in the C-index to 0.78 [0.74-0.81] and cNRI=0.76 [0.57-0.87] (table 3). The increase in the C-index attained with the combination of biomarkers was significantly higher than those attained with any single biomarker.
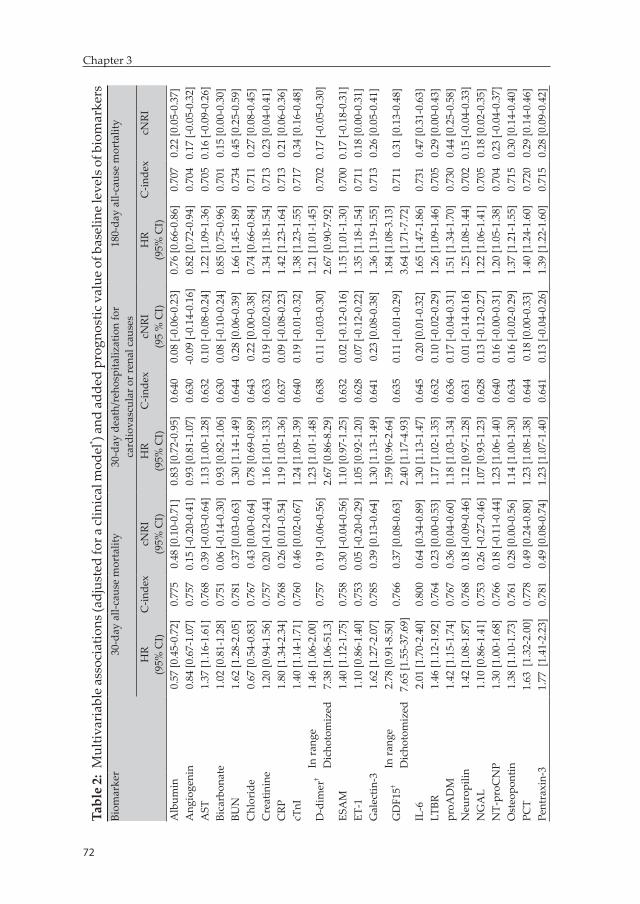
72
Chapter 3
73
Optimizing clinical use of biomarkers in high risk AHF patients
3
Tabl
e 2:
Mul
tivar
iabl
e as
soci
atio
ns (a
djus
ted
for a
clin
ical
mod
el* ) a
nd a
dded
pro
gnos
tic v
alue
of b
asel
ine
leve
ls o
f bio
mar
kers
Biom
arke
r30
-day
all-
caus
e m
orta
lity
30-d
ay d
eath
/reh
ospi
taliz
atio
n fo
r ca
rdio
vasc
ular
or r
enal
cau
ses
180-
day
all-c
ause
mor
talit
y
HR
(95%
CI)
C-in
dex
cNRI
(95%
CI)
HR
(95%
CI)
C-in
dex
cNRI
(95
% C
I)H
R(9
5% C
I)C
-inde
xcN
RI
Alb
umin
0.57
[0.4
5-0.
72]
0.77
50.
48 [0
.10-
0.71
]0.
83 [0
.72-
0.95
]0.
640
0.08
[-0.
06-0
.23]
0.76
[0.6
6-0.
86]
0.70
70.
22 [0
.05-
0.37
]A
ngio
geni
n0.
84 [0
.67-
1.07
]0.
757
0.15
[-0.
20-0
.41]
0.93
[0.8
1-1.
07]
0.63
0-0
.09
[-0.1
4-0.
16]
0.82
[0.7
2-0.
94]
0.70
40.
17 [-
0.05
-0.3
2]A
ST1.
37 [1
.16-
1.61
]0.
768
0.39
[-0.
03-0
.64]
1.13
[1.0
0-1.
28]
0.63
20.
10 [-
0.08
-0.2
4]1.
22 [1
.09-
1.36
]0.
705
0.16
[-0.
09-0
.26]
Bica
rbon
ate
1.02
[0.8
1-1.
28]
0.75
10.
06 [-
0.14
-0.3
0]0.
93 [0
.82-
1.06
]0.
630
0.08
[-0.
10-0
.24]
0.85
[0.7
5-0.
96]
0.70
10.
15 [0
.00-
0.30
]BU
N1.
62 [1
.28-
2.05
]0.
781
0.37
[0.0
3-0.
63]
1.30
[1.1
4-1.
49]
0.64
40.
28 [0
.06-
0.39
]1.
66 [1
.45-
1.89
]0.
734
0.45
[0.2
5-0.
59]
Chl
orid
e0.
67 [0
.54-
0.83
]0.
767
0.43
[0.0
0-0.
64]
0.78
[0.6
9-0.
89]
0.64
30.
22 [0
.00-
0.38
]0.
74 [0
.66-
0.84
]0.
711
0.27
[0.0
8-0.
45]
Cre
atin
ine
1.20
[0.9
4-1.
56]
0.75
70.
20 [-
0.12
-0.4
4]1.
16 [1
.01-
1.33
]0.
633
0.19
[-0.
02-0
.32]
1.34
[1.1
8-1.
54]
0.71
30.
23 [0
.04-
0.41
]C
RP1.
80 [1
.34-
2.34
]0.
768
0.26
[0.0
1-0.
54]
1.19
[1.0
3-1.
36]
0.63
70.
09 [-
0.08
-0.2
3]1.
42 [1
.23-
1.64
]0.
713
0.21
[0.0
6-0.
36]
cTnI
1.40
[1.1
4-1.
71]
0.76
00.
46 [0
.02-
0.67
]1.
24 [1
.09-
1.39
]0.
640
0.19
[-0.
01-0
.32]
1.38
[1.2
3-1.
55]
0.71
70.
34 [0
.16-
0.48
]
D-d
imer
†In
rang
e1.
46 [1
.06-
2.00
]0.
757
0.19
[-0.
06-0
.56]
1.23
[1.0
1-1.
48]
0.63
80.
11 [-
0.03
-0.3
0]1.
21 [1
.01-
1.45
]0.
702
0.17
[-0.
05-0
.30]
Dic
hoto
miz
ed7.
38 [1
.06-
51.3
]2.
67 [0
.86-
8.29
]2.
67 [0
.90-
7.92
]ES
AM
1.40
[1.1
2-1.
75]
0.75
80.
30 [-
0.04
-0.5
6]1.
10 [0
.97-
1.25
]0.
632
0.02
[-0.
12-0
.16]
1.15
[1.0
1-1.
30]
0.70
00.
17 [-
0.18
-0.3
1]ET
-11.
10 [0
.86-
1.40
]0.
753
0.05
[-0.
20-0
.29]
1.05
[0.9
2-1.
20]
0.62
80.
07 [-
0.12
-0.2
2]1.
35 [1
.18-
1.54
]0.
711
0.18
[0.0
0-0.
31]
Gal
ectin
-31.
62 [1
.27-
2.07
]0.
785
0.39
[0.1
3-0.
64]
1.30
[1.1
3-1.
49]
0.64
10.
23 [0
.08-
0.38
]1.
36 [1
.19-
1.55
]0.
713
0.26
[0.0
5-0.
41]
GD
F15†
In ra
nge
2.78
[0.9
1-8.
50]
0.76
60.
37 [0
.08-
0.63
]1.
59 [0
.96-
2.64
]0.
635
0.11
[-0.
01-0
.29]
1.84
[1.0
8-3.
13]
0.71
10.
31 [0
.13-
0.48
]D
icho
tom
ized
7.65
[1.5
5-37
.69]
2.40
[1.1
7-4.
93]
3.64
[1.7
1-7.
72]
IL-6
2.01
[1.7
0-2.
40]
0.80
00.
64 [0
.34-
0.89
]1.
30 [1
.13-
1.47
]0.
645
0.20
[0.0
1-0.
32]
1.65
[1.4
7-1.
86]
0.73
10.
47 [0
.31-
0.63
]LT
BR1.
46 [1
.12-
1.92
]0.
764
0.23
[0.0
0-0.
53]
1.17
[1.0
2-1.
35]
0.63
20.
10 [-
0.02
-0.2
9]1.
26 [1
.09-
1.46
]0.
705
0.29
[0.0
0-0.
43]
proA
DM
1.42
[1.1
5-1.
74]
0.76
70.
36 [0
.04-
0.60
]1.
18 [1
.03-
1.34
]0.
636
0.17
[-0.
04-0
.31]
1.51
[1.3
4-1.
70]
0.73
00.
44 [0
.25-
0.58
]N
euro
pilin
1.42
[1.0
8-1.
87]
0.76
80.
18 [-
0.09
-0.4
6]1.
12 [0
.97-
1.28
]0.
631
0.01
[-0.
14-0
.16]
1.25
[1.0
8-1.
44]
0.70
20.
15 [-
0.04
-0.3
3]N
GA
L1.
10 [0
.86-
1.41
]0.
753
0.26
[-0.
27-0
.46]
1.07
[0.9
3-1.
23]
0.62
80.
13 [-
0.12
-0.2
7]1.
22 [1
.06-
1.41
]0.
705
0.18
[0.0
2-0.
35]
NT-
proC
NP
1.30
[1.0
0-1.
68]
0.76
60.
18 [-
0.11
-0.4
4]1.
23 [1
.06-
1.40
]0.
640
0.16
[-0.
00-0
.31]
1.20
[1.0
5-1.
38]
0.70
40.
23 [-
0.04
-0.3
7]O
steo
pont
in1.
38 [1
.10-
1.73
]0.
761
0.28
[0.0
0-0.
56]
1.14
[1.0
0-1.
30]
0.63
40.
16 [-
0.02
-0.2
9]1.
37 [1
.21-
1.55
]0.
715
0.30
[0.1
4-0.
40]
PCT
1.63
[1.
32-2
.00]
0.77
80.
49 [0
.24-
0.80
]1.
23 [1
.08-
1.38
]0.
644
0.18
[0.0
0-0.
33]
1.40
[1.2
4-1.
60]
0.72
00.
29 [0
.14-
0.46
]Pe
ntra
xin-
31.
77 [
1.41
-2.2
3]0.
781
0.49
[0.0
8-0.
74]
1.23
[1.0
7-1.
40]
0.64
10.
13 [-
0.04
-0.2
6]1.
39 [1
.22-
1.60
]0.
715
0.28
[0.0
9-0.
42]
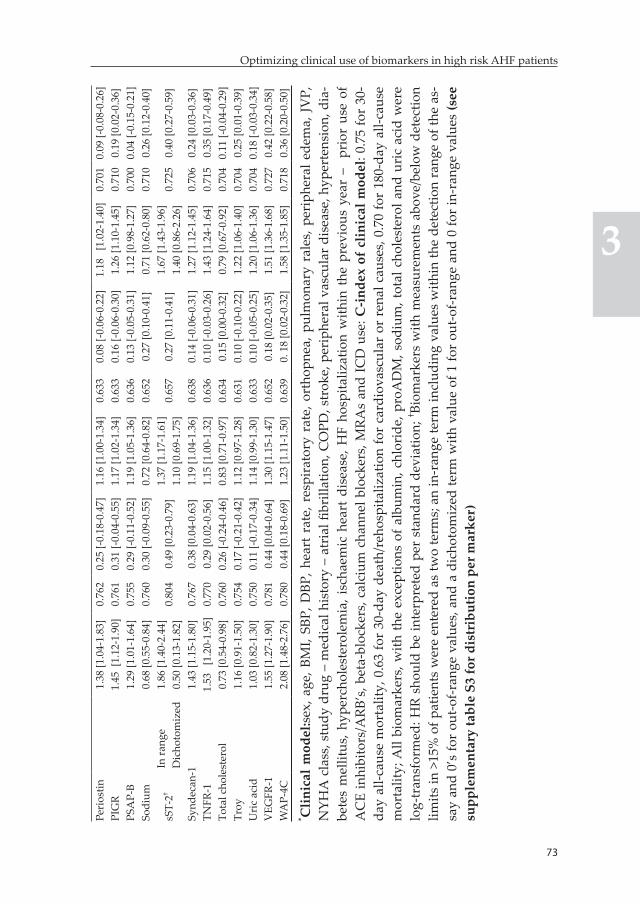
72
Chapter 3
73
Optimizing clinical use of biomarkers in high risk AHF patients
3
Peri
ostin
1.38
[1.0
4-1.
83]
0.76
20.
25 [-
0.18
-0.4
7]1.
16 [1
.00-
1.34
]0.
633
0.08
[-0.
06-0
.22]
1.18
[1
.02-
1.40
]0.
701
0.09
[-0.
08-0
.26]
PIG
R1.
45 [
1.12
-1.9
0]0.
761
0.31
[-0.
04-0
.55]
1.17
[1.0
2-1.
34]
0.63
30.
16 [-
0.06
-0.3
0]1.
26 [1
.10-
1.45
]0.
710
0.19
[0.0
2-0.
36]
PSA
P-B
1.29
[1.0
1-1.
64]
0.75
50.
29 [-
0.11
-0.5
2]1.
19 [1
.05-
1.36
]0.
636
0.13
[-0.
05-0
.31]
1.12
[0.9
8-1.
27]
0.70
00.
04 [-
0.15
-0.2
1]So
dium
0.68
[0.5
5-0.
84]
0.76
00.
30 [-
0.09
-0.5
5]0.
72 [0
.64-
0.82
]0.
652
0.27
[0.1
0-0.
41]
0.71
[0.6
2-0.
80]
0.71
00.
26 [0
.12-
0.40
]
sST-
2†In
rang
e1.
86 [1
.40-
2.44
] 0.
804
0.49
[0.2
3-0.
79]
1.37
[1.1
7-1.
61]
0.65
70.
27 [0
.11-
0.41
]1.
67 [1
.43-
1.96
] 0.
725
0.40
[0.2
7-0.
59]
Dic
hoto
miz
ed0.
50 [0
.13-
1.82
]1.
10 [0
.69-
1.75
]1.
40 [0
.86-
2.26
]Sy
ndec
an-1
1.43
[1.1
5-1.
80]
0.76
70.
38 [0
.04-
0.63
]1.
19 [1
.04-
1.36
]0.
638
0.14
[-0.
06-0
.31]
1.27
[1.1
2-1.
45]
0.70
60.
24 [0
.03-
0.36
]TN
FR-1
1.53
[1
.20-
1.95
]0.
770
0.29
[0.0
2-0.
56]
1.15
[1.0
0-1.
32]
0.63
60.
10 [-
0.03
-0.2
6]1.
43 [1
.24-
1.64
]0.
715
0.35
[0.1
7-0.
49]
Tota
l cho
lest
erol
0.73
[0.5
4-0.
98]
0.76
00.
26 [-
0.24
-0.4
6]0.
83 [0
.71-
0.97
]0.
634
0.15
[0.0
0-0.
32]
0.79
[0.6
7-0.
92]
0.70
40.
11 [-
0.04
-0.2
9]Tr
oy1.
16 [0
.91-
1.50
]0.
754
0.17
[-0.
21-0
.42]
1.12
[0.9
7-1.
28]
0.63
10.
10 [-
0.10
-0.2
2]1.
22 [1
.06-
1.40
]0.
704
0.25
[0.0
1-0.
39]
Uri
c ac
id1.
03 [0
.82-
1.30
]0.
750
0.11
[-0.
17-0
.34]
1.14
[0.9
9-1.
30]
0.63
30.
10 [-
0.05
-0.2
5]1.
20 [1
.06-
1.36
]0.
704
0.18
[-0.
03-0
.34]
VEG
FR-1
1.55
[1.2
7-1.
90]
0.78
10.
44 [0
.04-
0.64
]1.
30 [1
.15-
1.47
]0.
652
0.18
[0.0
2-0.
35]
1.51
[1.3
6-1.
68]
0.72
70.
42 [0
.22-
0.58
]W
AP-
4C2.
08 [1
.48-
2.76
]0.
780
0.44
[0.1
8-0.
69]
1.23
[1.1
1-1.
50]
0.63
90.
18
[0.0
2-0.
32]
1.58
[1.3
5-1.
85]
0.71
80.
36 [0
.20-
0.50
]* C
linic
al m
odel
:sex,
age
, BM
I, SB
P, D
BP, h
eart
rat
e, r
espi
rato
ry r
ate,
ort
hopn
ea, p
ulm
onar
y ra
les,
per
iphe
ral e
dem
a, J
VP,
N
YHA
cla
ss, s
tudy
dru
g –
med
ical
his
tory
– a
tria
l fibr
illat
ion,
CO
PD, s
trok
e, p
erip
hera
l vas
cula
r di
seas
e, h
yper
tens
ion,
dia
-be
tes
mel
litus
, hyp
erch
oles
tero
lem
ia, i
scha
emic
hea
rt d
isea
se, H
F ho
spita
lizat
ion
with
in t
he p
revi
ous
year
–
prio
r us
e of
A
CE
inhi
bito
rs/A
RB’s
, bet
a-bl
ocke
rs, c
alci
um c
hann
el b
lock
ers,
MRA
s an
d IC
D u
se: C
-inde
x of
clin
ical
mod
el: 0
.75
for
30-
day
all-c
ause
mor
talit
y, 0
.63
for
30-d
ay d
eath
/reh
ospi
taliz
atio
n fo
r ca
rdio
vasc
ular
or
rena
l cau
ses,
0.7
0 fo
r 18
0-da
y al
l-cau
se
mor
talit
y; A
ll bi
omar
kers
, with
the
exce
ptio
ns o
f alb
umin
, chl
orid
e, p
roA
DM
, sod
ium
, tot
al c
hole
ster
ol a
nd u
ric
acid
wer
e lo
g-tr
ansf
orm
ed: H
R sh
ould
be
inte
rpre
ted
per
stan
dard
dev
iatio
n; † Bi
omar
kers
with
mea
sure
men
ts a
bove
/bel
ow d
etec
tion
limits
in >
15%
of p
atie
nts
wer
e en
tere
d as
two
term
s; a
n in
-ran
ge te
rm in
clud
ing
valu
es w
ithin
the
dete
ctio
n ra
nge
of th
e as
-sa
y an
d 0’
s fo
r ou
t-of-r
ange
val
ues,
and
a d
icho
tom
ized
term
with
val
ue o
f 1 fo
r ou
t-of-r
ange
and
0 fo
r in
-ran
ge v
alue
s (s
ee
supp
lem
enta
ry ta
ble
S3 fo
r dis
trib
utio
n pe
r mar
ker)
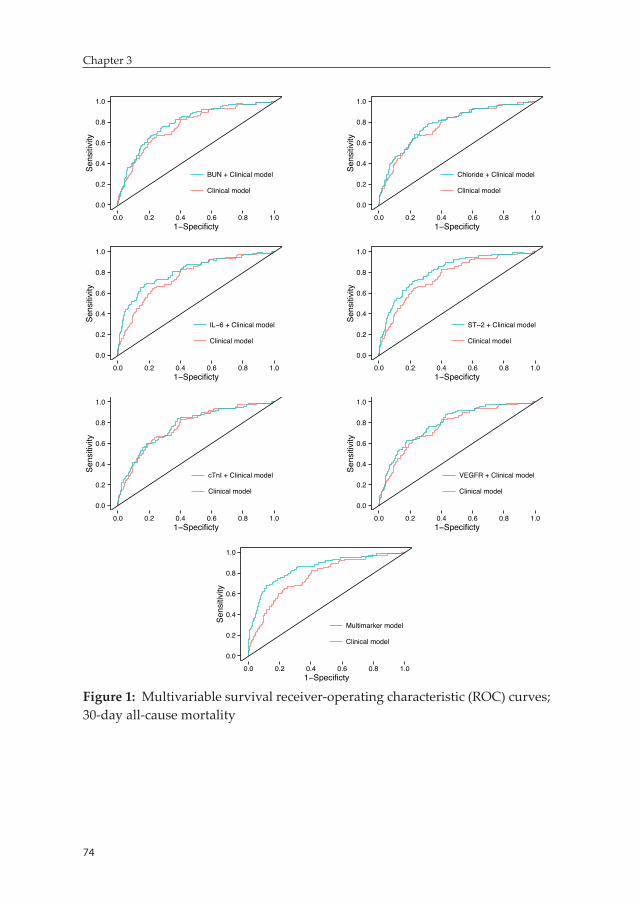
74
Chapter 3
0.0
0.2
0.4
0.6
0.8
1.0
0.0 0.2 0.4 0.6 0.8 1.01−Specificty
Sens
itivi
ty
BUN + Clinical model
Clinical model
0.0
0.2
0.4
0.6
0.8
1.0
0.0 0.2 0.4 0.6 0.8 1.01−Specificty
Sens
itivi
ty
Chloride + Clinical model
Clinical model
0.0
0.2
0.4
0.6
0.8
1.0
0.0 0.2 0.4 0.6 0.8 1.01−Specificty
Sens
itivi
ty
IL−6 + Clinical model
Clinical model
0.0
0.2
0.4
0.6
0.8
1.0
0.0 0.2 0.4 0.6 0.8 1.01−Specificty
Sens
itivi
ty
ST−2 + Clinical model
Clinical model
0.0
0.2
0.4
0.6
0.8
1.0
0.0 0.2 0.4 0.6 0.8 1.01−Specificty
Sens
itivi
ty
cTnI + Clinical model
Clinical model
0.0
0.2
0.4
0.6
0.8
1.0
0.0 0.2 0.4 0.6 0.8 1.01−Specificty
Sens
itivi
ty
VEGFR + Clinical model
Clinical model
0.0
0.2
0.4
0.6
0.8
1.0
0.0 0.2 0.4 0.6 0.8 1.01−Specificty
Sens
itivi
ty
Multimarker model
Clinical model
Figure 1: Multivariable survival receiver-operating characteristic (ROC) curves; 30-day all-cause mortality
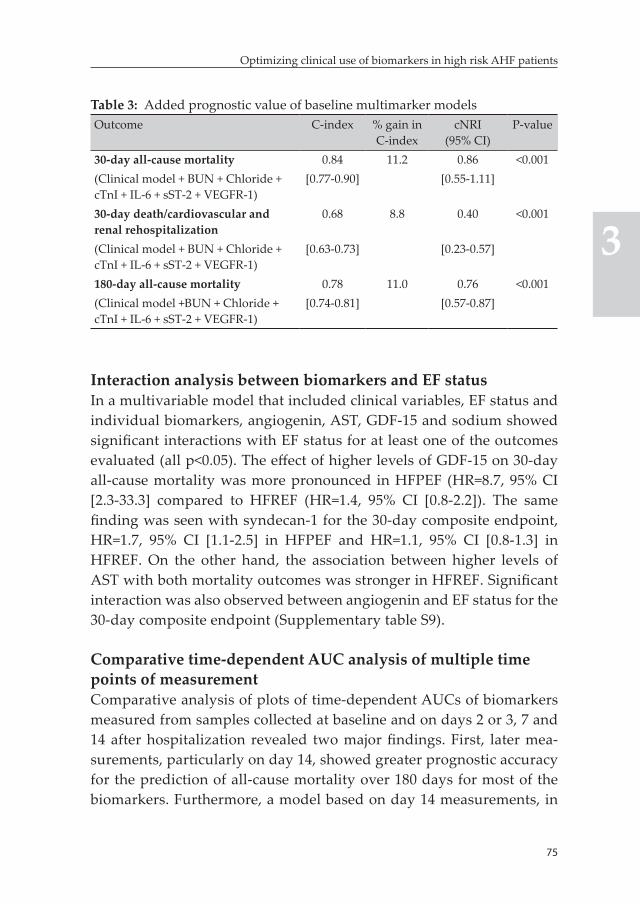
75
Optimizing clinical use of biomarkers in high risk AHF patients
3
Table 3: Added prognostic value of baseline multimarker modelsOutcome C-index % gain in
C-indexcNRI
(95% CI)P-value
30-day all-cause mortality 0.84 11.2 0.86 <0.001(Clinical model + BUN + Chloride + cTnI + IL-6 + sST-2 + VEGFR-1)
[0.77-0.90] [0.55-1.11]
30-day death/cardiovascular and renal rehospitalization
0.68 8.8 0.40 <0.001
(Clinical model + BUN + Chloride + cTnI + IL-6 + sST-2 + VEGFR-1)
[0.63-0.73] [0.23-0.57]
180-day all-cause mortality 0.78 11.0 0.76 <0.001(Clinical model +BUN + Chloride + cTnI + IL-6 + sST-2 + VEGFR-1)
[0.74-0.81] [0.57-0.87]
Interaction analysis between biomarkers and EF statusIn a multivariable model that included clinical variables, EF status and individual biomarkers, angiogenin, AST, GDF-15 and sodium showed significant interactions with EF status for at least one of the outcomes evaluated (all p<0.05). The effect of higher levels of GDF-15 on 30-day all-cause mortality was more pronounced in HFPEF (HR=8.7, 95% CI [2.3-33.3] compared to HFREF (HR=1.4, 95% CI [0.8-2.2]). The same finding was seen with syndecan-1 for the 30-day composite endpoint, HR=1.7, 95% CI [1.1-2.5] in HFPEF and HR=1.1, 95% CI [0.8-1.3] in HFREF. On the other hand, the association between higher levels of AST with both mortality outcomes was stronger in HFREF. Significant interaction was also observed between angiogenin and EF status for the 30-day composite endpoint (Supplementary table S9).
Comparative time-dependent AUC analysis of multiple time points of measurementComparative analysis of plots of time-dependent AUCs of biomarkers measured from samples collected at baseline and on days 2 or 3, 7 and 14 after hospitalization revealed two major findings. First, later mea-surements, particularly on day 14, showed greater prognostic accuracy for the prediction of all-cause mortality over 180 days for most of the biomarkers. Furthermore, a model based on day 14 measurements, in
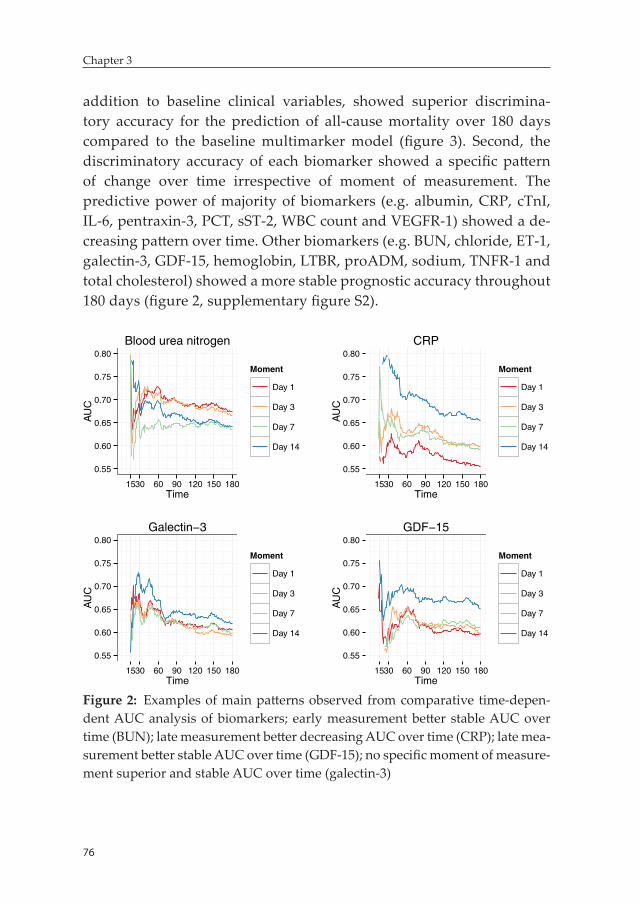
76
Chapter 3
addition to baseline clinical variables, showed superior discrimina-tory accuracy for the prediction of all-cause mortality over 180 days compared to the baseline multimarker model (figure 3). Second, the discriminatory accuracy of each biomarker showed a specific pattern of change over time irrespective of moment of measurement. The predictive power of majority of biomarkers (e.g. albumin, CRP, cTnI, IL-6, pentraxin-3, PCT, sST-2, WBC count and VEGFR-1) showed a de-creasing pattern over time. Other biomarkers (e.g. BUN, chloride, ET-1, galectin-3, GDF-15, hemoglobin, LTBR, proADM, sodium, TNFR-1 and total cholesterol) showed a more stable prognostic accuracy throughout 180 days (figure 2, supplementary figure S2).
0.55
0.60
0.65
0.70
0.75
0.80
1530 60 90 120 150 180Time
AU
C
Moment
Day 1
Day 3
Day 7
Day 14
Blood urea nitrogen
0.55
0.60
0.65
0.70
0.75
0.80
1530 60 90 120 150 180Time
AU
C
Moment
Day 1
Day 3
Day 7
Day 14
CRP
0.55
0.60
0.65
0.70
0.75
0.80
1530 60 90 120 150 180Time
AU
C
Moment
Day 1
Day 3
Day 7
Day 14
Galectin−3
0.55
0.60
0.65
0.70
0.75
0.80
1530 60 90 120 150 180Time
AU
C
Moment
Day 1
Day 3
Day 7
Day 14
GDF−15
Figure 2: Examples of main patterns observed from comparative time-depen-dent AUC analysis of biomarkers; early measurement better stable AUC over time (BUN); late measurement better decreasing AUC over time (CRP); late mea-surement better stable AUC over time (GDF-15); no specific moment of measure-ment superior and stable AUC over time (galectin-3)
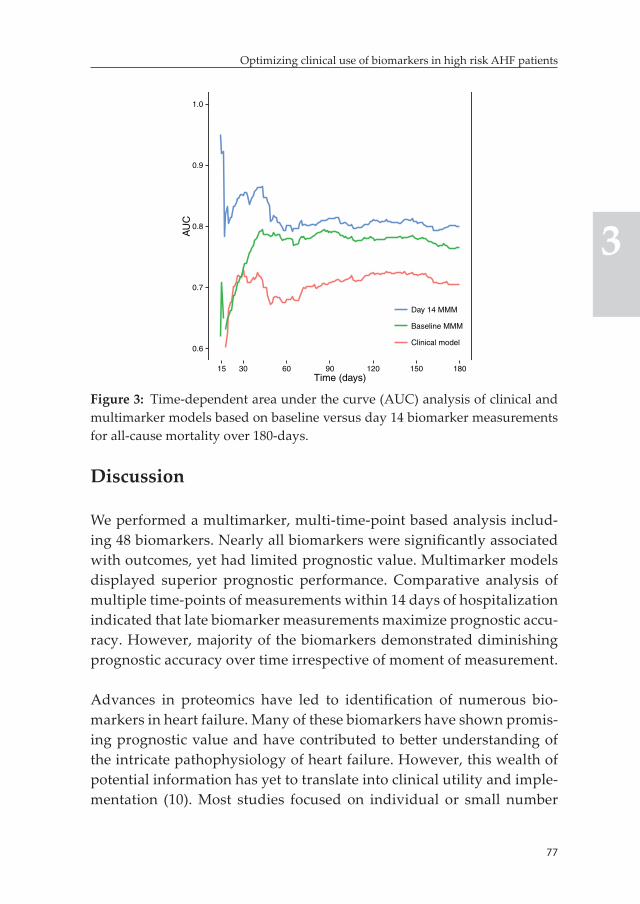
77
Optimizing clinical use of biomarkers in high risk AHF patients
3
Discussion
We performed a multimarker, multi-time-point based analysis includ-ing 48 biomarkers. Nearly all biomarkers were significantly associated with outcomes, yet had limited prognostic value. Multimarker models displayed superior prognostic performance. Comparative analysis of multiple time-points of measurements within 14 days of hospitalization indicated that late biomarker measurements maximize prognostic accu-racy. However, majority of the biomarkers demonstrated diminishing prognostic accuracy over time irrespective of moment of measurement.
Advances in proteomics have led to identification of numerous bio-markers in heart failure. Many of these biomarkers have shown promis-ing prognostic value and have contributed to better understanding of the intricate pathophysiology of heart failure. However, this wealth of potential information has yet to translate into clinical utility and imple-mentation (10). Most studies focused on individual or small number
0.6
0.7
0.8
0.9
1.0
15 30 60 90 120 150 180Time (days)
AU
C
Day 14 MMM
Baseline MMM
Clinical model
Figure 3: Time-dependent area under the curve (AUC) analysis of clinical and multimarker models based on baseline versus day 14 biomarker measurements for all-cause mortality over 180-days.
78
Chapter 3
of selected biomarkers, an approach unlikely to be adequate given the complex pathophysiology of AHF. Consequently, there is a growing interest in multimarker risk stratification strategies based on ‘super-families’ of biomarkers reflecting specific but diverse pathophysiologic pathways (8, 24, 25,27). Use of these ‘superfamilies’ to identify patients with activated disease pathways has been suggested as a way to enhance the accuracy of risk stratification and provide insight into underlying processes. However, evidence on the best combination of biomarkers and added value of a multimarker-based risk stratification approach in AHF remains scarce. Development of a multimarker risk stratification tool requires comparative assessment of the prognostic value of a broad panel of biomarkers in a large cohort of AHF patients (8).
In this study, we evaluated the prognostic value of 48 biomarkers measured within 24 hours of presentation – representing a broad range of pathophysiologic pathways – for predicting outcomes in a high risk AHF population. This is the first report on the prognostic value in AHF for circulating levels of many of these biomarkers – including angio-genin, ESAM, LTBR, mesothelin, neuropilin, osteopontin, pentraxin-3, periostin, PIGR, prosaposin B, syndecan-1, TNFR-1, Troy, VEGFR-1 and WAP-4c. A brief overview of available evidence in acute and chronic heart failure for all measured novel markers is presented in the supplementary material.
Nearly all (n=46) of the biomarkers were significantly associated with at least one of the outcomes, although prognostic performance was limited for most. In addition, the majority of biomarkers showed significant additive value on top of a clinical model that encompassed several variables related to patient characteristics at presentation, medi-cal history and prior medication use. However, the greatest prognostic performance was achieved with multimarker models that included multiple biomarkers selected from different clusters in addition to the clinical prognosticators.
Several studies indicated that risk of complications after hospitaliza-tion for AHF is greatest during the first month after discharge (4, 5).
79
Optimizing clinical use of biomarkers in high risk AHF patients
3
Multimarker models improve short-term risk stratification and can accurately identify more vulnerable patients as early as hospital admis-sion or early phase of hospitalization. This could allow early initiation of more intensive, tailored treatment and monitoring strategies, poten-tially improving outcomes. Krumholz et al highlighted the importance of additional factors related to hospitalization and the early recovery period after discharge (e.g. sleep disturbance, pain and stress, malnutri-tion, physical inactivity) as determinants of vulnerability during the post-hospital discharge phase (5). Accurate risk assessment early dur-ing hospitalization can be crucial for the early detection and prevention of these factors, which may lead to improved outcome. Other potential areas of use for multimarker models as objective and highly accurate risk stratification tools include more tailored decision making regard-ing hospital discharge (for instance, delayed discharge of high risk patients for inhospital monitoring) and optimization of post-discharge care. However, we noted that prediction of non-fatal outcomes with biomarkers is challenging. Cleland et al also reported the same finding in a previous analysis of the same dataset using readily available clini-cal and laboratory parameters. These highlight the inadequacy of the sole utilization of clinical and physiologic variables for the prediction of relapse and readmission and further emphasize the importance of evaluation of other factors such as response to treatment, quality of care, healthcare organization and social support for improved ascer-tainment of risk of rehospitalization (7).
Interestingly, some of the biomarkers, particularly angiogenin, AST, GDF-15 and syndecan-1, showed significant differential predictive val-ue (for at least one of the outcomes) in HFREF versus HFPEF patients. These biomarkers are involved in several of the major pathophysiologic pathways involved in heart failure including angiogenesis, endothelial dysfunction, inflammation and myocardial fibrosis and remodeling among others. The finding of differential predictive value for these biomarkers in HFREF compared to HFPEF further supports the exist-ing evidence suggesting the presence of pathophysiologic differences between the two entities (29). This may also highlight potential differ-ences in the role of associated pathophysiologic domains in terms of
80
Chapter 3
determining outcome between HFREF and HFPEF. These observations might have important prognostic and therapeutic implications and merit further research into the field.
A second aim of this study was to determine how well different mo-ments of measurements of a biomarker predicted clinical outcome over time. Subsequently, we compared the prognostic accuracy of 43 biomarkers measured at baseline and on days 2 or 3, 7 and 14, in a time-dependent AUC analysis. Late measurements of biomarkers, particularly on day 14, showed greater accuracy for the prediction of all-cause mortality over the course of six months, with the exception of markers like BUN and galectin-3 among few others. BUN is the only biomarker for which earlier measurements clearly demonstrated better prognostic accuracy. Galectin-3 was the most notable biomarker among the group of biomarkers for which no specific moment of measurement displayed clearly superior prognostic accuracy. This, in line with previ-ous evidence, highlights the stable nature of the marker (28). Regarding multimarker models, a model containing the best performing biomark-ers measured on day 14, in addition to clinical prognosticators, showed greater discriminatory accuracy compared to the baseline model.
Another interesting finding from the time-dependent AUC analysis was that the prognostic value of biomarkers could be influenced by the prediction time under consideration. Two distinct patterns of change of AUCs over time were observed irrespective of moment of measurement of biomarkers. Some of the most promising biomarkers like CRP, cTnI, IL-6, procalcitonin, sST-2, pentraxin-3, VEGFR-1 and WAP-4c – displayed greater accuracy in the short-term, but prognostic accuracy substantially declined over time. On the other hand, BUN, ET-1, proADM and majority of the fibrosis and remodelling markers – including galectin-3, syndecan-1, osteopontin and TNFR-1 – showed a more stable discriminatory accuracy over time.
These findings have important implications for maximizing the prog-nostic utility of biomarkers in AHF. In general, biomarker measure-ments acquired late during hospitalization or the early recovery period
81
Optimizing clinical use of biomarkers in high risk AHF patients
3
appear to be better for predicting survival within the first 6 months of hospitalization. Although further evidence is needed, this suggests that measuring biomarkers at hospital discharge and during the early post-discharge period might be preferable if the goal is optimizing post-discharge care and risk management in an outpatient setting. Along these lines, repeated measurement of some of the most promising bio-markers – including CRP, cTnI, IL-6, procalcitonin, pentraxin-3, sST-2, VEGFR-1 and WAP-4c – within 60-90 days of initial hospitalization may be needed to sustain prognostic accuracy in the long-term. Interest-ingly, there appears to be an association between pathophysiologic clustering of biomarkers and patterns of change in prognostic accuracy over time. For instance, markers for systemic inflammation have excel-lent short-term discriminatory accuracy, while fibrosis and remodelling markers show more stable longer term accuracy. This observation war-rants further investigation as it could enhance our understanding of the pathophysiologic processes that contribute to poor outcome in AHF.
Strengths and limitationsThe enormous number of both established and novel biomarkers evalu-ated at multiple time-points in a large, well-characterized cohort of AHF patients makes this study unique in its field. The results should be interpreted with some caution, however, as we performed a post hoc analysis of the PROTECT trial which included AHF patients with significantly elevated BNP/NT-proBNP levels and mild to moderate renal dysfunction. This preselects higher risk AHF patients and may influence the generalizability of prognostic performance of individual and combination of biomarkers observed in the current analysis to the broader AHF patient population. It is also well known that generaliz-ability of findings from a clinical trial population can be limited as a set of stringent criteria is used to define included patients. Subsequently, a major limitation of our study is that results were not evaluated in an independent external validation cohort of AHF patients.
Another major limitation is the fact that we utilized screening NT-proB-NP, which in many cases, was measured using a point-of-care device for which quantification of levels above 3000 pg/ml was not performed.
82
Chapter 3
Moreover, significant elevation of natriuretic peptide levels was one of the main inclusion criteria in the PROTECT trial. These factors significantly contribute to the modest prognostic performance of the biomarker observed in this study compared to the available evidence in the literature and can partially explain the failure of NT-proBNP to be included in the multimarker panel we identified. Natriuretic peptides, BNP and NT-proBNP in particular, are by far the most extensively studied and more commonly used prognostic biomarkers in AHF. Therefore, the drawback of the current study related to the NT-proBNP assessment should be given due consideration while interpreting our main findings.
An additional limitation of our study is that baseline EF data was avail-able only in less than half of patients included in the PROTECT trial (n=975, out of which only 277 had HFPEF). This significantly limits the statistical power of the interaction analysis we performed, potentially resulting in false negative findings. Furthermore, specific levels of cre-atinine, hemoglobin, potassium and, to some extent, serum albumin during screening were used define inclusion and exclusion criteria in the PROTECT trial. In addition, systolic blood pressure is included in the definition of exclusion criteria. This may influence association of these variables with outcomes as, by definition, certain levels from the usual range of values of these variables in AHF patients have been excluded from the analysis.
Future stepsSeveral steps are needed in the future before the routine implemen-tation of multimarker models as objective and highly accurate risk stratification tools in daily practice is considered. First, a simple, exter-nally validated multimarker risk score with clear clinical implications of different risk categories should be developed. Another step (may be the most important) should be evaluation of effectiveness (and even cost-effectiveness) of risk-guided patient management strategies in a randomized-controlled trial. Last but not least, efforts to develop mul-timarker assay kits should be strengthened as this can greatly enhance
83
Optimizing clinical use of biomarkers in high risk AHF patients
3
the feasibility and cost-effectiveness of multimarker risk stratification strategy in AHF.
Conclusion
Many biomarkers predict outcomes in high risk AHF patients. How-ever, the best results are attained with multimarker models combining markers reflecting diverse pathophysiologic pathways involved in AHF and known clinical prognosticators. Additionally, later measurement of biomarkers during hospitalization or shortly after discharge is gener-ally preferable if our goal is prediction of longer term outcomes and, for majority of biomarkers repeated measurement after 2-3 months may be needed to sustain discriminatory accuracy. In conclusion, multimarker models improve risk stratification in high risk AHF patients and may be the key to developing much needed personalized treatment strategies.
References 1. Adams KF,Jr, Fonarow GC, Emerman CL, LeJemtel TH, Costanzo MR,
Abraham WT, Berkowitz RL, Galvao M, Horton DP, ADHERE Scientific Advisory Committee and Investigators. Characteristics and outcomes of patients hospitalized for heart failure in the United States: rationale, design, and preliminary observations from the first 100,000 cases in the Acute Decompensated Heart Failure National Registry (ADHERE). Am Heart J 2005;149:209-216.
2. Cleland JG, Swedberg K, Follath F, Komajda M, Cohen-Solal A, Aguilar JC, Dietz R, Gavazzi A, Hobbs R, Korewicki J, Madeira HC, Moiseyev VS, Preda I, van Gilst WH, Widimsky J, Freemantle N, Eastaugh J, Mason J, Study Group on Diagnosis of the Working Group on Heart Failure of the European Society of Cardiology. The EuroHeart Failure survey programme-- a survey on the quality of care among patients with heart failure in Europe. Part 1: patient characteristics and diagnosis. Eur Heart J 2003;24:442-463.
3. Felker GM, Leimberger JD, Califf RM, Cuffe MS, Massie BM, Adams KF,Jr, Gheorghiade M, O’Connor CM. Risk stratification after hospitalization for decompensated heart failure. J Card Fail 2004;10:460-466.
4. Solomon SD, Dobson J, Pocock S, Skali H, McMurray JJ, Granger CB, Yu-suf S, Swedberg K, Young JB, Michelson EL, Pfeffer MA, Candesartan
84
Chapter 3
in Heart failure: Assessment of Reduction in Mortality and morbidity (CHARM) Investigators. Influence of nonfatal hospitalization for heart failure on subsequent mortality in patients with chronic heart failure. Circulation 2007;116:1482-1487.
5. Krumholz HM. Post-hospital syndrome--an acquired, transient condition of generalized risk. N Engl J Med 2013;368:100-102.
6. Ouwerkerk W, Voors AA, Zwinderman AH. Factors influencing the predic-tive power of models for predicting mortality and/or heart failure hospi-talization in patients with heart failure. JACC Heart Fail 2014;2:429-436.
7. Cleland JG, Chiswell K, Teerlink JR, Stevens S, Fiuzat M, Givertz MM, Davison BA, Mansoor GA, Ponikowski P, Voors AA, Cotter G, Metra M, Massie BM, O’Connor CM. Predictors of postdischarge outcomes from information acquired shortly after admission for acute heart failure: a report from the Placebo-Controlled Randomized Study of the Selective A1 Adenosine Receptor Antagonist Rolofylline for Patients Hospitalized With Acute Decompensated Heart Failure and Volume Overload to Assess Treatment Effect on Congestion and Renal Function (PROTECT) Study. Circ Heart Fail 2014;7:76-87.
8. Braunwald E. Biomarkers in heart failure. N Engl J Med 2008;358:2148-2159. 9. Chowdhury P, Kehl D, Choudhary R, Maisel A. The use of biomarkers in
the patient with heart failure. Curr Cardiol Rep 2013;15:372-013-0372-4. 10. Schmitter D, Cotter G, Voors AA. Clinical use of novel biomarkers in heart
failure: towards personalized medicine. Heart Fail Rev 2014;19:369-381. 11. van Kimmenade RR, Januzzi JL,Jr. Emerging biomarkers in heart failure.
Clin Chem 2012;58:127-138. 12. Pascual-Figal DA, Manzano-Fernandez S, Boronat M, Casas T, Garrido IP,
Bonaque JC, Pastor-Perez F, Valdes M, Januzzi JL. Soluble ST2, high-sensitivity troponin T- and N-terminal pro-B-type natriuretic peptide: complementary role for risk stratification in acutely decompensated heart failure. Eur J Heart Fail 2011;13:718-725.
13. Lassus J, Gayat E, Mueller C, Peacock WF, Spinar J, Harjola VP, van Kim-menade R, Pathak A, Mueller T, Disomma S, Metra M, Pascual-Figal D, Laribi S, Logeart D, Nouira S, Sato N, Potocki M, Parenica J, Collet C, Cohen-Solal A, Januzzi JL,Jr, Mebazaa A, GREAT-Network. Incremental value of biomarkers to clinical variables for mortality prediction in acute-ly decompensated heart failure: the Multinational Observational Cohort on Acute Heart Failure (MOCA) study. Int J Cardiol 2013;168:2186-2194.
14. Maisel A, Mueller C, Nowak R, Peacock WF, Landsberg JW, Ponikowski P, Mockel M, Hogan C, Wu AH, Richards M, Clopton P, Filippatos GS, Di Somma S, Anand I, Ng L, Daniels LB, Neath SX, Christenson R, Potocki M, McCord J, Terracciano G, Kremastinos D, Hartmann O, von Haehling S, Bergmann A, Morgenthaler NG, Anker SD. Mid-region pro-hormone markers for diagnosis and prognosis in acute dyspnea: results from
85
Optimizing clinical use of biomarkers in high risk AHF patients
3
the BACH (Biomarkers in Acute Heart Failure) trial. J Am Coll Cardiol 2010;55:2062-2076.
15. Potocki M, Breidthardt T, Reichlin T, Morgenthaler NG, Bergmann A, Noveanu M, Schaub N, Uthoff H, Freidank H, Buser L, Bingisser R, Christ M, Mebazaa A, Mueller C. Midregional pro-adrenomedullin in addition to b-type natriuretic peptides in the risk stratification of patients with acute dyspnea: an observational study. Crit Care 2009;13:R122.
16. Shah RV, Chen-Tournoux AA, Picard MH, van Kimmenade RR, Januzzi JL. Galectin-3, cardiac structure and function, and long-term mortality in patients with acutely decompensated heart failure. Eur J Heart Fail 2010;12:826-832.
17. van Kimmenade RR, Januzzi JL,Jr, Ellinor PT, Sharma UC, Bakker JA, Low AF, Martinez A, Crijns HJ, MacRae CA, Menheere PP, Pinto YM. Utility of amino-terminal pro-brain natriuretic peptide, galectin-3, and apelin for the evaluation of patients with acute heart failure. J Am Coll Cardiol 2006;48:1217-1224.
18. Maisel AS, Mueller C, Fitzgerald R, Brikhan R, Hiestand BC, Iqbal N, Clopton P, van Veldhuisen DJ. Prognostic utility of plasma neutrophil gelatinase-associated lipocalin in patients with acute heart failure: the NGAL EvaLuation Along with B-type NaTriuretic Peptide in acutely de-compensated heart failure (GALLANT) trial. Eur J Heart Fail 2011;13:846-851.
19. Weatherley BD, Cotter G, Dittrich HC, DeLucca P, Mansoor GA, Bloomfield DM, Ponikowski P, O’Connor CM, Metra M, Massie BM, PROTECT Steering Committee, Investigators, and Coordinators. Design and ratio-nale of the PROTECT study: a placebo-controlled randomized study of the selective A1 adenosine receptor antagonist rolofylline for patients hospitalized with acute decompensated heart failure and volume over-load to assess treatment effect on congestion and renal function. J Card Fail 2010;16:25-35.
20. Massie BM, O’Connor CM, Metra M, Ponikowski P, Teerlink JR, Cotter G, Weatherley BD, Cleland JG, Givertz MM, Voors A, DeLucca P, Mansoor GA, Salerno CM, Bloomfield DM, Dittrich HC, PROTECT Investigators and Committees. Rolofylline, an adenosine A1-receptor antagonist, in acute heart failure. N Engl J Med 2010;363:1419-1428.
21. Rahimi K, Bennett D, Conrad N, Williams TM, Basu J, Dwight J, Wood-ward M, Patel A, McMurray J, MacMahon S. Risk prediction in patients with heart failure: a systematic review and analysis. JACC Heart Fail 2014;2:440-446.
22. Pencina MJ, D’Agostino RB S, Steyerberg EW. Extensions of net reclassifica-tion improvement calculations to measure usefulness of new biomarkers. Stat Med 2011;30:11-21.
86
Chapter 3
23. Manhenke C, Orn S, von Haehling S, Wollert KC, Ueland T, Aukrust P, Voors AA, Squire I, Zannad F, Anker SD, Dickstein K. Clustering of 37 circulating biomarkers by exploratory factor analysis in patients follow-ing complicated acute myocardial infarction. Int J Cardiol 2013;166:729-735.
24. Wang TJ. Assessing the role of circulating, genetic, and imaging biomarkers in cardiovascular risk prediction. Circulation 2011;123:551-565.
25. Allen LA, Felker GM. Multi-marker strategies in heart failure: clinical and statistical approaches. Heart Fail Rev 2010;15:343-349.
26. Heagerty PJ, Lumley T, Pepe MS. Time-dependent ROC curves for censored survival data and a diagnostic marker. Biometrics 2000;56:337-344.
27. Bohm M, Voors AA, Ketelslegers JM, Schirmer SH, Turgonyi E, Bramlage P, Zannad F. Biomarkers: optimizing treatment guidance in heart failure. Clin Res Cardiol 2011;100:973-981.
28. Wu AH, Wians F, Jaffe A. Biological variation of galectin-3 and soluble ST2 for chronic heart failure: implication on interpretation of test results. Am Heart J 2013;165:995-999.
29. Quiroz R, Doros G, Shaw P, Liang CS, Gauthier DF, Sam F. Comparison of characteristics and outcomes of patients with heart failure preserved ejection fraction versus reduced left ventricular ejection fraction in an urban cohort. Am J Cardiol 2014;113:691-696.
87
Optimizing clinical use of biomarkers in high risk AHF patients
3
Supplementary material
Laboratory methods
Alere biomarker panelMicrotiter sandwich ELISAs were performed on serum samples in 384-well microtiter plates. A Tecan was used for all liquid handling steps and to read the plates. Samples were stored at -70°C, thawed at 37° C and processed at room temperature. Each plate included an 8-point calibration curve prepared with donor plasma, including a neutraliz-ing antibody to correct for endogenous antigens. Dilution series were performed and calibrated as necessary for samples that fell outside the assay range.
Multiplexed bead-based immunoassays were performed on serum samples in 384-well microtiter plates, using primary antibodies con-jugated to modified paramagnetic Luminex® beads (Radix Biosolu-tions) for each assay. Secondary antibodies (for sandwich assays) or antigens (competitive assays) were used. Streptavidin-R-Phycoerythrin (SA-RPE: Prozyme PJ31S) was used to generate fluorescent signals. An 8-point calibration curve was created using samples from healthy donors, including a free antibody to neutralize any endogenous antigen present. Plates were stored at -70°C, and assays were performed at room temperature. The bead-based antibody solution was added to a plate, then samples were added from the source plate, mixed and incubated. Separate plates were used for sandwich and competitive assays. A Lu-minex® LX200 reader was used to read the plate.
Singulex biomarker panelKIM-1, ET-1, IL-6 and cTnI were assayed in plasma samples using SMC™ technology (RUO, Erenna® Immunoassay System, Singulex, Inc). This high sensitivity technology utilizes paramagnetic microparticles (MP) as the solid phase format in combination with single-molecule count-ing. In the Erenna system, the immunoassay complex formed on the MP surface results in the release of fluorescently labeled detection anti-body. The resulting solution is sipped into a 100 μm flow capillary and
88
Chapter 3
photons are counted, via confocal microscopy, as they pass through a 2 μm interrogation space. Details of the SMCTM immunoassay technology have been described previously (217).
Inclusion and exclusion criteriaSeveral inclusion and exclusion criteria were utilized in the PROTECT trial. Some of these criteria involve biomarkers and clinical variables evaluated in this study and may influence our findings. These are pro-vided in supplementary table S1.
Supplementary table S1: Inclusion and exclusion criteria* of the PROTECT trial (only criteria directly relevant to the current study are provided)Inclusion criteria Exclusion criteriaBNP ≥ 500 pg/mL or NT-pro-BNP ≥ 2000 pg/mL Serum potassium <3.5 mEq/L
(3.0-3.4 mEq/L will be allowed if parenteral supplemental potassium is being administered)
Impaired renal function defined as a creatinine clearance on admission between 20 and 80 mL/min using the Cockcroft-Gault equation for estimating creatinine clearance (corrected for height in edematous or obese subjects ≥100 kg)
Known hepatic impairment (total bilirubin >3 mg/dL, albumin <2.8 mg/dL, or increased ammonia levels if performed)
Systolic blood pressure ≥95 mm Hg (subjects with a systolic blood pressure of 90 to 94 mm Hg at randomization may be included if their usual systolic blood pressure measurements are consistently within this range while clinically stable)
Hgb <8 g/dL, or Hct <25%, or the need for a blood transfusion
Systolic blood pressure ≥160 mm Hg at randomization
* previously published (Weatherely et al , J Card Fail 2010;16:25-35)
Principal component analysisOne of the main methodological challenges in developing multi-marker models is multicollinearity among markers resulting from interactions between underlying pathophysiologic processes and common mecha-nisms of clearance, such as renal filtration (1). It has been showed that average correlation between markers is a key determinant of improve-
89
Optimizing clinical use of biomarkers in high risk AHF patients
3
ment in the C-index attained by a combination of biomarkers – the higher the correlation the lower the gain (216). We performed explor-atory factor analysis to address multicollinearity. Exploratory factor analysis is a technique that groups highly collinear variables into one cluster, labeled as a ‘factor’. It aids the process of identification of inde-pendent biologically plausible clusters of biomarkers that can be used as a platform to identify ‘superfamilies’ of biomarkers for multimarker models. Overall sampling adequacy was tested with the Kaiser-Meyer-Olkin test, while measures of sampling adequacy (MSA) were assessed for individual biomarkers (MSA>0.5 is generally considered adequate and most biomarkers had MSA>0.60). A scree plot was employed to identify the appropriate number of factors to be extracted. Factor analy-sis was then performed based on the principal component analysis and factors were orthogonally rotated with the Varimax method to facilitate interpretation. A biomarker was considered to make a definitive con-tribution to a factor if its factor loading was greater than 0.5, i.e. the biomarker should explain at least 25% of the variance in the factor, as proposed by Manhenke et al (1).
Calculation and interpretation of cNRIThe cNRI is a category-independent metric that quantifies the amount of correct change in model-based predicted probabilities obtained by adding a biomarker to an established model. It is comprised of two components; event NRI and non-event NRI. Event NRI represents the net percentage of persons with the event of interest correctly assigned a higher predicted risk. It is calculated as;
Probability (higher|event) - Probability (lower|event) , which is equivalent to
(Number of events with increased predicted risk - Number of events with decreased predicted risk)/number of events
Non-event NRI, on the other hand, represents the net percentage of per-sons without the event of interest correctly assigned a lower predicted risk. It is calculated as;
90
Chapter 3
Probability (lower|nonevent) - Probability(higher|nonevent) , which is equivalent to
(Number of nonevents with decreased predicted risk -Number of nonevents with increased predicted risk)/number of nonevents
The overall cNRI is hence the sum of the net percentages of persons with and without the event of interest correctly assigned a different predicted risk. It can theoretically range from -2 to 2. Refer to Leening et al (Ann Intern Med. 2014;160:122-131) for details on the calculation, interpretation and controversies surrounding the cNRI.
Time-dependent AUC analysisComparative analysis of discriminatory accuracy of biomarker mea-surements obtained at baseline and days 2 or 3, 7 and 14 was performed. Time-dependent AUCs were estimated at different time-points within 180 days of index hospitalization based on the survival ROC method proposed by Heagerty et al (R package survivalROC was utilized) (218) and were plotted against time through 180 days. First, separate Cox-proportional hazards models were fit for the different moments of measurement of each biomarker. Estimations of the linear predictor from each model was then performed. The linear predictor was utilized as a marker in the survivalROC function to perform estimations of time-dependent AUCs. Comparison of discriminatory accuracy of different moments of measurement for an individual biomarker and assessment of pattern of change in prognostic accuracy over time were performed with visual inspection of plots of AUCs against time.
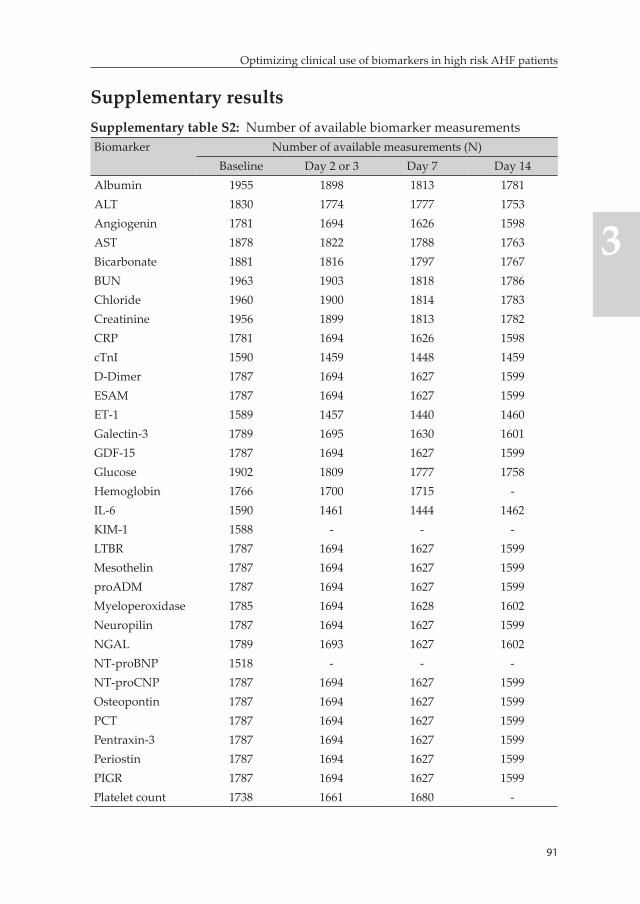
91
Optimizing clinical use of biomarkers in high risk AHF patients
3
Supplementary resultsSupplementary table S2: Number of available biomarker measurementsBiomarker Number of available measurements (N)
Baseline Day 2 or 3 Day 7 Day 14Albumin 1955 1898 1813 1781ALT 1830 1774 1777 1753Angiogenin 1781 1694 1626 1598AST 1878 1822 1788 1763Bicarbonate 1881 1816 1797 1767BUN 1963 1903 1818 1786Chloride 1960 1900 1814 1783Creatinine 1956 1899 1813 1782CRP 1781 1694 1626 1598cTnI 1590 1459 1448 1459D-Dimer 1787 1694 1627 1599ESAM 1787 1694 1627 1599ET-1 1589 1457 1440 1460Galectin-3 1789 1695 1630 1601GDF-15 1787 1694 1627 1599Glucose 1902 1809 1777 1758Hemoglobin 1766 1700 1715 -IL-6 1590 1461 1444 1462KIM-1 1588 - - -LTBR 1787 1694 1627 1599Mesothelin 1787 1694 1627 1599proADM 1787 1694 1627 1599Myeloperoxidase 1785 1694 1628 1602Neuropilin 1787 1694 1627 1599NGAL 1789 1693 1627 1602NT-proBNP 1518 - - -NT-proCNP 1787 1694 1627 1599Osteopontin 1787 1694 1627 1599PCT 1787 1694 1627 1599Pentraxin-3 1787 1694 1627 1599Periostin 1787 1694 1627 1599PIGR 1787 1694 1627 1599Platelet count 1738 1661 1680 -
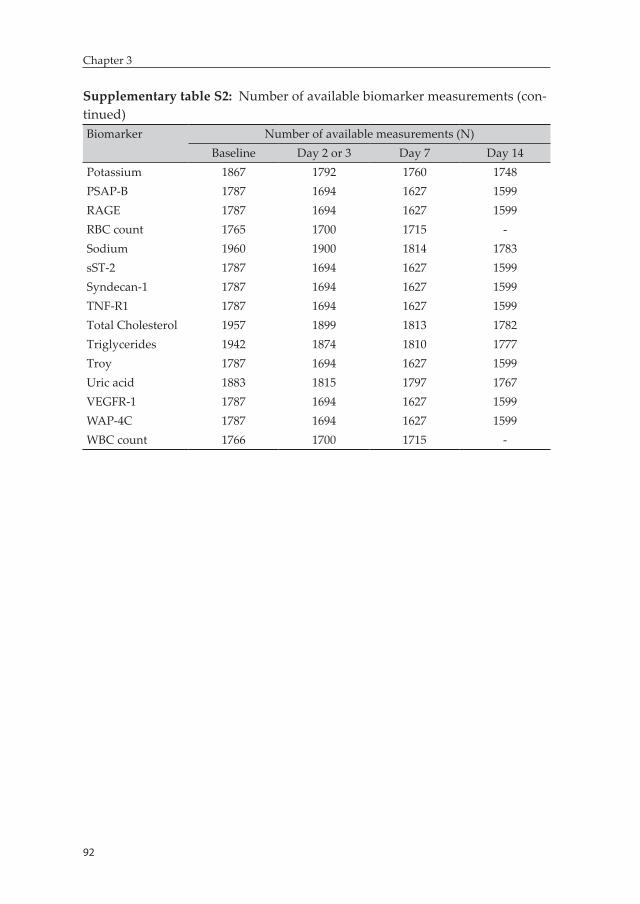
92
Chapter 3
Supplementary table S2: Number of available biomarker measurements (con-tinued)Biomarker Number of available measurements (N)
Baseline Day 2 or 3 Day 7 Day 14Potassium 1867 1792 1760 1748PSAP-B 1787 1694 1627 1599RAGE 1787 1694 1627 1599RBC count 1765 1700 1715 -Sodium 1960 1900 1814 1783sST-2 1787 1694 1627 1599Syndecan-1 1787 1694 1627 1599TNF-R1 1787 1694 1627 1599Total Cholesterol 1957 1899 1813 1782Triglycerides 1942 1874 1810 1777Troy 1787 1694 1627 1599Uric acid 1883 1815 1797 1767VEGFR-1 1787 1694 1627 1599WAP-4C 1787 1694 1627 1599WBC count 1766 1700 1715 -
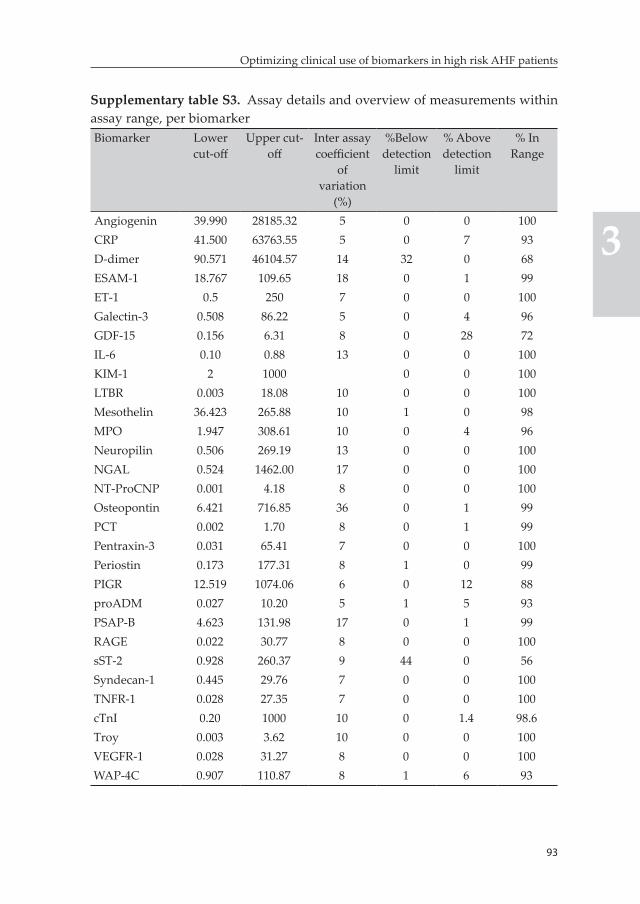
93
Optimizing clinical use of biomarkers in high risk AHF patients
3
Supplementary table S3. Assay details and overview of measurements within assay range, per biomarkerBiomarker Lower
cut-offUpper cut-
offInter assay coefficient
of variation
(%)
%Below detection
limit
% Above detection
limit
% In Range
Angiogenin 39.990 28185.32 5 0 0 100CRP 41.500 63763.55 5 0 7 93D-dimer 90.571 46104.57 14 32 0 68ESAM-1 18.767 109.65 18 0 1 99ET-1 0.5 250 7 0 0 100Galectin-3 0.508 86.22 5 0 4 96GDF-15 0.156 6.31 8 0 28 72IL-6 0.10 0.88 13 0 0 100KIM-1 2 1000 0 0 100LTBR 0.003 18.08 10 0 0 100Mesothelin 36.423 265.88 10 1 0 98MPO 1.947 308.61 10 0 4 96Neuropilin 0.506 269.19 13 0 0 100NGAL 0.524 1462.00 17 0 0 100NT-ProCNP 0.001 4.18 8 0 0 100Osteopontin 6.421 716.85 36 0 1 99PCT 0.002 1.70 8 0 1 99Pentraxin-3 0.031 65.41 7 0 0 100Periostin 0.173 177.31 8 1 0 99PIGR 12.519 1074.06 6 0 12 88proADM 0.027 10.20 5 1 5 93PSAP-B 4.623 131.98 17 0 1 99RAGE 0.022 30.77 8 0 0 100sST-2 0.928 260.37 9 44 0 56Syndecan-1 0.445 29.76 7 0 0 100TNFR-1 0.028 27.35 7 0 0 100cTnI 0.20 1000 10 0 1.4 98.6Troy 0.003 3.62 10 0 0 100VEGFR-1 0.028 31.27 8 0 0 100WAP-4C 0.907 110.87 8 1 6 93
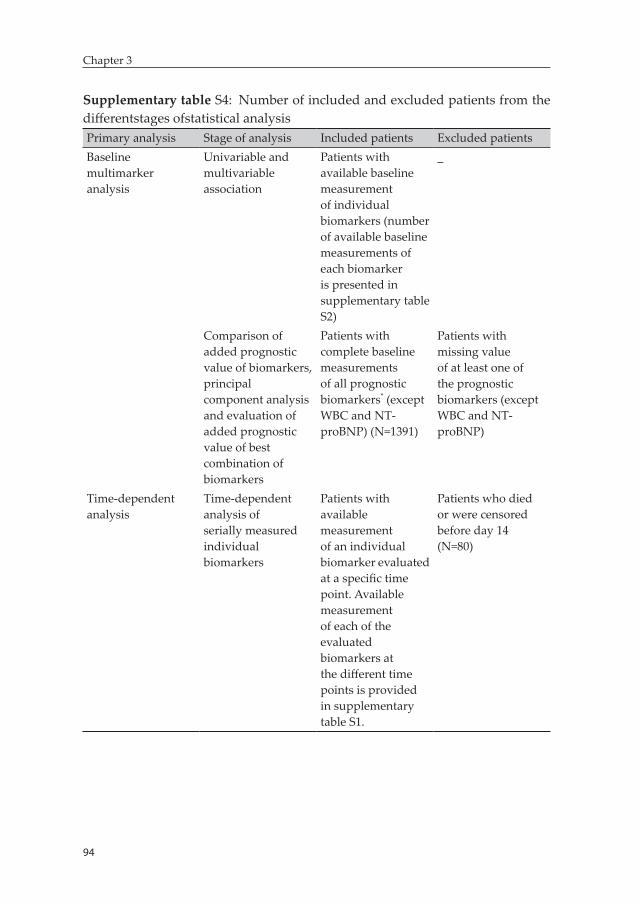
94
Chapter 3
Supplementary table S4: Number of included and excluded patients from the differentstages ofstatistical analysisPrimary analysis Stage of analysis Included patients Excluded patientsBaseline multimarker analysis
Univariable and multivariable association
Patients with available baseline measurement of individual biomarkers (number of available baseline measurements of each biomarker is presented in supplementary table S2)
_
Comparison of added prognostic value of biomarkers, principal component analysis and evaluation of added prognostic value of best combination of biomarkers
Patients with complete baseline measurements of all prognostic biomarkers* (except WBC and NT-proBNP) (N=1391)
Patients with missing value of at least one of the prognostic biomarkers (except WBC and NT-proBNP)
Time-dependent analysis
Time-dependent analysis of serially measured individual biomarkers
Patients with available measurement of an individual biomarker evaluated at a specific time point. Available measurement of each of the evaluated biomarkers at the different time points is provided in supplementary table S1.
Patients who died or were censored before day 14 (N=80)
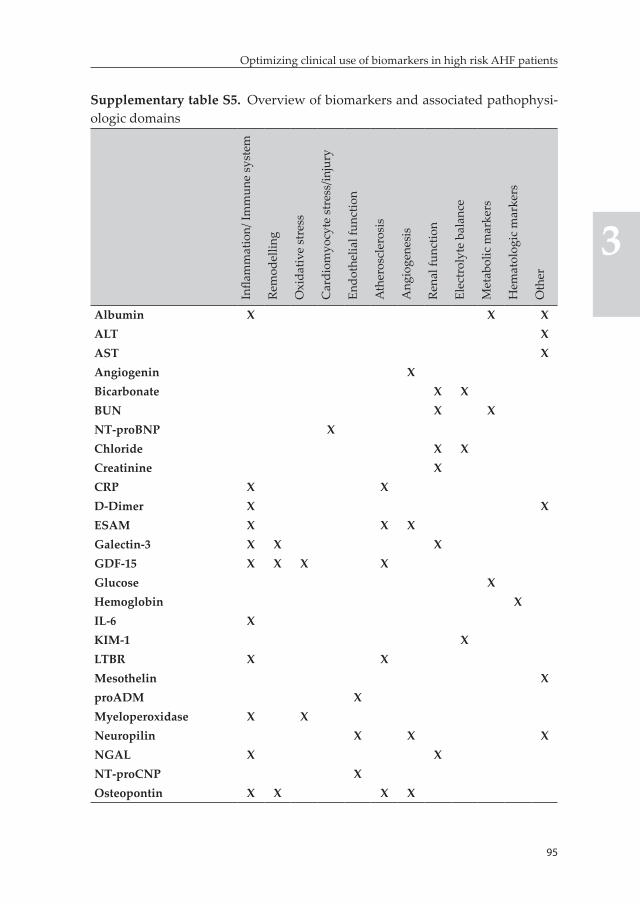
95
Optimizing clinical use of biomarkers in high risk AHF patients
3
Supplementary table S5. Overview of biomarkers and associated pathophysi-ologic domains
Infla
mm
atio
n/ Im
mun
e sy
stem
Rem
odel
ling
Oxi
dativ
e st
ress
Car
diom
yocy
te s
tres
s/in
jury
Endo
thel
ial f
unct
ion
Ath
eros
cler
osis
Ang
ioge
nesi
s
Rena
l fun
ctio
n
Elec
trol
yte
bala
nce
Met
abol
ic m
arke
rs
Hem
atol
ogic
mar
kers
Oth
er
Albumin X X XALT XAST XAngiogenin XBicarbonate X XBUN X XNT-proBNP XChloride X XCreatinine XCRP X XD-Dimer X XESAM X X XGalectin-3 X X XGDF-15 X X X XGlucose XHemoglobin XIL-6 XKIM-1 XLTBR X XMesothelin XproADM XMyeloperoxidase X XNeuropilin X X XNGAL X XNT-proCNP XOsteopontin X X X X
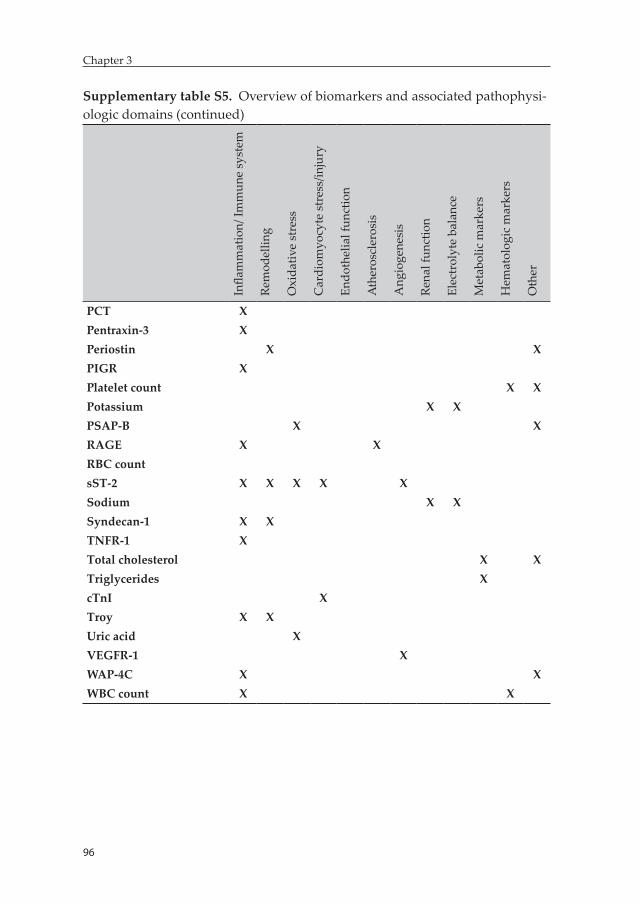
96
Chapter 3
97
Optimizing clinical use of biomarkers in high risk AHF patients
3
Supplementary table S5. Overview of biomarkers and associated pathophysi-ologic domains (continued)
Infla
mm
atio
n/ Im
mun
e sy
stem
Rem
odel
ling
Oxi
dativ
e st
ress
Car
diom
yocy
te s
tres
s/in
jury
Endo
thel
ial f
unct
ion
Ath
eros
cler
osis
Ang
ioge
nesi
s
Rena
l fun
ctio
n
Elec
trol
yte
bala
nce
Met
abol
ic m
arke
rs
Hem
atol
ogic
mar
kers
Oth
er
PCT XPentraxin-3 XPeriostin X XPIGR XPlatelet count X XPotassium X XPSAP-B X XRAGE X XRBC countsST-2 X X X X XSodium X XSyndecan-1 X XTNFR-1 XTotal cholesterol X XTriglycerides XcTnI XTroy X XUric acid XVEGFR-1 XWAP-4C X XWBC count X X
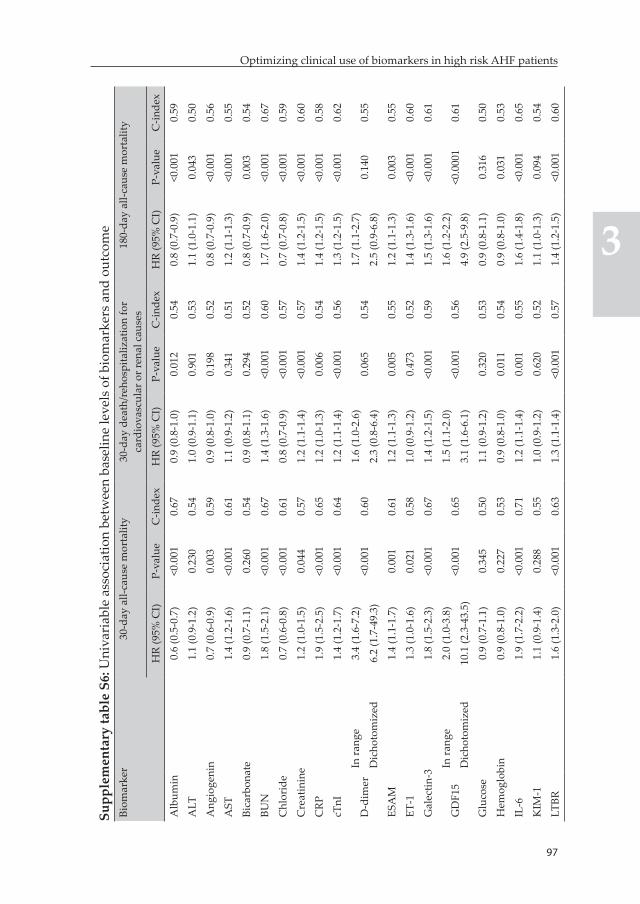
96
Chapter 3
97
Optimizing clinical use of biomarkers in high risk AHF patients
3
Supp
lem
enta
ry ta
ble
S6: U
niva
riab
le a
ssoc
iatio
n be
twee
n ba
selin
e le
vels
of b
iom
arke
rs a
nd o
utco
me
Biom
arke
r30
-day
all-
caus
e m
orta
lity
30-d
ay d
eath
/reh
ospi
taliz
atio
n fo
r ca
rdio
vasc
ular
or r
enal
cau
ses
180-
day
all-c
ause
mor
talit
y
HR
(95%
CI)
P-va
lue
C-in
dex
HR
(95%
CI)
P-va
lue
C-in
dex
HR
(95%
CI)
P-va
lue
C-in
dex
Alb
umin
0.6
(0.5
-0.7
)<0
.001
0.67
0.9
(0.8
-1.0
)0.
012
0.54
0.8
(0.7
-0.9
)<0
.001
0.59
ALT
1.1
(0.9
-1.2
)0.
230
0.54
1.0
(0.9
-1.1
)0.
901
0.53
1.1
(1.0
-1.1
)0.
043
0.50
Ang
ioge
nin
0.7
(0.6
-0.9
)0.
003
0.59
0.9
(0.8
-1.0
)0.
198
0.52
0.8
(0.7
-0.9
)<0
.001
0.56
AST
1.4
(1.2
-1.6
)<0
.001
0.61
1.1
(0.9
-1.2
)0.
341
0.51
1.2
(1.1
-1.3
)<0
.001
0.55
Bica
rbon
ate
0.9
(0.7
-1.1
)0.
260
0.54
0.9
(0.8
-1.1
)0.
294
0.52
0.8
(0.7
-0.9
)0.
003
0.54
BUN
1.8
(1.5
-2.1
)<0
.001
0.67
1.4
(1.3
-1.6
)<0
.001
0.60
1.7
(1.6
-2.0
)<0
.001
0.67
Chl
orid
e0.
7 (0
.6-0
.8)
<0.0
010.
610.
8 (0
.7-0
.9)
<0.0
010.
570.
7 (0
.7-0
.8)
<0.0
010.
59
Cre
atin
ine
1.2
(1.0
-1.5
)0.
044
0.57
1.2
(1.1
-1.4
)<0
.001
0.57
1.4
(1.2
-1.5
)<0
.001
0.60
CRP
1.9
(1.5
-2.5
)<0
.001
0.65
1.2
(1.0
-1.3
)0.
006
0.54
1.4
(1.2
-1.5
)<0
.001
0.58
cTnI
1.4
(1.2
-1.7
)<0
.001
0.64
1.2
(1.1
-1.4
)<0
.001
0.56
1.3
(1.2
-1.5
)<0
.001
0.62
D-d
imer
In ra
nge
3.4
(1.6
-7.2
)<0
.001
0.60
1.6
(1.0
-2.6
)0.
065
0.54
1.7
(1.1
-2.7
)0.
140
0.55
Dic
hoto
miz
ed6.
2 (1
.7-4
9.3)
2.3
(0.8
-6.4
)2.
5 (0
.9-6
.8)
ESA
M1.
4 (1
.1-1
.7)
0.00
10.
611.
2 (1
.1-1
.3)
0.00
50.
551.
2 (1
.1-1
.3)
0.00
30.
55
ET-1
1.3
(1.0
-1.6
)0.
021
0.58
1.0
(0.9
-1.2
)0.
473
0.52
1.4
(1.3
-1.6
)<0
.001
0.60
Gal
ectin
-31.
8 (1
.5-2
.3)
<0.0
010.
671.
4 (1
.2-1
.5)
<0.0
010.
591.
5 (1
.3-1
.6)
<0.0
010.
61
GD
F15
In ra
nge
2.0
(1.0
-3.8
)<0
.001
0.65
1.5
(1.1
-2.0
)<0
.001
0.56
1.6
(1.2
-2.2
)<0
.000
10.
61D
icho
tom
ized
10.1
(2.3
-43.
5)3.
1 (1
.6-6
.1)
4.9
(2.5
-9.8
)
Glu
cose
0.9
(0.7
-1.1
)0.
345
0.50
1.1
(0.9
-1.2
)0.
320
0.53
0.9
(0.8
-1.1
)0.
316
0.50
Hem
oglo
bin
0.9
(0.8
-1.0
)0.
227
0.53
0.9
(0.8
-1.0
)0.
011
0.54
0.9
(0.8
-1.0
)0.
031
0.53
IL-6
1.9
(1.7
-2.2
)<0
.001
0.71
1.2
(1.1
-1.4
)0.
001
0.55
1.6
(1.4
-1.8
)<0
.001
0.65
KIM
-11.
1 (0
.9-1
.4)
0.28
80.
551.
0 (0
.9-1
.2)
0.62
00.
521.
1 (1
.0-1
.3)
0.09
40.
54
LTBR
1.6
(1.3
-2.0
)<0
.001
0.63
1.3
(1.1
-1.4
)<0
.001
0.57
1.4
(1.2
-1.5
)<0
.001
0.60
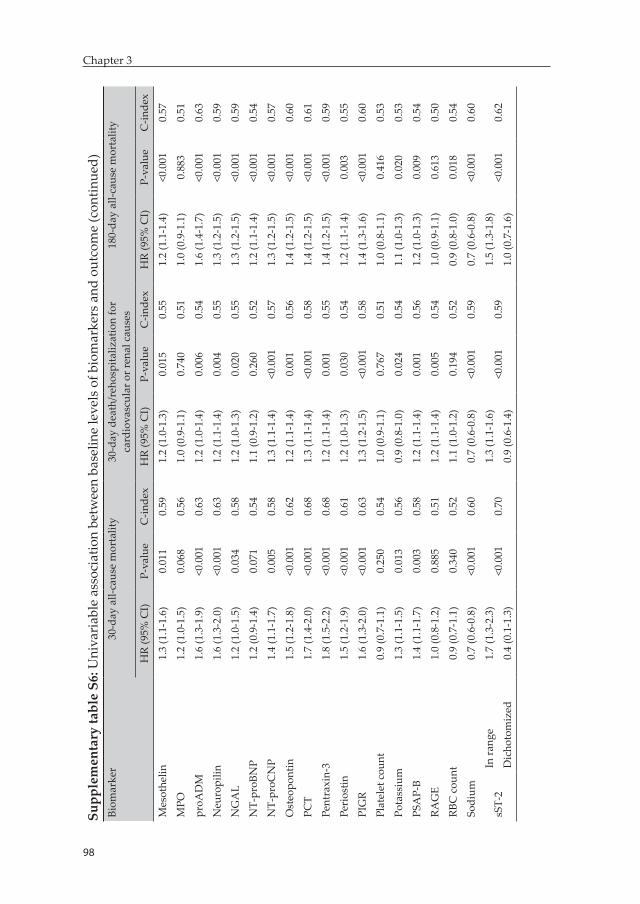
98
Chapter 3
99
Optimizing clinical use of biomarkers in high risk AHF patients
3
Supp
lem
enta
ry ta
ble
S6: U
niva
riab
le a
ssoc
iatio
n be
twee
n ba
selin
e le
vels
of b
iom
arke
rs a
nd o
utco
me
(con
tinue
d)Bi
omar
ker
30-d
ay a
ll-ca
use
mor
talit
y30
-day
dea
th/r
ehos
pita
lizat
ion
for
card
iova
scul
ar o
r ren
al c
ause
s18
0-da
y al
l-cau
se m
orta
lity
HR
(95%
CI)
P-va
lue
C-in
dex
HR
(95%
CI)
P-va
lue
C-in
dex
HR
(95%
CI)
P-va
lue
C-in
dex
Mes
othe
lin1.
3 (1
.1-1
.6)
0.01
10.
591.
2 (1
.0-1
.3)
0.01
50.
551.
2 (1
.1-1
.4)
<0.0
010.
57
MPO
1.2
(1.0
-1.5
)0.
068
0.56
1.0
(0.9
-1.1
)0.
740
0.51
1.0
(0.9
-1.1
)0.
883
0.51
proA
DM
1.6
(1.3
-1.9
)<0
.001
0.63
1.2
(1.0
-1.4
)0.
006
0.54
1.6
(1.4
-1.7
)<0
.001
0.63
Neu
ropi
lin1.
6 (1
.3-2
.0)
<0.0
010.
631.
2 (1
.1-1
.4)
0.00
40.
551.
3 (1
.2-1
.5)
<0.0
010.
59
NG
AL
1.2
(1.0
-1.5
)0.
034
0.58
1.2
(1.0
-1.3
)0.
020
0.55
1.3
(1.2
-1.5
)<0
.001
0.59
NT-
proB
NP
1.2
(0.9
-1.4
)0.
071
0.54
1.1
(0.9
-1.2
)0.
260
0.52
1.2
(1.1
-1.4
)<0
.001
0.54
NT-
proC
NP
1.4
(1.1
-1.7
)0.
005
0.58
1.3
(1.1
-1.4
)<0
.001
0.57
1.3
(1.2
-1.5
)<0
.001
0.57
Ost
eopo
ntin
1.5
(1.2
-1.8
)<0
.001
0.62
1.2
(1.1
-1.4
)0.
001
0.56
1.4
(1.2
-1.5
)<0
.001
0.60
PCT
1.7
(1.4
-2.0
)<0
.001
0.68
1.3
(1.1
-1.4
)<0
.001
0.58
1.4
(1.2
-1.5
)<0
.001
0.61
Pent
raxi
n-3
1.8
(1.5
-2.2
)<0
.001
0.68
1.2
(1.1
-1.4
)0.
001
0.55
1.4
(1.2
-1.5
)<0
.001
0.59
Peri
ostin
1.5
(1.2
-1.9
)<0
.001
0.61
1.2
(1.0
-1.3
)0.
030
0.54
1.2
(1.1
-1.4
)0.
003
0.55
PIG
R1.
6 (1
.3-2
.0)
<0.0
010.
631.
3 (1
.2-1
.5)
<0.0
010.
581.
4 (1
.3-1
.6)
<0.0
010.
60
Plat
elet
cou
nt0.
9 (0
.7-1
.1)
0.25
00.
541.
0 (0
.9-1
.1)
0.76
70.
511.
0 (0
.8-1
.1)
0.41
60.
53
Pota
ssiu
m1.
3 (1
.1-1
.5)
0.01
30.
560.
9 (0
.8-1
.0)
0.02
40.
541.
1 (1
.0-1
.3)
0.02
00.
53
PSA
P-B
1.4
(1.1
-1.7
)0.
003
0.58
1.2
(1.1
-1.4
)0.
001
0.56
1.2
(1.0
-1.3
)0.
009
0.54
RAG
E1.
0 (0
.8-1
.2)
0.88
50.
511.
2 (1
.1-1
.4)
0.00
50.
541.
0 (0
.9-1
.1)
0.61
30.
50
RBC
cou
nt0.
9 (0
.7-1
.1)
0.34
00.
521.
1 (1
.0-1
.2)
0.19
40.
520.
9 (0
.8-1
.0)
0.01
80.
54
Sodi
um0.
7 (0
.6-0
.8)
<0.0
010.
600.
7 (0
.6-0
.8)
<0.0
010.
590.
7 (0
.6-0
.8)
<0.0
010.
60
sST-
2In
rang
e1.
7 (1
.3-2
.3)
<0.0
010.
701.
3 (1
.1-1
.6)
<0.0
010.
591.
5 (1
.3-1
.8)
<0.0
010.
62D
icho
tom
ized
0.4
(0.1
-1.3
)0.
9 (0
.6-1
.4)
1.0
(0.7
-1.6
)
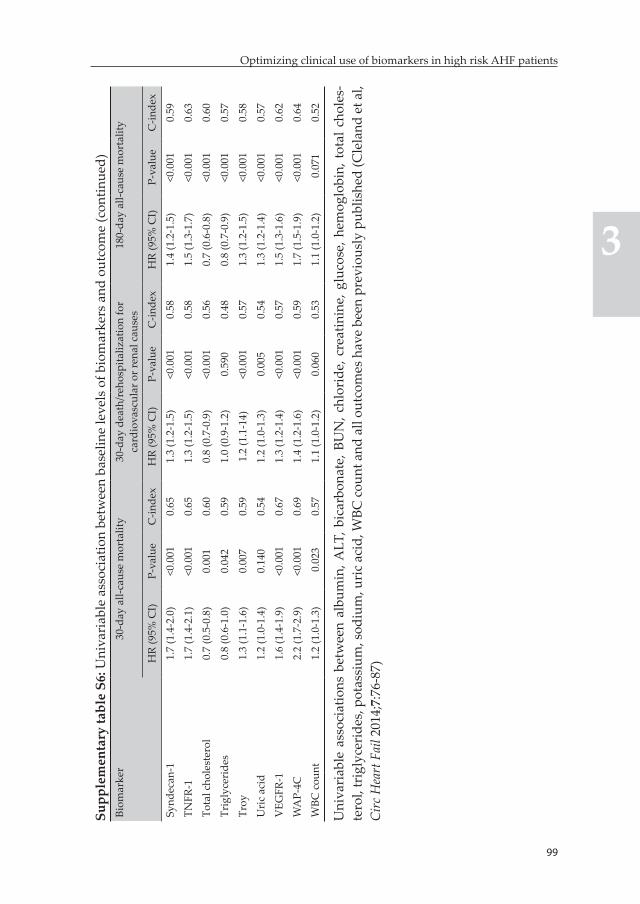
98
Chapter 3
99
Optimizing clinical use of biomarkers in high risk AHF patients
3
Supp
lem
enta
ry ta
ble
S6: U
niva
riab
le a
ssoc
iatio
n be
twee
n ba
selin
e le
vels
of b
iom
arke
rs a
nd o
utco
me
(con
tinue
d)Bi
omar
ker
30-d
ay a
ll-ca
use
mor
talit
y30
-day
dea
th/r
ehos
pita
lizat
ion
for
card
iova
scul
ar o
r ren
al c
ause
s18
0-da
y al
l-cau
se m
orta
lity
HR
(95%
CI)
P-va
lue
C-in
dex
HR
(95%
CI)
P-va
lue
C-in
dex
HR
(95%
CI)
P-va
lue
C-in
dex
Synd
ecan
-11.
7 (1
.4-2
.0)
<0.0
010.
651.
3 (1
.2-1
.5)
<0.0
010.
581.
4 (1
.2-1
.5)
<0.0
010.
59
TNFR
-11.
7 (1
.4-2
.1)
<0.0
010.
651.
3 (1
.2-1
.5)
<0.0
010.
581.
5 (1
.3-1
.7)
<0.0
010.
63
Tota
l cho
lest
erol
0.7
(0.5
-0.8
)0.
001
0.60
0.8
(0.7
-0.9
)<0
.001
0.56
0.7
(0.6
-0.8
)<0
.001
0.60
Trig
lyce
ride
s0.
8 (0
.6-1
.0)
0.04
20.
591.
0 (0
.9-1
.2)
0.59
00.
480.
8 (0
.7-0
.9)
<0.0
010.
57
Troy
1.3
(1.1
-1.6
)0.
007
0.59
1.2
(1.1
-14)
<0.0
010.
571.
3 (1
.2-1
.5)
<0.0
010.
58
Uri
c ac
id1.
2 (1
.0-1
.4)
0.14
00.
541.
2 (1
.0-1
.3)
0.00
50.
541.
3 (1
.2-1
.4)
<0.0
010.
57
VEG
FR-1
1.6
(1.4
-1.9
)<0
.001
0.67
1.3
(1.2
-1.4
)<0
.001
0.57
1.5
(1.3
-1.6
)<0
.001
0.62
WA
P-4C
2.2
(1.7
-2.9
)<0
.001
0.69
1.4
(1.2
-1.6
)<0
.001
0.
591.
7 (1
.5-1
.9)
<0.0
010.
64
WBC
cou
nt1.
2 (1
.0-1
.3)
0.0
230.
571.
1 (1
.0-1
.2)
0.06
00.
531.
1 (1
.0-1
.2)
0.0
710.
52
Uni
vari
able
ass
ocia
tions
bet
wee
n al
bum
in, A
LT, b
icar
bona
te, B
UN
, chl
orid
e, c
reat
inin
e, g
luco
se, h
emog
lobi
n, t
otal
cho
les-
tero
l, tr
igly
ceri
des,
pot
assi
um, s
odiu
m, u
ric
acid
, WBC
cou
nt a
nd a
ll ou
tcom
es h
ave
been
pre
viou
sly
publ
ishe
d (C
lela
nd e
t al,
Circ
Hea
rt F
ail 2
014;
7:76
-87)
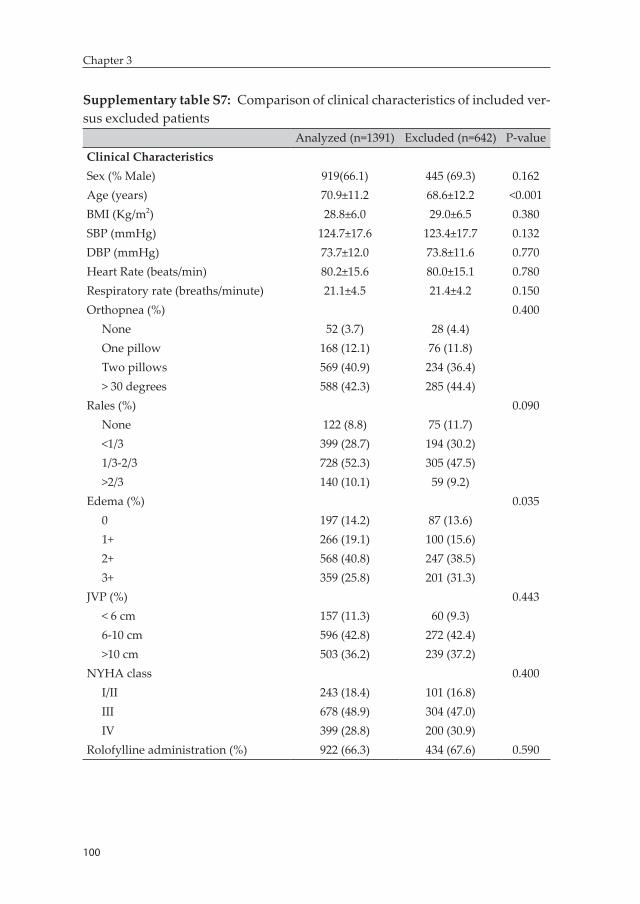
100
Chapter 3
Supplementary table S7: Comparison of clinical characteristics of included ver-sus excluded patients
Analyzed (n=1391) Excluded (n=642) P-valueClinical CharacteristicsSex (% Male) 919(66.1) 445 (69.3) 0.162Age (years) 70.9±11.2 68.6±12.2 <0.001BMI (Kg/m2) 28.8±6.0 29.0±6.5 0.380SBP (mmHg) 124.7±17.6 123.4±17.7 0.132DBP (mmHg) 73.7±12.0 73.8±11.6 0.770Heart Rate (beats/min) 80.2±15.6 80.0±15.1 0.780Respiratory rate (breaths/minute) 21.1±4.5 21.4±4.2 0.150Orthopnea (%) 0.400
None 52 (3.7) 28 (4.4)One pillow 168 (12.1) 76 (11.8)Two pillows 569 (40.9) 234 (36.4)> 30 degrees 588 (42.3) 285 (44.4)
Rales (%) 0.090None 122 (8.8) 75 (11.7)<1/3 399 (28.7) 194 (30.2)1/3-2/3 728 (52.3) 305 (47.5)>2/3 140 (10.1) 59 (9.2)
Edema (%) 0.0350 197 (14.2) 87 (13.6)1+ 266 (19.1) 100 (15.6)2+ 568 (40.8) 247 (38.5)3+ 359 (25.8) 201 (31.3)
JVP (%) 0.443< 6 cm 157 (11.3) 60 (9.3)6-10 cm 596 (42.8) 272 (42.4)>10 cm 503 (36.2) 239 (37.2)
NYHA class 0.400I/II 243 (18.4) 101 (16.8)III 678 (48.9) 304 (47.0)IV 399 (28.8) 200 (30.9)
Rolofylline administration (%) 922 (66.3) 434 (67.6) 0.590
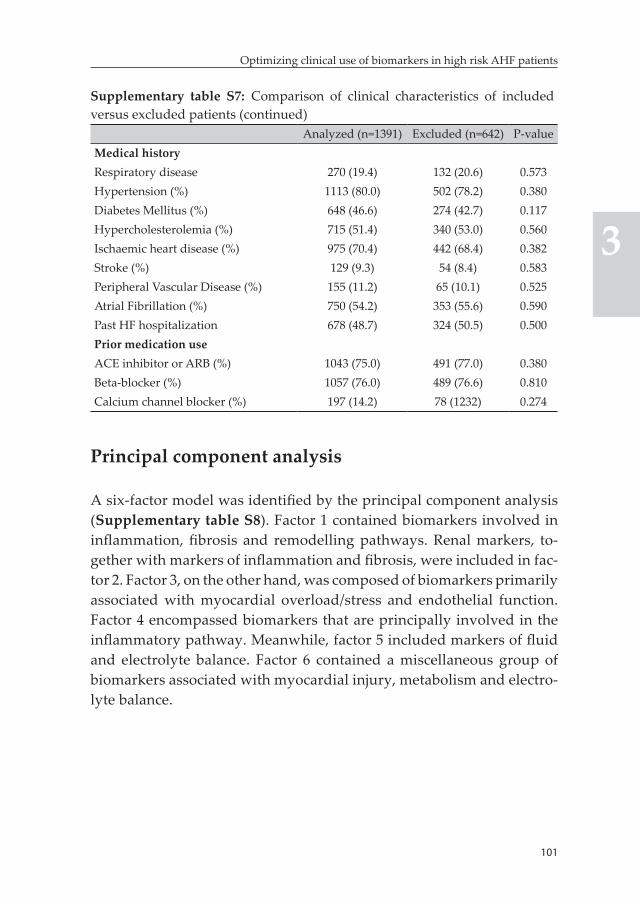
101
Optimizing clinical use of biomarkers in high risk AHF patients
3
Supplementary table S7: Comparison of clinical characteristics of included versus excluded patients (continued)
Analyzed (n=1391) Excluded (n=642) P-valueMedical historyRespiratory disease 270 (19.4) 132 (20.6) 0.573Hypertension (%) 1113 (80.0) 502 (78.2) 0.380Diabetes Mellitus (%) 648 (46.6) 274 (42.7) 0.117Hypercholesterolemia (%) 715 (51.4) 340 (53.0) 0.560Ischaemic heart disease (%) 975 (70.4) 442 (68.4) 0.382Stroke (%) 129 (9.3) 54 (8.4) 0.583Peripheral Vascular Disease (%) 155 (11.2) 65 (10.1) 0.525Atrial Fibrillation (%) 750 (54.2) 353 (55.6) 0.590Past HF hospitalization 678 (48.7) 324 (50.5) 0.500Prior medication useACE inhibitor or ARB (%) 1043 (75.0) 491 (77.0) 0.380Beta-blocker (%) 1057 (76.0) 489 (76.6) 0.810Calcium channel blocker (%) 197 (14.2) 78 (1232) 0.274
Principal component analysis
A six-factor model was identified by the principal component analysis (Supplementary table S8). Factor 1 contained biomarkers involved in inflammation, fibrosis and remodelling pathways. Renal markers, to-gether with markers of inflammation and fibrosis, were included in fac-tor 2. Factor 3, on the other hand, was composed of biomarkers primarily associated with myocardial overload/stress and endothelial function. Factor 4 encompassed biomarkers that are principally involved in the inflammatory pathway. Meanwhile, factor 5 included markers of fluid and electrolyte balance. Factor 6 contained a miscellaneous group of biomarkers associated with myocardial injury, metabolism and electro-lyte balance.
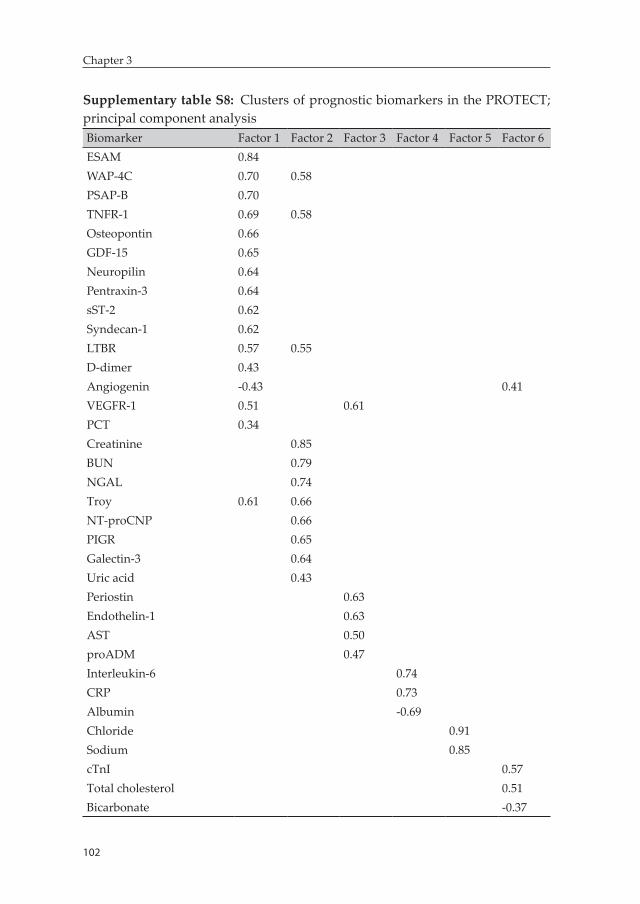
102
Chapter 3
Supplementary table S8: Clusters of prognostic biomarkers in the PROTECT; principal component analysisBiomarker Factor 1 Factor 2 Factor 3 Factor 4 Factor 5 Factor 6ESAM 0.84WAP-4C 0.70 0.58PSAP-B 0.70TNFR-1 0.69 0.58Osteopontin 0.66GDF-15 0.65Neuropilin 0.64Pentraxin-3 0.64sST-2 0.62Syndecan-1 0.62LTBR 0.57 0.55D-dimer 0.43Angiogenin -0.43 0.41VEGFR-1 0.51 0.61PCT 0.34Creatinine 0.85BUN 0.79NGAL 0.74Troy 0.61 0.66NT-proCNP 0.66PIGR 0.65Galectin-3 0.64Uric acid 0.43Periostin 0.63Endothelin-1 0.63AST 0.50proADM 0.47Interleukin-6 0.74CRP 0.73Albumin -0.69Chloride 0.91Sodium 0.85cTnI 0.57Total cholesterol 0.51Bicarbonate -0.37
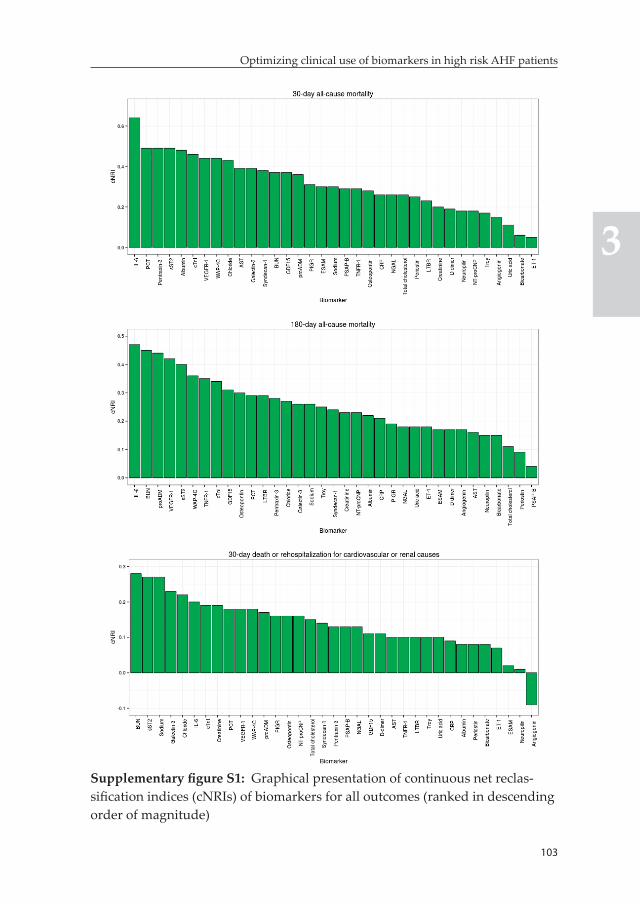
103
Optimizing clinical use of biomarkers in high risk AHF patients
3
Supplementary figure S1: Graphical presentation of continuous net reclas-sification indices (cNRIs) of biomarkers for all outcomes (ranked in descending order of magnitude)
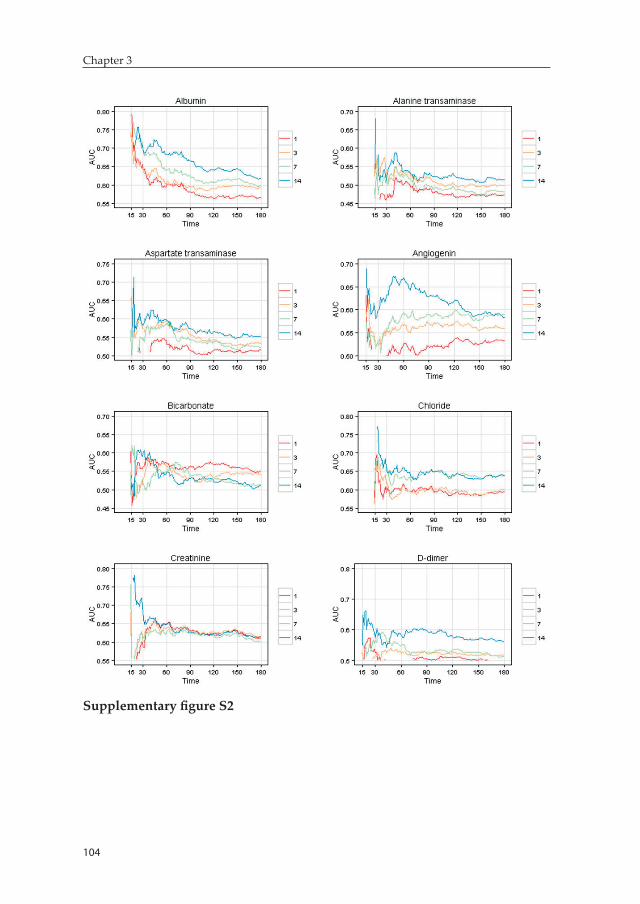
104
Chapter 3
Supplementary figure S2
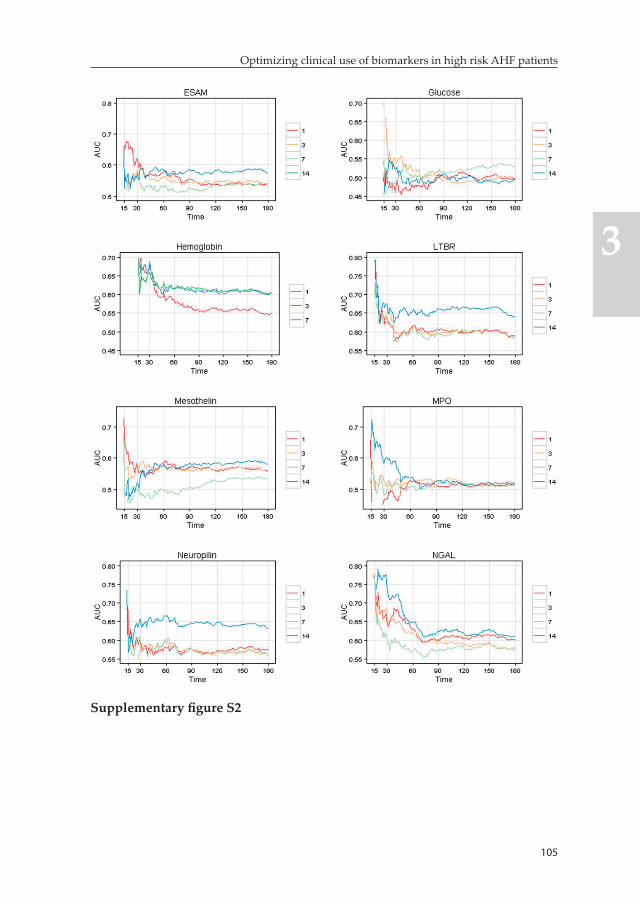
105
Optimizing clinical use of biomarkers in high risk AHF patients
3
Supplementary figure S2
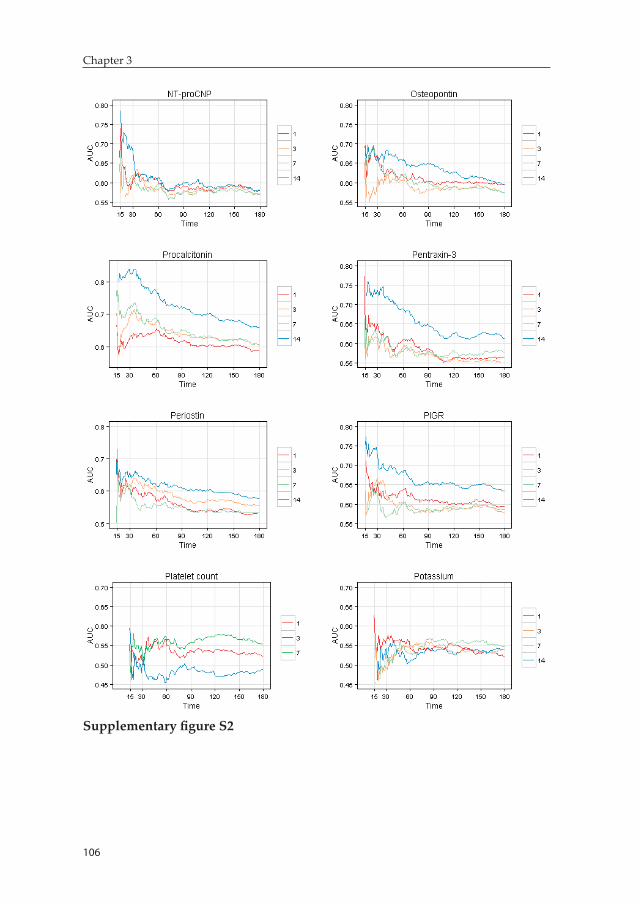
106
Chapter 3
Supplementary figure S2
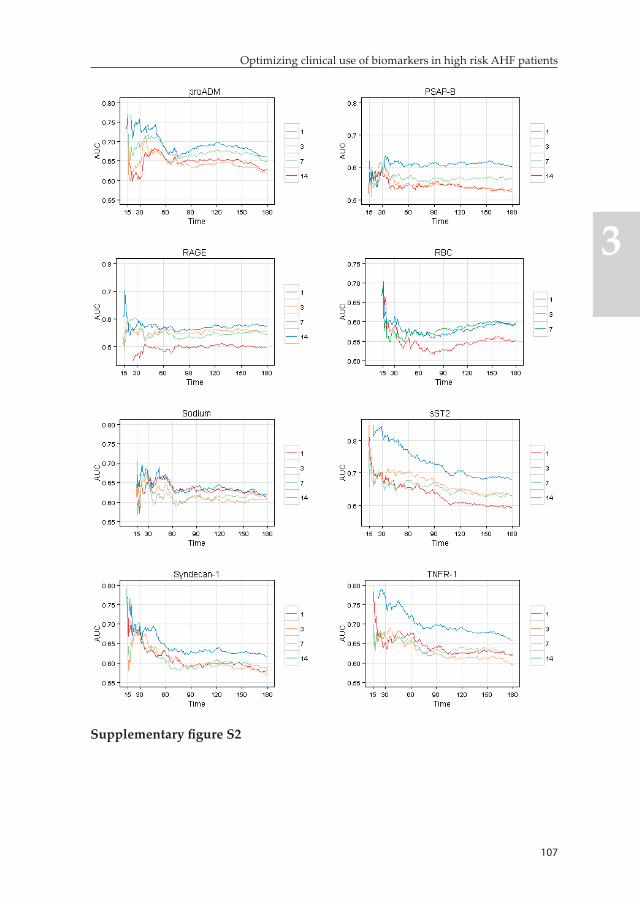
107
Optimizing clinical use of biomarkers in high risk AHF patients
3
Supplementary figure S2
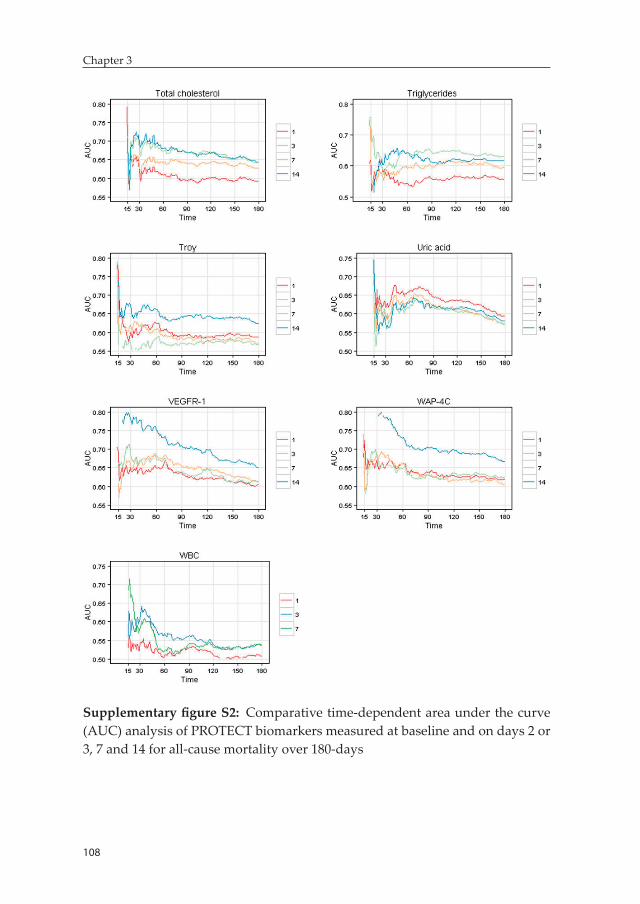
108
Chapter 3
Supplementary figure S2: Comparative time-dependent area under the curve (AUC) analysis of PROTECT biomarkers measured at baseline and on days 2 or 3, 7 and 14 for all-cause mortality over 180-days
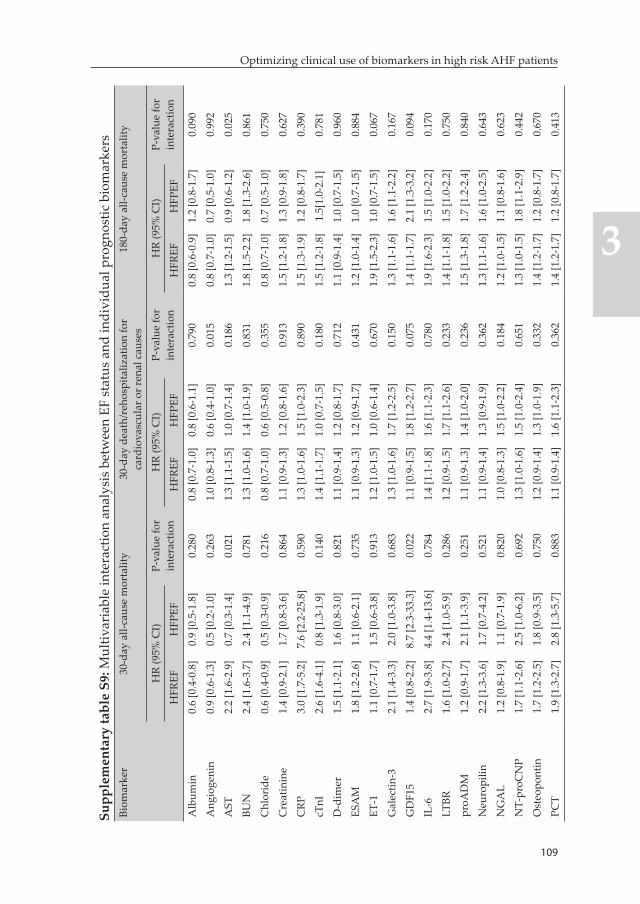
109
Optimizing clinical use of biomarkers in high risk AHF patients
3
Supp
lem
enta
ry ta
ble
S9: M
ultiv
aria
ble
inte
ract
ion
anal
ysis
bet
wee
n EF
sta
tus
and
indi
vidu
al p
rogn
ostic
bio
mar
kers
Biom
arke
r30
-day
all-
caus
e m
orta
lity
30-d
ay d
eath
/reh
ospi
taliz
atio
n fo
r ca
rdio
vasc
ular
or r
enal
cau
ses
180-
day
all-c
ause
mor
talit
y
HR
(95%
CI)
P-va
lue
for
inte
ract
ion
HR
(95%
CI)
P-va
lue
for
inte
ract
ion
HR
(95%
CI)
P-va
lue
for
inte
ract
ion
HFR
EFH
FPEF
HFR
EFH
FPEF
HFR
EFH
FPEF
Alb
umin
0.6
[0.4
-0.8
]0.
9 [0
.5-1
.8]
0.28
00.
8 [0
.7-1
.0]
0.8
[0.6
-1.1
]0.
790
0.8
[0.6
-0.9
]1.
2 [0
.8-1
.7]
0.09
0
Ang
ioge
nin
0.9
[0.6
-1.3
]0.
5 [0
.2-1
.0]
0.26
31.
0 [0
.8-1
.3]
0.6
[0.4
-1.0
]0.
015
0.8
[0.7
-1.0
]0.
7 [0
.5-1
.0]
0.99
2
AST
2.2
[1.6
-2.9
]0.
7 [0
.3-1
.4]
0.02
11.
3 [1
.1-1
.5]
1.0
[0.7
-1.4
]0.
186
1.3
[1.2
-1.5
]0.
9 [0
.6-1
.2]
0.02
5
BUN
2.4
[1.6
-3.7
]2.
4 [1
.1-4
.9]
0.78
11.
3 [1
.0-1
.6]
1.4
[1.0
-1.9
]0.
831
1.8
[1.5
-2.2
]1.
8 [1
.3-2
.6]
0.86
1
Chl
orid
e0.
6 [0
.4-0
.9]
0.5
[0.3
-0.9
]0.
216
0.8
[0.7
-1.0
]0.
6 [0
.5-0
.8]
0.35
50.
8 [0
.7-1
.0]
0.7
[0.5
-1.0
]0.
750
Cre
atin
ine
1.4
[0.9
-2.1
]1.
7 [0
.8-3
.6]
0.86
41.
1 [0
.9-1
.3]
1.2
[0.8
-1.6
]0.
913
1.5
[1.2
-1.8
]1.
3 [0
.9-1
.8]
0.62
7
CRP
3.0
[1.7
-5.2
]7.
6 [2
.2-2
5.8]
0.59
01.
3 [1
.0-1
.6]
1.5
[1.0
-2.3
]0.
890
1.5
[1.3
-1.9
]1.
2 [0
.8-1
.7]
0.39
0
cTnI
2.6
[1.6
-4.1
]0.
8 [1
.3-1
.9]
0.14
01.
4 [1
.1-1
.7]
1.0
[0.7
-1.5
]0.
180
1.5
[1.2
-1.8
]1.
5[1.
0-2.
1]0.
781
D-d
imer
1.5
[1.1
-2.1
]1.
6 [0
.8-3
.0]
0.82
11.
1 [0
.9-1
.4]
1.2
[0.8
-1.7
]0.
712
1.1
[0.9
-1.4
]1.
0 [0
.7-1
.5]
0.96
0
ESA
M1.
8 [1
.2-2
.6]
1.1
[0.6
-2.1
]0.
735
1.1
[0.9
-1.3
]1.
2 [0
.9-1
.7]
0.43
11.
2 [1
.0-1
.4]
1.0
[0.7
-1.5
]0.
884
ET-1
1.1
[0.7
-1.7
]1.
5 [0
.6-3
.8]
0.91
31.
2 [1
.0-1
.5]
1.0
[0.6
-1.4
]0.
670
1.9
[1.5
-2.3
]1.
0 [0
.7-1
.5]
0.06
7
Gal
ectin
-32.
1 [1
.4-3
.3]
2.0
[1.0
-3.8
]0.
683
1.3
[1.0
-1.6
]1.
7 [1
.2-2
.5]
0.15
01.
3 [1
.1-1
.6]
1.6
[1.1
-2.2
]0.
167
GD
F15
1.4
[0.8
-2.2
]8.
7 [2
.3-3
3.3]
0.02
21.
1 [0
.9-1
.5]
1.8
[1.2
-2.7
]0.
075
1.4
[1.1
-1.7
]2.
1 [1
.3-3
.2]
0.09
4
IL-6
2.7
[1.9
-3.8
]4.
4 [1
.4-1
3.6]
0.78
41.
4 [1
.1-1
.8]
1.6
[1.1
-2.3
]0.
780
1.9
[1.6
-2.3
]1.
5 [1
.0-2
.2]
0.17
0
LTBR
1.6
[1.0
-2.7
]2.
4 [1
.0-5
.9]
0.28
61.
2 [0
.9-1
.5]
1.7
[1.1
-2.6
]0.
233
1.4
[1.1
-1.8
]1.
5 [1
.0-2
.2]
0.75
0
proA
DM
1.2
[0.9
-1.7
]2.
1 [1
.1-3
.9]
0.25
11.
1 [0
.9-1
.3]
1.4
[1.0
-2.0
]0.
236
1.5
[1.3
-1.8
]1.
7 [1
.2-2
.4]
0.84
0
Neu
ropi
lin2.
2 [1
.3-3
.6]
1.7
[0.7
-4.2
]0.
521
1.1
[0.9
-1.4
]1.
3 [0
.9-1
.9]
0.36
21.
3 [1
.1-1
.6]
1.6
[1.0
-2.5
]0.
643
NG
AL
1.2
[0.8
-1.9
]1.
1 [0
.7-1
.9]
0.82
01.
0 [0
.8-1
.3]
1.5
[1.0
-2.2
]0.
184
1.2
[1.0
-1.5
]1.
1 [0
.8-1
.6]
0.62
3
NT-
proC
NP
1.7
[1.1
-2.6
]2.
5 [1
.0-6
.2]
0.69
21.
3 [1
.0-1
.6]
1.5
[1.0
-2.4
]0.
651
1.3
[1.0
-1.5
]1.
8 [1
.1-2
.9]
0.44
2
Ost
eopo
ntin
1.7
[1.2
-2.5
]1.
8 [0
.9-3
.5]
0.75
01.
2 [0
.9-1
.4]
1.3
[1.0
-1.9
]0.
332
1.4
[1.2
-1.7
]1.
2 [0
.8-1
.7]
0.67
0
PCT
1.9
[1.3
-2.7
]2.
8 [1
.3-5
.7]
0.88
31.
1 [0
.9-1
.4]
1.6
[1.1
-2.3
]0.
362
1.4
[1.2
-1.7
]1.
2 [0
.8-1
.7]
0.41
3
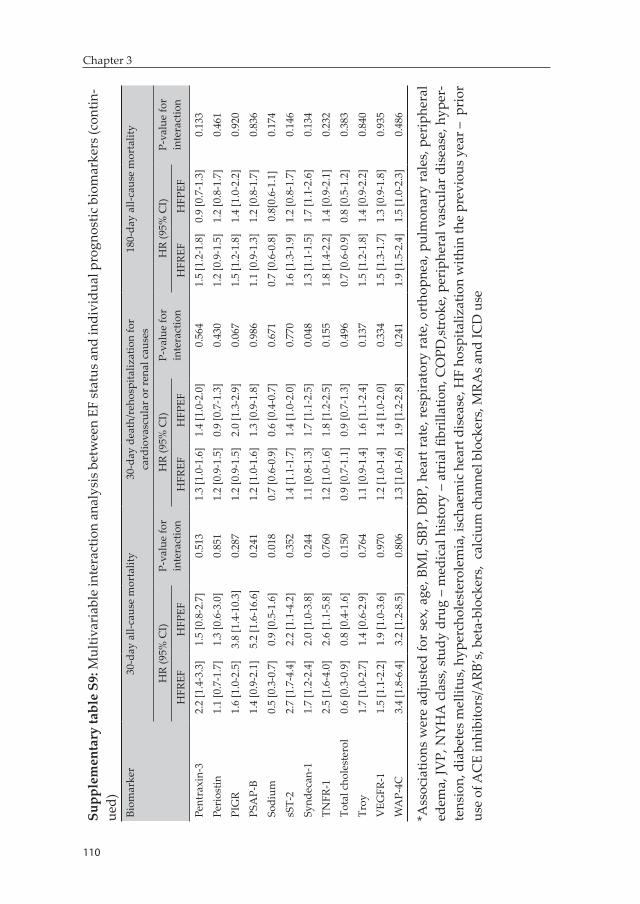
110
Chapter 3
Supp
lem
enta
ry ta
ble
S9: M
ultiv
aria
ble
inte
ract
ion
anal
ysis
bet
wee
n EF
stat
us a
nd in
divi
dual
pro
gnos
tic b
iom
arke
rs (c
ontin
-ue
d)Bi
omar
ker
30-d
ay a
ll-ca
use
mor
talit
y30
-day
dea
th/r
ehos
pita
lizat
ion
for
card
iova
scul
ar o
r ren
al c
ause
s18
0-da
y al
l-cau
se m
orta
lity
HR
(95%
CI)
P-va
lue
for
inte
ract
ion
HR
(95%
CI)
P-va
lue
for
inte
ract
ion
HR
(95%
CI)
P-va
lue
for
inte
ract
ion
HFR
EFH
FPEF
HFR
EFH
FPEF
HFR
EFH
FPEF
Pent
raxi
n-3
2.2
[1.4
-3.3
]1.
5 [0
.8-2
.7]
0.51
31.
3 [1
.0-1
.6]
1.4
[1.0
-2.0
]0.
564
1.5
[1.2
-1.8
]0.
9 [0
.7-1
.3]
0.13
3
Peri
ostin
1.1
[0.7
-1.7
]1.
3 [0
.6-3
.0]
0.85
11.
2 [0
.9-1
.5]
0.9
[0.7
-1.3
]0.
430
1.2
[0.9
-1.5
]1.
2 [0
.8-1
.7]
0.46
1
PIG
R1.
6 [1
.0-2
.5]
3.8
[1.4
-10.
3]0.
287
1.2
[0.9
-1.5
]2.
0 [1
.3-2
.9]
0.06
71.
5 [1
.2-1
.8]
1.4
[1.0
-2.2
]0.
920
PSA
P-B
1.4
[0.9
-2.1
]5.
2 [1
.6-1
6.6]
0.24
11.
2 [1
.0-1
.6]
1.3
[0.9
-1.8
]0.
986
1.1
[0.9
-1.3
]1.
2 [0
.8-1
.7]
0.83
6
Sodi
um0.
5 [0
.3-0
.7]
0.9
[0.5
-1.6
]0.
018
0.7
[0.6
-0.9
]0.
6 [0
.4-0
.7]
0.67
10.
7 [0
.6-0
.8]
0.8[
0.6-
1.1]
0.17
4
sST-
22.
7 [1
.7-4
.4]
2.2
[1.1
-4.2
]0.
352
1.4
[1.1
-1.7
]1.
4 [1
.0-2
.0]
0.77
01.
6 [1
.3-1
.9]
1.2
[0.8
-1.7
]0.
146
Synd
ecan
-11.
7 [1
.2-2
.4]
2.0
[1.0
-3.8
]0.
244
1.1
[0.8
-1.3
]1.
7 [1
.1-2
.5]
0.04
81.
3 [1
.1-1
.5]
1.7
[1.1
-2.6
]0.
134
TNFR
-12.
5 [1
.6-4
.0]
2.6
[1.1
-5.8
]0.
760
1.2
[1.0
-1.6
]1.
8 [1
.2-2
.5]
0.15
51.
8 [1
.4-2
.2]
1.4
[0.9
-2.1
]0.
232
Tota
l cho
lest
erol
0.6
[0.3
-0.9
]0.
8 [0
.4-1
.6]
0.15
00.
9 [0
.7-1
.1]
0.9
[0.7
-1.3
]0.
496
0.7
[0.6
-0.9
]0.
8 [0
.5-1
.2]
0.38
3
Troy
1.7
[1.0
-2.7
]1.
4 [0
.6-2
.9]
0.76
41.
1 [0
.9-1
.4]
1.6
[1.1
-2.4
]0.
137
1.5
[1.2
-1.8
]1.
4 [0
.9-2
.2]
0.84
0
VEG
FR-1
1.5
[1.1
-2.2
]1.
9 [1
.0-3
.6]
0.97
01.
2 [1
.0-1
.4]
1.4
[1.0
-2.0
]0.
334
1.5
[1.3
-1.7
]1.
3 [0
.9-1
.8]
0.93
5
WA
P-4C
3.4
[1.8
-6.4
]3.
2 [1
.2-8
.5]
0.80
61.
3 [1
.0-1
.6]
1.9
[1.2
-2.8
]0.
241
1.9
[1.5
-2.4
]1.
5 [1
.0-2
.3]
0.48
6
*Ass
ocia
tions
wer
e ad
just
ed fo
r se
x, a
ge, B
MI,
SBP,
DBP
, hea
rt r
ate,
res
pira
tory
rat
e, o
rtho
pnea
, pul
mon
ary
rale
s, p
erip
hera
l ed
ema,
JVP,
NYH
A c
lass
, stu
dy d
rug
– m
edic
al h
isto
ry –
atr
ial fi
brill
atio
n, C
OPD
,str
oke,
per
iphe
ral v
ascu
lar d
isea
se, h
yper
-te
nsio
n, d
iabe
tes m
ellit
us, h
yper
chol
este
role
mia
, isc
haem
ic h
eart
dis
ease
, HF
hosp
italiz
atio
n w
ithin
the
prev
ious
yea
r – p
rior
us
e of
AC
E in
hibi
tors
/ARB
’s, b
eta-
bloc
kers
, ca
lciu
m c
hann
el b
lock
ers,
MRA
s an
d IC
D u
se
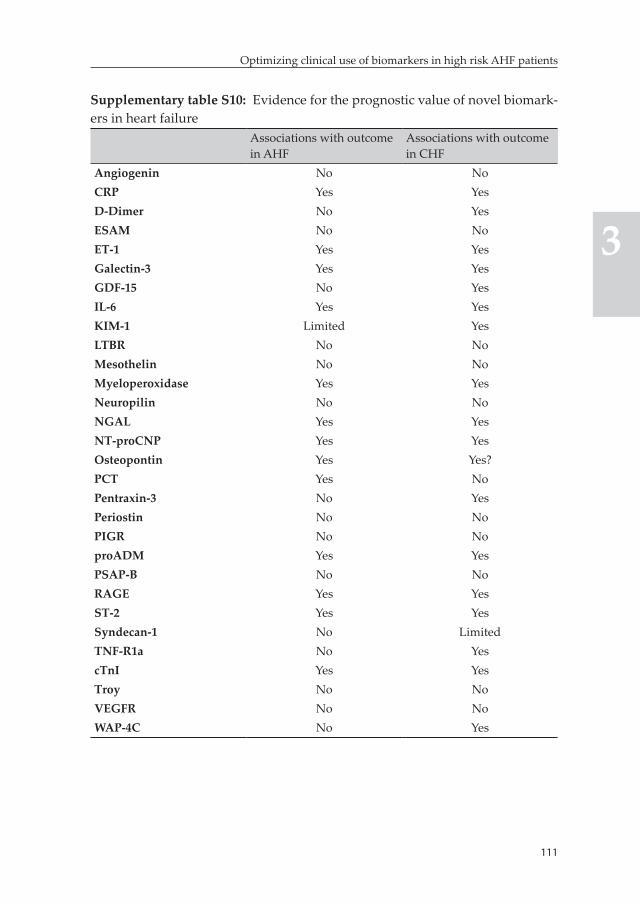
111
Optimizing clinical use of biomarkers in high risk AHF patients
3
Supplementary table S10: Evidence for the prognostic value of novel biomark-ers in heart failure
Associations with outcome in AHF
Associations with outcome in CHF
Angiogenin No NoCRP Yes YesD-Dimer No YesESAM No NoET-1 Yes YesGalectin-3 Yes YesGDF-15 No YesIL-6 Yes YesKIM-1 Limited YesLTBR No NoMesothelin No NoMyeloperoxidase Yes YesNeuropilin No NoNGAL Yes YesNT-proCNP Yes YesOsteopontin Yes Yes?PCT Yes NoPentraxin-3 No YesPeriostin No NoPIGR No NoproADM Yes YesPSAP-B No NoRAGE Yes YesST-2 Yes YesSyndecan-1 No LimitedTNF-R1a No YescTnI Yes YesTroy No NoVEGFR No NoWAP-4C No Yes
112
Chapter 3
TRIPOD Checklist Prediction Model Development and ValidationSection/Topic Checklist Item PageTitle and abstractTitle 1 D;V Identify the study as developing and/or
validating a multivariable prediction model, the target population, and the outcome to be predicted.
1
Abstract 2 D;V Provide a summary of objectives, study design, setting, participants, sample size, predictors, outcome, statistical analysis, results, and conclusions.
2
IntroductionBackground and objectives
3a D;V Explain the medical context (including whether diagnostic or prognostic) and rationale for developing or validating the multivariable prediction model, including references to existing models.
3
3b D;V Specify the objectives, including whether the study describes the development or validation of the model or both.
3
MethodsSource of data 4a D;V Describe the study design or source of data
(e.g., randomized trial, cohort, or registry data), separately for the development and validation data sets, if applicable.
3, 4
4b D;V Specify the key study dates, including start of accrual; end of accrual; and, if applicable, end of follow-up.
**
Participants 5a D;V Specify key elements of the study setting (e.g., primary care, secondary care, general population) including number and location of centres.
**
5b D;V Describe eligibility criteria for participants. 3, 4, **5c D;V Give details of treatments received, if
relevant.**
Outcome 6a D;V Clearly define the outcome that is predicted by the prediction model, including how and when assessed.
5
6b D;V Report any actions to blind assessment of the outcome to be predicted.
**
113
Optimizing clinical use of biomarkers in high risk AHF patients
3
TRIPOD Checklist Prediction Model Development and Validation (continued)Section/Topic Checklist Item PageTitle and abstractPredictors 7a D;V Clearly define all predictors used in
developing or validating the multivariable prediction model, including how and when they were measured.
4, 5
7b D;V Report any actions to blind assessment of predictors for the outcome and other predictors.
-
Sample size 8 D;V Explain how the study size was arrived at. 5, 6Missing data 9 D;V Describe how missing data were handled
(e.g., complete-case analysis, single imputation, multiple imputation) with details of any imputation method.
5
Statistical analysis methods
10a D Describe how predictors were handled in the analyses.
5, 6
10b D Specify type of model, all model-building procedures (including any predictor selection), and method for internal validation.
5, 6
10c V For validation, describe how the predictions were calculated.
-
10d D;V Specify all measures used to assess model performance and, if relevant, to compare multiple models.
5, 6
10e V Describe any model updating (e.g., recalibration) arising from the validation, if done.
-
Risk groups 11 D;V Provide details on how risk groups were created, if done.
-
Development vs. validation
12 V For validation, identify any differences from the development data in setting, eligibility criteria, outcome, and predictors.
-
114
Chapter 3
TRIPOD Checklist Prediction Model Development and Validation (continued)Section/Topic Checklist Item PageTitle and abstractResultsParticipants 13a D;V Describe the flow of participants through the
study, including the number of participants with and without the outcome and, if applicable, a summary of the follow-up time. A diagram may be helpful.
Supp. Material P 25
13b D;V Describe the characteristics of the participants (basic demographics, clinical features, available predictors), including the number of participants with missing data for predictors and outcome.
7, 22, 23
13c V For validation, show a comparison with the development data of the distribution of important variables (demographics, predictors and outcome).
-
Model development
14a D Specify the number of participants and outcome events in each analysis.
7
14b D If done, report the unadjusted association between each candidate predictor and outcome.
Supp. Material 9, 10
Model specification
15a D Present the full prediction model to allow predictions for individuals (i.e., all regression coefficients, and model intercept or baseline survival at a given time point).
-
15b D Explain how to the use the prediction model. -Model performance
16 D;V Report performance measures (with CIs) for the prediction model.
9, 26
Model-updating
17 V If done, report the results from any model updating (i.e., model specification, model performance).
-
115
Optimizing clinical use of biomarkers in high risk AHF patients
3
TRIPOD Checklist Prediction Model Development and Validation (continued)Section/Topic Checklist Item PageTitle and abstractDiscussionLimitations 18 D;V Discuss any limitations of the study (such
as nonrepresentative sample, few events per predictor, missing data).
13
Interpretation 19a V For validation, discuss the results with reference to performance in the development data, and any other validation data.
-
19b D;V Give an overall interpretation of the results, considering objectives, limitations, results from similar studies, and other relevant evidence.
10, 11
Implications 20 D;V Discuss the potential clinical use of the model and implications for future research.
11, 14
Other informationSupplementary information
21 D;V Provide information about the availability of supplementary resources, such as study protocol, Web calculator, and data sets.
-
Funding 22 D;V Give the source of funding and the role of the funders for the present study.
15
** Information published in details previously ((Weatherely et al , J Card Fail 2010;16:25-35))
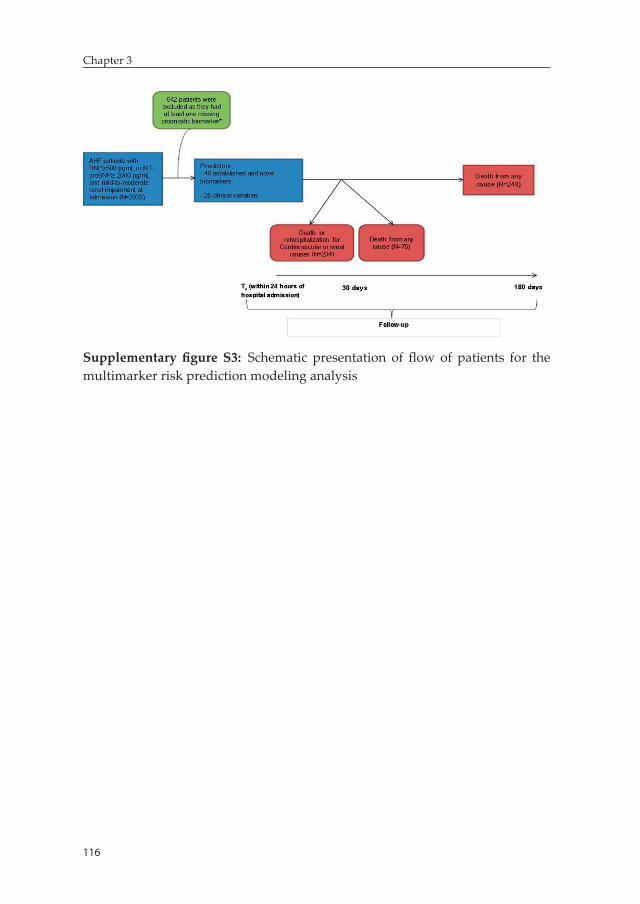
116
Chapter 3
Supplementary figure S3: Schematic presentation of flow of patients for the multimarker risk prediction modeling analysis


Chapter 4: A multimarker multi-time-point based risk stratification strategy in AHF – results from the RELAX-AHF trial
Biniyam G. Demissei, Gad Cotter, Margaret F. Prescott, G. Michael Felker, Gerasimos Filippatos, Barry H. Greenberg, Peter S. Pang, Piotr Ponikowski, Thomas M. Severin, Yi-Li Wang, Min Qian, John R. Teerlink, Marco Metra, Beth A. Davison, Adriaan A. Voors
Accepted European journal of heart failure
120
Chapter 4
Abstract
Aim: We evaluated the added prognostic value of a multi-time-point based multimarker panel of biomarkers in AHF patients.
Methods: Seven circulating biomarkers – NT-proBNP, hs-TnT, sST-2, GDF-15, cystatin-C, galectin-3 and hs-CRP – were measured at baseline and on days 2, 5, 14 and 60 in 1161 patients enrolled in the RELAX-AHF trial. Patients with BNP ≥350 ng/L or NT-proBNP ≥1400 ng/L, mild to moderate renal impairment and systolic blood pressure >125mmHg were included in the trial. Time-dependent Cox-regression analysis was utilized to evaluate incremental value of serial measurement of biomarkers. Added value of individual and combination of biomarkers, on top of a prespecified baseline model, was quantified with the gain in the C-index.
Result: Serial biomarker evaluation showed incremental predictive value over baseline measurements alone for the prediction of 180-day cardiovascular mortality except for galectin-3. While a repeat measurement as early as day 2 was adequate for NT-proBNP and cystatin-C in terms of maximizing discriminatory accuracy, further measurements on days 14 and 60 provided added value for hs-TnT, GDF-15, sST2 and hs-CRP. Individual biomarker additions on top of the baseline model showed additional prognostic value. The greatest prognostic gain was, however, attained with the combination of NT-proBNP, hs-TnT, GDF-15 and sST-2, which yielded 0.08 unit absolute increment in the C-index to 0.87, 95% CI [0.83,0.91].
Conclusion: In patients with AHF and mild-to-moderate renal impairment, a multimarker approach based on a panel of serially evaluated biomarkers provides the greatest prognostic improvement unmatched by a single time-point based single marker strategy.
Keywords: acute heart failure, prognosis, risk stratification, biomarkers, multimarker strategy, serial measurement
121
A multimarker multi-time-point based risk stratification strategy in AHF
4
Introduction
The potential role of personalized, need-based treatment strategies to improve outcome and cost associated with hospitalization for acute heart failure (AHF) is being increasingly recognized (1-4). Evaluation and implementation of such strategies in daily practice demands highly accurate and objective risk stratification tools.
A multimarker risk stratification strategy based on a combination of biomarkers reflecting diverse pathophysiologic pathways involved in heart failure is a promising approach that could serve as signature of disease and can greatly enhance accuracy of risk predictions (5-7). Al-though few studies reported significant prognostic improvement with multimarker panels, current data on the best combination of biomark-ers for risk evaluation in AHF is inadequate (8-13). The latter requires a comprehensive evaluation of a broader set of biomarkers representing the multitude of pathophysiologic pathways involved in heart failure. In addition, data on the timing of biomarker measurements that maximize prognostic performance of multimarker risk prediction tools is needed. In a post-hoc analysis of data from the PROTECT trial that included 48 established and novel biomarkers, we recently showed that measure-ments beyond hospital admission are needed for most biomarkers to attain a more optimal prognostic performance, particularly for outcome prediction after 2-3 months of the index hospitalization (13). However, evidence on the optimal timing for repeat post-hospital admission measurement of biomarkers during the course of hospitalization or post-discharge is generally lacking.
In this study, we assessed the improvement in discriminatory accu-racy attained by serial evaluation of biomarkers with measurements collected beyond baseline (i.e. days 2, 5, 14 and 60) and evaluated the added prognostic value of multimarker models based on best combina-tion of biomarkers and time points of measurements, on top of readily available clinical and laboratory parameters.
122
Chapter 4
Methods
Study populationThe RELAX-AHF, a prospective, randomized, double-blind, placebo-controlled, parallel-group trial comparing serelaxin with placebo (on top of standard care) enrolled 1161 patients admitted to hospital for AHF. Patients presenting within previous 16 hours with dyspnea at rest or with minimum exertion, pulmonary congestion on chest ra-diograph, BNP≥350 ng/L or NT-proBNP≥1400 ng/L, mild to moderate renal impairment evidenced by a glomerular filtration rate of 30 to 75 mL/min per 1.73 m2 (estimated using the simplified Modification of Diet in Renal Disease equation), systolic blood pressure >125 mmHg and were treated with at least 40 mg of IV furosemide or its equivalent before screening were included in the trial. Details of the design and main results of the study have been published previously (14, 15). All patients provided written informed consent. The study was conducted in compliance with the Declaration of Helsinki and was approved by all relevant local ethics committees.
Study procedures and measurementsSeven biomarkers including NT-proBNP, high sensitivity Troponin T (hs-TnT), cystatin-C, high sensitivity C-reactive protein (hs-CRP), sST-2, galectin-3 and growth differentiation factor 15 (GDF-15) were analyzed in a central laboratory (Clinical Reference Laboratories - Eu-rope [Fordham, Cambridgeshire, UK]) from samples collected during baseline assessment and on days 2, 5, 14 and 60 (for some biomarkers). All samples from the same patient were analyzed in the same batch by laboratory personnel blinded to subject treatment and study data. High sensitivity Troponin T (hs-TnT) and NT-proBNP were measured in EDTA plasma samples using electrochemiluminescent immunoas-say assay kits from Roche Diagnostics GmbH (Mannheim, Germany). Cystatin-C was measured in EDTA plasma using particle-enhanced turbidimetric immunoassay kits from Gentian AS (Moss, Norway). High sensitivity C-reactive protein (hs-CRP) was measured in serum using an immunoturbidimetric assay from Roche Diagnostics GmbH (Mannheim, Germany; Tina-quant® C-reactive protein high sensitive
123
A multimarker multi-time-point based risk stratification strategy in AHF
4
assay). sST-2 was measured in serum using an ELISA kit from Critical Diagnostics (San Diego, CA, USA; Presage® ST2 Assay). Galectin-3 was measured in serum using an ELISA kit from BG Medicine, Inc. (Waltham, MA, USA). Growth differentiation factor 15 (GDF-15) was analyzed in serum samples using a pre-commercial Elecsys assay from Roche Diagnostics (Mannheim, Germany) with a reporting range of 400 to 40,000 ng/L. Coefficient of variation (%CV) at levels of 516 ng/L, 1538 ng/L and 5954 ng/L was ≤3.4%.The reporting ranges used for the other biomarkers were those defined by the assay kit manufacturer with the exception of hs-TnT. For hs-TnT, the lowest value reported, defined as the lowest concentration that could be reproducibly measured with an inter-assay %CV <10%, was the lower limit of quantitation (LLOQ). The lower and upper limits of quantitation for hs-TnT were 0.013 μg/L and 10 μg/L, respectively. The number of patients with available biomarker measurements at each evaluated time points with corresponding num-ber of measurements within reporting ranges are presented in supple-mentary table S1. For our analysis, values below the LLOQ were set to 0.5*LLOQ and values above the ULOQ set to 1.5*ULOQ.
Study outcomeThe primary outcome evaluated in this analysis was time-to-cardio-vascular mortality within 180 days. Vital status was recorded at all scheduled follow-up visits or contacts up to day 180 and mode of death was adjudicated centrally by a blinded endpoint committee.
Statistical analysisAll analyses were performed based on the intention-to-treat popula-tion. Continuous variables are presented as mean ± standard deviation or geometric mean [95% confidence interval] for normally and non-normally distributed variables, respectively, while categorical variables were summarized with percentages. Chi-square test, Fisher’s Exact test or Student’s t-tests were used to compare groups as appropriate.
Univariable time-dependent discriminatory accuracy of biomarker measurements from samples collected at baseline and on days 2, 5 and 14 for the prediction of cardiovascular mortality over 180 days was
124
Chapter 4
compared by plotting area under the receiver-operator (ROC) curve (AUC) estimated at different time points within 180 days using survival ROC analysis proposed by Heagerty et al (16). Patients who died or were censored by day 14 (N=27) were excluded from this analysis.
To assess the incremental predictive value of serial evaluation of bio-markers with measurements collected beyond baseline (i.e. on days 2, 5, 14 and 60) four time-dependent versions, which allowed a biomarker value to be differentially updated through the various measurement time points, were defined to represent a given biomarker effect. Version 1 utilized baseline and day 2 measurements; version 2 utilized baseline, day 2 and 5 measurements; version 3 utilized baseline, day 2, 5 and 14 measurements and version 4 utilized further measurements at day 60 (when available), in addition to baseline, day 2, 5, 14 measurements. The procedure for defining each version of a biomarker was implemented based on the measurement closest to the event or censoring time ap-proach. This procedure is graphically presented in figure 1. The predic-tive values of the different versions of a biomarker were then quantified with C-indices calculated from a time-dependent Cox-proportional hazards model that included each version as a predictor. C-indices were estimated using SAS macro survcstd, which calculates the C-statistics and corresponding 95% confidence intervals for survival data with time-dependent covariates. In the next step, the C-index estimates at-tained by the four time-dependent versions, together with an additional version that utilized only baseline measurements, were compared. The best version of a biomarker was defined as the one that uses the fewest set of measurement time points from among the candidate versions of the biomarker and yields a C-index within 1% of the maximum C-index attained for the biomarker under consideration. Subset of patients with available baseline measurement were included for each biomarker (see supplementary table S1 for the number of available baseline measure-ments) and the last observation carried forward approach was utilized to impute for missing values in subsequent time points of biomarker measurements.
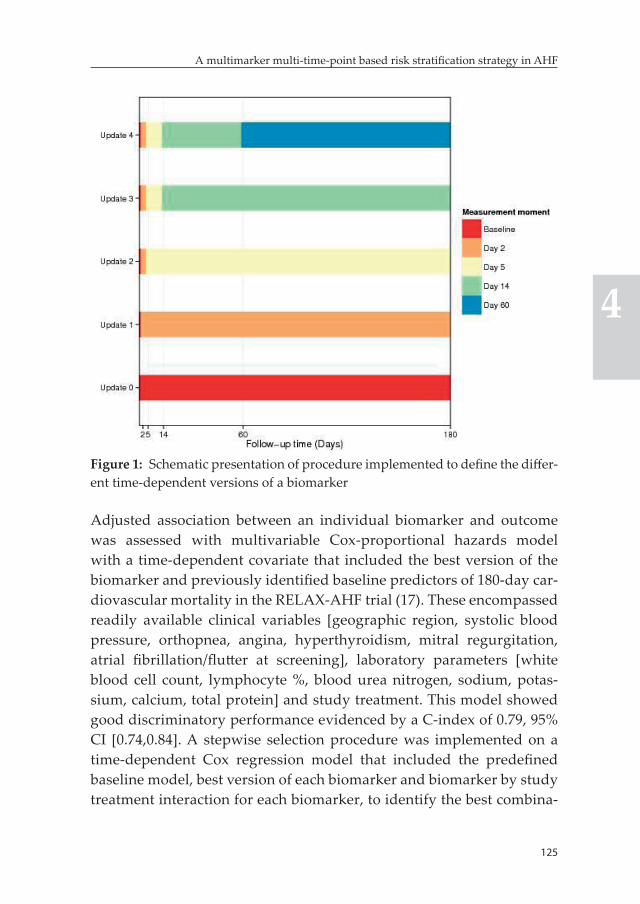
125
A multimarker multi-time-point based risk stratification strategy in AHF
4
Figure 1: Schematic presentation of procedure implemented to define the differ-ent time-dependent versions of a biomarker
Adjusted association between an individual biomarker and outcome was assessed with multivariable Cox-proportional hazards model with a time-dependent covariate that included the best version of the biomarker and previously identified baseline predictors of 180-day car-diovascular mortality in the RELAX-AHF trial (17). These encompassed readily available clinical variables [geographic region, systolic blood pressure, orthopnea, angina, hyperthyroidism, mitral regurgitation, atrial fibrillation/flutter at screening], laboratory parameters [white blood cell count, lymphocyte %, blood urea nitrogen, sodium, potas-sium, calcium, total protein] and study treatment. This model showed good discriminatory performance evidenced by a C-index of 0.79, 95% CI [0.74,0.84]. A stepwise selection procedure was implemented on a time-dependent Cox regression model that included the predefined baseline model, best version of each biomarker and biomarker by study treatment interaction for each biomarker, to identify the best combina-
126
Chapter 4
tion of biomarkers. The predefined baseline model was forced to stay in the model at each step of the selection procedure. Biomarkers and bio-marker by study treatment interactions with p-values lower than 0.05 were retained in the final multimarker model. Added prognostic value of individual and combination of biomarkers was quantified with the absolute gain in the C-index. Patients with complete baseline measure-ments of all candidate biomarkers (N=1033) were included in this analy-sis and missing values in subsequent moments were imputed using the last measurement carried forward approach. Moreover, missing values in variables included in the prespecified baseline model were imputed with the treatment group-specific median (for continuous variables) or the treatment group-specific mode (for categorical variables).
Estimates are presented with 95% confidence intervals. P-value <0.05 was considered statistically significant. Statistical analyses were per-formed using SAS (version 9.4).
Results
Baseline characteristicsAround 62.4% of patients included in the intention-to-treat population were male and mean (SD) age was 72.0 (11.2) years, while 45.2% of patients had LVEF ≥40%. Baseline clinical characteristics and labora-tory values by cardiovascular death status at 180 days are presented in supplementarytable S2.
Biomarker measurementsSummary of levels of the seven analyzed biomarkers at the different time points of measurements is provided in table 1. This set of biomark-ers represents the major pathophysiologic domains involved in heart failure including; myocardial stress and injury, myocardial fibrosis and remodeling, renal function and inflammation among others.
OutcomeA total of 88 patients (7.6%) died from cardiovascular causes within 180 days of the index hospitalization.
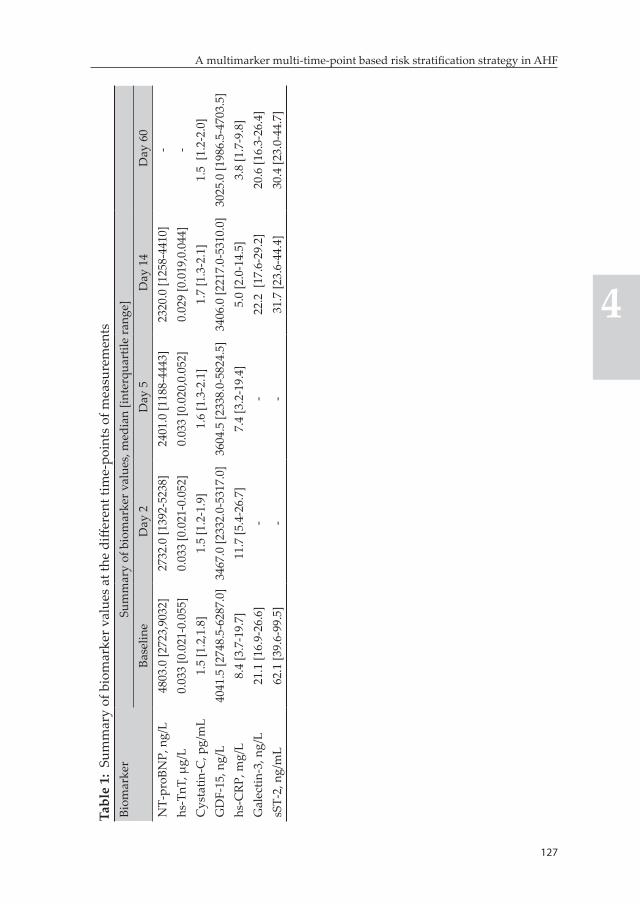
127
A multimarker multi-time-point based risk stratification strategy in AHF
4
Tabl
e 1:
Sum
mar
y of
bio
mar
ker v
alue
s at
the
diffe
rent
tim
e-po
ints
of m
easu
rem
ents
Biom
arke
rSu
mm
ary
of b
iom
arke
r val
ues,
med
ian
[inte
rqua
rtile
rang
e]Ba
selin
eD
ay 2
Day
5D
ay 1
4D
ay 6
0N
T-pr
oBN
P, n
g/L
4803
.0 [2
723,
9032
]27
32.0
[139
2-52
38]
2401
.0 [1
188-
4443
]23
20.0
[125
8-44
10]
-hs
-TnT
, μg/
L 0.
033
[0.0
21-0
.055
]0.
033
[0.0
21-0
.052
]0.
033
[0.0
20,0
.052
]0.
029
[0.0
19,0
.044
]-
Cys
tatin
-C, p
g/m
L1.
5 [1
.2,1
.8]
1.5
[1.2
-1.9
]1.
6 [1
.3-2
.1]
1.7
[1.3
-2.1
]1.
5 [1
.2-2
.0]
GD
F-15
, ng/
L40
41.5
[274
8.5-
6287
.0]
3467
.0 [2
332.
0-53
17.0
]36
04.5
[233
8.0-
5824
.5]
3406
.0 [2
217.
0-53
10.0
]30
25.0
[198
6.5-
4703
.5]
hs-C
RP, m
g/L
8.4
[3.7
-19.
7]11
.7 [5
.4-2
6.7]
7.4
[3.2
-19.
4]5.
0 [2
.0-1
4.5]
3.8
[1.7
-9.8
]G
alec
tin-3
, ng/
L21
.1 [1
6.9-
26.6
]-
-22
.2 [
17.6
-29.
2]20
.6 [1
6.3-
26.4
]sS
T-2,
ng/
mL
62.1
[39.
6-99
.5]
--
31.7
[23.
6-44
.4]
30.4
[23.
0-44
.7]
128
Chapter 4
Comparative analysis of predictive value of baseline, day 2, 5, and 14 measurementsComparison of time-dependent AUCs of individual biomarkers mea-sured from samples collected at baseline and on days 2, 5 and 14 after hospitalization indicated that day 14 measurements provide superior discriminatory accuracy for hs-CRP, GDF-15 and sST-2, while baseline measurements appear to be slightly better for cystatin-C and galectin-3. Measurements beyond baseline provided clearly superior discrimina-tory accuracy over time for hs-TnT and NT-proBNP although there was no obvious difference among the day 2, 5 and 14 measurements (supplementary figure S1).
Time-dependent evaluation of predictive value of biomarkersThe evaluated biomarkers showed distinctive patterns of change in predictive accuracy over the 180-day observation period, irrespective of time of measurement, as depicted in the plots of time-dependent AUCs in supplementary figure S1. hs-CRP was unique in that the predictive accuracy of a single time-point measurement in the first 14 days after hospitalization showed decreasing pattern over longer follow-up times. The other biomarkers showed a more stable discriminatory accuracy for the prediction of cardiovascular mortality over the course of the 180 days of follow-up.
Incremental value of serial evaluation of individual biomarkersThe C-index estimates attained by the different versions of individual biomarkers for the prediction of 180-day cardiovascular mortality are presented in table 2 and figure 2. Day 2 repeat measurement of NT-proBNP provided increment in the C-index while subsequent mea-surments did not show added value. The same pattern was observed for cystatin-C, although the gain with the day 2 measurement was relatively modest. On the other hand, further evaluation of GDF-15 and hs-TnT on day 14, in addition to day 2 or 5 measurements, provided incremental value in terms of improving discriminatory accuracy of the biomarkers. It must be noted that day 5 measurements did not provide incremental value compared to day 2. For hs-CRP and sST-2 (only base-line, day 14 and 60 measurements were available for the latter), each
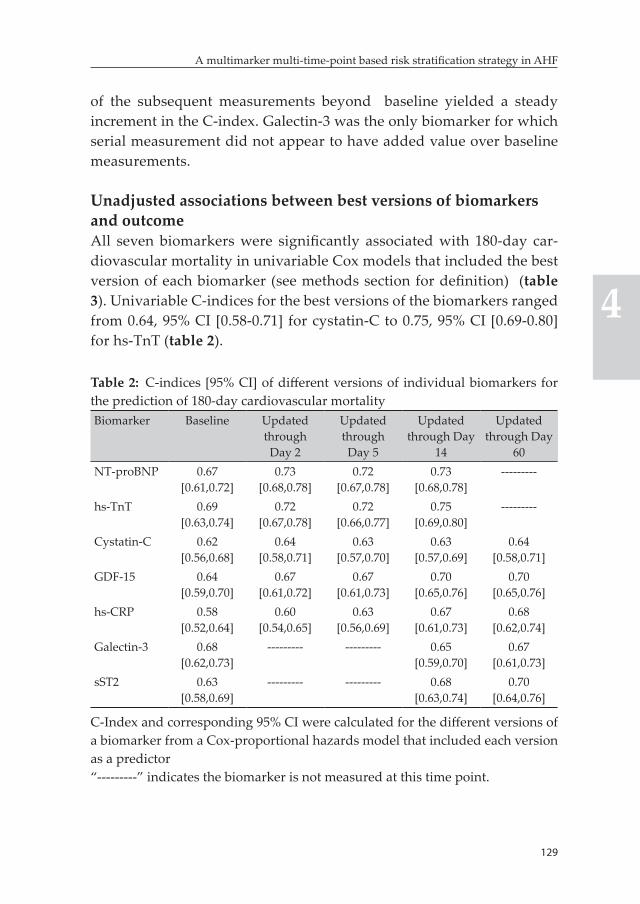
129
A multimarker multi-time-point based risk stratification strategy in AHF
4
of the subsequent measurements beyond baseline yielded a steady increment in the C-index. Galectin-3 was the only biomarker for which serial measurement did not appear to have added value over baseline measurements.
Unadjusted associations between best versions of biomarkers and outcomeAll seven biomarkers were significantly associated with 180-day car-diovascular mortality in univariable Cox models that included the best version of each biomarker (see methods section for definition) (table 3). Univariable C-indices for the best versions of the biomarkers ranged from 0.64, 95% CI [0.58-0.71] for cystatin-C to 0.75, 95% CI [0.69-0.80] for hs-TnT (table 2).
Table 2: C-indices [95% CI] of different versions of individual biomarkers for the prediction of 180-day cardiovascular mortalityBiomarker Baseline Updated
through Day 2
Updated through
Day 5
Updated through Day
14
Updated through Day
60NT-proBNP 0.67
[0.61,0.72]0.73
[0.68,0.78]0.72
[0.67,0.78]0.73
[0.68,0.78]---------
hs-TnT 0.69 [0.63,0.74]
0.72 [0.67,0.78]
0.72 [0.66,0.77]
0.75 [0.69,0.80]
---------
Cystatin-C 0.62 [0.56,0.68]
0.64 [0.58,0.71]
0.63 [0.57,0.70]
0.63 [0.57,0.69]
0.64 [0.58,0.71]
GDF-15 0.64 [0.59,0.70]
0.67 [0.61,0.72]
0.67 [0.61,0.73]
0.70 [0.65,0.76]
0.70 [0.65,0.76]
hs-CRP 0.58 [0.52,0.64]
0.60 [0.54,0.65]
0.63 [0.56,0.69]
0.67 [0.61,0.73]
0.68 [0.62,0.74]
Galectin-3 0.68 [0.62,0.73]
--------- --------- 0.65 [0.59,0.70]
0.67 [0.61,0.73]
sST2 0.63 [0.58,0.69]
--------- --------- 0.68 [0.63,0.74]
0.70 [0.64,0.76]
C-Index and corresponding 95% CI were calculated for the different versions of a biomarker from a Cox-proportional hazards model that included each version as a predictor“---------” indicates the biomarker is not measured at this time point.
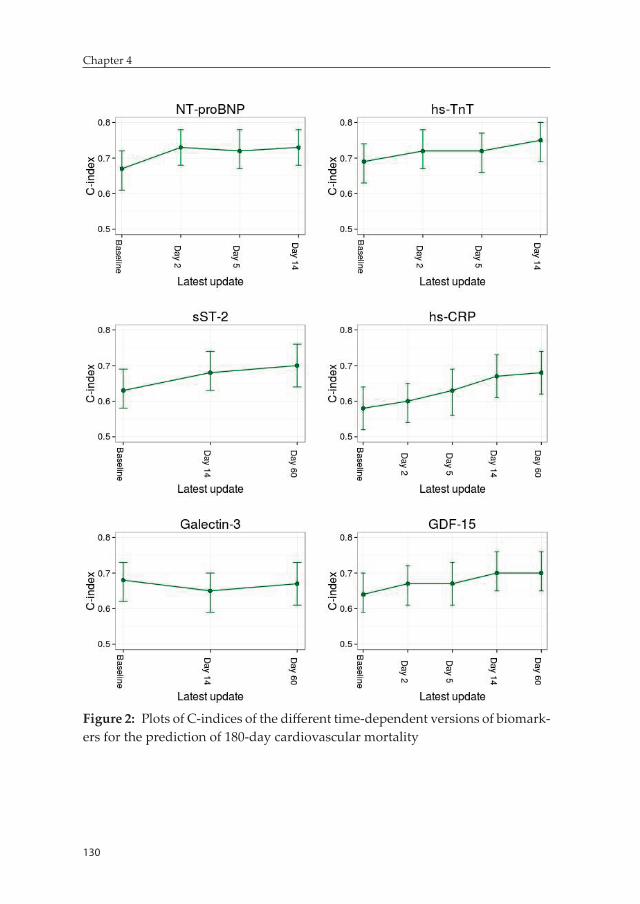
130
Chapter 4
Figure 2: Plots of C-indices of the different time-dependent versions of biomark-ers for the prediction of 180-day cardiovascular mortality
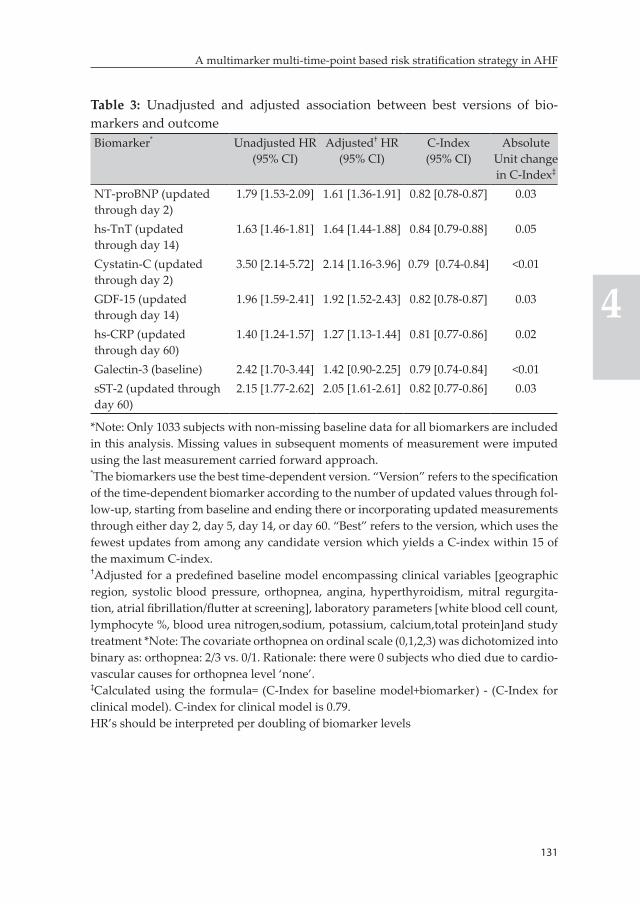
131
A multimarker multi-time-point based risk stratification strategy in AHF
4
Table 3: Unadjusted and adjusted association between best versions of bio-markers and outcomeBiomarker* Unadjusted HR
(95% CI)Adjusted† HR
(95% CI)C-Index (95% CI)
Absolute Unit change in C-Index‡
NT-proBNP (updated through day 2)
1.79 [1.53-2.09] 1.61 [1.36-1.91] 0.82 [0.78-0.87] 0.03
hs-TnT (updated through day 14)
1.63 [1.46-1.81] 1.64 [1.44-1.88] 0.84 [0.79-0.88] 0.05
Cystatin-C (updated through day 2)
3.50 [2.14-5.72] 2.14 [1.16-3.96] 0.79 [0.74-0.84] <0.01
GDF-15 (updated through day 14)
1.96 [1.59-2.41] 1.92 [1.52-2.43] 0.82 [0.78-0.87] 0.03
hs-CRP (updated through day 60)
1.40 [1.24-1.57] 1.27 [1.13-1.44] 0.81 [0.77-0.86] 0.02
Galectin-3 (baseline) 2.42 [1.70-3.44] 1.42 [0.90-2.25] 0.79 [0.74-0.84] <0.01sST-2 (updated through day 60)
2.15 [1.77-2.62] 2.05 [1.61-2.61] 0.82 [0.77-0.86] 0.03
*Note: Only 1033 subjects with non-missing baseline data for all biomarkers are included in this analysis. Missing values in subsequent moments of measurement were imputed using the last measurement carried forward approach.*The biomarkers use the best time-dependent version. “Version” refers to the specification of the time-dependent biomarker according to the number of updated values through fol-low-up, starting from baseline and ending there or incorporating updated measurements through either day 2, day 5, day 14, or day 60. “Best” refers to the version, which uses the fewest updates from among any candidate version which yields a C-index within 15 of the maximum C-index.†Adjusted for a predefined baseline model encompassing clinical variables [geographic region, systolic blood pressure, orthopnea, angina, hyperthyroidism, mitral regurgita-tion, atrial fibrillation/flutter at screening], laboratory parameters [white blood cell count, lymphocyte %, blood urea nitrogen,sodium, potassium, calcium,total protein]and study treatment *Note: The covariate orthopnea on ordinal scale (0,1,2,3) was dichotomized into binary as: orthopnea: 2/3 vs. 0/1. Rationale: there were 0 subjects who died due to cardio-vascular causes for orthopnea level ‘none’.‡Calculated using the formula= (C-Index for baseline model+biomarker) - (C-Index for clinical model). C-index for clinical model is 0.79.HR’s should be interpreted per doubling of biomarker levels
132
Chapter 4
Adjusted associations and added prognostic value of individual biomarkersThe baseline model – a comprehensive model that encompassed 14 known prognosticators in addition to study treatment – had a C-index of 0.79, 95% CI [0.74,0.84]. Six of the seven analyzed biomarkers in-cluding – NT-proBNP, cystatin-C, hs-CRP, hs-TnT, GDF-15 and sST-2 – were independently associated with 180-day cardiovascular mortality in multivariable Cox models that included the best version of each of the individual biomarkers and the prespecificed baseline model and resulted in significant improvement in prognostic performance except for cystatin-C which showed a minimal added prognostic value. The highest prognostic gain was attained with the addition of hs-TnT, which yielded a 0.05 unit absolute increment in the C-index to 0.84, 95% CI [0.79-0.88]. Individual additions of NT-proBNP, GDF-15 and sST-2 to the baseline model also resulted in about 0.04 unit absolute gain in the C-index (table 3).
Multimarker panel and added prognostic value of combination of biomarkersHs-TnT, sST-2, NT-proBNP and GDF-15 and an interaction term be-tween study treatment and GDF-15 were identified for inclusion into a multimarker model after implementation of a stepwise selection proce-dure in which the predefined baseline model was forced a priori. The combined addition of best versions of these biomarkers to the baseline model resulted in a 0.08 unit absolute increment in the C-index to 0.87, 95% CI [0.83,0.91]. This is significantly higher than the increment in C-index attained by the addition of any of the individual biomarkers. All the four biomarkers provided significant additional prognostic in-formation even after adjustment for each other, and variables included in the predefined baseline model (table 4).
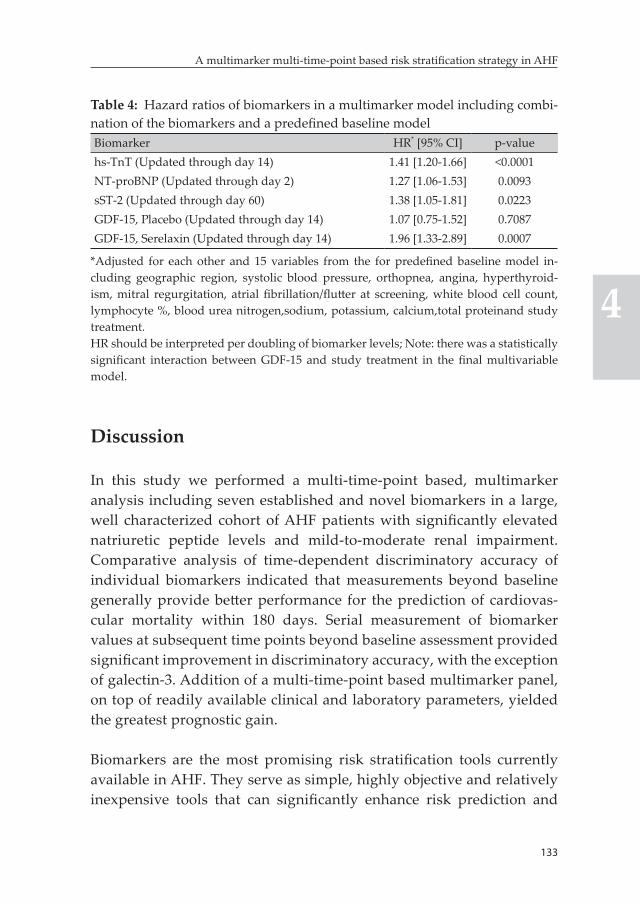
133
A multimarker multi-time-point based risk stratification strategy in AHF
4
Table 4: Hazard ratios of biomarkers in a multimarker model including combi-nation of the biomarkers and a predefined baseline modelBiomarker HR* [95% CI] p-valuehs-TnT (Updated through day 14) 1.41 [1.20-1.66] <0.0001NT-proBNP (Updated through day 2) 1.27 [1.06-1.53] 0.0093sST-2 (Updated through day 60) 1.38 [1.05-1.81] 0.0223GDF-15, Placebo (Updated through day 14) 1.07 [0.75-1.52] 0.7087GDF-15, Serelaxin (Updated through day 14) 1.96 [1.33-2.89] 0.0007
*Adjusted for each other and 15 variables from the for predefined baseline model in-cluding geographic region, systolic blood pressure, orthopnea, angina, hyperthyroid-ism, mitral regurgitation, atrial fibrillation/flutter at screening, white blood cell count, lymphocyte %, blood urea nitrogen,sodium, potassium, calcium,total proteinand study treatment.HR should be interpreted per doubling of biomarker levels; Note: there was a statistically significant interaction between GDF-15 and study treatment in the final multivariable model.
Discussion
In this study we performed a multi-time-point based, multimarker analysis including seven established and novel biomarkers in a large, well characterized cohort of AHF patients with significantly elevated natriuretic peptide levels and mild-to-moderate renal impairment. Comparative analysis of time-dependent discriminatory accuracy of individual biomarkers indicated that measurements beyond baseline generally provide better performance for the prediction of cardiovas-cular mortality within 180 days. Serial measurement of biomarker values at subsequent time points beyond baseline assessment provided significant improvement in discriminatory accuracy, with the exception of galectin-3. Addition of a multi-time-point based multimarker panel, on top of readily available clinical and laboratory parameters, yielded the greatest prognostic gain.
Biomarkers are the most promising risk stratification tools currently available in AHF. They serve as simple, highly objective and relatively inexpensive tools that can significantly enhance risk prediction and
134
Chapter 4
stratification and may pave the way towards need-based, personalized treatment strategies (6, 18-20). In spite of the availability of plenty of prognostic biomarkers in AHF, clinical use remains largely limited. There are several contributing factors for this, besides the lack of evi-dence on the role of risk-guided, tailored treatment strategies. One of these is the fact that current biomarker-based risk prediction and strati-fication strategies primarily focus on single markers. This approach is suboptimal from a pathophysiological point of view since multiple pathophysiologic pathways are involved in heart failure. In addition, data on optimal timing of measurements is required to maximize the prognostic utility of biomarkers. This information is very important given levels of several biomarkers have been shown to change in paral-lel to treatment response (21-24). There is consistent data indicating that admission levels of BNP and NT-proBNP alone have limited prognostic utility. Post-hospital admission measurements of these markers, par-ticularly pre-discharge, should be performed for better prognostication and risk stratification (25-29). However, evidence on timing of mea-surements and incremental value of serial evaluation in AHF is highly limited for majority of the novel biomarkers.
We utilized plots of time-dependent AUCs as a function of time to compare the discriminatory accuracy of biomarker measurements from samples collected at baseline and on days 2, 5 and 14 of the index hospitalization. In line with previous evidence, measurements beyond baseline showed better performance for NT-proBNP (28, 29). Similarly, post-baseline measurements (particularly on day 14) provided superior discriminatory performances for hs-CRP, hs-TnT, GDF-15 and sST-2. Cystatin-C and galectin-3 were unique in that baseline measurements were better or at least comparable to later in-hospital and post-discharge measurements in terms of discriminatory performance. The pattern of change in AUCs over the entire follow-up time was an interesting additional observation from the plots. Most of the biomarkers showed a more stable prognostic accuracy over time irrespective of time of measurement. However, the predictive performance of a single time-point measurement of hs-CRP in the first 14 days after hospitalization showed a decreasing trend over longer follow-up times, particularly
135
A multimarker multi-time-point based risk stratification strategy in AHF
4
after the first 60 days of follow-up. Interestingly, these observations are highly consistent with the findings of our recently reported analysis of biomarkers evaluated in the PROTECT trial (13). These findings raise an important proposition pointing towards the possibility that some mark-ers, particularly those which change with treatment response like sST-2, hs-CRP and hs-TnT, may need to be re-measured to maximize prognos-tic performance, while other more stable markers (e.g. galectin-3), can be measured only once (21-24). Subsequently, we evaluated the added value of serial evaluation of biomarker values with measurements col-lected during the course of hospitalization or shortly after discharge (i.e. days 2, 5 and 14) and 60 days after the index hospital admission (for some biomarkers) and assessed which time points provide incremental prognostic value. Four different patterns were seen from this analysis. Post-baseline measurements did not show added value for galectin-3. On the other hand, re-evaluation of NT-proBNP on day 2 provided significant incremental value while subsequent measurements did not show further added value. Re-evaluation of GDF-15 and hs-TnT on day 14 yielded significant gains in discriminatory performance of the bio-markers, while each sequential measurement through day 60 showed incremental value for hs-CRP and sST-2.
On the other hand, all but one (i.e. galectin-3) of the biomarkers evalu-ated were independently associated with cardiovascular mortality within 180 days of the index hospitalization and five of these includ-ing NT-proBNP, hs-CRP, hs-TnT, GDF-15 and sST-2 provided added prognostic value on top of a predefined baseline model that included 14 readily available clinical and laboratory prognosticators, in addition to study treatment. Nevertheless, the greatest prognostic improvement was attained with the combined addition of hs-TnT, NT-proBNP, sST-2 and GDF-15. The addition of these biomarkers to the baseline model increased the C-index to 0.87, which is in the highest end of the range of model performances reported in AHF so far (30, 31). Interestingly, all of these biomarkers provided significant additional prognostic informa-tion independent of each other in the final multimarker model. This is a further testament to the fact that several pathophysiologic pathways play an important role in determining outcome in AHF patients and
136
Chapter 4
no specific pathway or biomarker can adequately capture all relevant prognostic information.
Clinical implicationsEvaluation of biomarkers during hospital admission is needed from a practical perspective as it can facilitate early decision making regard-ing inhospital treatment, monitoring, and even timing of discharge. However, optimal use of most biomarkers for prognostication and risk stratification requires further evaluation at latter moments during hos-pitalization or post-discharge. While a single repeat measurement of NT-proBNP as early as 48 hours after initiation of in-hospital therapy or, even better, pre-discharge appear to be adequate, additional measure-ment of hs-TnT and GDF-15 on day 14 (nearly a week after discharge for the typical AHF patient) may be needed to maximize predictive value. Moreover, further evaluation of hs-CRP and sST-2 after 2 months of the index hospitalization, besides measurements collected during the first two weeks of the index hospitalization, can enhance the prognostic utility of these biomarkers in the longer term.
Furthermore, array of pathophysiologic pathways have significant independent prognostic implications in patients hospitalized with AHF. Consequently, a shift from the current single marker based risk stratification approach to a more comprehensive strategy utilizing mul-timarker panels is required to optimize the utility of biomarkers for the risk stratification of AHF patients.
Future stepsOur study is only the first step towards the realization of the potential of multimarker panels as highly accurate and objective risk stratifica-tion tools in daily clinical practise. Development and external valida-tion of a simple risk calculator that combines selected readily available clinical parameters together with multi-time-point based multimarker panel will significantly enhance the clinical usability of the latter and this needs to be accomplished in future studies.
137
A multimarker multi-time-point based risk stratification strategy in AHF
4
Strengths and limitationsA comprehensive set of established and novel biomarkers were evalu-ated at multiple time-points in a fairly large, well-characterized cohort of AHF patients which makes this study unique in the field. The results should be interpreted with some caution, however, as we performed a retrospective analysis of biomarker data collected at prespecified time points as part of a clinical trial evaluation. Strict criteria includ-ing BNP≥350 ng/L or NT-proBNP ≥1400 ng/L, mild to moderate renal impairment evidenced by a glomerular filtration rate of 30 to 75 mL/min per 1.73 m2 and admission systolic blood pressure >125mmHg among others needed to be fulfilled for inclusion into the RELAX AHF trial. In addition, several exclusion criteria were involved in the definition of the trial patient population. These might limit the gener-alizability of our findings to the whole AHF patient population and further external validation studies are needed. Moreover, patients were allowed to be included into the trial up to 16 hours after presentation and were required to have received treatment with at least 40 mg of IV furosemide or its equivalent before screening. And hence, baseline evaluation during randomization may not necessarily reflect biomarker levels at hospital admission. In addition, NT-proBNP, hs-TnT, galec-tin-3 and sST-2 were not evaluated at some of the measurement time points assessed. The prognostic performance of biomarkers could be influenced by LVEF status, and hence, there is a possibility that selec-tion of best combination of biomarkers in the different LVEF based phenotypes can, potentially, be different. Our study was, however, not adequately powered to investigate this as the number of patients and events in these subgroups were quite small, particularly for the HFpEF and HFmrEF subgroups. We evaluated whether there is a significant interaction between biomarkers and LVEF status. There was a statisti-cally significant interaction between NT-proBNP and LVEF status in univariable analysis, yet this term was not selected into the final model after implementing the stepwise selection procedure. Subsequently, it is very unlikely that the best combination of biomarkers could have been influenced by LVEF status in the current study. Nonetheless, we acknowledge that this needs further investigation in adequately pow-ered studies in the future.
138
Chapter 4
Conclusion
Serial evaluation of biomarkers, beyond the time of baseline assessment, is generally needed to maximize the prognostic utility of biomarkers in AHF patients with significantly elevated natriuretic peptide levels and mild-to-moderate renal impairment. Combination of biomarkers reflecting diverse pathophysiologic pathways provides significant prognostic improvement on top of readily available clinical and labo-ratory parameters unmatched by any single biomarker. Multimarker models are highly accurate and objective risk stratification tools that can play a crucial role for developing need-based, personalized treat-ment strategies in AHF.
References 1. Dusemund F, Steiner M, Vuilliomenet A, Muller C, Bossart R, Regez K,
Schild U, Conca A, Huber A, Reutlinger B, Muller B, Albrich WC. Multi-disciplinary Assessment to Personalize Length of Stay in Acute Decom-pensated Heart Failure (OPTIMA II ADHF). J Clin Med Res 2012;4:402-409.
2. Blecker S, Ladapo JA, Doran KM, Goldfeld KS, Katz S. Emergency department visits for heart failure and subsequent hospitalization or observation unit admission. Am Heart J 2014;168:901-8.e1.
3. Felker GM, Leimberger JD, Califf RM, Cuffe MS, Massie BM, Adams KF,Jr, Gheorghiade M, O’Connor CM. Risk stratification after hospitalization for decompensated heart failure. J Card Fail 2004;10:460-466.
4. Collins SP, Lindsell CJ, Jenkins CA, Harrell FE, Fermann GJ, Miller KF, Roll SN, Sperling MI, Maron DJ, Naftilan AJ, McPherson JA, Weintraub NL, Sawyer DB, Storrow AB. Risk stratification in acute heart failure: rationale and design of the STRATIFY and DECIDE studies. Am Heart J 2012;164:825-834.
5. Braunwald E. Biomarkers in heart failure. N Engl J Med 2008;358:2148-2159. 6. Manhenke C, Orn S, von Haehling S, Wollert KC, Ueland T, Aukrust P,
Voors AA, Squire I, Zannad F, Anker SD, Dickstein K. Clustering of 37 circulating biomarkers by exploratory factor analysis in patients follow-ing complicated acute myocardial infarction. Int J Cardiol 2013;166:729-735.
7. Ikonomidis I, Michalakeas CA, Lekakis J, Paraskevaidis I, Kremastinos DT. Multimarker approach in cardiovascular risk prediction. Dis Markers 2009;26:273-285.
139
A multimarker multi-time-point based risk stratification strategy in AHF
4
8. Eurlings LW, Sanders-van Wijk S, van Kimmenade R, Osinski A, van Hel-mond L, Vallinga M, Crijns HJ, van Dieijen-Visser MP, Brunner-La Rocca HP, Pinto YM. Multimarker strategy for short-term risk assessment in patients with dyspnea in the emergency department: the MARKED (Multi mARKer Emergency Dyspnea)-risk score. J Am Coll Cardiol 2012;60:1668-1677.
9. Lassus J, Gayat E, Mueller C, Peacock WF, Spinar J, Harjola VP, van Kim-menade R, Pathak A, Mueller T, Disomma S, Metra M, Pascual-Figal D, Laribi S, Logeart D, Nouira S, Sato N, Potocki M, Parenica J, Collet C, Cohen-Solal A, Januzzi JL,Jr, Mebazaa A, GREAT-Network. Incremental value of biomarkers to clinical variables for mortality prediction in acute-ly decompensated heart failure: the Multinational Observational Cohort on Acute Heart Failure (MOCA) study. Int J Cardiol 2013;168:2186-2194.
10. Pascual-Figal DA, Manzano-Fernandez S, Boronat M, Casas T, Garrido IP, Bonaque JC, Pastor-Perez F, Valdes M, Januzzi JL. Soluble ST2, high-sensitivity troponin T- and N-terminal pro-B-type natriuretic peptide: complementary role for risk stratification in acutely decompensated heart failure. Eur J Heart Fail 2011;13:718-725.
11. Rehman SU, Martinez-Rumayor A, Mueller T, Januzzi JL,Jr. Independent and incremental prognostic value of multimarker testing in acute dys-pnea: results from the ProBNP Investigation of Dyspnea in the Emer-gency Department (PRIDE) study. Clin Chim Acta 2008;392:41-45.
12. Mebazaa A, Di Somma S, Maisel AS, Bayes-Genis A. ST2 and multimarker testing in acute decompensated heart failure. Am J Cardiol 2015;115:38B-43B.
13. Demissei BG, Cleland JG, O’Connor CM, Metra M, Ponikowski P, Teerlink JR, Cotter G, Davison B, Givertz MM, Bloomfield DM, Dittrich H, van der Meer P, van Veldhuisen DJ, Hillege HL, Voors AA. Optimizing clinical use of biomarkers in high-risk acute heart failure patients. Eur J Heart Fail 2016;18(3):269-80
14. Ponikowski P, Metra M, Teerlink JR, Unemori E, Felker GM, Voors AA, Filippatos G, Greenberg B, Teichman SL, Severin T, Mueller-Velten G, Cotter G, Davison BA. Design of the RELAXin in acute heart failure study. Am Heart J 2012;163:149-55.e1.
15. Teerlink JR, Cotter G, Davison BA, Felker GM, Filippatos G, Greenberg BH, Ponikowski P, Unemori E, Voors AA, Adams KF,Jr, Dorobantu MI, Grinfeld LR, Jondeau G, Marmor A, Masip J, Pang PS, Werdan K, Teichman SL, Trapani A, Bush CA, Saini R, Schumacher C, Severin TM, Metra M, RELAXin in Acute Heart Failure (RELAX-AHF) Investigators. Serelaxin, recombinant human relaxin-2, for treatment of acute heart failure (RELAX-AHF): a randomised, placebo-controlled trial. Lancet 2013;381:29-39.
16. Heagerty PJ, Lumley T, Pepe MS. Time-dependent ROC curves for censored survival data and a diagnostic marker. Biometrics 2000;56:337-344.
140
Chapter 4
17. Cotter G, Voors AA, Prescott MF, Felker GM, Filippatos G, Greenberg BH, Pang PS, Ponikowski P, Milo O, Hua TA, Qian M, Severin TM, Teerlink JR, Metra M, Davison BA. Growth differentiation factor 15 (GDF-15) in patients admitted for acute heart failure: results from the RELAX-AHF study. Eur J Heart Fail 2015;17:1133-43.
18. Schmitter D, Cotter G, Voors AA. Clinical use of novel biomarkers in heart failure: towards personalized medicine. Heart Fail Rev 2014;19:369-381.
19. Maisel AS, Choudhary R. Biomarkers in acute heart failure--state of the art. Nat Rev Cardiol 2012;9:478-490.
20. Maisel A, Xue Y, Greene SJ, Pang PS, Januzzi JL, Pina IL, DeFilippi C, Butler J. The potential role of natriuretic peptide-guided management for pa-tients hospitalized for heart failure. J Card Fail 2015;21:233-239.
21. Maisel AS, Richards AM, Pascual-Figal D, Mueller C. Serial ST2 testing in hospitalized patients with acute heart failure. Am J Cardiol 2015;115:32B-7B.
22. Metra M, Nodari S, Parrinello G, Specchia C, Brentana L, Rocca P, Fracassi F, Bordonali T, Milani P, Danesi R, Verzura G, Chiari E, Dei Cas L. The role of plasma biomarkers in acute heart failure. Serial changes and in-dependent prognostic value of NT-proBNP and cardiac troponin-T. Eur J Heart Fail 2007;9:776-786.
23. Felker GM, Mentz RJ, Teerlink JR, Voors AA, Pang PS, Ponikowski P, Greenberg BH, Filippatos G, Davison BA, Cotter G, Prescott MF, Hua TA, Lopez-Pintado S, Severin T, Metra M. Serial high sensitivity cardiac troponin T measurement in acute heart failure: insights from the RELAX-AHF study. Eur J Heart Fail 2015;17:1262-1270.
24. Wu AH, Wians F, Jaffe A. Biological variation of galectin-3 and soluble ST2 for chronic heart failure: implication on interpretation of test results. Am Heart J 2013;165:995-999.
25. Kociol RD, Horton JR, Fonarow GC, Reyes EM, Shaw LK, O’Connor CM, Felker GM, Hernandez AF. Admission, discharge, or change in B-type natriuretic peptide and long-term outcomes: data from Organized Program to Initiate Lifesaving Treatment in Hospitalized Patients with Heart Failure (OPTIMIZE-HF) linked to Medicare claims. Circ Heart Fail 2011;4:628-636.
26. Faggiano P, Valle R, Aspromonte N, D’Aloia A, Di Tano G, Barro S, Giovin-azzo P, Milani L, Lorusso R, Dei Cas L. How often we need to measure brain natriuretic peptide (BNP) blood levels in patients admitted to the hospital for acute severe heart failure? Role of serial measurements to improve short-term prognostic stratification. Int J Cardiol 2010;140:88-94.
27. Logeart D, Thabut G, Jourdain P, Chavelas C, Beyne P, Beauvais F, Bouvier E, Solal AC. Predischarge B-type natriuretic peptide assay for identifying patients at high risk of re-admission after decompensated heart failure. J Am Coll Cardiol 2004;43:635-641.
141
A multimarker multi-time-point based risk stratification strategy in AHF
4
28. Noveanu M, Breidthardt T, Potocki M, Reichlin T, Twerenbold R, Uthoff H, Socrates T, Arenja N, Reiter M, Meissner J, Heinisch C, Stalder S, Mueller C. Direct comparison of serial B-type natriuretic peptide and NT-proBNP levels for prediction of short- and long-term outcome in acute decompensated heart failure. Crit Care 2011;15:R1.
29. O’Brien RJ, Squire IB, Demme B, Davies JE, Ng LL. Pre-discharge, but not admission, levels of NT-proBNP predict adverse prognosis following acute LVF. Eur J Heart Fail 2003;5:499-506.
30. Ouwerkerk W, Voors AA, Zwinderman AH. Factors influencing the predic-tive power of models for predicting mortality and/or heart failure hospi-talization in patients with heart failure. JACC Heart Fail 2014;2:429-436.
31. Rahimi K, Bennett D, Conrad N, Williams TM, Basu J, Dwight J, Wood-ward M, Patel A, McMurray J, MacMahon S. Risk prediction in patients with heart failure: a systematic review and analysis. JACC Heart Fail 2014;2:440-446.
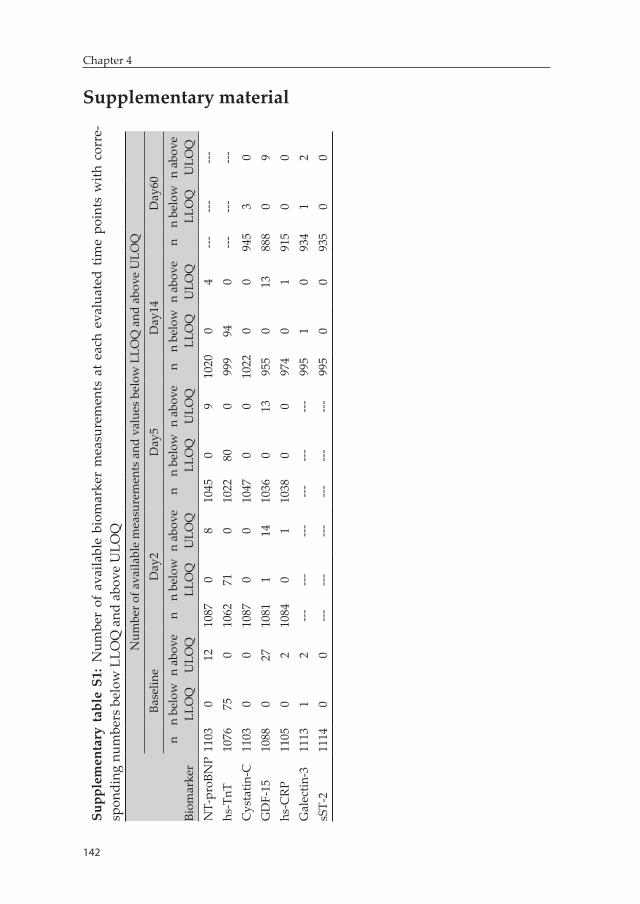
142
Chapter 4
Supplementary materialSu
pple
men
tary
tab
le S
1: N
umbe
r of
ava
ilabl
e bi
omar
ker
mea
sure
men
ts a
t ea
ch e
valu
ated
tim
e po
ints
with
cor
re-
spon
ding
num
bers
bel
ow L
LOQ
and
abo
ve U
LOQ
Biom
arke
r
Num
ber o
f ava
ilabl
e m
easu
rem
ents
and
val
ues
belo
w L
LOQ
and
abo
ve U
LOQ
Base
line
Day
2D
ay5
Day
14D
ay60
nn
belo
w
LLO
Qn
abov
e U
LOQ
nn
belo
w
LLO
Qn
abov
e U
LOQ
nn
belo
w
LLO
Qn
abov
e U
LOQ
nn
belo
w
LLO
Qn
abov
e U
LOQ
nn
belo
w
LLO
Qn
abov
e U
LOQ
NT-
proB
NP
1103
012
1087
08
1045
09
1020
04
------
---hs
-TnT
1076
750
1062
710
1022
800
999
940
------
---C
ysta
tin-C
1103
00
1087
00
1047
00
1022
00
945
30
GD
F-15
1088
027
1081
114
1036
013
955
013
888
09
hs-C
RP11
050
210
840
110
380
097
40
191
50
0G
alec
tin-3
1113
12
------
------
------
995
10
934
12
sST-
211
140
0---
------
------
---99
50
093
50
0
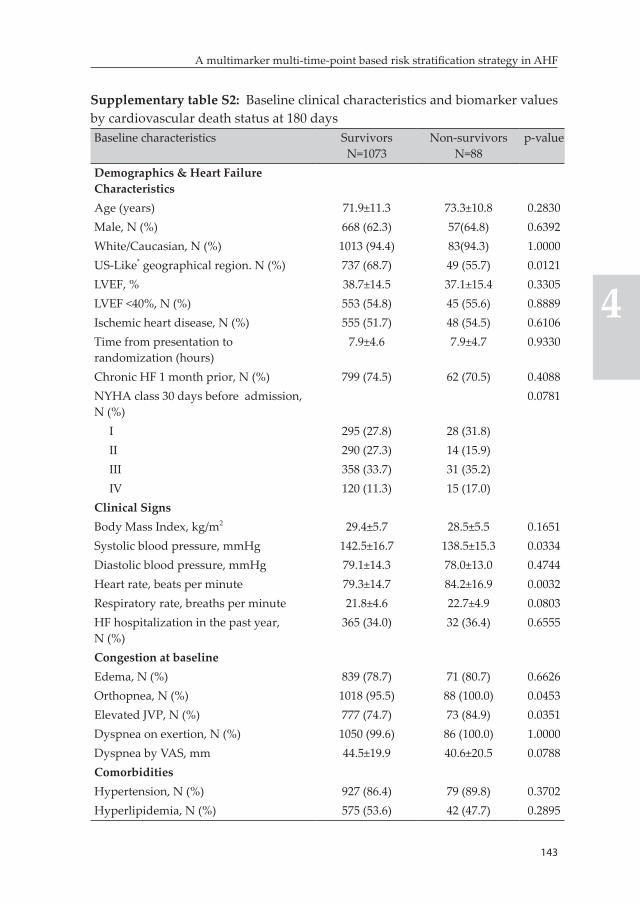
143
A multimarker multi-time-point based risk stratification strategy in AHF
4
Supplementary table S2: Baseline clinical characteristics and biomarker values by cardiovascular death status at 180 daysBaseline characteristics Survivors
N=1073Non-survivors
N=88p-value
Demographics & Heart Failure CharacteristicsAge (years) 71.9±11.3 73.3±10.8 0.2830Male, N (%) 668 (62.3) 57(64.8) 0.6392White/Caucasian, N (%) 1013 (94.4) 83(94.3) 1.0000US-Like* geographical region. N (%) 737 (68.7) 49 (55.7) 0.0121LVEF, % 38.7±14.5 37.1±15.4 0.3305LVEF <40%, N (%) 553 (54.8) 45 (55.6) 0.8889Ischemic heart disease, N (%) 555 (51.7) 48 (54.5) 0.6106Time from presentation to randomization (hours)
7.9±4.6 7.9±4.7 0.9330
Chronic HF 1 month prior, N (%) 799 (74.5) 62 (70.5) 0.4088NYHA class 30 days before admission, N (%)
0.0781
I 295 (27.8) 28 (31.8)II 290 (27.3) 14 (15.9)III 358 (33.7) 31 (35.2)IV 120 (11.3) 15 (17.0)
Clinical SignsBody Mass Index, kg/m2 29.4±5.7 28.5±5.5 0.1651Systolic blood pressure, mmHg 142.5±16.7 138.5±15.3 0.0334Diastolic blood pressure, mmHg 79.1±14.3 78.0±13.0 0.4744Heart rate, beats per minute 79.3±14.7 84.2±16.9 0.0032Respiratory rate, breaths per minute 21.8±4.6 22.7±4.9 0.0803HF hospitalization in the past year, N (%)
365 (34.0) 32 (36.4) 0.6555
Congestion at baselineEdema, N (%) 839 (78.7) 71 (80.7) 0.6626Orthopnea, N (%) 1018 (95.5) 88 (100.0) 0.0453Elevated JVP, N (%) 777 (74.7) 73 (84.9) 0.0351Dyspnea on exertion, N (%) 1050 (99.6) 86 (100.0) 1.0000Dyspnea by VAS, mm 44.5±19.9 40.6±20.5 0.0788ComorbiditiesHypertension, N (%) 927 (86.4) 79 (89.8) 0.3702Hyperlipidemia, N (%) 575 (53.6) 42 (47.7) 0.2895
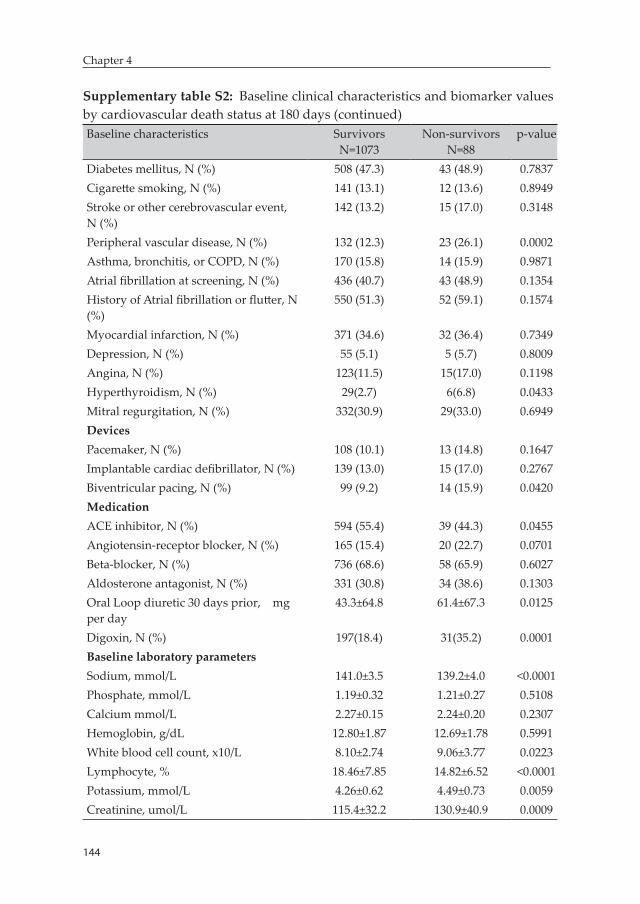
144
Chapter 4
Supplementary table S2: Baseline clinical characteristics and biomarker values by cardiovascular death status at 180 days (continued)Baseline characteristics Survivors
N=1073Non-survivors
N=88p-value
Diabetes mellitus, N (%) 508 (47.3) 43 (48.9) 0.7837Cigarette smoking, N (%) 141 (13.1) 12 (13.6) 0.8949Stroke or other cerebrovascular event, N (%)
142 (13.2) 15 (17.0) 0.3148
Peripheral vascular disease, N (%) 132 (12.3) 23 (26.1) 0.0002Asthma, bronchitis, or COPD, N (%) 170 (15.8) 14 (15.9) 0.9871Atrial fibrillation at screening, N (%) 436 (40.7) 43 (48.9) 0.1354History of Atrial fibrillation or flutter, N (%)
550 (51.3) 52 (59.1) 0.1574
Myocardial infarction, N (%) 371 (34.6) 32 (36.4) 0.7349Depression, N (%) 55 (5.1) 5 (5.7) 0.8009Angina, N (%) 123(11.5) 15(17.0) 0.1198Hyperthyroidism, N (%) 29(2.7) 6(6.8) 0.0433Mitral regurgitation, N (%) 332(30.9) 29(33.0) 0.6949DevicesPacemaker, N (%) 108 (10.1) 13 (14.8) 0.1647Implantable cardiac defibrillator, N (%) 139 (13.0) 15 (17.0) 0.2767Biventricular pacing, N (%) 99 (9.2) 14 (15.9) 0.0420MedicationACE inhibitor, N (%) 594 (55.4) 39 (44.3) 0.0455Angiotensin-receptor blocker, N (%) 165 (15.4) 20 (22.7) 0.0701Beta-blocker, N (%) 736 (68.6) 58 (65.9) 0.6027Aldosterone antagonist, N (%) 331 (30.8) 34 (38.6) 0.1303Oral Loop diuretic 30 days prior, mg per day
43.3±64.8 61.4±67.3 0.0125
Digoxin, N (%) 197(18.4) 31(35.2) 0.0001Baseline laboratory parametersSodium, mmol/L 141.0±3.5 139.2±4.0 <0.0001Phosphate, mmol/L 1.19±0.32 1.21±0.27 0.5108Calcium mmol/L 2.27±0.15 2.24±0.20 0.2307Hemoglobin, g/dL 12.80±1.87 12.69±1.78 0.5991White blood cell count, x10/L 8.10±2.74 9.06±3.77 0.0223Lymphocyte, % 18.46±7.85 14.82±6.52 <0.0001Potassium, mmol/L 4.26±0.62 4.49±0.73 0.0059Creatinine, umol/L 115.4±32.2 130.9±40.9 0.0009
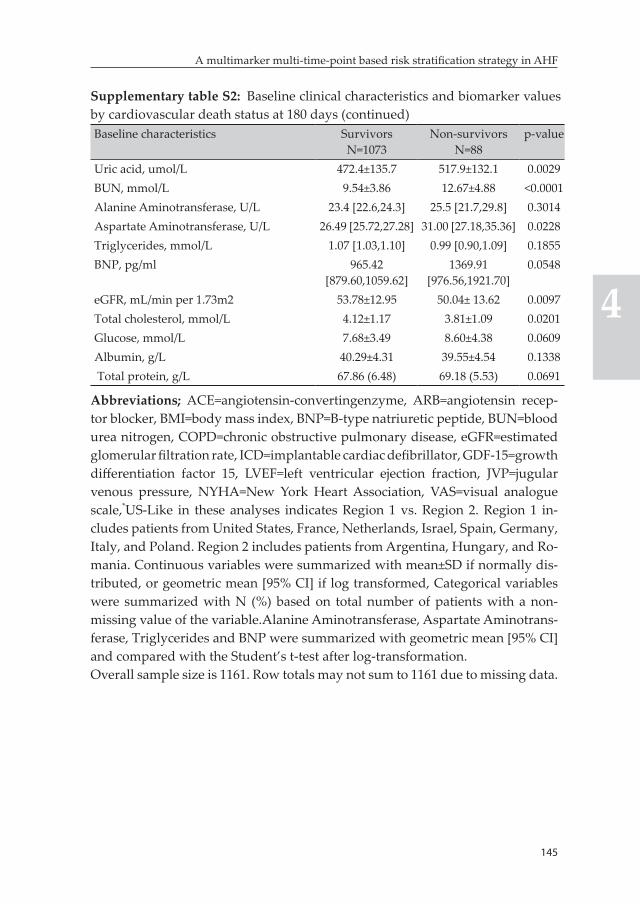
145
A multimarker multi-time-point based risk stratification strategy in AHF
4
Supplementary table S2: Baseline clinical characteristics and biomarker values by cardiovascular death status at 180 days (continued)Baseline characteristics Survivors
N=1073Non-survivors
N=88p-value
Uric acid, umol/L 472.4±135.7 517.9±132.1 0.0029BUN, mmol/L 9.54±3.86 12.67±4.88 <0.0001Alanine Aminotransferase, U/L 23.4 [22.6,24.3] 25.5 [21.7,29.8] 0.3014Aspartate Aminotransferase, U/L 26.49 [25.72,27.28] 31.00 [27.18,35.36] 0.0228Triglycerides, mmol/L 1.07 [1.03,1.10] 0.99 [0.90,1.09] 0.1855BNP, pg/ml 965.42
[879.60,1059.62]1369.91
[976.56,1921.70]0.0548
eGFR, mL/min per 1.73m2 53.78±12.95 50.04± 13.62 0.0097Total cholesterol, mmol/L 4.12±1.17 3.81±1.09 0.0201Glucose, mmol/L 7.68±3.49 8.60±4.38 0.0609Albumin, g/L 40.29±4.31 39.55±4.54 0.1338 Total protein, g/L 67.86 (6.48) 69.18 (5.53) 0.0691
Abbreviations; ACE=angiotensin-convertingenzyme, ARB=angiotensin recep-tor blocker, BMI=body mass index, BNP=B-type natriuretic peptide, BUN=blood urea nitrogen, COPD=chronic obstructive pulmonary disease, eGFR=estimated glomerular filtration rate, ICD=implantable cardiac defibrillator, GDF-15=growth differentiation factor 15, LVEF=left ventricular ejection fraction, JVP=jugular venous pressure, NYHA=New York Heart Association, VAS=visual analogue scale,*US-Like in these analyses indicates Region 1 vs. Region 2. Region 1 in-cludes patients from United States, France, Netherlands, Israel, Spain, Germany, Italy, and Poland. Region 2 includes patients from Argentina, Hungary, and Ro-mania. Continuous variables were summarized with mean±SD if normally dis-tributed, or geometric mean [95% CI] if log transformed, Categorical variables were summarized with N (%) based on total number of patients with a non-missing value of the variable.Alanine Aminotransferase, Aspartate Aminotrans-ferase, Triglycerides and BNP were summarized with geometric mean [95% CI] and compared with the Student’s t-test after log-transformation.Overall sample size is 1161. Row totals may not sum to 1161 due to missing data.
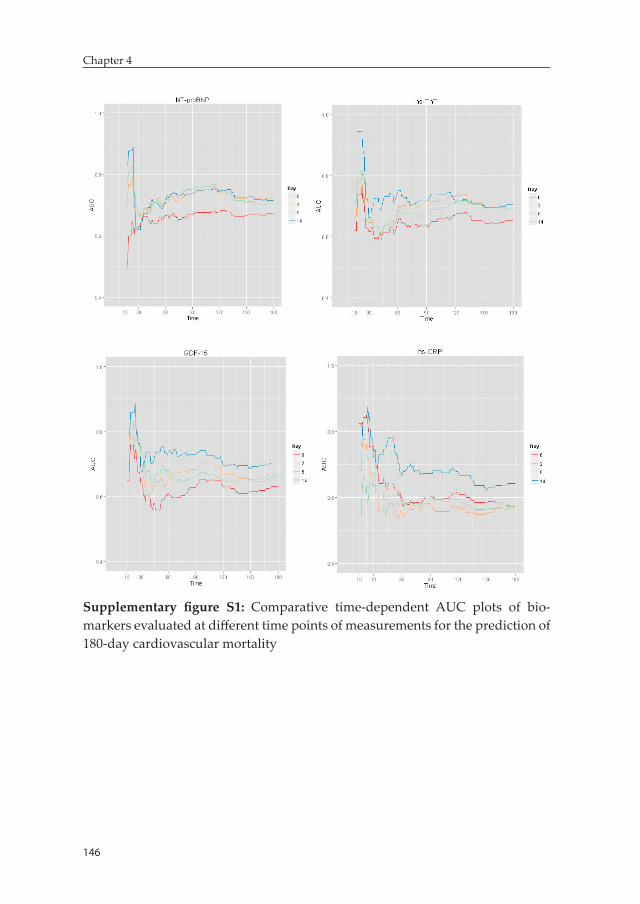
146
Chapter 4
Supplementary figure S1: Comparative time-dependent AUC plots of bio-markers evaluated at different time points of measurements for the prediction of 180-day cardiovascular mortality


Chapter 5: Procalcitonin-based indication of bacterial infection identifies high risk AHF patients
Biniyam G. Demissei, John G. Cleland, Christopher M. O’Connor, Marco Metra, Piotr Ponikowski, John R. Teerlink, Beth Davison, Michael M. Givertz, Daniel M. Bloomfield, Howard Dittrich, Dirk J. van Veldhuisen, Hans L. Hillege, Adriaan A. Voors, Gad Cotter
International journal of cardiology 2016;204:164-171.
150
Chapter 5
Abstract
Background: Bacterial infections in patients hospitalized with acute heart failure(AHF) are related to worse prognosis, but they can be difficult to diagnose. In this study we evaluated the prevalence, clinical correlates and association with outcomes of significantly elevated procalcitonin levels in patients hospitalized for AHF without clear signs of bacterial infection.
Methods: 1781 patients from the PROTECT trial were included. Patients with a body temperature >38oC, sepsis or active infection requiring IV antibiotics were excluded. Significant elevation of procalcitonin was considered present when levels exceeded 0.20 ng/mL. In-hospital and post-discharge outcomes were compared between groups of patients with and without elevated procalcitonin levels.
Results: Procalcitonin ≥0.20 ng/mL was seen in 6.0% of patients (N=104). This group of patients had lower serum albumin, lower hemoglobin, higher leukocyte count, higher C-reactive protein, higher blood urea nitrogen, higher heart rate and more pulmonary rales. Interestingly, no significant differences were observed between the two groups in terms of severity of heart failure evidenced by left ventricular ejection fraction (LVEF) or B-type natriuretic peptide (BNP) levels. Patients with significantly elevated procalcitonin levels were more often classified as treatment failure or unchanged status, and had an increased risk of 30-day all-cause mortality even after adjustment for estabilished prognosticators; HR=2.3 (95% CI, 1.3-4.2), (P<0.01).
Conclusion: Patients with AHF and significantly elevated procalcitonin levels, indicating probable undiagnosed/untreated bacterial infection, had poorer in-hospital and post-discharge outcomes, despite similar severity of heart failure.
Keywords: acute heart failure, procalcitonin, bacterial infection, prognosis
151
Procalcitonin-based indication of bacterial infection identifies high risk AHF patients
5
Introduction
Bacterial infections are one of the main factors associated with exacer-bations leading to heart failure admissions. Respiratory infections have been identified as precipitating factors in 15-20% of hospitalizations for decompensated heart failure (1, 2). In addition to increasing length of hospital stay and in-hospital mortality, the presence of bacterial infec-tions is associated with poor post-discharge outcomes (1).
Early and accurate detection of bacterial infections and initiation of appropriate treatment is paramount to reducing associated risk. How-ever, clinical diagnosis of bacterial infections, particularly pulmonary, in patients hospitalized with decompensated heart failure can be chal-lenging due to overlapping clinical features and radiologic findings (3, 4). Moreover, occult bacteremia is not an uncommon phenomenon among Emergency Department patients (5, 6). Seigel et al indicated that more than a third of Emergency Department patients with blood culture-proven bacteremia had normal body temperature and more than half had normal leukocyte count (7).
Biomarkers can be used to facilitate rapid and accurate diagnosis of bacterial infections and potentially lead to early initiation of antibiotic treatment in patients hospitalized with AHF. C-reactive protein (CRP) has been studied extensively for the point-of-care diagnosis of bacterial infections in both primary and intensive care settings (8-12). However, lack of specificity, in particular in inflammatory states such as AHF, has limited its clinical value (13). Procalcitonin – a 14.5 kDa protein containing 116 amino acids which is upregulated in infective states in response to microbial toxins and proinflammatory mediators – is the most promising biomarker for the detection of bacterial infections (14-20). Significant elevation of serum procalcitonin levels had been reported to allow detection of systemic bacterial infections with a speci-ficity reaching up to 90% to 100% (4, 16-19).
152
Chapter 5
In this study we evaluated the prevalence, predictors and association with outcomes of significantly elevated procalcitonin levels in patients hospitalized with AHF without overt clinical signs of bacterial infection.
Methods
Study populationPROTECT is a multicenter, randomized, double-blind, placebo-controlled trial, which enrolled 2033 adult patients with a history of heart failure, who were hospitalized for AHF. Patients with tempera-ture ≥380C (oral or equivalent) or sepsis or active infection requiring IV antimicrobial treatment during screening were excluded from the trial. Details of the design and main results of the study have been published previously (21, 22). All patients provided written informed consent. The study was conducted in compliance with the Declaration of Helsinki and was approved by all local ethics committees. A total of 1787 patients with available baseline measurements of procalcitonin were considered for inclusion in the current analysis. Six patients with protocol violations related to the presence of fever or IV antibiotic use during randomization were excluded (median [interquartile range] lev-els of procalcitonin in this group of patients was 1.45 ng/mL [0.31-1.70].
DefinitionsSignificant elevation of procalcitonin was considered present when baseline levels exceeded 0.20 ng/mL. Hausfater et al reported a sensitiv-ity of 62% and specificity of 88% at this cut-off value for the diagnosis of systemic bacterial infection in the Emergency Department; corre-sponding positive predictive value (PPV) and negative predictive value (NPV) were 74% and 81%, respectively (23). Patients with levels <0.20 ng/mL were considered to have low procalcitonin levels. A sensitivity analysis was performed using two additional cut-off values; 0.10 ng/mL and 0.40 ng/mL. In the Emergency Department setting, at a cut-off value of 0.10 ng/mL, procalcitonin showed an NPV close to 100% for the diagnosis of bacterial infections but with low PPV while at 0.40 ng/mL the PPV reached nearly 100%, yet this comes at a cost of low NPV (24).
153
Procalcitonin-based indication of bacterial infection identifies high risk AHF patients
5
Biomarker measurementsProcalcitonin was measured in available frozen serum samples collected at baseline using sandwich enzyme-linked immonsorbent assay (ELISA) on a microtiter plate. The immunoassay was developed by Alere Inc., San Diego, CA, USA. This research assay has not been standardized to the commercialized assays used in research or in clinical use and the extent to which this Alere assay correlates with the commercial assay is not fully characterized. Lower detection limit of the procalcitonin assay was 0.002 ng/ml. Additionally, CRP was evaluated using competitive ELISA assay on a Luminex® platform. B-type natriuretic peptide (BNP) was measured in frozen plasma samples using high sensitive single molecule counting (SMC™) technology (RUO, Erenna® Immunoassay System, Singulex Inc., Alameda, CA, USA). Other routine biochemical and hematologic parameters, including total leukocyte count, were measured in a central laboratory (ICON Laboratories, Farmingdale, New York).
Study outcomesBoth in-hospital and post-discharge outcomes were assessed. In-hospital outcome evaluated was the primary endpoint of the PROTECT trial for which patients were classified into one of these three categories: ‘‘suc-cess’’, ‘‘unchanged’’ or ‘‘failure’’ as previously described (21, 22). Suc-cess was defined as patient-reported moderate or marked improvement in dyspnea at both 24 and 48 hours after administration of the study drug, in the absence of any criterion for failure. Failure was defined as the occurrence of any of the following: death or readmission for heart failure through day 7, worsening symptoms and signs of heart failure occurring more than 24 hours after the initiation of the study drug requiring intervention by day 7 or discharge (if earlier), or persistent worsening renal function, defined as an increase in the serum creatinine level of 0.3 mg/dl or more from randomization to day 7, confirmed at day 14, or the initiation of hemofiltration or dialysis during the period from initiation of the study drug through day 7. Patients were classified as having unchanged treatment status if they met neither the criteria for treatment success nor the criteria for treatment failure.
154
Chapter 5
Post-discharge outcomes evaluated were (1) time-to-death from any cause through day 30, (2) time-to-death or rehospitalization for renal or cardiovascular causes through day 30, (3) time-to-death or rehospi-talization for any cause through day 30, and (4) time-to-death through 180 days.
Statistical analysisAll analyses were performed based on the intention-to-treat popula-tion. The study drug rolofylline did not have significant effect on any of the outcomes assessed in this study (22). Categorical variables are presented as counts and percentages. Continuous variables are pre-sented as mean ±standard deviation or median (interquartile range) for normally and non-normally distributed variables, respectively. Patients with and without significant procalcitonin elevation were compared with chi-square, Student’s t-test and Wilcoxon tests as appropriate.
A multivariable logistic regression model was developed to assess the predictors for the presence of significantly elevated procalcitonin levels. Age, sex, heart rate, respiratory rate, systolic blood pressure, pulmo-nary rales, peripheral edema, NYHA class in prior month, histories of COPD, asthma or bronchitis, diabetes mellitus, myocardial infarction, ischaemic heart disease, malignancy, atrial fibrillation and past heart failure hospitalization, serum albumin, blood urea nitrogen, serum cre-atinine, hemoglobin, total leukocyte count and BNP were considered candidate predictors. Stepwise backward selection with bootstrapping was then performed to select the final model. Variables associated with a p-value <0.2 in univariable analysis were included. Missing data was considered missing at random and no imputation was performed.
Proportions of patients within each category of the in-hospital outcome were compared between groups of patients with and without significant procalcitonin elevation using the chi-square test. Adjusted association was evaluated in a multivariable multinomial logistic regression model that included variables from a previously published PROTECT inhos-pital risk model which encompassed blood urea nitrogen, respiratory rate, systolic blood pressure, heart rate, serum albumin, total choles-
155
Procalcitonin-based indication of bacterial infection identifies high risk AHF patients
5
terol, diabetes mellitus and past heart failure hospitalization (25). The success category was treated as the reference category in this analysis.
Kaplan-Meier survival curves were utilized for the graphical assess-ment of post-discharge outcomes. Groups of patients with and without significantly elevated procalcitonin levels were compared with the log-rank test. Adjusted associations were evaluated with multivariable Cox proportional hazards models that included variables from a previ-ously published prognostic model developed in the PROTECT trial (26). These variables included age, systolic blood pressure, past hospitaliza-tion for heart failure, edema, albumin, creatinine, blood urea nitrogen and sodium. The model showed good calibration and moderate to good discriminatory performance for the post-discharge outcomes evalu-ated; published Harrell’s C-indices were 0.77, 0.72, 0.65 and 0.64 for 30-day all-cause mortality, 180-day all-cause mortality, 30-day death or rehospitalization for renal or cardiovascular causes and 30-day death or all-cause rehospitalization, respectively (26). Moreover, in retrospect, we observed that heart rate, hemoglobin and total leukocyte count were significantly associated with elevated procalcitonin levels. Given these factors are also known to be associated with outcomes in AHF patients, they can potentially confound the association between procalcitonin elevation and outcomes. Subsequently, we performed a sensitivity analysis of the adjusted association between procalcitonin elevation and outcomes in multivariable Cox-models that included heart rate, hemoglobin and total leukocyte count, in addition to the previous eight variables.
Furthermore, we assessed the gradient of risk of post-discharge outcomes associated with procalcitonin levels along the continuum of the latter in multivariable Cox proportional hazards models that included the above mentioned eight prognostic variables, in addition to procalcitonin on the continuous scale. Estimates are presented with 95% confidence intervals. P-value <0.05 was considered statistically sig-nificant. Statistical analyses were performed using R: A Language and Environment for Statistical Computing, version 3.0.2 (R Foundation for Statistical Computing, Vienna, Austria).
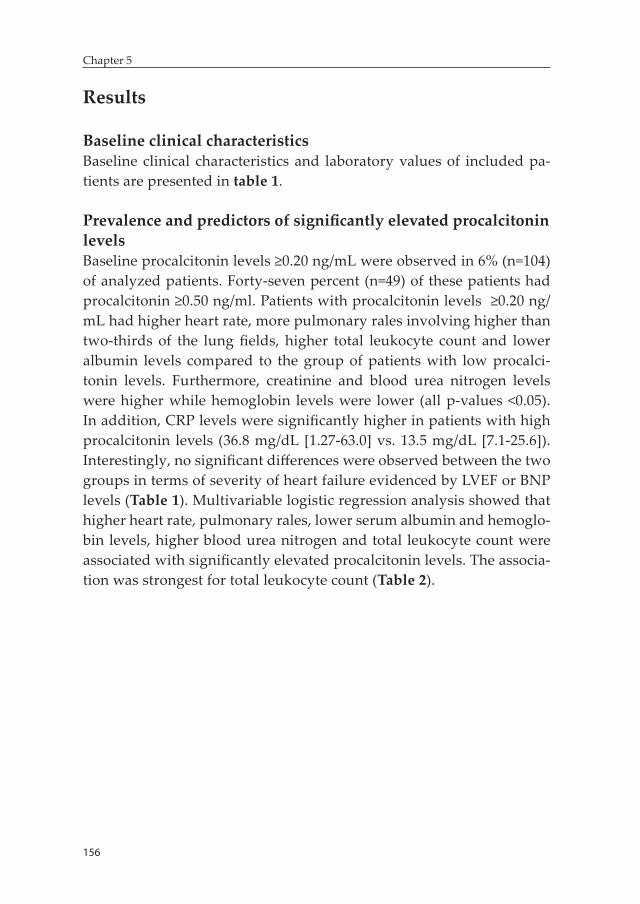
156
Chapter 5
Results
Baseline clinical characteristicsBaseline clinical characteristics and laboratory values of included pa-tients are presented in table 1.
Prevalence and predictors of significantly elevated procalcitonin levelsBaseline procalcitonin levels ≥0.20 ng/mL were observed in 6% (n=104) of analyzed patients. Forty-seven percent (n=49) of these patients had procalcitonin ≥0.50 ng/ml. Patients with procalcitonin levels ≥0.20 ng/mL had higher heart rate, more pulmonary rales involving higher than two-thirds of the lung fields, higher total leukocyte count and lower albumin levels compared to the group of patients with low procalci-tonin levels. Furthermore, creatinine and blood urea nitrogen levels were higher while hemoglobin levels were lower (all p-values <0.05). In addition, CRP levels were significantly higher in patients with high procalcitonin levels (36.8 mg/dL [1.27-63.0] vs. 13.5 mg/dL [7.1-25.6]). Interestingly, no significant differences were observed between the two groups in terms of severity of heart failure evidenced by LVEF or BNP levels (Table 1). Multivariable logistic regression analysis showed that higher heart rate, pulmonary rales, lower serum albumin and hemoglo-bin levels, higher blood urea nitrogen and total leukocyte count were associated with significantly elevated procalcitonin levels. The associa-tion was strongest for total leukocyte count (Table 2).
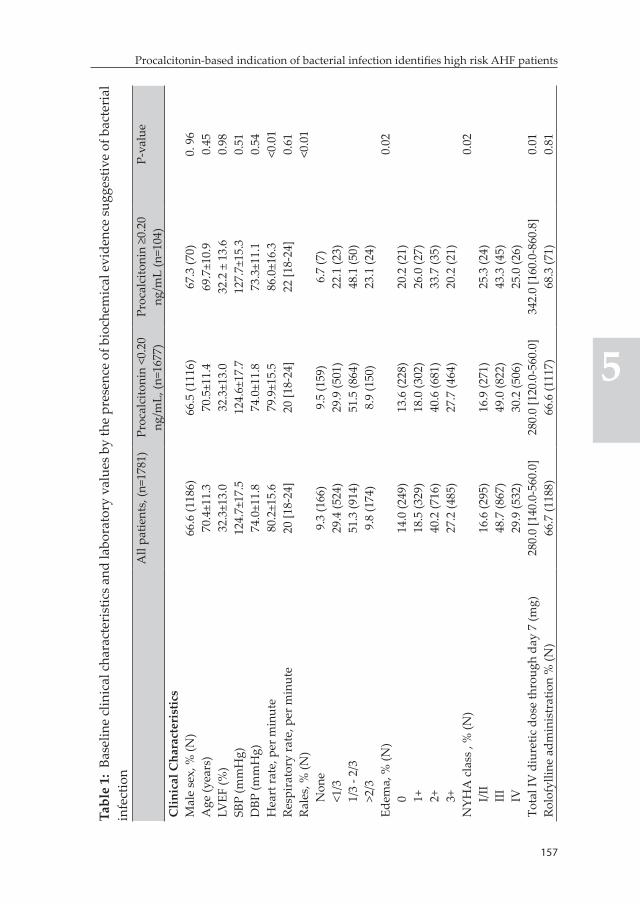
157
Procalcitonin-based indication of bacterial infection identifies high risk AHF patients
5
Tabl
e 1:
Bas
elin
e cl
inic
al c
hara
cter
istic
s and
labo
rato
ry v
alue
s by
the
pres
ence
of b
ioch
emic
al e
vide
nce
sugg
estiv
e of
bac
teri
al
infe
ctio
nA
ll pa
tient
s, (n
=178
1)Pr
ocal
cito
nin
<0.2
0 ng
/mL,
(n=1
677)
Proc
alci
toni
n ≥0
.20
ng/m
L (n
=104
)P-
valu
e
Clin
ical
Cha
ract
eris
tics
Mal
e se
x, %
(N)
66.6
(118
6)66
.5 (1
116)
67.3
(70)
0. 9
6A
ge (y
ears
)70
.4±1
1.3
70.5
±11.
469
.7±1
0.9
0.45
LVEF
(%)
32.3
±13.
032
.3±1
3.0
32.2
± 1
3.6
0.98
SBP
(mm
Hg)
124.
7±17
.512
4.6±
17.7
127.
7±15
.30.
51D
BP (m
mH
g)74
.0±1
1.8
74.0
±11.
873
.3±1
1.1
0.54
Hea
rt ra
te, p
er m
inut
e80
.2±1
5.6
79.9
±15.
586
.0±1
6.3
<0.0
1Re
spir
ator
y ra
te, p
er m
inut
e20
[18-
24]
20 [1
8-24
]22
[18-
24]
0.61
Rale
s, %
(N)
<0.0
1N
one
9.3
(166
)9.
5 (1
59)
6.7
(7)
<1/3
29.4
(524
)29
.9 (5
01)
22.1
(23)
1/3
- 2/3
51.3
(914
)51
.5 (8
64)
48.1
(50)
>2/3
9.8
(174
)8.
9 (1
50)
23.1
(24)
Edem
a, %
(N)
0.02
014
.0 (2
49)
13.6
(228
)20
.2 (2
1)1+
18.5
(329
)18
.0 (3
02)
26.0
(27)
2+40
.2 (7
16)
40.6
(681
)33
.7 (3
5)3+
27.2
(485
)27
.7 (4
64)
20.2
(21)
NYH
A c
lass
, %
(N)
0.02
I/II
16.6
(295
)16
.9 (2
71)
25.3
(24)
III
48.7
(867
)49
.0 (8
22)
43.3
(45)
IV29
.9 (5
32)
30.2
(506
)25
.0 (2
6)To
tal I
V d
iure
tic d
ose
thro
ugh
day
7 (m
g)28
0.0
[140
.0-5
60.0
]28
0.0
[120
.0-5
60.0
]34
2.0
[160
.0-8
60.8
]0.
01Ro
lofy
lline
adm
inis
trat
ion
% (N
)66
.7 (1
188)
66.6
(111
7)68
.3 (7
1)0.
81
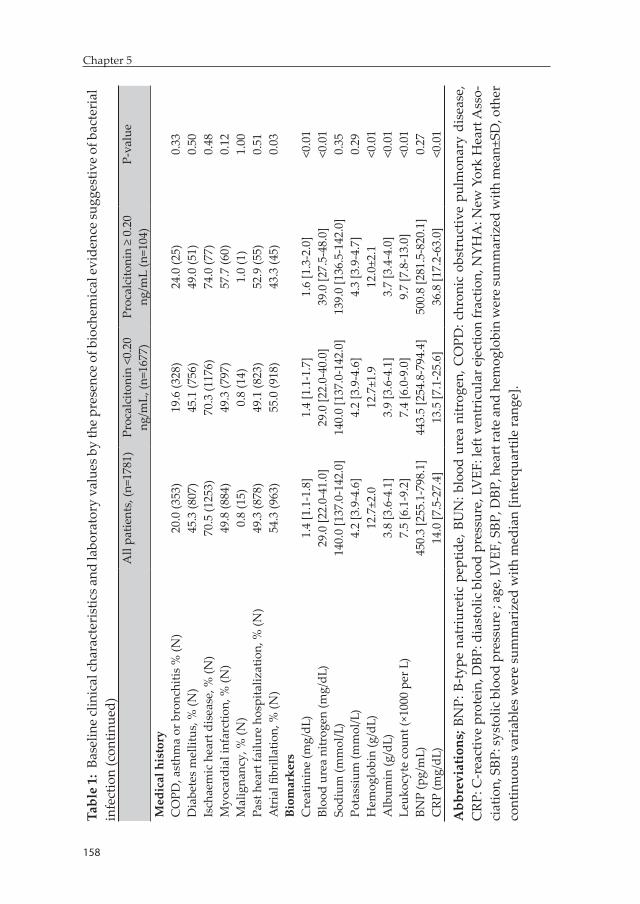
158
Chapter 5
159
Procalcitonin-based indication of bacterial infection identifies high risk AHF patients
5
Tabl
e 1:
Bas
elin
e cl
inic
al ch
arac
teri
stic
s and
labo
rato
ry v
alue
s by
the
pres
ence
of b
ioch
emic
al e
vide
nce
sugg
estiv
e of
bac
teri
al
infe
ctio
n (c
ontin
ued)
All
patie
nts,
(n=1
781)
Proc
alci
toni
n <0
.20
ng/m
L, (n
=167
7)Pr
ocal
cito
nin
≥ 0.
20
ng/m
L (n
=104
)P-
valu
e
Med
ical
his
tory
CO
PD, a
sthm
a or
bro
nchi
tis %
(N)
20.0
(353
)19
.6 (3
28)
24.0
(25)
0.33
Dia
bete
s m
ellit
us, %
(N)
45.3
(807
)45
.1 (7
56)
49.0
(51)
0.50
Isch
aem
ic h
eart
dis
ease
, % (N
)70
.5 (1
253)
70.3
(117
6)74
.0 (7
7)0.
48M
yoca
rdia
l inf
arct
ion,
% (N
)49
.8 (8
84)
49.3
(797
)57
.7 (6
0)0.
12M
alig
nanc
y, %
(N)
0.8
(15)
0.8
(14)
1.0
(1)
1.00
Past
hea
rt fa
ilure
hos
pita
lizat
ion,
% (N
)49
.3 (8
78)
49.1
(823
)52
.9 (5
5)0.
51A
tria
l fibr
illat
ion,
% (N
)54
.3 (9
63)
55.0
(918
)43
.3 (4
5)0.
03Bi
omar
kers
Cre
atin
ine
(mg/
dL)
1.4
[1.1
-1.8
]1.
4 [1
.1-1
.7]
1.6
[1.3
-2.0
]<0
.01
Bloo
d ur
ea n
itrog
en (m
g/dL
)29
.0 [2
2.0-
41.0
]29
.0 [2
2.0-
40.0
]39
.0 [2
7.5-
48.0
]<0
.01
Sodi
um (m
mol
/L)
140.
0 [1
37.0
-142
.0]
140.
0 [1
37.0
-142
.0]
139.
0 [1
36.5
-142
.0]
0.35
Pota
ssiu
m (m
mol
/L)
4.2
[3.9
-4.6
]4.
2 [3
.9-4
.6]
4.3
[3.9
-4.7
]0.
29H
emog
lobi
n (g
/dL)
12.7
±2.0
12.7
±1.9
12.0
±2.1
<0.0
1A
lbum
in (g
/dL)
3.8
[3.6
-4.1
]3.
9 [3
.6-4
.1]
3.7
[3.4
-4.0
]<0
.01
Leuk
ocyt
e co
unt (
×100
0 pe
r L)
7.5
[6.1
-9.2
]7.
4 [6
.0-9
.0]
9.7
[7.8
-13.
0]<0
.01
BNP
(pg/
mL)
450.
3 [2
55.1
-798
.1]
443.
5 [2
54.8
-794
.4]
500.
8 [2
81.5
-820
.1]
0.27
CRP
(mg/
dL)
14.0
[7.5
-27.
4]13
.5 [7
.1-2
5.6]
36.8
[17.
2-63
.0]
<0.0
1
Abb
revi
atio
ns; B
NP:
B-ty
pe n
atri
uret
ic p
eptid
e, B
UN
: blo
od u
rea
nitr
ogen
, CO
PD: c
hron
ic o
bstr
uctiv
e pu
lmon
ary
dise
ase,
C
RP: C
-rea
ctiv
e pr
otei
n, D
BP: d
iast
olic
blo
od p
ress
ure,
LV
EF: l
eft v
entr
icul
ar e
ject
ion
frac
tion,
NYH
A: N
ew Y
ork
Hea
rt A
sso-
ciat
ion,
SBP
: sys
tolic
blo
od p
ress
ure
; age
, LV
EF, S
BP, D
BP, h
eart
rate
and
hem
oglo
bin
wer
e su
mm
ariz
ed w
ith m
ean±
SD, o
ther
co
ntin
uous
var
iabl
es w
ere
sum
mar
ized
with
med
ian
[inte
rqua
rtile
rang
e].
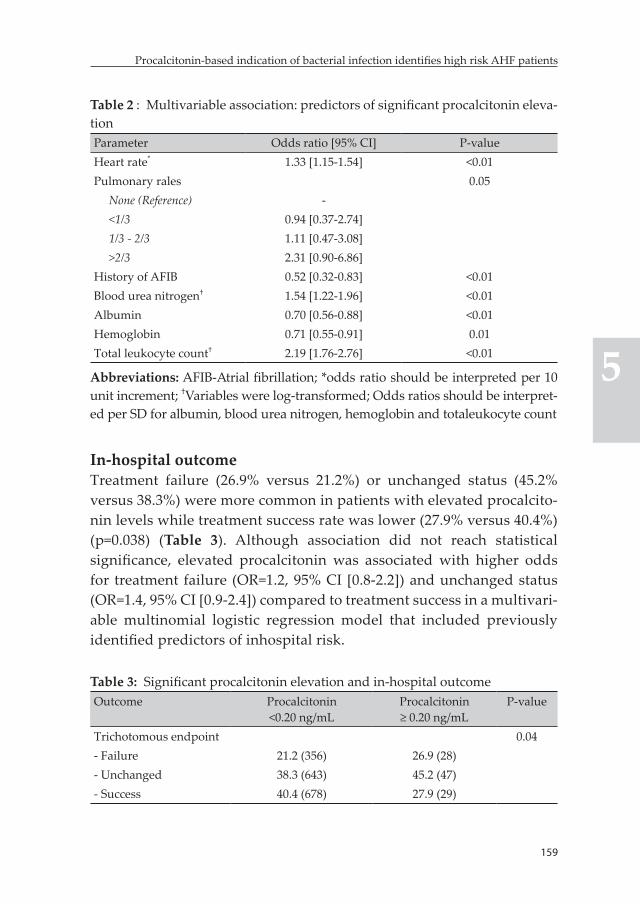
158
Chapter 5
159
Procalcitonin-based indication of bacterial infection identifies high risk AHF patients
5
Table 2 : Multivariable association: predictors of significant procalcitonin eleva-tionParameter Odds ratio [95% CI] P-valueHeart rate* 1.33 [1.15-1.54] <0.01Pulmonary rales 0.05
None (Reference) -<1/3 0.94 [0.37-2.74]1/3 - 2/3 1.11 [0.47-3.08]>2/3 2.31 [0.90-6.86]
History of AFIB 0.52 [0.32-0.83] <0.01Blood urea nitrogen† 1.54 [1.22-1.96] <0.01Albumin 0.70 [0.56-0.88] <0.01Hemoglobin 0.71 [0.55-0.91] 0.01Total leukocyte count† 2.19 [1.76-2.76] <0.01
Abbreviations: AFIB-Atrial fibrillation; *odds ratio should be interpreted per 10 unit increment; †Variables were log-transformed; Odds ratios should be interpret-ed per SD for albumin, blood urea nitrogen, hemoglobin and totaleukocyte count
In-hospital outcomeTreatment failure (26.9% versus 21.2%) or unchanged status (45.2% versus 38.3%) were more common in patients with elevated procalcito-nin levels while treatment success rate was lower (27.9% versus 40.4%) (p=0.038) (Table 3). Although association did not reach statistical significance, elevated procalcitonin was associated with higher odds for treatment failure (OR=1.2, 95% CI [0.8-2.2]) and unchanged status (OR=1.4, 95% CI [0.9-2.4]) compared to treatment success in a multivari-able multinomial logistic regression model that included previously identified predictors of inhospital risk.
Table 3: Significant procalcitonin elevation and in-hospital outcomeOutcome Procalcitonin
<0.20 ng/mLProcalcitonin ≥ 0.20 ng/mL
P-value
Trichotomous endpoint 0.04- Failure 21.2 (356) 26.9 (28)- Unchanged 38.3 (643) 45.2 (47)- Success 40.4 (678) 27.9 (29)
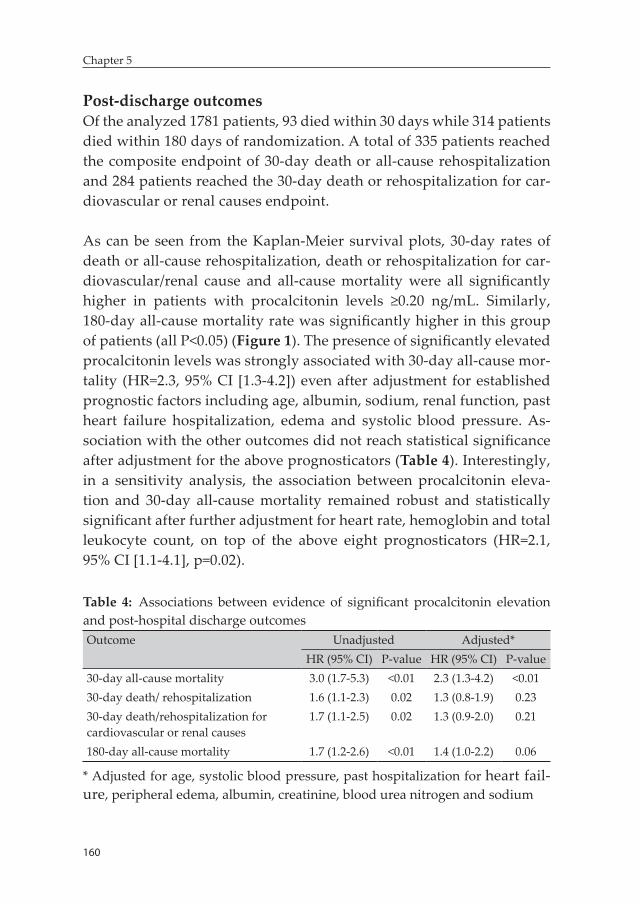
160
Chapter 5
Post-discharge outcomesOf the analyzed 1781 patients, 93 died within 30 days while 314 patients died within 180 days of randomization. A total of 335 patients reached the composite endpoint of 30-day death or all-cause rehospitalization and 284 patients reached the 30-day death or rehospitalization for car-diovascular or renal causes endpoint.
As can be seen from the Kaplan-Meier survival plots, 30-day rates of death or all-cause rehospitalization, death or rehospitalization for car-diovascular/renal cause and all-cause mortality were all significantly higher in patients with procalcitonin levels ≥0.20 ng/mL. Similarly, 180-day all-cause mortality rate was significantly higher in this group of patients (all P<0.05) (Figure 1). The presence of significantly elevated procalcitonin levels was strongly associated with 30-day all-cause mor-tality (HR=2.3, 95% CI [1.3-4.2]) even after adjustment for established prognostic factors including age, albumin, sodium, renal function, past heart failure hospitalization, edema and systolic blood pressure. As-sociation with the other outcomes did not reach statistical significance after adjustment for the above prognosticators (Table 4). Interestingly, in a sensitivity analysis, the association between procalcitonin eleva-tion and 30-day all-cause mortality remained robust and statistically significant after further adjustment for heart rate, hemoglobin and total leukocyte count, on top of the above eight prognosticators (HR=2.1, 95% CI [1.1-4.1], p=0.02).
Table 4: Associations between evidence of significant procalcitonin elevation and post-hospital discharge outcomesOutcome Unadjusted Adjusted*
HR (95% CI) P-value HR (95% CI) P-value30-day all-cause mortality 3.0 (1.7-5.3) <0.01 2.3 (1.3-4.2) <0.0130-day death/ rehospitalization 1.6 (1.1-2.3) 0.02 1.3 (0.8-1.9) 0.2330-day death/rehospitalization for cardiovascular or renal causes
1.7 (1.1-2.5) 0.02 1.3 (0.9-2.0) 0.21
180-day all-cause mortality 1.7 (1.2-2.6) <0.01 1.4 (1.0-2.2) 0.06
* Adjusted for age, systolic blood pressure, past hospitalization for heart fail-ure, peripheral edema, albumin, creatinine, blood urea nitrogen and sodium
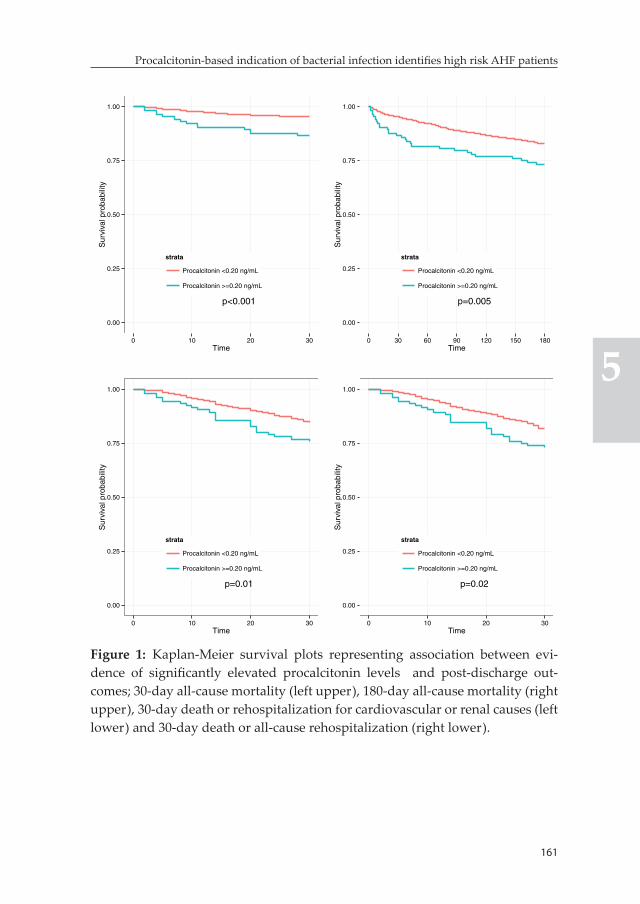
161
Procalcitonin-based indication of bacterial infection identifies high risk AHF patients
5
p<0.001
0.00
0.25
0.50
0.75
1.00
0 10 20 30Time
Sur
viva
l pro
babi
lity
strata
Procalcitonin <0.20 ng/mL
Procalcitonin >=0.20 ng/mL
p=0.005
0.00
0.25
0.50
0.75
1.00
0 30 60 90 120 150 180Time
Sur
viva
l pro
babi
lity
strata
Procalcitonin <0.20 ng/mL
Procalcitonin >=0.20 ng/mL
p=0.01
0.00
0.25
0.50
0.75
1.00
0 10 20 30Time
Sur
viva
l pro
babi
lity
strata
Procalcitonin <0.20 ng/mL
Procalcitonin >=0.20 ng/mL
p=0.02
0.00
0.25
0.50
0.75
1.00
0 10 20 30Time
Sur
viva
l pro
babi
lity
strata
Procalcitonin <0.20 ng/mL
Procalcitonin >=0.20 ng/mL
Figure 1: Kaplan-Meier survival plots representing association between evi-dence of significantly elevated procalcitonin levels and post-discharge out-comes; 30-day all-cause mortality (left upper), 180-day all-cause mortality (right upper), 30-day death or rehospitalization for cardiovascular or renal causes (left lower) and 30-day death or all-cause rehospitalization (right lower).
162
Chapter 5
Sensitivity analysisAt both procalcitonin cut-off values of 0.10 ng/mL and 0.40 ng/mL, clini-cal differences between group of patients considered to have significant elevation versus low levels remained consistent with those observed using cut-off value of 0.20 ng/mL. Moreover, the presence of elevated procalcitonin levels was associated with worse outcome regardless of the cut-off value utilized to define it (Appendix tables A1 and A2).
Gradient of risk of post-discharge outcomes along the continuum of procalcitoninIn multivariable Cox models that also included estabilished prognosti-cators, increasing procalcitonin levels were associated with a positive, logarithmic gradient of risk for all evaluated post-discharge outcomes with the exception of 30-day death or all-cause rehospitalization (Figure 2). Association was stronger for the 30-day all-cause mortality endpoint (HR =1.4, 95% CI [1.2-1.6]).
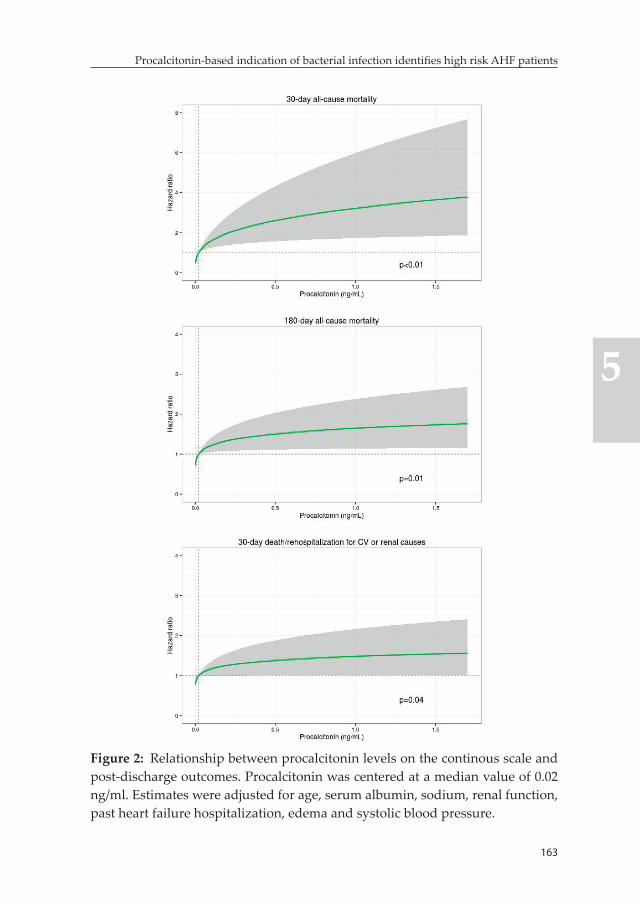
163
Procalcitonin-based indication of bacterial infection identifies high risk AHF patients
5
Figure 2: Relationship between procalcitonin levels on the continous scale and post-discharge outcomes. Procalcitonin was centered at a median value of 0.02 ng/ml. Estimates were adjusted for age, serum albumin, sodium, renal function, past heart failure hospitalization, edema and systolic blood pressure.
164
Chapter 5
Discussion
Bacterial infections are one of the most common and usually treatable precipitating factors for heart failure hospitalizations (1, 2). However, clinical diagnosis in patients hospitalized for AHF, particularly for pul-monary infections, can be challenging. This is related to the difficulty in differentiating signs, symptoms and radiologic features of (pulmonary) infections from that of AHF (3, 4). In addition, patients may not present with characteristic features of bacterial infections (related to underlying pathogens) or may only have low-grade signs and symptoms. Advances in proteomic research have led to the development of several promising biomarkers that could serve as simple and objective tools that can en-hance early and accurate detection of infections. One of the most exten-sively studied of these biomarkers is CRP, which is commonly elevated in not just bacterial infections but also other inflammatory states (8-13). This non-specific nature of its upregulation limits the usefulness of CRP as an infection marker in AHF as heightened inflammatory state is one of the core pathophysiologic features of the latter (13). Subsequently, highly specific biomarkers are needed to facilitate diagnosis of bacterial infections in patients hospitalized for AHF. Procalcitonin is the most specific marker available currently and have been shown to be the most useful for the point-of-care diagnosis of bacterial infections in both primary and emergency care settings (15-17, 19, 20). However, clinical utility in patients hospitalized with AHF has not been well established.
In this study we evaluated the prevalence, predictors and association with outcomes of significantly elevated procalcitonin levels suggesting bacterial infection in patients hospitalized with AHF and no clinically overt signs of bacterial infections during screening (i.e. temperature ≥380C or sepsis or active infection requiring IV antimicrobial treat-ment). Around 6% of patients included in this analysis had significantly elevated procalcitonin levels indicating probable bacterial infection. Unadjusted treatment success rate was significantly lower in the group of patients with elevated procalcitonin levels. Moreover, elevated pro-calcitonin levels were associated with poorer post-discharge outcomes. The association was more pronounced for mortality outcomes. The risk
165
Procalcitonin-based indication of bacterial infection identifies high risk AHF patients
5
of short-term all-cause mortality was more than doubled in patients with high procalcitonin levels even after adjustment for established prognostic factors.
Total leukocyte count had the strongest association with significantly elevated procalcitonin levels. Elevated leukocyte count is a common fea-ture of many infections, including those related to bacterial pathogens. Several studies have also evaluated the diagnostic utility of leukocyte count for community acquired pneumonia and differentiation between various etiologies (e.g. typical versus atypical or bacterial versus viral) although it showed limited accuracy compared to either procalcitonin or CRP (17, 27). Low serum albumin, low hemoglobin and high blood urea nitrogen levels were other biochemical parameters that were strongly associated with evidence of elevated procalcitonin. Although not specific, these observations are known to be common findings in the presence of bacterial infections (26, 28). In addition, clinical features including high heart rate and pulmonary rales involving more than two-thirds of the lung fields were more common in the presence of procalcitonin levels suggesting probable bacterial infection.
One of the earliest evidences on the potential diagnostic, prognostic and therapeutic utility of procalcitonin in patients presenting with the chief complaint of shortness of breath came from a retrospective analysis of an observational study – the biomarkers in heart failure (BACH) trial. Procalcitonin showed significant added value over clinical variables for the diagnosis of pneumonia in all patients including those with AHF. In line with our findings, AHF patients with significant procalcitonin elevation had significantly higher 90-day all-cause mortality. It must be noted here that patients with overt bacterial infections during screen-ing were excluded from our analysis. More importantly, procalcitonin showed a promising potential for predicting clinical benefit from anti-biotic therapy in patients with the primary diagnosis of AHF. Patients with a diagnosis of AHF and procalcitonin levels above 0.21 ng/ml had worse outcome if not treated with antibiotics compared to patients who received antibiotics, while those with procalcitonin levels below 0.05 ng/ml had worse outcome if treated with antibiotics. However, the
166
Chapter 5
same study also revealed that nearly a third of patients with procalci-tonin elevation suggesting significant bacterial infection did not receive antibiotic therapy (3).
Alba et al also, recently, evaluated the diagnostic utility of procalcitonin in patients presenting to the Emergency Department with acute dyspnea (24). They reported an AUC of 0.84, (95% CI, 0.77-0.91) for the diagnosis of pneumonia; and a procalcitonin level of 0.10 ng/mL was identified as the optimal cut-off point. Importantly, procalcitonin showed highly accurate performance for the diagnosis and exclusion of superimposed pneumonia in patients with heart failure; procalcitonin had AUC of 0.92 (95% CI 0.87-0.97) for the diagnosis of superimposed pneumonia while at a cut-off value of 0.10 ng/mL NPV reached 99% although PPV was low at 37%. Furthermore, they evaluated baseline clinical and biomarker values in groups of Emergency Department patients defined based on procalcitonin levels above and below 0.10 ng/mL. Interest-ingly, clinical and biochemical differences observed between the groups were consistent with the ones reported in our study (it must be noted that we used a cut-off value of 0.20 ng/mL for the primary analysis). We utilized a cut-off value of 0.20 ng/mL to define significant elevation of procalcitonin levels signaling bacterial infection as opposed to 0.10 ng/mL because the PPV of the latter was relatively low. At 0.20 ng/mL, the PPV of procalcitonin for the diagnosis of systemic bacterial infection in the Emergency Department has been reported to reach more than 80% (23).
There is some clinical trial data supporting the potential benefit of pro-calcitonin-guided initiation and discontinuation of antibiotic therapy in patients with history of heart failure presenting to the Emergency Department with respiratory symptoms from the post-hoc analysis of the ProHOSP trial. ProHOSP is a randomized controlled trial that com-pared a procalcitonin-guided algorithm for antibiotic initiation and/or discontinuation with a state-of-the-art evidence-based guidelines in patients presenting to the emergency department with suspected lower respiratory tract infection. The procalcitonin-guided algorithm encouraged antibiotic treatment when procalcitonin levels exceeded
167
Procalcitonin-based indication of bacterial infection identifies high risk AHF patients
5
0.25 ng/ml and discouraged treatment when levels were below 0.25 ng/ml. In addition, follow-up procalcitonin levels were utilized to guide antibiotic discontinuation decisions (29). Schuetz et al performed a secondary analysis of the ProHOSP trial which showed that use of procalcitonin measurement to exclude bacterial infections and guide antibiotic treatment in patients with history of heart failure present-ing to the Emergency Department with suspicion of lower respiratory infections is associated with better outcomes (primarily in subgroup of patients with procalcitonin levels below 0.25 ng/ml) and reduced antibiotic exposure (4).
Although the role of procalcitonin as a bacterial infection marker and its potential role in guiding antibiotic initiation and discontinuation are well estabilished, its prognostic value in patients with AHF has not been extensively studied. A recent study by Villanueva et al indicated that procalcitonin was independently associated with the risk of long-term death and recurrent rehospitalizations in patients with AHF and no evidence of infection (32). A positive, logarithmic association with long term risk was observed along the continuum of procalcitonin levels. Interestingly, we observed a similar pattern of association with risk of short and intermediate term outcomes along the continuum of procal-citonin. Subsequently, the prognostic value of procalcitonin (besides its role as an infection marker) and its clinical utility, particularly as part of a multimarker risk stratification strategy, will be of clinical interest and need to be evaluated more extensively.
Clinical implicationsSignificantly elevated procalcitonin levels, signaling increased likeli-hood of bacterial infections, were associated with worse outcome in AHF patients without overt signs and symptoms of infection. This, coupled with previous evidence from the BACH trial, further strengthens the notion that the presence of potential untreated bacterial infections is an important clinical problem in patients hospitalized for AHF. Procalcito-nin measurement may be considered as a tool for discovering possible bacterial infection in the routine evaluation of patients presenting with signs and symptoms of AHF. Thorough investigation of patients with
168
Chapter 5
elevated levels of procalcitonin (particularly when levels exceed 0.20 ng/mL) for confirmation and identification of source of infection with diagnostic tools like blood-culture can facilitate early diagnosis and treatment of bacterial infections. Moreover, randomized controlled trials evaluating efficacy and cost-effectiveness of procalcitonin-guided antibiotic treatment strategy in broader AHF patient populations are required (31). To this end, the outcome of the ongoing IMPACT-EU (Improve Management of Heart Failure With Procalcitonin) trial can play an important role in advancing the clinical utility of procalcito-nin for the routine evaluation of AHF patients. In this trial, antibiotic therapy is recommended when procalcitonin levels exceed 0.20 ng/mL (NCT02392689).
Strengths and limitationsWe evaluated the prevalence and prognostic significance of elevated procalcitonin levels suggestive of bacterial infection in a large cohort of AHF patients without overt signs of bacterial infections from a well-defined, international, multicenter trial. The results should be interpreted with some caution as we performed a post-hoc analysis of the PROTECT trial which included a selected group of AHF patients that agreed to participate in a trial. This study is retrospective in nature and patients were not followed with the primary goal of determining the development of bacterial infections during the course of hospital-ization. Although some data on infection-related adverse events was collected as part of safety evaluation for the study drug, it lacked ad-judication and was challenging to discriminate infections of bacterial etiology from others merely based on the recorded data in most of the cases. Subsequently, we were not able to reliably evaluate the ability of the procalcitonin-based algorithm to aid identification of bacterial infections that developed during the course of hospitalization yet were potentially undetected during hospital admission. Furthermore, data on antibiotic treatment was generally lacking for our analysis. Antibi-otic treatment is a potential effect modifier for the association between procalcitonin elevation and outcomes and this needs to be taken into consideration during the interpretation of our findings.
169
Procalcitonin-based indication of bacterial infection identifies high risk AHF patients
5
Several cut-off values of procalcitonin with varying performances, usu-ally in the range of 0.10 ng/mL to 0.50 ng/mL were reported for the diagnosis of systemic bacterial infections in the Emergency Department setting. In this study we utilized a cut-off value of 0.20 ng/ mL for the primary analysis as it showed an excellent balance between PPV and NPV in a previous study (22). We also performed a sensitivity analysis using two additional cut-off values; one that maximizes NPV (0.10 ng/mL) and another maximizing PPV (0.40 ng/mL). This analysis revealed a similar clinical profile and unfavorable outcome status in patients fulfilling the criteria for probable bacterial infection irrespective of procalcitonin cut-off value utilized.
Another limitation of our study is related to the fact that the presence and source of bacterial infections was not confirmed with the gold stan-dard diagnostic tools, particularly culture, in patients with significantly elevated procalcitonin. Confirmation of presence of bacterial infections becomes, particularly, important as there are suggestions in the lit-erature that minor elevations of procalcitonin can be observed in AHF patients with no evidence of active infection due to endotoxin translo-cation related to gut congestion and, even proinflammatory activity. Mollar et al reported a very modest correlation between circulating plasma endotoxin levels and procalcitonin (R2=2.2%) while there was no significant correlation between procalcitonin levels and proinflam-matory cytokines like IL-6 and TNF-alpha. In addition, they reported a modest correlation between procalcitonin levels and NT-proBNP with an R2 of 5.0% (30). The correlation between BNP and procalcitonin observed in our study was also modest (R2=2.3%). Procalcitonin levels also correlated poorly with clinical severity of heart failure evidenced by NYHA class (Appendix Table A3). More importantly, procalcitonin showed a relatively low correlation with CRP, which is a well-known systemic inflammatory marker (R2=9.0%). It must also be emphasized that more than 75% of AHF patients analyzed in this study have procal-citonin levels below 0.05 ng/mL; levels observed in health individuals (3). Subsequently, it is very unlikely that such the presence of sig-nificant elevations of procalcitonin levels can be fully explained by the endotoxin translocation or proinflammatory state hypothesis. This does
170
Chapter 5
not, however, minimize the importance of confirmation of diagnosis of bacterial infections with the gold standard diagnostic tools.
Conclusion
A procalcitonin-based diagnostic algorithm identifies AHF patient population at high risk for poor outcome. Routine utilization of this algorithm may facilitate early diagnosis of bacterial infections. Further evidence is needed to elucidate whether this algorithm leads to more appropriate initiation of antibiotic treatment and, subsequently, leads to improved outcomes.
References 1. Fonarow GC, Abraham WT, Albert NM, et al. OPTIMIZE-HF Investigators
and Hospitals. Factors identified as precipitating hospital admissions for heart failure and clinical outcomes: findings from OPTIMIZE-HF. Arch Intern Med. 2008; 168: 847-854.
2. Alon D, Stein GY, Korenfeld R, Fuchs S. Predictors and outcomes of infection-related hospital admissions of heart failure patients. PLoS One. 2013; 8: e72476.
3. Maisel A, Neath SX, Landsberg J, et al. Use of procalcitonin for the diagnosis of pneumonia in patients presenting with a chief complaint of dyspnoea: results from the BACH (Biomarkers in AHF) trial. Eur J Heart Fail. 2012; 14: 278-286.
4. Schuetz P, Kutz A, Grolimund E, et al, ProHOSP Study Group. Excluding infection through procalcitonin testing improves outcomes of congestive heart failure patients presenting with acute respiratory symptoms: results from the randomized ProHOSP trial. Int J Cardiol. 2014; 175: 464-472.
5. Epstein D, Raveh D, Schlesinger Y, Rudensky B, Gottehrer NP, Yinnon AM. Adult patients with occult bacteremia discharged from the emergency department: epidemiological and clinical characteristics. Clin Infect Dis. 2001; 32: 559-565.
6. Gonzalez-Del Vecchio M, Bunsow E, Sanchez-Carrillo C, Garcia Leoni E, Rodriguez-Creixems M, Bouza E. Occult bloodstream infections in adults: a “benign” entity. Am J Emerg Med. 2014; 32: 966-971.
7. Seigel TA, Cocchi MN, Salciccioli J, et al. Inadequacy of temperature and white blood cell count in predicting bacteremia in patients with sus-pected infection. J Emerg Med. 2012; 42: 254-259.
171
Procalcitonin-based indication of bacterial infection identifies high risk AHF patients
5
8. Almirall J, Bolibar I, Toran P, et al. Community-Acquired Pneumonia Maresme Study Group. Contribution of C-reactive protein to the diagno-sis and assessment of severity of community-acquired pneumonia. Chest. 2004; 125: 1335-1342.
9. Haran JP, Beaudoin FL, Suner S, Lu S. C-reactive protein as predictor of bacterial infection among patients with an influenza-like illness. Am J Emerg Med. 2013; 31: 137-144.
10. Povoa P, Coelho L, Almeida E, et al. C-reactive protein as a marker of infec-tion in critically ill patients. Clin Microbiol Infect. 2005; 11: 101-108.
11. Flanders SA, Stein J, Shochat G, et al. Performance of a bedside C-reactive protein test in the diagnosis of community-acquired pneumonia in adults with acute cough. Am J Med. 2004; 116: 529-535.
12. Clyne B, Olshaker JS. The C-reactive protein. J Emerg Med. 1999; 17: 1019-1025.
13. Kalogeropoulos AP, Tang WH, Hsu A, et al. High-sensitivity C-reactive protein in AHF: insights from the ASCEND-HF trial. J Card Fail. 2014; 20: 319-326.
14. Maisel AS, Choudhary R. Biomarkers in AHF--state of the art. Nat Rev Cardiol. 2012; 9: 478-490.
15. Simon L, Gauvin F, Amre DK, Saint-Louis P, Lacroix J. Serum procalcitonin and C-reactive protein levels as markers of bacterial infection: a system-atic review and meta-analysis. Clin Infect Dis. 2004; 39: 206-217.
16. Holm A, Pedersen SS, Nexoe J, et al. Procalcitonin versus C-reactive protein for predicting pneumonia in adults with lower respiratory tract infection in primary care. Br J Gen Pract. 2007; 57: 555-560.
17. Muller B, Harbarth S, Stolz D, et al. Diagnostic and prognostic accuracy of clinical and laboratory parameters in community-acquired pneumonia. BMC Infect Dis. 2007; 7: 10.
18. Wang W, Zhang X, Ge N, et al. Procalcitonin testing for diagnosis and short-term prognosis in bacterial infection complicated by congestive heart failure: a multicenter analysis of 4,698 cases. Crit Care. 2014; 18: R4.
19. Aabenhus R, Jensen JU, Jorgensen KJ, Hrobjartsson A, Bjerrum L. Bio-markers as point-of-care tests to guide prescription of antibiotics in pa-tients with acute respiratory infections in primary care. Cochrane Database Syst Rev. 2014; 11: CD010130.
20. Schuetz P, Albrich W, Mueller B. Procalcitonin for diagnosis of infection and guide to antibiotic decisions: past, present and future. BMC Med. 2011; 9: 107-7015-9-107.
21. Weatherley BD, Cotter G, Dittrich HC, et al, PROTECT Steering Committee, Investigators, and Coordinators. Design and rationale of the PROTECT study: a placebo-controlled randomized study of the selective A1 adenos-ine receptor antagonist rolofylline for patients hospitalized with acute
172
Chapter 5
decompensated heart failure and volume overload to assess treatment effect on congestion and renal function. J Card Fail. 2010; 16: 25-35.
22. Massie BM, O’Connor CM, Metra M, et al, PROTECT Investigators and Committees. Rolofylline, an adenosine A1-receptor antagonist, in AHF. N Engl J Med. 2010; 363: 1419-1428.
23. Hausfater P, Garric S, Ayed SB, Rosenheim M, Bernard M, Riou B. Useful-ness of procalcitonin as a marker of systemic infection in emergency de-partment patients: a prospective study. Clin Infect Dis. 2002; 34: 895-901.
24. Alba GA, Truong QA, Gaggin HK, et al, Global Research on Acute Con-ditions Team (GREAT) Network. Diagnostic and Prognostic Utility of Procalcitonin in Patients Presenting to the Emergency Department with Dyspnea. Am J Med. 2015;Jul 10. doi: 10.1016/j.amjmed.2015.06.037.
25. O’Connor CM, Mentz RJ, Cotter G, et al. The PROTECT in-hospital risk model: 7-day outcome in patients hospitalized with AHF and renal dys-function. Eur J Heart Fail. 2012; 14: 605-612.
26. Cleland JG, Chiswell K, Teerlink JR, et al. Predictors of postdischarge outcomes from information acquired shortly after admission for AHF: a report from the Placebo-Controlled Randomized Study of the Selective A1 Adenosine Receptor Antagonist Rolofylline for Patients Hospitalized With Acute Decompensated Heart Failure and Volume Overload to Assess Treatment Effect on Congestion and Renal Function (PROTECT) Study. Circ Heart Fail. 2014; 7: 76-87.
27. Kruger S, Ewig S, Papassotiriou J, et al, CAPNETZ Study Group. Inflamma-tory parameters predict etiologic patterns but do not allow for individual prediction of etiology in patients with CAP: results from the German competence network CAPNETZ. Respir Res. 2009; 10: 65-9921-10-65.
28. Alvarez C, Ramos A. Lipids, lipoproteins, and apoproteins in serum dur-ing infection. Clin Chem. 1986; 32: 142-145.
29. Schuetz P, Christ-Crain M, Thomann R, et al, ProHOSP Study Group. Effect of procalcitonin-based guidelines vs standard guidelines on antibiotic use in lower respiratory tract infections: the ProHOSP randomized con-trolled trial. JAMA. 2009; 302: 1059-1066.
30. Mollar A, Villanueva MP, Carratala A, Nunez E, Sanchis J, Nunez J. Deter-minants of procalcitonin concentration in AHF. Int J Cardiol. 2014; 177: 532-534.
31. Lee NS, Daniels LB. Personalized CHF treatment: PCT to guide therapy in heart failure patients. Int J Cardiol. 2014; 176: 307-308.
32. Villanueva MP, Mollar A, Palau P, et al. Procalcitonin and long-term prog-nosis after an admission for AHF. Eur J Intern Med. 2015; 26: 42-48.
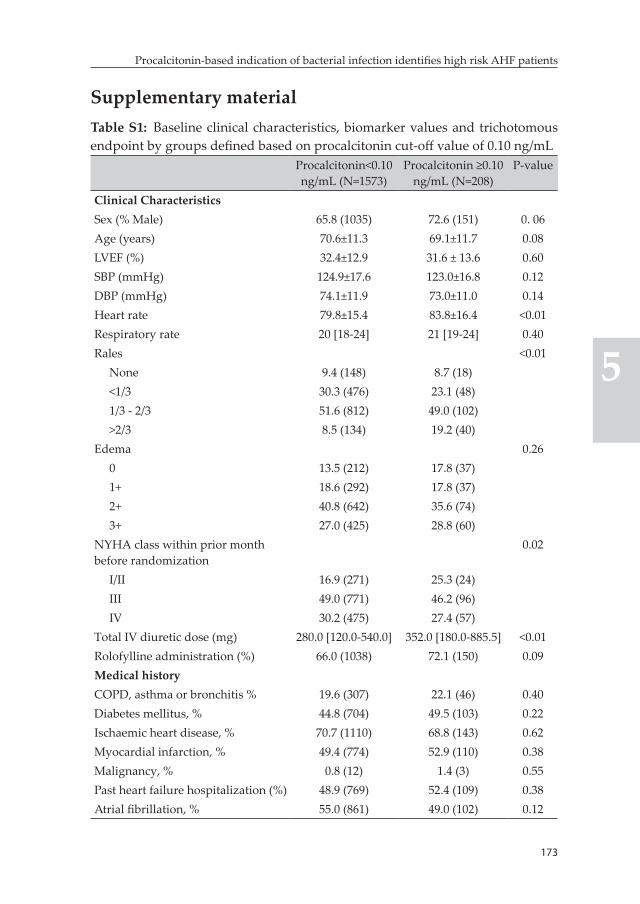
173
Procalcitonin-based indication of bacterial infection identifies high risk AHF patients
5
Supplementary materialTable S1: Baseline clinical characteristics, biomarker values and trichotomous endpoint by groups defined based on procalcitonin cut-off value of 0.10 ng/mL
Procalcitonin<0.10 ng/mL (N=1573)
Procalcitonin ≥0.10 ng/mL (N=208)
P-value
Clinical CharacteristicsSex (% Male) 65.8 (1035) 72.6 (151) 0. 06Age (years) 70.6±11.3 69.1±11.7 0.08LVEF (%) 32.4±12.9 31.6 ± 13.6 0.60SBP (mmHg) 124.9±17.6 123.0±16.8 0.12DBP (mmHg) 74.1±11.9 73.0±11.0 0.14Heart rate 79.8±15.4 83.8±16.4 <0.01Respiratory rate 20 [18-24] 21 [19-24] 0.40Rales <0.01
None 9.4 (148) 8.7 (18)<1/3 30.3 (476) 23.1 (48)1/3 - 2/3 51.6 (812) 49.0 (102)>2/3 8.5 (134) 19.2 (40)
Edema 0.260 13.5 (212) 17.8 (37)1+ 18.6 (292) 17.8 (37)2+ 40.8 (642) 35.6 (74)3+ 27.0 (425) 28.8 (60)
NYHA class within prior month before randomization
0.02
I/II 16.9 (271) 25.3 (24)III 49.0 (771) 46.2 (96)IV 30.2 (475) 27.4 (57)
Total IV diuretic dose (mg) 280.0 [120.0-540.0] 352.0 [180.0-885.5] <0.01Rolofylline administration (%) 66.0 (1038) 72.1 (150) 0.09Medical historyCOPD, asthma or bronchitis % 19.6 (307) 22.1 (46) 0.40Diabetes mellitus, % 44.8 (704) 49.5 (103) 0.22Ischaemic heart disease, % 70.7 (1110) 68.8 (143) 0.62Myocardial infarction, % 49.4 (774) 52.9 (110) 0.38Malignancy, % 0.8 (12) 1.4 (3) 0.55Past heart failure hospitalization (%) 48.9 (769) 52.4 (109) 0.38Atrial fibrillation, % 55.0 (861) 49.0 (102) 0.12
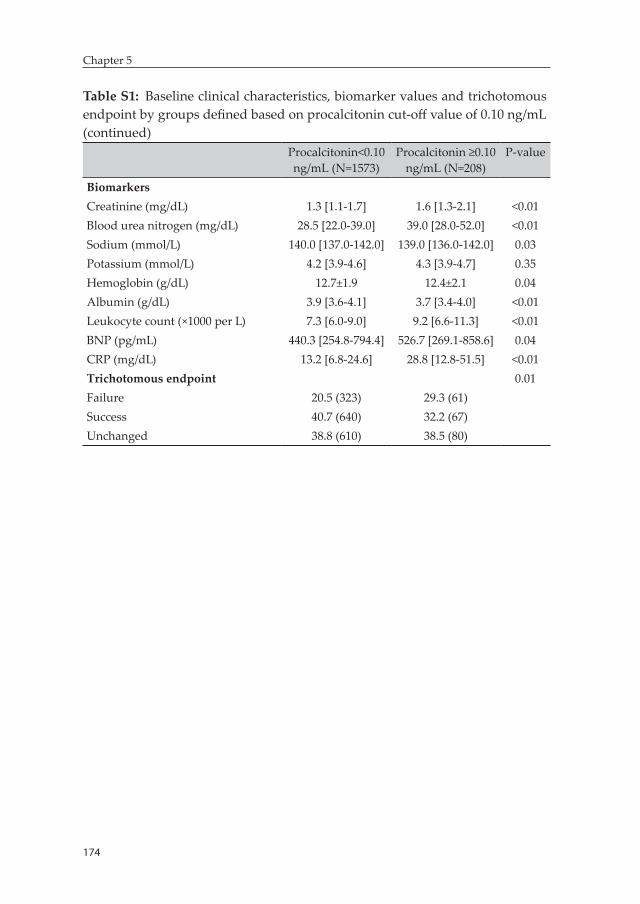
174
Chapter 5
Table S1: Baseline clinical characteristics, biomarker values and trichotomous endpoint by groups defined based on procalcitonin cut-off value of 0.10 ng/mL (continued)
Procalcitonin<0.10 ng/mL (N=1573)
Procalcitonin ≥0.10 ng/mL (N=208)
P-value
BiomarkersCreatinine (mg/dL) 1.3 [1.1-1.7] 1.6 [1.3-2.1] <0.01Blood urea nitrogen (mg/dL) 28.5 [22.0-39.0] 39.0 [28.0-52.0] <0.01Sodium (mmol/L) 140.0 [137.0-142.0] 139.0 [136.0-142.0] 0.03Potassium (mmol/L) 4.2 [3.9-4.6] 4.3 [3.9-4.7] 0.35Hemoglobin (g/dL) 12.7±1.9 12.4±2.1 0.04Albumin (g/dL) 3.9 [3.6-4.1] 3.7 [3.4-4.0] <0.01Leukocyte count (×1000 per L) 7.3 [6.0-9.0] 9.2 [6.6-11.3] <0.01BNP (pg/mL) 440.3 [254.8-794.4] 526.7 [269.1-858.6] 0.04CRP (mg/dL) 13.2 [6.8-24.6] 28.8 [12.8-51.5] <0.01Trichotomous endpoint 0.01Failure 20.5 (323) 29.3 (61)Success 40.7 (640) 32.2 (67)Unchanged 38.8 (610) 38.5 (80)
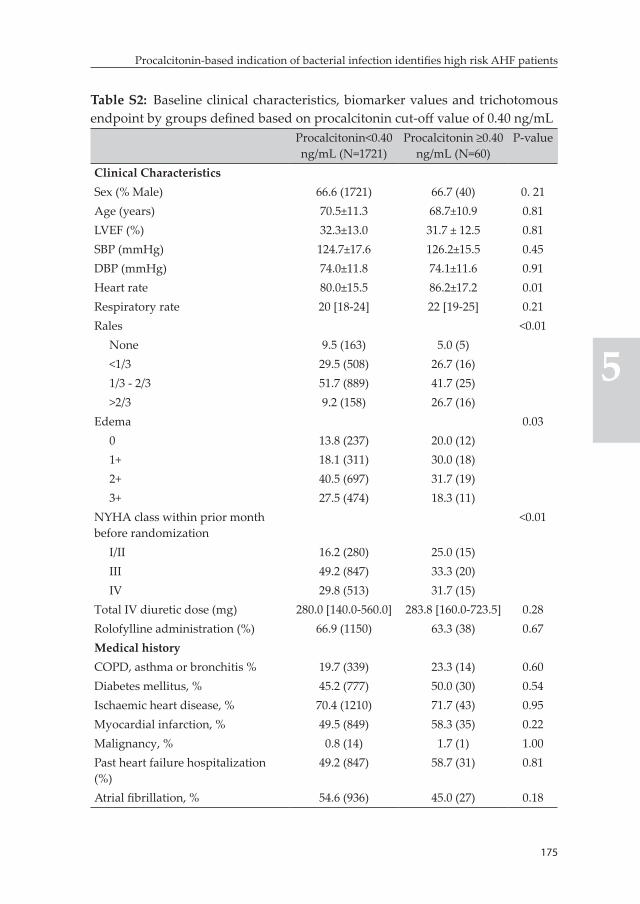
175
Procalcitonin-based indication of bacterial infection identifies high risk AHF patients
5
Table S2: Baseline clinical characteristics, biomarker values and trichotomous endpoint by groups defined based on procalcitonin cut-off value of 0.40 ng/mL
Procalcitonin<0.40 ng/mL (N=1721)
Procalcitonin ≥0.40 ng/mL (N=60)
P-value
Clinical CharacteristicsSex (% Male) 66.6 (1721) 66.7 (40) 0. 21Age (years) 70.5±11.3 68.7±10.9 0.81LVEF (%) 32.3±13.0 31.7 ± 12.5 0.81SBP (mmHg) 124.7±17.6 126.2±15.5 0.45DBP (mmHg) 74.0±11.8 74.1±11.6 0.91Heart rate 80.0±15.5 86.2±17.2 0.01Respiratory rate 20 [18-24] 22 [19-25] 0.21Rales <0.01
None 9.5 (163) 5.0 (5)<1/3 29.5 (508) 26.7 (16)1/3 - 2/3 51.7 (889) 41.7 (25)>2/3 9.2 (158) 26.7 (16)
Edema 0.030 13.8 (237) 20.0 (12)1+ 18.1 (311) 30.0 (18)2+ 40.5 (697) 31.7 (19)3+ 27.5 (474) 18.3 (11)
NYHA class within prior month before randomization
<0.01
I/II 16.2 (280) 25.0 (15)III 49.2 (847) 33.3 (20)IV 29.8 (513) 31.7 (15)
Total IV diuretic dose (mg) 280.0 [140.0-560.0] 283.8 [160.0-723.5] 0.28Rolofylline administration (%) 66.9 (1150) 63.3 (38) 0.67Medical historyCOPD, asthma or bronchitis % 19.7 (339) 23.3 (14) 0.60Diabetes mellitus, % 45.2 (777) 50.0 (30) 0.54Ischaemic heart disease, % 70.4 (1210) 71.7 (43) 0.95Myocardial infarction, % 49.5 (849) 58.3 (35) 0.22Malignancy, % 0.8 (14) 1.7 (1) 1.00Past heart failure hospitalization (%)
49.2 (847) 58.7 (31) 0.81
Atrial fibrillation, % 54.6 (936) 45.0 (27) 0.18
176
Chapter 5
Table S2: Baseline clinical characteristics, biomarker values and trichotomous endpoint by groups defined based on procalcitonin cut-off value of 0.40 ng/mL (continued)
Procalcitonin<0.40 ng/mL (N=1721)
Procalcitonin ≥0.40 ng/mL (N=60)
P-value
BiomarkersCreatinine (mg/dL) 1.4 [1.1-1.8] 1.6 [1.2-1.9] 0.02Blood urea nitrogen (mg/dL) 29.0 [22.0-41.0] 33.5 [24.8-44.0] 0.05Sodium (mmol/L) 140.0 [137.0-142.0] 139.0 [136.8-142.0] 0.44Potassium (mmol/L) 4.2 [3.9-4.6] 4.2 [3.9-4.7] 0.84Hemoglobin (g/dL) 12.7±1.9 11.8±2.0 <0.01Albumin (g/dL) 3.9 [3.6-4.1] 3.7 [3.3-3.9] <0.01Leukocyte count (×1000 per L) 7.4 [6.9-9.1] 10.2 [8.5-14.8] <0.01BNP (pg/mL) 450.3 [255.4-795.6] 467.6 [237.6-810.3] 0.82CRP (mg/dL) 13.6 [7.2-26.0] 43.2 [26.2-63.1] <0.01Trichotomous endpoint 0.11Failure 21.7 (373) 18.3 (11)Success 40.0 (689) 30.0 (18)Unchanged 38.3 (659) 51.7 (31)
Table S3: Summary of procalcitonin levels by NYHA classMedian (IQR) procalcitonin levels in ng/mL
NYHA I 0.03 (0.01-0.05)NYHA II 0.02 (0.01-0.06)NYHA III 0.02 (0.01-0.05)NYHA IV 0.02 (0.01-0.04)


Chapter 6: Plasma biomarkers to predict or rule-out early post-discharge events in patients discharged after an AHF hospital admission
Biniyam G. Demissei, Douwe Postmus, John G. Cleland, Christopher M. O’Connor, Marco Metra, Piotr Ponikowski, John R. Teerlink, Gad Cotter ,Beth Davison, Michael M. Givertz, Daniel M. Bloomfield, Howard Dittrich, Hans L. Hillege, Adriaan A. Voors
Accepted European journal of heart failure
180
Chapter 6
Abstract
Aim: Improved prediction of early post-discharge death or rehospitalization after admission for acute heart failure (AHF) is a major unmet need. We evaluated the value of biomarkers to predict either low or high risk for early post-discharge events.
Methods: A total of 1653 patients enrolled in the PROTECT trial who were discharged alive and with available blood samples were included. Forty-seven biomarkers were serially evaluated in these patients. Measurement closest to discharge was utilized to evaluate the predictive value of biomarkers for low and high post-discharge risk. Patients were classified as ‘low risk’ if post-discharge 30-day risk of death or heart failure rehospitalization was <5% while risk >20% was utilized to define ‘high risk’. Cut-off values that yielded 95% NPV and 20% PPV were identified for each biomarker. Partial area under the ROC curve (pAUC) in the high sensitivity and high specificity regions was calculated to compare low and high risk predictive values.
Results: Of analyzed patients, 193 (11.7%) patients reached the 30-day death or heart failure rehospitalization outcome. We found marked differences between low and high risk predictors. cTnI was the strongest biomarker for low risk prediction (pAUC=0.552, 95% CI [0.52-0.58]) while ET-1 showed greater performance for high risk prediction (pAUC=0.560, 95% CI [0.53-0.59]). Several biomarkers (individually and in combination) provided added predictive value, on top of a clinical model, in both low and high risk regions.
Conclusion: Different biomarkers predicted low versus high risk of early post-discharge death or heart failure readmission in patients hospitalized for AHF.
Keywords: biomarker, acute heart failure, risk stratification, predictive value, low risk, high risk
181
Plasma biomarkers to predict or rule out early post-discharge events in AHF patients
6
Introduction
Nearly 20% of patients discharged after hospitalization for acute heart failure (AHF) need readmission within 30 days (1). Risk of short-term post-hospital discharge mortality is also at an unacceptably high level. In addition to significantly reducing survival and quality of life, the high rates of these post-discharge events (particularly readmissions) contribute substantially to the monetary cost of health care for heart failure patients. The total cost of heart failure care was estimated to be $31 billion in the US alone in 2012 and this is projected to increase to an unprecedented $70 billion in 2030 (2, 3). The majority of this cost is associated with rehospitalizations.
Several strategies have been proposed to reduce the enormous burden of early post-discharge events on patients and health care systems (4-9). Several observational data suggested that longer hospital stay and intensified post -discharge care are amongst the strategies that can be potentially beneficial in terms of lowering 30-day readmission rates (10-12). Nevertheless, such strategies are very unlikely to benefit the whole spectrum of hospitalized AHF patients and do not appear to be feasible, particularly from a cost-effectiveness perspective. A targeted approach in which low risk patients are discharged early with less aggressive post-discharge monitoring while an extended, intensive inhospital and post-discharge care is implemented in high risk patients is a more feasi-ble, and potentially cost-effective strategy. Effective implementation of this strategy requires tools that can accurately identify subpopulations of patients at low or high risk for early post-discharge events. None-theless, prediction of these events, hospital readmissions in particular, remains a significant clinical challenge (1, 4, 13).
Biomarkers can play an essential role as objective tools for short-term post-discharge risk stratification in hospitalized AHF patients and, in-terestingly, several promising prognostic biomarkers are available. Tra-ditionally, global measures of model performance like the C-statistics have been utilized to quantify prognostic performance of biomarkers in prognostic AHF research (14-18, 24). However, these parameters do
182
Chapter 6
not provide clear indication of the performance of biomarkers in certain risk ranges deemed to be clinically relevant, like the low or high risk re-gions. There is evidence, particularly in diagnostic medicine, suggesting that the performance of biomarkers might significantly differ in specific clinically relevant regions of the receiver operating characteristic (ROC) curve, like the rule-out (high sensitivity) or rule-in (high specificity) regions (19). Subsequently, different sets of biomarkers might need to be utilized for more optimal identification of low versus high risk sub-population of patients. However, there is a limited objective data on the value of biomarkers for the identification of hospitalized AHF patients who are at low or high risk for post-discharge events (20).
In this exploratory study, we aimed to assess the value of biomarkers measured close to discharge for the identification of AHF patients at low and high risk for short-term post-hospital discharge events.
Methods
Study populationData from the Placebo-controlled Randomized Study of the Selective A1 Adenosine Receptor Antagonist Rolofylline for Patients Hospital-ized with Acute Decompensated Heart Failure and Volume Overload to Assess Treatment Effect on Congestion and Renal Function (PRO-TECT) trial was utilized in this study. The PROTECT trial enrolled 2033 hospitalized AHF patients with a history of heart failure. Patients with BNP≥500 pg/mL or NT-proBNP ≥2000 pg/mL and mild to moderate renal impairment were included in the trial. Details of the design and main results of the study have been published previously (21, 22). All patients provided written informed consent. The study was conducted in compliance with the Declaration of Helsinki and was approved by all relevant local ethics committees. Patients who were documented to have been discharged from the index hospitalization alive were consid-ered for inclusion in the current study (N=1911).
183
Plasma biomarkers to predict or rule out early post-discharge events in AHF patients
6
Study procedures and measurementsForty-three established and novel circulating biomarkers were evalu-ated at baseline and then daily until day 6 or discharge (whichever came first), days 7 and 14. Measurement closest to discharge was utilized to define predischarge biomarker value. Albumin, alanine transaminase, aspartate transaminase, bicarbonate, blood urea nitrogen (BUN), chloride, creatinine, glucose, hemoglobin, platelet count, potassium, red blood cell (RBC) count, sodium, total cholesterol, triglycerides, uric acid and white blood cell (WBC) count were measured in a cen-tral laboratory (ICON Laboratories, Farmingdale, New York). A panel of 26 novel biomarkers was measured by Alere Inc., San Diego, CA, USA in available frozen serum samples. Galectin-3, myeloperoxidase (MPO) and neutrophil gelatinase-associated lipocalin (NGAL) were measured using sandwich enzyme-linked immonsorbent assays (ELISA) on a microtiter plate; angiogenin and C-reactive protein (CRP) were measured using competitive ELISAs on a Luminex® platform; D-dimer, endothelial cell-selective adhesion molecule (ESAM), growth differentiation factor 15 (GDF-15), lymphotoxin beta receptor (LTBR), mesothelin, neuropilin, N-terminal pro C-type natriuretic peptide (NT-proCNP), osteopontin, procalcitonin, pentraxin-3, periostin, polymeric immunoglobulin receptor (PIGR), pro-adrenomedullin (proADM), prosaposin B, receptor for advanced glycation endproducts (RAGE), soluble ST-2 (sST-2), syndecan-1, tumor necrosis factor alpha receptor 1 (TNFR-1), Troy, vascular endothelial growth receptor 1 (VEGFR-1) and WAP four-disulphide core domain protein HE4 (WAP-4c) were mea-sured using sandwich ELISAs on a Luminex® platform. These research assays have not been standardized to the commercialized assays used in research or in clinical use and the extent to which each Alere assay correlates with the commercial assay is not fully characterized. Four additional biomarkers – B-type natriuretic peptide (BNP), endothelin-1 (ET-1), Interleukin-6 (IL-6) and cardiac specific Troponin I (cTnI) – were measured in frozen plasma samples collected at baseline and on days 2, 7 and 14 using high sensitive single molecule counting (SMC™) tech-nology (RUO, Erenna® Immunoassay System, Singulex Inc., Alameda, CA, USA). Details of assay information and the number of available measurements of each biomarker have been previously published
184
Chapter 6
(24). A maximum difference of ±3 days was allowed between time of measurement and time of hospital discharge. Subsequently, patients discharged from hospital after 17 days of baseline assessment (N=258) were excluded from the analysis by definition.
Study outcomesPrimary outcome evaluated in the current study was time-to-death or heart failure rehospitalization within 30 days of discharge. Time-to-all-cause mortality within 90 days of discharge was evaluated as a second-ary outcome. Further sensitivity analysis was performed using time-to-death or rehospitalization for cardiovascular/renal causes by day 30 and time-to-all-cause mortality by 180 (from index hospital admission).
DefinitionsA threshold of 5% was considered an acceptable level of risk to catego-rize patients as ‘low risk’ for the 30-day risk of death or heart failure rehospitalization outcome. Subsequently, a cut-off value of a biomarker under consideration yielding negative predictive value (NPV) of 95% (i.e. corresponding to 5% false omission rate) was used to define low risk status and, therefore, patients with biomarker values below this cut-off were classified as low risk. On the other hand, a risk level of 20% for 30-day death or heart failure rehospitalization was utilized as the threshold defining ‘high risk’ status. In this case, a cut-off value of a biomarker yielding 20% positive predictive value (PPV) was employed to categorize patients as high risk. Patients with biomarker values above this cut-off were classified as positive for high risk. For secondary analysis with the 90-day all-cause mortality, risk thresholds of 2.5% and 15% were utilized to define low and high risk status, respectively.
Statistical analysisBiomarker levels were summarized by 30-day death or heart failure rehospitalization status. Mean (SD) or median (interquartile range) was presented for normally and non-normally distributed continuous variables, respectively. Groups were compared with the independent t-test or Wilcoxon rank-sum test based on normality of distribution.
185
Plasma biomarkers to predict or rule out early post-discharge events in AHF patients
6
To define optimal cut-off values of biomarkers for the identification of low and high risk patients, time-dependent sensitivity and specificity with corresponding negative and positive predictive values were esti-mated at all possible cut-off values for each biomarker using R package survivalROC. A biomarker was considered to be predictive of low risk for 30-day death or heart failure rehospitalization if it had at least one cut-off value that reached a NPV of 95% or greater. Biomarkers fulfill-ing this criterion were then further evaluated in a comparative analysis. In this analysis, predictive performances were compared by estimating partial area under the receiver operating characteristic (ROC) curve (pAUC) for each of the biomarkers considered to be predictive of low risk. The pAUC summarizes the discriminatory performance of a marker in a portion of the ROC curve defined based on a prespecified sensitivity/specificity range of interest (19). For the quantification of low- risk predictive value, the high sensitivity (i.e. rule-out) region of the ROC curve, defined as a sensitivity range from 0.9 to 1.0, was analyzed. Patients with available measurements of all biomarkers considered to be predictive of low risk were included in this analysis. Evaluation of high risk predictive value was performed by analyzing pAUC in the high specificity (i.e. rule-in) portion of the ROC curve, which was defined as a specifity range from 0.8 to 1.0. Patients with available measurements of all biomarkers considered to be predictive of high risk were included in this analysis. Here, a biomarker was considered predictive if it had at least one cut-off value reaching a PPV of 20% or greater. R package pROC was utilized for the calculation of pAUC.
Biomarkers that had cut-off values that classified at least 10% of pa-tients to either low or high risk (for the 30-day death or heart failure rehospitalization outcome) were then further analyzed in multivariable analysis to quantify added predictive value in the rule-out or rule-in re-gions of the ROC curve on top of a clinical model. First, a clinical model encompassing baseline variables including systolic blood pressure, his-tory of diabetes mellitus, atrial fibrillation, CABG, hyperlipidemia, past heart failure hospitalization and diuretic response (defined as weight loss in Kg per 40 mg of furosemide by day 4) was identified after imple-mentation of a backward selection procedure on a logistic regression
186
Chapter 6
model that included candidate predictors associated with outcome at a significance level of 10%. A bootstrap analysis was incorporated in this procedure to assure stability of model selection. In a second step, the added value of low and high risk predictive biomarkers in the rule-out and rule-in regions of the ROC curve, respectively, was quantified with the percentage change in pAUC attained with the addition of the biomarker under consideration to the clinical model. In this analysis, linear combination of biomarkers that maximizes the pAUC was identi-fied based on the clinical model alone or clinical model plus biomarker and a linear predictor was calculated for each patient and this was en-tered as a marker for the calculation of pAUC. In a last step, the added value of a combination of biomarkers, on top of the clinical model, was evaluated by quantifying the gain the pAUC in the rule-out or rule-in regions. The combination of the smallest number of the top four best performing biomarkers that yielded the highest pAUC in the respective risk regions was considered optimal.
A further analysis was performed at additional risk thresholds of 0%, 1%, 2%, 3% and 4% for low risk and at risk thresholds of 22.5%, 25%, 27.5% and 30% for high risk to determine cut-off values and associated proportion of patients that can be classified as low or high risk based on individual biomarkers, the clinical model and clinical model plus combination of biomarkers.
Secondary analysis with the 90-day all-cause mortality outcome was performed applying the same procedure described above. Here, further analysis was performed at risk thresholds of 0%, 0.5%, 1%, 1.5% and 2% for low risk and 17.5%, 20%, 22.5% and 25% for high risk. A similar analysis was also performed using 30-day death or rehospitalization for cardiovascular/renal causes and time-to-all-cause mortality by day 180 after index hospital admission outcomes as sensitivity. P-values <0.05 were considered statistically significant. Statistical analyses were performed with R: A Language and Environment for Statistical Com-puting, version 3.0.2 (R Foundation for Statistical Computing, Vienna, Austria).
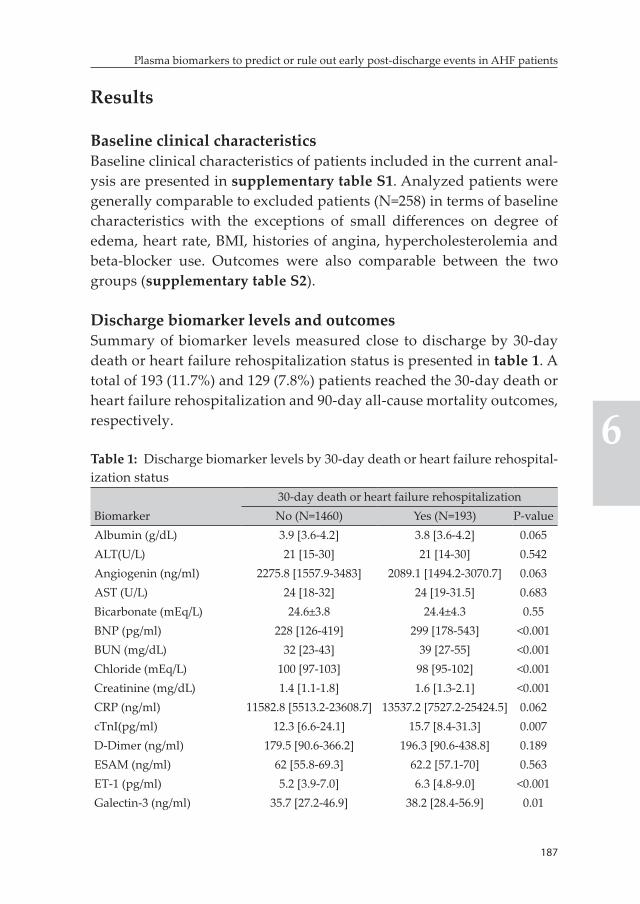
187
Plasma biomarkers to predict or rule out early post-discharge events in AHF patients
6
Results
Baseline clinical characteristicsBaseline clinical characteristics of patients included in the current anal-ysis are presented in supplementary table S1. Analyzed patients were generally comparable to excluded patients (N=258) in terms of baseline characteristics with the exceptions of small differences on degree of edema, heart rate, BMI, histories of angina, hypercholesterolemia and beta-blocker use. Outcomes were also comparable between the two groups (supplementary table S2).
Discharge biomarker levels and outcomesSummary of biomarker levels measured close to discharge by 30-day death or heart failure rehospitalization status is presented in table 1. A total of 193 (11.7%) and 129 (7.8%) patients reached the 30-day death or heart failure rehospitalization and 90-day all-cause mortality outcomes, respectively.
Table 1: Discharge biomarker levels by 30-day death or heart failure rehospital-ization status
Biomarker30-day death or heart failure rehospitalizationNo (N=1460) Yes (N=193) P-value
Albumin (g/dL) 3.9 [3.6-4.2] 3.8 [3.6-4.2] 0.065ALT(U/L) 21 [15-30] 21 [14-30] 0.542Angiogenin (ng/ml) 2275.8 [1557.9-3483] 2089.1 [1494.2-3070.7] 0.063AST (U/L) 24 [18-32] 24 [19-31.5] 0.683Bicarbonate (mEq/L) 24.6±3.8 24.4±4.3 0.55BNP (pg/ml) 228 [126-419] 299 [178-543] <0.001BUN (mg/dL) 32 [23-43] 39 [27-55] <0.001Chloride (mEq/L) 100 [97-103] 98 [95-102] <0.001Creatinine (mg/dL) 1.4 [1.1-1.8] 1.6 [1.3-2.1] <0.001CRP (ng/ml) 11582.8 [5513.2-23608.7] 13537.2 [7527.2-25424.5] 0.062cTnI(pg/ml) 12.3 [6.6-24.1] 15.7 [8.4-31.3] 0.007D-Dimer (ng/ml) 179.5 [90.6-366.2] 196.3 [90.6-438.8] 0.189ESAM (ng/ml) 62 [55.8-69.3] 62.2 [57.1-70] 0.563ET-1 (pg/ml) 5.2 [3.9-7.0] 6.3 [4.8-9.0] <0.001Galectin-3 (ng/ml) 35.7 [27.2-46.9] 38.2 [28.4-56.9] 0.01
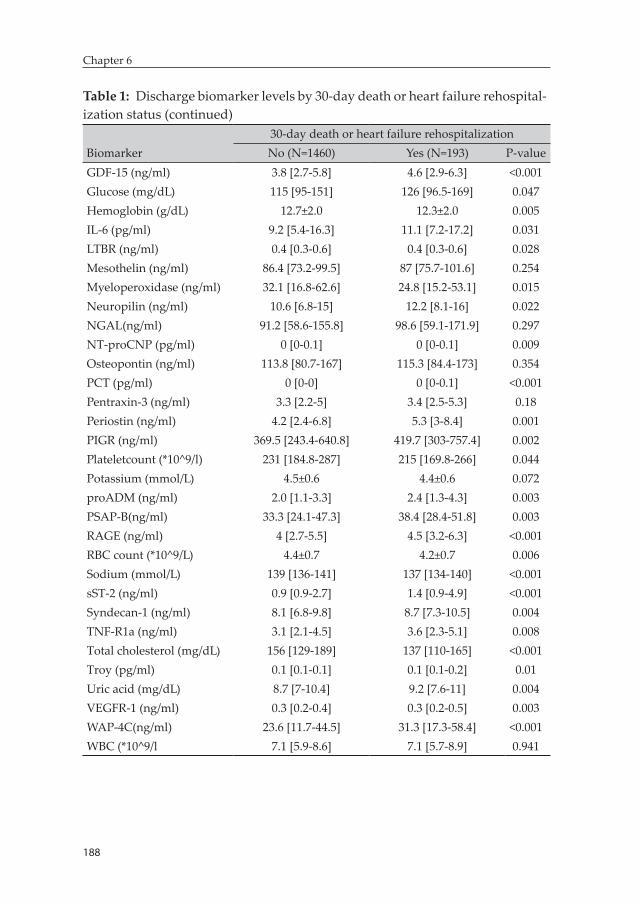
188
Chapter 6
Table 1: Discharge biomarker levels by 30-day death or heart failure rehospital-ization status (continued)
Biomarker30-day death or heart failure rehospitalizationNo (N=1460) Yes (N=193) P-value
GDF-15 (ng/ml) 3.8 [2.7-5.8] 4.6 [2.9-6.3] <0.001Glucose (mg/dL) 115 [95-151] 126 [96.5-169] 0.047Hemoglobin (g/dL) 12.7±2.0 12.3±2.0 0.005IL-6 (pg/ml) 9.2 [5.4-16.3] 11.1 [7.2-17.2] 0.031LTBR (ng/ml) 0.4 [0.3-0.6] 0.4 [0.3-0.6] 0.028Mesothelin (ng/ml) 86.4 [73.2-99.5] 87 [75.7-101.6] 0.254Myeloperoxidase (ng/ml) 32.1 [16.8-62.6] 24.8 [15.2-53.1] 0.015Neuropilin (ng/ml) 10.6 [6.8-15] 12.2 [8.1-16] 0.022NGAL(ng/ml) 91.2 [58.6-155.8] 98.6 [59.1-171.9] 0.297NT-proCNP (pg/ml) 0 [0-0.1] 0 [0-0.1] 0.009Osteopontin (ng/ml) 113.8 [80.7-167] 115.3 [84.4-173] 0.354PCT (pg/ml) 0 [0-0] 0 [0-0.1] <0.001Pentraxin-3 (ng/ml) 3.3 [2.2-5] 3.4 [2.5-5.3] 0.18Periostin (ng/ml) 4.2 [2.4-6.8] 5.3 [3-8.4] 0.001PIGR (ng/ml) 369.5 [243.4-640.8] 419.7 [303-757.4] 0.002Plateletcount (*10^9/l) 231 [184.8-287] 215 [169.8-266] 0.044Potassium (mmol/L) 4.5±0.6 4.4±0.6 0.072proADM (ng/ml) 2.0 [1.1-3.3] 2.4 [1.3-4.3] 0.003PSAP-B(ng/ml) 33.3 [24.1-47.3] 38.4 [28.4-51.8] 0.003RAGE (ng/ml) 4 [2.7-5.5] 4.5 [3.2-6.3] <0.001RBC count (*10^9/L) 4.4±0.7 4.2±0.7 0.006Sodium (mmol/L) 139 [136-141] 137 [134-140] <0.001sST-2 (ng/ml) 0.9 [0.9-2.7] 1.4 [0.9-4.9] <0.001Syndecan-1 (ng/ml) 8.1 [6.8-9.8] 8.7 [7.3-10.5] 0.004TNF-R1a (ng/ml) 3.1 [2.1-4.5] 3.6 [2.3-5.1] 0.008Total cholesterol (mg/dL) 156 [129-189] 137 [110-165] <0.001Troy (pg/ml) 0.1 [0.1-0.1] 0.1 [0.1-0.2] 0.01Uric acid (mg/dL) 8.7 [7-10.4] 9.2 [7.6-11] 0.004VEGFR-1 (ng/ml) 0.3 [0.2-0.4] 0.3 [0.2-0.5] 0.003WAP-4C(ng/ml) 23.6 [11.7-44.5] 31.3 [17.3-58.4] <0.001WBC (*10^9/l 7.1 [5.9-8.6] 7.1 [5.7-8.9] 0.941
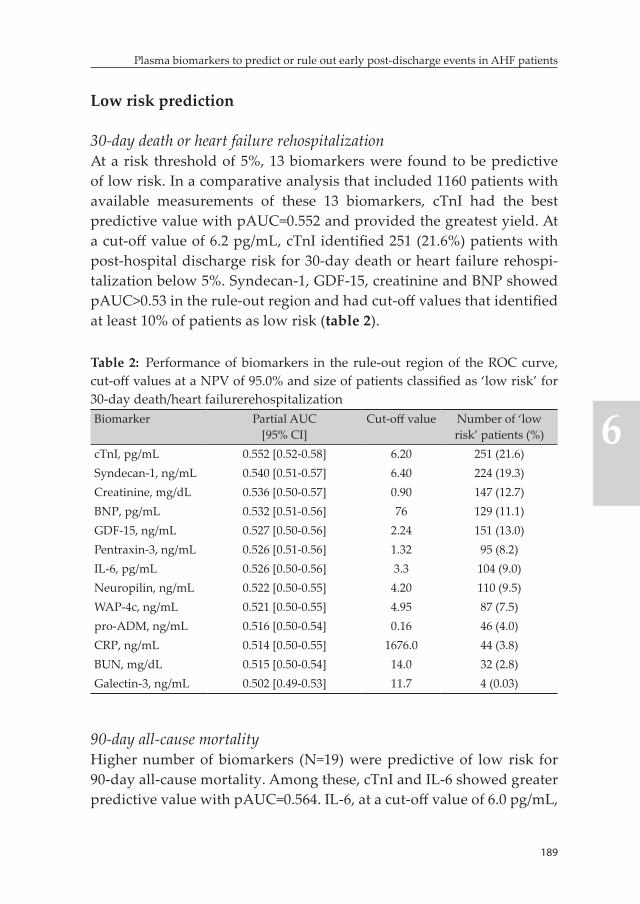
189
Plasma biomarkers to predict or rule out early post-discharge events in AHF patients
6
Low risk prediction
30-day death or heart failure rehospitalizationAt a risk threshold of 5%, 13 biomarkers were found to be predictive of low risk. In a comparative analysis that included 1160 patients with available measurements of these 13 biomarkers, cTnI had the best predictive value with pAUC=0.552 and provided the greatest yield. At a cut-off value of 6.2 pg/mL, cTnI identified 251 (21.6%) patients with post-hospital discharge risk for 30-day death or heart failure rehospi-talization below 5%. Syndecan-1, GDF-15, creatinine and BNP showed pAUC>0.53 in the rule-out region and had cut-off values that identified at least 10% of patients as low risk (table 2).
Table 2: Performance of biomarkers in the rule-out region of the ROC curve, cut-off values at a NPV of 95.0% and size of patients classified as ‘low risk’ for 30-day death/heart failurerehospitalizationBiomarker Partial AUC
[95% CI]Cut-off value Number of ‘low
risk’ patients (%)cTnI, pg/mL 0.552 [0.52-0.58] 6.20 251 (21.6)Syndecan-1, ng/mL 0.540 [0.51-0.57] 6.40 224 (19.3)Creatinine, mg/dL 0.536 [0.50-0.57] 0.90 147 (12.7)BNP, pg/mL 0.532 [0.51-0.56] 76 129 (11.1)GDF-15, ng/mL 0.527 [0.50-0.56] 2.24 151 (13.0)Pentraxin-3, ng/mL 0.526 [0.51-0.56] 1.32 95 (8.2)IL-6, pg/mL 0.526 [0.50-0.56] 3.3 104 (9.0)Neuropilin, ng/mL 0.522 [0.50-0.55] 4.20 110 (9.5)WAP-4c, ng/mL 0.521 [0.50-0.55] 4.95 87 (7.5)pro-ADM, ng/mL 0.516 [0.50-0.54] 0.16 46 (4.0)CRP, ng/mL 0.514 [0.50-0.55] 1676.0 44 (3.8)BUN, mg/dL 0.515 [0.50-0.54] 14.0 32 (2.8)Galectin-3, ng/mL 0.502 [0.49-0.53] 11.7 4 (0.03)
90-day all-cause mortalityHigher number of biomarkers (N=19) were predictive of low risk for 90-day all-cause mortality. Among these, cTnI and IL-6 showed greater predictive value with pAUC=0.564. IL-6, at a cut-off value of 6.0 pg/mL,
190
Chapter 6
identified 325 (28.0%) patients with post-discharge 90-day all-cause mortality risk below 2.5%, which was the greatest yield observed for this outcome. cTnI classified 251 (21.6%) patients to low risk for 90-day all-cause mortality at a cut-off value of 6.2 pg/mL. Eight additional bio-markers – syndecan-1, BNP, BUN, CRP, uric acid, GDF-15, creatinine and WAP-4c – identified at least 10% of patients as low risk for this outcome (supplementary table S3).
High risk prediction
30-day death or heart failure rehospitalizationEighteen biomarkers were predictive of high risk for 30-day death or heart failure rehospitalization at a risk threshold of 20%. A total of 1129 patients had available measurements of these biomarkers. ET-1 and procalcitonin showed the best predictive value in the rule-in re-gion with pAUC=0.56. At a cut-off value of 7.0 pg/mL, ET-1 identified 306 (27.1%) of these patients as high risk which was the highest yield observed among biomarkers predictive of high risk. On the other hand, procalcitonin, at a cut-off value of 0.04 ng/mL, categorized 265 (23.5%) patients as high risk for post-discharge 30-day death or heart failure rehospitalization. Six biomarkers – galectin-3, sST-2, RAGE, proADM, BUN and VEGFR-1 – also had cut-off values that identified at least 10% of patients as high risk (table 3).
90-day all-cause mortalityFifteen biomarkers were predictive of high risk for 90-day all-cause mortality at a threshold of 15%. Among these sST-2, ET-1 and proADM had pAUC=0.60 in the rule-in region for 90-day all-cause mortality. The greatest yield was attained by sST-2 as it categorized 288 (25.5%) patients as high risk at a cut-off value of 5.0 pg/mL. ET-1, IL-6 and procalcitonin, at cut-off values of 7.5 pg/mL, 20 pg/mL and 0.05 ng/mL, respectively, identified ~20% of patients as high risk for 90-day all-cause mortality. Six additional biomarkers including proADM, galectin-3, creatinine, VEGFR-1, BNP and BUN had cut-off values that categorized at least 10% of analyzed patients as high risk (supplementary table S4).
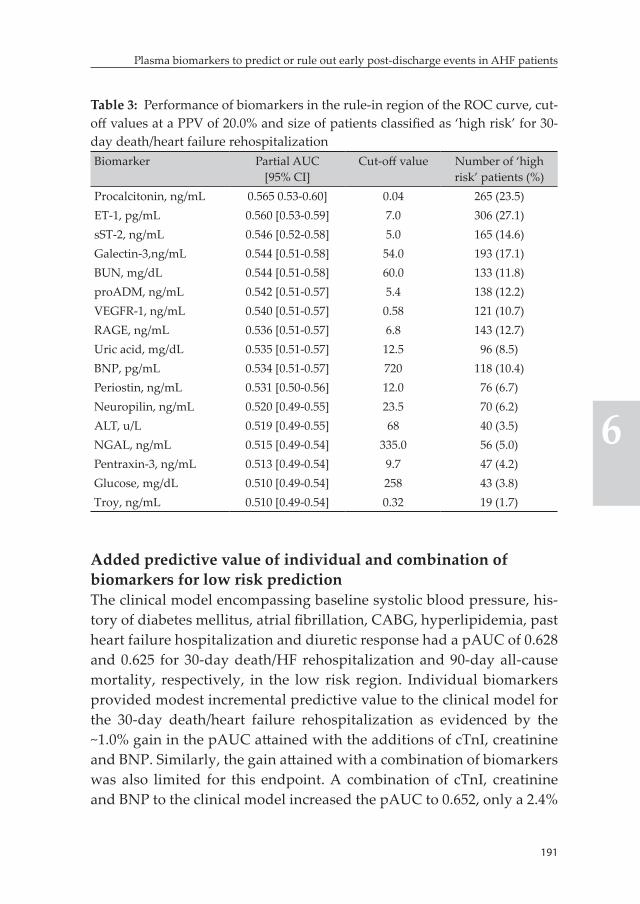
191
Plasma biomarkers to predict or rule out early post-discharge events in AHF patients
6
Table 3: Performance of biomarkers in the rule-in region of the ROC curve, cut-off values at a PPV of 20.0% and size of patients classified as ‘high risk’ for 30-day death/heart failure rehospitalizationBiomarker Partial AUC
[95% CI]Cut-off value Number of ‘high
risk’ patients (%)Procalcitonin, ng/mL 0.565 0.53-0.60] 0.04 265 (23.5)ET-1, pg/mL 0.560 [0.53-0.59] 7.0 306 (27.1)sST-2, ng/mL 0.546 [0.52-0.58] 5.0 165 (14.6)Galectin-3,ng/mL 0.544 [0.51-0.58] 54.0 193 (17.1)BUN, mg/dL 0.544 [0.51-0.58] 60.0 133 (11.8)proADM, ng/mL 0.542 [0.51-0.57] 5.4 138 (12.2)VEGFR-1, ng/mL 0.540 [0.51-0.57] 0.58 121 (10.7)RAGE, ng/mL 0.536 [0.51-0.57] 6.8 143 (12.7)Uric acid, mg/dL 0.535 [0.51-0.57] 12.5 96 (8.5)BNP, pg/mL 0.534 [0.51-0.57] 720 118 (10.4)Periostin, ng/mL 0.531 [0.50-0.56] 12.0 76 (6.7)Neuropilin, ng/mL 0.520 [0.49-0.55] 23.5 70 (6.2)ALT, u/L 0.519 [0.49-0.55] 68 40 (3.5)NGAL, ng/mL 0.515 [0.49-0.54] 335.0 56 (5.0)Pentraxin-3, ng/mL 0.513 [0.49-0.54] 9.7 47 (4.2)Glucose, mg/dL 0.510 [0.49-0.54] 258 43 (3.8)Troy, ng/mL 0.510 [0.49-0.54] 0.32 19 (1.7)
Added predictive value of individual and combination of biomarkers for low risk predictionThe clinical model encompassing baseline systolic blood pressure, his-tory of diabetes mellitus, atrial fibrillation, CABG, hyperlipidemia, past heart failure hospitalization and diuretic response had a pAUC of 0.628 and 0.625 for 30-day death/HF rehospitalization and 90-day all-cause mortality, respectively, in the low risk region. Individual biomarkers provided modest incremental predictive value to the clinical model for the 30-day death/heart failure rehospitalization as evidenced by the ~1.0% gain in the pAUC attained with the additions of cTnI, creatinine and BNP. Similarly, the gain attained with a combination of biomarkers was also limited for this endpoint. A combination of cTnI, creatinine and BNP to the clinical model increased the pAUC to 0.652, only a 2.4%
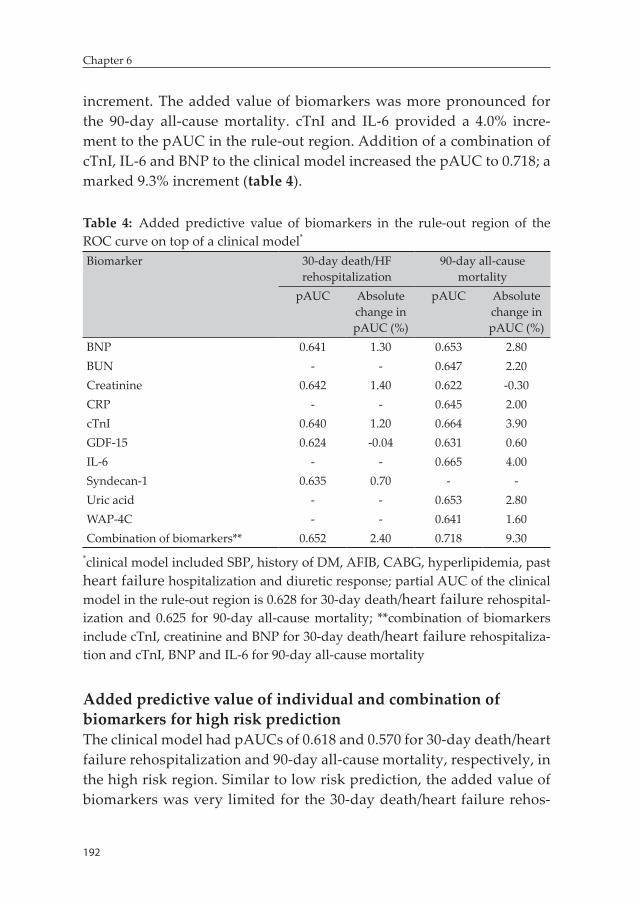
192
Chapter 6
increment. The added value of biomarkers was more pronounced for the 90-day all-cause mortality. cTnI and IL-6 provided a 4.0% incre-ment to the pAUC in the rule-out region. Addition of a combination of cTnI, IL-6 and BNP to the clinical model increased the pAUC to 0.718; a marked 9.3% increment (table 4).
Table 4: Added predictive value of biomarkers in the rule-out region of the ROC curve on top of a clinical model*
Biomarker 30-day death/HF rehospitalization
90-day all-cause mortality
pAUC Absolute change in pAUC (%)
pAUC Absolute change in pAUC (%)
BNP 0.641 1.30 0.653 2.80BUN - - 0.647 2.20Creatinine 0.642 1.40 0.622 -0.30CRP - - 0.645 2.00cTnI 0.640 1.20 0.664 3.90GDF-15 0.624 -0.04 0.631 0.60IL-6 - - 0.665 4.00Syndecan-1 0.635 0.70 - -Uric acid - - 0.653 2.80WAP-4C - - 0.641 1.60Combination of biomarkers** 0.652 2.40 0.718 9.30
*clinical model included SBP, history of DM, AFIB, CABG, hyperlipidemia, past heart failure hospitalization and diuretic response; partial AUC of the clinical model in the rule-out region is 0.628 for 30-day death/heart failure rehospital-ization and 0.625 for 90-day all-cause mortality; **combination of biomarkers include cTnI, creatinine and BNP for 30-day death/heart failure rehospitaliza-tion and cTnI, BNP and IL-6 for 90-day all-cause mortality
Added predictive value of individual and combination of biomarkers for high risk predictionThe clinical model had pAUCs of 0.618 and 0.570 for 30-day death/heart failure rehospitalization and 90-day all-cause mortality, respectively, in the high risk region. Similar to low risk prediction, the added value of biomarkers was very limited for the 30-day death/heart failure rehos-
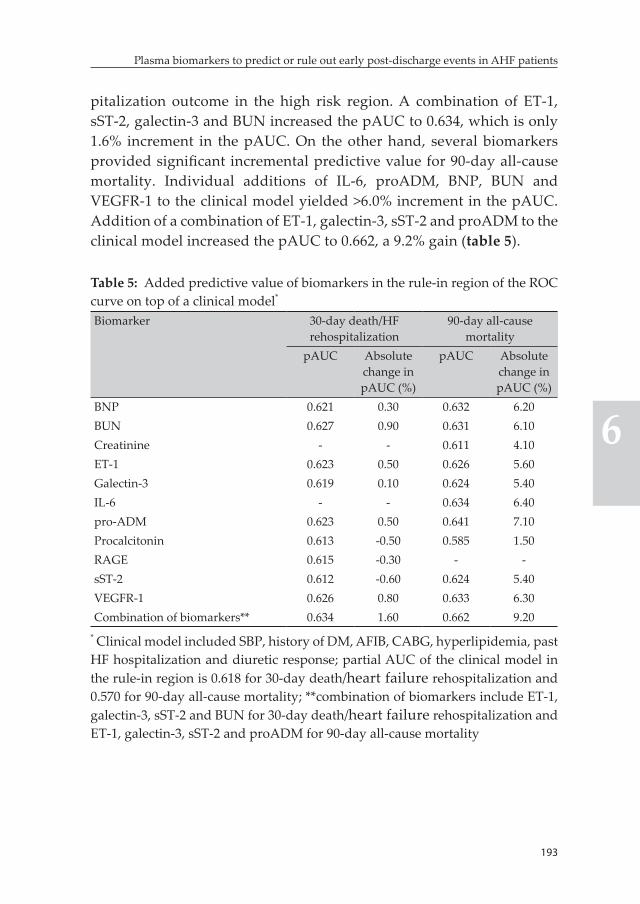
193
Plasma biomarkers to predict or rule out early post-discharge events in AHF patients
6
pitalization outcome in the high risk region. A combination of ET-1, sST-2, galectin-3 and BUN increased the pAUC to 0.634, which is only 1.6% increment in the pAUC. On the other hand, several biomarkers provided significant incremental predictive value for 90-day all-cause mortality. Individual additions of IL-6, proADM, BNP, BUN and VEGFR-1 to the clinical model yielded >6.0% increment in the pAUC. Addition of a combination of ET-1, galectin-3, sST-2 and proADM to the clinical model increased the pAUC to 0.662, a 9.2% gain (table 5).
Table 5: Added predictive value of biomarkers in the rule-in region of the ROC curve on top of a clinical model*
Biomarker 30-day death/HF rehospitalization
90-day all-cause mortality
pAUC Absolute change in pAUC (%)
pAUC Absolute change in pAUC (%)
BNP 0.621 0.30 0.632 6.20BUN 0.627 0.90 0.631 6.10Creatinine - - 0.611 4.10ET-1 0.623 0.50 0.626 5.60Galectin-3 0.619 0.10 0.624 5.40IL-6 - - 0.634 6.40pro-ADM 0.623 0.50 0.641 7.10Procalcitonin 0.613 -0.50 0.585 1.50RAGE 0.615 -0.30 - -sST-2 0.612 -0.60 0.624 5.40VEGFR-1 0.626 0.80 0.633 6.30Combination of biomarkers** 0.634 1.60 0.662 9.20
* Clinical model included SBP, history of DM, AFIB, CABG, hyperlipidemia, past HF hospitalization and diuretic response; partial AUC of the clinical model in the rule-in region is 0.618 for 30-day death/heart failure rehospitalization and 0.570 for 90-day all-cause mortality; **combination of biomarkers include ET-1, galectin-3, sST-2 and BUN for 30-day death/heart failure rehospitalization and ET-1, galectin-3, sST-2 and proADM for 90-day all-cause mortality
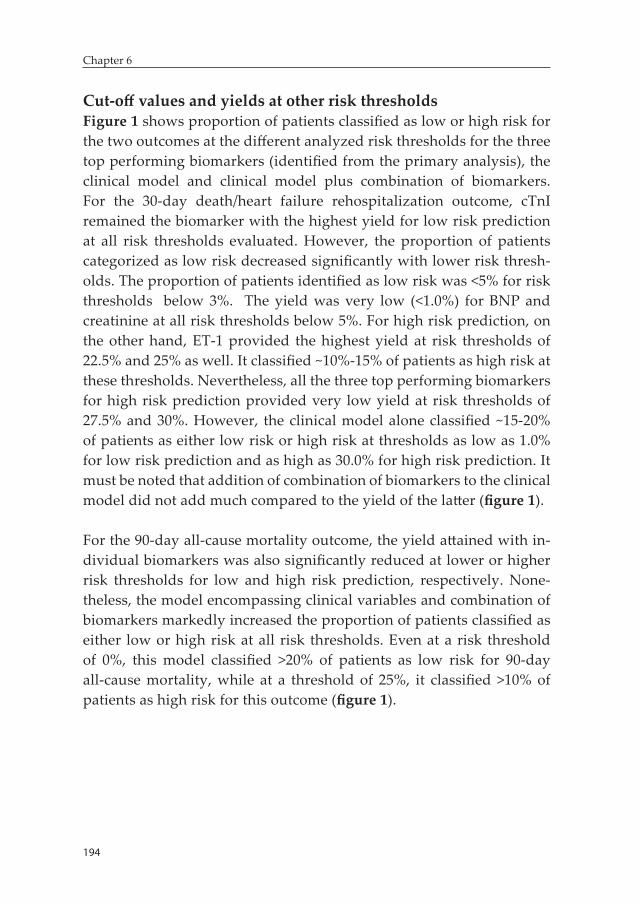
194
Chapter 6
Cut-off values and yields at other risk thresholdsFigure 1 shows proportion of patients classified as low or high risk for the two outcomes at the different analyzed risk thresholds for the three top performing biomarkers (identified from the primary analysis), the clinical model and clinical model plus combination of biomarkers. For the 30-day death/heart failure rehospitalization outcome, cTnI remained the biomarker with the highest yield for low risk prediction at all risk thresholds evaluated. However, the proportion of patients categorized as low risk decreased significantly with lower risk thresh-olds. The proportion of patients identified as low risk was <5% for risk thresholds below 3%. The yield was very low (<1.0%) for BNP and creatinine at all risk thresholds below 5%. For high risk prediction, on the other hand, ET-1 provided the highest yield at risk thresholds of 22.5% and 25% as well. It classified ~10%-15% of patients as high risk at these thresholds. Nevertheless, all the three top performing biomarkers for high risk prediction provided very low yield at risk thresholds of 27.5% and 30%. However, the clinical model alone classified ~15-20% of patients as either low risk or high risk at thresholds as low as 1.0% for low risk prediction and as high as 30.0% for high risk prediction. It must be noted that addition of combination of biomarkers to the clinical model did not add much compared to the yield of the latter (figure 1).
For the 90-day all-cause mortality outcome, the yield attained with in-dividual biomarkers was also significantly reduced at lower or higher risk thresholds for low and high risk prediction, respectively. None-theless, the model encompassing clinical variables and combination of biomarkers markedly increased the proportion of patients classified as either low or high risk at all risk thresholds. Even at a risk threshold of 0%, this model classified >20% of patients as low risk for 90-day all-cause mortality, while at a threshold of 25%, it classified >10% of patients as high risk for this outcome (figure 1).
195
Plasma biomarkers to predict or rule out early post-discharge events in AHF patients
6
Sensitivity analysisAs presented in supplementary tables S5 and S6, the best performing low and high risk predictive biomarkers for 30-day death or rehospi-talization for cardiovascular/renal causes were generally comparable to that of the 30-day death or heart failure rehospitalization outcome. Similarly, there were no significant differences in the set and ranking of low versus high risk predictive biomarkers for the 180-day all-cause mortality outcome compared to the findings for 90-day all-cause mor-tality (supplementary tables S7 and S8).
0
10
20
30
40
50
0 1 2 3 4 51−NPV (False omission rate) (%)
Prop
ortio
n of
pat
ient
s cl
assi
fied
as lo
w ri
sk (%
)
Biomarker
Clinical model+MM
Clinical model
cTnI
Creatinine
BNP
30−day death/HF rehospitalization
0
10
20
30
40
50
20.0 22.5 25.0 27.5 30.0PPV (%)
Prop
ortio
n of
pat
ient
s cl
assi
fied
as h
igh
risk
(%)
Biomarker
Clinical model + MM
Clinical model
ET−1
Galectin−3
sST−2
30−day death/HF rehospitalization
0
20
40
60
0.0 0.5 1.0 1.5 2.0 2.51−NPV (False omission rate) (%)
Prop
ortio
n of
pat
ient
s cl
assi
fied
as lo
w ri
sk (%
)
Biomarker
Clinical model+MM
Clinical model
IL−6
cTnI
BNP
90−day all−cause mortality
0
10
20
30
40
50
15.0 17.5 20.0 22.5 25.0PPV (%)
Prop
ortio
n of
pat
ient
s cl
assi
fied
as h
igh
risk
(%)
Biomarker
Clinical model + MM
Clinical model
ET−1
sST−2
Galectin−3
90−day all−cause mortality
Figure 1: Size of low risk (left) and high risk (right) subpopulation of patients as a function of risk threshold for 30-day death or heart failure rehospitalization (top) and 90-day all-cause mortality (bottom); results for top three biomarkers, clinical model and clinical model + combination of biomarkers are presented
196
Chapter 6
Discussion
In this comparative study we evaluated the value of 47 established and novel biomarkers measured close to discharge for low and high post-discharge risk prediction in hospitalized AHF patients. We found a remarkable difference between those markers that showed good perfor-mance for the prediction of low risk and those that predicted high risk for two early post-discharge outcomes. For the 30-day death or heart failure rehospitalization outcome, cTnI provided the greatest perfor-mance for low risk prediction while ET-1 and procalcitonin performed best for high risk prediction. On the other hand, cTnI and IL-6 were the best performing biomarkers for low risk prediction using the 90-day all-cause mortality outcome while several biomarkers including ET-1, sST-2 and proADM showed good performance for high risk. Several biomarkers (both individually and in combination) provided added predictive value, on top of a clinical model, in both the low and high risk regions, which was more pronounced for the mortality outcome.
A demand-based approach that combines earlier discharge with less intensive post-discharge care in low risk AHF patients and more ex-tended and intensive inhospital and post-discharge care in those with high risk is appealing as it might lead to improved outcomes. This strategy might also promote efficient distribution of scarce health care resources potentially reducing the high monetary cost associated with the care of heart failure patients. Development and effective imple-mentation of such strategies requires tools that can accurately identify low risk patients that can be safely discharged and treated less aggres-sively post-discharge and high risk patients for whom more intensive inhospital and post-discharge management is justified. Nevertheless, prediction of post-discharge events, particularly readmissions, with readily available clinical variables and standard laboratory parameters remains challenging (1, 4). Biomarkers can play an essential role to-wards improving objective predischarge risk stratification and several promising prognostic biomarkers are available in AHF currently thanks to significant advances in proteomic research over the past years (23-27). However, there is a very limited data on the potential clinical utility
197
Plasma biomarkers to predict or rule out early post-discharge events in AHF patients
6
of biomarkers for the identification of patients at low and high risk for short-term post-discharge complications.
Our study suggests that different sets of biomarkers need to be utilized for optimal low and high risk prediction. Interestingly, cTnI was the most promising biomarker for the identification of patients who are at low risk for post-discharge complications. This is consistent with a recently reported study by Pang et al, which indicated that low levels of hs-TnT evaluated within 16 hours of presentation could identify AHF patients at very low risk for cardiovascular mortality within 180 days of hospital admission (28). Although further investigation is required, the pivotal role of troponins in the management of acute coronary syndrome appears to have the potential to extend to the management of AHF patients. Regarding high risk prediction, ET-1 is, possibly, the most optimal individual biomarker as it showed consistently good performance for both outcomes evaluated. ET-1 is a potent endogenous vasoconstrictor that had been indicated to have increased activity in heart failure through the upregulation of ET receptor A (29). Perez et al evaluated the prognostic value of elevated ET-1 in hospitalized AHF patients included in the ASCEND trial. They showed that patients with baseline ET-1 levels in the highest tertile had the highest rate of 180-day all-cause mortality and, interestingly, risk persisted if ET-1 levels were maintained at the highest tertile after 48-72 hours and 30 days of the baseline assessment (30). Our findings further support the notion that persistence of endothelin-mediated vasoconstriction after inhospital treatment could be an important marker of susceptibility for post-hos-pital discharge adverse outcomes. It must be emphasized that several other biomarkers reflecting diverse pathophysiologic pathways also showed promising low risk (e.g. IL-6, syndecan-1, GDF-15, BNP, BUN and creatinine) and high risk (e.g. procalcitonin, sST-2, galectin-3, IL-6 and proADM) prediction values. Plenty of biomarkers also provided added predictive value, on top of a clinical model, in both the low and high risk regions. Interestingly, both low and high risk prediction were further enhanced with combinations of biomarkers that encompassed markers reflecting the diverse pathophysiologic pathways involved in heart failure.
198
Chapter 6
The choice of outcome utilized to define risk did not show significant effect on the selection of best performing biomarkers for both low and high risk prediction. Aside from small changes in ranking, biomarkers that showed good performance for the 30-day death or heart failure rehospitalization outcome also performed well for the 90-day all-cause mortality. However, the inflammatory biomarkers (IL-6 in particular) are notable exceptions here. IL-6 was among the best predictors of both low and high risk for 90-day all-cause mortality yet it had poor performance for the 30-day composite outcome. This is not unexpected as we, in a post-hoc analysis of biomarker data from the PROTECT trial, showed that IL-6 showed poor overall predictive value for 30-day death or rehospitalization for cardiovascular or renal causes despite having the highest C-index for both short and intermediate term all-cause mortality among 48 biomarkers evaluated (24). Moreover, the added value of both individual and combinations of biomarkers, on top of the clinical model, was more pronounced for the 90-day all-cause mortality outcome. This, again, is consistent with our previous analysis which showed that biomarkers are generally better at predicting mortality compared to rehospitalization outcomes as quantified by overall pre-dictive value.
Evaluation of performance of biomarkers in clinically relevant risk regions, as we did in this study, is (probably) more important than the mere assessment of overall discriminatory accuracy for facilitating the clinical utility of the plenty of available prognostic biomarkers in AHF. However, defining these clinically relevant risk regions is a challenging task as the clinical and health economic implications of stratification into different risk categories remains unclear at this stage. Ideally, event rate should be close to zero in low risk subpopulation of patients and significantly high enough to warrant more intensive treatment in high risk subpopulation of patients. This must, however, be offset against the proportion of patients categorized as low or high risk for this risk stratification to have meaningful clinical impact. For the primary analy-sis of this study, we utilized risk thresholds of 5% and 20% for 30-day death or heart failure rehospitalization to define low and high risk, respectively. At this thresholds ~20%-25% of patients were categorized
199
Plasma biomarkers to predict or rule out early post-discharge events in AHF patients
6
as low or high risk with the best performing biomarkers. In a sensitivity analysis we evaluated several risk thresholds <5% for low risk and >20% for high risk. The proportion of patients categorized as low risk signifi-cantly declined at lower risk thresholds; even with cTnI, <5% of patients were identified as low risk at risk thresholds below 3%. Similarly the number of patients identified as high risk was lower with the higher risk thresholds, particularly for thresholds above 25%. Subsequently, the risk thresholds utilized for the primary analysis appear to provide a reasonable balance between level of risk and proportion of patients categorized into low or high risk. Interestingly, these parameters were significantly improved with models that utilized clinical prognostica-tors together with a combination of biomarkers.
Strengths and limitationsWe evaluated 47 established and novel biomarkers measured close to hospital discharge in in a fairly large, well-characterized cohort of hospitalized AHF patients. Our study has several limitations. This is a post-hoc analysis of data from a randomized controlled trial which was primarily designed to evaluate efficacy of rolofylline. Therefore, our analysis was exploratory and findings should only be considered as hy-pothesis generating. The PROTECT trial included sicker subpopulation of AHF patients with significantly elevated natriuretic peptide levels, mild to moderate renal dysfunction and previous history of heart failure hospitalization during admission. Subsequently, extrapolation of our findings to the whole AHF patient population needs further evaluation. The importance of prospective validation of our findings could not be overstated at this point. Moreover, several of the biomarkers evaluated, in particular cTnI and BNP, were measured using research assays rather than the routinely available commercial assays. Subsequently, cut-off values identified in the current analysis might not be generalized and need to be interpreted cautiously. Significant proportions of sST-2 and GDF-15 measurements available were at the lower and upper assay detection limits, respectively. This could potentially underestimate the performance of the two biomarkers for low (sST-2) and high (GDF-15) risk prediction.
200
Chapter 6
Future stepsCurrently, there appears to a disconnect between disease severity and intensity of treatment in hospitalized AHF patients. An interest-ing analysis by Cotter et al that utilized data from the VERITAS trial showed that length of hospital stay was only partially explained by baseline disease severity (10). Another study by Davison et al, utilizing data from the PROTECT trial also showed a similar finding (31). We further explored whether several potential surrogates for physicians’ judgment of disease severity (including total IV diuretic dose, length of hospital stay and IV inotrope/vasopressor administration) differed in groups of patients classified as low versus high risk for post-discharge outcomes based on the most optimal discharge models we identified. As presented in the supplementary table S9, aside from a significant difference on total IV diuretic dose received through day 7 or discharge (if earlier), length of hospital stay and inotrope/vasopressor administra-tion did not differ based on post-discharge risk of complications. These further support the assertion that objective risk stratification tools like biomarkers are highly needed in AHF patients.
Although biomarkers could effectively identify low and high risk patients, there is a lack of guideline recommended, risk-based inter-ventions that could be implemented to reduce both the high rates of adverse outcomes and cost associated with hospitalization for AHF. This significantly limits the clinical application of risk stratification tools in general and biomarkers in particular. Subsequently, random-ized controlled trials evaluating the effectiveness of targeted, risk-based interventions are needed in the future. Length of hospital stay is one area that might be of interest. There is some observational data suggest-ing that longer hospital stay might be beneficial, particularly in terms of reducing rates of readmissions (10-12). It will be highly interesting to evaluate the effectiveness and cost-effectiveness of an intervention that combines early discharge in low risk patients and more extended inhospital treatment in high risk patients in a randomized controlled trial. Another potential target for intervention, particularly in high risk patients, involves intensity of post-discharge care. Although available evidence is inconclusive, intensive monitoring strategies like telemoni-
201
Plasma biomarkers to predict or rule out early post-discharge events in AHF patients
6
toring and natriuretic peptide guided monitoring have been indicated to be beneficial in some studies (5-8). It might be of particular interest to evaluate the effectiveness of such intensive monitoring strategies in selected high risk group of patients in a randomized controlled trial.
External validation of findings reported in this study in an independent cohort of AHF patients is another essential step that is needed to facili-tate the clinical applicability of the current results. Last but not least, cost and availability of biomarker measurements is another important area that needs to be addressed in the future to facilitate the clinical utility of prognostic biomarkers. Quantification of cost-effectiveness of biomarker analysis, both individually and in tandem, is challenging currently as the clinical implications of information attained with prog-nostic biomarkers is less clear so far. It could, however, be speculated that the advent of new technology that could enhance the speed and availability of biomarker measurements and reduce costs (e.g. point-of-care devices) will significantly facilitate the clinical utility of biomark-ers.
Conclusion
Different sets of biomarkers predict low versus high risk of early post-discharge events in patients hospitalized for AHF. Therefore, this needs to be taken into consideration for optimizing biomarker-guided predischarge risk stratification strategies in hospitalized AHF patients. Future studies are needed to prospectively validate our observations in the general AHF patient population.
References 1. Au AG, McAlister FA, Bakal JA, Ezekowitz J, Kaul P, van Walraven C.
Predicting the risk of unplanned readmission or death within 30 days of discharge after a heart failure hospitalization. Am Heart J 2012;164:365-372.
2. Heidenreich PA, Albert NM, Allen LA, Bluemke DA, Butler J, Fonarow GC, Ikonomidis JS, Khavjou O, Konstam MA, Maddox TM, Nichol G, Pham
202
Chapter 6
M, Pina IL, Trogdon JG, American Heart Association Advocacy Coordi-nating Committee, Council on Arteriosclerosis, Thrombosis and Vascular Biology, Council on Cardiovascular Radiology and Intervention, Council on Clinical Cardiology, Council on Epidemiology and Prevention, Stroke Council. Forecasting the impact of heart failure in the United States: a policy statement from the American Heart Association. Circ Heart Fail 2013;6:606-619.
3. Reynolds K, Butler MG, Kimes TM, Rosales AG, Chan W, Nichols GA. Relation of Acute Heart Failure Hospital Length of Stay to Subsequent Readmission and All-Cause Mortality. Am J Cardiol 2015;116:400-405.
4. Dunbar-Yaffe R, Stitt A, Lee JJ, Mohamed S, Lee DS. Assessing Risk and Preventing 30-Day Readmissions in Decompensated Heart Failure: Op-portunity to Intervene? Curr Heart Fail Rep 2015;12:309-317.
5. Feltner C, Jones CD, Cene CW, Zheng ZJ, Sueta CA, Coker-Schwimmer EJ, Arvanitis M, Lohr KN, Middleton JC, Jonas DE. Transitional care interventions to prevent readmissions for persons with heart failure: a systematic review and meta-analysis. Ann Intern Med 2014;160:774-784.
6. Hindricks G, Taborsky M, Glikson M, Heinrich U, Schumacher B, Katz A, Brachmann J, Lewalter T, Goette A, Block M, Kautzner J, Sack S, Husser D, Piorkowski C, Sogaard P, IN-TIME study group. Implant-based mul-tiparameter telemonitoring of patients with heart failure (IN-TIME): a randomised controlled trial. Lancet 2014;384:583-590.
7. Chaudhry SI, Mattera JA, Curtis JP, Spertus JA, Herrin J, Lin Z, Phillips CO, Hodshon BV, Cooper LS, Krumholz HM. Telemonitoring in patients with heart failure. N Engl J Med 2010;363:2301-2309.
8. Maisel A, Barnard D, Jaski B, Frivold G, Marais J, Azer M, Miyamoto MI, Lombardo D, Kelsay D, Borden K, Iqbal N, Taub PR, Kupfer K, Clopton P, Greenberg B. Primary results of the HABIT Trial (heart failure assess-ment with BNP in the home). J Am Coll Cardiol 2013;61:1726-1735.
9. Hernandez AF, Greiner MA, Fonarow GC, Hammill BG, Heidenreich PA, Yancy CW, Peterson ED, Curtis LH. Relationship between early physi-cian follow-up and 30-day readmission among Medicare beneficiaries hospitalized for heart failure. JAMA 2010;303:1716-1722.
10. Cotter G, Davison BA, Milo O, Bourge RC, Cleland JG, Jondeau G, Krum H, O’Connor CM, Metra M, Parker JD, Torre-Amione G, van Veldhuisen DJ, Kobrin I, Rainisio M, Senger S, Edwards C, McMurray JJ, Teerlink JR, VERITAS Investigators. Predictors and Associations With Outcomes of Length of Hospital Stay in Patients With Acute Heart Failure: Results From VERITAS. J Card Fail 2015;.
11. Eapen ZJ, Reed SD, Li Y, Kociol RD, Armstrong PW, Starling RC, McMur-ray JJ, Massie BM, Swedberg K, Ezekowitz JA, Fonarow GC, Teerlink JR, Metra M, Whellan DJ, O’Connor CM, Califf RM, Hernandez AF. Do countries or hospitals with longer hospital stays for acute heart failure
203
Plasma biomarkers to predict or rule out early post-discharge events in AHF patients
6
have lower readmission rates?: Findings from ASCEND-HF. Circ Heart Fail 2013;6:727-732.
12. Mentz RJ, Cotter G, Cleland JG, Stevens SR, Chiswell K, Davison BA, Teerlink JR, Metra M, Voors AA, Grinfeld L, Ruda M, Mareev V, Lotan C, Bloomfield DM, Fiuzat M, Givertz MM, Ponikowski P, Massie BM, O’Connor CM. International differences in clinical characteristics, man-agement, and outcomes in acute heart failure patients: better short-term outcomes in patients enrolled in Eastern Europe and Russia in the PRO-TECT trial. Eur J Heart Fail 2014;16:614-624.
13. Cleland JG, Chiswell K, Teerlink JR, Stevens S, Fiuzat M, Givertz MM, Davison BA, Mansoor GA, Ponikowski P, Voors AA, Cotter G, Metra M, Massie BM, O’Connor CM. Predictors of postdischarge outcomes from information acquired shortly after admission for acute heart failure: a report from the Placebo-Controlled Randomized Study of the Selective A1 Adenosine Receptor Antagonist Rolofylline for Patients Hospitalized With Acute Decompensated Heart Failure and Volume Overload to Assess Treatment Effect on Congestion and Renal Function (PROTECT) Study. Circ Heart Fail 2014;7:76-87.
14. Eurlings LW, Sanders-van Wijk S, van Kimmenade R, Osinski A, van Hel-mond L, Vallinga M, Crijns HJ, van Dieijen-Visser MP, Brunner-La Rocca HP, Pinto YM. Multimarker strategy for short-term risk assessment in patients with dyspnea in the emergency department: the MARKED (Multi mARKer Emergency Dyspnea)-risk score. J Am Coll Cardiol 2012;60:1668-1677.
15. Pascual-Figal DA, Manzano-Fernandez S, Boronat M, Casas T, Garrido IP, Bonaque JC, Pastor-Perez F, Valdes M, Januzzi JL. Soluble ST2, high-sensitivity troponin T- and N-terminal pro-B-type natriuretic peptide: complementary role for risk stratification in acutely decompensated heart failure. Eur J Heart Fail 2011;13:718-725.
16. Maisel A, Mueller C, Nowak R, Peacock WF, Landsberg JW, Ponikowski P, Mockel M, Hogan C, Wu AH, Richards M, Clopton P, Filippatos GS, Di Somma S, Anand I, Ng L, Daniels LB, Neath SX, Christenson R, Potocki M, McCord J, Terracciano G, Kremastinos D, Hartmann O, von Haehling S, Bergmann A, Morgenthaler NG, Anker SD. Mid-region pro-hormone markers for diagnosis and prognosis in acute dyspnea: results from the BACH (Biomarkers in Acute Heart Failure) trial. J Am Coll Cardiol 2010;55:2062-2076.
17. Lassus J, Gayat E, Mueller C, Peacock WF, Spinar J, Harjola VP, van Kim-menade R, Pathak A, Mueller T, Disomma S, Metra M, Pascual-Figal D, Laribi S, Logeart D, Nouira S, Sato N, Potocki M, Parenica J, Collet C, Cohen-Solal A, Januzzi JL,Jr, Mebazaa A, GREAT-Network. Incremental value of biomarkers to clinical variables for mortality prediction in acute-ly decompensated heart failure: the Multinational Observational Cohort on Acute Heart Failure (MOCA) study. Int J Cardiol 2013;168:2186-2194.
204
Chapter 6
18. Dieplinger B, Gegenhuber A, Kaar G, Poelz W, Haltmayer M, Mueller T. Prognostic value of established and novel biomarkers in patients with shortness of breath attending an emergency department. Clin Biochem 2010;43:714-719.
19. Ma H, Bandos AI, Rockette HE, Gur D. On use of partial area under the ROC curve for evaluation of diagnostic performance. Stat Med 2013;32:3449-3458.
20. Meijers WC, de Boer RA, van Veldhuisen DJ, Jaarsma T, Hillege HL, Maisel AS, Di Somma S, Voors AA, Peacock WF. Biomarkers and low risk in heart failure. Data from COACH and TRIUMPH. Eur J Heart Fail 2015;17:1271-1282.
21. Weatherley BD, Cotter G, Dittrich HC, DeLucca P, Mansoor GA, Bloomfield DM, Ponikowski P, O’Connor CM, Metra M, Massie BM, PROTECT Steering Committee, Investigators, and Coordinators. Design and ratio-nale of the PROTECT study: a placebo-controlled randomized study of the selective A1 adenosine receptor antagonist rolofylline for patients hospitalized with acute decompensated heart failure and volume over-load to assess treatment effect on congestion and renal function. J Card Fail 2010;16:25-35.
22. Massie BM, O’Connor CM, Metra M, Ponikowski P, Teerlink JR, Cotter G, Weatherley BD, Cleland JG, Givertz MM, Voors A, DeLucca P, Mansoor GA, Salerno CM, Bloomfield DM, Dittrich HC, PROTECT Investigators and Committees. Rolofylline, an adenosine A1-receptor antagonist, in acute heart failure. N Engl J Med 2010;363:1419-1428.
23. de Boer RA, Daniels LB, Maisel AS, Januzzi JL,Jr. State of the Art: Newer biomarkers in heart failure. Eur J Heart Fail 2015;17:559-569.
24. Demissei BG, Valente MA, Cleland JG, O’Connor CM, Metra M, Ponikowski P, Teerlink JR, Cotter G, Davison B, Givertz MM, Bloomfield DM, Dittrich H, van der Meer P, van Veldhuisen DJ, Hillege HL, Voors AA. Optimiz-ing clinical use of biomarkers in high-risk acute heart failure patients. Eur J Heart Fail 2016;18:269-280.
25. Chowdhury P, Kehl D, Choudhary R, Maisel A. The use of biomarkers in the patient with heart failure. Curr Cardiol Rep 2013;15:372-013-0372-4.
26. Schmitter D, Cotter G, Voors AA. Clinical use of novel biomarkers in heart failure: towards personalized medicine. Heart Fail Rev 2014;19:369-381.
27. Maisel AS, Choudhary R. Biomarkers in acute heart failure--state of the art. Nat Rev Cardiol 2012;9:478-490.
28. Pang PS, Teerlink JR, Voors AA, Ponikowski P, Greenberg BH, Filippatos G, Felker GM, Davison BA, Cotter G, Kriger J, Prescott MF, Hua TA, Severin T, Metra M. Use of High-Sensitivity Troponin T to Identify Patients With Acute Heart Failure at Lower Risk for Adverse Outcomes: An Explor-atory Analysis From the RELAX-AHF Trial. JACC Heart Fail 2016;.
29. Kawanabe Y, Nauli SM. Endothelin. Cell Mol Life Sci 2011;68:195-203.
205
Plasma biomarkers to predict or rule out early post-discharge events in AHF patients
6
30. Perez AL, Grodin JL, Wu Y, Hernandez AF, Butler J, Metra M, Felker GM, Voors AA, McMurray JJ, Armstrong PW, Starling RC, O’Connor CM, Tang WH. Increased mortality with elevated plasma endothelin-1 in acute heart failure: an ASCEND-HF biomarker substudy. Eur J Heart Fail 2016;18:290-297.
31. Davison BA, Metra M, Senger S, Edwards C, Milo O, Bloomfield DM, Cleland JG, Dittrich HC, Givertz MM, O’Connor CM, Massie BM, Ponikowski P, Teerlink JR, Voors AA, Cotter G. Patient journey after admission for acute heart failure: length of stay, 30-day readmission and 90-day mortality. Eur J Heart Fail 2016;18:1041-1050.
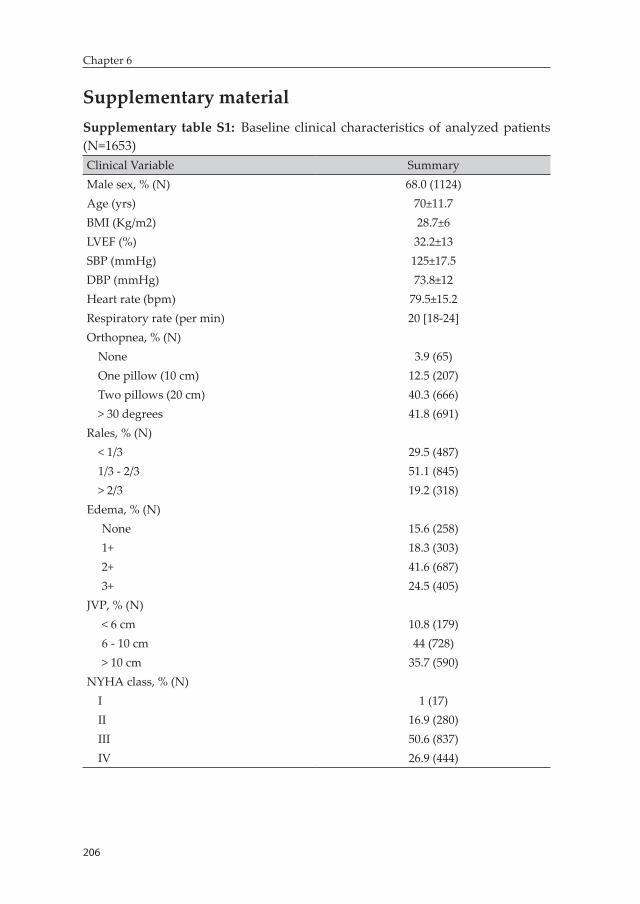
206
Chapter 6
Supplementary materialSupplementary table S1: Baseline clinical characteristics of analyzed patients (N=1653)Clinical Variable SummaryMale sex, % (N) 68.0 (1124)Age (yrs) 70±11.7BMI (Kg/m2) 28.7±6LVEF (%) 32.2±13SBP (mmHg) 125±17.5DBP (mmHg) 73.8±12Heart rate (bpm) 79.5±15.2Respiratory rate (per min) 20 [18-24]Orthopnea, % (N)
None 3.9 (65)One pillow (10 cm) 12.5 (207)Two pillows (20 cm) 40.3 (666)> 30 degrees 41.8 (691)
Rales, % (N)< 1/3 29.5 (487)1/3 - 2/3 51.1 (845)> 2/3 19.2 (318)
Edema, % (N)None 15.6 (258)1+ 18.3 (303)2+ 41.6 (687)3+ 24.5 (405)
JVP, % (N)< 6 cm 10.8 (179)6 - 10 cm 44 (728)> 10 cm 35.7 (590)
NYHA class, % (N)I 1 (17)II 16.9 (280)III 50.6 (837)IV 26.9 (444)
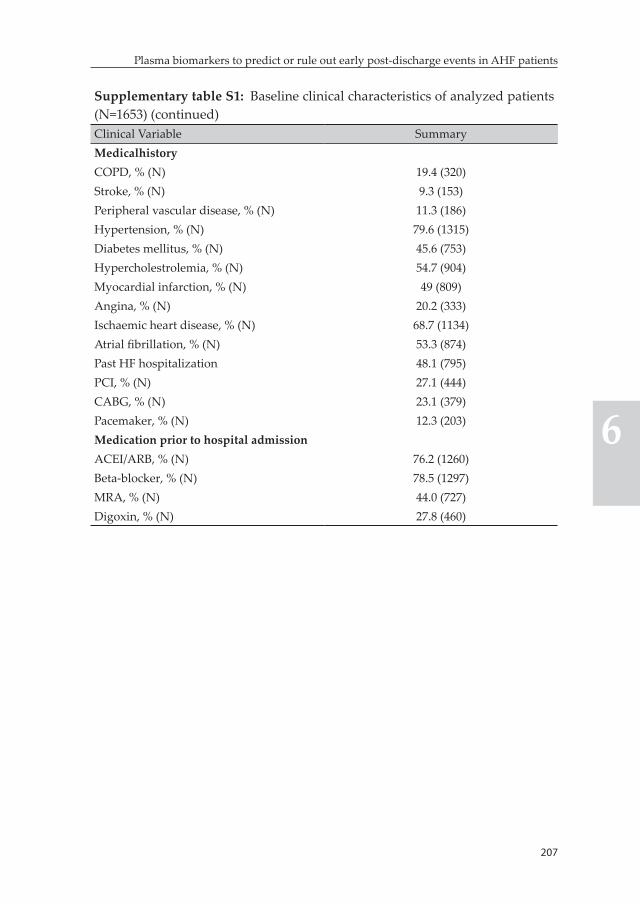
207
Plasma biomarkers to predict or rule out early post-discharge events in AHF patients
6
Supplementary table S1: Baseline clinical characteristics of analyzed patients (N=1653) (continued)Clinical Variable SummaryMedicalhistoryCOPD, % (N) 19.4 (320)Stroke, % (N) 9.3 (153)Peripheral vascular disease, % (N) 11.3 (186)Hypertension, % (N) 79.6 (1315)Diabetes mellitus, % (N) 45.6 (753)Hypercholestrolemia, % (N) 54.7 (904)Myocardial infarction, % (N) 49 (809)Angina, % (N) 20.2 (333)Ischaemic heart disease, % (N) 68.7 (1134)Atrial fibrillation, % (N) 53.3 (874)Past HF hospitalization 48.1 (795)PCI, % (N) 27.1 (444)CABG, % (N) 23.1 (379)Pacemaker, % (N) 12.3 (203)Medication prior to hospital admissionACEI/ARB, % (N) 76.2 (1260)Beta-blocker, % (N) 78.5 (1297)MRA, % (N) 44.0 (727)Digoxin, % (N) 27.8 (460)
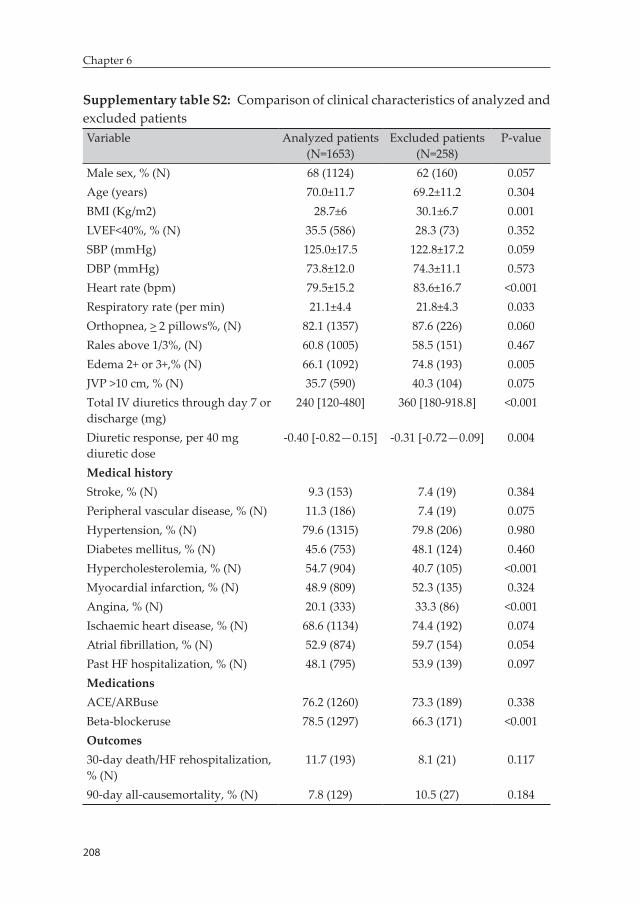
208
Chapter 6
Supplementary table S2: Comparison of clinical characteristics of analyzed and excluded patientsVariable Analyzed patients
(N=1653)Excluded patients
(N=258)P-value
Male sex, % (N) 68 (1124) 62 (160) 0.057Age (years) 70.0±11.7 69.2±11.2 0.304BMI (Kg/m2) 28.7±6 30.1±6.7 0.001LVEF<40%, % (N) 35.5 (586) 28.3 (73) 0.352SBP (mmHg) 125.0±17.5 122.8±17.2 0.059DBP (mmHg) 73.8±12.0 74.3±11.1 0.573Heart rate (bpm) 79.5±15.2 83.6±16.7 <0.001Respiratory rate (per min) 21.1±4.4 21.8±4.3 0.033Orthopnea, > 2 pillows%, (N) 82.1 (1357) 87.6 (226) 0.060Rales above 1/3%, (N) 60.8 (1005) 58.5 (151) 0.467Edema 2+ or 3+,% (N) 66.1 (1092) 74.8 (193) 0.005JVP >10 cm, % (N) 35.7 (590) 40.3 (104) 0.075Total IV diuretics through day 7 or discharge (mg)
240 [120-480] 360 [180-918.8] <0.001
Diuretic response, per 40 mg diuretic dose
-0.40 [-0.82—0.15] -0.31 [-0.72—0.09] 0.004
Medical historyStroke, % (N) 9.3 (153) 7.4 (19) 0.384Peripheral vascular disease, % (N) 11.3 (186) 7.4 (19) 0.075Hypertension, % (N) 79.6 (1315) 79.8 (206) 0.980Diabetes mellitus, % (N) 45.6 (753) 48.1 (124) 0.460Hypercholesterolemia, % (N) 54.7 (904) 40.7 (105) <0.001Myocardial infarction, % (N) 48.9 (809) 52.3 (135) 0.324Angina, % (N) 20.1 (333) 33.3 (86) <0.001Ischaemic heart disease, % (N) 68.6 (1134) 74.4 (192) 0.074Atrial fibrillation, % (N) 52.9 (874) 59.7 (154) 0.054Past HF hospitalization, % (N) 48.1 (795) 53.9 (139) 0.097MedicationsACE/ARBuse 76.2 (1260) 73.3 (189) 0.338Beta-blockeruse 78.5 (1297) 66.3 (171) <0.001Outcomes30-day death/HF rehospitalization, % (N)
11.7 (193) 8.1 (21) 0.117
90-day all-causemortality, % (N) 7.8 (129) 10.5 (27) 0.184
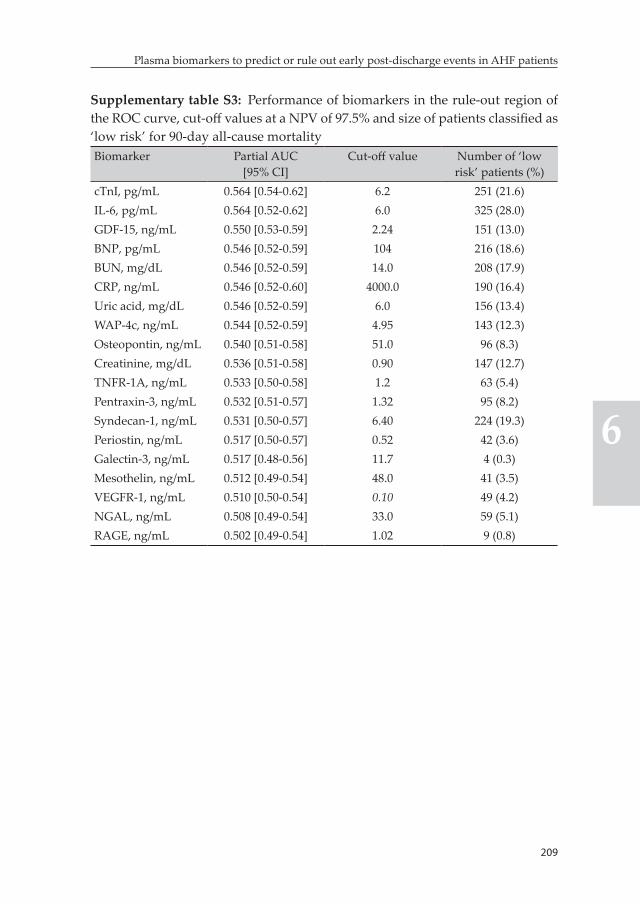
209
Plasma biomarkers to predict or rule out early post-discharge events in AHF patients
6
Supplementary table S3: Performance of biomarkers in the rule-out region of the ROC curve, cut-off values at a NPV of 97.5% and size of patients classified as ‘low risk’ for 90-day all-cause mortalityBiomarker Partial AUC
[95% CI]Cut-off value Number of ‘low
risk’ patients (%)cTnI, pg/mL 0.564 [0.54-0.62] 6.2 251 (21.6)IL-6, pg/mL 0.564 [0.52-0.62] 6.0 325 (28.0)GDF-15, ng/mL 0.550 [0.53-0.59] 2.24 151 (13.0)BNP, pg/mL 0.546 [0.52-0.59] 104 216 (18.6)BUN, mg/dL 0.546 [0.52-0.59] 14.0 208 (17.9)CRP, ng/mL 0.546 [0.52-0.60] 4000.0 190 (16.4)Uric acid, mg/dL 0.546 [0.52-0.59] 6.0 156 (13.4)WAP-4c, ng/mL 0.544 [0.52-0.59] 4.95 143 (12.3)Osteopontin, ng/mL 0.540 [0.51-0.58] 51.0 96 (8.3)Creatinine, mg/dL 0.536 [0.51-0.58] 0.90 147 (12.7)TNFR-1A, ng/mL 0.533 [0.50-0.58] 1.2 63 (5.4)Pentraxin-3, ng/mL 0.532 [0.51-0.57] 1.32 95 (8.2)Syndecan-1, ng/mL 0.531 [0.50-0.57] 6.40 224 (19.3)Periostin, ng/mL 0.517 [0.50-0.57] 0.52 42 (3.6)Galectin-3, ng/mL 0.517 [0.48-0.56] 11.7 4 (0.3)Mesothelin, ng/mL 0.512 [0.49-0.54] 48.0 41 (3.5)VEGFR-1, ng/mL 0.510 [0.50-0.54] 0.10 49 (4.2)NGAL, ng/mL 0.508 [0.49-0.54] 33.0 59 (5.1)RAGE, ng/mL 0.502 [0.49-0.54] 1.02 9 (0.8)
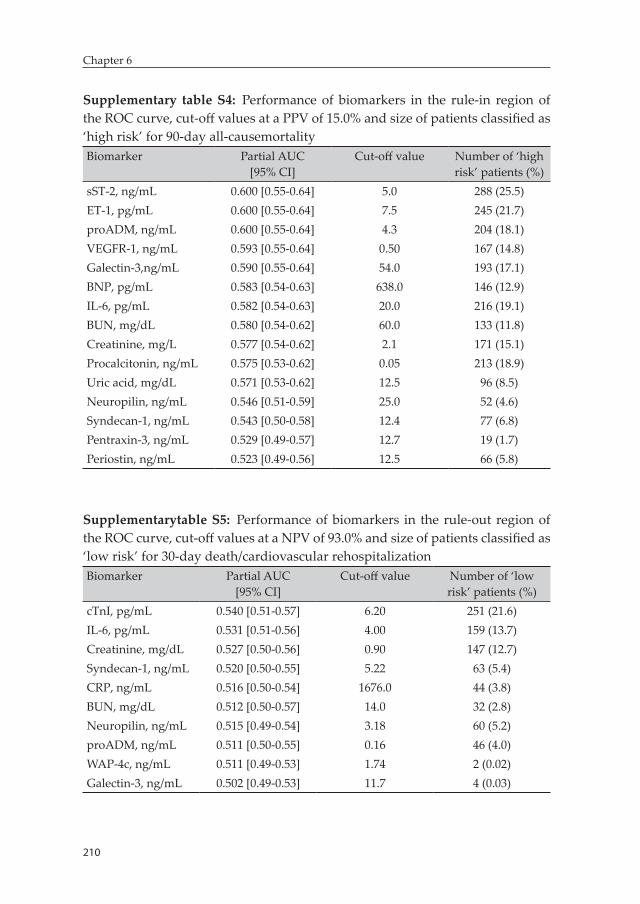
210
Chapter 6
Supplementary table S4: Performance of biomarkers in the rule-in region of the ROC curve, cut-off values at a PPV of 15.0% and size of patients classified as ‘high risk’ for 90-day all-causemortalityBiomarker Partial AUC
[95% CI]Cut-off value Number of ‘high
risk’ patients (%)sST-2, ng/mL 0.600 [0.55-0.64] 5.0 288 (25.5)ET-1, pg/mL 0.600 [0.55-0.64] 7.5 245 (21.7)proADM, ng/mL 0.600 [0.55-0.64] 4.3 204 (18.1)VEGFR-1, ng/mL 0.593 [0.55-0.64] 0.50 167 (14.8)Galectin-3,ng/mL 0.590 [0.55-0.64] 54.0 193 (17.1)BNP, pg/mL 0.583 [0.54-0.63] 638.0 146 (12.9)IL-6, pg/mL 0.582 [0.54-0.63] 20.0 216 (19.1)BUN, mg/dL 0.580 [0.54-0.62] 60.0 133 (11.8)Creatinine, mg/L 0.577 [0.54-0.62] 2.1 171 (15.1)Procalcitonin, ng/mL 0.575 [0.53-0.62] 0.05 213 (18.9)Uric acid, mg/dL 0.571 [0.53-0.62] 12.5 96 (8.5)Neuropilin, ng/mL 0.546 [0.51-0.59] 25.0 52 (4.6)Syndecan-1, ng/mL 0.543 [0.50-0.58] 12.4 77 (6.8)Pentraxin-3, ng/mL 0.529 [0.49-0.57] 12.7 19 (1.7)Periostin, ng/mL 0.523 [0.49-0.56] 12.5 66 (5.8)
Supplementarytable S5: Performance of biomarkers in the rule-out region of the ROC curve, cut-off values at a NPV of 93.0% and size of patients classified as ‘low risk’ for 30-day death/cardiovascular rehospitalizationBiomarker Partial AUC
[95% CI]Cut-off value Number of ‘low
risk’ patients (%)cTnI, pg/mL 0.540 [0.51-0.57] 6.20 251 (21.6)IL-6, pg/mL 0.531 [0.51-0.56] 4.00 159 (13.7)Creatinine, mg/dL 0.527 [0.50-0.56] 0.90 147 (12.7)Syndecan-1, ng/mL 0.520 [0.50-0.55] 5.22 63 (5.4)CRP, ng/mL 0.516 [0.50-0.54] 1676.0 44 (3.8)BUN, mg/dL 0.512 [0.50-0.57] 14.0 32 (2.8)Neuropilin, ng/mL 0.515 [0.49-0.54] 3.18 60 (5.2)proADM, ng/mL 0.511 [0.50-0.55] 0.16 46 (4.0)WAP-4c, ng/mL 0.511 [0.49-0.53] 1.74 2 (0.02)Galectin-3, ng/mL 0.502 [0.49-0.53] 11.7 4 (0.03)
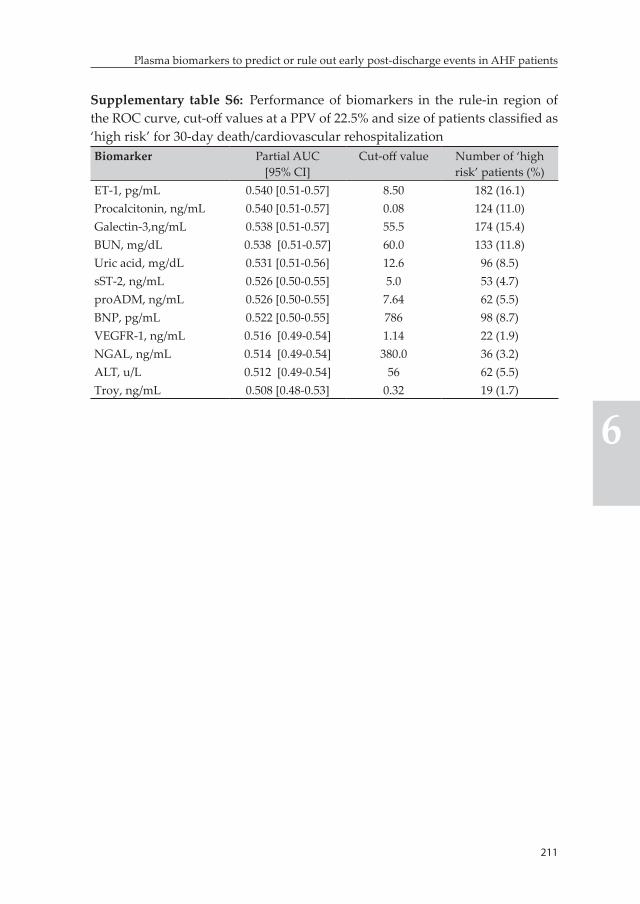
211
Plasma biomarkers to predict or rule out early post-discharge events in AHF patients
6
Supplementary table S6: Performance of biomarkers in the rule-in region of the ROC curve, cut-off values at a PPV of 22.5% and size of patients classified as ‘high risk’ for 30-day death/cardiovascular rehospitalizationBiomarker Partial AUC
[95% CI]Cut-off value Number of ‘high
risk’ patients (%)ET-1, pg/mL 0.540 [0.51-0.57] 8.50 182 (16.1)Procalcitonin, ng/mL 0.540 [0.51-0.57] 0.08 124 (11.0)Galectin-3,ng/mL 0.538 [0.51-0.57] 55.5 174 (15.4)BUN, mg/dL 0.538 [0.51-0.57] 60.0 133 (11.8)Uric acid, mg/dL 0.531 [0.51-0.56] 12.6 96 (8.5)sST-2, ng/mL 0.526 [0.50-0.55] 5.0 53 (4.7)proADM, ng/mL 0.526 [0.50-0.55] 7.64 62 (5.5)BNP, pg/mL 0.522 [0.50-0.55] 786 98 (8.7)VEGFR-1, ng/mL 0.516 [0.49-0.54] 1.14 22 (1.9)NGAL, ng/mL 0.514 [0.49-0.54] 380.0 36 (3.2)ALT, u/L 0.512 [0.49-0.54] 56 62 (5.5)Troy, ng/mL 0.508 [0.48-0.53] 0.32 19 (1.7)
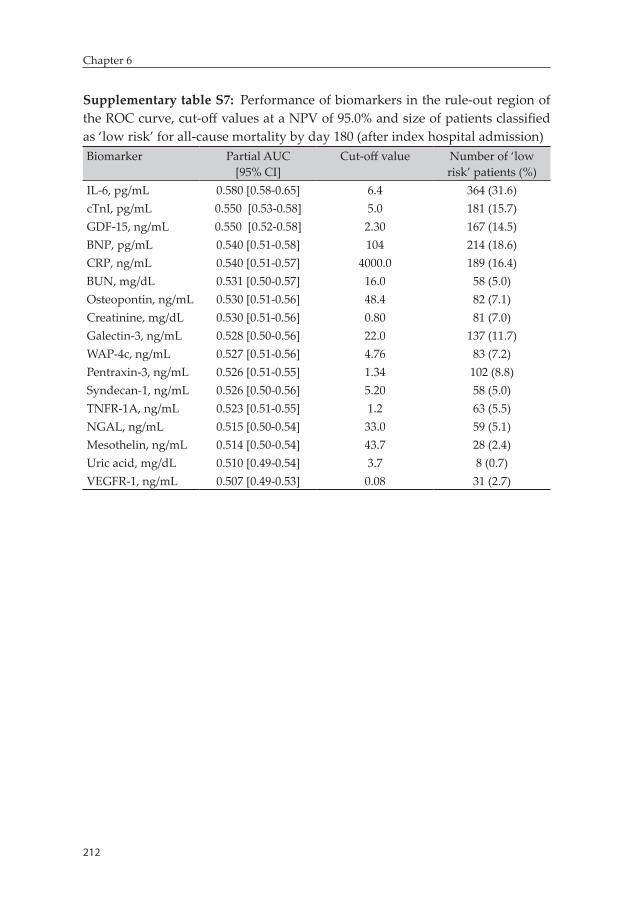
212
Chapter 6
Supplementary table S7: Performance of biomarkers in the rule-out region of the ROC curve, cut-off values at a NPV of 95.0% and size of patients classified as ‘low risk’ for all-cause mortality by day 180 (after index hospital admission)Biomarker Partial AUC
[95% CI]Cut-off value Number of ‘low
risk’ patients (%)IL-6, pg/mL 0.580 [0.58-0.65] 6.4 364 (31.6)cTnI, pg/mL 0.550 [0.53-0.58] 5.0 181 (15.7)GDF-15, ng/mL 0.550 [0.52-0.58] 2.30 167 (14.5)BNP, pg/mL 0.540 [0.51-0.58] 104 214 (18.6)CRP, ng/mL 0.540 [0.51-0.57] 4000.0 189 (16.4)BUN, mg/dL 0.531 [0.50-0.57] 16.0 58 (5.0)Osteopontin, ng/mL 0.530 [0.51-0.56] 48.4 82 (7.1)Creatinine, mg/dL 0.530 [0.51-0.56] 0.80 81 (7.0)Galectin-3, ng/mL 0.528 [0.50-0.56] 22.0 137 (11.7)WAP-4c, ng/mL 0.527 [0.51-0.56] 4.76 83 (7.2)Pentraxin-3, ng/mL 0.526 [0.51-0.55] 1.34 102 (8.8)Syndecan-1, ng/mL 0.526 [0.50-0.56] 5.20 58 (5.0)TNFR-1A, ng/mL 0.523 [0.51-0.55] 1.2 63 (5.5)NGAL, ng/mL 0.515 [0.50-0.54] 33.0 59 (5.1)Mesothelin, ng/mL 0.514 [0.50-0.54] 43.7 28 (2.4)Uric acid, mg/dL 0.510 [0.49-0.54] 3.7 8 (0.7)VEGFR-1, ng/mL 0.507 [0.49-0.53] 0.08 31 (2.7)
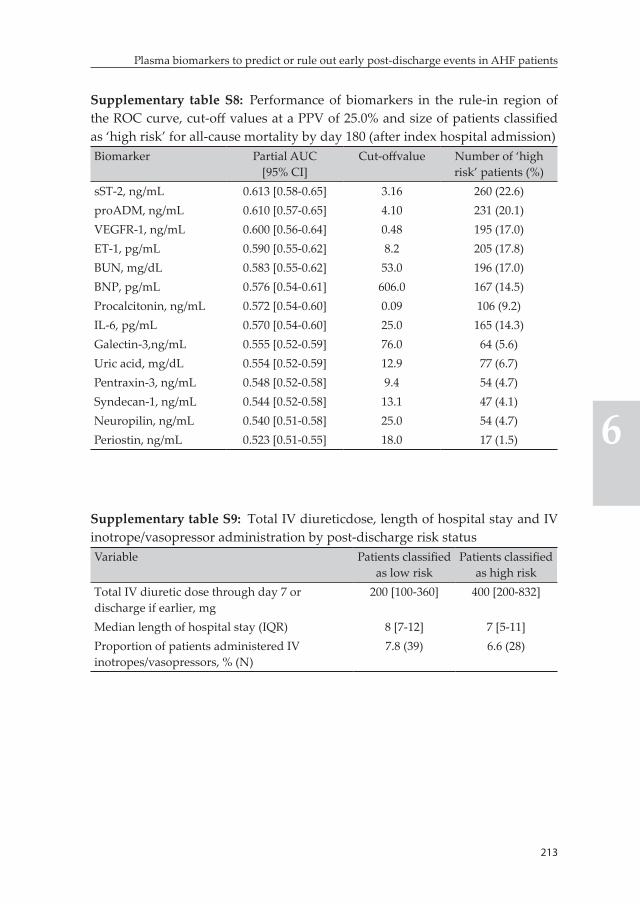
213
Plasma biomarkers to predict or rule out early post-discharge events in AHF patients
6
Supplementary table S8: Performance of biomarkers in the rule-in region of the ROC curve, cut-off values at a PPV of 25.0% and size of patients classified as ‘high risk’ for all-cause mortality by day 180 (after index hospital admission)Biomarker Partial AUC
[95% CI]Cut-offvalue Number of ‘high
risk’ patients (%)sST-2, ng/mL 0.613 [0.58-0.65] 3.16 260 (22.6)proADM, ng/mL 0.610 [0.57-0.65] 4.10 231 (20.1)VEGFR-1, ng/mL 0.600 [0.56-0.64] 0.48 195 (17.0)ET-1, pg/mL 0.590 [0.55-0.62] 8.2 205 (17.8)BUN, mg/dL 0.583 [0.55-0.62] 53.0 196 (17.0)BNP, pg/mL 0.576 [0.54-0.61] 606.0 167 (14.5)Procalcitonin, ng/mL 0.572 [0.54-0.60] 0.09 106 (9.2)IL-6, pg/mL 0.570 [0.54-0.60] 25.0 165 (14.3)Galectin-3,ng/mL 0.555 [0.52-0.59] 76.0 64 (5.6)Uric acid, mg/dL 0.554 [0.52-0.59] 12.9 77 (6.7)Pentraxin-3, ng/mL 0.548 [0.52-0.58] 9.4 54 (4.7)Syndecan-1, ng/mL 0.544 [0.52-0.58] 13.1 47 (4.1)Neuropilin, ng/mL 0.540 [0.51-0.58] 25.0 54 (4.7)Periostin, ng/mL 0.523 [0.51-0.55] 18.0 17 (1.5)
Supplementary table S9: Total IV diureticdose, length of hospital stay and IV inotrope/vasopressor administration by post-discharge risk statusVariable Patients classified
as low riskPatients classified
as high riskTotal IV diuretic dose through day 7 or discharge if earlier, mg
200 [100-360] 400 [200-832]
Median length of hospital stay (IQR) 8 [7-12] 7 [5-11]Proportion of patients administered IV inotropes/vasopressors, % (N)
7.8 (39) 6.6 (28)

PART IIIRisk-based evaluation of phase III
clinical trials in AHF

Chapter 7: Risk-based evaluation of efficacy of rolofylline in patients hospitalized with AHF – post-hoc analysis of the PROTECT trial
Biniyam G. Demissei, Douwe Postmus, Licette C.Y. Liu, John G. Cleland, Christopher M. O’Connor, Marco Metra, Piotr Ponikowski, John R. Teerlink, Gad Cotter, Beth A. Davison, Christopher Edwards, Michael M. Givertz, Daniel M. Bloomfield, Howard Dittrich, Adriaan A. Voors, Hans L. Hillege
International journal of cardiology 2016;223:967-975
218
Chapter 7
Abstract
Background: The selective adenosine A1 receptor antagonist rolofylline showed neutral overall result on clinical outcomes in the PROTECT trial. However, we hypothesize that response to rolofylline treatment could be influenced by underlying clinical risk.
Methods: We performed a post-hoc analysis of the PROTECT trial – large, double-blind, randomized, placebo-controlled trial that enrolled 2033 patients. Baseline risk of 180-day all-cause mortality was estimated using previously published 8-item model. Evaluation of efficacy of rolofylline across subpopulations defined based on estimated risk of mortality was performed using subpopulation treatment effect pattern plot (STEPP) analysis. Findings were validated in an independent cohort of acute heart failure (AHF) patients.
Results: Median estimated risk of mortality was 13.0%, IQR [8.0%-23.0%] and was comparable between the rolofylline and placebo arms. In low to intermediate risk subgroup of patients, rolofylline was associated with higher rate of 180-day all-cause mortality (11.8% in the rolofylline versus 8.4% in the placebo arms, p=0.050). In the high risk subgroup of patients, particularly those with estimated risk of mortality between 20% to 30%, 180-day all- cause mortality rate was markedly lower in the rolofylline arm (18.4% in the rolofylline versus 34.0% in the placebo arms, p=0.003). The trend towards potential harm with rolofylline treatment in the low to intermediate risk subpopulations and significant benefit in high risk patients was also observed in the validation cohort.
Conclusion: Our findings suggest that selective adenosine A1 receptor antagonism could be harmful in low risk AHF patients, while it might significantly benefit higher risk patients.
Keywords: acute heart failure, rolofylline, multivariable risk, heterogeneity of treatment effect, subgroup analysis, STEPP
219
Risk-based evaluation of efficacy of rolofylline in patients hospitalized with AHF
7
Introduction
Acute heart failure (AHF) remains a significant public health problem with outcome poorer than many forms of cancer and an enormous burden to health care systems (1). There is a huge unmet medical need for new therapeutic agents that can improve survival and curb the high risk of hospital readmissions associated with hospitalization for AHF. However, development of such agents remains largely elusive despite the massive effort to do so. Several drugs showed promising results in phase II or early phase III trials yet failed to show improvement in clini-cal outcome in larger phase III trials with the only notable exception of serelaxin (2-5).
One such group of drugs is the class of the selective adenosine A1 re-ceptor antagonists. Adenosine plays an important role in the regulation of renal hemodynamics and function, primarily through its A1 receptor activation (6, 7). In states of salt overload in the distal tubule (e.g. during high dose furosemide administration), adenosine secretion increases in the renal tubular system stimulating proximal tubular sodium reup-take. In addition, adenosine acts as a mediator of the tubuloglomerular feedback causing glomerular afferent arteriolar vasoconstriction. In the setting of treatment of AHF, these actions may lead to deterioration of renal function and poor response to diuretic therapy, both of which are associated with poor prognosis (6, 8). It was hypothesized that inhibition of these potentially dysregulatory effects of adenosine could preserve or even improve renal function and enhance the diuretic and natriuretic effects of loop diuretics during the treatment of AHF. Subsequently, several selective adenosine A1 antagonists (e.g. KW-3902, BG9928 and SLV320) were tested in proof-of-concept and small phase II clinical tri-als and showed promising results (9-11). However, the PROTECT trial, which is the largest phase III trial that evaluated the efficacy of selective A1 adenosine receptor antagonism with KW-3902 (rolofylline), showed neutral overall results on renal function and clinical outcomes in hospi-talized AHF patients (2, 12).
220
Chapter 7
The presence of significant heterogeneity in the AHF patient population in terms of baseline disease severity, renal function, diuretic respon-siveness and comorbidities prompts the consideration of the possibility that there might be a clinically relevant heterogeneity in the efficacy of rolofylline across subpopulations. Voors et al, in a post-hoc analysis of the PROTECT trial, reported that rolofyillne was associated with a re-duction in 60-day death or cardiovascular or renal rehospitalization in subpopulation of patients with estimated creatinine clearance below 30 ml/min (12). Nevertheless, a single variable is very unlikely to capture the whole spectrum of relevant differences in response to rolofylline treatment among subpopulations as a complex interplay between a multitude of clinical and pathophysiologic processes determines renal function, diuretic responsiveness and disease severity in AHF patients (13-16). A multivariable risk-based approach is an alternative strategy that facilitates identification of clinically relevant differences in treat-ment response among subpopulations that can only be identified when a combination of variables is utilized (14, 15). Therefore, in this study we evaluated heterogeneity in the efficacy of rolofylline across subpopula-tions defined based on underlying risk of 180-day all-cause mortality estimated using a previously published model with a set of eight read-ily available patient-related clinical and laboratory parameters (17).
Methods
Patient populationThe Placebo-controlled Randomized Study of Selective A1 Adenosine Receptor Antagonist Rolofylline for Patients Hospitalized with Acute Decompensated Heart Failure and Volume Overload to Assess Treat-ment Effect on Congestion and Renal Function (PROTECT) trial –– a multicenter, randomized, double-blind, placebo-controlled phase III trial –– enrolled 2033 adult patients with a history of heart failure hos-pitalized for AHF. Patients with BNP ≥500 pg/mL or NT-proBNP ≥2000 pg/mL and admission creatinine clearance between 20 and 80 mL/min were included in the trial. Details of the design and main results of the study have been published previously (2, 8). All patients provided writ-
221
Risk-based evaluation of efficacy of rolofylline in patients hospitalized with AHF
7
ten informed consent. The study was conducted in compliance with the Declaration of Helsinki and was approved by all relevant local ethics committees.
Study procedures and measurementsEligible patients were enrolled into the trial within 24 hours of hospital admission. After randomization, 30 mg of rolofylline or matching pla-cebo was administered as a 4-hour intravenous infusion daily for up to 3 days or discharge if earlier. A comprehensive clinical evaluation of patient characteristics was performed during baseline assessment. Standard laboratory parameters were measured in a central laboratory (ICON Laboratories, Farmingdale, New York).
Study outcomesThe primary outcome evaluated in the current analysis was time-to-all-cause mortality within 180 days of index hospitalization. Time-to-heart failure rehospitalization within 60 days of the index hospitalization was evaluated as a secondary outcome.
Statistical analysisContinuous variables are presented as mean ± standard deviation or median (interquartile range) for normally and non-normally distributed variables, respectively, while categorical variables were summarized with percentages. Individual risk of mortality within 180 days of hospitaliza-tion was estimated based on a previously published 8-item prognostic model developed using routinely available baseline clinical and labora-tory parameters (17). These included age, systolic blood pressure, edema, previous history of heart failure hospitalization, serum albumin, blood urea nitrogen, creatinine and sodium. Model performance was evaluated with the Harrell’s C-index. Patients with available baseline measure-ments of these eight variables were included in the analysis (N=1951).
As an initial step, the efficacy of rolofylline on 180-day all-cause mortal-ity was evaluated across several subgroups defined based on clinical and standard laboratory parameters. These parameters are listed in the supplementary material. Median values were utilized as cut-off points
222
Chapter 7
to define subgroups for continuous variables, with the exceptions of eGFR and LVEF. Three subgroups were defined based on eGFR; <30 mL/min, 30-60 mL/min and ≥60 mL/min while a cut-off value of 40% was utilized for LVEF. Forest plots were used to present hazard ratios for treatment effect estimated using Cox proportional hazards models in each subgroup and statistical significance of heterogeneity in treatment effect between subgroups was assessed by an interaction p-value from a Cox proportional hazards model that included treatment, variable used to define subgroups, and treatment*variable as predictors.
Risk-based evaluation of heterogeneity in the efficacy of rolofylline along the continuum of estimated risk of 180-day all-cause mortal-ity was performed using subpopulation treatment effect pattern plot (STEPP) analysis. STEPP is a graphical method that estimates and displays treatment effect along a continuous scale using overlapping patient subgroups (18- 22). We utilized the sliding window approach to define overlapping subpopulations. In this approach, patients are first ordered from lowest to highest value based on the variable of interest, estimated risk of 180-day all-cause mortality in our case. Two parameters are then used to define subpopulations; r1 represents the largest number of patients in common among consecutive subpopula-tions and r2 indicates the number of patients in each subpopulation. We utilized r1=260 and r2=320 in the current study. The first subpopulation is defined as a group of 320 patients with the lowest values of estimated absolute risk. The next subpopulation is then produced by removing r2 - r1 (n=60) patients from the first subpopulation and replacing them with the next 60 patients in the ordered list. This process ends when all patients are included in at least one of the subpopulations. We then evaluated treatment efficacy in each subpopulation by estimating haz-ard ratios. These subpopulation estimates of hazard ratios were then plotted against median estimated risk in each subpopulation. The om-nibus test was performed to test for the equality of hazard ratios across subpopulations. Details on the STEPP methodology are provided else-where (18, 19). Absolute differences in 180-day survival rates between the placebo and rolofylline treatment groups were then estimated (using the Kaplan-Meier survival estimator) in different subgroups of patients
223
Risk-based evaluation of efficacy of rolofylline in patients hospitalized with AHF
7
defined using risk thresholds identified based on observed patterns of response to rolofylline therapy in the STEPP plot. Differences in 60-day heart failure rehospitalization rates between the placebo and rolofylline arms were also compared in the identified subgroups using Kaplan-Meier survival plots. The log-rank test was used for the comparison of survival curves between the two treatment arms in each risk subgroup.
We utilized data from the PROTECT pilot trial to validate our findings. The PROTECT pilot trial was a randomized, double-blind, dose-ranging phase III trial that compared three doses of rolofylline (i.e. 10mg, 20mg and 30mg) and placebo in 301 patients hospitalized for AHF. Patients with screening BNP >250 pg/mL or NT-proBNP >1000 pg/mL and impaired renal function, defined as an admission estimated creatinine clearance of 20 to 80 mL/min (based on Cockcroft-Gault equation), were included. Details of the design and main results of the trial have been published previously (9). Individual risks of 180-day all-cause mortality in the pilot trial were estimated after refitting a Coxproportional hazards model encompassing seven variables from the 8-item model used in the main analysis. Previous history of heart failure hospitalization was not included in the model as data was unavailable. Patients with available baseline measurements of the seven variables were included in this analysis (N=292). Next, 180-day all-cause mortality and 60-day heart failure rehospitalization rates were compared between the placebo and rolofylline arms in subgroups defined based on risk thresholds identified from the main analysis. Given the primary outcome evaluated in the cur-rent analysis was comparable between the different rolofylline treatment arms in the overall PROTECT pilot trial population (supplementary fig-ure S1), the 20mg and 30mg treatment arms were combined to enhance statistical power of our validation analysis.
Estimates are presented with 95% confidence intervals. P-values <0.05 were considered statistically significant. Statistical analyses were per-formed with R: A Language andEnvironment for Statistical Computing, version 3.0.2 (R Foundation for Statistical Computing, Vienna, Austria). R package ‘stepp’ was utilized for the STEPP analysis.
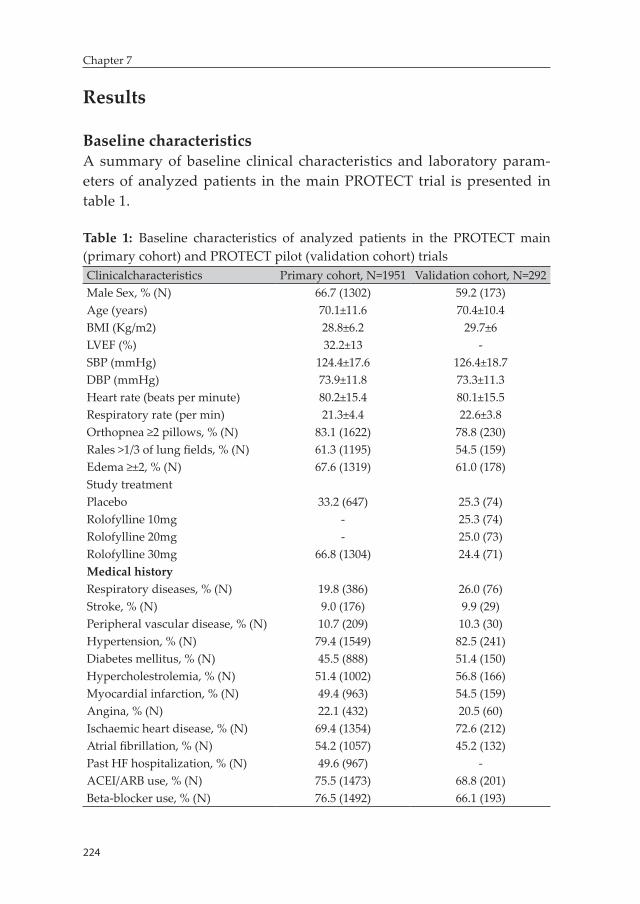
224
Chapter 7
Results
Baseline characteristicsA summary of baseline clinical characteristics and laboratory param-eters of analyzed patients in the main PROTECT trial is presented in table 1.
Table 1: Baseline characteristics of analyzed patients in the PROTECT main (primary cohort) and PROTECT pilot (validation cohort) trialsClinicalcharacteristics Primary cohort, N=1951 Validation cohort, N=292Male Sex, % (N) 66.7 (1302) 59.2 (173)Age (years) 70.1±11.6 70.4±10.4BMI (Kg/m2) 28.8±6.2 29.7±6LVEF (%) 32.2±13 -SBP (mmHg) 124.4±17.6 126.4±18.7DBP (mmHg) 73.9±11.8 73.3±11.3Heart rate (beats per minute) 80.2±15.4 80.1±15.5Respiratory rate (per min) 21.3±4.4 22.6±3.8Orthopnea ≥2 pillows, % (N) 83.1 (1622) 78.8 (230)Rales >1/3 of lung fields, % (N) 61.3 (1195) 54.5 (159)Edema ≥±2, % (N) 67.6 (1319) 61.0 (178)Study treatmentPlacebo 33.2 (647) 25.3 (74)Rolofylline 10mg - 25.3 (74)Rolofylline 20mg - 25.0 (73)Rolofylline 30mg 66.8 (1304) 24.4 (71)Medical historyRespiratory diseases, % (N) 19.8 (386) 26.0 (76)Stroke, % (N) 9.0 (176) 9.9 (29)Peripheral vascular disease, % (N) 10.7 (209) 10.3 (30)Hypertension, % (N) 79.4 (1549) 82.5 (241)Diabetes mellitus, % (N) 45.5 (888) 51.4 (150)Hypercholestrolemia, % (N) 51.4 (1002) 56.8 (166)Myocardial infarction, % (N) 49.4 (963) 54.5 (159)Angina, % (N) 22.1 (432) 20.5 (60)Ischaemic heart disease, % (N) 69.4 (1354) 72.6 (212)Atrial fibrillation, % (N) 54.2 (1057) 45.2 (132)Past HF hospitalization, % (N) 49.6 (967) -ACEI/ARB use, % (N) 75.5 (1473) 68.8 (201)Beta-blocker use, % (N) 76.5 (1492) 66.1 (193)
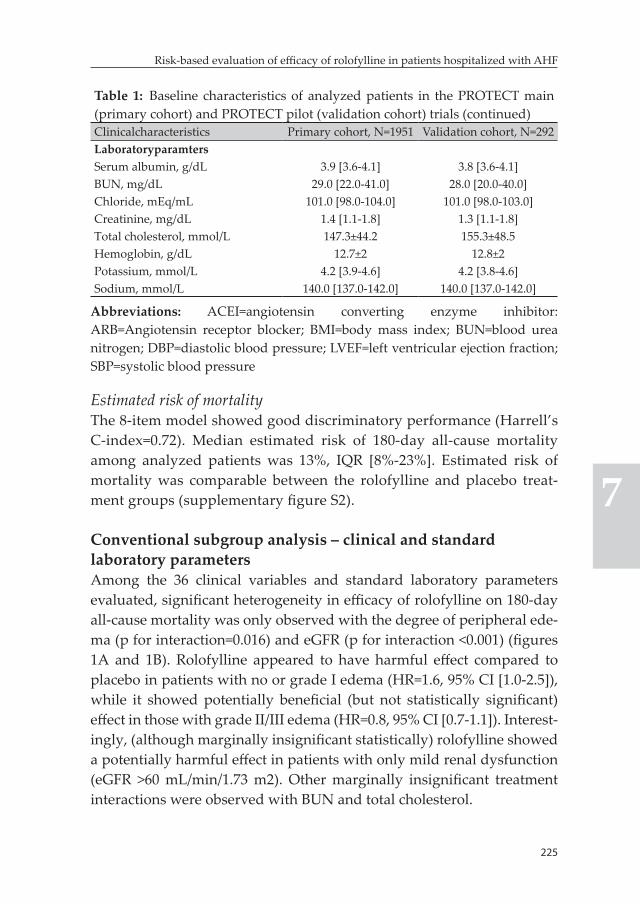
225
Risk-based evaluation of efficacy of rolofylline in patients hospitalized with AHF
7
Table 1: Baseline characteristics of analyzed patients in the PROTECT main (primary cohort) and PROTECT pilot (validation cohort) trials (continued)Clinicalcharacteristics Primary cohort, N=1951 Validation cohort, N=292LaboratoryparamtersSerum albumin, g/dL 3.9 [3.6-4.1] 3.8 [3.6-4.1]BUN, mg/dL 29.0 [22.0-41.0] 28.0 [20.0-40.0]Chloride, mEq/mL 101.0 [98.0-104.0] 101.0 [98.0-103.0]Creatinine, mg/dL 1.4 [1.1-1.8] 1.3 [1.1-1.8]Total cholesterol, mmol/L 147.3±44.2 155.3±48.5Hemoglobin, g/dL 12.7±2 12.8±2Potassium, mmol/L 4.2 [3.9-4.6] 4.2 [3.8-4.6]Sodium, mmol/L 140.0 [137.0-142.0] 140.0 [137.0-142.0]
Abbreviations: ACEI=angiotensin converting enzyme inhibitor: ARB=Angiotensin receptor blocker; BMI=body mass index; BUN=blood urea nitrogen; DBP=diastolic blood pressure; LVEF=left ventricular ejection fraction; SBP=systolic blood pressure
Estimated risk of mortalityThe 8-item model showed good discriminatory performance (Harrell’s C-index=0.72). Median estimated risk of 180-day all-cause mortality among analyzed patients was 13%, IQR [8%-23%]. Estimated risk of mortality was comparable between the rolofylline and placebo treat-ment groups (supplementary figure S2).
Conventional subgroup analysis – clinical and standard laboratory parametersAmong the 36 clinical variables and standard laboratory parameters evaluated, significant heterogeneity in efficacy of rolofylline on 180-day all-cause mortality was only observed with the degree of peripheral ede-ma (p for interaction=0.016) and eGFR (p for interaction <0.001) (figures 1A and 1B). Rolofylline appeared to have harmful effect compared to placebo in patients with no or grade I edema (HR=1.6, 95% CI [1.0-2.5]), while it showed potentially beneficial (but not statistically significant) effect in those with grade II/III edema (HR=0.8, 95% CI [0.7-1.1]). Interest-ingly, (although marginally insignificant statistically) rolofylline showed a potentially harmful effect in patients with only mild renal dysfunction (eGFR >60 mL/min/1.73 m2). Other marginally insignificant treatment interactions were observed with BUN and total cholesterol.
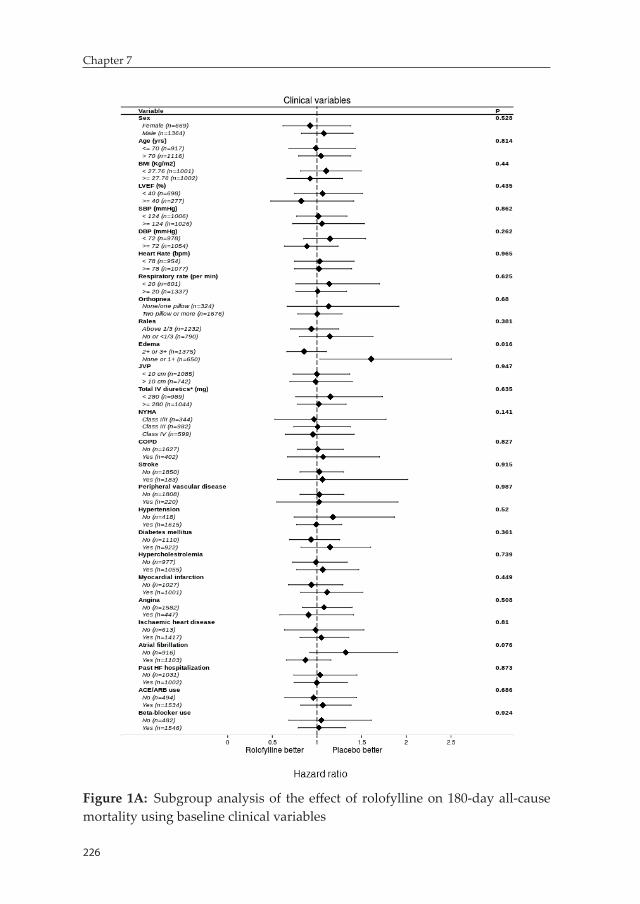
226
Chapter 7
Figure 1A: Subgroup analysis of the eff ect of rolofylline on 180-day all-cause mortality using baseline clinical variables
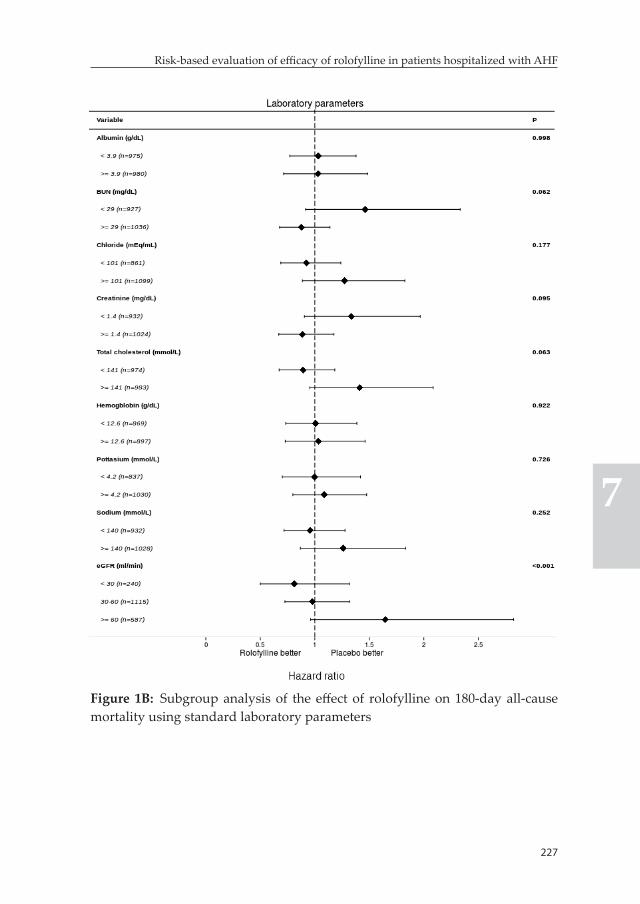
227
Risk-based evaluation of effi cacy of rolofylline in patients hospitalized with AHF
7
Figure 1B: Subgroup analysis of the eff ect of rolofylline on 180-day all-cause mortality using standard laboratory parameters
228
Chapter 7
Risk-based evaluation of heterogeneity in the efficacy of rolofylline
Subpopulation treatment effect pattern plot (STEPP) analysisThe STEPP plot, depicted in figure 2, clearly demonstrates the pres-ence of significant heterogeneity in the efficacy of rolofylline along the continuum of estimated risk of 180-day all-cause mortality (p for the Omnibus-test <0.001). Rolofylline showed a harmful effect compared to placebo in subpopulations of patients with estimated risk lying in the lower ranges of the risk continuum. The STEPP analysis further reveals an interesting finding suggesting that rolofylline can have a beneficial effect in subpopulations of patients in the higher risk ranges, particularly those with estimated risks ranging between 20% to 30%. Rolofylline showed a neutral effect in patients with estimated risk of mortality exceeding 30%. Three subgroups were defined using risk thresholds identified based on patterns of response to rolofylline therapy observed in the STEPP plot; subgroup 1 included patients with estimated risk <20% (n=1350), while those with estimated risk between 20 to 30% (n=307) and ≥30% (n=294) were categorized into subgroups 2 and 3, respectively. Kaplan-Meier plots depicting survival rates in the rolofylline treatment arm compared to placebo in each of these subgroups are presented in figure 3. In the subgroup of patients with estimated risk <20%, absolute difference in 180-day mortality rate was 3.5% in favor of placebo (11.9% in the rolo-fylline group versus 8.4% in the placebo group, p=0.05). In the second subgroup of patients, however, rolofylline treatment was associated with a markedly lower 180-day all-cause mortality rate as evidenced by an absolute difference of 15.4% in its favor (18.6 % in the rolofylline group versus 34.0% in the placebo group, p=0.003). There was no sig-nificant difference in 180-day all-cause mortality rate between rolofylline and placebo treatment groups in patients with estimated risk ≥30%. A comparable trend of response to rolofylline treatment was also seen for 60-day heart failure rehospitalization (figure 3). Baseline differences in clinical characteristics and laboratory values, in addition to differences in total IV diuretic dose and diuretic response among these subgroups are presented in supplementary table S1. It must be noted that there is a significant trend towards decreasing renal function, decreasing blood
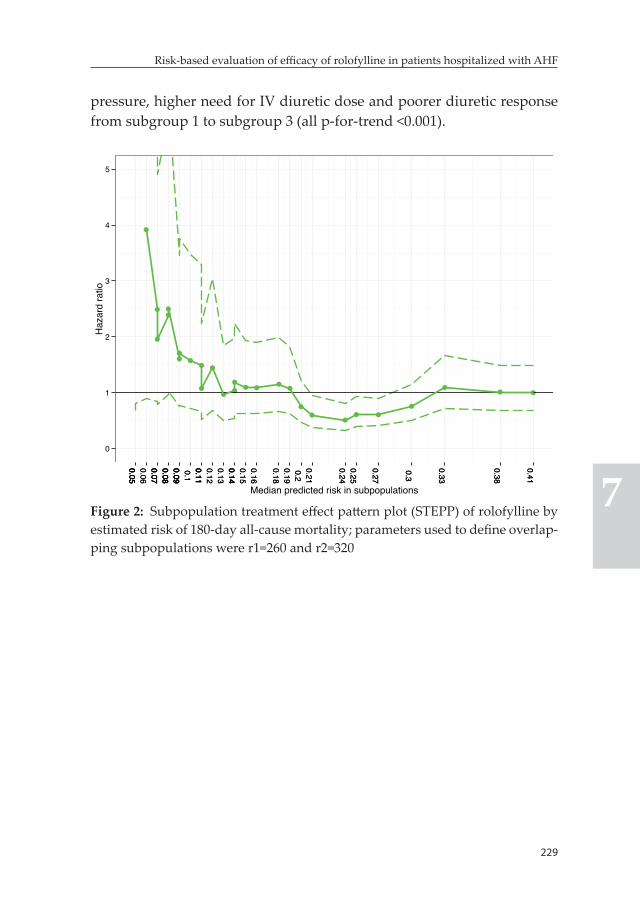
229
Risk-based evaluation of efficacy of rolofylline in patients hospitalized with AHF
7
pressure, higher need for IV diuretic dose and poorer diuretic response from subgroup 1 to subgroup 3 (all p-for-trend <0.001).
0
1
2
3
4
5
0.050.050.060.070.070.080.080.090.090.10.110.110.120.130.140.140.150.16
0.180.190.20.21
0.240.25
0.27
0.3
0.33
0.38
0.41
0.050.050.060.070.070.080.080.090.090.10.110.110.120.130.140.140.150.16
0.180.190.20.21
0.240.25
0.27
0.3
0.33
0.38
0.41
Median predicted risk in subpopulations
Haz
ard
ratio
Figure 2: Subpopulation treatment effect pattern plot (STEPP) of rolofylline by estimated risk of 180-day all-cause mortality; parameters used to define overlap-ping subpopulations were r1=260 and r2=320
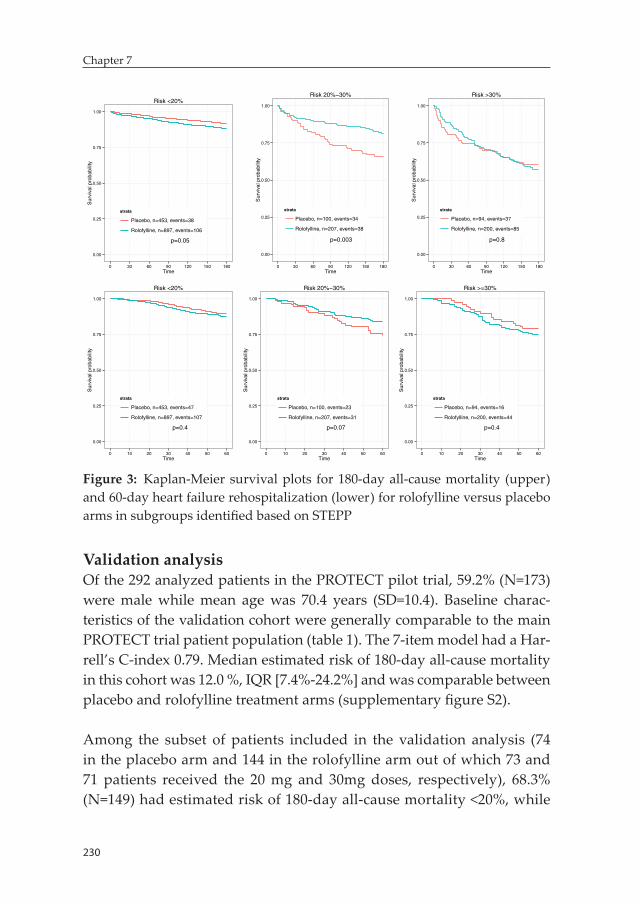
230
Chapter 7
p=0.05
0.00
0.25
0.50
0.75
1.00
0 30 60 90 120 150 180Time
Sur
viva
l pro
babi
lity
strata
Placebo, n=453, events=38
Rolofylline, n=897, events=106
Risk <20%
p=0.003
0.00
0.25
0.50
0.75
1.00
0 30 60 90 120 150 180Time
Sur
viva
l pro
babi
lity
strata
Placebo, n=100, events=34
Rolofylline, n=207, events=38
Risk 20%−30%
p=0.8
0.00
0.25
0.50
0.75
1.00
0 30 60 90 120 150 180Time
Sur
viva
l pro
babi
lity
strata
Placebo, n=94, events=37
Rolofylline, n=200, events=85
Risk >30%
p=0.4
0.00
0.25
0.50
0.75
1.00
0 10 20 30 40 50 60Time
Sur
viva
l pro
babi
lity
strata
Placebo, n=453, events=47
Rolofylline, n=897, events=107
Risk <20%
p=0.07
0.00
0.25
0.50
0.75
1.00
0 10 20 30 40 50 60Time
Sur
viva
l pro
babi
lity
strata
Placebo, n=100, events=23
Rolofylline, n=207, events=31
Risk 20%−30%
p=0.4
0.00
0.25
0.50
0.75
1.00
0 10 20 30 40 50 60Time
Sur
viva
l pro
babi
lity
strata
Placebo, n=94, events=16
Rolofylline, n=200, events=44
Risk >=30%
Figure 3: Kaplan-Meier survival plots for 180-day all-cause mortality (upper) and 60-day heart failure rehospitalization (lower) for rolofylline versus placebo arms in subgroups identified based on STEPP
Validation analysisOf the 292 analyzed patients in the PROTECT pilot trial, 59.2% (N=173) were male while mean age was 70.4 years (SD=10.4). Baseline charac-teristics of the validation cohort were generally comparable to the main PROTECT trial patient population (table 1). The 7-item model had a Har-rell’s C-index 0.79. Median estimated risk of 180-day all-cause mortality in this cohort was 12.0 %, IQR [7.4%-24.2%] and was comparable between placebo and rolofylline treatment arms (supplementary figure S2).
Among the subset of patients included in the validation analysis (74 in the placebo arm and 144 in the rolofylline arm out of which 73 and 71 patients received the 20 mg and 30mg doses, respectively), 68.3% (N=149) had estimated risk of 180-day all-cause mortality <20%, while
231
Risk-based evaluation of efficacy of rolofylline in patients hospitalized with AHF
7
11.5% (N=25) and 20.2% (N=44) had estimated risk between 20%-30% and ≥30%, respectively. Due to small sizes of the latter risk categories, evaluation of efficacy of rolofylline was performed in two risk groups defined based on estimated risk <20% or ≥20%. In the subgroup of pa-tients with estimated risk <20%, 180-day all-cause mortality was higher in the rolofylline arm although differences did not reach statistical significance. In those with estimated risk ≥20%, rolofylline treatment was associated with significantly lower 180-day all-cause mortality rate compared to placebo (25.1% vs. 49.6%, p=0.020). Interestingly, a similar pattern of treatment effect was observed in the two subgroups for the 60-day heart failure rehospitalization outcome (figure 4).
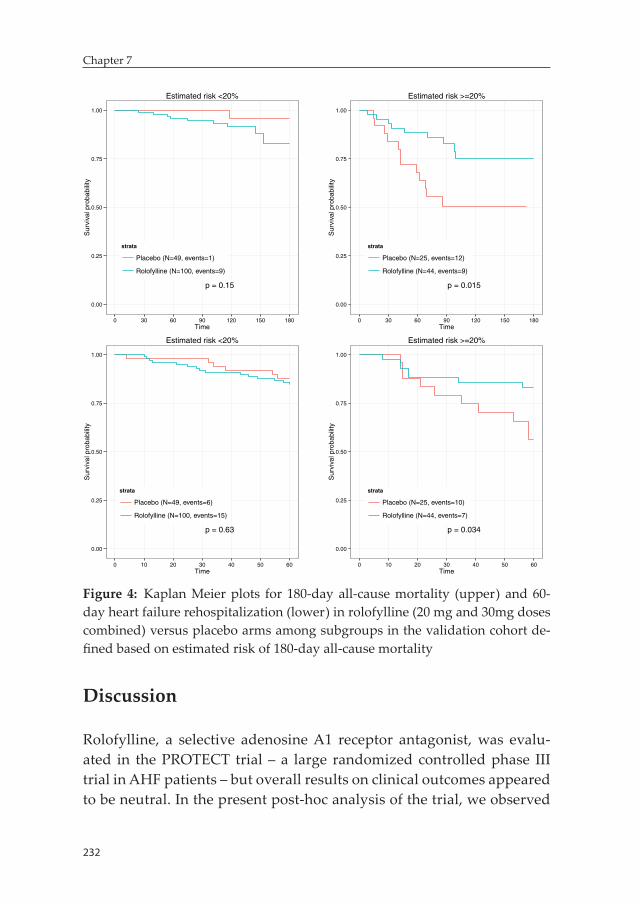
232
Chapter 7
p = 0.15
0.00
0.25
0.50
0.75
1.00
0 30 60 90 120 150 180Time
Sur
viva
l pro
babi
lity
strata
Placebo (N=49, events=1)
Rolofylline (N=100, events=9)
Estimated risk <20%
p = 0.015
0.00
0.25
0.50
0.75
1.00
0 30 60 90 120 150 180Time
Sur
viva
l pro
babi
lity
strata
Placebo (N=25, events=12)
Rolofylline (N=44, events=9)
Estimated risk >=20%
p = 0.63
0.00
0.25
0.50
0.75
1.00
0 10 20 30 40 50 60Time
Sur
viva
l pro
babi
lity
strata
Placebo (N=49, events=6)
Rolofylline (N=100, events=15)
Estimated risk <20%
p = 0.034
0.00
0.25
0.50
0.75
1.00
0 10 20 30 40 50 60Time
Sur
viva
l pro
babi
lity
strata
Placebo (N=25, events=10)
Rolofylline (N=44, events=7)
Estimated risk >=20%
Figure 4: Kaplan Meier plots for 180-day all-cause mortality (upper) and 60-day heart failure rehospitalization (lower) in rolofylline (20 mg and 30mg doses combined) versus placebo arms among subgroups in the validation cohort de-fined based on estimated risk of 180-day all-cause mortality
Discussion
Rolofylline, a selective adenosine A1 receptor antagonist, was evalu-ated in the PROTECT trial – a large randomized controlled phase III trial in AHF patients – but overall results on clinical outcomes appeared to be neutral. In the present post-hoc analysis of the trial, we observed
233
Risk-based evaluation of efficacy of rolofylline in patients hospitalized with AHF
7
significant and clinically relevant heterogeneity in the efficacy of rolofylline across subpopulations defined based on underlying risk of 180-day all-cause mortality. Rolofylline was associated with increased risk of 180-day all-cause mortality compared to placebo in the low to in-termediate risk (i.e. estimated risk <20%) subpopulations as evidenced by the 3.5% higher mortality rate in the rolofylline group. On the other hand, rolofylline treatment was associated with a markedly improved survival in a selected subpopulation of patients with high estimated risk, in particular those with estimated risk between 20% and 30%. A comparable pattern of response to rolofylline was also seen for 60-day heart failure rehospitalization. This trend of potential harm with rolo-fylline treatment in the low to intermediate risk subpopulations and potentially significant benefit in high risk patients was confirmed in an independent validation cohort of AHF patients.
In an exploratory analysis of the PROTECT trial aimed at identifying biomarker profiles that can potentially distinguish treatment respond-ers from non-responders, Liu et al showed that rolofylline had a harm-ful effect in subpopulation of patients with low values of biomarkers while it showed beneficial effect in those with higher biomarker values (23). It was hypothesized that this pattern of differential treatment re-sponse based on differential biomarker expression levels was driven by underlying clinical risk. The pattern of response to rolofylline therapy as a function of estimated risk of 180-day all-cause mortality observed in our analysis supports this hypothesis.
The clinical risk-based heterogeneity in response to rolofylline treatment appears to be primarily driven by the differential pathophysiological role that adenosine (through its A1 receptor activation) might play among different subpopulations of AHF patients with differing sever-ity of disease. Although adenosine can play a potentially detrimental role in the setting of AHF and can significantly contribute to cardiorenal dysfunction through its effect on the kidney, the primary physiological role of adenosine A1 receptor activation is cardiac protection through several actions that can enhance myocardial function, preclude tissue injury and promote tissue repair (7). The benefits of adenosine might
234
Chapter 7
outweigh its detrimental effects on the kidneys in less sick AHF pa-tients, particularly those with no or mild cardiorenal syndrome. This is supported by the finding that adenosine antagonism with rolofylline was associated with a harmful effect on clinical outcomes in the low to intermediate risk subpopulation of patients characterized by mild renal dysfunction, relatively low BUN levels and higher systolic blood pressure among others. On the other hand, it is imperative to consider that the potential detrimental effects of adenosine outweigh its poten-tial benefits in high risk AHF patients, particularly those with more severe cardiorenal syndrome. Givertz et al, in an editorial summarizing the potential role of adenosine receptor blockade in heart failure, sug-gested that sicker patients with acute or worsening renal function or those with diuretic resistance would be better targets of such therapy (24). The REACH UP study, a small randomized placebo-controlled clinical trial that included 76 patients with AHF and recent worsening renal function, showed that there was a trend towards lower rates of persistent renal impairment and 60-day death or heart failure rehos-pitalization in the rolofylline treated patients although differences did not reach statistical significance (the small size of the study needs to be taken into consideration here) (33). The current post-hoc analysis of the PROTECT trial appears to corroborate this observations. Selective adenosine A1 receptor antagonism with rolofylline was associated with significant improvement in clinical outcomes in sicker subpopulation of patients characterized by impaired renal function, higher BUN levels, lower systolic blood pressure and more comorbidities, all of which are associated with more severe cardiorenal syndrome and poorer diuretic response (13, 16, 25, 26).
Methodological considerationsThe potential presence of heterogeneity in treatment effect among subpopulations is well recognized in AHF trials. The conventional ap-proach for the evaluation of heterogeneity in treatment effect involves a one-variable-at-a-time approach that utilizes a set of prespecified patient characteristics. However, this approach has several drawbacks. One of these is increased likelihood of false-negative findings due to inadequate statistical power. Clinical trials are often inadequately pow-
235
Risk-based evaluation of efficacy of rolofylline in patients hospitalized with AHF
7
ered to detect subgroup differences in treatment effect (14, 15, 27, 28). This can be clearly seen from our analysis as no statistically significant treatment interactions were observed among 36 clinical variables and standard laboratory parameters evaluated with the only exception of degree of peripheral edema and eGFR. Moreover, higher likelihood of false positive findings arising from multiple comparisons is a well-known limitation of the conventional subgroup analysis. This prompts the need for the increased utilization of the multivariable risk-based approach for the evaluation of heterogeneity in treatment effect in heart failure trials. This approach is quite appealing as it enhances the statis-tical power of subgroup analysis reducing likelihood of false-negative findings. But most importantly, it facilitates identification of clinically relevant differences in treatment effect among subpopulations that can only be identified when a combination of variables is utilized (14, 15, 28). The utilization of multivariable risk in subgroup analysis, however, requires some methodologic considerations. Ideally, a valid externally developed model should be used to estimate individual absolute risks (15). However, for instances in which a universally accepted externally developed prediction models are lacking, Burke et al indicated that adequately powered (i.e. should at least fulfill the rule of thumb of 10 events per 1 predictor) internally developed models can serve as pow-erful tools to estimate heterogeneity of treatment effect with minimal bias (29). Another important factor that needs to be considered is the performance of the underlying model utilized to estimate individual absolute risks. Hayward et al, in a simulation study, showed that at least a moderate discriminatory accuracy (i.e. AUC >0.60) is needed to achieve a moderate statistical power for the detection of significant multivariable risk based heterogeneity of treatment effect (14).
Moreover, conventional subgroup analysis with continuous variables often involves evaluation of treatment effect in subpopulations of pa-tients defined using arbitrary cut-offs like the mean or median values. This approach has a major drawback, however, as categorizing continu-ous variables is potentially associated with loss of information (30, 31). Subsequently, statistical techniques that allow evaluation of treatment covariate interactions on the continuous scale, like the STEPP approach,
236
Chapter 7
need to be incorporated for more optimal assessment of risk-based het-erogeneity of treatment effect.
Clinical implicationsOur study highlights that underlying clinical risk significantly influ-ences response to rolofylline treatment in patients hospitalized for AHF. Rolofylline showed neutral overall results in the whole trial population and the main PROTECT study concluded that the drug did not show promise in the treatment of AHF with renal dysfunction. This resulted in the halted development of rolofylline and other selective A1 adenosine receptor antagonists as potential treatment strategy in AHF. However, the present findings suggest that a window of opportunity might still exist for selective A1 adenosine receptor antagonists in AHF, particularly in patients with significant cardiorenal syndrome.
On the other side, a partial adenosine A1 receptor agonist is currently under development for the treatment of heart failure. (7). Preclinical trials evaluating these agents have already indicated encouraging re-sults (32). However, our findings seem to imply that partial adenosine A1 receptor agonism is very unlikely to benefit the whole spectrum of patients and, less sick patients with no or mild cardiorenal syndrome might be more suitable targets for this treatment strategy. This is an important point that needs to be considered in the design of future clinical trials of partial adenosine A1 receptor agonists.
Strengths and limitationsUp to our knowledge, this is the first study in AHF to show the presence of significant heterogeneity of treatment effect among subpopulations of patients identified based on multivariable risk estimated using a set of relevant and readily available patient-related clinical and laboratory parameters. In addition, external validation of the main results in an independent cohort of AHF patients is a unique attribute of our study. The findings should be interpreted with some caution, however, as we performed a post-hoc analysis of a clinical trial that was not primarily designed and powered for the evaluation of subpopulation differences
237
Risk-based evaluation of efficacy of rolofylline in patients hospitalized with AHF
7
in treatment effect. The smaller size of the validation PROTECT pilot trial cohort is another limitation of the study.
Conclusion
There is a significant and clinically relevant heterogeneity in the efficacy of rolofylline across subpopulations of AHF patients identified based on underlying baseline risk of 180-day all-cause mortality. Although rolofylline did not improve outcome (might even be slightly deleteri-ous) in the majority of patients included in the PROTECT trial, it was associated with a markedly improved outcome in selected subpopula-tion of patients with high baseline risk of 180-day all-cause mortality. Our findings suggest that window of opportunity might still exist in the future for rolofylline and other agents in hospitalized AHF patients with the implementation of more targeted, need-based approaches.
References 1. Ambrosy AP, Fonarow GC, Butler J, Chioncel O, Greene SJ, Vadugana-
than M, Nodari S, Lam CS, Sato N, Shah AN, Gheorghiade M. The global health and economic burden of hospitalizations for heart failure: lessons learned from hospitalized heart failure registries. J Am Coll Cardiol. 2014; 63: 1123-1133.
2. Massie BM, O’Connor CM, Metra M, Ponikowski P, Teerlink JR, Cotter G, Weatherley BD, Cleland JG, Givertz MM, Voors A, DeLucca P, Mansoor GA, Salerno CM, Bloomfield DM, Dittrich HC, PROTECT Investigators and Committees. Rolofylline, an adenosine A1-receptor antagonist, in AHF. N Engl J Med. 2010; 363: 1419-1428.
3. McMurray JJ, Teerlink JR, Cotter G, Bourge RC, Cleland JG, Jondeau G, Krum H, Metra M, O’Connor CM, Parker JD, Torre-Amione G, van Veld-huisen DJ, Lewsey J, Frey A, Rainisio M, Kobrin I, VERITAS Investiga-tors. Effects of tezosentan on symptoms and clinical outcomes in patients with AHF: the VERITAS randomized controlled trials. JAMA. 2007; 298: 2009-2019.
4. O’Connor CM, Starling RC, Hernandez AF, Armstrong PW, Dickstein K, Hasselblad V, Heizer GM, Komajda M, Massie BM, McMurray JJ, Ni-eminen MS, Reist CJ, Rouleau JL, Swedberg K, Adams KF,Jr, Anker SD, Atar D, Battler A, Botero R, Bohidar NR, Butler J, Clausell N, Corbalan
238
Chapter 7
R, Costanzo MR, Dahlstrom U, Deckelbaum LI, Diaz R, Dunlap ME, Eze-kowitz JA, Feldman D, Felker GM, Fonarow GC, Gennevois D, Gottlieb SS, Hill JA, Hollander JE, Howlett JG, Hudson MP, Kociol RD, Krum H, Laucevicius A, Levy WC, Mendez GF, Metra M, Mittal S, Oh BH, Pereira NL, Ponikowski P, Tang WH, Tanomsup S, Teerlink JR, Triposkiadis F, Troughton RW, Voors AA, Whellan DJ, Zannad F, Califf RM. Effect of nesiritide in patients with acute decompensated heart failure. N Engl J Med. 2011; 365: 32-43.
5. Teerlink JR, Cotter G, Davison BA, Felker GM, Filippatos G, Greenberg BH, Ponikowski P, Unemori E, Voors AA, Adams KF,Jr, Dorobantu MI, Grin-feld LR, Jondeau G, Marmor A, Masip J, Pang PS, Werdan K, Teichman SL, Trapani A, Bush CA, Saini R, Schumacher C, Severin TM, Metra M, RELAXin in AHF (RELAX-AHF) Investigators. Serelaxin, recombinant human relaxin-2, for treatment of AHF (RELAX-AHF): a randomised, placebo-controlled trial. Lancet. 2013; 381: 29-39.
6. Dohadwala MM, Givertz MM. Role of adenosine antagonism in the cardio-renal syndrome. Cardiovasc Ther. 2008; 26: 276-286.
7. Greene SJ, Sabbah HN, Butler J, Voors AA, Albrecht-Kupper BE, Dungen HD, Dinh W, Gheorghiade M. Partial adenosine A1 receptor agonism: a potential new therapeutic strategy for heart failure. Heart Fail Rev. 2016; 21: 95-102.
8. Weatherley BD, Cotter G, Dittrich HC, DeLucca P, Mansoor GA, Bloomfield DM, Ponikowski P, O’Connor CM, Metra M, Massie BM, PROTECT Steer-ing Committee, Investigators, and Coordinators. Design and rationale of the PROTECT study: a placebo-controlled randomized study of the selective A1 adenosine receptor antagonist rolofylline for patients hospi-talized with acute decompensated heart failure and volume overload to assess treatment effect on congestion and renal function. J Card Fail. 2010; 16: 25-35.
9. Cotter G, Dittrich HC, Weatherley BD, Bloomfield DM, O’Connor CM, Me-tra M, Massie BM, Protect Steering Committee, Investigators, and Coor-dinators. The PROTECT pilot study: a randomized, placebo-controlled, dose-finding study of the adenosine A1 receptor antagonist rolofylline in patients with AHF and renal impairment. J Card Fail. 2008; 14: 631-640.
10. Mitrovic V, Seferovic P, Dodic S, Krotin M, Neskovic A, Dickstein K, de Voogd H, Bocker C, Ziegler D, Godes M, Nakov R, Essers H, Verboom C, Hocher B. Cardio-renal effects of the A1 adenosine receptor antagonist SLV320 in patients with heart failure. Circ Heart Fail. 2009; 2: 523-531.
11. Greenberg B, Thomas I, Banish D, Goldman S, Havranek E, Massie BM, Zhu Y, Ticho B, Abraham WT. Effects of multiple oral doses of an A1 adenosine antagonist, BG9928, in patients with heart failure: results of a placebo-controlled, dose-escalation study. J Am Coll Cardiol. 2007; 50: 600-606.
12. Voors AA, Dittrich HC, Massie BM, DeLucca P, Mansoor GA, Metra M, Cot-ter G, Weatherley BD, Ponikowski P, Teerlink JR, Cleland JG, O’Connor
239
Risk-based evaluation of efficacy of rolofylline in patients hospitalized with AHF
7
CM, Givertz MM. Effects of the adenosine A1 receptor antagonist rolofyl-line on renal function in patients with AHF and renal dysfunction: results from PROTECT (Placebo-Controlled Randomized Study of the Selective Adenosine A1 Receptor Antagonist Rolofylline for Patients Hospitalized with Acute Decompensated Heart Failure and Volume Overload to Assess Treatment Effect on Congestion and Renal Function). J Am Coll Cardiol. 2011; 57: 1899-1907.
13. Sarraf M, Masoumi A, Schrier RW. Cardiorenal syndrome in acute decom-pensated heart failure. Clin J Am Soc Nephrol. 2009; 4: 2013-2026.
14. Hayward RA, Kent DM, Vijan S, Hofer TP. Multivariable risk prediction can greatly enhance the statistical power of clinical trial subgroup analysis. BMC Med Res Methodol. 2006; 6: 18.
15. Kent DM, Rothwell PM, Ioannidis JP, Altman DG, Hayward RA. Assess-ing and reporting heterogeneity in treatment effects in clinical trials: a proposal. Trials. 2010; 11: 85-6215-11-85.
16. Valente MA, Voors AA, Damman K, Van Veldhuisen DJ, Massie BM, O’Connor CM, Metra M, Ponikowski P, Teerlink JR, Cotter G, Davison B, Cleland JG, Givertz MM, Bloomfield DM, Fiuzat M, Dittrich HC, Hillege HL. Diuretic response in AHF: clinical characteristics and prognostic significance. Eur Heart J. 2014; 35: 1284-1293.
17. Cleland JG, Chiswell K, Teerlink JR, Stevens S, Fiuzat M, Givertz MM, Davison BA, Mansoor GA, Ponikowski P, Voors AA, Cotter G, Metra M, Massie BM, O’Connor CM. Predictors of postdischarge outcomes from information acquired shortly after admission for AHF: a report from the Placebo-Controlled Randomized Study of the Selective A1 Adenosine Receptor Antagonist Rolofylline for Patients Hospitalized With Acute Decompensated Heart Failure and Volume Overload to Assess Treat-ment Effect on Congestion and Renal Function (PROTECT) Study. Circ Heart Fail. 2014; 7: 76-87.
18. Bonetti M, Gelber RD. Patterns of treatment effects in subsets of patients in clinical trials. Biostatistics. 2004; 5: 465-481.
19. Bonetti M, Gelber RD. A graphical method to assess treatment-covariate interactions using the Cox model on subsets of the data. Stat Med. 2000; 19: 2595-2609.
20. Lazar AA, Cole BF, Bonetti M, Gelber RD. Evaluation of treatment-effect heterogeneity using biomarkers measured on a continuous scale: sub-population treatment effect pattern plot. J Clin Oncol. 2010; 28: 4539-4544.
21. Luoh SW, Ramsey B, Park B, Keenan E. Quantitative progesterone receptor expression and efficacy of anti-estrogen therapy in breast cancer. Breast J. 2014; 20: 46-52.
22. Regan MM, Gelber RD, International Breast Cancer Study Group (IBCSG) and the Breast International Group (BIG). Using clinical trial data to tailor adjuvant treatments for individual patients. Breast. 2007; 16 Suppl 2: S98-104.
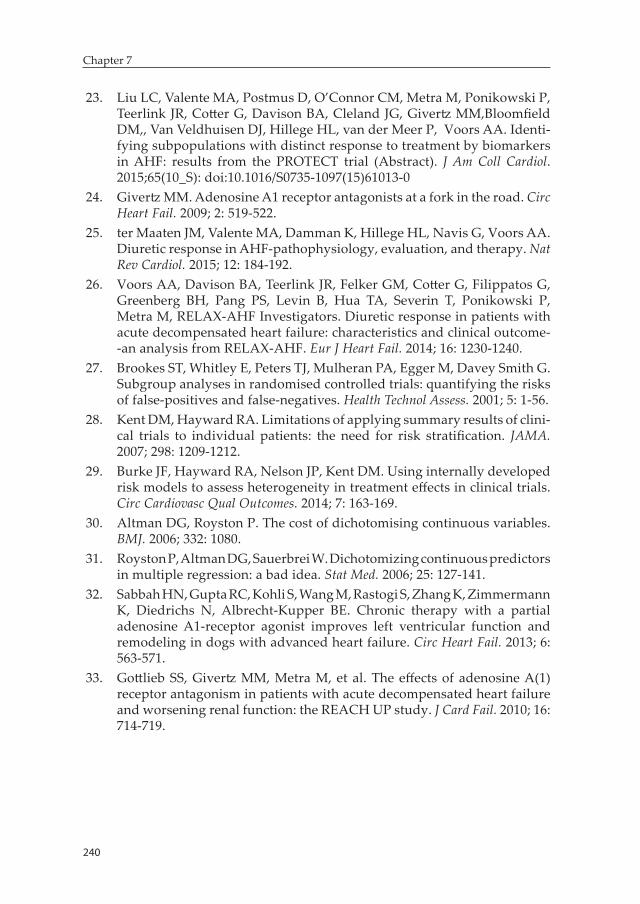
240
Chapter 7
23. Liu LC, Valente MA, Postmus D, O’Connor CM, Metra M, Ponikowski P, Teerlink JR, Cotter G, Davison BA, Cleland JG, Givertz MM,Bloomfield DM,, Van Veldhuisen DJ, Hillege HL, van der Meer P, Voors AA. Identi-fying subpopulations with distinct response to treatment by biomarkers in AHF: results from the PROTECT trial (Abstract). J Am Coll Cardiol. 2015;65(10_S): doi:10.1016/S0735-1097(15)61013-0
24. Givertz MM. Adenosine A1 receptor antagonists at a fork in the road. Circ Heart Fail. 2009; 2: 519-522.
25. ter Maaten JM, Valente MA, Damman K, Hillege HL, Navis G, Voors AA. Diuretic response in AHF-pathophysiology, evaluation, and therapy. Nat Rev Cardiol. 2015; 12: 184-192.
26. Voors AA, Davison BA, Teerlink JR, Felker GM, Cotter G, Filippatos G, Greenberg BH, Pang PS, Levin B, Hua TA, Severin T, Ponikowski P, Metra M, RELAX-AHF Investigators. Diuretic response in patients with acute decompensated heart failure: characteristics and clinical outcome--an analysis from RELAX-AHF. Eur J Heart Fail. 2014; 16: 1230-1240.
27. Brookes ST, Whitley E, Peters TJ, Mulheran PA, Egger M, Davey Smith G. Subgroup analyses in randomised controlled trials: quantifying the risks of false-positives and false-negatives. Health Technol Assess. 2001; 5: 1-56.
28. Kent DM, Hayward RA. Limitations of applying summary results of clini-cal trials to individual patients: the need for risk stratification. JAMA. 2007; 298: 1209-1212.
29. Burke JF, Hayward RA, Nelson JP, Kent DM. Using internally developed risk models to assess heterogeneity in treatment effects in clinical trials. Circ Cardiovasc Qual Outcomes. 2014; 7: 163-169.
30. Altman DG, Royston P. The cost of dichotomising continuous variables. BMJ. 2006; 332: 1080.
31. Royston P, Altman DG, Sauerbrei W. Dichotomizing continuous predictors in multiple regression: a bad idea. Stat Med. 2006; 25: 127-141.
32. Sabbah HN, Gupta RC, Kohli S, Wang M, Rastogi S, Zhang K, Zimmermann K, Diedrichs N, Albrecht-Kupper BE. Chronic therapy with a partial adenosine A1-receptor agonist improves left ventricular function and remodeling in dogs with advanced heart failure. Circ Heart Fail. 2013; 6: 563-571.
33. Gottlieb SS, Givertz MM, Metra M, et al. The effects of adenosine A(1) receptor antagonism in patients with acute decompensated heart failure and worsening renal function: the REACH UP study. J Card Fail. 2010; 16: 714-719.
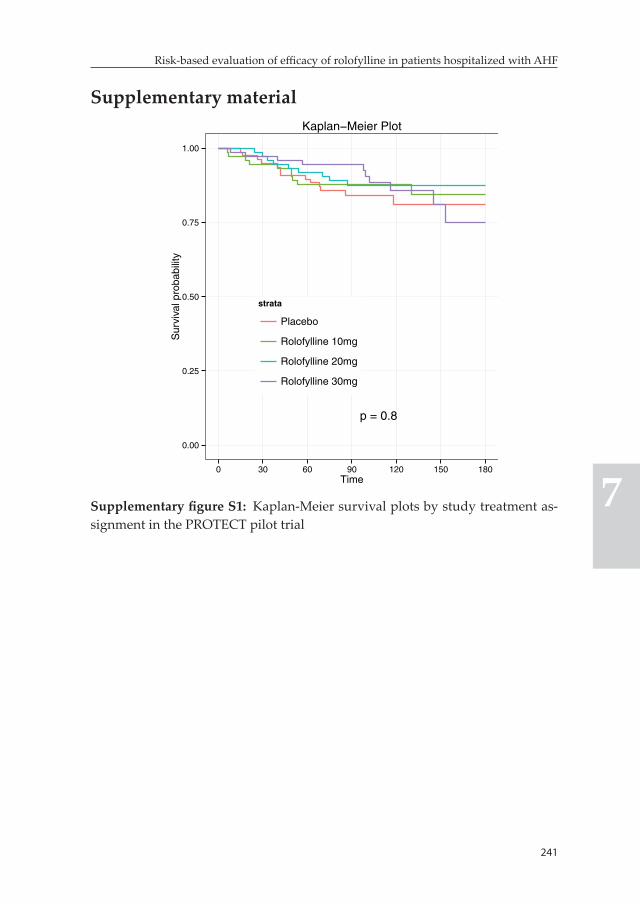
241
Risk-based evaluation of efficacy of rolofylline in patients hospitalized with AHF
7
Supplementary material
p = 0.8
0.00
0.25
0.50
0.75
1.00
0 30 60 90 120 150 180Time
Sur
viva
l pro
babi
lity
strata
Placebo
Rolofylline 10mg
Rolofylline 20mg
Rolofylline 30mg
Kaplan−Meier Plot
Supplementary figure S1: Kaplan-Meier survival plots by study treatment as-signment in the PROTECT pilot trial
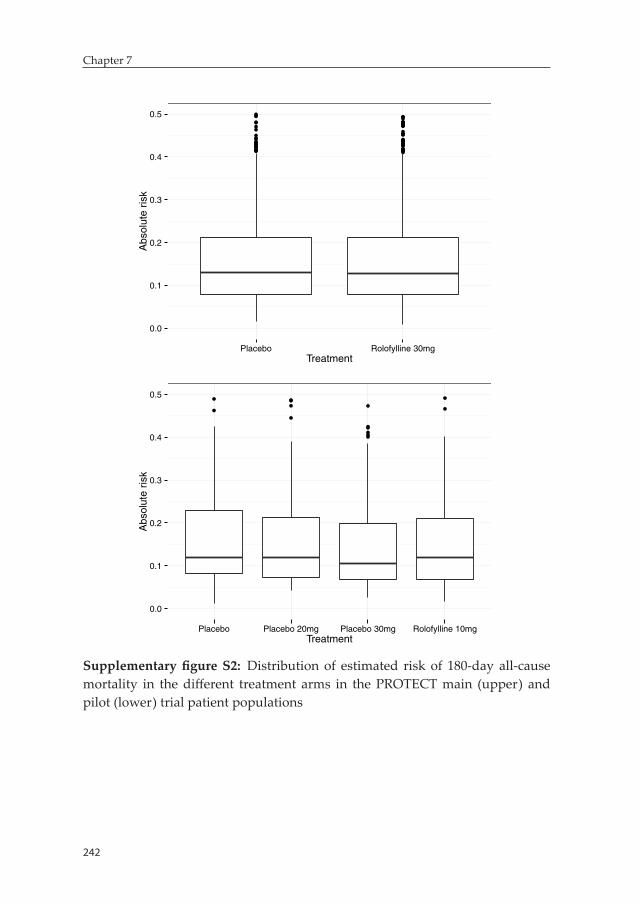
242
Chapter 7
0.0
0.1
0.2
0.3
0.4
0.5
Placebo Rolofylline 30mgTreatment
Abs
olut
e ris
k
0.0
0.1
0.2
0.3
0.4
0.5
Placebo Placebo 20mg Placebo 30mg Rolofylline 10mgTreatment
Abs
olut
e ris
k
Supplementary figure S2: Distribution of estimated risk of 180-day all-cause mortality in the different treatment arms in the PROTECT main (upper) and pilot (lower) trial patient populations
243
Risk-based evaluation of efficacy of rolofylline in patients hospitalized with AHF
7
Supp
lem
enta
ry ta
ble
S1:
Clin
ical
cha
ract
eris
tics
and
labo
rato
ry p
aram
eter
s in
sub
grou
psVa
riab
leLo
w to
inte
rmed
iate
risk
(R
isk
<20%
) N=1
350
Hig
h ri
sk(R
isk
20%
-30%
) N
=307
Very
hig
h ri
sk(R
isk
≥30%
) N
=294
P fo
r tre
nd
Mal
e (%
)88
7 (6
5.7)
202
(65.
8)21
3 (7
2.4)
0.04
7A
ge, y
ears
68.2
±11.
973
.8±9
.575
.2±9
.5<0
.001
BMI,
Kg/
m2
29.1
±6.4
28.4
±5.7
27.8
±5.5
<0.0
01LV
EF, %
32.7
±12.
832
.5±1
4.3
30.0
±12.
30.
022
SBP,
mm
Hg
129±
16.7
118.
5±15
.110
9.4±
13.3
<0.0
01D
BP, m
mH
g76
.4±1
1.3
69.9
±10.
766
.1±1
0.7
<0.0
01H
eart
rate
, bea
ts p
er m
in81
.5±1
5.4
78.0
±15.
777
.0±1
4.5
<0.0
01Ed
ema
≥+2,
N(%
)88
2 (6
5.3)
215
(70.
0)22
2 (7
5.5)
<0.0
01JV
P ≥1
0 cm
, N(%
)48
7 (3
9.8)
105
(38.
5)13
0 (4
8.3)
0.03
0M
edic
al h
isto
ryPe
riph
eral
vas
cula
r dis
ease
, N(%
)12
8 (9
.5)
42 (1
3.7)
39 (1
3.4)
0.01
6H
yper
tens
ion,
N(%
)11
00 (8
1.5)
227
(73.
9)22
2 (7
5.5)
0.00
3M
yoca
rdia
l inf
arct
ion,
N(%
)64
3 (4
7.8)
155
(50.
7)16
5 (5
6.1)
0.00
9Is
chem
ic h
eart
dis
ease
, N(%
)90
9 (6
7.4)
219
(71.
6)22
6 (7
6.9)
0.00
1A
tria
l fibr
illat
ion,
N(%
)67
6 (5
0.4)
197
(65.
0)18
4 (6
2.8)
<0.0
01Pr
evio
us H
F ho
spita
lizat
ion,
N(%
)58
8 (4
3.6)
176
(57.
3)20
3 (6
9.0)
<0.0
01La
bora
tory
par
amet
ers
Seru
m a
lbum
in, g
/dL
3.9
[3.7
-4.2
]3.
7 [3
.5-4
.0]
3.6
[3.3
-3.9
]<0
.001
BUN
, mg/
dL25
.0 [2
0.0-
33.0
]39
.0 [3
1.0-
51.0
]53
.0 [4
1.0-
69.0
]<0
.001
Chl
orid
e, m
Eq/m
L10
2 [9
9.0-
105.
0]10
0.0
[96.
0-10
3.0]
98.0
[95.
0-10
2.0]
<0.0
01
244
Chapter 7
Supp
lem
enta
ry ta
ble
S1:
Clin
ical
cha
ract
eris
tics
and
labo
rato
ry p
aram
eter
s in
sub
grou
ps (c
ontin
ued)
Vari
able
Low
to in
term
edia
te ri
sk
(Ris
k <2
0%) N
=135
0H
igh
risk
(Ris
k 20
%-3
0%)
N=3
07
Very
hig
h ri
sk(R
isk
≥30%
) N
=294
P fo
r tre
nd
Cre
atin
ine,
mg/
dL1.
3 [1
.1-1
.6]
1.6
[1.2
-2.1
]1.
8 [1
.4-2
.3]
<0.0
01To
tal c
hole
ster
ol, m
mol
/L15
5.4±
44.3
135.
1±41
.112
3.0±
33.7
<0.0
01H
emog
lobi
n, g
/dL
13.0
±2.0
12.3
±1.7
11.8
±1.9
<0.0
01Po
tass
ium
, mm
ol/L
4.2
[3.9
-4.6
]4.
2 [3
.9-4
.7]
4.3
[3.9
-4.8
]0.
002
Sodi
um, m
mol
/L14
1.0
[138
.0-1
43.0
]13
8.0
[135
.0-1
41.0
]13
7.0
[133
.0-1
39.0
]<0
.001
eGFR
, ml/m
in/1
.73
m2
53.4
[41.
8-67
.2]
42.3
[30.
7-53
.4]
36.5
[28.
6-47
.5]
<0.0
01D
iure
tic
dose
and
diu
reti
c re
spon
seTo
tal I
V d
iure
tic d
ose
thro
ugh
day
7,
mg
240.
0 [1
20.0
-445
.3]
360.
0 [1
80.0
-746
.8]
487.
2 [2
00.0
-113
3.8]
<0.0
01
Diu
retic
resp
onse
, kg
-0.4
0 [-0
.90
- -0.
20]
-0.3
0 [-0
.70
- -0.
10]
-0.2
0 [-0
.50
- -0.
10]
<0.0
01


General discussion

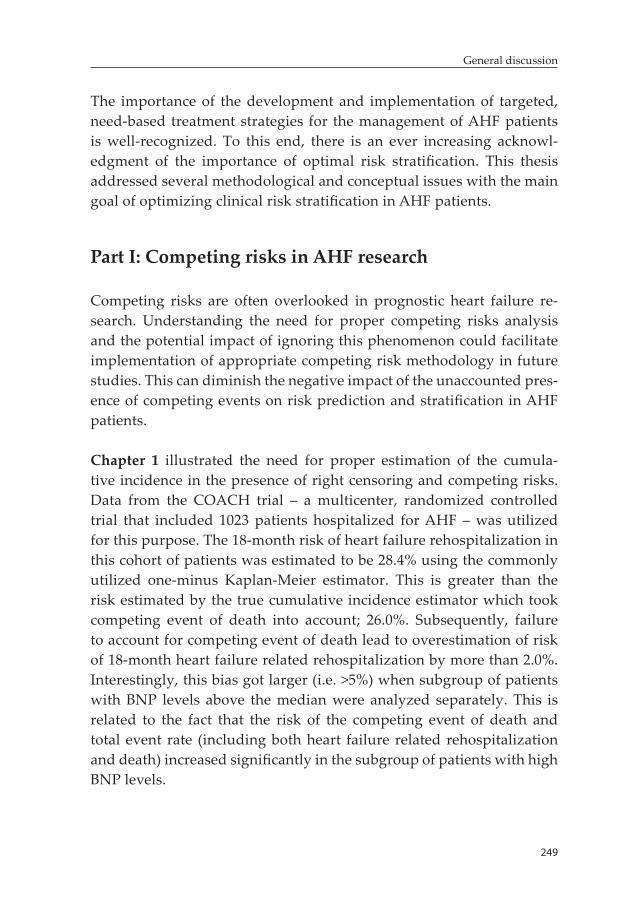
249
General discussion
The importance of the development and implementation of targeted, need-based treatment strategies for the management of AHF patients is well-recognized. To this end, there is an ever increasing acknowl-edgment of the importance of optimal risk stratification. This thesis addressed several methodological and conceptual issues with the main goal of optimizing clinical risk stratification in AHF patients.
Part I: Competing risks in AHF research
Competing risks are often overlooked in prognostic heart failure re-search. Understanding the need for proper competing risks analysis and the potential impact of ignoring this phenomenon could facilitate implementation of appropriate competing risk methodology in future studies. This can diminish the negative impact of the unaccounted pres-ence of competing events on risk prediction and stratification in AHF patients.
Chapter 1 illustrated the need for proper estimation of the cumula-tive incidence in the presence of right censoring and competing risks. Data from the COACH trial – a multicenter, randomized controlled trial that included 1023 patients hospitalized for AHF – was utilized for this purpose. The 18-month risk of heart failure rehospitalization in this cohort of patients was estimated to be 28.4% using the commonly utilized one-minus Kaplan-Meier estimator. This is greater than the risk estimated by the true cumulative incidence estimator which took competing event of death into account; 26.0%. Subsequently, failure to account for competing event of death lead to overestimation of risk of 18-month heart failure related rehospitalization by more than 2.0%. Interestingly, this bias got larger (i.e. >5%) when subgroup of patients with BNP levels above the median were analyzed separately. This is related to the fact that the risk of the competing event of death and total event rate (including both heart failure related rehospitalization and death) increased significantly in the subgroup of patients with high BNP levels.
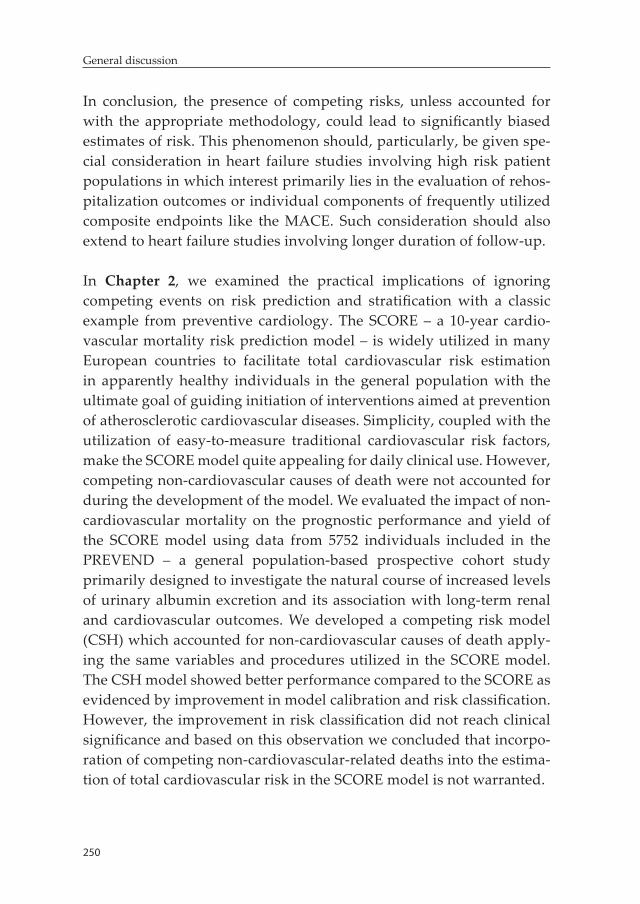
250
General discussion
In conclusion, the presence of competing risks, unless accounted for with the appropriate methodology, could lead to significantly biased estimates of risk. This phenomenon should, particularly, be given spe-cial consideration in heart failure studies involving high risk patient populations in which interest primarily lies in the evaluation of rehos-pitalization outcomes or individual components of frequently utilized composite endpoints like the MACE. Such consideration should also extend to heart failure studies involving longer duration of follow-up.
In Chapter 2, we examined the practical implications of ignoring competing events on risk prediction and stratification with a classic example from preventive cardiology. The SCORE – a 10-year cardio-vascular mortality risk prediction model – is widely utilized in many European countries to facilitate total cardiovascular risk estimation in apparently healthy individuals in the general population with the ultimate goal of guiding initiation of interventions aimed at prevention of atherosclerotic cardiovascular diseases. Simplicity, coupled with the utilization of easy-to-measure traditional cardiovascular risk factors, make the SCORE model quite appealing for daily clinical use. However, competing non-cardiovascular causes of death were not accounted for during the development of the model. We evaluated the impact of non-cardiovascular mortality on the prognostic performance and yield of the SCORE model using data from 5752 individuals included in the PREVEND – a general population-based prospective cohort study primarily designed to investigate the natural course of increased levels of urinary albumin excretion and its association with long-term renal and cardiovascular outcomes. We developed a competing risk model (CSH) which accounted for non-cardiovascular causes of death apply-ing the same variables and procedures utilized in the SCORE model. The CSH model showed better performance compared to the SCORE as evidenced by improvement in model calibration and risk classification. However, the improvement in risk classification did not reach clinical significance and based on this observation we concluded that incorpo-ration of competing non-cardiovascular-related deaths into the estima-tion of total cardiovascular risk in the SCORE model is not warranted.
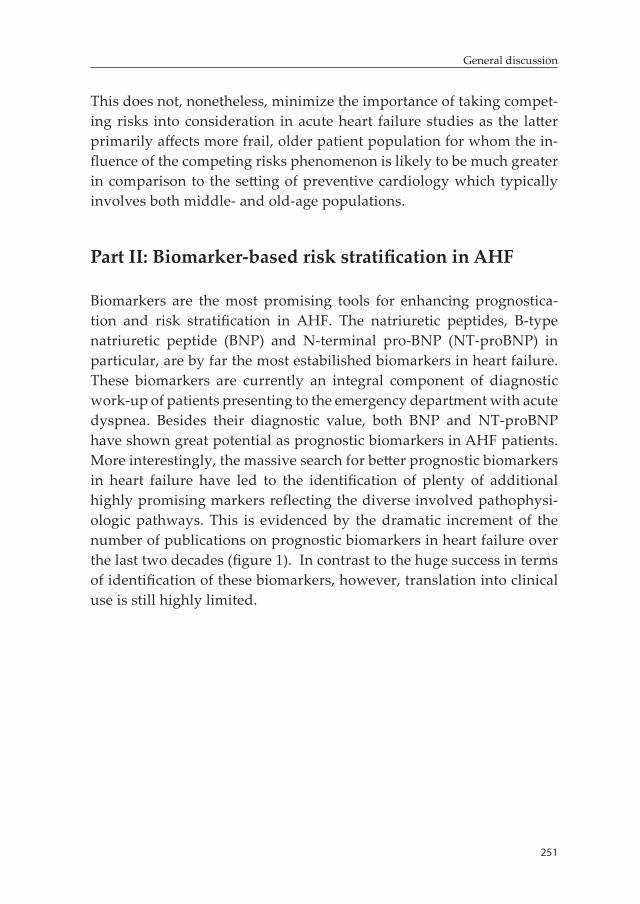
251
General discussion
This does not, nonetheless, minimize the importance of taking compet-ing risks into consideration in acute heart failure studies as the latter primarily affects more frail, older patient population for whom the in-fluence of the competing risks phenomenon is likely to be much greater in comparison to the setting of preventive cardiology which typically involves both middle- and old-age populations.
Part II: Biomarker-based risk stratification in AHF
Biomarkers are the most promising tools for enhancing prognostica-tion and risk stratification in AHF. The natriuretic peptides, B-type natriuretic peptide (BNP) and N-terminal pro-BNP (NT-proBNP) in particular, are by far the most estabilished biomarkers in heart failure. These biomarkers are currently an integral component of diagnostic work-up of patients presenting to the emergency department with acute dyspnea. Besides their diagnostic value, both BNP and NT-proBNP have shown great potential as prognostic biomarkers in AHF patients. More interestingly, the massive search for better prognostic biomarkers in heart failure have led to the identification of plenty of additional highly promising markers reflecting the diverse involved pathophysi-ologic pathways. This is evidenced by the dramatic increment of the number of publications on prognostic biomarkers in heart failure over the last two decades (figure 1). In contrast to the huge success in terms of identification of these biomarkers, however, translation into clinical use is still highly limited.
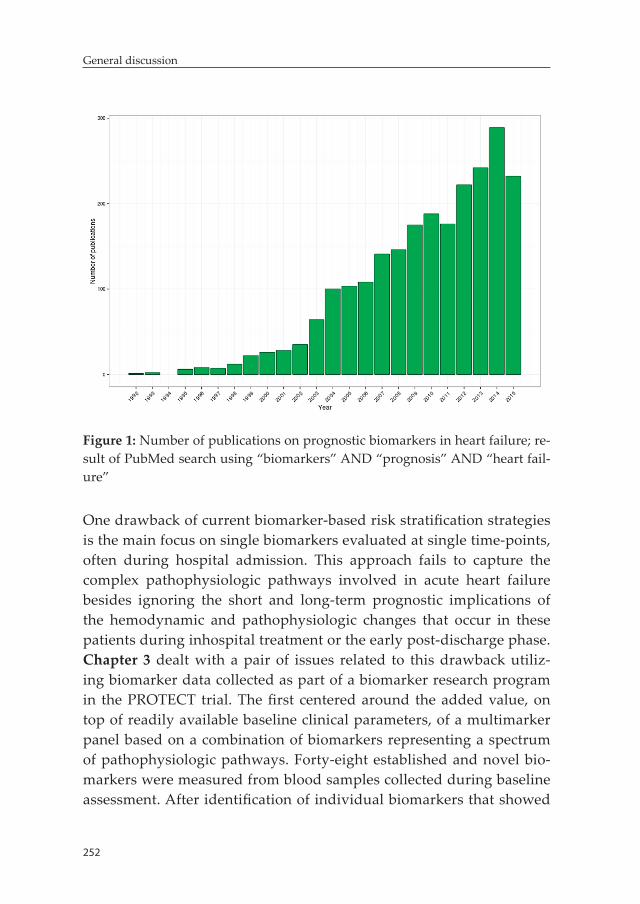
252
General discussion
Figure 1: Number of publications on prognostic biomarkers in heart failure; re-sult of PubMed search using “biomarkers” AND “prognosis” AND “heart fail-ure”
One drawback of current biomarker-based risk stratification strategies is the main focus on single biomarkers evaluated at single time-points, often during hospital admission. This approach fails to capture the complex pathophysiologic pathways involved in acute heart failure besides ignoring the short and long-term prognostic implications of the hemodynamic and pathophysiologic changes that occur in these patients during inhospital treatment or the early post-discharge phase. Chapter 3 dealt with a pair of issues related to this drawback utiliz-ing biomarker data collected as part of a biomarker research program in the PROTECT trial. The first centered around the added value, on top of readily available baseline clinical parameters, of a multimarker panel based on a combination of biomarkers representing a spectrum of pathophysiologic pathways. Forty-eight established and novel bio-markers were measured from blood samples collected during baseline assessment. After identification of individual biomarkers that showed
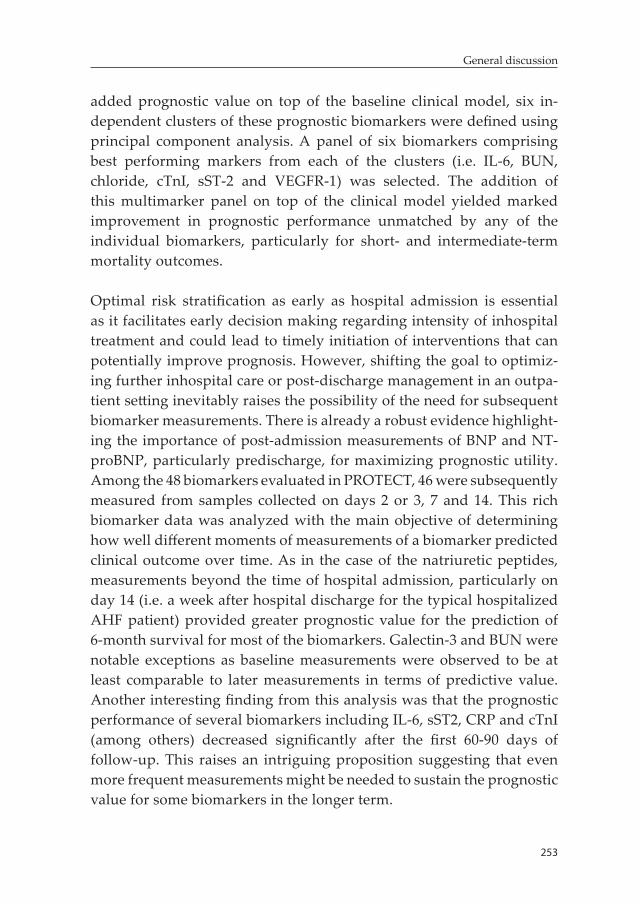
253
General discussion
added prognostic value on top of the baseline clinical model, six in-dependent clusters of these prognostic biomarkers were defined using principal component analysis. A panel of six biomarkers comprising best performing markers from each of the clusters (i.e. IL-6, BUN, chloride, cTnI, sST-2 and VEGFR-1) was selected. The addition of this multimarker panel on top of the clinical model yielded marked improvement in prognostic performance unmatched by any of the individual biomarkers, particularly for short- and intermediate-term mortality outcomes.
Optimal risk stratification as early as hospital admission is essential as it facilitates early decision making regarding intensity of inhospital treatment and could lead to timely initiation of interventions that can potentially improve prognosis. However, shifting the goal to optimiz-ing further inhospital care or post-discharge management in an outpa-tient setting inevitably raises the possibility of the need for subsequent biomarker measurements. There is already a robust evidence highlight-ing the importance of post-admission measurements of BNP and NT-proBNP, particularly predischarge, for maximizing prognostic utility. Among the 48 biomarkers evaluated in PROTECT, 46 were subsequently measured from samples collected on days 2 or 3, 7 and 14. This rich biomarker data was analyzed with the main objective of determining how well different moments of measurements of a biomarker predicted clinical outcome over time. As in the case of the natriuretic peptides, measurements beyond the time of hospital admission, particularly on day 14 (i.e. a week after hospital discharge for the typical hospitalized AHF patient) provided greater prognostic value for the prediction of 6-month survival for most of the biomarkers. Galectin-3 and BUN were notable exceptions as baseline measurements were observed to be at least comparable to later measurements in terms of predictive value. Another interesting finding from this analysis was that the prognostic performance of several biomarkers including IL-6, sST2, CRP and cTnI (among others) decreased significantly after the first 60-90 days of follow-up. This raises an intriguing proposition suggesting that even more frequent measurements might be needed to sustain the prognostic value for some biomarkers in the longer term.
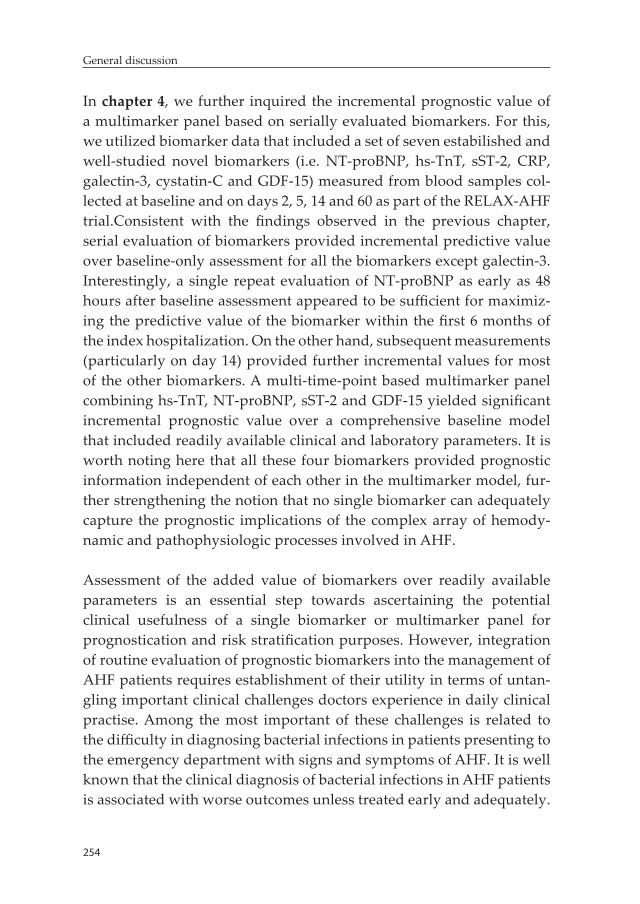
254
General discussion
In chapter 4, we further inquired the incremental prognostic value of a multimarker panel based on serially evaluated biomarkers. For this, we utilized biomarker data that included a set of seven estabilished and well-studied novel biomarkers (i.e. NT-proBNP, hs-TnT, sST-2, CRP, galectin-3, cystatin-C and GDF-15) measured from blood samples col-lected at baseline and on days 2, 5, 14 and 60 as part of the RELAX-AHF trial.Consistent with the findings observed in the previous chapter, serial evaluation of biomarkers provided incremental predictive value over baseline-only assessment for all the biomarkers except galectin-3. Interestingly, a single repeat evaluation of NT-proBNP as early as 48 hours after baseline assessment appeared to be sufficient for maximiz-ing the predictive value of the biomarker within the first 6 months of the index hospitalization. On the other hand, subsequent measurements (particularly on day 14) provided further incremental values for most of the other biomarkers. A multi-time-point based multimarker panel combining hs-TnT, NT-proBNP, sST-2 and GDF-15 yielded significant incremental prognostic value over a comprehensive baseline model that included readily available clinical and laboratory parameters. It is worth noting here that all these four biomarkers provided prognostic information independent of each other in the multimarker model, fur-ther strengthening the notion that no single biomarker can adequately capture the prognostic implications of the complex array of hemody-namic and pathophysiologic processes involved in AHF.
Assessment of the added value of biomarkers over readily available parameters is an essential step towards ascertaining the potential clinical usefulness of a single biomarker or multimarker panel for prognostication and risk stratification purposes. However, integration of routine evaluation of prognostic biomarkers into the management of AHF patients requires establishment of their utility in terms of untan-gling important clinical challenges doctors experience in daily clinical practise. Among the most important of these challenges is related to the difficulty in diagnosing bacterial infections in patients presenting to the emergency department with signs and symptoms of AHF. It is well known that the clinical diagnosis of bacterial infections in AHF patients is associated with worse outcomes unless treated early and adequately.
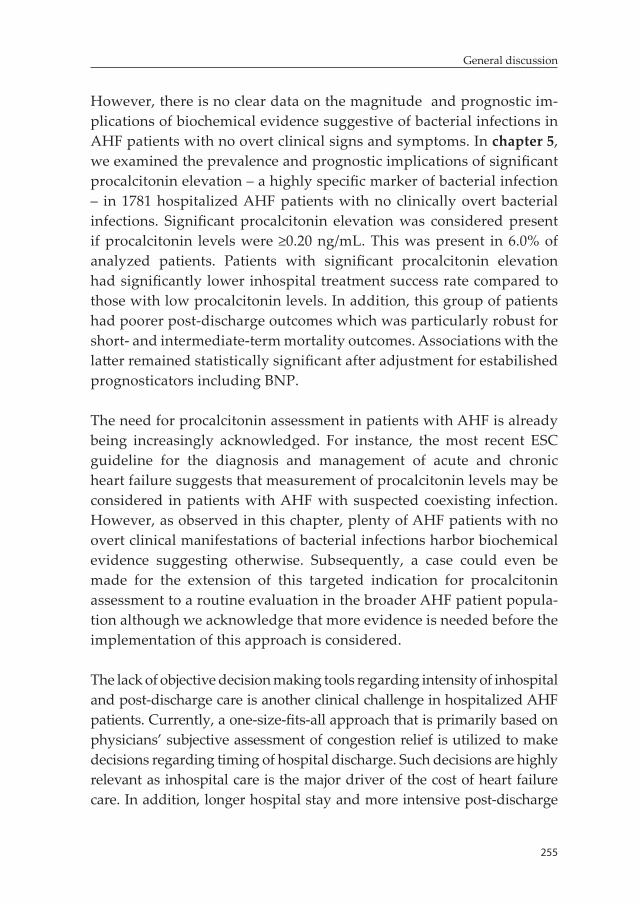
255
General discussion
However, there is no clear data on the magnitude and prognostic im-plications of biochemical evidence suggestive of bacterial infections in AHF patients with no overt clinical signs and symptoms. In chapter 5, we examined the prevalence and prognostic implications of significant procalcitonin elevation – a highly specific marker of bacterial infection – in 1781 hospitalized AHF patients with no clinically overt bacterial infections. Significant procalcitonin elevation was considered present if procalcitonin levels were ≥0.20 ng/mL. This was present in 6.0% of analyzed patients. Patients with significant procalcitonin elevation had significantly lower inhospital treatment success rate compared to those with low procalcitonin levels. In addition, this group of patients had poorer post-discharge outcomes which was particularly robust for short- and intermediate-term mortality outcomes. Associations with the latter remained statistically significant after adjustment for estabilished prognosticators including BNP.
The need for procalcitonin assessment in patients with AHF is already being increasingly acknowledged. For instance, the most recent ESC guideline for the diagnosis and management of acute and chronic heart failure suggests that measurement of procalcitonin levels may be considered in patients with AHF with suspected coexisting infection. However, as observed in this chapter, plenty of AHF patients with no overt clinical manifestations of bacterial infections harbor biochemical evidence suggesting otherwise. Subsequently, a case could even be made for the extension of this targeted indication for procalcitonin assessment to a routine evaluation in the broader AHF patient popula-tion although we acknowledge that more evidence is needed before the implementation of this approach is considered.
The lack of objective decision making tools regarding intensity of inhospital and post-discharge care is another clinical challenge in hospitalized AHF patients. Currently, a one-size-fits-all approach that is primarily based on physicians’ subjective assessment of congestion relief is utilized to make decisions regarding timing of hospital discharge. Such decisions are highly relevant as inhospital care is the major driver of the cost of heart failure care. In addition, longer hospital stay and more intensive post-discharge
256
General discussion
care have been indicated to be potentially beneficial. Nevertheless, these are less likely to be needed in all patients and might contribute to further inflation of cost of care. A demand-based strategy in which low risk patients are discharged early and high risk patients are treated longer inhospital and monitored more aggressively post-discharge appears to be promising in terms of both improving outcomes and reducing cost of care. Biomarkers can serve as objective tools that can enhance predischarge risk ascertainment and facilitate the development and implementation of such demand-based strategies. In chapter 6, we evaluated the value of biomark-ers measured close to discharge for the identification of hospitalized AHF patients at low and high risk for post-discharge events. In this comparative analysis, we showed that plenty of biomarkers have predictive values for low and high post-discharge risk. Interestingly, findings from this analysis suggest that different sets of biomarkers might need to be assessed for optimal identification of low versus high risk patients. Biomarkers such as cTnI, syndecan-1, GDF-15, serum creatinine and BNP showed good performance for the identification of low risk patients while ET-1, procalci-tonin, sST-2, galectin-3 and proADM showed good performance for iden-tification of high risk patients. These risk-region dependent differences in performance of biomarkers need to be considered in future studies aiming at the optimization of biomarker-based predischarge risk stratification in hospitalized AHF patients.
Part III: Risk-based evaluation of phase III clinical trials in AHF
Several mechanisms by which risk stratification tools could be used to improve patient care have been proposed, and some have significantly evolved over the past years. However, in contrast to their crucial value in the setting of primary preventive cardiology care or management of acute coronary syndromes, the role of risk stratification tools in the management of AHF patients is not clearly defined in the guidelines at this stage.
One (probably most important) area of application of risk stratification tools in AHF is facilitation of development and implementation of more
257
General discussion
targeted, personalized treatment strategies. Current drug development strategies, which follow a more general approach targeting the broader patient population, have largely failed to yield successful results and the need for new therapeutic agents that can improve outcome in AHF patients remains as high as ever. There is an increasing recognition among experts in the field on the importance of a shift to more tailored, need-based strategies. Risk stratification tools can play an essential role in terms of facilitating the development and implementation of such strategies through enhancing the process of identification of subpopu-lations that might benefit from a specific therapy in clinical trials. We examined this proposition in the last chapter of this thesis using the case of rolofylline. Rolofylline was considered to be a promising po-tential novel therapy for the treatment of AHF patients about a decade ago and had undergone significant clinical testing. Inspite of a strong pathophysiologic rationale for its administration and positive results in phase II and small phase III trials, it did not show overall benefit in the pivotal PROTECT trial, and subsequently its clinical development was halted. In chapter 7, we evaluated risk-based heterogeneity in re-sponse to rolofylline therapy in AHF patients with a post-hoc analysis of the PROTECT trial. Individual risk was estimated using a simple 8-item model encompassing readily available clinical and laboratory parameters. A STEPP analysis revealed that while rolofylline is not beneficial in low to intermediate risk patients (there is even a trend towards harm), it showed significant beneficial effect in selected high risk AHF patients with regard to both improving survival and reducing heart failure rehospitalizations. This pattern of response to rolofylline therapy was confirmed in an independent cohort of AHF patients. Our findings indicate that a window of opportunity might still exist for rolofylline in the treatment of high risk AHF patients with significant cardiorenal syndrome. In summary, this case study demonstrated that risk stratification tools can have a very important utility in terms of enhancing evaluation of heterogeneity in treatment effect in AHF clini-cal trials, and therefore, might play a key role towards advancing the development and implementation of need-based individualized treat-ment strategies ultimately leading to improved patient care.


Future perspectives

261
Future perspectives
Prognostic biomarker research remains among the most studied areas in heart failure. There has been a tremendous amount of success in identifying prognostic biomarkers and developing reliable measure-ment assays in heart failure. Unfortunately, there is still a huge gap in terms of utilization of these prognostic biomarkers to improve the day-to-day care of AHF patients. The following statement from the ESC 2016 guideline on the management of acute and chronic heart failure is a clear testament to this assertion;
“Multiple other biomarkers, including those reflecting inflammation, oxidative stress, neurohormonal disarray and myocardial and matrix remodelling, have been investigated for their diagnostic and prognostic value in AHF; however, none has reached the stage of being recommended for routine clinical use”.
In this thesis, we addressed plenty of methodological and conceptual issues that could enhance the clinical utility of biomarkers in AHF. However, a great deal of work still remains to be done to facilitate the integration of risk stratification tools, biomarkers in particular, into the routine management of AHF patients.
Risk-based treatment in AHF
An essential feature of any diagnostic, therapeutic or prognostic tool that is often taken into consideration when its integration into patient management guidelines is contemplated revolves around its ability to change or advance clinical practise. Although significant progress has been made regarding the improvement of prognostication and risk stratification, there is hardly any evidence on the role of such tools for the advancement of care in AHF patients. This, by far, remains the major factor hampering the clinical use of risk stratification tools, including prognostic biomarkers, in AHF.
The best proxy for the potential value of risk stratification tools for improving quality of care emanates from primary preventive cardiol-ogy and acute coronary syndrome (ACS) guidelines. Risk scores like
262
Future perspectives
the Framingham or SCORE in primary preventive cardiology and the thrombolysis in myocardial infarction (TIMI) score in ACS are cur-rently integral components of daily clinical practise and their use has led to marked advancement in quality of care. There are plenty of areas where risk stratification tools could be utilized to improve manage-ment of AHF patients potentially leading to better outcomes, in addi-tion to facilitating efficient distribution of scarce health care resources. Triaging of patients in the emergency department, decision making regarding intensity of inhospital and post-discharge care are among the major areas that could be bettered by risk stratification tools. Systematic evaluation of effectiveness of risk-guided treatment strategies, prefer-ably in randomized controlled trials, is a major step that needs to be undertaken in the future to advance the clinical utility of risk stratifica-tion tools in AHF.
Simple externally validated risk score
Although plenty of risk prediction models have been developed in AHF patients over the past years, there is no specific model recommended for potential clinical application. There are differences among published models with respect to clinical setting, characteristics of patient popula-tion, candidate variables, model performance and outcomes assessed. Furthermore, most of these models have not been externally validated in independent cohorts of patients. Interestingly, however, few variables emerged as highly consistent and strong predictors across the spectrum of the prediction models regardless of underlying differences in several parameters. Subsequently, an initial first step that should be accom-plished to hasten clinical use of risk stratification tools in AHF is the establishment of a simple, universally accepted risk score encompass-ing both readily available clinical predictors and a panel of biomarkers. This can be best achieved with individual patient data meta-analysis that incorporates data collected in different settings including clinical trials, prospective observational cohort studies and registries. The im-portance of close collaboration among different consortia could not be overstated in this case. It must be emphasized that external validation
263
Future perspectives
in an independent cohort of patients is paramount to the development of a universally applicable risk score.
Biomarker-guided AHF management
The clinical utility of biomarkers in AHF relies on not only their value as prognostic markers but also as their potential role in guiding therapy. Procalcitonin is, probably, the closest novel biomarker to being con-sidered for inclusion in the routine evaluation of AHF patients. This is primarily related to its anticipated value in guiding initiation and discontinuation of antibiotic therapy in AHF patients with suspected or confirmed concomitant bacterial infections. Whether procalcitonin-guided antibiotic therapy yields improved outcomes in AHF patients is being investigated in the ongoing IMPACT-EU trial and results are eagerly awaited. Positive outcome is highly likely to prompt consid-eration of routine assessment of procalcitonin in this patient popula-tion. Biomonitoring of patients during the inhospital treatment phase or in the ambulatory setting is another very promising target for the utilization of biomarkers. The natriuretic peptides have shown en-couraging results as accurate objective tools for inhospital treatment response monitoring. Moreover, although results were inconclusive, several trials indicated that natriuretic peptide-guided therapy in the ambulatory setting could be beneficial in terms of reducing mortality and rehospitalization, particularly in patients with reduced ejection fraction. However, as highlighted in this thesis, a single biomarker is very unlikely to capture the whole array of pathophysiologic and hemodynamic processes that determine outcome in AHF patients. A multimarker panel-guided biomonitoring and management appears to be a more optimal approach that merits further investigation. This requires more future work in terms of identification and validation of multimarker panels, in addition to the enhancement of the practical feasibility and cost-effectiveness of assessment of such panels. This calls for the strengthening of recent efforts aimed at developing point-of-care devices that enable expedited simultaneous measurement of a panel of biomarkers.
264
Future perspectives
Risk-based evaluation of heterogeneity in treatment effect
Perhaps largely under-recognized application of risk stratification tools in AHF is evaluation of heterogeneity in treatment effect in phase III clinical trials. In the last part of this thesis, we have shown that a risk prediction model could help identify subpopulations of patients that might benefit from a specific novel therapy in spite of apparent lack of overall treatment effect. This is likely to be a common scenario across plenty of past and future phase III clinical trials involving AHF due to the enormous heterogeneity in the treated patient population. In addition to serving as methodologically robust tools for detecting heterogeneity in treatment effect, multivariable risk prediction models can also enhance interpretation and extrapolation of findings. Subse-quently, the routine utilization of risk stratification tools for the evalu-ation of heterogeneity in treatment effect in phase III clinical trials in AHF should be encouraged. Moreover, these tools can also be utilized to improve design of pivotal phase III clinical trials. Larger phase III pilot trials are increasingly becoming the norm in AHF drug develop-ment practise. This provides a unique opportunity for the performance of robust analysis of heterogeneity in treatment effect before the main phase III trials are conducted and could help identify more suitable tar-gets for the treatment under investigation. Such information could be used to improve design of pivotal phase III trials potentially increasing the chance of success. It must be noted here that development of a uni-versally accepted risk score is crucial before routine application of risk stratification tools for the evaluation of clinical trials in contemplated.
In conclusion, biomarker-guided risk stratification and management holds promise with respect to optimizing patient care and improving outcome in AHF. Yet, realization of this promise requires enormous amount of work in the future. More attention needs to be given to the translational aspect of biomarker research and ascertainment of the utility of biomarkers in terms of solving clinical challenges should be prioritized as it could play an essential role towards facilitating the in-corporation of biomarkers into daily clinical practise. The importance of
265
Future perspectives
collaboration among different consortia involved in biomarker research could not be overstated. It is high time that we make a wise use of the ever growing biomarker data generated by researchers and consortia around the world. Last but not least, development of innovative tech-nology that can enhance not just the validity and reliability of assays but also the accessibility and cost-effectiveness of measurements, is crucial to advancing the clinical utility of biomarkers.


Nederlandse samenvatting

269
Nederlandse samenvatting
Het belang van het ontwikkelen en implementeren van gefocuste, op behoefte gebaseerde behandelstrategieën voor het managen van pati-enten met hartfalen is duidelijk. Adequate risico stratificatie is hierin onontbeerlijk. Dit proefschrift behandelde verschillende technieken om tot een optimale risico stratificatie te komen.
Deel 1: concurrerende risico’s in AHF onderzoek
Concurrerende risico’s worden vaak over het hoofd gezien in prognos-tisch hartfalen onderzoek. Het begrijpen van de impact hiervan op de mogelijke zuiverheid van de verkregen risico schattingen kan leiden tot een groter gebruik van statistische methoden om deze risico’s correct te schatten.
Hoofdstuk 1 liet zien dat wanneer er rechtsgecensureerde observa-ties zijn het belangrijk is dat er bij het schatten van de cumulatieve incidentie van een gebeurtenis rekening gehouden wordt met concur-rende risico’s. Gegevens uit de COACH studie – een gerandomiseerde klinische studie waarin 1023 in het ziekenhuis opgenomen hartfalen patiënten deelnamen – waren gebruikt om dit te illustreren. Gebruik makende van de 1 min Kaplan-Meier schatter kwam het 18-maands risico op hartfalen heropname uit op 28.4%. Dit is hoger dan de schat-ting van 26% verkregen op basis van de cumulatieve incidentie schatter, waarbij gecorrigeerd wordt voor overlijden als een concurrerend risico. Het niet rekening houden met overlijden als een concurrerend risico leidt dus tot een meer dan 2% overschatting van het 18-maands risico op hartfalen heropname. Deze onzuiverheid werd groter (5%) wan-neer subgroepen van patiënten met hoge en lage BNP waarden apart geanalyseerd werden. Dit heeft te maken met het feit dat zowel het risico op overlijden als de totale kans op een gebeurtenis (overlijden of heropname) groter is in de groep met hoge BNP waarden. Rekening houden met concurrerende risico’s is dus vooral belangrijk wanneer de studie populatie bestaat uit patiënten met een hoog risico op een gebeurtenis. Dit geldt ook naarmate de tijdsduur waarover patiënten gevolgd worden langer wordt.
270
Nederlandse samenvatting
In hoofdstuk 2 onderzochten we de praktische implicaties van het negeren van concurrerende risico’s in een klassiek voorbeeld binnen de preventieve cardiologie. SCORE – een 10-jaars cardiovasculair risico voorspelmodel – wordt veelvuldig gebruikt in diverse Europese landen voor het schatten van het totale cardiovasculaire risico in ogenschijnlijk gezonde individuen met als doel om, waar nodig, vroege preventieve interventies te starten. De relatieve eenvoud van dit model en het feit dat het gebruikt maakt van klassieke en makkelijk te meten cardio-vasculaire risicofactoren, maakt het gebruik van SCORE aantrekkelijk voor de dagelijkse praktijk. Echter, bij het ontwikkelen van dit model is er geen rekening gehouden met concurrerende, niet cardiovasculaire oorzaken van overlijden. Wij onderzochten de gevolgen hiervan door zowel het originele SCORE model als een concurrerend risico model met dezelfde risicofactoren te (her-) schatten op de PREVEND data, een prospectief cohort van 5752 individuen uit de algemene populatie in the regio Groningen. Onze resultaten lieten zien dat het concurrerend risico model beter presteerde als het SCORE model, zowel in termen van kalibratie als discriminatie. Echter, de verbetering in model fit was klinisch gesproken niet relevant. Op basis hiervan concludeerden wij dat het rekening houden met concurrerende risico’s niet noodzakelijk is voor het voorspellen van totale cardiovasculaire risico in de algemene populatie. Voor het voorspellen van uitkomsten in patiënten met hartfa-len ligt dit anders omdat het hier gaat om een oudere en kwetsbaardere populatie waarin de invloed van concurrerende risico’s groter is.
Deel II: Risicostratificatie gebaseerd op biomarkers in AHF
Biomarkers zijn veelbelovend wat betreft het voorspellen van prog-nose en ter risicostratificatie in AHF. De natriuretische peptides, met name B-type natriuretisch peptide (BNP) en N-terminal pro-BNP (NT-proBNP), zijn met afstand de meest gevestigde biomarkers in hartfalen. Deze biomarkers zijn tegenwoordig een onmisbare component in de diagnostiek van patiënten die zich met acute dyspneu presenteren op de spoedeisende hulp. Behoudens de diagnostische waarde van deze
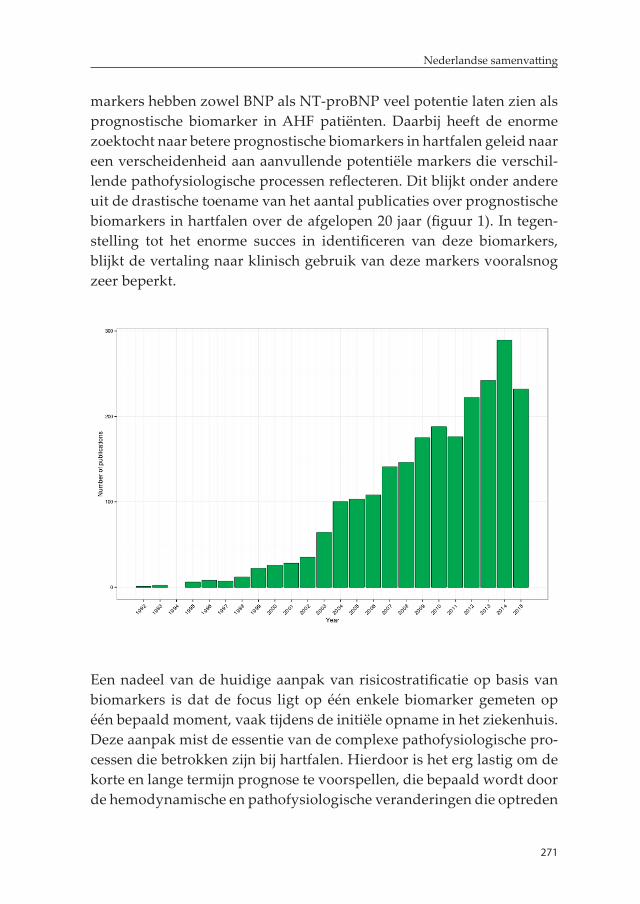
271
Nederlandse samenvatting
markers hebben zowel BNP als NT-proBNP veel potentie laten zien als prognostische biomarker in AHF patiënten. Daarbij heeft de enorme zoektocht naar betere prognostische biomarkers in hartfalen geleid naar een verscheidenheid aan aanvullende potentiële markers die verschil-lende pathofysiologische processen reflecteren. Dit blijkt onder andere uit de drastische toename van het aantal publicaties over prognostische biomarkers in hartfalen over de afgelopen 20 jaar (figuur 1). In tegen-stelling tot het enorme succes in identificeren van deze biomarkers, blijkt de vertaling naar klinisch gebruik van deze markers vooralsnog zeer beperkt.
Een nadeel van de huidige aanpak van risicostratificatie op basis van biomarkers is dat de focus ligt op één enkele biomarker gemeten op één bepaald moment, vaak tijdens de initiële opname in het ziekenhuis. Deze aanpak mist de essentie van de complexe pathofysiologische pro-cessen die betrokken zijn bij hartfalen. Hierdoor is het erg lastig om de korte en lange termijn prognose te voorspellen, die bepaald wordt door de hemodynamische en pathofysiologische veranderingen die optreden
272
Nederlandse samenvatting
als gevolg van de behandeling tijdens opname in het ziekenhuis en in de vroege fase na ontslag. Hoofdstuk 3 behandeld een aantal van deze tekortkomingen door gebruik te maken van data die verzameld is in het kader van een onderzoeks programma in de PROTECT trial. Het eerste dat wordt behandeld is de toegevoegde waarde van een multimarker panel bovenop de al gevestigde reeds bestaande klinische parameters. Dit multimarker panel is gebaseerd op een combinatie van biomarkers die een verscheidenheid van pathofysiologische processen reflecteren. In totaal werden 48 gevestigde en nieuwe biomarkers gemeten in bloedmonsters die verzameld zijn op baseline. Na de identificatie van individuele biomarkers die een toegevoegde prognostische waarde lieten zien bovenop het basis klinische model, werden er zes onafhan-kelijke clusters van deze prognostische biomarkers gedefinieerd door middel van principal component analyse. Er werd een panel van zes biomarkers geselecteerd welke het best presteerde uit elk van de clus-ters (IL-6, BUN, chloride, cTnI, sST-2 en VEGFR-1). De toevoeging van dit multimarker panel bovenop het klinische model gaf een duidelijke verbetering in het voorspellen van prognose, in het bijzonder voor korte en middellange termijn mortaliteit, welke niet kon worden geëvenaard door de individuele biomarkers.
Optimale risicostratificatie bij opname in het ziekenhuis is essentieel omdat het kan helpen in de vroege besluitvorming over de intensiteit en behandeling van de patiënt in het ziekenhuis, en kan leiden tot een tijdige interventie die mogelijk de prognose kan verbeteren. Echter, om de focus meer te leggen op het optimaliseren van de zorg tijdens opname of kort na ontslag, is het onvermijdelijk om opeenvolgende metingen van dergelijke biomarkers uit te voeren. Er is al solide bewijs wat het belang van het meten van BNP en NT-proBNP kort vóór of na ontslag benadrukt, om maximaal gebruik te maken van de prog-nostische waarde van deze biomarkers. Onder de 48 biomarkers die gemeten zijn in PROTECT, waren er 46 achtereenvolgend bepaald in bloedmonsters verzameld op dag 2 of 3, 7 en 14. Al deze biomarker data werd geanalyseerd met als hoofddoel te bepalen hoe goed ver-schillende meetmomenten van een biomarker klinische uitkomst over tijd voorspellen. Net zoals dat het geval is bij natriuretische peptides
273
Nederlandse samenvatting
hadden metingen na ontslag, met name op dag 14 (een week na ontslag uit het ziekenhuis voor de gemiddelde AHF patiënt), voor de meeste biomarkers een grotere prognostische waarde in het voorspellen van de overleving tot zes maanden. Uitzonderingen hierop waren galectin-3 en BUN, waar baseline metingen minstens net zo goed waren vergeleken met latere metingen in het geval van voorspellende waarde. Een an-dere interessante bevinding van deze analyse was dat de prognostische waarde van verschillende biomarkers (o.a. IL-6, sST2, CRP en cTnI) significant daalden na de eerste 60-90 dagen follow-up. Dit leidt tot de intrigerende stelling dat er mogelijk nog meer opeenvolgende metin-gen nodig zijn om de prognostische waarde voor sommige biomarkers te behouden op de langere termijn.
In hoofdstuk 4 gaan we verder in op de toegenomen prognostische waarde van een multimarker panel gebaseerd op meerdere opeen-volgende metingen van biomarkers. Hiervoor hebben we biomarker data gebruikt die bestond uit een set van zeven gevestigde en vaak bestudeerde biomarkers (NT-proBNP, hs-TnT, sST-2, CRP, galectin-3, cystatin-C en GDF-15), welke gemeten zijn in bloedmonsters verzameld op baseline, dag 2, 5, 14 en 60 in het kader van de RELAX-AHF trial. Consequent met de bevindingen die we in het vorige hoofdstuk zagen, hebben meerdere metingen van biomarkers toegenomen voorspellende waarde ten opzichte van biomarkers die alleen op baseline gemeten zijn. De uitzondering hierop is galectin-3. Interessant is dat een herha-ling van NT-proBNP op 48 uur na baseline genoeg lijkt te zijn om de maximale voorspellende waarde van de biomarker te bewerkstelligen binnen de eerste 6 maanden na de ziekenhuisopname. Aan de andere kant bleek dat voor de andere biomarkers door opeenvolgende metin-gen (met name op dag 14) de grootste toename in voorspellende waarde werd bereikt. Een multimarker panel, gebaseerd op meerdere tijds-punten, bestaande uit hs-TnT, NT-proBNP, sST-2 en GDF-15 leverde een aanzienlijke toename in prognostische waarde vergeleken met een uitgebreid baseline model welke bestond uit gemakkelijk beschikbare klinische en laboratorium parameters. Verder valt te vermelden dat al deze vier biomarkers, onafhankelijk van elkaar, prognostische waarde hadden in het multimarker model, wat ons versterkt in het idee dat geen
274
Nederlandse samenvatting
enkele biomarker adequaat de prognostische implicaties kan vangen van de complexe hemodynamische en pathofysiologische processen die betrokken zijn in AHF.
De beoordeling van de toegevoegde waarde van de biomarkers ten op-zichte van de reeds beschikbare parameters is een essentiële stap in de richting van het vaststellen van de potentiële klinische bruikbaarheid van een enkele biomarker of een multimarker panel om de prognose te voorspellen in het kader van risicostratificatie. Echter voordat routi-nematig opeenvolgende metingen van prognostische biomarkers in de kliniek zullen worden uitgevoerd, zal eerst het nut van deze biomarkers met betrekking tot het ontrafelen van belangrijke klinische uitdagin-gen welke dokters tegenkomen in de dagelijkse praktijk in patiënten met AHF moeten worden vastgesteld. Een van de meest belangrijke uitdagingen is gerelateerd aan de moeizame diagnostisering van bacte-riële infecties in patiënten die zich presenteren op de spoedopvang met symptomen van AHF. Het is bekend dat de klinische diagnose van een bacteriële infectie in patiënten met AHF geassocieerd is met een slech-tere uitkomst, tenzij dit tijdig en adequaat wordt behandeld. Echter is er tot op heden geen duidelijk bewijs over de omvang en prognostische implicaties van biochemisch bewijs van een bacteriële infectie in patiën-ten met AHF zonder klinische tekenen van een infectie. In hoofdstuk 5 hebben de prevalentie en prognostische implicaties van een significante procalcitonine stijging, een sterk specifieke marker voor een bacteriële infectie, in 1781 AHF patiënten welke waren opgenomen in het zieken-huis zonder klinische tekenen van een bacteriële infectie. Een stijging van ≥0.20 ng/mL van procalcitonine werd als significant beschouwd. Dit werd gezien in 6.0% van de bestudeerde patiënten. Patiënten met een significante stijging van procalcitonine hadden significant minder succesvolle behandelingen vergeleken met patiënten met lage pro-calcitonine levels. Verder had deze groep de slechtste uitkomsten na ontslag, wat het sterkst werd gezien in mortaliteit op korte en middel-lange termijn. Associaties met het laatste bleven statistisch significant na correctie voor reeds gevestigde prognostische markers waaronder BNP. De noodzaak om procalcitonine te gaan meten in AHF patiënten wordt steeds meer erkend. In de meest recente ESC richtlijnen staat

275
Nederlandse samenvatting
dat voor de diagnose en behandeling van acuut en chronisch hartfalen overwogen kan worden om procalcitonine levels te meten bij patiënten met verdenking op een infectie. Echter, zoals ook beschreven in dit hoofdstuk, hebben veel patiënten met acuut hartfalen zonder klinische tekenen van een bacteriële infectie wel biochemische aanwijzingen welke anders suggereren. Tevens zou gesteld kunnen worden dat er een indicatie is om routinematig procalcitonine te meten in AHF pa-tiënten, hoewel we erkennen dat er meer bewijs nodig is voordat dit daadwerkelijk geïmplementeerd kan worden.
Het gebrek aan objectieve middelen om een beslissing te maken over de intensiteit van de behandeling, zowel in het ziekenhuis als na ont-slag, is een volgende klinische uitdaging tijdens de opname van een AHF patiënt. Momenteel wordt gebruik gemaakt van dezelfde aanpak bij iedere patiënt, welke voornamelijk is gebaseerd op de subjectieve beoordeling van de arts of er sprake is van afname van de congestie, en daaraan gekoppeld wat het goede moment van ontslag zal zijn. Deze beslissingen zijn zeer relevant aangezien de zorg in het ziekenhuis de grootste kostenpost is in de hartfalenzorg. Aan de andere kant kan een langer ziekenhuisverblijf en intensievere zorg na ontslag potentieel gunstige effecten hebben voor de patiënt. Desalniettemin zal deze aan-pak niet in alle patiënten nodig zijn, en draagt daardoor nu mogelijk bij aan de stijging van de zorgkosten. Een zorgvraag gestuurde strategie waarin laag risico patiënten vroeg worden ontslagen uit het ziekenhuis en waar hoog risico patiënten tijdens opname intensief gemonitord worden en na ontslag meer intensievere zorg krijgen, lijkt veelbelovend in zowel het verbeteren van uitkomsten als in het reduceren van de zorgkosten. Biomarkers kunnen hierin dienen als objectieve middelen die het risico vóór ontslag kunnen inschatten, en kunnen helpen met de ontwikkeling en implementatie van dergelijke zorgvraag gestuurde strategieën. In hoofdstuk 6 hebben we gekeken naar de waarde van biomarkers gemeten kort voor ontslag, om patiënten met een laag of hoog risico voor een terugval na ontslag te kunnen identificeren. In deze vergelijkende analyse hebben we aangetoond dat genoeg biomarkers een voorspellende waarde hebben voor een hoog en laag risico na ont-slag. Interessant genoeg laten bevindingen uit deze analyse zien dat er
276
Nederlandse samenvatting
verschillende sets van biomarkers mogelijk nodig zijn om een optimale identificatie van laag of hoog risico patiënten te krijgen. Biomarkers zoals cTnI, syndecan-1, GDF-15, serum creatinine en BNP waren goed in de identificatie van laag risico patiënten terwijl ET-1, procalcitonine, sST-2, galectin-3 en proADM goed waren bij de identificatie van hoog risico patiënten. Deze verschillen in voorspellend vermogen afhankelijk van het risico moeten worden meegenomen in toekomstige studies die als doel hebben om een optimale biomarker gebaseerde risicostratifica-tie vlak voor ontslag vast te stellen in patiënten opgenomen met AHF.
Deel III: Risk-based evaluation of phase III clinical trials in AHF
Er zijn verschillende mechanismen waarbij hulpmiddelen voor risicostratificatie kunnen worden gebruikt om de patiëntenzorg te verbeteren, en deze mechanismen zijn significant verbeterd over de afgelopen jaren. Echter, in tegenstelling tot hun onmisbare waarde in de preventieve cardiologische zorg of behandeling van het acuut coronair syndroom, is de rol van risicostratificatie in de behandeling van AHF patiënten tot op heden nog niet helder gedefinieerd in de huidige richtlijnen. Een (waarschijnlijk meest belangrijke) toepassings-gebied van risicostratificatie in AHF is gelegen in het faciliteren van de ontwikkeling en implementatie van meer gerichte, persoonsgebonden behandelstrategieën. De huidige strategieën van medicatie ontwikke-ling, welke een meer algemene aanpak volgen die gericht is op de brede patiënten populatie, hebben grotendeels gefaald in het opbrengen van succesvolle resultaten, waardoor de noodzaak voor nieuwe therapeuti-sche middelen in AHF die de uitkomsten verbeteren onveranderd hoog blijft. Er is een toenemende erkenning onder de experts op dit gebied dat een meer persoonsgerichte aanpak nodig is. Hulpmiddelen ter risicostratificatie kunnen een essentiële rol spelen in het faciliteren van de ontwikkeling en implementatie van dergelijke strategieën, door het proces van identificatie van subpopulaties die mogelijk profiteren van een specifieke therapie in trials te vergroten. Deze hypothese hebben we onderzocht in het laatste hoofdstuk van deze thesis, gebruikmakend
277
Nederlandse samenvatting
van rolofylline. Van rolofylline werd tien jaar geleden gedacht dat het een veelbelovende nieuwe therapie bij de behandeling van AHF zou zijn, en is daarom uitgebreid klinisch getest. Ondanks een sterke pa-thofysiologische onderbouwing voor de toediening van dit middel, en positieve resultaten in fase II en kleine fase III studies, werd er geen algeheel voordeel gezien in de PROTECT trial en werd de klinische ontwikkeling derhalve stopgezet. In hoofdstuk 7 hebben we heteroge-niteit als respons op rolofylline behandeling in AHF patiënten op basis van risico geanalyseerd met behulp van een post-hoc analyse van de PROTECT trial. Individueel risico werd geschat door middel van een simpel model met 8 gemakkelijk beschikbare variabelen, bestaande uit klinische en laboratorium parameters. Vervolgens werd een STEPP analyse uitgevoerd welke liet zien dat rolofylline niet voordelig is in laag tot middelmatig risico patiënten (er werd zelfs een trend richting schadelijk gezien), maar dat er een significant voordelig effect te zien was in geselecteerde hoog risico patiënten met AHF met betrekking tot zowel een verbeterde overleving als de reductie van hartfalen rehospi-talisatie. Dit patroon van respons op rolofylline werd bevestigd in een onafhankelijk cohort van AHF patiënten. Onze bevindingen geven aan dat er mogelijk een plek is voor rolofylline in de behandeling van AHF in hoog risico patiënten met een significant cardiorenaal syndroom.
Samengevat laat deze studie zien dat hulpmiddelen ter risicostratifica-tie een zeer belangrijke rol kunnen hebben in de evaluatie van hetero-geniteit in behandel effect van AHF in klinische trials, en daarom een mogelijke sleutelrol speelt in de ontwikkeling en implementatie van persoonsgerichte therapieën die op hun beurt weer leiden tot verbe-terde patiëntenzorg.


Toekomstperspectief

281
Toekomstperspectief
De prognostische waarde van biomarkers blijft een van de meest veelvuldig onderzochte aandachtsgebieden in hartfalen onderzoek. Veel succes is reeds behaald met het identificeren van prognostische biomarkers en de ontwikkeling van betrouwbare meetmethodes. He-laas is er tot op heden nog geen vooruitgang geboekt in de vertaling naar de dagelijkse klinische praktijk van AHF patiënten. De volgende passage uit de ESC 2016 richtlijn over acuut- en chronisch hartfalen is een duidelijke bevestiging van deze stelling;
“Van verschillende andere biomarkers, die onder andere inflammatie, oxida-tieve stress, neurohormonale disbalans en mycardiale- en matrix remodeling reflecteren, is de diagnostische en prognostische waarde in AHF onderzocht; echter geen enkele heeft het stadium bereikt dat het wordt aanbevolen deze biomarker te gebruiken in de dagelijkse praktijk”.
Veel werk zal nog verricht moeten worden om de implementatie van risico stratificatie hulpmiddelen zoals biomarkers mogelijk te maken in de dagelijkse praktijk van AHF patiënten.
Risico-gebaseerde behandeling in AHF
Een essentiële eigenschap van ieder diagnostisch, therapeutisch en prognostisch hulpmiddel welke wordt ingezet ter aanvulling op het patiëntenbeleid is dat het de klinische praktijk kan veranderen of voor-uitbrengen. Alhoewel er reeds significante vooruitgang is geboekt in het kader van prognose en risico stratificatie is er weinig bewijs dat deze hulpmiddelen daadwerkelijk de zorg omtrent AHF patiënten kun-nen verbeteren. Dit blijft een van de meest belangrijke punten welke het gebruik van risico stratificatie hulpmiddelen - waaronder prognostische biomarkers - in de klinische praktijk van AHF belemmert. Een goed voor-beeld wat de potentiele waarde van het gebruik van risico stratificatie illustreert, is afkomstig van de primaire preventie cardiologie en acuut coronair syndroom (ACS) richtlijnen. Het gebruik van risico scores zo-als de Framingham of SCORE in primaire preventie en de thrombolysis in myocardial infarction (TIMI) score bij het acuut coronair syndroom is
282
Toekomstperspectief
reeds geïntegreerd in de dagelijkse klinische praktijk en heeft geleid tot een substantiële verbetering van de zorg. Er zijn verschillende gebieden waar risico stratificatie hulpmiddelen gebruikt zouden kunnen worden om de zorg en daarmee uitkomsten van AHF patiënten te verbeteren, in toevoeging op het efficiënt beschikbaar maken vande gezondheidszorg. De triage van patiënten op de spoedeisende hulp, beslissingen tijdens opname en de zorg na ontslag zijn belangrijke aandachtsgebieden die door het gebruik van risico stratificatie verbeterd kunnen worden. Een systemische evaluatie van de effectiviteit van deze op risico gebaseerde behandel strategieën dient verricht te worden, bij voorkeur door middel van gerandomiseerde, controleerde studies. Deze grote stap is nodig om in de toekomst daadwerkelijk risico stratificatie hulpmiddelen in te kunnen zetten in de dagelijkse zorg omtrent AHF patiënten.
Eenvoudige, extern gevalideerde risico scores
Ook al zijn er in de afgelopen jaren meerdere risico predictie modellen ontwikkeld voor AHF patiënten, er wordt geen specifiek model aanbe-volen met mogelijke klinische toepasbaarheid. Er zijn duidelijke ver-schillen te zien tussen de huidige gepubliceerde modellen, met name wat betreft klinische setting, patiënt karakteristieken, kandidaat variabelen, de kwaliteit van het model en onderzochte uitkomsten. Tevens zijn de meeste modellen niet gevalideerd in onafhankelijke patiënt cohorten. Slechts enkele variabelen bleken consistente, sterke voorspellers te zijn over het gehele spectrum van predictie modellen, onafhankelijk van verschillen in onderliggende pathofysiologische en hemodynamische processen. Om die reden zou als eerste stap een simpele, universeel geaccepteerde risico score bestaande uit reeds makkelijk toegankelijke klinische voorspellers en biomarkers ontwikkeld moeten worden om het gebruik van risico stratificatie bij AHF te bevorderen. Dit zou het best bereikt kunnen worden met een op de individuele patiënt gerichte meta-analyse, welke data bevat van verschillende klinische trials, pros-pectieve observationele cohort studies en registratie studies. Het belang van een goede samenwerking tussen verschillende consortia kan hierbij niet sterk genoeg benadrukt worden. Tevens is externe validatiezeer
283
Toekomstperspectief
belangrijk en onmisbaar voor het ontwikkelen van een universeel toe-pasbare risico score.
Biomarker-gestuurde zorg in AHF
De klinische bruikbaarheid van biomarkers in AHF is afhankelijk van zowel de prognostische waarde als de mogelijkheid om de behandeling te sturen. De biomarker procalcitonine is waarschijnlijk het dichtst bij klinische toepasbaarheid in de routine evaluatie van AHF patiënten. Dit is komt vooral doordat procalcitonine het starten en stoppen van antibiotica in AHF patiënten met een mogelijke of aangetoonde bij-komende bacteriële infectie lijkt te kunnen sturen. Of procalcitonine-geleide antibiotische behandeling ook daadwerkelijk de uitkomsten van AHF patiënten verbetert, wordt op dit moment onderzocht in de IMPACT-EU studie, waarvan de resultaten met spanning worden afgewacht. Een verbeterde klinische uitkomst zal hoogstwaarschijnlijk de invoering van het routinematig meten van procalcitonine in deze populatie sterk bevorderen. Biomonitoring van opgenomen patiënten tijdens de behandelfase of in ambulante setting is tevens een zeer veelbelovende toepassing van biomarkers. De natriuretische peptiden hebben reeds laten zien accurate en objectieve hulpmiddelen te zijn als het gaat om het monitoren van intramurale therapie respons. Ook al waren de resultaten inconclusief, verschillende studies hebben reeds aangetoond dat natriuretische peptide-geleide therapie in de ambu-lante setting voor een verlaagde mortaliteit en minder heropnames kunnen zorgen, vooral bij hartfalen patiënten met een verminderde ejectiefractie. Echter, zoals ook al eerder benadrukt in dit proefschrift is het zeer onwaarschijnlijk dat één enkele biomarker de pathofysiologi-sche en hemodynamische processen kan weergeven welke de prognose van AHF patiënten bepaalt. Multimarker-geleide biomonitoring lijkt een betere benadering te zijn en vereist meer onderzoek. Toekomstige studies zouden verricht moeten worden met als doel de identificatie en validatie van multimarker panels, in toevoeging op de verbetering van de klinische toepasbaarheid en kosteneffectiviteit van dergelijke panels. Om dit te bereiken zou de ontwikkeling van point-of-care apparaten
284
Toekomstperspectief
die tegelijkertijd meerdere biomarkers kunnen meten, gestimuleerd moeten worden.
Risico-gebaseerde evaluatie van heterogeniteit in behandel effecten
Een mogelijk ondergewaardeerde applicatie van risico stratificatie hulpmiddelen in AHF is de evaluatie van heterogeniteit in relatie tot effectiviteit van de ingezette behandeling in fase III klinische trials. In het laatste gedeelte van dit proefschrift hebben we een risicomodel laten zien wat kan helpen in het identificeren van patiënten die moge-lijk voordeel hebben van een bepaalde nieuwe therapie, ondanks dat er in de gehele populatie geen effect wordt gezien. Dit is een bekend fenomeen in reeds eerdere, maar waarschijnlijk ook toekomstige kli-nische fase III studies, veroorzaakt doorde grote heterogeniteit binnen de AHF populatie. Naast methodologische robuuste hulpmiddelen om heterogeniteit in behandel effecten te detecteren zijn multivariabele risico predictie modellen ook in staat de interpretatie en extrapolatie van bevindingen te bevorderen. Om die reden zou routine gebruik van risico stratificatie bij de evaluatie van heterogeniteit in behandel-effecten in fase III studies aangemoedigd moeten worden. Daarnaast zouden deze hulpmiddelen gebruikt kunnen worden om het design van doorslaggevende klinische fase III studies te verbeteren. Grote fase III pilot studies worden steeds meer de norm in het kader van de ontwikkeling van nieuwe AHF therapieën. Dit biedt de unieke kans om een robuuste analyse naar de heterogeniteit in behandeleffecten te ver-richten alvorens de algemene fase III studies uit te voeren, met daarbij de mogelijkheid betere targets te identificeren voor de nieuwe therapie die onderzocht wordt. Deze informatie kan gebruikt worden om het design van fase III studies te verbeteren om zo de kans op succes te vergroten. Hierbij moet wel gezegd worden dat er eerst een geschikte, universeel geaccepteerde risico score ontwikkeld moet worden voordat routine applicatie van risico stratificatie hulpmiddelen ter evaluatie van klinische studies in gang wordt gezet.
285
Toekomstperspectief
Concluderend, biomarker-gestuurde risico stratificatie lijkt veelbelo-vend te zijn en zou de zorg omtrent AHF patiënten en hun prognose kunnen verbeteren. Echter, om dit doel te realiseren is veel werk nodig in de toekomst. Meer pijlen dienen gericht te worden op het translati-onale aspect van biomarker onderzoek. Tevens dient de bruikbaarheid van biomarkers in relatie tot het oplossen van klinische vraagstukken de meeste prioriteit te krijgen, gezien dit de eerste stap is naar een mogelijke toepassing in de dagelijkse praktijk. Het belang van een goede samenwerking tussen de verschillende consortia is hierbij van cruciaal belang. Het wordt de hoogste tijd dat er verstandig wordt omgegaan met de groeiende hoeveelheid biomarker data, gegenereerd door verschillende onderzoekers en consortia wereldwijd. Tot slot, de ontwikkeling van innovatieve technologieën die niet alleen de validiteit en betrouwbaarheid van de assays kan vergroten maar ook de toegan-kelijkheid en kosteneffectiviteit verbeteren, is cruciaal om de klinische bruikbaarheid van biomarkers vooruit te helpen.


APPENDICESAcknowledgment
Bibliography
Curriculum vitae

289
Acknowledgment
Acknowledgment
The successful completion of this PhD thesis was made possible with the contribution of many people and I would like to express my grati-tude to those who supported me along the way.
First and foremost, I would like to express my sincere gratitude to my promotores Prof. Hans L. Hillege and Prof. Adriaan A. Voors. Dear Hans, I will always be grateful for getting the opportunity to work with you on this PhD project. Since the first day I started working with you on my master thesis, you have always been highly supportive, both academically and at a personal level. I have greatly benefited from your expertise, experience and critical thinking which I believe were central to the successful accomplishment of this PhD project. I always respected your unique perspective on clinical research – focus on clini-cal relevance, appropriate level of methodologic sophistication and out of the box thinking – and I learned much from it. I would also like to thank you for always keeping your door open and helping me deal with many of the challenges I faced along this journey. More importantly, you encouraged me to pursue my career ambitions and challenged me when needed; and I believe I am a better person because of it. For these and many other reasons I failed to mention here, I will forever be thank-ful!
Dear Adriaan, firstly, I would like to thank you for giving me the op-portunity to work with you on my PhD project. It was my long held ambition to study biomarkers in heart failure although I was unsure on how this was going to happen. I am so grateful that you gave me the opportunity to realize this ambition of mine while in the process enabling me to effectively utilize my backgrounds in medicine and epidemiology. I admired and appreciated your enthusiasm and pursuit of novel yet clinically relevant research, which I believe has created an exciting and motivating environment for your PhD students. You always encouraged me to work hard and aim higher, which I believe were essential for the timely and successful conclusion of my PhD project. I learned a lot from your expertise and experience, and your
290
Acknowledgment
close supervision and guidance had been crucial to my development as a researcher. I will fondly remember the great time I spent working with you on my PhD project and I wish to express my deeply heartfelt gratitude for all the opportunities.
I would also like to extend my gratitude to my co-promoter Dr. Douwe Postmus. Dear Douwe, your knowledge and skills were invaluable to me, and I learned a lot from you. I will always remember the long and interesting scientific discussions we had over the years, and they taught me enormously. I appreciate the fact that you were accessible for dis-cussions and always had quick solutions to some of the most complex stastical challenges I faced working on this PhD project. Thank you for your support, supervision and overall contribution to this PhD thesis. Your assistance in translating the summary of my PhD thesis is also highly appreciated.
I wish to thank the members of the reading committee, Prof. Pieter de Graeff, Prof. Eric Boersma and Prof. Pim van der Harst for taking the time to review this thesis.
I would like to thank the graduate school of medical sciences (GSMS) for funding my PhD project. Dr. Desiree Jansen, who is the coordinator of the research master program in clinical and psychosocial epidemiol-ogy, was very supportive during my masters study here in UMCG and facilitated my transition to a PhD student; I really appreciate it and thank you.
My colleagues from the heart failure team; Mattia, Licette, Jozine, Eline and Koen, it had been a great pleasure working with you. Dear Mat-tia, you had been like a mentor to me and helped me a lot during the first year of my PhD training. I was highly motivated by the scientific discussions we had, and I appreciate your support in helping me learn R faster. Dear Licette, Jozine, Eline and Koen, you had been amazing officemates over the past years. I really enjoyed our conversations, both scientific and extracurricular, and was inspired by your discipline, intelligence and commitment. I would also like to extend my heartfelt
291
Acknowledgment
gratitude to Eline and Koen, for helping me with the Dutch summary. Thomas, Wouter, Rogier, Laura, Niels, Mathilde, Frank and my col-leagues from the heart failure team, I am so thankful for the great times in the ESC heart failure congresses in Seville and Florence. I will always cherish those memories. I would also like to thank other colleagues; Hanna, Minke, Johanneke, Yuya, Ijsbrand, Sven, Haye, Anne, Ernaldo, Bastiaan, Rob, Meelad, Ruben, Marielle, Ymkje, Lawien, Yanick, Carlijn, Navine, Megan and all other colleagues from the experimental cardiol-ogy. I enjoyed the conversations at the coffee machine or during drinks and the outing to Schiermonnikoog (with some of you) was a special moment.
Dear Roelian, Aukje and Marijke, you provided me with much support over the past three years, particularly on the practical side of things, and you were always helpful. I really appreciate it and thank you. Marco and colleagues from TCC, I would like to thank you for all the technical support you provided me; your doors were always open and I am grateful. My thanks also go out to Carla and Danielle for all their support.
To Dr. Gad Cotter and Dr. Beth Davison, you invited me to Momentum research Inc. in Durham, North Carolina and provided all the neces-sary support that enabled me to perform the validation analysis for the ‘risk-based evaluation of efficacy of rolofylline in patients hospitalized with acute heart failure’ manuscript. I believe the manuscript is much improved after the validation analysis, which would not have been pos-sible without your support. Moreover, I learned a lot from my stay in Momentum research and I am so grateful for getting the opportunity to visit your company. Dear Chris, Phil and all the employees of Momen-tum research Inc. in Durham, I really appreciate all you did to make my stay there a great experience.
To all my habesha friends in Groningen; Fasil and Saron, Wondwosen, Solomon, Fitsum, Addisu, Yeshambel, Abdella, Misghina, Teshome, Hana, Netsanet, Abera and Deribew, thank you for the great times and friendship. Noami, Abhinav, Giuditta, Marialetizia and Feyza, albiet

292
Acknowledgment
short, we spent some nice times together here in Groningen. Thank you for the companionship and I feel privileged to have gotten to know you. I would also like to extend my appreciation to Ricardo who has been a good friend since we met five years back.
My special thanks go out to my paranymphs; Julisca Cesar and Jasper Tromp. Dear Julisca, you have been such a good friend since we have known each other as classmates during our research master study. I am so thankful for your friendship and wish you all the best in the future. Dear Jasper, I really enjoyed both the academic and regular conversa-tions we had over the last couple of years. It was also a great pleasure working with you on several projects and I hope we will continue doing so in the future.
To my parents, Tsehaye and Gemechu, I really do not know where to start. You have been great parents for both Henok and myself; you taught us the value of education since we were very young and made many sacrifices to make sure we got the best education possible. You always believed in us and encouraged us to aim higher and work hard. Although we have been far apart for some years already, I always felt like we were so close and our regular phone conversations had been therapeutic. I know there is no way to pay you back, but at least I hope I have made you proud with my academic accomplishments so far. Dear Henok, thank you for the encouragement and moral support over the years. Although we did not talk much over the past couple of years, I cherish those heartfelt brotherly moments. I am proud of you and keep up the hard work. Sebiye, Argaw and all your family, your support and encouragement meant a lot, and is part of the reason for where I am today; thank you so much. I would also like to thank Zebenay, Solomon, Hamelmal, Aynalem, Abay and Eliyas for all the encourage-ment and support.
I would like to express my heartfelt gratitude to Abby, Emama and all the family (Yosef, Teddy, Bruk, Bereket, Muse and Helina). Thank you so much for your warmth, hospitality and kindness. I really appreciate your support and encouragement.

293
Acknowledgment
Last but not least, to my beautiful wife; Tenuye you have been unbeliev-ably supportive since the first day we met, but especially during the last three years. You have always been there for me through all the ups and downs; celebrated my success and lifted me up when I was down. You encouraged and motivated me to persevere during times of difficulty and uncertainty. Even when I regularly spent the weekends in the office and stayed late, you had always been patient. I am so thankful Tenuye; these meant a lot. I also appreciate the effort you put into listening to and understanding my research (I know it can be boring at times) and your creative input in the process of publication of my book was amaz-ing. Tenuye, I feel blessed and grateful to be able to spend every day of my life with you and I cannot wait to see what the future holds for us. I love you so much!

295
Curriculum Vitae
Curriculum Vitae
Biniyam Gemechu Demissei was born on March 11, 1987 in Huruta, Ethiopia. He attended his primary and secondary school education in Huruta primary and senior secondary schools. After completing his pre-paratory school education in Huruta senior secondary school, he joined Jimma university school of medicine in December 2004. After five years of education and one more year of clinical rotations, he completed his medical training and obtained his MD degree with distinction. In 2009, in his last year of medical school, he got the opportunity to visit the Ludwig-Maximilians-University Hospital, Munich, Germany where he did a month-long clinical internship in the departments of cardiology and nephrology.
After completing his medical training in October 2010, Biniyam started working as a lecturer in the department of epidemiology in Jimma University College of Public health and Medical sciences. In September 2011, he moved to Groningen to pursue his research master study in the clinical and psychosocial epidemiology (CPE) program provided in the University Medical Center of Groningen. It was during this train-ing – in the spring of 2012 – that he got in contact with Professor Hans Hillege about the possibility of working together on his master’s thesis. After some email communications, Professor Hans Hillege agreed to be the main supervisor of his master’s thesis. Under the supervision of Professor Hans Hillege and co-supervision of Dr. Douwe Postmus, he successfully finished his master thesis project entitled ‘The application of competing risks methodology in cardiovascular risk prediction models’ and the project ultimately lead to a publication.
Following the completion of his research masters training, he started working on his GSMS funded PhD project entitled ‘Optimizing clinical risk stratification in acute heart failure’ in 2013 under the supervision of Professors Hans Hillege and Adriaan Voors, and the support of Dr. Douwe Postmus. He plans to defend his PhD thesis on the 9th of Janu-ary, 2017 and is currently working as a post-doc in the department of cardiology, University Medical Center of Groningen.

297
Bibliography
Bibliography
1. Demissei BG, Postmus D, Valente MA, van der Harst P, van Gilst WH, Van den Heuvel ER, Hillege HL. Should non-cardiovascular mortality be considered in the SCORE model? Findings from the Prevention of Renal and Vascular End-stage Disease (PREVEND) cohort. Eur J Epidemiol 2015;30:47-56.
2. Postmus D, Demissei BG, Hillege HL. Tools and Techniques - Sta-tistical. Estimating cumulative incidences in the presence of right-censoring and competing risks: an introduction with illustrations from the COACH study. EuroIntervention 2016;11:e1322-4.
3. Demissei BG, Valente MA, Cleland JG, O’Connor CM, Metra M, Ponikowski P, Teerlink JR, Cotter G, Davison BA, Givertz MM, Bloomfield DM, Dittrich H, van der Meer P, van Veldhuisen DJ, Hil-lege HL, Voors AA. Optimizing clinical use of biomarkers in high-risk acute heart failure patients. Eur J Heart Fail 2016;18:269-280.
4. Demissei BG, Cleland JG, O’Connor CM, Metra M, Ponikowski P, Teerlink JR, Davison BA, Givertz MM, Bloomfield DM, Dittrich H, van Veldhuisen DJ, Hillege HL, Voors AA, Cotter G. Procalcitonin-based indication of bacterial infection identifies high risk acute heart failure patients. Int J Cardiol 2016;204:164-171.
5. Demissei BG, Postmus D, Liu LC, Cleland JG, O’Connor CM, Metra M, Ponikowski P, Teerlink JR, Cotter G, Davison BA, Edwards C, Givertz MM, Bloomfield DM, Dittrich HC, Voors AA, Hillege HL. Risk-based evaluation of efficacy of rolofylline in patients hospital-ized with acute heart failure - Post-hoc analysis of the PROTECT trial. Int J Cardiol 2016;223:967-975.
6. Demissei BG, Postmus D, Cleland JG, O’Connor CM, Metra M, Poni-kowski P, Teerlink JR, Cotter G, Davison BA, Givertz MM, Bloomfield DM, Dittrich H, van Veldhuisen DJ, Hillege HL, Voors AA. Plasma biomarkers to predict or rule out early post-discharge events in patients discharged after an acute heart failure hospital admission. Accepted European journal of heart failure
7. Demissei BG, Cotter G, Prescott MF, Felker GM, Filippatos G, Green-berg BH, Pang PS, Ponikowski P, Severin YM, Wang YL, Qian M, Teerlink JR, Metra M, Davison BA, Voors AA. A multimarker multi-

298
Bibliography
time-point based risk stratification strategy in AHF – results from the RELAX-AHF trial.
Accepted European journal of heart failure8. Gracia JR, Demissei BG, Cleland JG, O’Connor CM, Metra M, Poni-
kowski P, Teerlink JR, Cotter G, Davison BA, Givertz MM, Bloom-field DM, Dittrich H, Pérez-Calvo JI, ter Maaten JM, Damman K, Voors AA. Residual congestion in acute decompensated heart failure. Submitted
Related Documents