Demand & Utility David Levinson

Demand & Utility David Levinson. Trade Game The Economy consists of the following resources White Purple Brown Orange Blue Gray Green Yellow Gold The.
Dec 19, 2015
Welcome message from author
This document is posted to help you gain knowledge. Please leave a comment to let me know what you think about it! Share it to your friends and learn new things together.
Transcript

Demand & Utility
David Levinson

Trade Game
• The Economy consists of the following resources
• White• Purple• Brown• Orange• Blue• Gray• Green• Yellow• Gold
The objective of the game is to maximize your gains in utility.
Define A Utility Function for Yourself
U = F(White, Purple, Brown, Orange, Blue, Gray, Green, Yellow, Gold)
You are handed an assortment of resources
Measure your utility
Trade with others in the class (15 minutes)
At end of trading period measure your utility again. Measure absolute, % increase
Record scores on the board
Discuss
Is there a better way to allocate resources?
Utility Maximization
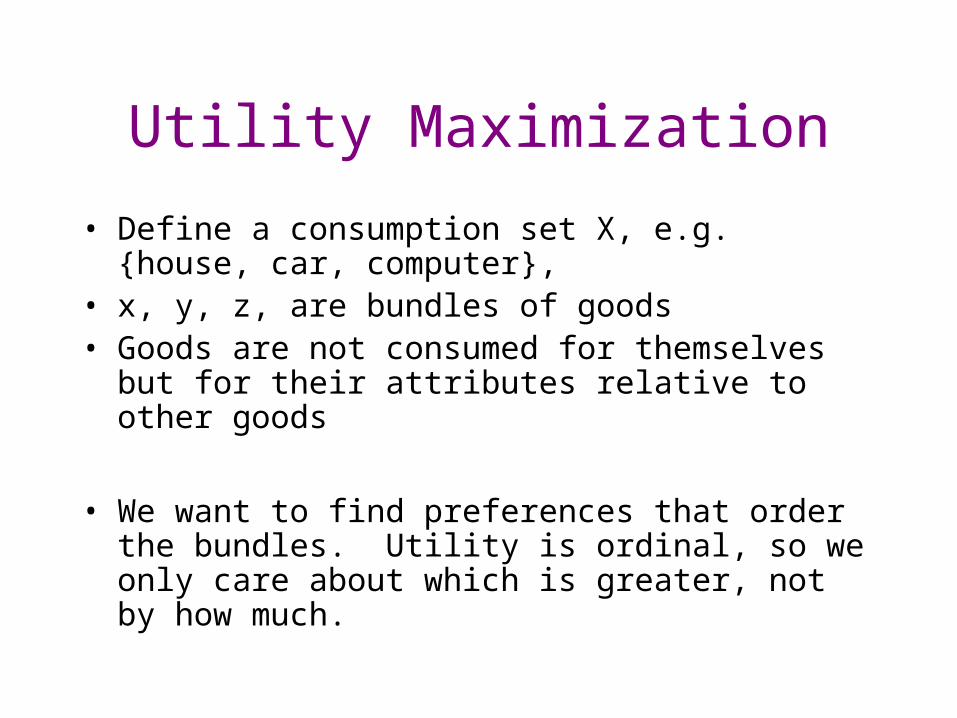
• Define a consumption set X, e.g. {house, car, computer},
• x, y, z, are bundles of goods• Goods are not consumed for themselves but
for their attributes relative to other goods
• We want to find preferences that order the bundles. Utility is ordinal, so we only care about which is greater, not by how much.
Preferences Must Satisfy Assumptions of Continuous
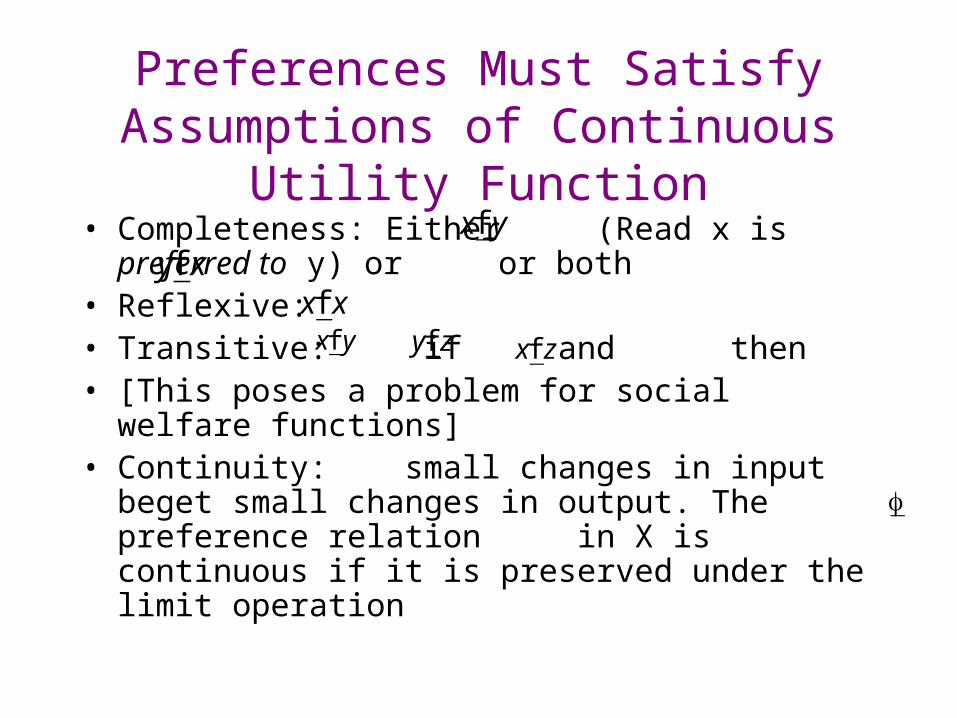
Utility Function• Completeness: Either (Read x is preferred to
y) or or both • Reflexive: • Transitive: if and then • [This poses a problem for social welfare
functions]• Continuity: small changes in input beget small
changes in output. The preference relation in X is continuous if it is preserved under the limit operation
€
xf y
€
yf x
€
xf x
€
xf y
€
yf z
€
xf z
€
f
Continuous at a Point
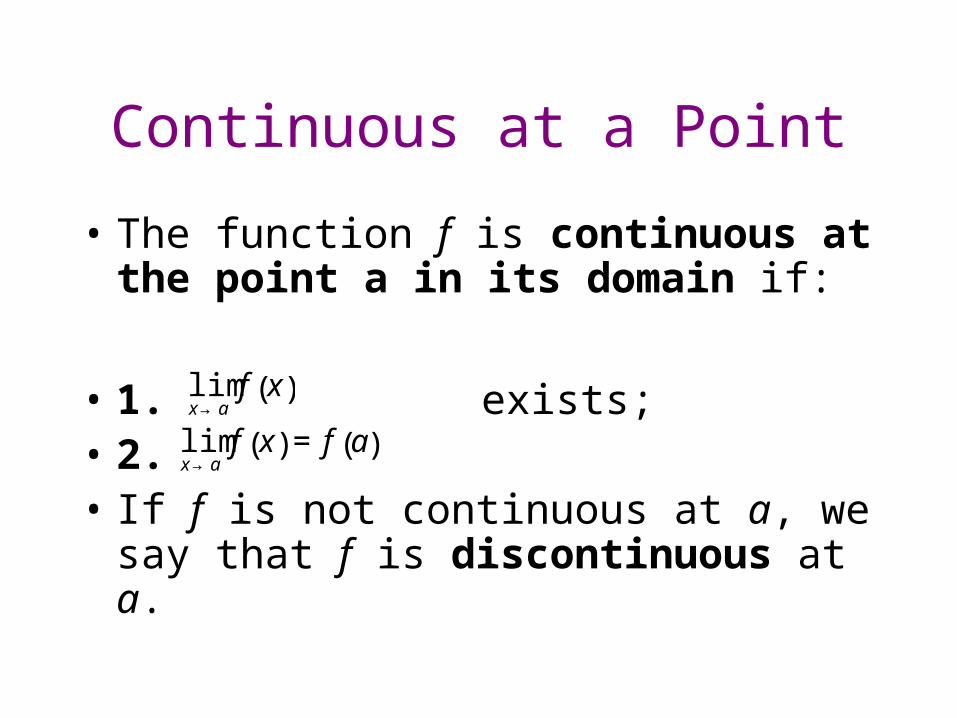
• The function f is continuous at the point a in its domain if:
• 1. exists;• 2.• If f is not continuous at a, we say
that f is discontinuous at a.€
limx→af x( )
€
limx→af x( ) = f a( )

More Assumptions
• Monotonicity: If x ≥ y then • Local Non-satiation: More is
better than less• Convexity: If and, then
€
xf y
€
xf z
€
yf z
€
tx+(1− t)yf z

Aggregation of Social Welfare Functions
• Three individuals each have well-behaved preferences.
• Person A prefers red to blue and blue to green
• Person B prefers green to red and red to blue
• Person C prefers blue to green and green to red.

Violation
• However, aggregating the three does not produce a well behaved preference function:
• Transitivity is violated.– Two people prefer red to blue– Two people prefer blue to green,– and two people prefer green to red.

Preference MaximizationMaximize U(X)
subject to: px ≤ mx is in X
where: p = price vector, x = goods vector, m = income
• (Because of non-satiation, the constraint can be written as px=m.)
• This kind of problem can be solved with the use of the Lagrangian:
• L = U(X) - (px - m)where is the Lagrange multiplier
• Take derivatives with respect to x, and set the first order conditions to 0
• Divide to get the Marginal rate of substitution and Economic Rate of Substitution
€
∂L∂xi
=∂U(X )
∂xi− λpi = 0
€
MRS =
∂U(X )
∂xi∂U(X )
∂xj
=pipj
= ERS

Example
• SolvingU=x1 x2
s.t. m = p1x1 + p2x2
L = x1 x2- (p1x1 + p2x2- m)
€
∂L∂x1
= x2 − λp1 = 0
€
∂L∂x2
= x1 − λp2 = 0
€
x2
p1
=x1p2
orx1p1=x2p2
substituting into the budget constraintm=2 x1p1
x1* =m/2p1
x2* =m/2p2

Indirect Utility
• The Marshallian Demand relates price and income to the demanded bundle. This is given as x(p,m). This function is homogenous of degree 0, so if we double both p and m, x remains constant.
• We can develop an indirect utility function:
v(p,m)=max U(X)subject to: px=mwhere the X that solves this is the demanded bundle

Example (Continued)
v(p,m)=max U(X) = (m/2p1) (m/2p2) = m2/(4p1p2)
• taking a monotonic transform:= (1/4) (2 ln (m) - ln (p1) - ln (p2))
• which increases in income and decreases in price

Properties
• Properties of the indirect utility function v(p,m):
• is non-increasing in p, non-decreasing in m
• homogenous of degree 0• quasiconvex in p
• continuous at all p >>0, m> 0
Expenditure Function
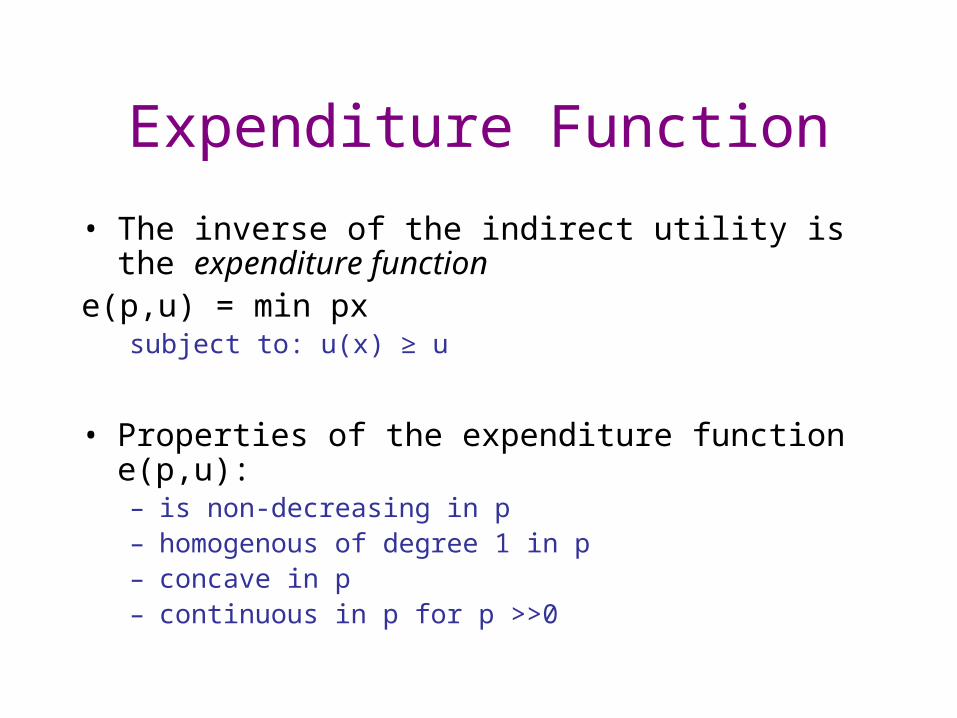
• The inverse of the indirect utility is the expenditure function
e(p,u) = min pxsubject to: u(x) ≥ u
• Properties of the expenditure function e(p,u):– is non-decreasing in p– homogenous of degree 1 in p– concave in p– continuous in p for p >>0

Roy’s Identity
• The Hicksian Demand or compensated demand is denoted h(p,u).
• vary price and income to keep consumer at fixed utility level vs. Marshallian demand.
• Roy's Identity allows going back and forth between observed demand and utility
€
hi( p,u) =∂e( p,u)
∂pi
€
xi( p,m) = −
∂v( p,m)
∂pi∂v( p,m)
∂m

Example (Continued)
€
x1( p,m) = −∂V∂p
∂V∂m
= −−m
2
4 p12p2
2m4 p1 p2
=2m
p1
x2( p,m) =2m
p2

Equivalencies
• e(p,v(p,m) = m – the minimum expenditure to reach v(p,m) is m
• v(p,e(p,u)) = u – the maximum utility from income e(p,u) is u
• xi (p,m) = hi(p,v(p,m))– Marshallian demand at m is Hicksian demand at
v(p,m)
• hi (p,u) = xi (p,e(p,u))– Hicksian demand at u is Marshallian demand at
e(p,u)
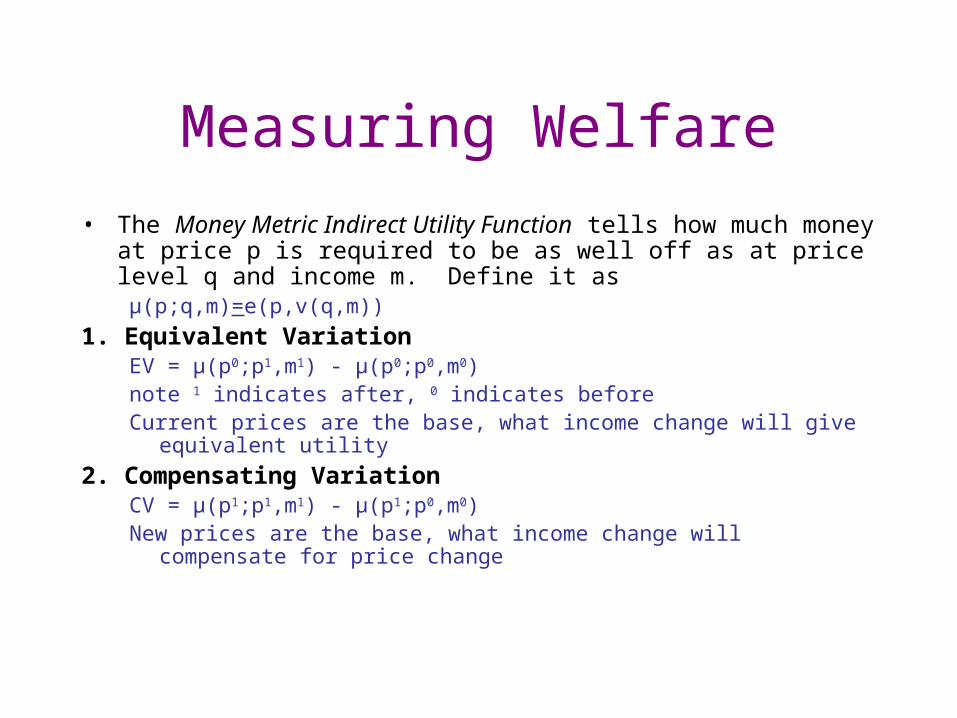
Measuring Welfare• The Money Metric Indirect Utility Function tells how much
money at price p is required to be as well off as at price level q and income m. Define it asµ(p;q,m)=e(p,v(q,m))
1. Equivalent VariationEV = µ(p0;p1,m1) - µ(p0;p0,m0)note 1 indicates after, 0 indicates beforeCurrent prices are the base, what income change will give equivalent
utility
2. Compensating VariationCV = µ(p1;p1,m1) - µ(p1;p0,m0)New prices are the base, what income change will compensate for
price change

Consumer’s Surplus
p
Q
CS
x
h(p,u1)h(p,u0)
€
ΔCS = x(t)dtp0
p1
∫
GenerallyEV ≥ CS ≥ CV
When utility is quasilinear (U=U(X1)+X0), then:EV = CS = CV

Utility, An Example from Transportation
U(Tw, Tt, C) = -0.147 Tw - 0.0411Tt - 2.24CwhereTw = walk timeTt = travel timeC = Cost
Plug in data for a particular trip by car and bus and get utilities.If model is complete and accurate, it gives choice in terms of higher utility
Source: Domenich and McFadden 1975
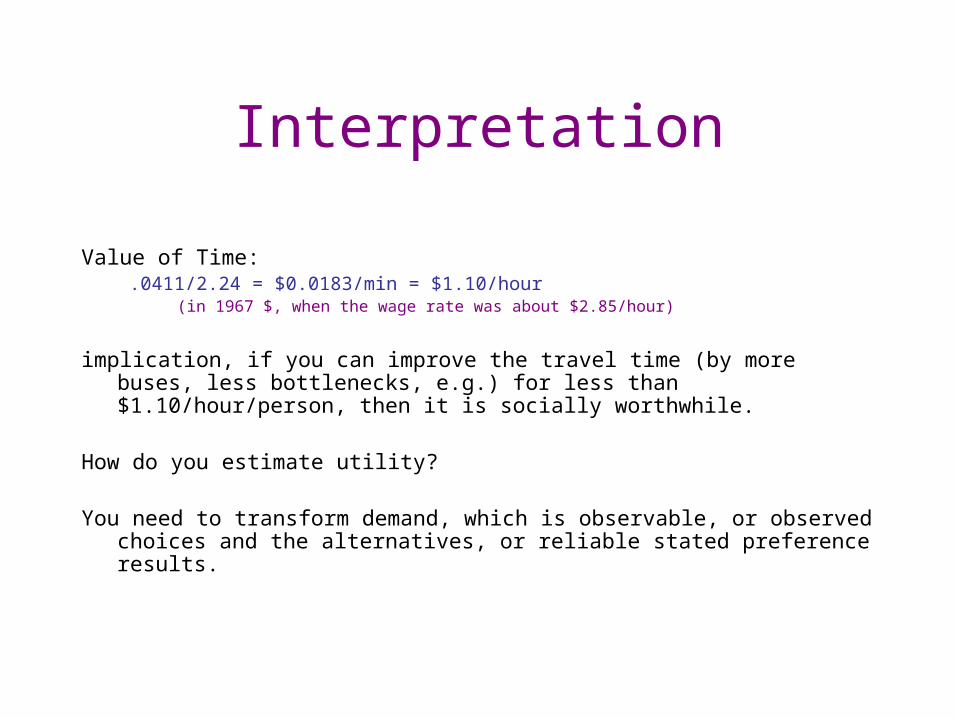
Interpretation
Value of Time:.0411/2.24 = $0.0183/min = $1.10/hour
(in 1967 $, when the wage rate was about $2.85/hour)
implication, if you can improve the travel time (by more buses, less bottlenecks, e.g.) for less than $1.10/hour/person, then it is socially worthwhile.
How do you estimate utility?
You need to transform demand, which is observable, or observed choices and the alternatives, or reliable stated preference results.

Case 1
• Car always wins (independent of parameters as long as all are < 0)
Bus Car ParameterTw 10 min 5 min -0.147Tt 40 min 20 min -0.0411C $2 $1 -2.24

Case 2
Bus Car ParameterTw 5 min 5 min -0.147Tt 40 min 20 min -0.0411C $2 $4 -2.24Results -6.86 -10.51
• Under observed parameters, bus always wins, but not necessarily under all parameters.
• It is important to note that individuals differ in parameters. We could introduce socio-economic and other observable characteristics as well as a stochastic error term to make the problem more realistic.

Who, What, Where, When, Why?
• Who is traveling or what is being shipped?• Where are the origin and destination of
those trips, shipments?• When do those trips begin and end (how
long do they take, how far away are the trip ends)?
• Why are the trips being made, what is their purpose?
• How are the trips getting there, what routes or modes are they taking?

Explanatory Factors
• Cost: Money, Time spent on the trip,
• Cost: Money and Time of alternatives.
• Benefit (utility) of trip (e.g. the activity at the destination)
• Benefit of alternatives
Why We Care
• How much “induced demand” will be generated if a roadway is expanded?
• How many passengers will be lost if bus services are cut back?
• How many people will be “priced off” if tolls are implemented?
• How much traffic will a new development generate?
• How much demand will I lose if I raise shipping costs to my customers?

Travel: Derived or Innate
• It is often said that “travel is a derived demand”. There would be no travel but for the activities being undertaken at the trip ends. Travel is seldom consumed for its own sake, the occasional “Sunday Drive” or walk in the park excepted.
• On the other hand, there seems to be some innate need for people to get out of the house, a 20-30 minute separation between the home and workplace is common, and 60 - 90 minutes of travel per day total is common, even for non-workers.

Demand CurvesThe more expensive something is, the less of it that will be consumed. E.g. if
gas taxes were doubled there will be less vehicle miles traveled overall. • Similarly, the longer it takes to get from A to B, the less likely it is that
people will go from A to B. • All this means is that we are dealing with a downward sloping demand
curve:
Demand
Money, Time
Quantity 0
Demand when competitorsPrice is higher, orcomplements price is lower

To Estimate:
• The shape of demand – is it linear or curved,
convex or concave, – what function best
describes it, • the sensitivity of demand
for a particular thing (a mode, an origin destination pair, a link, a time of day) – to price and time
(elasticity) – in the short run and the
long run.
• Are the choices continuous (the number of miles driven) or discrete (car vs. bus)?
• Are we treating demand as an absolute or a probability?
• Does the probability apply to individuals (disaggregate) or the population as a whole (aggregate)?
• What is the trade-off between money and time?
• What are the effects on demand for a thing as a function of the time and money costs of competitive or complementary choices (cross elasticity).

Practice: ITE Rates
• Estimates the number of trips entering or exiting a site at a given time (sometimes the number entering and exiting combined is estimated).
• ITE Rates are functions of type of development, and square footage, number of gas pumps, number of dwelling units, or other standard measurable things, usually produced in site plans.
• They are typically of the form Trips = a + b * Area OR Trips = a + b ln (Area).
• They do not consider location, competitors, complements, the cost of transportation, or many other obviously likely important factors.
• They are often estimated based on very few observations (a non-statistically significant sample).
• Unfortunately, many localities require their use.
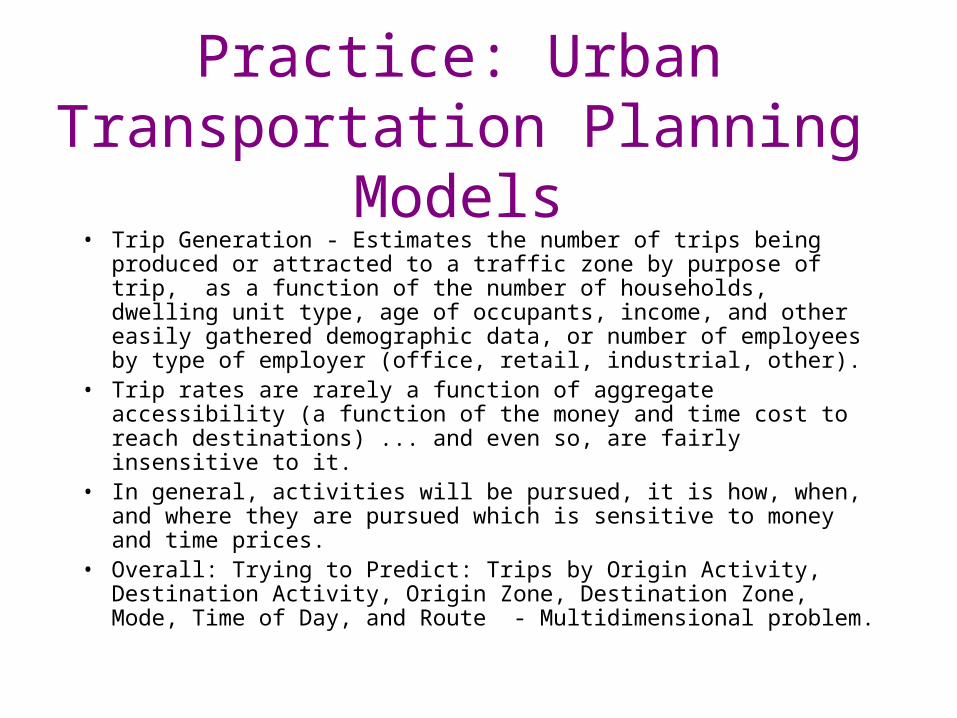
Practice: Urban Transportation Planning
Models• Trip Generation - Estimates the number of trips being
produced or attracted to a traffic zone by purpose of trip, as a function of the number of households, dwelling unit type, age of occupants, income, and other easily gathered demographic data, or number of employees by type of employer (office, retail, industrial, other).
• Trip rates are rarely a function of aggregate accessibility (a function of the money and time cost to reach destinations) ... and even so, are fairly insensitive to it.
• In general, activities will be pursued, it is how, when, and where they are pursued which is sensitive to money and time prices.
• Overall: Trying to Predict: Trips by Origin Activity, Destination Activity, Origin Zone, Destination Zone, Mode, Time of Day, and Route - Multidimensional problem.

Matrix of Activity Interchanges
Home Work Shop School OtherHomeWorkShopSchoolOther
• Purpose can be thought of as a matrix of origin and destination activities, where the less frequent activity pairs (trip purposes) are often aggregated.
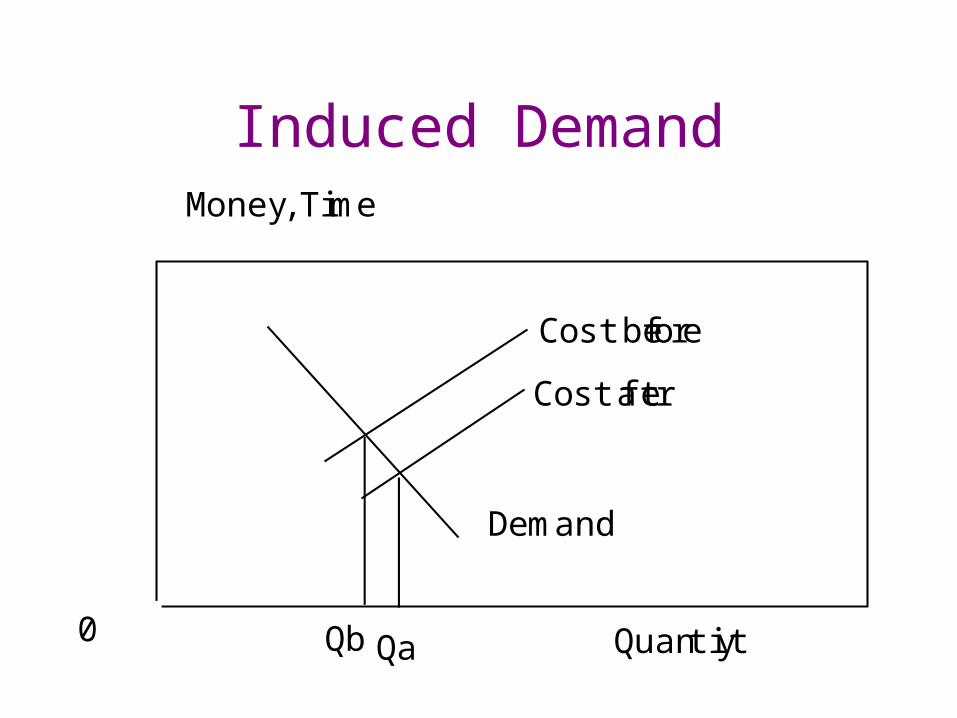
Induced Demand
Demand
Money, Time
Quantity 0
Cost before
Cost after
Qb Qa
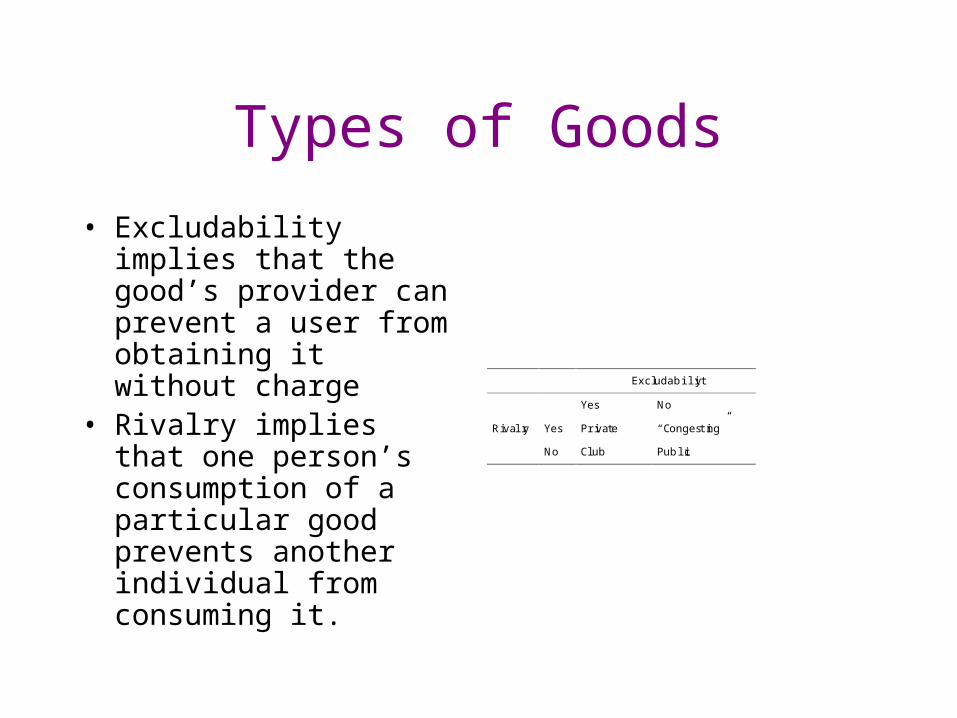
Types of Goods
• Excludability implies that the good’s provider can prevent a user from obtaining it without charge
• Rivalry implies that one person’s consumption of a particular good prevents another individual from consuming it.
Excludability
Yes No
Rivalry Yes Private “Congesting”
No Club Public
Excludability vs. Rivalry
• National defense for instance is non-excludable, America’s nuclear weapons protect anyone in the country, whether or not they want it. On the other hand the sale of anything in a store is excludable – the owner can prevent a customer from obtaining a good unless the customer pays (assuming enforceable property rights etc.).
• National defense again is non-rivalrous – one person’s protection does not prevent another’s protection. Shoes are rivalrous, only one person can wear a pair at
a time.
Public, Private, Club, Congesting
• Public goods are non-excludable and non-rivalrous,
• Private goods are both excludable and rivalrous.
• Club goods (for instance a country club membership) are excludable, but non-rivalrous (in the absence of crowding).
• Congesting goods are rivalrous but not excludable, for instance a crowded street. While an individual cannot be excluded from a city street that person’s presence may cost you extra time and his occupation of space does prevent you from occupying the same space at a given time. (Note that limited access highways are potentially excludable, unlike city streets.)
Aggregate Demand
• Moving from individual to aggregate demand requires that we sum individual demands in some way. The level of aggregation is determined by the nature of the issue at hand. Demand functions can be defined over socio-economic groups, cities, states and economy wide. There are numerous issues of 'aggregation' not least of which is how one handles the diversity of consumer preferences while aggregating.
• One of the interesting issues is how to aggregate given the nature of the good. This is an issue in transportation since some people consider transportation infrastructure 'quasi-public' goods.
• Another interesting issue is how to handle income distribution when aggregating since demand for many goods will depend not simply on the level of income in the group in question but also the distribution of that income.
Aggregating Demand for Goods
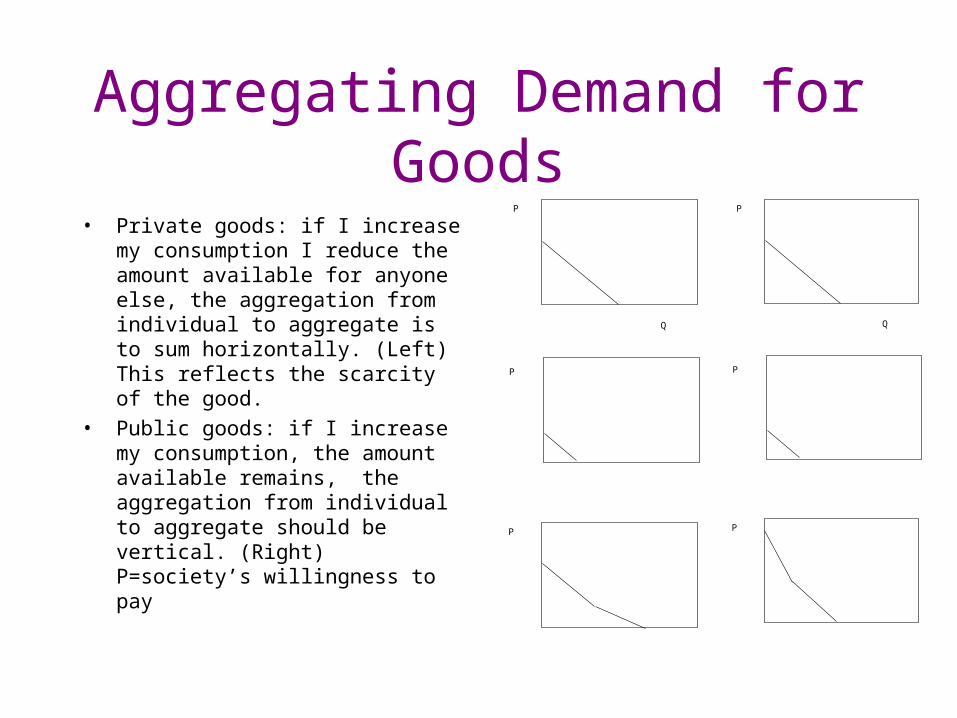
• Private goods: if I increase my consumption I reduce the amount available for anyone else, the aggregation from individual to aggregate is to sum horizontally. (Left) This reflects the scarcity of the good.
• Public goods: if I increase my consumption, the amount available remains, the aggregation from individual to aggregate should be vertical. (Right) P=society’s willingness to pay
P
P
P
Q
P
P
P
Q

Elasticity• The utility function is a
representation of consumer preferences and a demand function is the mapping of utility (and hence preferences) into quantity space.
• The elasticity is a summary measure of the demand curve and it is therefore influenced to a great extent by the underlying preference structure.
• Elasticity is defined as a proportionate change in one variable over the proportionate change in another variable. It, therefore, provides a measure of how sensitive one variable is to changes in some other variable.
• For example, how sensitive are people to purchasing transit tickets if the fare went up 5%, 10% or 50%?
• How would the demand for housing change if mortgage rates fell by 30%
• How would the demand for international air travel change if airfares went up 15%?
• All of these questions are really asking, "what is the elasticity of demand with respect to some variable"?

Own-Price Elasticity
• Note that dq/dp is the slope of the demand function so unless there is a very particular type of demand function the slope is not the same as the elasticity.
• In general, own price elasticity is negative. An increase in Pi should increase the consumption of Qi, (all else equal). However it is often referred to as positive, this is just confusing. All goods have a price elasticity, however, if the elasticity is less than -1, than the good is called elastic and if the elasticity is between 0 and -1, then the good is inelastic.
• This is important when looking at the effect of fuel prices on travel demand.
€
ε ii =piΔqiqiΔpi
=pi∂qiqi∂pi
• the price elasticity of demand (own price elasticity) is defined as:

Cross-Price Elasticity
• Cross price elasticity examines how the quantity of good i consumed changes as the price of j changes:
• If Pj increases and Qi increases, then Qi and Qj
are substitutes.• If Pj decreases and Qi
increases, then Qi and Qj
are complements
• This is important in examining modal competition.
€
ε ij =pjΔqiqiΔpj
=pj∂qiqi∂pj
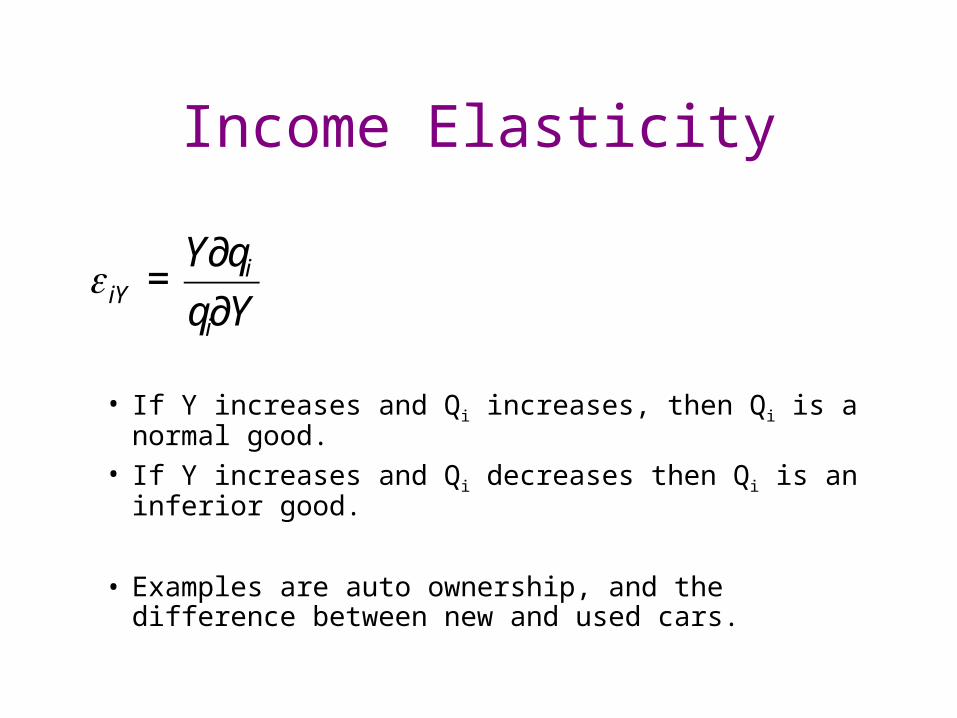
• If Y increases and Qi increases, then Qi is a normal good.
• If Y increases and Qi decreases then Qi is an inferior good.
• Examples are auto ownership, and the difference between new and used cars.
Income Elasticity
€
ε iY =Y∂qiqi∂Y

Utility
• Demand depends on utility. Utility functions represent a way of assigning rankings to different bundles such that more preferred bundles are ranked higher than less preferred bundles. A utility function can be represented in a general way as:
• U=U(X1,X2) = x1x2
• where x1 and x2 are goods (e.g. the net benefits resulting from a trip)

Indifference Curves
• An indifference curve is the locus of commodity bundles over which a consumer is indifferent.
• If preferences satisfy the usual regularity conditions, then there is a utility function U(X1, X2) that represents these preferences.
• Points along the indifference curve represent iso-utility.
• The negative slope indicates the marginal rate of substitution:
€
MRS = −ΔX2
ΔX1

Illustration
Indifference Curves: U=x1*x2
0
2
4
6
8
10
12
0 2 4 6 8 10 12
X1
x2@K=1
x2=k=2
x2@k=3
x2@k=5
x2@k=10
The indifference curves from this utility function would have the form:where a different indifference curve would emerge for each value of k
x
2
=
k
x1

Substitutes and Complements
• Substitutes would be represented by :
U x1
, x2
= a x1
+ b x2
• where the slope of the indifference curve would be = -a/b.
Complements are represented by:
U x1
, x2
= min a x1
+ b x2
Indifference: Substitutes and Complements
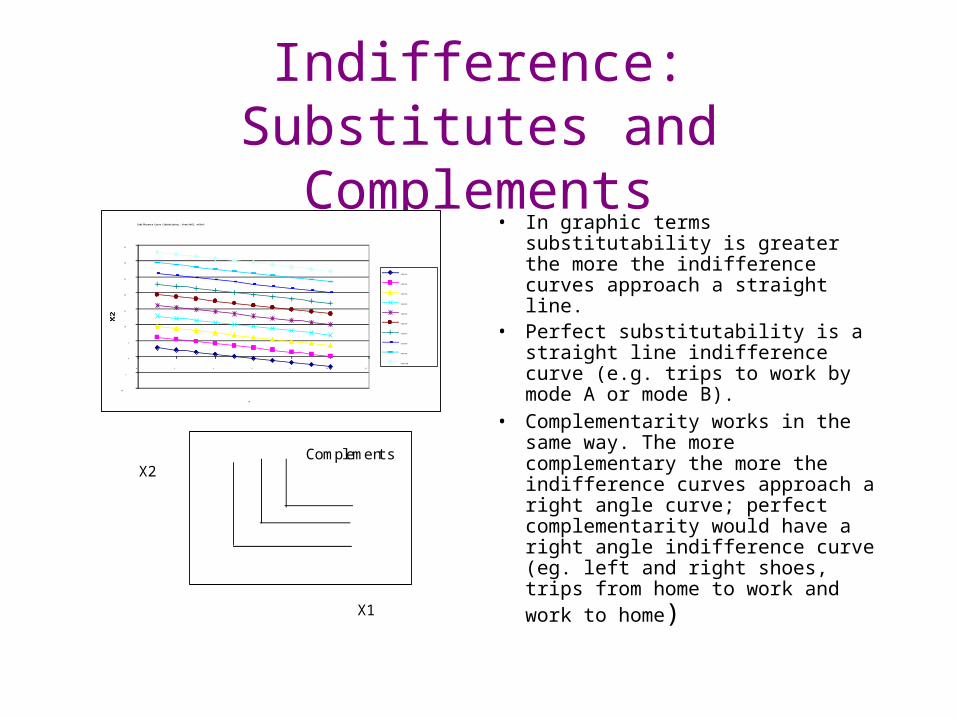
• In graphic terms substitutability is greater the more the indifference curves approach a straight line.
• Perfect substitutability is a straight line indifference curve (e.g. trips to work by mode A or mode B).
• Complementarity works in the same way. The more complementary the more the indifference curves approach a right angle curve; perfect complementarity would have a right angle indifference curve (eg. left and right shoes, trips from home to work and work to home)
Indifference Curve (Substitutes): U=ax1+bX2, a=2b=3
-10
-5
0
5
10
15
20
25
30
35
0 2 4 6 8 10 12
X1
x2@U=10
X2@U=20
X2@U=30
X2@U=40
X2@U=50
X2@U=60
X2@U=70
X2@U=80
X2@U=90
X2@U=100
X2
X1
Complements

Cobb-Douglas
• A utility function can take on a number of different forms. One of the more popular forms is called the Cobb-Douglas form which is a log-linear function. It is represented as:
U x1
, x2
= x1
c
x2
d

Budget Constraints
• Utility maximization involves the choice of bundles under a resource constraint.
• For example, individuals select the amount of goods, services and transportation by comparing the utility increase with an increase in consumption against the utility loss associated with the giving up of resources (or equivalently forgoing the consumption which those resources command).
X2
X1
Y/P2
BudgetSet
P1X1 + P2X2 = Y
Slope = -P1/P2

Budget: Income & Prices
• Often one price is taken to be 1, and one good is taken to be money.
• <-- An income increase
• <-- An increase in the price of good X1
X2
X1
Y/P2
BudgetSet
Y'/P2
Budget Line MovesOutward
X2
X1
Y/P2
BudgetSet
Budget LineBecomes Steeper
Optimization
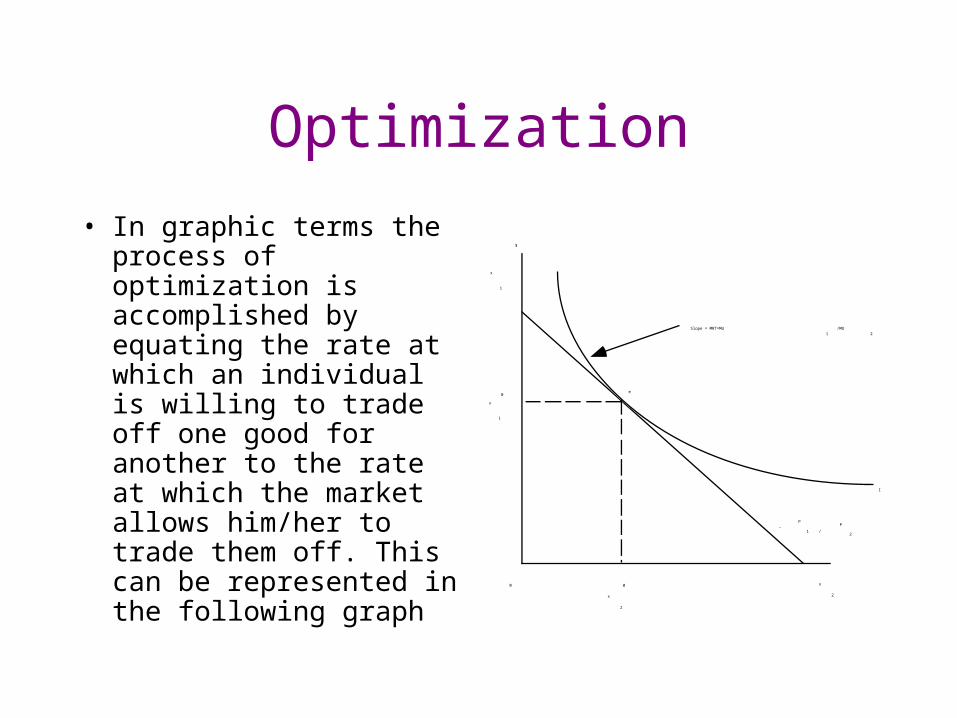
• In graphic terms the process of optimization is accomplished by equating the rate at which an individual is willing to trade off one good for another to the rate at which the market allows him/her to trade them off. This can be represented in the following graph
$
x
1
x
2
0
e
-P
1
P
2/
I
x
2
0
x
1
0
Slope = MRT=MU1
/MU2

Maximizing Utility• The individual maximizes
utility by moving down the budget constraint to that point at which the slope of the budget line (-P1/P2) which is the rate of exchange dictated by the market is just equal to the rate at which the individual is willing to trade the two goods off. This is the slope of the indifference curve or the marginal rate of transformation (MRT). A point such as 'e' is an equilibrium point at which utility is being maximized.
• As an optimization problem, this can be written:
• Maximize U ( X1, X2) • Subject To: P1X1 +
P2X2 = Y• Equilibrium is the
tangency between the indifference curve/utility and the budget constraint.

Input Demand Theory
• To date we have looked at demand for consumers. Demand for firms applies similar ideas. For instance, a firm may need to choose a trucking company to ship its goods. It can either approach the problem as cost minimization or profit maximization, which are called Duals of each other, and when solved will produce the same answer.
• Cost minimization: given the output level Q', minimize costs.

Cost Minimization
K
L
K*
L*
Isocost line isproducer's budgetconstraint
Isoquant is loci ofinputs that producesame level of outputsIQ = f (K,L)
• Minimize C= wL + rK• subject to : f(K,L) = Q'
• (K = Capital, L = Labor, w = wage, r = interest rate)
• The Marginal Rate of Technical Substitution (MRTS) = w/r.
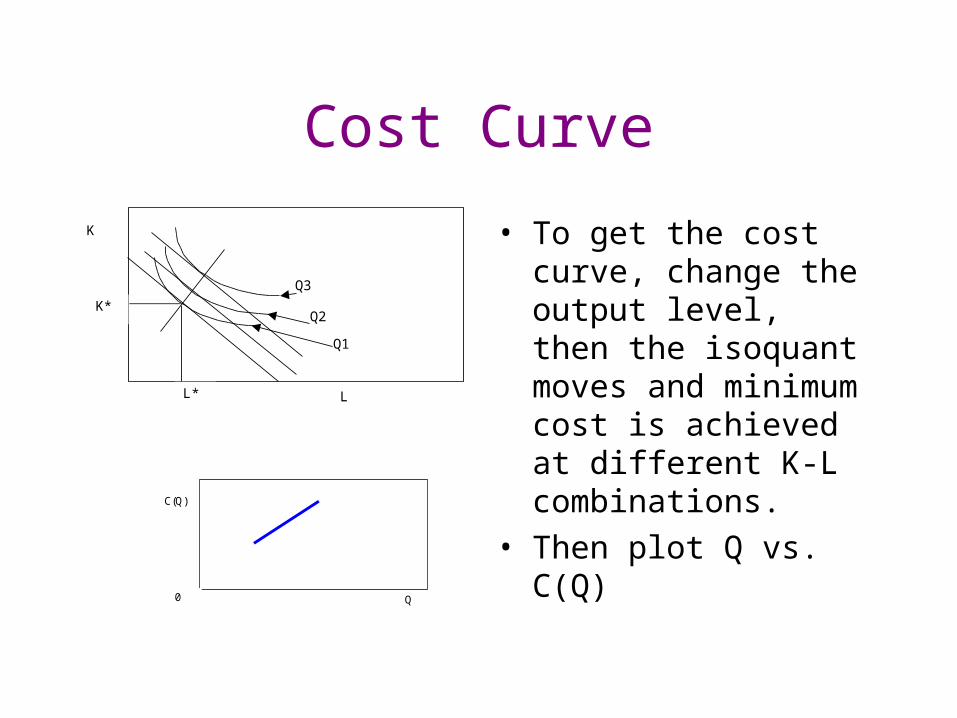
Cost Curve
• To get the cost curve, change the output level, then the isoquant moves and minimum cost is achieved at different K-L combinations.
• Then plot Q vs. C(Q)
K
L
K*
L*
Q1
Q2
Q3
C(Q)
Q 0

Profit Maximization
• In a competitive market, and a whole set of associated assumptions, firms maximize profits by producing when Marginal Cost = Marginal Revenue.
• Profit ∏ = PQ - C(Q).

Questions?
Individual Demand Functions
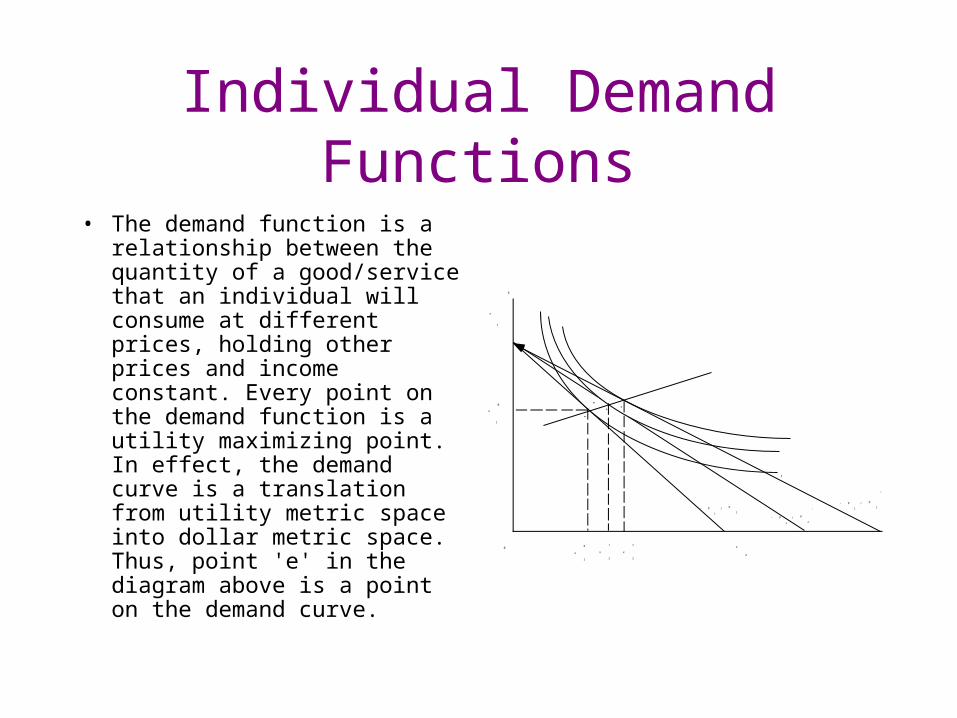
• The demand function is a relationship between the quantity of a good/service that an individual will consume at different prices, holding other prices and income constant. Every point on the demand function is a utility maximizing point. In effect, the demand curve is a translation from utility metric space into dollar metric space. Thus, point 'e' in the diagram above is a point on the demand curve.
$
x
1
x
2
0
e
- P
1
P
2
/
I
x
2
0
x
1
0
•
• •
- P
1
P
2
/
'
- P
1
P
2
/
"
x
2
1
x
2
2

Constructing a Demand Curve
• To construct the demand curve simply vary the price of one good holding the price of other goods and income constant. In graphical terms this is represented as in the diagrams below. Note that the equilibrium points in the upper diagram have their counterparts in 'quantity space' in the lower diagram. Therefore, this shows that prices or expenditure information provides a measure of people's preferences and can be used in making assessments with respect to valuation.

Engel Curve• An Engel curve is also
associated with the development of the demand curve from the utility maximizing framework. An Engel curve is the locus of combinations of goods that an individual would consume if they were faced with changes in income holding all prices constant. Pictorially this would mean a parallel shift in the budget constraint either up or down if income rises or falls, respectively. This Engel curve is also known as an income-consumption curve.
0
e••
•
Engel Curve
X2
X1
•normal goods: the Engel curve is upward sloping•inferior goods: Engel curve is downward sloping•perfect substitutes: Engel curve is positively slope with a slope value of P1•perfect complements: Engel curve is positively sloped with a slope equal to P1 + P2

Homothetic Preferences
• Depend only on the ratio of goods in the consumption bundle. This means that homothetic preferences will yield straight line Engel curves which pass through the origin.
• This has the interpretation that if income goes up buy a factor t , the demand bundle goes up by a factor t. Log-linear preferences are an example of homothetic preferences but not all homothetic preferences are log-linear.

Inverse Demand Curve
• The demand curve is defined as the relationship between price and quantity in which the quantity demanded is the unknown and the price is the exogenously given variable. The relationship is represented as:
• Q=Q(P)
• The inverse demand curve is simply the monotone transformation of the 'ordinary' demand curve. The inverse demand curve indicates, for each level of demand for good 1, the price which would have to be charged for the consumer to consume a given amount. The inverse demand curve is represented as:
• P=P(Q)
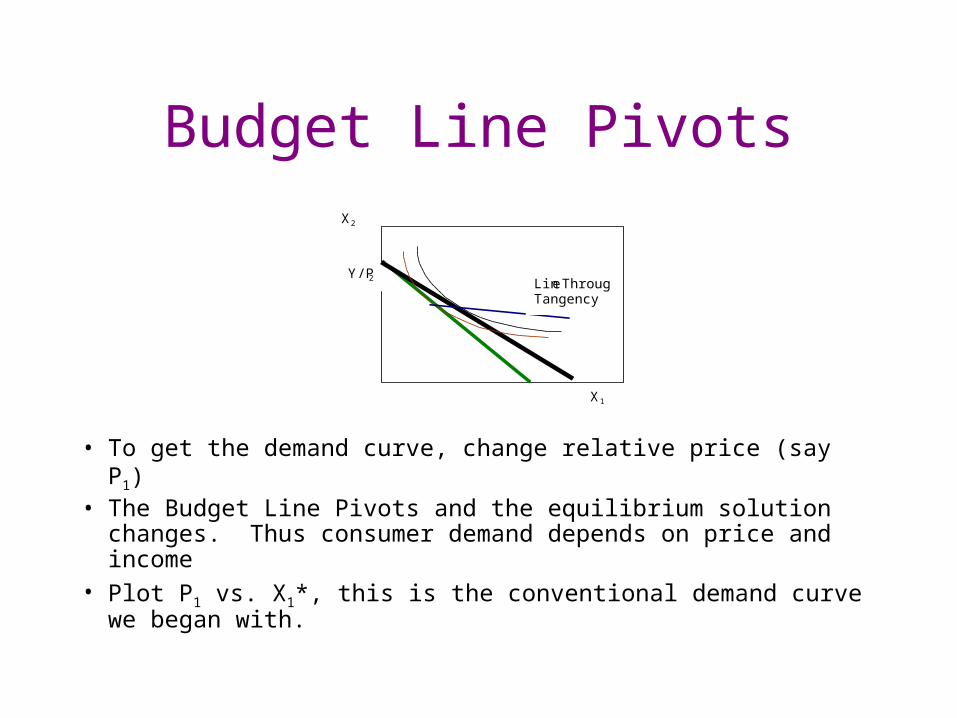
Budget Line Pivots
• To get the demand curve, change relative price (say P1)• The Budget Line Pivots and the equilibrium solution
changes. Thus consumer demand depends on price and income
• Plot P1 vs. X1*, this is the conventional demand curve we began with.
X2
X1
Y/P2Line ThroughTangency
Related Documents